
2014 Schield Creating Distributions Empirically0E 1
Milo SchieldAugsburg College
Editor of www.StatLit.orgUS Rep: International Statistical Literacy Project
Fall 2014 NNN Conferencewww.StatLit.org/pdf/
2014-Schield-NNN-Create-Distributions-Empirically-Excel-Slides.pdf
Creating Distributions Empirically

2014 Schield Creating Distributions Empirically0E 2
Generating Distributions
In introductory statistics, students are shown how the means of random samples form a sampling distribution that -- in the limit -- forms a Normal distribution.
This is extremely useful in sampling. But the Normal distribution applies in situations that do not involve sampling – as do the Log-Normal and Exponential.
Certain kinds of random activity can be shown to generate these well-known analytic distributions.
Understanding how this happens can be very useful to managers making data-based decisions.

2014 Schield Creating Distributions Empirically0E 3
Generating Distributions:Normal, Log-Normal & Exponential
Mathematicians have proven: 1.The sum of an infinite number of independent random variables generates a Normal distribution 2.The product of an infinite # of random, independent, positive variables generates a Log-Normal distribution3.A random process of assigning counts to cells in a table can generate a chi-square distribution. 4.A process having a constant chance of ‘death’ generates an exponential distribution. Amazing! At the micro level, pure randomness. At the macro level, an analytic distribution emerges without any agency or intent. Micro randomness generates macro-order: spontaneous and unplanned.

2014 Schield Creating Distributions Empirically0E 4
Generating DistributionsEmpirically
Excel is used to generate these distributions empirically.
The Normal and Log-Normal are the empirical results of 10,000 independent lines of activity. Each line receives:•An add by a random amount (discrete or continuous) generates a Normal distribution. •a multiply by a positive random change (discrete or continuous) generates a Log-Normal distribution. The Chi-square is the empirical result of randomly assign values to cells in a table (keeping the expected values equal) and then compute chi-square for each series.The Exponential is the empirical result of 2,000 lines of activity; each line has a fixed chance of death per period.
2014 Schield Creating Distributions Empirically0E 5
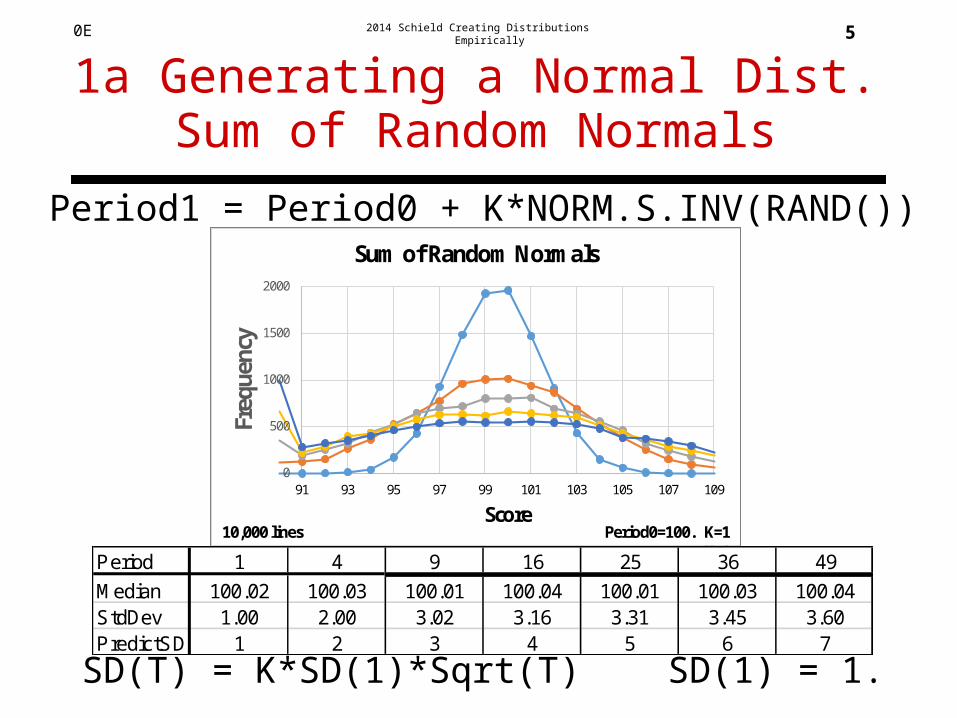
Period1 = Period0 + K*NORM.S.INV(RAND())
SD(T) = K*SD(1)*Sqrt(T) SD(1) = 1.
1a Generating a Normal Dist.Sum of Random Normals
0
500
1000
1500
2000
91 93 95 97 99 101 103 105 107 109
Freq
uenc
y
Score
Sum of Random Normals
10,000 lines Period0=100. K=1 K=1Period 1 4 9 16 25 36 49
Median 100.02 100.03 100.01 100.04 100.01 100.03 100.04StdDev 1.00 2.00 3.02 3.16 3.31 3.45 3.60PredictSD 1 2 3 4 5 6 7

2014 Schield Creating Distributions Empirically0E 6
.
Test for Normality #1QQ-Plot: Sorted PDF vs Percentile
70
80
90
100
110
120
130
0 10 20 30 40 50 60 70 80 90 100
Valu
es
Percentile
Sum of Random Normals (50 periods)Sorted PDF vs Percentile
Start: 100 K = 1
Correlation: 0.97785
10,000 Series
CV = -0.00278

2014 Schield Creating Distributions Empirically0E 7
.
Test for Normality #2QQ-Plot: Sorted PDF vs. Z-Score
75
85
95
105
115
125
-3.5 -2.5 -1.5 -0.5 0.5 1.5 2.5 3.5
Valu
es
Z-Score
Sum of Random Normals (50 periods)Sorted PDF vs Z-score
Correlation: 0.99997
Z-score = NORM.S.INV(Percentile/100)
10,000 Series
CV = -0.00278
Start: 100 K = 1

2014 Schield Creating Distributions Empirically0E 8
Period1 = Period0 + K*RandBetween(-1,+1)
SD(T) = K*SD(1)*Sqrt(T) SD(1) = Sqrt(8/12)
1b Generating a Normal Dist. Sum of Random Discretes
Period 1 4 9 16 25 36 49Median 100.00 100.00 100.00 100.00 100.00 100.00 100.00StdDev 0.815 1.64 2.45 3.27 4.10 4.90 5.72
PredictSD 0.815 1.63 2.45 3.26 4.08 4.89 5.71
0
500
1000
1500
2000
2500
91 93 95 97 99 101 103 105 107 109
Freq
uenc
y
Score
Sum of RandBetween [-1,+1]StdDev=Sqrt((3^2-1)/12)
10,000 lines Period0=100. K=1 K=1

2014 Schield Creating Distributions Empirically0E 9
Period1 = Period0 + K*[2*Rand()-1]
SD(T) = K*SD(1)*Sqrt(T). SD(1) = 2/Sqrt(12)
1c Generating a Normal Dist. Sum of Random Uniforms
Period 1 4 9 16 25 36 49Median 100.00 99.99 100.00 100.00 100.05 100.03 100.08StdDev 0.576 1.17 1.75 2.32 2.87 3.43 3.98
PredictSD 0.577 1.15 1.73 2.31 2.89 3.46 4.04
0
500
1000
1500
2000
2500
3000
3500
91 93 95 97 99 101 103 105 107 109
Freq
uenc
y
Score
Sum of Rand()StdDev(Period1) = 2*K / Sqrt(12))
10,000 lines Period0=100. K=1 K=1

2014 Schield Creating Distributions Empirically0E 10
P1 = P0*{1+K*[1+NORMSINV(RAND()]}
2a Generating a Log-Normal Dist. Product: Random Normal Growth
0
200
400
600
800
1000
1200
1400
5 10 15 20 25 30 35 40 45 50 55 60 65 70 75 80 85 90 95 100
Products of Random Uniform GrowthDistribution of Results after 5 and 50 Periods:
Results Scaled: 20 bins0 = Min; 50 = Mean.
5% growth per period
5 periods50 periods
Mean/Median = 1.06 Mean/Median = 1.00

2014 Schield Creating Distributions Empirically0E 11
P1 = P0*{1+K*[1+NORMSINV(RAND()]}
2a Generating a Log-Normal Dist.Product: Random Normal Growth
0
200
400
600
800
1000
1200
1400
5 10 15 20 25 30 35 40 45 50 55 60 65 70 75 80 85 90 95 100
Products of Random Normal GrowthDistribution of Results after 5 and 50 Periods:
Results Scaled: 20 bins0 = Min; 50 = Mean.
15% growth per periodK = 0.15
5 periods50 periods
Mean/Median = 1.54
Mean/Median = 1.04
2014 Schield Creating Distributions Empirically0E 12
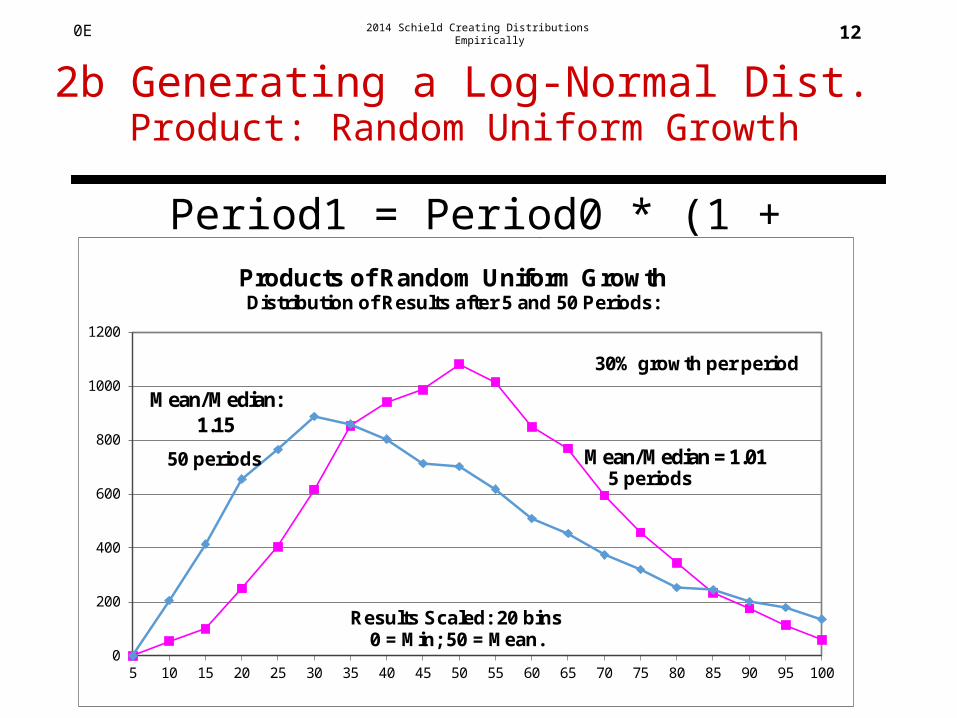
Period1 = Period0 * (1 + K*2*Rand() )
2b Generating a Log-Normal Dist. Product: Random Uniform Growth
0
200
400
600
800
1000
1200
5 10 15 20 25 30 35 40 45 50 55 60 65 70 75 80 85 90 95 100
Products of Random Uniform GrowthDistribution of Results after 5 and 50 Periods:
Results Scaled: 20 bins0 = Min; 50 = Mean.
30% growth per period
5 periods50 periods
Mean/Median:1.15
Mean/Median = 1.01

2014 Schield Creating Distributions Empirically0E 13
X=RND() If(X>.75,4,If(X<.25,1,If(X>.5,3,2)))
3 Generate Chi-Square Distribution:Random Assignment to Table Cells
2014 Schield Creating Distributions Empirically0E 14
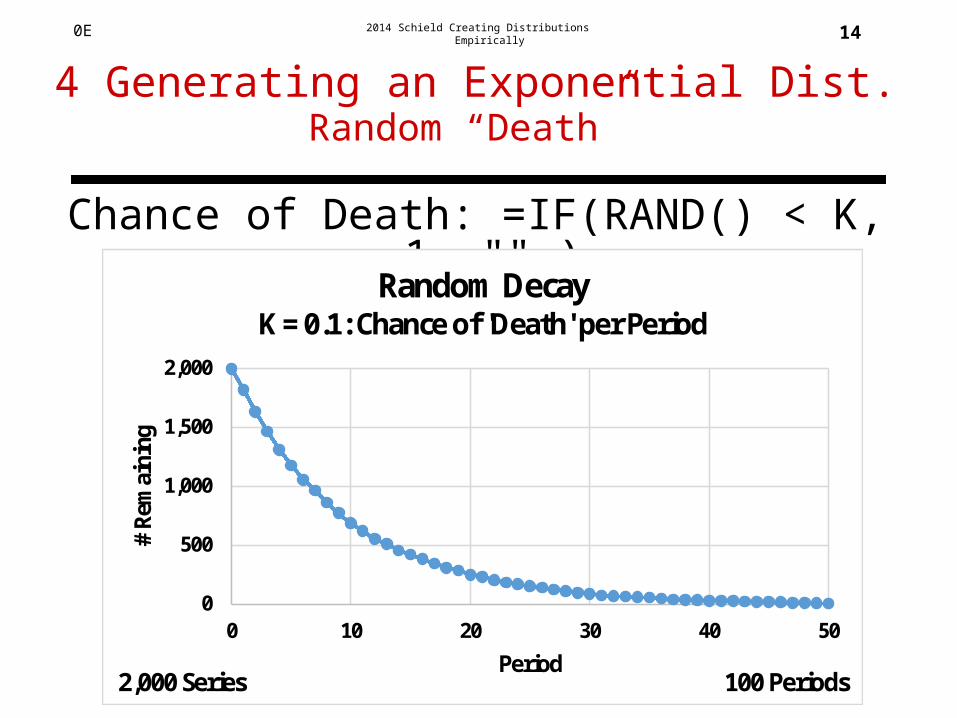
Chance of Death: =IF(RAND() < K, 1, "" )
4 Generating an Exponential Dist.Random “Death”
0
500
1,000
1,500
2,000
0 10 20 30 40 50
# Re
mai
ning
Period
Random DecayK = 0.1: Chance of 'Death' per Period
2,000 Series 100 Periods
2014 Schield Creating Distributions Empirically0E 15
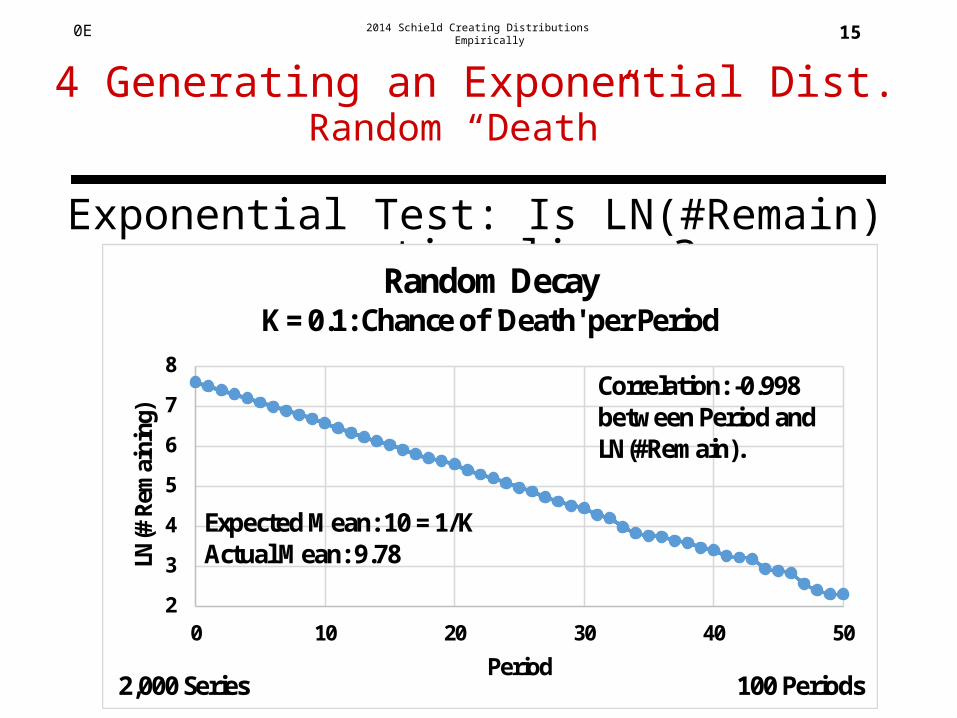
Exponential Test: Is LN(#Remain) vs. time linear?
4 Generating an Exponential Dist.Random “Death”
2
3
4
5
6
7
8
0 10 20 30 40 50
LN(#
Rem
aini
ng)
Period
Random DecayK = 0.1: Chance of 'Death' per Period
Correlation: -0.998between Period and LN(#Remain).
2,000 Series 100 Periods
Expected Mean: 10 = 1/KActual Mean: 9.78

2014 Schield Creating Distributions Empirically0E 16
Conclusion
Knowing the process that generates a distribution is helpful to anyone who wants to understand why a given distribution is a good fit in a particular situation.
It also helps us understand what determines the parameters of a distribution (or changes therein).
Why have these increased over time?•the standard deviation of heights?•the mean/median ratio (the skewness) for incomes?•the economic return from higher education?•the average lifetime of humans?

2014 Schield Creating Distributions Empirically0E 17
Bibliography
Aitchison and Brown (1957, 1963). The Log Normal Distribution with Special References to its uses in Economics. Cambridge U.
Crow, E. and Shimizu, K. (1988). Lognormal Distributions: Theory and Applications. New York: Marcel Dekker, Inc., 1988.
International Futures (2014) Using Lognormal Income Distributions www.du.edu/ifs/help/understand/economy/poverty/lognormal.html
Schield, M. and T. Burnham (2008). Von Mises’ Frequentist Approach to Probability, 2008 ASA Proceedings of the Section on Statistical Education. [CD-ROM] P. 2187-2194. www.StatLit.org/pdf/2008SchieldBurnhamASA.pdf.
Wikipedia/Log-normal distribution, Uniform distribution (continuous) and Uniform distribution (discrete)

2014 Schield Creating Distributions Empirically0E 18
Using Excel toCreate Distributions Empirically
All of these files are in www.StatLit.org/Excel/
Generating Normal Distributions with Sums of Random Variables: * 2014-Schield-Create-Normal-Empirically-Excel-Sum-Discrete.xlsx* 2014-Schield-Create-Normal-Empirically-Excel-Sum-Uniform.xlsx* 2014-Schield-Create-Normal-Empirically-Excel-Sum-Normal.xlsx
Creating Log-Normals with Product of Uniform Random Variables: * 2014-Schield-Create-LogNormal-Empirically-Excel-Product-Uniforms.xlsx
Creating Chi-Square with Random Assignment to Table Cells: * 2014-Schield-Create-ChiSquare-Empirically-Excel-DF3.xlsx
Generating Exponentials with Fixed Chance of ‘Death” per period* 2014-Schield-Create-Exponential-Empirically-Excel.xlsx


