

2013 ANALYTICS SYMPOSIUMFebruary 12, 2013Grand River CenterDubuque, Iowa
INSERT YOUR LOGO
HERE
Best Practices in Financial Planning & Analysis
Dave Pooley – 617 797 2949
Vice President - Peloton Group

3
Personal Overview
• 20+ year career - Industry & Consulting
• Accounting and Finance background• Enterprise wide solution selling,
delivery, and high client satisfaction track record
• Key developer of culture and community in various start ups
• Team Player, Team Builder and Entrepreneurial Sprit
Background• Professional for fee based external
training – hundreds of students thru planning and reporting tool training
• Center of Excellence programs & leading practice sharing
• Client “Chalk Talk” and knowledge dialogue leader and contributor
• Entrepreneur program at private high school
• Group facilitation and team building
Expertise• Dashboard – Wal-Mart (BSCOL
concepts, KPI, and Standard Reporting)
• Planning – EMC (driver based rolling planning P&L model using headcount and capital modeling)
• Profitability – Fidelity (driver based allocation modeling and enterprise wide reporting)
Solutions
• Fairfield University – Fairfield, CT• Bowater – Pulp & Paper• Navigator Systems / Painted Word• Peloton Group / Balanced Scorecard• Fidelity Investments• Peloton Group• Entrepreneur, Volunteer, and
Contributor
Credentials

4
4
Concepts and key points serve as flexible guides – they are not rigid rules
Approach & BackgroundApproach & Background
Guiding PrinciplesGuiding Principles
An approach that meets your needs
An approach that meets your needs
I can shareI can share
You should adoptYou should adopt
Around which
5
Agenda
• What the experts are saying• What does the data tell us• What frameworks exist• What are the leading practices• What does success look like• Q&A

6
What are “experts” saying?

7
It's clearly a budget. It's got a lot of numbers in it.
— George W. Bush

8
Never base your budget requests on realistic assumptions, as this could lead to a decrease in your funding.
— Scott Adams, Dilbert

9
The budgeting process in many companies has become costly, time-consuming, and inflexible control system for rewarding and punishing business managers.
— Robert Kaplan & David Norton

10
The budget is an exercise in minimalization. You’re always getting the lowest out of people because everyone is negotiating to get to the lowest number.
– Jack Welch, GE Chairman & CEO

11
CFO Top Concerns
Consumer Demand Global Financial Instability
Maintain Margins Ability to Forecast Results

12
I want to see the forest, the trees, the branches and individual leaves
– Lee Scott, CEO Wal-Mart
Other Key Executive Thoughts
Senior executives want scenarios and simulations that provide immediate guidance on the best actions to take when
disruptions occur.

13
What does the data tell us?
14
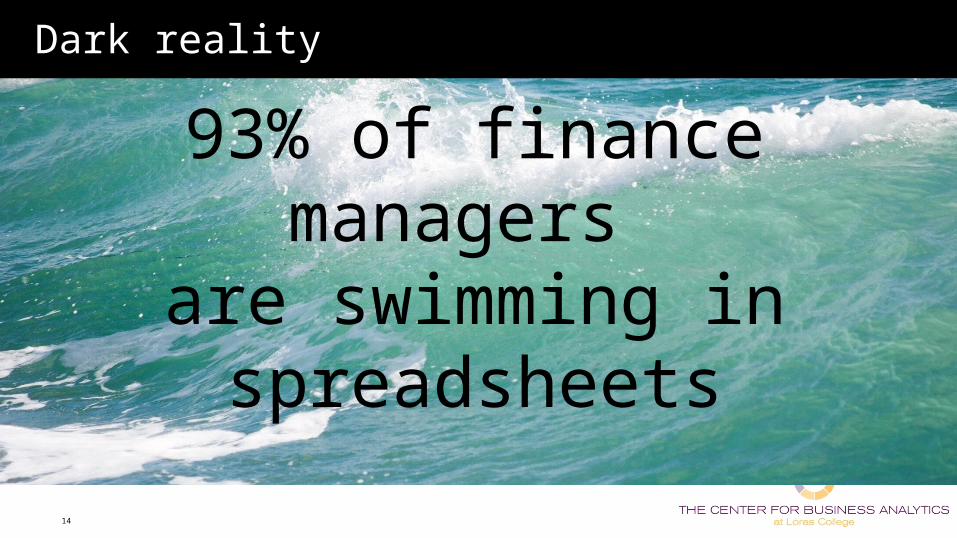
Dark reality
93% of finance managers are swimming in
spreadsheets

15
Accuracy, Timeliness and Relevance Seen as Greatest Weakness
33%
39%
43%
50%
47%
44%
14%
12%
16%
2%
2%
3%
0% 20% 40% 60% 80% 100%
Relevance offorecasts
Timeliness offorecasts
Accuracy offorecasts
Needs improvement Acceptable Excellent Not sure

16
AQPC Study Shows the Need to Eliminate Talent Waste

17
Best Practice Firms Metrics and Practices
Source: Hackett Group
18
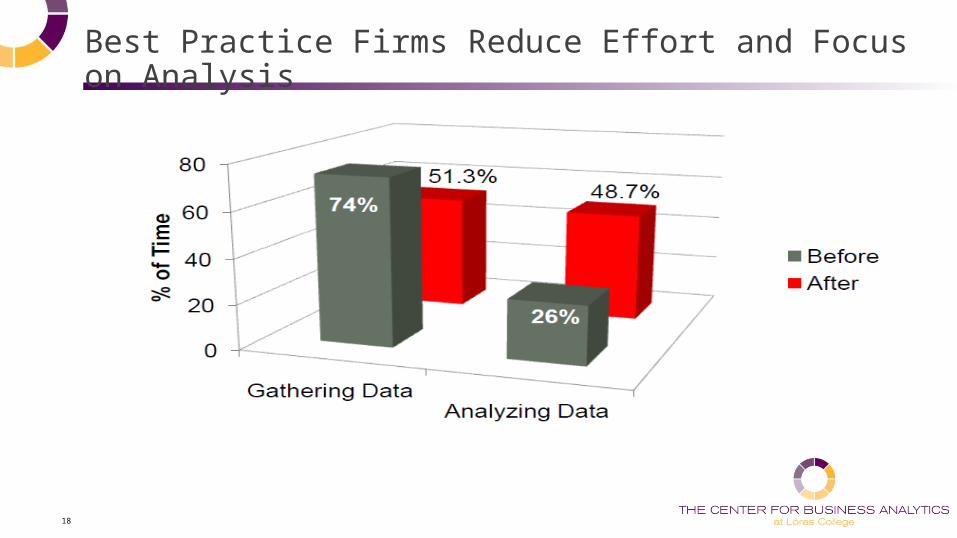
Best Practice Firms Reduce Effort and Focus on Analysis

19
What frameworks are in place to guide my journey?

20
Budgeting and
Planning
Shareholder Value
Better Company Forecast Accuracy
Better Strategy Formulation
and Execution
More Time & Cost Efficient Planning and
Budgeting
Market Expectations
Performance vs.
Expectations
Actual Performance
Communicate with Investor
Management Credibility
Improved Management
Managing Market Perceptions
Company Performance
Reproduced from “Driving Value Through Strategic Planning and Budgeting”, Accenture in association with Cranfield University
The guide highlights a few potential purposes of the planning process

21
Best Practice Planning Process – Level 1
Capital AssetsPlanning
Workforce Planning
Long-Term Financial Planning
FinancialDetail
OperationalDetail
Predictive Modeling & Simulation
Cost Analysis
Planning, Budgeting & Forecasting
ProjectFinancial
Plans

22
Run models based on key strategies
Set targets
Seed targets to annual operating plan
Start annual process
Update strategic plan with latest forecast
Evaluate resource and capital requirements
A typical World Class Planning Process – Level 2
Include operational detail and model variability of financial plan
Update forecast with latest budget and actuals

23
Detailed World Class Planning Process – Level 3
BasicPlanningSteps
Prepare Develop
Sign off working plan
Review
Provide access/distr. plan
Input plan
Submit plan
Consolidate plan
Review plan
Revise submitted plan
Set planning structure
Populateplan
Set global constants
Set baseline/default plan
PS01 PS02 PS03 PS04 PS05 PS06 PS07 PS08 PS09 PS11
PS10
IterativeModeling

24
Companies capture efficiencies from new planning solutions and can add value to the firm. Eventually optimizing and driving strategy execution.
Step 1
Step 2
Step 3
Maximum Productivity of Available Resources
More Cost & Time Efficient Planning and Budgeting(decentralized inputs & global plan consolidation)
Better Company Forecast Accuracy
(driver-based modeling)
BetterStrategy
Execution(rolling forecast, continuous resource allocation & relative
performance targets)
25
What are the success stories?

26
What results are firms achieving
Uncovered estimated annual cost savings of $1.2M in missing shipping charges
Shortened budget
cycle. Replaced 1000’s of Excel spreadsheets
Reduced monthly forecasting cycle by 48% . 21 – 11 days. Reduced forecast error by 20%
Standardized process globally and improved forecast accuracy by 30%
Cut Sales Forecasting cycle from 2 weeks to 3 days.
Reduced annual budget cycle by 50%
Cycle time AccuracyEffort & CostStandardizationSimplificationContinuous Improvement

27
What are the leading practices?

28
Leading Practices
1 Measure financial impact of strategic objectives
3 Focus on drivers, not details
5 What-if scenario analysis
2 Develop rolling forecast process
4 Link human resource and capital allocation plans
6 Mitigate risk and uncertainty
7 Anticipate management reporting changes
29
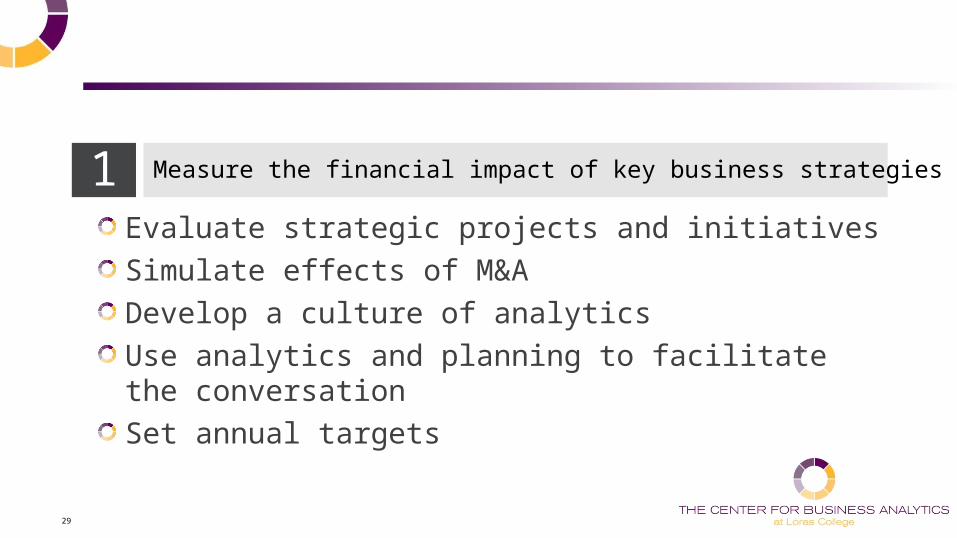
Evaluate strategic projects and initiativesSimulate effects of M&ADevelop a culture of analytics Use analytics and planning to facilitate the conversationSet annual targets
1 Measure the financial impact of key business strategies
30
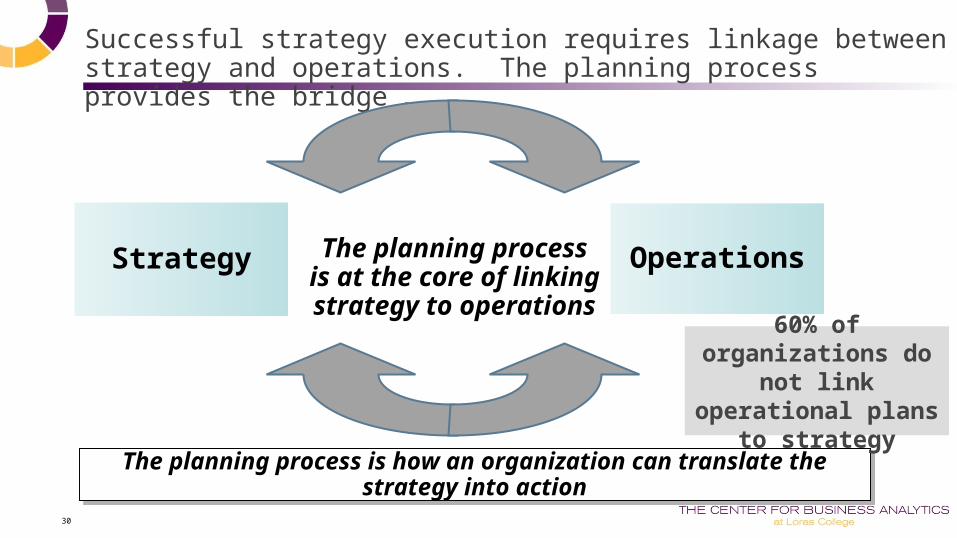
Successful strategy execution requires linkage between strategy and operations. The planning process provides the bridge …
Strategy OperationsThe planning process is at the core of linking strategy to operations
The planning process is how an organization can translate the strategy into action
The planning process is how an organization can translate the strategy into action
60% of organizations do not link operational plans
to strategy

31
Strategy Scorecard • Revenue• Cost
• Margin• Ratios (ROIC)
• Satisfaction• Engagement
• Loyalty• Market Share
FINANCIAL
CUSTOMER
Is your strategy clearly articulated and measured? What outcomes are you trying to achieve?
Consider a strategy execution framework to link strategy to operations
32
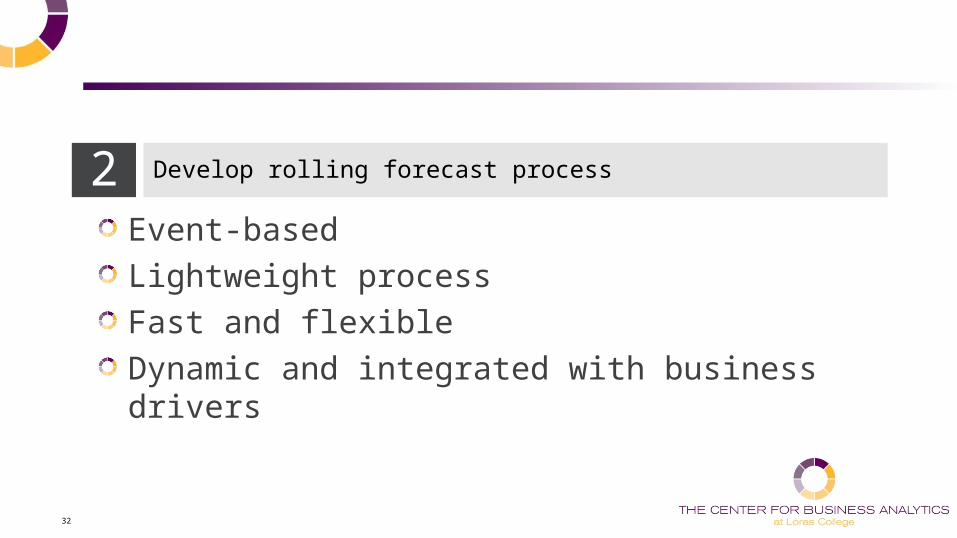
Event-based Lightweight processFast and flexibleDynamic and integrated with business drivers
2 Develop rolling forecast process
33
Rolling Forecasts Require Process Change

34
If rolling forecasts are interpreted as just another control system,
they then will be perceived as just another reporting burden and only
spurious data will resultBeyond Budgeting

35
The traditional budgeting and forecasting cycle does not provide visibility and insight into the future
Q1 Q2 Q4Q3AnnualPlan
ForecastOne
Q1 Q2 Q4Q3
ForecastTwo
Q1 Q2 Q4Q3
ForecastThree
Q1 Q2 Q4Q3
AnnualPlan
Q1 Q2 Q4Q3 Q1 Q2 Q4Q3
2013 2014 2015
Actual Results
No information beyond the current fiscal year
• Is the organization making progress towards longer-term financial and non-financial objectives ?
• Is their an opportunity to deploy / redeploy resources given expected financial performance ?
• Are there opportunities / threats on the horizon that necessitate action today ?
• What is the longer-term impact of near-term decisions being made today (eliminate programs, defer hiring, etc.) ?
Forecast Results

The rolling forecast provides a continuous, extended view of expected performance
ForecastTwo
ForecastThree
Q3 Q4 Q2Q1
2013 2014 2015
Q3 Q4
Q4 Q1 Q3Q2 Q4 Q1
Fcst Four / Annual Plan
Q2Q1 Q3 Q4 Q2Q1
ForecastOne
Q2 Q3 Q4 Q2Q1 Q3
• The rolling forecast supports strategic planning efforts including strategy refreshes
Q1
• The rolling forecast supports target setting activities by with estimates of expected financial performance based on known assumptions
• The rolling forecast provides the baseline for the annual plan
Actual ResultsTraditional Forecast

Rolling forecasts focuses on root cause analysis around business drivers and action plans to address performance gaps
Inbound Calls per Month 200,000 225,000 12.5%
Working Days per Month 20 20
Calls per Agent Per Day 75 66 - 12.0%
Capacity per Agent per Day 1,500 1,320 - 12.0
Peak / Absence Factor 1.2 1.1 - 8.3%
Agents Required 160 188 17.2%
Cost per Agent per Month $ 2,500 $ 2,500
Salary Expense $400,000 $468,750 17.2% $400,000 $468,750 17.2%
Plan Actual Variance Plan Actual Variance
Driver-Based Root Cause Analysis Traditional Analysis
Variance analysis based on driver-based forecasts provides insight into both what happened and why it happened.
• What: Salary expense 17.2% above plan
• Why: (1) Call volume 12.5% above plan (2) Agent productivity 12% below plan (3) More agents required
• Corrective Action: How do I address the performance shortfall ?
Detailed Causal Analysis
• Investigate the significant above plan call volume variance• Timing, scope, and effectiveness of Marketing programs• Other external demand drivers
• Agent Productivity• Training program effectiveness• Enabling tools / technology• Agent proficiency, tenure, motivation, absenteeism
• Customer service metrics
Corrective Action Plans
Actions Owner Date
• Initiate forecast improvement project around Marketing Program response rates
• Provide remedial training for existing agents
• Engage placement services for new hiring
• Complete assessment of agent talking scripts
Marketing
Training
10/1
12/1
Driver Model Variable Values

38
Drivers should be logical, actionable and relevantLeverage external indicatorsEvaluate model sensitivity of new drivers
3 Focus on drivers, not details

39
Building Driver-Based Models
Logical – valid and coherent relationship
Actionable – ability to influence outcomes
Statistically Relevant – strong correlation between driver and result
Simplifying Drivers Improves Agility and Increases Flexibility to Change Assumptions and Re-Forecast
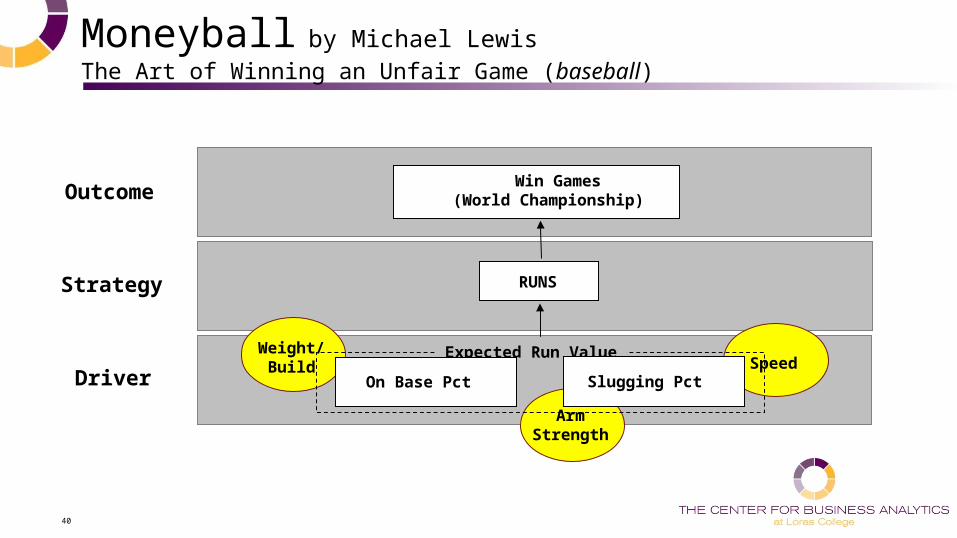
40
Outcome
Strategy
Driver
Win Games (World Championship)
RUNS
Moneyball by Michael LewisThe Art of Winning an Unfair Game (baseball)
SpeedWeight/
Build
ArmStrength
Expected Run Value
Slugging PctOn Base Pct

41
Striking the Right Balance on Detail
• Typical conversation.Finance - We don’t have enough data….
Operations - We don’t have the relevant data…
• 50 account lines by major product group and entity should be sufficient

42
4 Link human resource and capital allocation plans
Incorporate the appropriate level of detail in the enterprise planning processEnsure you have the right amount of workforce staffedEnsure you have incorporate the right amount of capital required

43
Assess Resource and Capital Assets Requirements
Workforce Plan
Financial Plan
Capital Asset Plan
Detailed Headcount, Staff Expenses, Salary & Compensation
Detailed Depreciation, Asset Purchase/Sell, Asset Expenses
44
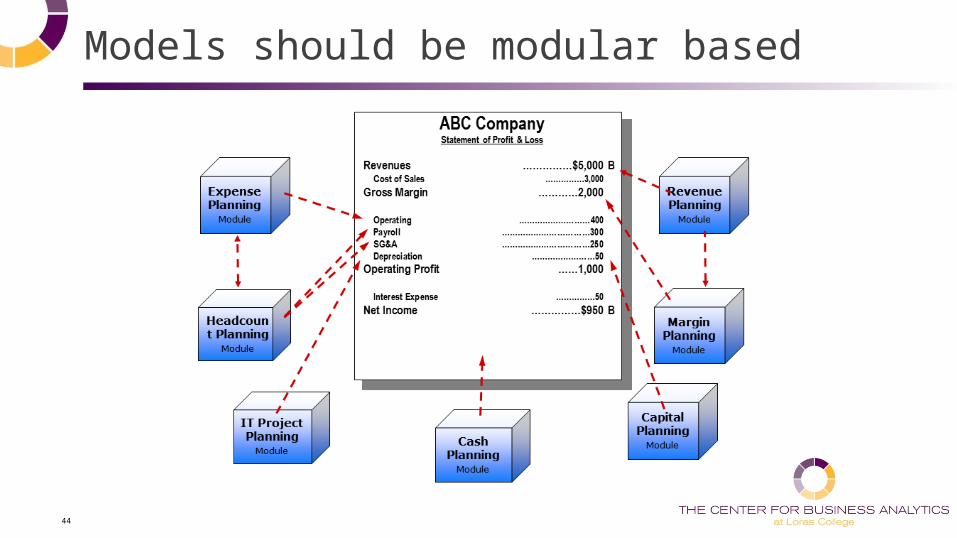
Models should be modular based

45
Create sandbox for BU’s to test new assumptionsDefine process for extending analytical modelsGo beyond spreadsheets; keep process lightCreate and enabling technology platform
5 What-if scenario modeling thru technology advancements

46
46
Without an integrated Information Architecture
Legacy
CRM
SAP
Oracle
Analytics
Query and Reporting
Financial Management
Planning
Destination/End-Users Disparate SystemsData Sources Data Warehouse

47
With an integrated Information Architecture
Destination/End-Users Data Sources Data Warehouse
Legacy
CRM
SAP
Oracle
OP
ER
AT
ION
AL
PLA
NN
ING
INT
ER
AC
TI
VE
D
AS
HB
OA
RD
FIN
AN
CIA
L R
EP
OR
TIN
G

48
6 Mitigate risk and uncertainty
Move from ‘possibility’ to ‘probabilityReview full range of outcomesQuantify the risk of not achieving your goalsKnow the probability of a particular outcomeUnderstand key factors impacting your business

49
Uncontrollable External Factors Most Likely to Lead to Variances to Actual Performance

50
Quantify Risk and Uncertainty
• Only 3 possible outcomes• Limited view of risk• What are most important risk factors?• What are the odds I’ll miss the target?• Which outcome is most likely?
• Full range of outcomes• Illustrate probability of outcomes• Immediate visibility into inherent risk• True risk analysis for financial models
ConventionalSingle Point Scenarios
AdvancedThinking in Ranges

51
Develop strategy for governing change in reporting structuresCentralize change management process into a hubProvide what-if visibility into new structures before implementation
7 Anticipate management reporting changes

52
Organizations must invest in and develop strategies and processes to address all of the major planning levers
FunctionalProcessFlows Governance
Model / Management
SystemUsers&
SecurityReports
&Data Outputs
Data Sources,Input Templates
&Commentary
Statistical Measures,
Allocations, &
Adjustments
FinancialAccounts,
Dimensionality, &
Consolidation
StrategicIntent
Results
Project Leadership & Controls
Change Mgmt & Communication

53
53
©2006 Balanced Scorecard Collaborative, a Palladium company • bscol.com
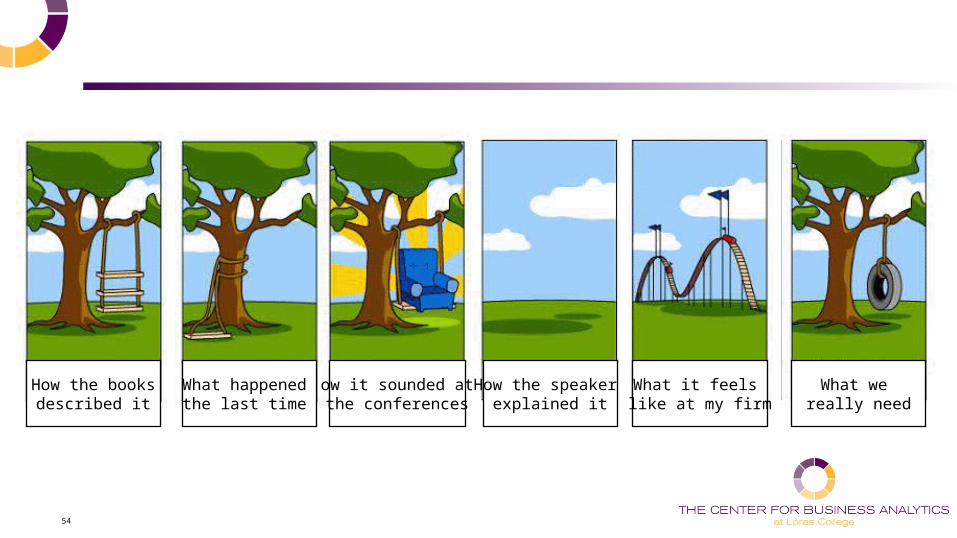
High Level Road MapEstablish the “Blue Sky” vision up front
Continuously make trade-off’s • Balance short term desire to “get it done” with long term platform needs
Adopt a modular based approach • Build out the “Blue Sky” vision over time
Select and standardize on the best of breed vendors & tools• The whole platform as vendors products span the information platform
Establish standards and knowledge sharing forums early in the process
Build the environment with the vision to handle large data volumes• Driver based applications can mean more, volumes and types of data, not less
• Technology can ripple impacts through the details quickly to derived new insights
54
How the booksdescribed it
How it sounded at the conferences
How the speaker explained it
What it feels like at my firm
What we really need
What happened the last time

55
55
©2006 Balanced Scorecard Collaborative, a Palladium company • bscol.com
Thank You!

56

57
Sample Case Study

58
About Friendly’s
Based in Wilbraham, MassachusettsFounded in 1935 with the intention to provide warm, caring, neighborly service to all who visitServing handcrafted ice cream treats and classic comfort foods for 77 yearsOver 130 RestaurantsHeld in Private EquityRecently went thru bankruptcy

59
The Business Challenge
Friendly’s planned to rapidly deploy a robust solution to support the budgeting and forecasting needs of the business
• Existing P&L budget and forecast process were facilitated through a combination of database files and ~60 Excel workbooks that performed complex calculations
• The planning process was manually intensive, leaving limited time to perform value added analytic activities
• Lacked the ability to perform what-if modeling and analysis within the existing solution
• Budget owners were not held accountable to their plans due to a lack of visibility and clarity
Restaurant Plan
Corporate G&A Plan Franchise Plan
Manufacturing Plan
Distribution Plan
Retail Plan
Eliminations
Sales
Food Cost
Labor
G&A Expense
Store Planning
60 + Excel Workbooks

60
• Planning: Provide the ability to develop the restaurant P&L (129 Stores, 50 Line P&L, etc), as well as the ability to load in the budget for Manufacturing, Retail, Custom Pack. Develop the G&A Model on a simplified level – excluding Headcount/Compensation Planning
• Efficiency: Remove repetitive and unnecessary work from the existing planning process, with a focus on providing more time for value added analysis
• Visibility: Provide enhanced visibility to the P&L, allowing planners to see the impact real-time as they update their forecast in the solution
• Clarity & Accountability: Drive clarity and accountably for the forecast/plan into the business process -- specifically with Restaurant Operators
• Scenario Modeling: Provide the ability to perform what-if/ad-hoc planning, where required
Objectives
Project Charter

61
Nightly Load of Actuals Sales Planning
11 22
• Clear Actual Scenario• Load Metadata• Load Actuals from .csv• Load Actuals from
Lawson• Calculate and Aggregate
the Database
• Load Demand Data• Input Cust Count &
Guest Check % Change• Review current variances• Input % Bump to
Customer Count• Calculate Sales Plan
Inpu
tsA
ctiv
ities
Account | Organization | Actuals (.csv) |
Actuals (Lawson)
Demand Load | Input % Change | Input Customer Count % Bump
Labor Planning – Hourly | Salary
Food Cost
Planning
Taxes | Fringes | Benefits
33 55
• Calculate Price Change by store
• Input Global Commodity Change and Other
• Input Gap by store• Calculate final FC % of
Sales and dollar amount
• Load Hourly data from Labor Model
• Load Salary data from HR
• Manually input additional expenses
• Calculate Labor Expense
• Data copy from LY Actuals
• Input % Drivers• Calculate expenses• Manually override if
necessary• Calculate final expenses
44
LY FC % of Sales | Price Change | Cmdty Change |
Other | Gap
Data Load - Labor Model |
Data Load - HR | Manual Input
Copy in LY Actuals |
Manually input % Drivers
Friendly’s Planning Process
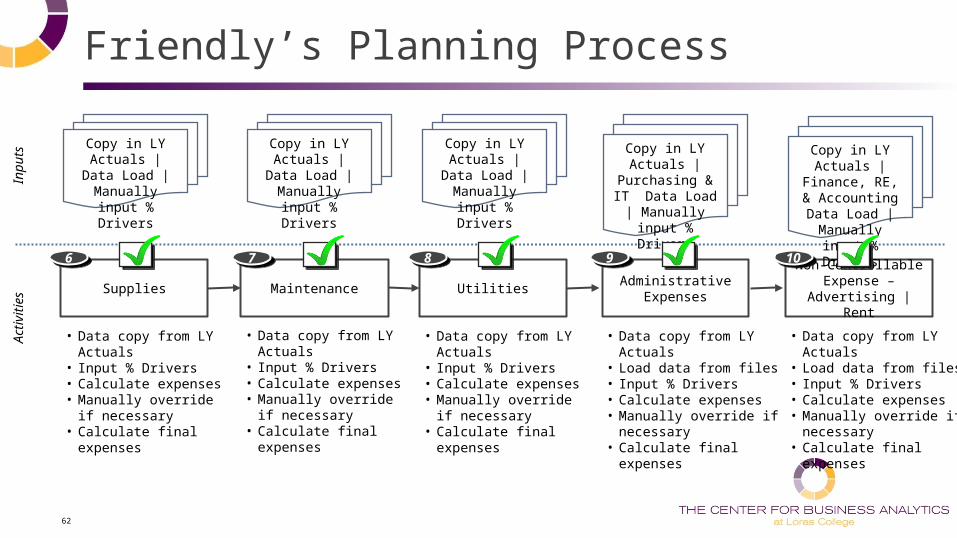
62
MaintenanceSupplies UtilitiesAdministrative
Expenses
66 88 99
• Data copy from LY Actuals
• Input % Drivers• Calculate expenses• Manually override if
necessary• Calculate final expenses
• Data copy from LY Actuals
• Input % Drivers• Calculate expenses• Manually override if
necessary• Calculate final expenses
• Data copy from LY Actuals
• Input % Drivers• Calculate expenses• Manually override if
necessary• Calculate final expenses
• Data copy from LY Actuals• Load data from files• Input % Drivers• Calculate expenses• Manually override if
necessary• Calculate final expenses
Inpu
tsA
ctiv
ities
77
Copy in LY Actuals | Data
Load | Manually input % Drivers
Copy in LY Actuals | Data
Load | Manually input % Drivers
Copy in LY Actuals | Data
Load | Manually input % Drivers
Copy in LY Actuals |
Purchasing & IT Data Load |
Manually input % Drivers
Non-Controllable Expense – Advertising
| Rent
1010
• Data copy from LY Actuals• Load data from files• Input % Drivers• Calculate expenses• Manually override if
necessary• Calculate final expenses
Copy in LY Actuals |
Finance, RE, & Accounting Data Load | Manually input % Drivers
Friendly’s Planning Process

63
Store Planning – Opening
Store Planning – Closures Store Planning – Remodel
1313 1414
• Input # of new stores for each format
• Input average yearly sales for each format
• Input expense drivers by format
• Calculate new store P&L
• Data form to select stores to close
• Ability to close at a monthly level
• Reverse out P&L line items
• Calculate closed stores
• Data form to select stores to remodel
• Ability to remodel at a monthly level
• Increase sales evenly by % Sales Lift
• Calculate remodel stores
Inpu
tsA
ctiv
ities
1212
# Store Openings by Format | Avg
Sales by Format | Expense Drivers
Select stores to close with date |
Input other closing expenses
Select stores to remodel with date
| Input % Sales Lift Driver
CC5000 Planning
• Manually input expenses into CC 5000
• Calculate expenses
1111
Manual Input of data
Friendly’s Planning Process

64
Realized Benefits
• Eliminated the manual effort needed to update all 60 Excel workbooks when the sales plan or labor plan changed
• Provided clarity into the drivers and calculations used to build the Annual Budget
• Drove the accountability of the Departments for the Annual Budget
• Decreased the amount of time needed to update and maintain key management reports
• Eliminated the manual effort needed to perform “what-if” modeling
• Reduced the level of effort and cost to the Annual Budget and the solution is supportable by Friendly’s IT


