Download - 2.008 Manufacturing Systems

2.008 -Spring 2004 1
2.008
Manufacturing Systems
2.008 -Spring 2004 2
Outline
1. Manufacturing Systems
2. Types of Plant Layouts
3. Production Rates
4. Design and Operations

2.008 -Spring 2004 3
Manufacture
Market Research
Conceptual Design
Design for Manufacture
Unit Manufacturing
ProcessesAssembly
and Joining
Factory, Systems & Enterprise

2.008 -Spring 2004 4
What is mfg systems?

2.008 -Spring 2004 5
Time spectrum of Typical Activities in aManufacturing Organization
Seconds Period Activity
108 Decade
Plant design, Machine Selection,
107 Year System Simulation
Process design: CAD
106 Month Catalogs
Select manufacturing methods
Week
105 Day
Factory Operation
104 Ship-Receive
Hour Transport Inventory
103
102
Minute Part handling
101 Load/Unload
Assembly
1 Second
.1 Machine control
CNC-DNC
.01 Adaptive control
Intelligent machines
.001 Millisecond Process control

2.008 -Spring 2004 6
How Man, Machine, and Material Spend Time in the Factory
People Materials Machines
Value-added
Value-added
Value-added
Waste Waste Waste
“Waste”: transportation, storage, inspect on and rework
"Waste": unnecessary movement of machine, setup time, machine breakdown, unproductive maintenance, producing defective products, producing products when not needed, etc.
"Waste": waiting for materials,watching machine running,producing defects, looking fortools, fixing machinebreakdowns, producingunnecessary items, etc

2.008 -Spring 2004 7
Disruptions/Variation(Random Events)
• Machine failure• Set-up change• Operator absence• Starvation/Blockage• Demand change

2.008 -Spring 2004 8
Types of Plant Layout
• Job Shop• Project Shop• Flow Line• Transfer Line• Cellular System
2.008 -Spring 2004 9
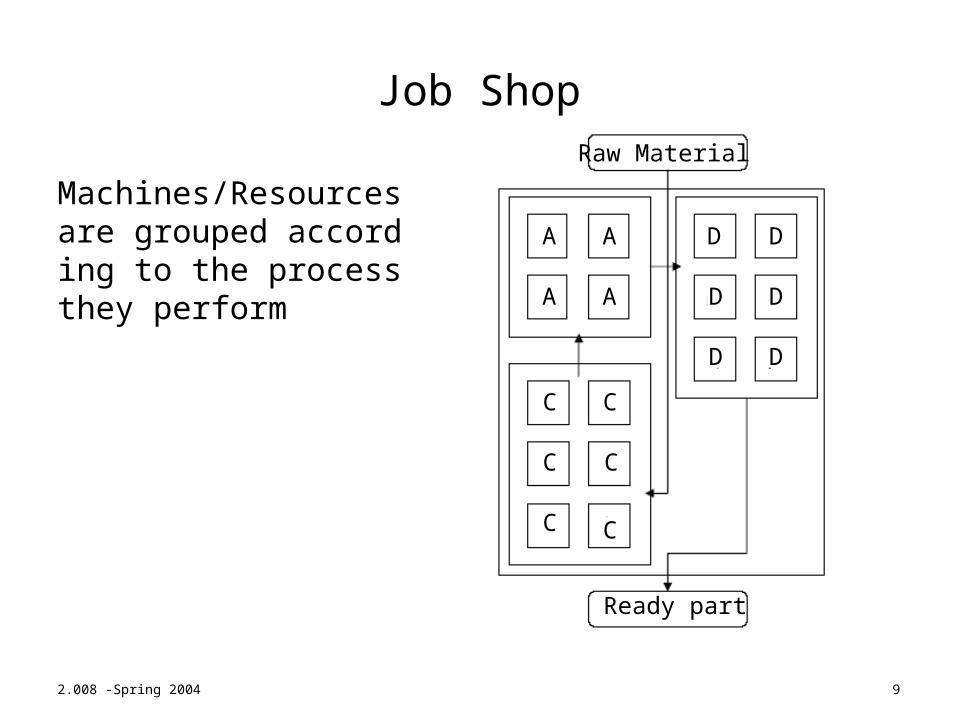
Job Shop
Machines/Resources are grouped according to the process they perform
Raw Material
Ready part
A A
A A
D D
D D
D D
C C
C C
C C

2.008 -Spring 2004 10
Project Shop
Machines/Resources are brought to and removed from stationary part as required
A
A
C
B
B
D
DD
Raw material/
Ready part
2.008 -Spring 2004 11
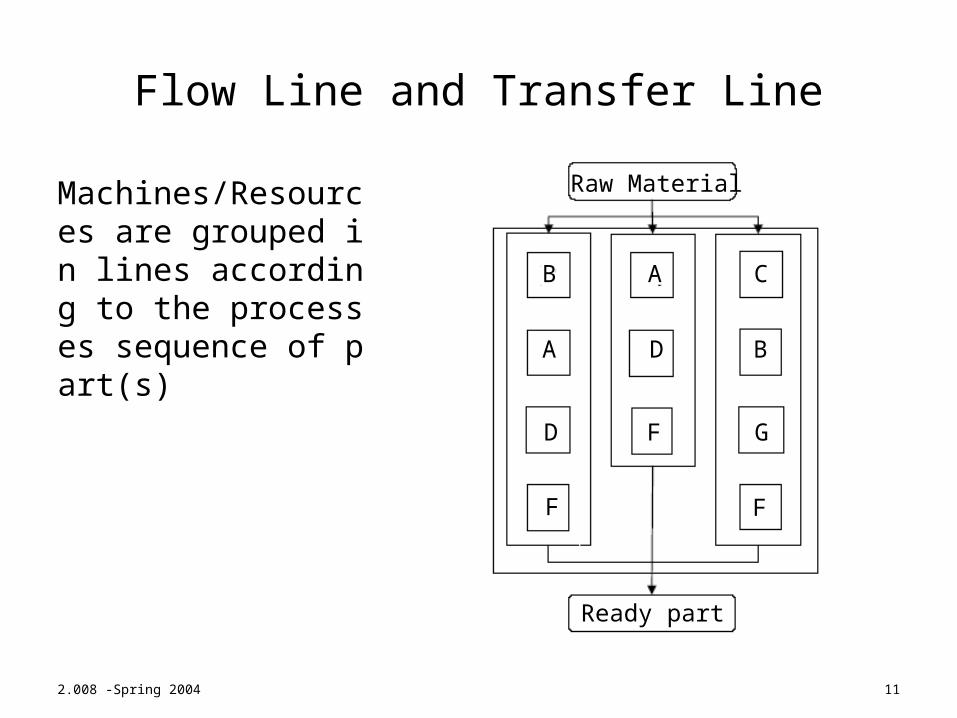
Flow Line and Transfer Line
Machines/Resources are grouped in lines according to the processes sequence of part(s)
A
A
Raw Material
Ready part
B
B
C
D
D F
F F
G

2.008 -Spring 2004 12
Cellular System
Machines/Resources are grouped according to the processes required for part families
Raw Material
Ready part
B
B
C
E
E
A
D
D
D
F
F
G

2.008 -Spring 2004 13
Production Quantity and Plant Layout
Project Shop
Job Shop
Cellular System
Flow Line
1 10 100 1,000 10,000 100,000
Quantity

2.008 -Spring 2004 14
Production Rates
• Case I:– One machine– Everything works
M
time Operation
1rate Production

2.008 -Spring 2004 15
Production Rates (cont’d)
• Case II:– One machine– Machine breaks down (disruption)– Everything else works
M
MTTR
MTTF
MTTRMTTF
MTTFEfficiency
on)(utilizati
time Operation
Efficiencyrate Production

2.008 -Spring 2004 16
Production Rates (cont’d)
• Case III:– Many machines– No machine breaks down– No buffers
M1 M2 Mi Mk

2.008 -Spring 2004 17
Production Rates (cont’d)
• Case IV:– Many machines (same operation time)– No machine breaks down– No buffers
M1 M2 Mi Mk

2.008 -Spring 2004 18
Production Rates (cont’d)
• Case V:– Many machines (same operation time)– Machine breaks down– No buffers
M1 M2 Mi Mk

2.008 -Spring 2004 19
Production Rates (cont’d)
• Case VI:– Many machines and buffers in between– Machine breaks down
M1 M2 Mi MkB1 B2 Bk-1Mk-1

2.008 -Spring 2004 20
Production Rates (cont’d)
• Production rate increases if:– Increase the rate of the slowest machine– Reduce the disruptions– Introduce “buffers”– Introduce in-process control

2.008 -Spring 2004 21
Disruptions (Random Events)
• Machine failure • Set-up change • Operator absence • Starvation/Blockage

2.008 -Spring 2004 22
Waiting
• Underutilization• Idleness • Inventory

2.008 -Spring 2004 23
Inventory/Work-in-Process (WIP)
• It costs money • It gets damaged • It becomes obsolete • It shrinks • It increases lead time

2.008 -Spring 2004 24
Cycle Time and Lead Time
Order
Supply
Order
Supply
PlantSupplier Customer
demand averageDaily
time availableDaily time Takt

2.008 -Spring 2004 25
Cycle Time
“Cycle Time”
. The time a part spends in the system
Little’s Law: L = λw
L: average inventory
λ: average production rate
w: average cycle time

2.008 -Spring 2004 26
Cycle Time (cont’d)
• Example:Operation time = 1, One-piece operation
Production rate = 1
Cycle time = 5
Inventory = 5
M1 M2 M3 M5M4

2.008 -Spring 2004 27
Cycle Time Batch Production
1.
Operation time: 3 minutes
Batch (Lot) size: 1000
Cycle time = 1,000*3 + 1,000*3 + 1,000*3 = 9,000min
Op1 Op2 Op3

2.008 -Spring 2004 28
Cycle Time One-Piece Production
2.
Operation time = 3 minutes
Cycle time = 1,000*3 + 2*3 = 3,006 minutes
Op1 Op2 Op3

2.008 -Spring 2004 29
Cycle Time and Lead Time
Order
Supply
Order
Supply
PlantSupplier Customer
demand averageDaily
time availableDaily time Takt

2.008 -Spring 2004 30
Systems Design and Operation
• Cycle time < Lead time
• Lumpiness
• Information contents

2.008 -Spring 2004 31
Lumpy Demand
D 1 1 1 1 1 1
P 5 5
D 6 6 6 6 6 6
P 15 15 15
D 3 3 3 3 3 3
P 10 10
D 7 7 7 7 7 7
P 25 25
D 20 0 15 0 0 20
P 25 25 25
D 35 0 0 35 0 0
P 50 50
D 75 0 25 50 0 25
Wrench A Wrench B Wrench C Wrench D
Forging X Forging Y
Steel Z

2.008 -Spring 2004 32
Typical Design Guidelines
• Leveling • Balancing • Single-piece flow • Low materials handling • Low setup time • Smaller lot size • Low WIP • Faster feedback

2.008 -Spring 2004 33
Plant Operations
• Push (MRP, ERP, etc.) vs. Pull (JIT)• Batch vs. One-piece


