Tab 9 1 Index 2
July 6, 2012 3 MANITOBA HYDRO 4
2012/13 & 2013/14 GENERAL RATE APPLICATION 5 6
VOLUME II 7 8
ENERGY SUPPLY 9
10 INDEX 11
12 9.0 Overview of Tab 9 ............................................................................................................... 1 13 9.1 Energy Supply ...................................................................................................................... 2 14 9.2 Power Resource Planning Criteria ....................................................................................... 3 15 9.3 Supply and Demand Summary ............................................................................................ 4 16 9.4 Major Projects ...................................................................................................................... 7 17 9.5 Export Markets and Export Sales ...................................................................................... 10 18 9.6 Water Conditions ............................................................................................................... 21 19 9.7 Financial Impact of Drought .............................................................................................. 25 20 21
Tab 9 Page 1 of 26 July 6, 2012
MANITOBA HYDRO 1 2010/11 & 2011/12 GENERAL RATE APPLICATION 2
3 VOLUME II 4
5 ENERGY SUPPLY 6
7 9.0 9
OVERVIEW OF TAB 9 8
Tab 9 provides information on energy supply planning as well as an estimate of energy 10 generation based on prevailing water conditions. Section 9.1 provides highlights of the 11 2011/12 Power Resource Plan for the Manitoba Hydro system; Section 9.2 describes 12 Manitoba Hydro’s criteria that are utilized to ensure an adequate supply of capacity and 13 dependable energy; Section 9.3 provides supply and demand tables that summarize the 14 capacity and dependable energy for each year up to 2027/28; Section 9.4 provides 15 information on the following major projects and initiatives: Wuskwatim GS, wind 16 generation, Bipole III transmission, Pointe du Bois GS, Kelsey GS Upgrade, Conawapa 17 GS, Keeyask GS, Demand Side Management, and thermal resources; Section 9.5 18 provides a description of export market conditions and Manitoba Hydro’s export sales 19 activities; Section 9.6 provides an update on system operations, energy in reservoir 20 storage, water conditions and hydraulic generation for 2011/12 based on water conditions 21 as of March 31, 2012; and, Section 9.7 provides information related to the loss of 22 revenues due to the risk of an extended drought period commencing in 2013/14 with a 23 duration of five years. 24
25
Tab 9 Page 2 of 26 July 6, 2012
9.1 2
ENERGY SUPPLY 1
The 2011/12 Power Resource Plan is the most recent corporately approved update of 3 energy supply and demand for the Manitoba Hydro system and is based on information 4 available prior to August 2011. The 2011/12 plan incorporates the 2011 Electric Load 5 Forecast and the 2011 Power Smart Plan for demand side management. 6 7 The 2011/12 plan assessed various alternative development plans. The recommended 8 development plan includes the construction of major new resources, Keeyask GS (in-9 service 2019) and Conawapa GS (in-service 2024). The construction of Keeyask and 10 Conawapa in close succession meets the demand of Manitoba domestic load and 11 facilitates the new export sales to Wisconsin Public Service and Minnesota Power and the 12 construction of a new U.S. interconnection. The 2011/12 plan also includes new sales 13 agreements with Northern States Power (“NSP”) to extend the export sale and diversity 14 contacts for an additional ten years to 2025 over the existing interconnection. 15 16 The 2011/12 plan includes a number of other major generation projects. The next 17 hydroelectric resource is the Wuskwatim project for which construction began in August 18 2006 with first power expected in 2012. The plan also includes the purchase of a total of 19 253.5 MW of wind generation from the St. Leon and St. Joseph wind farms. 20 21 The 2011/12 plan assumes that the existing Pointe du Bois Generating Station will 22 continue to operate until 2030, and a new spillway and new concrete and earth dams will 23 be completed by 2015. 24
25 The 2011/12 plan includes the Bipole III transmission line for system reliability 26 requirements and also for transmitting existing and future northern generation. The 27 Bipole is to be routed from the Keewatinoow station, located near the proposed 28 Conawapa generating station, to the Riel converter station east of Winnipeg, with an in-29 service date of 2017. Final design for the west-side route is being completed. 30
31
Tab 9 Page 3 of 26 July 6, 2012
9.2 2
POWER RESOURCE PLANNING CRITERIA 1
In planning for a reliable supply of electric power for Manitobans, Manitoba Hydro has 3 established the following criteria: 4 5
Capacity Criterion 6 7
The capacity criterion for the Manitoba Hydro system requires that planned generation 8 capacity (MW) must not be less than forecast firm annual peak demand plus a reserve 9 requirement of 12% of forecast firm loads. 10 11 Reserves are intended to protect against capacity shortfalls resulting from three types of 12 contingencies: breakdown of generation equipment, increases in peak load due to extreme 13 weather, and deviation from the peak load forecast due to higher than projected 14 provincial economic growth in the short term. 15 16 Reserve margins of 12% are adequate in Manitoba Hydro’s predominately hydraulic 17 system because of the relatively low outage rates of hydro generating units combined 18 with relatively small size of units. For comparison, reserve margins on thermal systems 19 are typically required to be in the 15% to 20% range. 20 21
23 Dependable Energy Criterion 22
Manitoba Hydro has adopted an energy supply (GW.h) planning criterion that recognizes 24 the limitation of hydroelectric generation during drought conditions. This energy criterion 25 requires that the Manitoba Hydro System shall be capable of a dependable supply of 26 energy to meet forecast firm load demand. Specifically, there must be sufficient firm 27 energy sources to meet firm energy demand in the event of a repeat of the lowest historic 28 river flow conditions. It should be noted that the dependable flow has been determined by 29 adjusting historic flows to represent present use conditions and accounting for expected 30 withdrawals of water upstream of Manitoba. 31 32 The dependable supply includes energy from hydro-electric and thermal stations, 33 purchases from wind farms, as well as contracted imports from neighbouring utilities and 34 non-contracted imports from organized markets. The quantity of dependable imports 35 should not exceed 10% of Manitoba Hydro’s domestic energy requirement. Imports that 36 are associated with a firm export sale are not included in the 10% limit. 37
Tab 9 Page 4 of 26 July 6, 2012
9.3 2
SUPPLY AND DEMAND SUMMARY 1
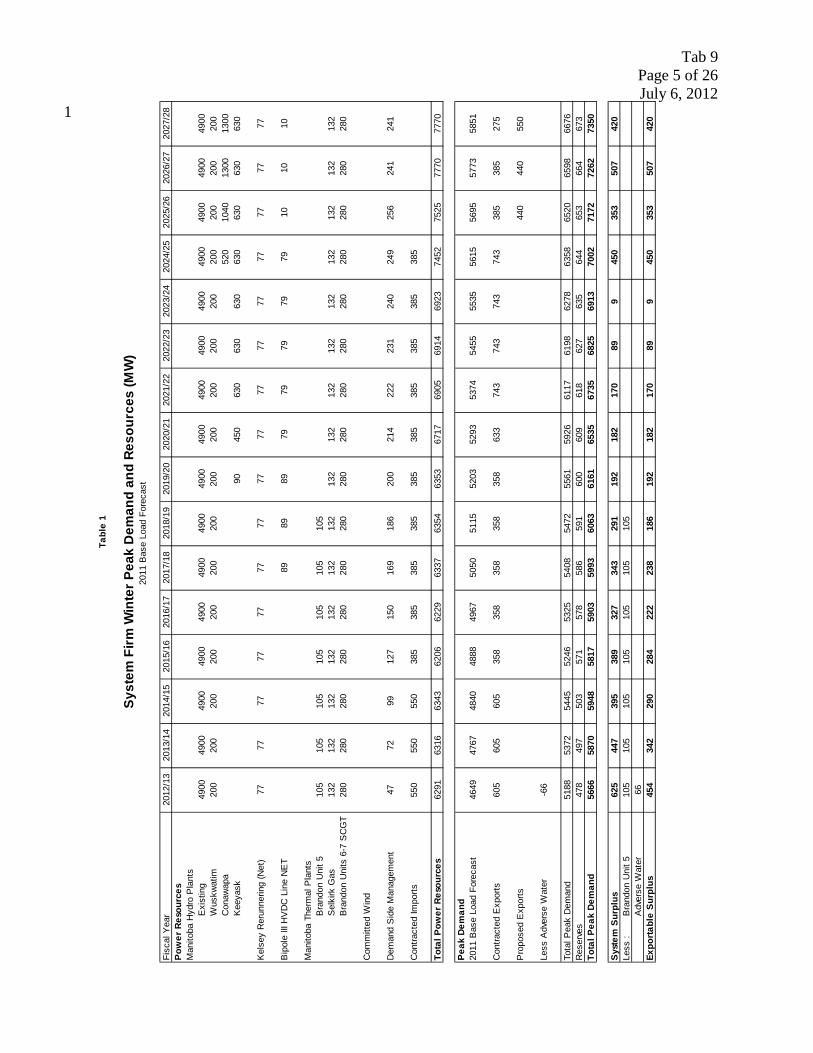
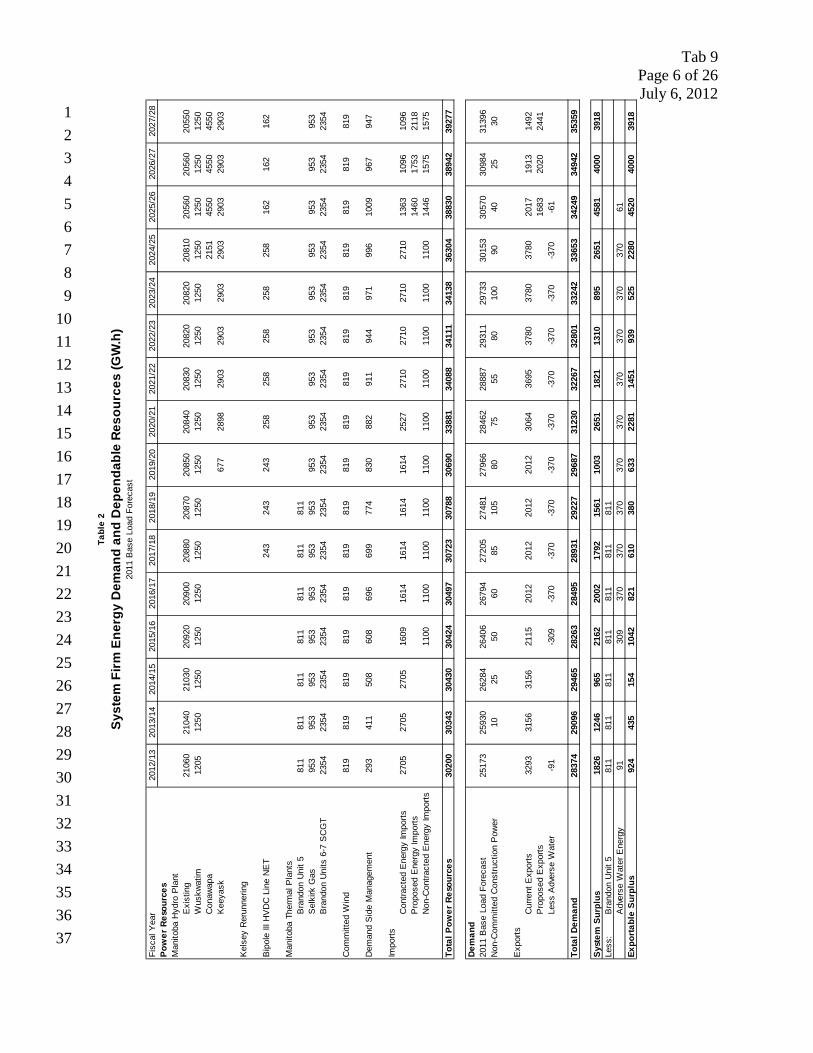
The firm electric supply and demand summary during the winter peak (MW) for the 3 Manitoba system between fiscal years 2012/13 and 2027/28 is provided in Table 1. 4 Demand includes the 2011 forecast of Manitoba load plus contracted extraprovincial 5 exports and capacity reserve requirements. Table 2 provides a similar summary for firm 6 energy (GW.h) supply and demand during each year between fiscal years 2012/13 and 7 2027/28. 8
Tab 9 Page 5 of 26 July 6, 2012
1
Fisc
al Y
ear
2012
/13
2013
/14
2014
/15
2015
/16
2016
/17
2017
/18
2018
/19
2019
/20
2020
/21
2021
/22
2022
/23
2023
/24
2024
/25
2025
/26
2026
/27
2027
/28
Pow
er R
esou
rces
Man
itoba
Hyd
ro P
lant
sE
xist
ing
4900
4900
4900
4900
4900
4900
4900
4900
4900
4900
4900
4900
4900
4900
4900
4900
Wus
kwat
im20
020
020
020
020
020
020
020
020
020
020
020
020
020
020
020
0C
onaw
apa
520
1040
1300
1300
Kee
yask
9045
063
063
063
063
063
063
063
0
Kel
sey
Rer
unne
ring
(Net
)77
7777
7777
7777
7777
7777
7777
7777
77
Bip
ole
III H
VD
C L
ine
NE
T89
8989
7979
7979
7910
1010
Man
itoba
The
rmal
Pla
nts
Bra
ndon
Uni
t 510
510
510
510
510
510
510
5S
elki
rk G
as13
213
213
213
213
213
213
213
213
213
213
213
213
213
213
213
2B
rand
on U
nits
6-7
SC
GT
280
280
280
280
280
280
280
280
280
280
280
280
280
280
280
280
Com
mitt
ed W
ind
Dem
and
Sid
e M
anag
emen
t47
7299
127
150
169
186
200
214
222
231
240
249
256
241
241
Con
tract
ed Im
ports
550
550
550
385
385
385
385
385
385
385
385
385
385
Tota
l Pow
er R
esou
rces
6291
6316
6343
6206
6229
6337
6354
6353
6717
6905
6914
6923
7452
7525
7770
7770
Peak
Dem
and
2011
Bas
e Lo
ad F
orec
ast
4649
4767
4840
4888
4967
5050
5115
5203
5293
5374
5455
5535
5615
5695
5773
5851
Con
tract
ed E
xpor
ts60
560
560
535
835
835
835
835
863
374
374
374
374
338
538
527
5
Pro
pose
d E
xpor
ts44
044
055
0
Less
Adv
erse
Wat
er-6
6
Tota
l Pea
k D
eman
d51
8853
7254
4552
4653
2554
0854
7255
6159
2661
1761
9862
7863
5865
2065
9866
76R
eser
ves
478
497
503
571
578
586
591
600
609
618
627
635
644
653
664
673
Tota
l Pea
k De
man
d56
6658
7059
4858
1759
0359
9360
6361
6165
3567
3568
2569
1370
0271
7272
6273
50
Syst
em S
urpl
us62
544
739
538
932
734
329
119
218
217
089
945
035
350
742
0Le
ss :
Bra
ndon
Uni
t 510
510
510
510
510
510
510
5A
dver
se W
ater
66Ex
port
able
Sur
plus
454
342
290
284
222
238
186
192
182
170
899
450
353
507
420
Tabl
e 1
Syst
em F
irm W
inte
r Pea
k D
eman
d an
d Re
sour
ces
(MW
)20
11 B
ase
Load
For
ecas
t
Tab 9 Page 6 of 26 July 6, 2012
1 2 3 4 5 6 7 8 9 10 11 12 13 14 15 16 17 18 19 20 21 22 23 24 25 26 27 28 29 30 31 32 33 34 35 36 37
Fisc
al Y
ear
2012
/13
2013
/14
2014
/15
2015
/16
2016
/17
2017
/18
2018
/19
2019
/20
2020
/21
2021
/22
2022
/23
2023
/24
2024
/25
2025
/26
2026
/27
2027
/28
Pow
er R
esou
rces
Man
itoba
Hyd
ro P
lant
Exi
stin
g21
060
2104
021
030
2092
020
900
2088
020
870
2085
020
840
2083
020
820
2082
020
810
2056
020
560
2055
0W
uskw
atim
1205
1250
1250
1250
1250
1250
1250
1250
1250
1250
1250
1250
1250
1250
1250
1250
Con
awap
a21
5145
5045
5045
50K
eeya
sk67
728
9829
0329
0329
0329
0329
0329
0329
03
Kel
sey
Rer
unne
ring
Bip
ole
III H
VD
C L
ine
NE
T 24
324
324
325
825
825
825
825
816
216
216
2
Man
itoba
The
rmal
Pla
nts
Bra
ndon
Uni
t 581
181
181
181
181
181
181
1S
elki
rk G
as95
395
395
395
395
395
395
395
395
395
395
395
395
395
395
395
3B
rand
on U
nits
6-7
SC
GT
2354
2354
2354
2354
2354
2354
2354
2354
2354
2354
2354
2354
2354
2354
2354
2354
Com
mitt
ed W
ind
819
819
819
819
819
819
819
819
819
819
819
819
819
819
819
819
Dem
and
Sid
e M
anag
emen
t29
341
150
860
869
669
977
483
088
291
194
497
199
610
0996
794
7
Impo
rtsC
ontra
cted
Ene
rgy
Impo
rts27
0527
0527
0516
0916
1416
1416
1416
1425
2727
1027
1027
1027
1013
6310
9610
96P
ropo
sed
Ene
rgy
Impo
rts14
6017
5321
18N
on-C
ontra
cted
Ene
rgy
Impo
rts11
0011
0011
0011
0011
0011
0011
0011
0011
0011
0014
4615
7515
75
Tota
l Pow
er R
esou
rces
3020
030
343
3043
030
424
3049
730
723
3078
830
690
3388
134
088
3411
134
138
3630
438
830
3894
239
277
Dem
and
2011
Bas
e Lo
ad F
orec
ast
2517
325
930
2628
426
406
2679
427
205
2748
127
966
2846
228
887
2931
129
733
3015
330
570
3098
431
396
Non
-Com
mitt
ed C
onst
ruct
ion
Pow
er10
2550
6085
105
8075
5580
100
9040
2530
Exp
orts
Cur
rent
Exp
orts
3293
3156
3156
2115
2012
2012
2012
2012
3064
3695
3780
3780
3780
2017
1913
1492
Pro
pose
d E
xpor
ts16
8320
2024
41Le
ss A
dver
se W
ater
-91
-309
-370
-370
-370
-370
-370
-370
-370
-370
-370
-61
Tota
l Dem
and
2837
429
096
2946
528
263
2849
528
931
2922
729
687
3123
032
267
3280
133
242
3365
334
249
3494
235
359
Syst
em S
urpl
us18
2612
4696
521
6220
0217
9215
6110
0326
5118
2113
1089
526
5145
8140
0039
18Le
ss:
Bra
ndon
Uni
t 581
181
181
181
181
181
181
1A
dver
se W
ater
Ene
rgy
9130
937
037
037
037
037
037
037
037
037
061
Expo
rtab
le S
urpl
us92
443
515
410
4282
161
038
063
322
8114
5193
952
522
8045
2040
0039
18
Tabl
e 2
Syst
em F
irm E
nerg
y D
eman
d an
d D
epen
dabl
e Re
sour
ces
(GW
.h)
2011
Bas
e Lo
ad F
orec
ast
Tab 9 Page 7 of 26 July 6, 2012
9.4 2 MAJOR PROJECTS 1
The 2011/12 Power Resource Plan includes several major projects to which Manitoba 3 Hydro has committed or for which there is a reasonable expectation that Manitoba Hydro 4 will commit. Demand Side Management is treated as a supply-side resource for purposes 5 of resource planning. The characteristics of these supply-side initiatives are summarized 6 below. 7 8 Wuskwatim Generating Station 9 10 The Wuskwatim Generating Station is a 200 MW hydroelectric development on the 11 Burntwood River and is scheduled for an in-service date of 2012 with a currently 12 estimated in-service cost of $1.3 billion. 13
14 Wind Generation 15 16 The 2011/12 Power Resource Plan includes the purchase of power from the 99 MW St. 17 Leon Wind Energy wind farm and the 138 MW St. Joseph Wind Farm. In July 2011 18 Manitoba Hydro entered into a power purchase agreement with Algonquin Power to 19 purchase the output from the planned 16.5 MW St. Leon II Wind Energy wind farm. The 20 additional wind turbines will be physically located within the footprint of the existing St. 21 Leon Wind Energy wind farm and are expected to begin operation in 2012. 22 23 Bipole III Project 24 25 The 2011/12 Power Resource Plan includes the Bipole III transmission line for reliability 26 requirements and also for transmitting existing and future northern generation. Bipole III 27 is being routed down the west side of Lakes Winnipegosis and Manitoba. Manitoba 28 Hydro completed the fourth round of community consultations and the final preferred 29 route selection is nearly complete. 30 31 The bipole is expected to extend from the Keewatinoow station, located near the 32 proposed Conawapa generating station, to the Riel converter station east of Winnipeg, 33 with an in-service date of 2017. Final design of Bipole III is in progress with an 34 estimated in-service cost of $3.28 billion. 35 36
37

Tab 9 Page 8 of 26 July 6, 2012
Pointe du Bois Generating Station 1 2 The 2011/12 Power Resource Plan assumes that the existing Pointe du Bois Generating 3 Station will continue to operate until 2030/31 and a new spillway and new concrete and 4 earth dams (Spillway Replacement Project) will be completed over the 2010/11 to 5 2015/16 time frame. Until Pointe du Bois is rebuilt, it is assumed that the existing facility 6 will be maintained so that it will continue to operate at or near full capacity. 7 8
10 Kelsey Generating Station Upgrade 9
The 2011/12 Power Resource Plan continues to include a major upgrade of the Kelsey 11 GS which consists of the replacement of all seven turbines resulting in greater utilization 12 of water flow at the site. This upgrade is expected to be fully in-service in 2012/13 with 13 the potential to increase the plant rating from 224 MW to approximately 300 MW. The 14 project is proceeding on a unit by unit basis, with a review being conducted before 15 undertaking each additional unit replacement. Therefore, the program for remaining units 16 can be deferred at any time. 17 18 Upgraded turbines will be able to pass more water and thus capture more of the energy 19 during higher flow periods. While this does not increase dependable energy, there will be 20 an increase in average energy of about 350 GWh per year. There are seven units at 21 Kelsey GS and each unit is expected to gain about 11 MW. To date, five units have been 22 replaced resulting in a 55 MW increase in capacity. 23 24 Conawapa Generating Station 25 26 The 2011/12 Power Resource Plan includes the Conawapa GS (in-service in 2024/25) 27 following the construction of Keeyask . Conawapa is located downstream of Limestone 28 GS on the Nelson River. The current design rating for Conawapa is 1485 MW under ideal 29 operating conditions with a winter peak rating of 1300 MW that is utilized in resource 30 planning work as the net addition to the system. 31 32 The Conawapa GS will be located within the Fox Lake Resource Management Area. The 33 provincial government and Manitoba Hydro have signed a Memorandum of 34 Understanding with Fox Lake First Nations related to the Conawapa GS. 35 36
Tab 9 Page 9 of 26 July 6, 2012
The corporation has also entered into Process Agreements with First Nations in vicinity 1 of Conawapa including Fox Lake Cree Nation, York Factory First Nation, Tataskweyak 2 Cree Nation and War Lake First Nation working together as the Cree Nations Partners. 3 In addition, Manitoba Hydro has signed a Letter of Agreement with the Shamattawa First 4 Nation. A comprehensive framework for local First Nation participation in project 5 benefits remains to be determined. 6 7 Conawapa GS concept engineering is ongoing. Some plant design parameters have been 8 finalized including forebay elevation and plant discharge capacity while other design 9 parameters have yet to be finalized. The access road to the site is in place as it was built 10 before the original Conawapa GS project was suspended in 1992. 11 12 Keeyask Generating Station 13 14 The 2011/12 Power resource Plan includes the Keeyask GS with the first unit in service 15 in 2019 which is its earliest possible in-service date. Keeyask can be brought in to service 16 approximately five years earlier than Conawapa due to a shorter construction schedule 17 and advanced environmental assessment work. Keeyask is located upstream of the Kettle 18 generating station on the Nelson River. The current design rating for Keeyask is 695 MW 19 under ideal operating conditions with a winter peak rating of 630 MW that is utilized in 20 resource planning work. 21 22 The four in-vicinity Keeyask Cree Nation (“KCN”) communities all voted to ratify the 23 Joint Keeyask Development Agreement (“JKDA”). A JKDA signing ceremony was held 24 on May 29, 2009. 25 26 The Environmental Act License for the Keeyask Infrastructure Project (KIP) was issued 27 in March 2011 and the environmental field work for the Keeyask Generating Station and 28 related works is essentially complete. The Manitoba Hydro Electric Board authorized the 29 Corporation to commence construction of KIP in the summer of 2011 to preserve the 30 2019 in service date. 31 32 Demand Side Management 33 34 The 2011/12 Power Resource Plan includes Demand Side Management Programs which 35 target a 906 MW reduction in peak load and a 3,283 GWh reduction in annual energy 36 consumption by 2025/26. As of March 31, 2011 these programs have achieved a 37
Tab 9 Page 10 of 26
July 6, 2012
309 MW reduction of peak load and a 1,339 GWh reduction in annual energy 1 consumption. Anticipated changes to Codes and Standards for new equipment (e.g. 2 refrigerators, electric motors and lighting) are expected to result in reductions of 157 MW 3 and 935 GWh which are reflected in Manitoba Hydro’s load forecast. Also included in 4 the load forecast are savings due to customer self generation (10 MW) and the Curtailable 5 Rate Program (173 MW). The remaining reduction of 256 MW and 1009 GWh is treated 6 as a resource option in the 2011/12 plan. 7 8 Thermal Resources 9 10 The Environment Act License for Selkirk GS was received in 2008. The Selkirk GS is in 11 good physical condition and is expected to remain serviceable well beyond 2027/28. 12 13 As of January 1, 2010 Brandon Unit 5 has been governed by The Climate Change and 14 Emissions Reductions Act and the associated regulation MR 186/2009, the Coal-Fired 15 Emergency Operations Regulation. The operation of Brandon Unit 5 can occur for two 16 main purposes: mitigation of adverse water condition commonly referred to as “drought”, 17 and to provide system reliability support. Under emergency conditions Brandon Unit 5 18 can continue to operate to its maximum capability of 811 GWh/year. The 2011/12 Power 19 Resource Plan includes operation of Brandon Unit 5 until March 2019. 20 21
9.5 23
EXPORT MARKETS AND EXPORT SALES 22
25 Current Market Conditions 24
Manitoba Hydro’s US export customers’ load forecasts continue to reflect the reduction 26 in demand that resulted from the recession and the slow economic recovery that is being 27 experienced in the US. Their load forecasts remain relatively flat in the short term and 28 then grow modestly in the mid to long term. Given the long-term potential for high and 29 volatile natural gas costs for new natural gas-fired generation, environmental 30 uncertainties associated with existing and new coal generation, and little public support 31 for nuclear generation, there is continued interest in long-term, dependable hydraulic 32 supply from Manitoba as a carbon and price hedge to new thermal generating stations. 33 Energy from hydro is also recognized as a complementary partner to new intermittent 34 renewable generation resources such as wind. 35 36
Tab 9 Page 11 of 26
July 6, 2012
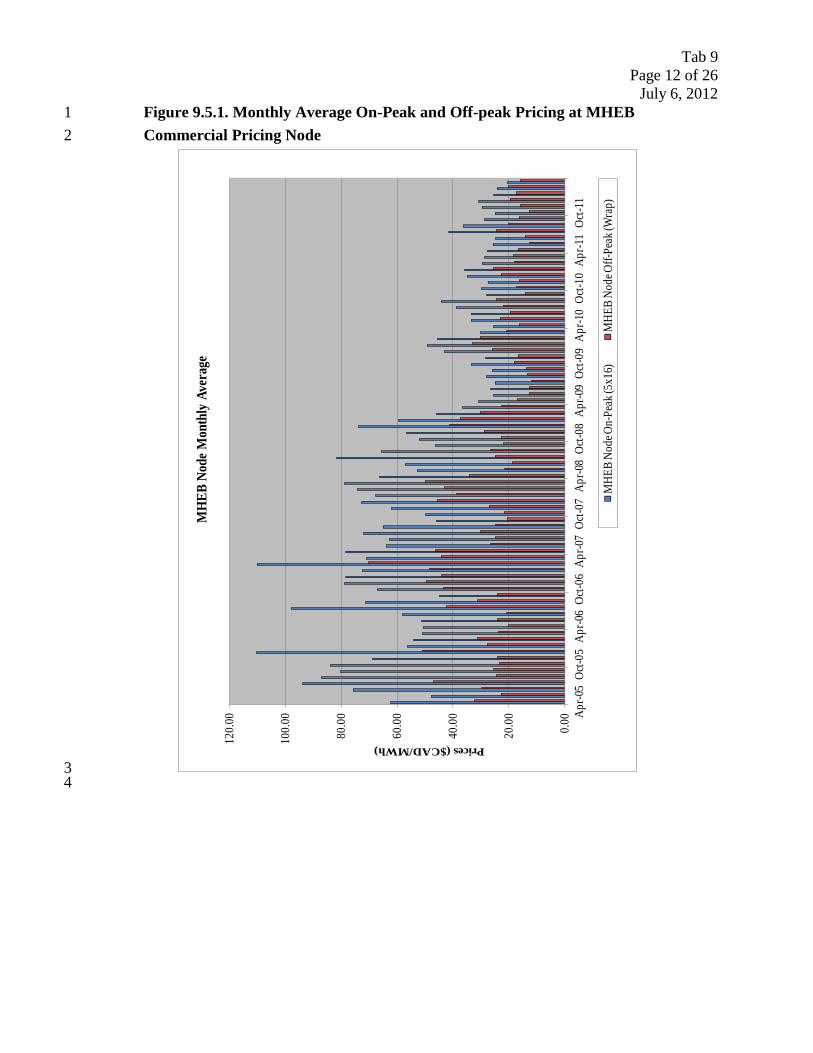
Customers continue to be interested in securing low carbon resources given the potential 1 for new carbon legislation in the United States. However, the uncertainty surrounding 2 potential carbon legislation has increased as US political attention is focused on 3 stimulating the recovery of the US economy. In the long term, uncertainty regarding the 4 impact that greenhouse gas requirements will have on future power prices is a significant 5 issue for customers when evaluating and developing their resource plans. Coal continues 6 to dominate the supply of energy in the Midwest Independent Transmission System 7 Operator (“MISO”) region as coal generation supplied approximately 75% of the energy 8 requirements during the summer of 2011. This high reliance on coal generation by 9 utilities in the MISO market makes Manitoba Hydro’s renewable and clean hydraulic 10 energy a strategic asset. 11 12 Prices for Manitoba Hydro’s export energy increased significantly in the ten years prior 13 to 2009 as a result of US electricity market restructuring, a general tightening of supply, 14 increased demand for low emitting resources, and a general rise in natural gas prices. 15 However, spot and short-term energy prices decreased by approximately 50% in 2009 16 and have remained low due to a soft US economy and very low natural gas prices. In 17 addition, the establishment of the MISO Ancillary Services Market and development of 18 new wind resources in North Dakota and Minnesota have further contributed to lower 19 prices. Figure 9.5.1 shows the monthly average on-peak (5 days × 16 hours) and off-peak 20 (balance of hours) energy prices as posted at the MISO’s Manitoba Hydro Commercial 21 Pricing Node. 22
23 24
Tab 9 Page 12 of 26
July 6, 2012
Figure 9.5.1. Monthly Average On-Peak and Off-peak Pricing at MHEB 1 Commercial Pricing Node 2
3 4
0.00
20.0
0
40.0
0
60.0
0
80.0
0
100.
00
120.
00 Apr-0
5Oc
t-05
Apr-0
6Oc
t-06
Apr-0
7Oc
t-07
Apr-0
8Oc
t-08
Apr-0
9Oc
t-09
Apr-1
0Oc
t-10
Apr-1
1Oc
t-11
Prices ($CAD/MWh)
MH
EB N
ode M
onth
ly A
vera
ge
MHE
B No
de O
n-Pe
ak (5
x16)
MHE
B No
de O
ff-Pe
ak (W
rap)
Tab 9 Page 13 of 26
July 6, 2012
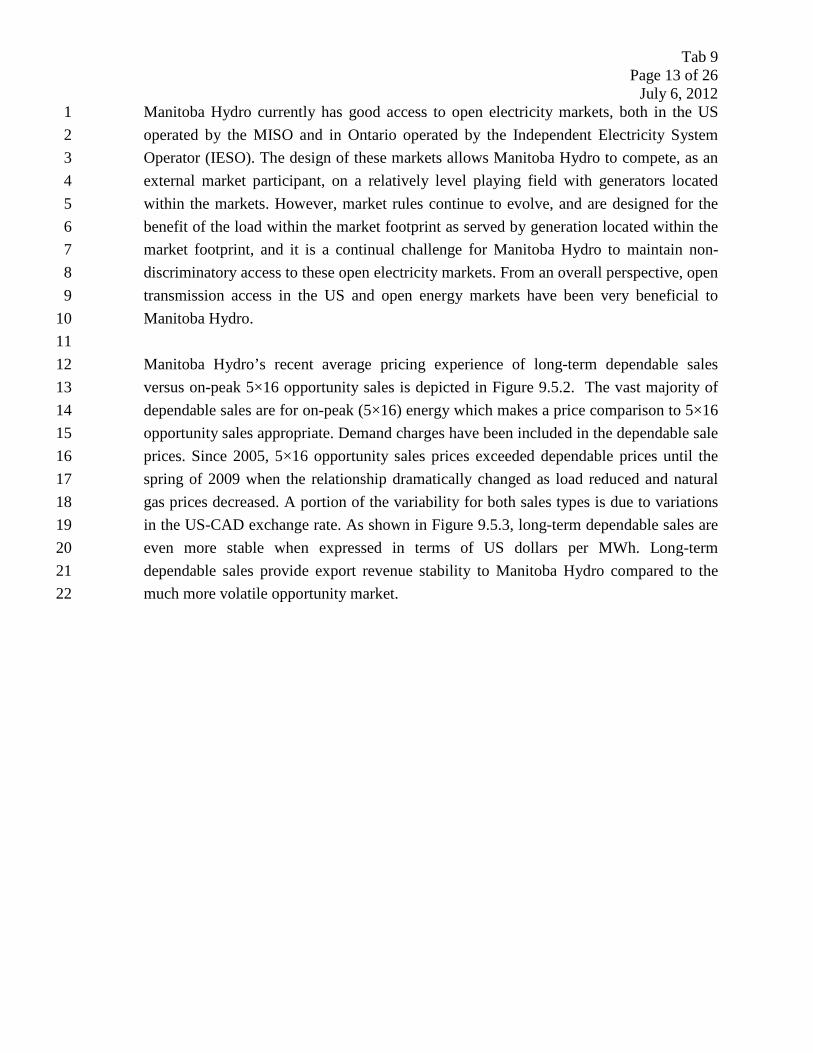
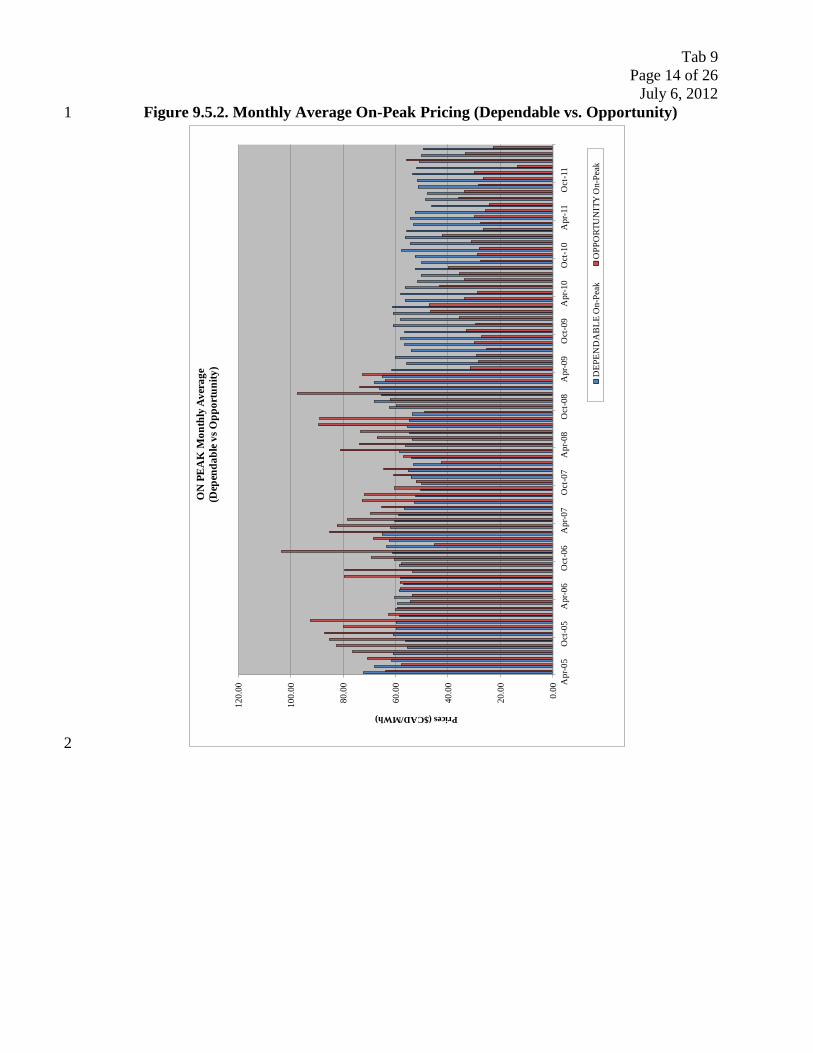
Manitoba Hydro currently has good access to open electricity markets, both in the US 1 operated by the MISO and in Ontario operated by the Independent Electricity System 2 Operator (IESO). The design of these markets allows Manitoba Hydro to compete, as an 3 external market participant, on a relatively level playing field with generators located 4 within the markets. However, market rules continue to evolve, and are designed for the 5 benefit of the load within the market footprint as served by generation located within the 6 market footprint, and it is a continual challenge for Manitoba Hydro to maintain non-7 discriminatory access to these open electricity markets. From an overall perspective, open 8 transmission access in the US and open energy markets have been very beneficial to 9 Manitoba Hydro. 10 11 Manitoba Hydro’s recent average pricing experience of long-term dependable sales 12 versus on-peak 5×16 opportunity sales is depicted in Figure 9.5.2. The vast majority of 13 dependable sales are for on-peak (5×16) energy which makes a price comparison to 5×16 14 opportunity sales appropriate. Demand charges have been included in the dependable sale 15 prices. Since 2005, 5×16 opportunity sales prices exceeded dependable prices until the 16 spring of 2009 when the relationship dramatically changed as load reduced and natural 17 gas prices decreased. A portion of the variability for both sales types is due to variations 18 in the US-CAD exchange rate. As shown in Figure 9.5.3, long-term dependable sales are 19 even more stable when expressed in terms of US dollars per MWh. Long-term 20 dependable sales provide export revenue stability to Manitoba Hydro compared to the 21 much more volatile opportunity market. 22
Tab 9 Page 14 of 26
July 6, 2012
Figure 9.5.2. Monthly Average On-Peak Pricing (Dependable vs. Opportunity) 1
2
0.00
20.0
0
40.0
0
60.0
0
80.0
0
100.
00
120.
00
Apr
-05
Oct
-05
Apr
-06
Oct
-06
Apr
-07
Oct
-07
Apr
-08
Oct
-08
Apr
-09
Oct
-09
Apr
-10
Oct
-10
Apr
-11
Oct
-11
Prices ($CAD/MWh)
ON
PE
AK
Mon
thly
Ave
rage
(D
epen
dabl
e vs O
ppor
tuni
ty)
DEP
END
AB
LE O
n-Pe
akO
PPO
RTU
NIT
Y O
n-Pe
ak
Tab 9 Page 15 of 26
July 6, 2012
Figure 9.5.3. Monthly Average On-Peak Dependable Pricing (US vs. CAD 1 Currency) 2
3 4
5
0.00
20.0
0
40.0
0
60.0
0
80.0
0
100.
00
120.
00
Apr
-05
Oct
-05
Apr
-06
Oct
-06
Apr
-07
Oct
-07
Apr
-08
Oct
-08
Apr
-09
Oct
-09
Apr
-10
Oct
-10
Apr
-11
Oct
-11
Prices/MWh)
ON
PEA
K M
onth
ly A
vera
ge
$CA
D vs
$U
SD
DEP
END
ABL
E O
n-Pe
ak $U
SDD
EPEN
DA
BLE
On-
Peak
$CA
D
Tab 9 Page 16 of 26
July 6, 2012
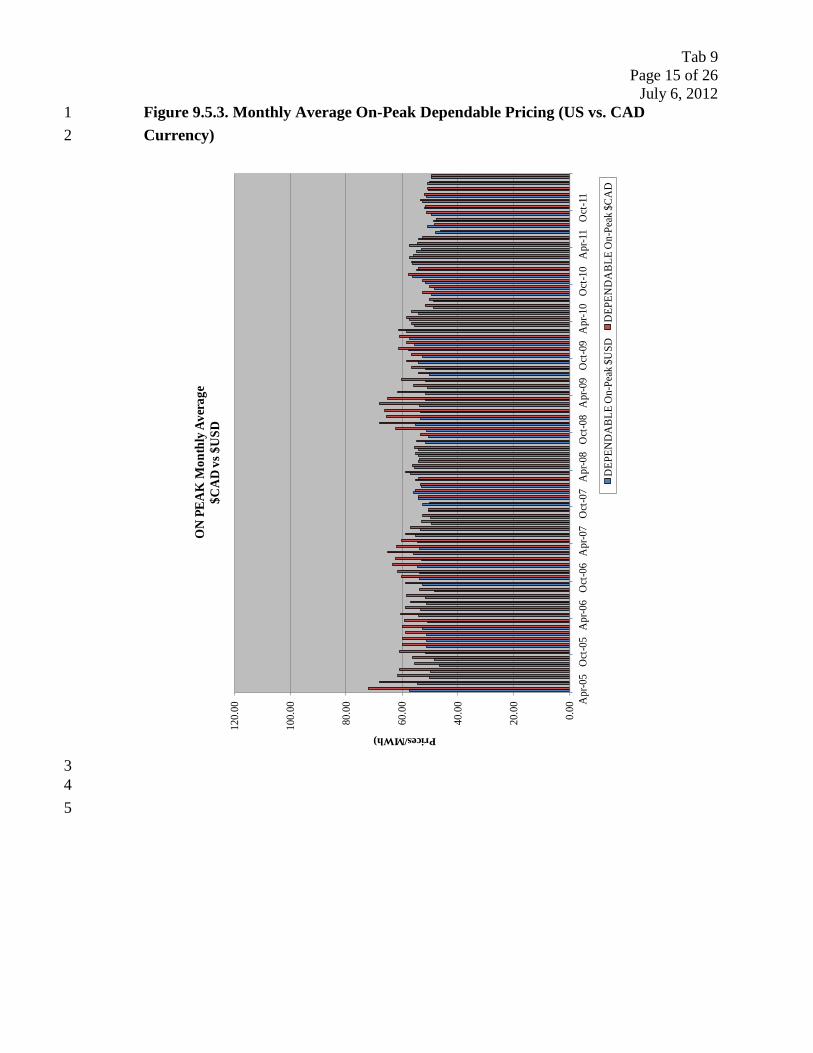
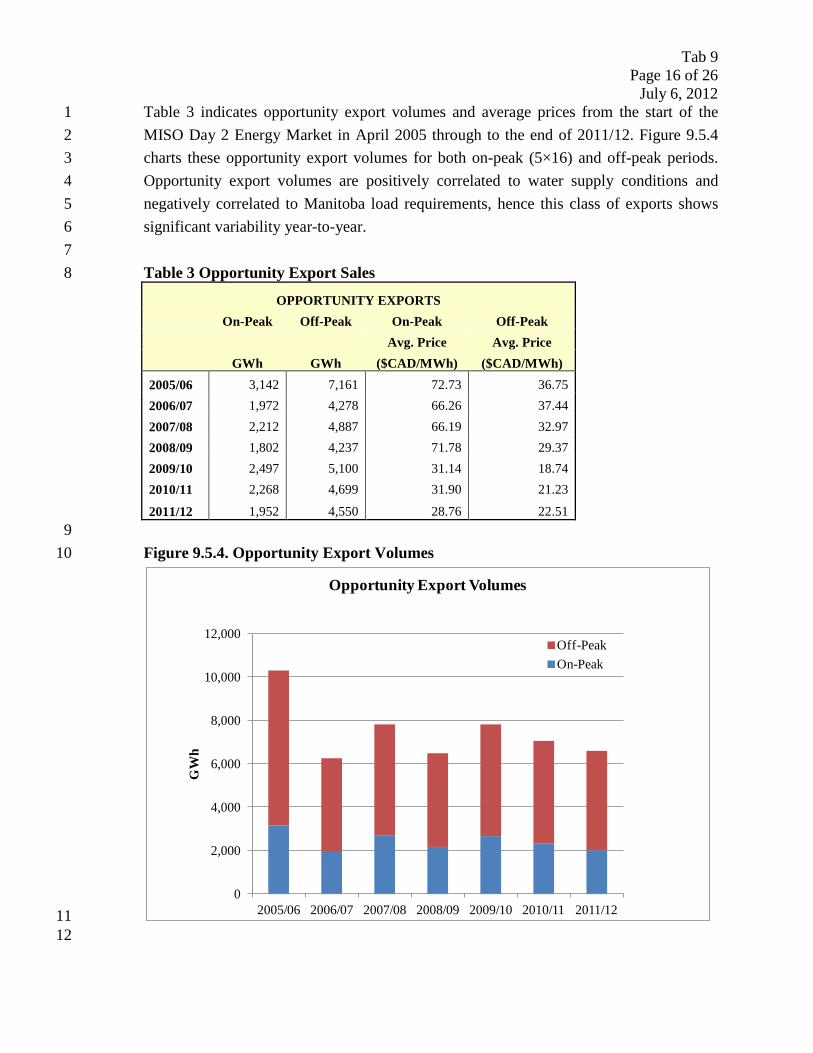
Table 3 indicates opportunity export volumes and average prices from the start of the 1 MISO Day 2 Energy Market in April 2005 through to the end of 2011/12. Figure 9.5.4 2 charts these opportunity export volumes for both on-peak (5×16) and off-peak periods. 3 Opportunity export volumes are positively correlated to water supply conditions and 4 negatively correlated to Manitoba load requirements, hence this class of exports shows 5 significant variability year-to-year. 6
7 Table 3 Opportunity Export Sales 8
OPPORTUNITY EXPORTS On-Peak Off-Peak On-Peak Off-Peak Avg. Price Avg. Price GWh GWh ($CAD/MWh) ($CAD/MWh) 2005/06 3,142 7,161 72.73 36.75 2006/07 1,972 4,278 66.26 37.44 2007/08 2,212 4,887 66.19 32.97 2008/09 1,802 4,237 71.78 29.37 2009/10 2,497 5,100 31.14 18.74 2010/11 2,268 4,699 31.90 21.23
2011/12 1,952 4,550 28.76 22.51 9
Figure 9.5.4. Opportunity Export Volumes 10
11 12
0
2,000
4,000
6,000
8,000
10,000
12,000
2005/06 2006/07 2007/08 2008/09 2009/10 2010/11 2011/12
GW
h
Opportunity Export Volumes
Off-PeakOn-Peak
Tab 9 Page 17 of 26
July 6, 2012
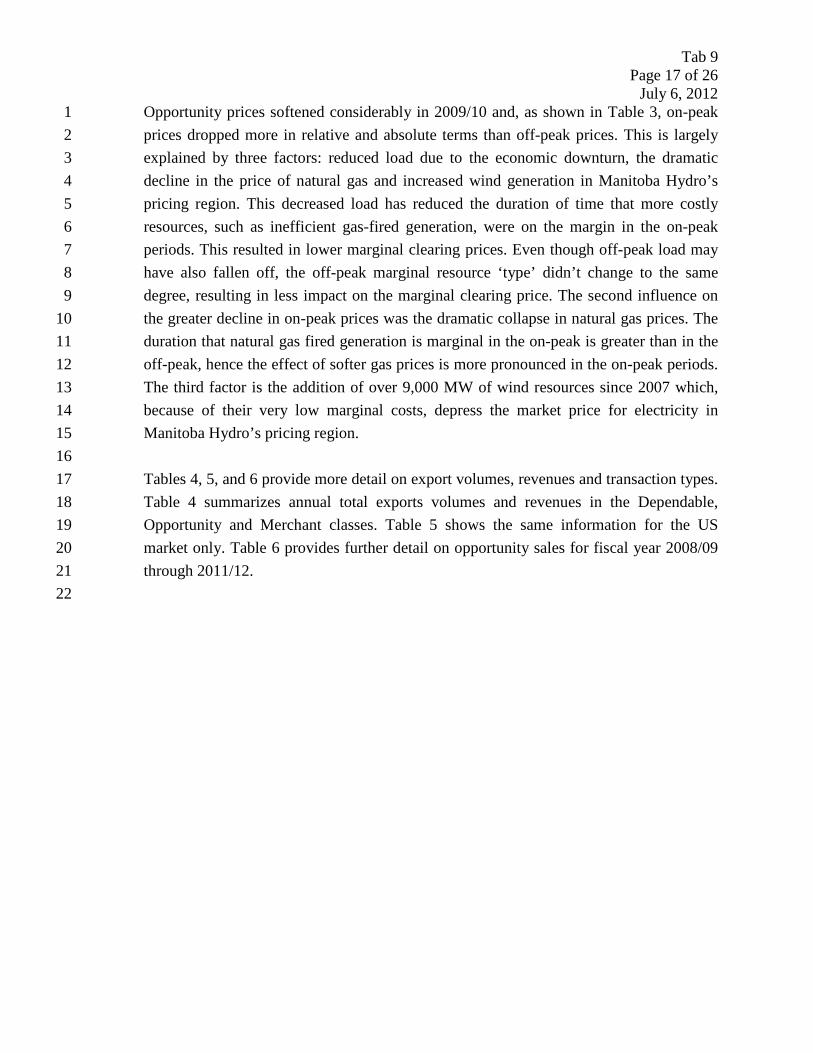
Opportunity prices softened considerably in 2009/10 and, as shown in Table 3, on-peak 1 prices dropped more in relative and absolute terms than off-peak prices. This is largely 2 explained by three factors: reduced load due to the economic downturn, the dramatic 3 decline in the price of natural gas and increased wind generation in Manitoba Hydro’s 4 pricing region. This decreased load has reduced the duration of time that more costly 5 resources, such as inefficient gas-fired generation, were on the margin in the on-peak 6 periods. This resulted in lower marginal clearing prices. Even though off-peak load may 7 have also fallen off, the off-peak marginal resource ‘type’ didn’t change to the same 8 degree, resulting in less impact on the marginal clearing price. The second influence on 9 the greater decline in on-peak prices was the dramatic collapse in natural gas prices. The 10 duration that natural gas fired generation is marginal in the on-peak is greater than in the 11 off-peak, hence the effect of softer gas prices is more pronounced in the on-peak periods. 12 The third factor is the addition of over 9,000 MW of wind resources since 2007 which, 13 because of their very low marginal costs, depress the market price for electricity in 14 Manitoba Hydro’s pricing region. 15
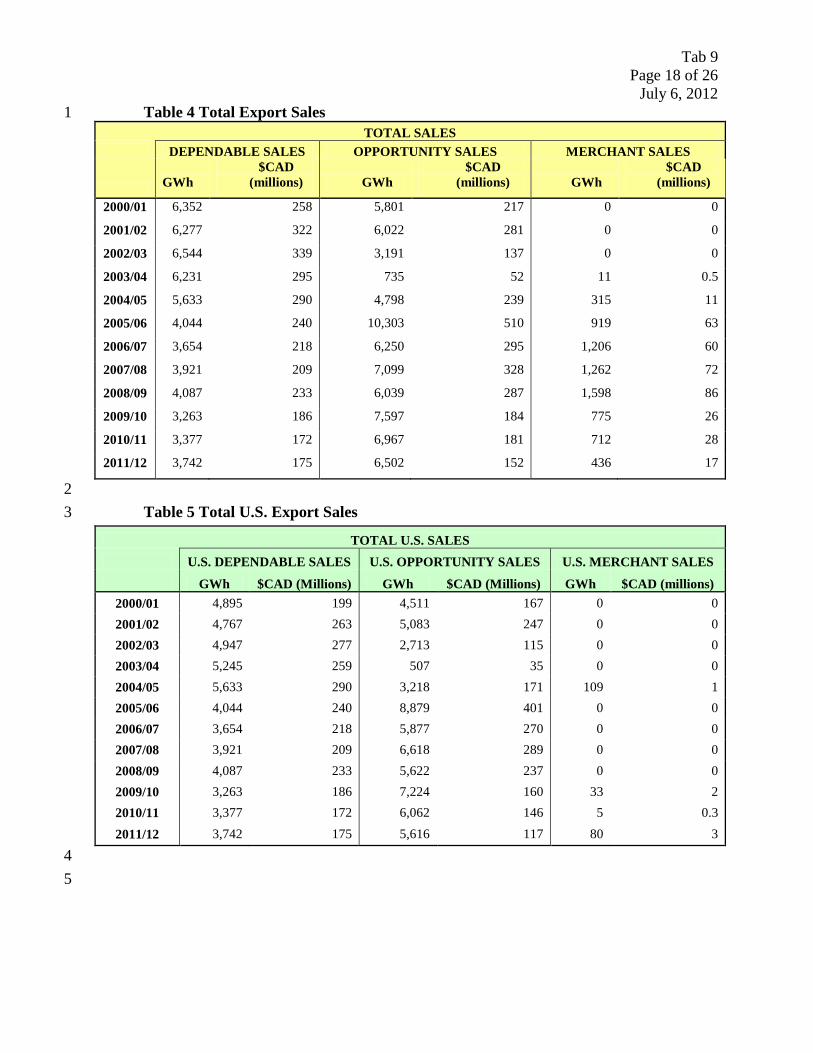
16 Tables 4, 5, and 6 provide more detail on export volumes, revenues and transaction types. 17 Table 4 summarizes annual total exports volumes and revenues in the Dependable, 18 Opportunity and Merchant classes. Table 5 shows the same information for the US 19 market only. Table 6 provides further detail on opportunity sales for fiscal year 2008/09 20 through 2011/12. 21
22
Tab 9 Page 18 of 26
July 6, 2012
Table 4 Total Export Sales 1 TOTAL SALES
DEPENDABLE SALES OPPORTUNITY SALES MERCHANT SALES
GWh $CAD
(millions) GWh $CAD
(millions) GWh $CAD
(millions)
2000/01 6,352 258 5,801 217 0 0
2001/02 6,277 322 6,022 281 0 0
2002/03 6,544 339 3,191 137 0 0
2003/04 6,231 295 735 52 11 0.5
2004/05 5,633 290 4,798 239 315 11
2005/06 4,044 240 10,303 510 919 63
2006/07 3,654 218 6,250 295 1,206 60
2007/08 3,921 209 7,099 328 1,262 72
2008/09 4,087 233 6,039 287 1,598 86
2009/10 3,263 186 7,597 184 775 26
2010/11 3,377 172 6,967 181 712 28
2011/12 3,742 175 6,502 152 436 17
2 Table 5 Total U.S. Export Sales 3
TOTAL U.S. SALES U.S. DEPENDABLE SALES U.S. OPPORTUNITY SALES U.S. MERCHANT SALES
GWh $CAD (Millions) GWh $CAD (Millions) GWh $CAD (millions) 2000/01 4,895 199 4,511 167 0 0 2001/02 4,767 263 5,083 247 0 0 2002/03 4,947 277 2,713 115 0 0 2003/04 5,245 259 507 35 0 0 2004/05 5,633 290 3,218 171 109 1 2005/06 4,044 240 8,879 401 0 0 2006/07 3,654 218 5,877 270 0 0 2007/08 3,921 209 6,618 289 0 0 2008/09 4,087 233 5,622 237 0 0 2009/10 3,263 186 7,224 160 33 2 2010/11 3,377 172 6,062 146 5 0.3 2011/12 3,742 175 5,616 117 80 3
4 5
Tab 9 Page 19 of 26
July 6, 2012
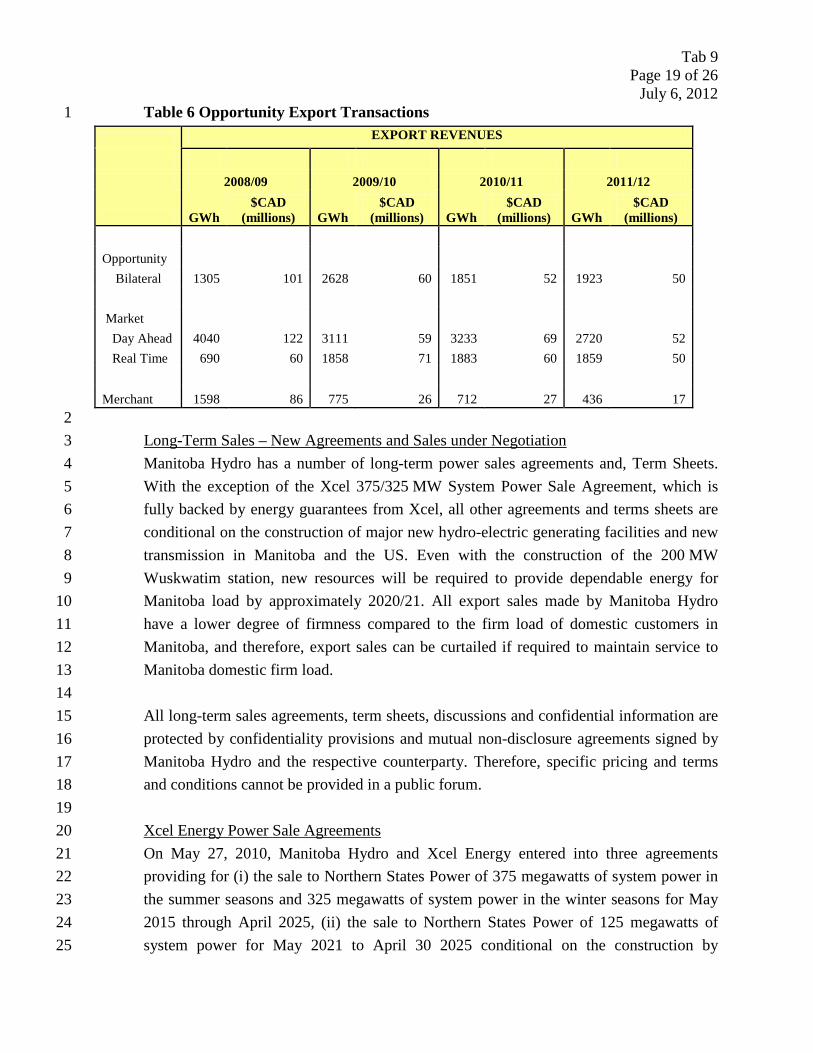
Table 6 Opportunity Export Transactions 1
EXPORT REVENUES
2008/09 2009/10 2010/11 2011/12
GWh $CAD
(millions) GWh $CAD
(millions) GWh $CAD
(millions) GWh $CAD
(millions)
Opportunity
Bilateral 1305 101 2628 60 1851 52 1923 50
Market
Day Ahead 4040 122 3111 59 3233 69 2720 52 Real Time 690 60 1858 71 1883 60 1859 50
Merchant 1598 86 775 26 712 27 436 17 2
Manitoba Hydro has a number of long-term power sales agreements and, Term Sheets. 4 With the exception of the Xcel 375/325 MW System Power Sale Agreement, which is 5 fully backed by energy guarantees from Xcel, all other agreements and terms sheets are 6 conditional on the construction of major new hydro-electric generating facilities and new 7 transmission in Manitoba and the US. Even with the construction of the 200 MW 8 Wuskwatim station, new resources will be required to provide dependable energy for 9 Manitoba load by approximately 2020/21. All export sales made by Manitoba Hydro 10 have a lower degree of firmness compared to the firm load of domestic customers in 11 Manitoba, and therefore, export sales can be curtailed if required to maintain service to 12 Manitoba domestic firm load. 13
Long-Term Sales – New Agreements and Sales under Negotiation 3
14 All long-term sales agreements, term sheets, discussions and confidential information are 15 protected by confidentiality provisions and mutual non-disclosure agreements signed by 16 Manitoba Hydro and the respective counterparty. Therefore, specific pricing and terms 17 and conditions cannot be provided in a public forum. 18 19
On May 27, 2010, Manitoba Hydro and Xcel Energy entered into three agreements 21 providing for (i) the sale to Northern States Power of 375 megawatts of system power in 22 the summer seasons and 325 megawatts of system power in the winter seasons for May 23 2015 through April 2025, (ii) the sale to Northern States Power of 125 megawatts of 24 system power for May 2021 to April 30 2025 conditional on the construction by 25
Xcel Energy Power Sale Agreements 20
Tab 9 Page 20 of 26
July 6, 2012
Manitoba Hydro of major new hydro-electric generating facilities and new transmission 1 in Manitoba and the US, (iii) a 350 megawatt seasonal diversity agreement with Northern 2 States Power where capacity and energy is exported from Manitoba in the summer 3 months and capacity and energy (if required by Manitoba Hydro) is returned to Manitoba 4 in the winter months for the period May 2015 through April 2025. 5 6
On May 19, 2011 Manitoba Hydro and Minnesota Power entered two agreements 8 providing for (i) a 250 megawatt system power sale to Minnesota Power from June 2020 9 to May 2035, (ii) an Energy Exchange Agreement to provide Manitoba Hydro with firm 10 transmission service to import energy during the period June 2020 to May 2035. The 250 11 megawatt System Power Sale Agreement is conditional upon the construction by 12 Manitoba Hydro of major new hydro-electric generating facilities and new transmission 13 in Manitoba and US. 14
Minnesota Power 7
15
In March 2008, Manitoba Hydro and Wisconsin Public Service signed a Term Sheet that 17 set out the significant terms for a 500 megawatt system power sale. Based on this Term 18 Sheet, Manitoba Hydro and Wisconsin Public Service entered a 100 megawatt System 19 Power Sale Agreement for the period June 2021 to May 2027 on May 19, 2011. The 100 20 megawatt System Power Sale is contingent on the construction of new hydraulic 21 generation in Manitoba. Negotiations are continuing to expand the Wisconsin power sale 22 up to 500 megawatts which will require the construction of the Conawapa Generating 23 Station and new transmission in Manitoba and the United States. 24
Wisconsin Public Service 16
25 Manitoba Hydro, Minnesota Power and Wisconsin Public Service continue to negotiate 26 and work with the MISO and other US transmission owners on evaluating the costs and 27 benefits of various US transmission alternatives required for the 250 megawatt System 28 Power Sale Agreement with Minnesota Power and for the expanded Wisconsin Public 29 Service sale. 30
31 32
Tab 9 Page 21 of 26
July 6, 2012
9.6 2
WATER CONDITIONS 1
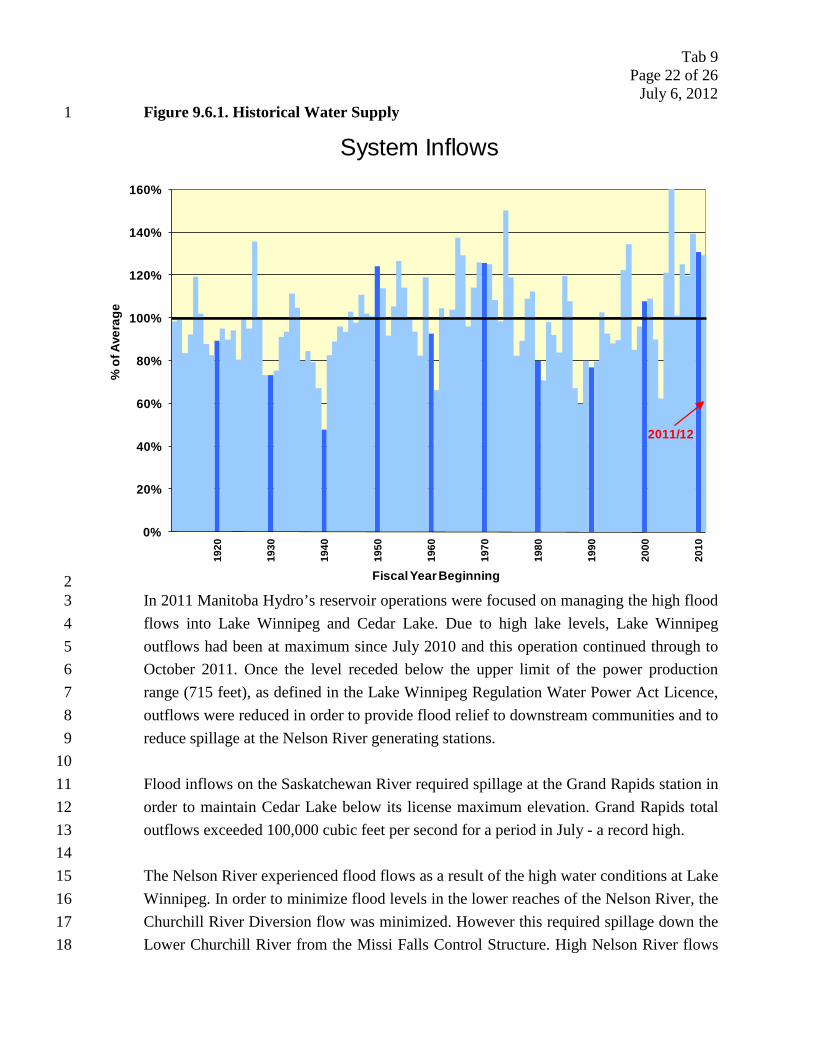
The 2011/12 water year was the 8th highest on record (see Figure 9.6.1). As a result of 4 excessively high soil moisture conditions in the fall of 2010 and winter snow conditions, 5 the 2011 spring runoff was much above average. The Red, Assiniboine, Saskatchewan 6 and Winnipeg rivers all experienced major floods. Overall the flow volume into Lake 7 Winnipeg was the highest on record for the period between April 1 and August 31. The 8 very wet spring was followed by a summer and fall of much below average precipitation, 9 especially over the Winnipeg River Basin. As a result reservoir inflows rapidly 10 transitioned to near record lows by the end of September and remained at or below 11 normal though the winter of 2011/12. 12
2011 System Operations 3
13 Accumulated precipitation for the entire Nelson-Churchill for the period April 1, 2011 to 14 March 31, 2012 was 90% of normal (or 56 mm below the 34-year average of 570 mm). 15 This corresponds to a 10th percentile condition. 16 17
18
Tab 9 Page 22 of 26
July 6, 2012
Figure 9.6.1. Historical Water Supply 1
2 In 2011 Manitoba Hydro’s reservoir operations were focused on managing the high flood 3 flows into Lake Winnipeg and Cedar Lake. Due to high lake levels, Lake Winnipeg 4 outflows had been at maximum since July 2010 and this operation continued through to 5 October 2011. Once the level receded below the upper limit of the power production 6 range (715 feet), as defined in the Lake Winnipeg Regulation Water Power Act Licence, 7 outflows were reduced in order to provide flood relief to downstream communities and to 8 reduce spillage at the Nelson River generating stations. 9 10 Flood inflows on the Saskatchewan River required spillage at the Grand Rapids station in 11 order to maintain Cedar Lake below its license maximum elevation. Grand Rapids total 12 outflows exceeded 100,000 cubic feet per second for a period in July - a record high. 13 14 The Nelson River experienced flood flows as a result of the high water conditions at Lake 15 Winnipeg. In order to minimize flood levels in the lower reaches of the Nelson River, the 16 Churchill River Diversion flow was minimized. However this required spillage down the 17 Lower Churchill River from the Missi Falls Control Structure. High Nelson River flows 18
0%
20%
40%
60%
80%
100%
120%
140%
160%
1920
1930
1940
1950
1960
1970
1980
1990
2000
2010
% o
f Ave
rage
Fiscal Year Beginning
System Inflows
2011/12

Tab 9 Page 23 of 26
July 6, 2012
resulted in spillage at the Nelson River plants from May through November and the sale 1 of large volumes of energy in the off-peak markets. 2 3 Figure 9.6.2 is a chart of daily energy from inflows to the Manitoba Hydro system 4 compared to the 30 previous years of data. 5
6 Figure 9.6.2. Daily Gross Energy from Inflow Indicator7
8 9
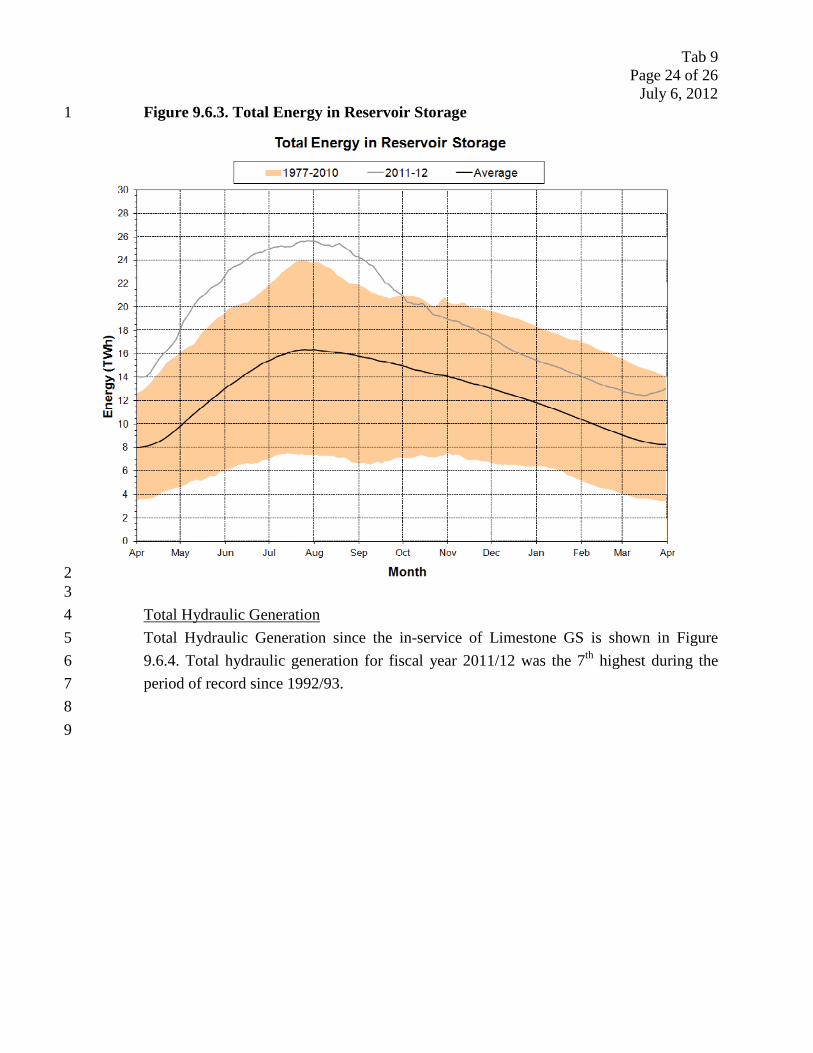
Energy in reservoir storage is shown in Figure 9.6.3. This indicator is for the eighteen 11 major reservoirs in Manitoba Hydro’s watersheds including 14 reservoirs regulated by 12 other agencies. Storage levels were at record levels (approximately 6 TWh above 13 average) on April 1, 2011 and rose rapidly through the spring in response to flood flows 14 on many of the major rivers. On October 31, 2011 storage amounts were 4.5 TWh above 15 the 30-year average, and remained between 3.5 and 4.5 TWh above average through the 16 winter of 2011/12. 17
Energy in Reservoir Storage 10
18
Tab 9 Page 24 of 26
July 6, 2012
Figure 9.6.3. Total Energy in Reservoir Storage1
2 3
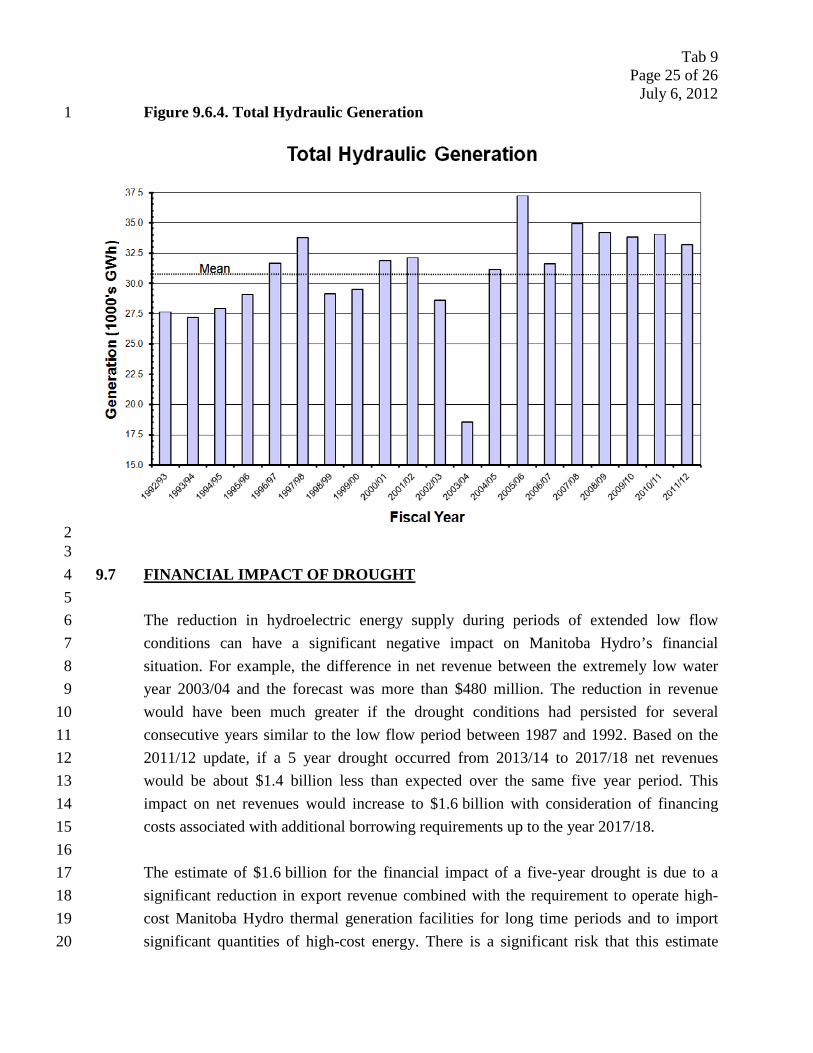
Total Hydraulic Generation since the in-service of Limestone GS is shown in Figure 5 9.6.4. Total hydraulic generation for fiscal year 2011/12 was the 7th highest during the 6 period of record since 1992/93. 7
Total Hydraulic Generation 4
8 9
Tab 9 Page 25 of 26
July 6, 2012
Figure 9.6.4. Total Hydraulic Generation 1
2 3 9.7 5
FINANCIAL IMPACT OF DROUGHT 4
The reduction in hydroelectric energy supply during periods of extended low flow 6 conditions can have a significant negative impact on Manitoba Hydro’s financial 7 situation. For example, the difference in net revenue between the extremely low water 8 year 2003/04 and the forecast was more than $480 million. The reduction in revenue 9 would have been much greater if the drought conditions had persisted for several 10 consecutive years similar to the low flow period between 1987 and 1992. Based on the 11 2011/12 update, if a 5 year drought occurred from 2013/14 to 2017/18 net revenues 12 would be about $1.4 billion less than expected over the same five year period. This 13 impact on net revenues would increase to $1.6 billion with consideration of financing 14 costs associated with additional borrowing requirements up to the year 2017/18. 15 16 The estimate of $1.6 billion for the financial impact of a five-year drought is due to a 17 significant reduction in export revenue combined with the requirement to operate high-18 cost Manitoba Hydro thermal generation facilities for long time periods and to import 19 significant quantities of high-cost energy. There is a significant risk that this estimate 20
Tab 9 Page 26 of 26
July 6, 2012
could be greater if a series of adverse conditions occurred coincident with this time 1 period. It is possible that natural gas prices, and consequently electricity prices in the 2 export market, could be exceptionally high resulting not only in additional cost to operate 3 Manitoba Hydro’s gas-fired generation but also resulting in increased cost of import 4 energy, especially during peak periods. Based on a price scenario 15% higher than 5 expected for export energy, thermal fuel and import energy, the financial impact of a 6 five-year drought would increase by $0.2 billion compared to the expected price scenario. 7 8 Another factor that has similar impacts as electricity prices in the export and import 9 market is the currency exchange rate for the US dollar. A low Canadian dollar relative to 10 the US dollar increases the export revenue that is lost in a drought and increases the cost 11 of import energy and cost of operating thermal generation in Manitoba. This would be 12 offset to some degree by reductions in finance expense denominated in USD. 13 14 A further factor that could increase the cost of drought is the occurrence of a more 15 extreme drought compared to that which occurred during the five year period between 16 1987 and 1992. For example, the seven-year drought representing flows from the period 17 1936/37 to 1942/43 would result in costs $0.7 billion higher than the cost of the five-year 18 drought under expected market prices for electricity. 19


