


Monterey Peninsula UnifiedMonterey County
Unaudited ActualsTABLE OF CONTENTS 27 66092 0000000
Form TC
California Dept of EducationSACS Financial Reporting Software - 2017.2.0File: tc (Rev 03/03/2014) Page 1 of 2 Printed: 9/6/2017 2:40 PM
G = General Ledger Data; S = Supplemental Data
Data Supplied For:Form Description 2016-17
UnauditedActuals
2017-18Budget
01 General Fund/County School Service Fund GS GS09 Charter Schools Special Revenue Fund G G10 Special Education Pass-Through Fund11 Adult Education Fund G G12 Child Development Fund G G13 Cafeteria Special Revenue Fund G G14 Deferred Maintenance Fund G G15 Pupil Transportation Equipment Fund17 Special Reserve Fund for Other Than Capital Outlay Projects18 School Bus Emissions Reduction Fund19 Foundation Special Revenue Fund20 Special Reserve Fund for Postemployment Benefits21 Building Fund G G25 Capital Facilities Fund G G30 State School Building Lease-Purchase Fund35 County School Facilities Fund40 Special Reserve Fund for Capital Outlay Projects G G49 Capital Project Fund for Blended Component Units51 Bond Interest and Redemption Fund G G52 Debt Service Fund for Blended Component Units53 Tax Override Fund56 Debt Service Fund57 Foundation Permanent Fund61 Cafeteria Enterprise Fund62 Charter Schools Enterprise Fund63 Other Enterprise Fund G G66 Warehouse Revolving Fund67 Self-Insurance Fund G G71 Retiree Benefit Fund73 Foundation Private-Purpose Trust Fund G G76 Warrant/Pass-Through Fund95 Student Body Fund76A Changes in Assets and Liabilities (Warrant/Pass-Through)95A Changes in Assets and Liabilities (Student Body)A Average Daily Attendance S SASSET Schedule of Capital Assets SCA Unaudited Actuals Certification SCAT Schedule for CategoricalsCEA Current Expense Formula/Minimum Classroom Comp. - Actuals GSCHG Change Order FormDEBT Schedule of Long-Term Liabilities GSGANN Appropriations Limit Calculations GS GSICR Indirect Cost Rate Worksheet GSL Lottery Report GSNCMOE No Child Left Behind Maintenance of Effort GS
Monterey Peninsula UnifiedMonterey County
Unaudited ActualsTABLE OF CONTENTS 27 66092 0000000
Form TC
California Dept of EducationSACS Financial Reporting Software - 2017.2.0File: tc (Rev 03/03/2014) Page 2 of 2 Printed: 9/6/2017 2:40 PM
G = General Ledger Data; S = Supplemental Data
Data Supplied For:Form Description 2016-17
UnauditedActuals
2017-18Budget
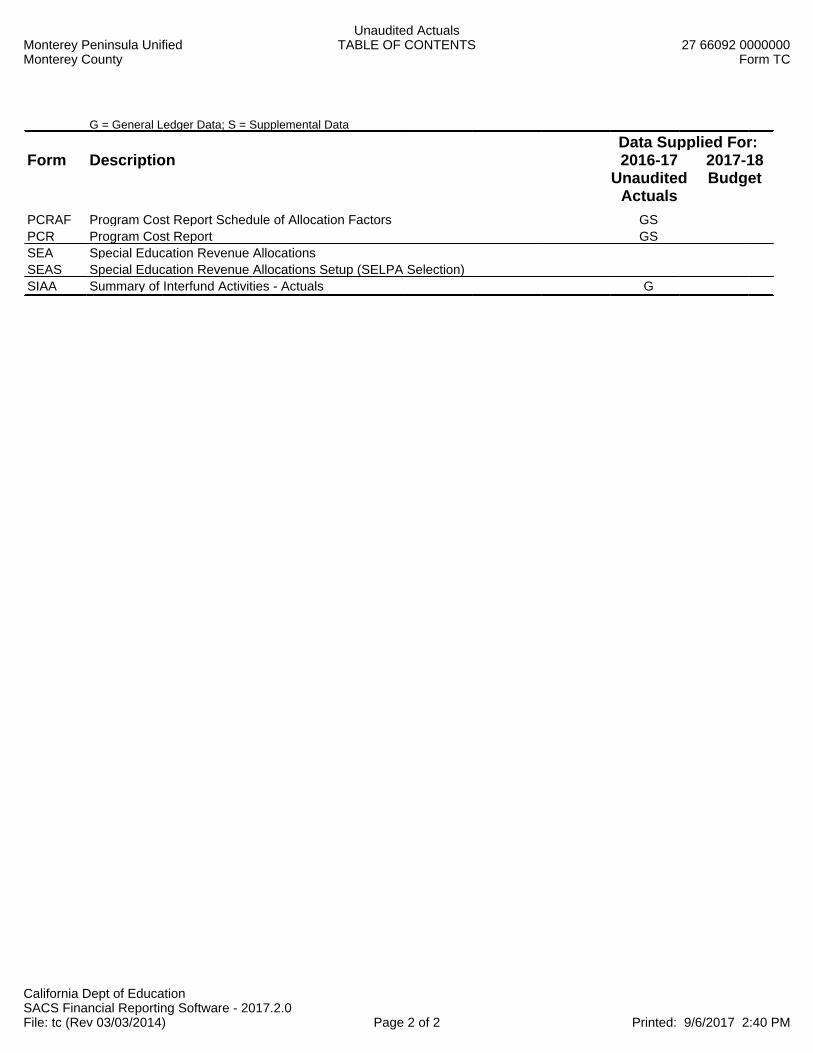
PCRAF Program Cost Report Schedule of Allocation Factors GSPCR Program Cost Report GSSEA Special Education Revenue AllocationsSEAS Special Education Revenue Allocations Setup (SELPA Selection)SIAA Summary of Interfund Activities - Actuals G

Page 1
SACS2017ALL Financial Reporting Software - 2017.2.09/6/2017 2:32:21 PM 27-66092-0000000
Unaudited Actuals2016-17 Unaudited ActualsTechnical Review Checks
Monterey Peninsula Unified Monterey County
Following is a chart of the various types of technical review checks and related requirements:
F - Fatal (Data must be corrected; an explanation is not allowed)W/WC - Warning/Warning with Calculation (If data are not correct,
correct the data; if data are correct an explanation is required)
O - Informational (If data are not correct, correct the data; if data are correct an explanation is optional, but encouraged)
IMPORT CHECKS
GENERAL LEDGER CHECKSOBJ-POSITIVE - (W) - The following objects have a negative balance by resource, by fund: EXCEPTION
FUND RESOURCE OBJECT VALUE01 6300 8660 -4,528.39Explanation:The negative balance in Fund 01, Resource 6300, Object 8660 is dueto negative cash flow.
11 6391 8660 -2,394.27Explanation:The negative balance in Fund 11, Resource 6391, Object 8660 is dueto negative cash flow.
12 5210 8660 -2,171.05Explanation:The negative balance in Fund 12, Resource 5210, Object 8660 is dueto negative cash flow.
12 6105 8660 -717.60Explanation:The negative balance in Fund 12, Resource 6105, Object 8660 is dueto negative cash flow.
EXP-POSITIVE - (W) - The following expenditure functions have a negative balance by resource, by fund. (NOTE: Functions, including CDE-defined optionalfunctions, are checked individually, except functions 7200-7600 are combined.)
EXCEPTION
FUND RESOURCE FUNCTION VALUE01 0000 8700 -105,190.02Explanation:The negative balance in Fund 01, Resource 0000, Function 8700 is rent being charged to the Stone Soup program and DLAMP.
SUPPLEMENTAL CHECKS

Page 2
SACS2017ALL Financial Reporting Software - 2017.2.027-66092-0000000-Monterey Peninsula Unified-Unaudited Actuals 2016-17 Unaudited Actuals9/6/2017 2:32:21 PM
EXPORT CHECKS
Checks Completed.

Page 1
SACS2017ALL Financial Reporting Software - 2017.2.09/6/2017 2:36:38 PM 27-66092-0000000
Unaudited Actuals2017-18 Budget
Technical Review ChecksMonterey Peninsula Unified Monterey County
Following is a chart of the various types of technical review checks and related requirements:
F - Fatal (Data must be corrected; an explanation is not allowed)W/WC - Warning/Warning with Calculation (If data are not correct,
correct the data; if data are correct an explanation is required)
O - Informational (If data are not correct, correct the data; if data are correct an explanation is optional, but encouraged)
IMPORT CHECKS
GENERAL LEDGER CHECKSEXP-POSITIVE - (W) - The following expenditure functions have a negative balance by resource, by fund. (NOTE: Functions, including CDE-defined optionalfunctions, are checked individually, except functions 7200-7600 are combined.)
EXCEPTION
FUND RESOURCE FUNCTION VALUE01 0000 8700 -118,960.00Explanation:The negative balance in Fund 01, Resource 0000, Function 8700 is rent being charged to the Stone Soup program and DLAMP.
SUPPLEMENTAL CHECKS
EXPORT CHECKS
Checks Completed.

Monterey Peninsula UnifiedMonterey County
Unaudited ActualsFINANCIAL REPORTS
2016-17 Unaudited ActualsSummary of Unaudited Actual Data Submission
27 66092 0000000Form CA
California Dept of EducationSACS Financial Reporting Software - 2017.2.0File: ca (Rev 05/30/2017) Page 1 Printed: 9/6/2017 4:28 PM
Following is a summary of the critical data elements contained in your unaudited actual data. Since these data may have fiscal implications for your agency, please verify their accuracy before filing your unaudited actual financial reports.
Form Description Value
CEA Percent of Current Cost of Education Expended for Classroom Compensation 57.36%
Must equal or exceed 60% for elementary, 55% for unified, and 50% for high school
districts or future apportionments may be affected. (EC 41372)
CEA Deficiency Amount $0.00
Applicable to districts not exempt from the requirement and not meeting the minimum classroom
compensation percentage - see Form CEA for further details.
GANN Adjustments to Appropriations Limit Per Government Code Section 7902.1 $0.00
If this amount is not zero, it represents an increase to your Appropriations Limit. The Department of
Finance must be notified of increases within 45 days of budget adoption.
Adjusted Appropriations Limit $65,375,277.18
Appropriations Subject to Limit $65,375,277.18
These amounts represent the board approved Appropriations Limit and Appropriations Subject to
Limit pursuant to Government Code Section 7906 and EC 42132.
ICR Preliminary Proposed Indirect Cost Rate 7.27%
Fixed-with-carry-forward indirect cost rate for use in 2018-19, subject to CDE approval.
NCMOE No Child Left Behind (NCLB) Maintenance of Effort (MOE) Determination MOE Met
If MOE Not Met, the 2018-19 apportionment may be reduced by the lesser of the following two percentages:
MOE Deficiency Percentage - Based on Total Expenditures
MOE Deficiency Percentage - Based on Expenditures Per ADA


Monterey Peninsula UnifiedMonterey County
Unaudited ActualsGeneral Fund
Unrestricted and RestrictedExpenditures by Object
27 66092 0000000Form 01
California Dept of EducationSACS Financial Reporting Software - 2017.2.0File: fund-a (Rev 06/08/2017) Page 1 Printed: 9/6/2017 2:40 PM
2016-17 Unaudited Actuals 2017-18 Budget
Description Resource CodesObjectCodes
Unrestricted(A)
Restricted(B)
Total Fundcol. A + B
(C)Unrestricted
(D)Restricted
(E)
Total Fundcol. D + E
(F)
% DiffColumnC & F
A. REVENUES
1) LCFF Sources 8010-8099 86,915,499.86 0.00 86,915,499.86 89,256,638.00 0.00 89,256,638.00 2.7%
2) Federal Revenue 8100-8299 673,751.65 5,328,048.30 6,001,799.95 700,342.94 5,877,453.56 6,577,796.50 9.6%
3) Other State Revenue 8300-8599 3,751,502.07 6,877,276.99 10,628,779.06 3,137,088.01 6,299,732.57 9,436,820.58 -11.2%
4) Other Local Revenue 8600-8799 2,874,341.46 7,015,419.47 9,889,760.93 2,217,573.02 5,872,858.46 8,090,431.48 -18.2%
5) TOTAL, REVENUES 94,215,095.04 19,220,744.76 113,435,839.80 95,311,641.97 18,050,044.59 113,361,686.56 -0.1%
B. EXPENDITURES
1) Certificated Salaries 1000-1999 38,852,678.50 8,653,657.44 47,506,335.94 37,907,677.95 9,238,712.13 47,146,390.08 -0.8%
2) Classified Salaries 2000-2999 13,475,004.07 9,150,295.05 22,625,299.12 13,427,243.28 9,911,895.95 23,339,139.23 3.2%
3) Employee Benefits 3000-3999 17,084,004.72 9,491,487.13 26,575,491.85 18,003,514.91 11,080,382.47 29,083,897.38 9.4%
4) Books and Supplies 4000-4999 2,760,939.11 2,023,994.72 4,784,933.83 4,335,564.99 1,819,803.32 6,155,368.31 28.6%
5) Services and Other Operating Expenditures 5000-5999 6,840,732.42 3,124,565.81 9,965,298.23 7,120,457.69 2,175,327.36 9,295,785.05 -6.7%
6) Capital Outlay 6000-6999 282,336.55 37,697.35 320,033.90 711,203.18 0.00 711,203.18 122.2%
7) Other Outgo (excluding Transfers of Indirect 7100-7299 Costs) 7400-7499 571,628.58 1,366,730.23 1,938,358.81 758,373.68 1,376,327.85 2,134,701.53 10.1%
8) Other Outgo - Transfers of Indirect Costs 7300-7399 (985,272.12) 399,558.68 (585,713.44) (1,255,482.66) 444,553.31 (810,929.35) 38.5%
9) TOTAL, EXPENDITURES 78,882,051.83 34,247,986.41 113,130,038.24 81,008,553.02 36,047,002.39 117,055,555.41 3.5%
C. EXCESS (DEFICIENCY) OF REVENUES OVER EXPENDITURES BEFORE OTHER FINANCING SOURCES AND USES (A5 - B9) 15,333,043.21 (15,027,241.65) 305,801.56 14,303,088.95 (17,996,957.80) (3,693,868.85) -1307.9%
D. OTHER FINANCING SOURCES/USES 1) Interfund Transfers a) Transfers In 8900-8929 17,418.86 0.00 17,418.86 0.00 0.00 0.00 -100.0%
b) Transfers Out 7600-7629 741,861.00 0.00 741,861.00 738,284.95 0.00 738,284.95 -0.5%
2) Other Sources/Uses a) Sources 8930-8979 0.00 0.00 0.00 0.00 0.00 0.00 0.0%
b) Uses 7630-7699 0.00 0.00 0.00 0.00 0.00 0.00 0.0%
3) Contributions 8980-8999 (14,894,399.61) 14,894,399.61 0.00 (17,855,081.70) 17,855,081.70 0.00 0.0%
4) TOTAL, OTHER FINANCING SOURCES/USES (15,618,841.75) 14,894,399.61 (724,442.14) (18,593,366.65) 17,855,081.70 (738,284.95) 1.9%

Monterey Peninsula UnifiedMonterey County
Unaudited ActualsGeneral Fund
Unrestricted and RestrictedExpenditures by Object
27 66092 0000000Form 01
California Dept of EducationSACS Financial Reporting Software - 2017.2.0File: fund-a (Rev 06/08/2017) Page 2 Printed: 9/6/2017 2:40 PM
2016-17 Unaudited Actuals 2017-18 Budget
Description Resource CodesObjectCodes
Unrestricted(A)
Restricted(B)
Total Fundcol. A + B
(C)Unrestricted
(D)Restricted
(E)
Total Fundcol. D + E
(F)
% DiffColumnC & F
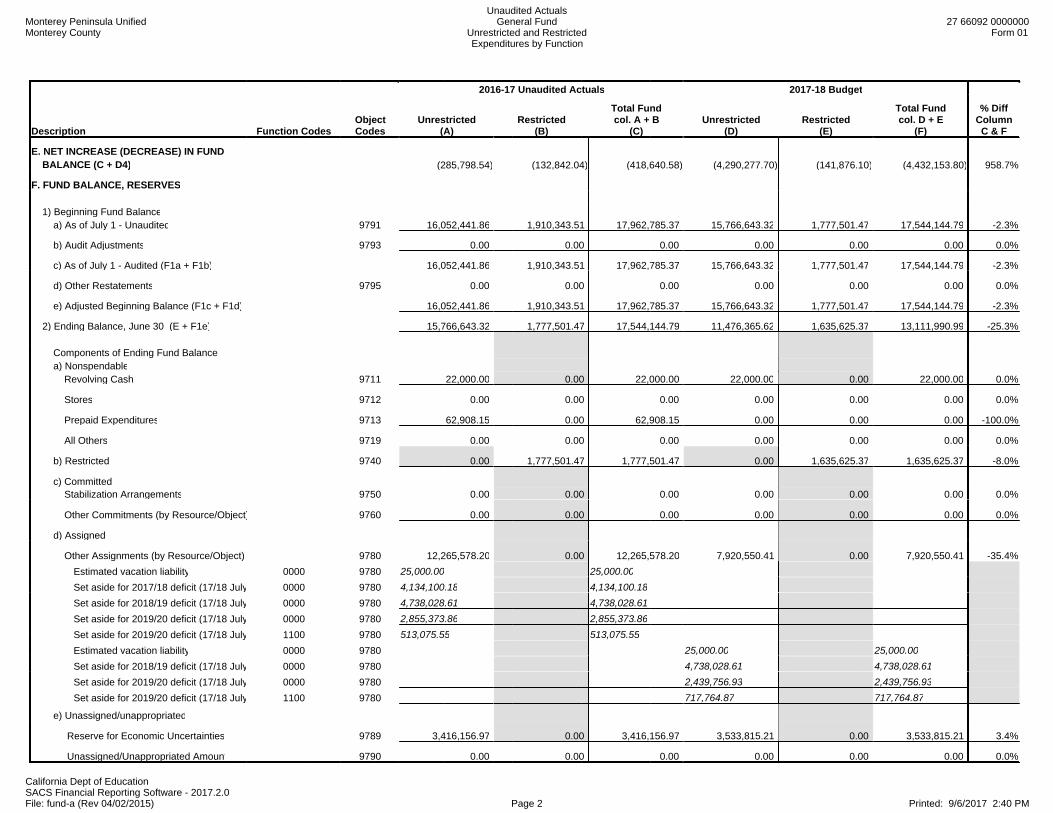
E. NET INCREASE (DECREASE) IN FUND BALANCE (C + D4) (285,798.54) (132,842.04) (418,640.58) (4,290,277.70) (141,876.10) (4,432,153.80) 958.7%
F. FUND BALANCE, RESERVES 1) Beginning Fund Balance a) As of July 1 - Unaudited 9791 16,052,441.86 1,910,343.51 17,962,785.37 15,766,643.32 1,777,501.47 17,544,144.79 -2.3%
b) Audit Adjustments 9793 0.00 0.00 0.00 0.00 0.00 0.00 0.0%
c) As of July 1 - Audited (F1a + F1b) 16,052,441.86 1,910,343.51 17,962,785.37 15,766,643.32 1,777,501.47 17,544,144.79 -2.3%
d) Other Restatements 9795 0.00 0.00 0.00 0.00 0.00 0.00 0.0%
e) Adjusted Beginning Balance (F1c + F1d) 16,052,441.86 1,910,343.51 17,962,785.37 15,766,643.32 1,777,501.47 17,544,144.79 -2.3%
2) Ending Balance, June 30 (E + F1e) 15,766,643.32 1,777,501.47 17,544,144.79 11,476,365.62 1,635,625.37 13,111,990.99 -25.3%
Components of Ending Fund Balance a) Nonspendable Revolving Cash 9711 22,000.00 0.00 22,000.00 22,000.00 0.00 22,000.00 0.0%
Stores 9712 0.00 0.00 0.00 0.00 0.00 0.00 0.0%
Prepaid Expenditures 9713 62,908.15 0.00 62,908.15 0.00 0.00 0.00 -100.0%
All Others 9719 0.00 0.00 0.00 0.00 0.00 0.00 0.0%
b) Restricted 9740 0.00 1,777,501.47 1,777,501.47 0.00 1,635,625.37 1,635,625.37 -8.0%
c) Committed Stabilization Arrangements 9750 0.00 0.00 0.00 0.00 0.00 0.00 0.0%
Other Commitments 9760 0.00 0.00 0.00 0.00 0.00 0.00 0.0%
d) Assigned
Other Assignments 9780 12,265,578.20 0.00 12,265,578.20 7,920,550.41 0.00 7,920,550.41 -35.4%
Estimated vacation liability 0000 9780 25,000.00 25,000.00Set aside for 2017/18 deficit (17/18 July 0000 9780 4,134,100.18 4,134,100.18Set aside for 2018/19 deficit (17/18 July 0000 9780 4,738,028.61 4,738,028.61Set aside for 2019/20 deficit (17/18 July 0000 9780 2,855,373.86 2,855,373.86Set aside for 2019/20 deficit (17/18 July 1100 9780 513,075.55 513,075.55Estimated vacation liability 0000 9780 25,000.00 25,000.00Set aside for 2018/19 deficit (17/18 July 0000 9780 4,738,028.61 4,738,028.61Set aside for 2019/20 deficit (17/18 July 0000 9780 2,439,756.93 2,439,756.93Set aside for 2019/20 deficit (17/18 July 1100 9780 717,764.87 717,764.87
e) Unassigned/unappropriated
Reserve for Economic Uncertainties 9789 3,416,156.97 0.00 3,416,156.97 3,533,815.21 0.00 3,533,815.21 3.4%
Unassigned/Unappropriated Amount 9790 0.00 0.00 0.00 0.00 0.00 0.00 0.0%

Monterey Peninsula UnifiedMonterey County
Unaudited ActualsGeneral Fund
Unrestricted and RestrictedExpenditures by Object
27 66092 0000000Form 01
California Dept of EducationSACS Financial Reporting Software - 2017.2.0File: fund-a (Rev 06/08/2017) Page 3 Printed: 9/6/2017 2:40 PM
2016-17 Unaudited Actuals 2017-18 Budget
Description Resource CodesObjectCodes
Unrestricted(A)
Restricted(B)
Total Fundcol. A + B
(C)Unrestricted
(D)Restricted
(E)
Total Fundcol. D + E
(F)
% DiffColumnC & F
G. ASSETS
1) Cash a) in County Treasury 9110 19,447,743.74 1,956,872.69 21,404,616.43
1) Fair Value Adjustment to Cash in County Treasury 9111 0.00 0.00 0.00
b) in Banks 9120 0.00 0.00 0.00
c) in Revolving Fund 9130 22,000.00 0.00 22,000.00
d) with Fiscal Agent 9135 0.00 0.00 0.00
e) collections awaiting deposit 9140 30,819.26 168,860.77 199,680.03
2) Investments 9150 0.00 0.00 0.00
3) Accounts Receivable 9200 866,810.63 2,069,767.64 2,936,578.27
4) Due from Grantor Government 9290 0.00 0.00 0.00
5) Due from Other Funds 9310 253,186.77 146.20 253,332.97
6) Stores 9320 0.00 0.00 0.00
7) Prepaid Expenditures 9330 62,908.15 0.00 62,908.15
8) Other Current Assets 9340 0.00 0.00 0.00
9) TOTAL, ASSETS 20,683,468.55 4,195,647.30 24,879,115.85
H. DEFERRED OUTFLOWS OF RESOURCES
1) Deferred Outflows of Resources 9490 0.00 0.00 0.00
2) TOTAL, DEFERRED OUTFLOWS 0.00 0.00 0.00
I. LIABILITIES
1) Accounts Payable 9500 4,130,385.66 1,071,837.66 5,202,223.32
2) Due to Grantor Governments 9590 0.00 0.00 0.00
3) Due to Other Funds 9610 786,439.57 0.00 786,439.57
4) Current Loans 9640 0.00 0.00 0.00
5) Unearned Revenue 9650 0.00 1,346,308.17 1,346,308.17
6) TOTAL, LIABILITIES 4,916,825.23 2,418,145.83 7,334,971.06
J. DEFERRED INFLOWS OF RESOURCES
1) Deferred Inflows of Resources 9690 0.00 0.00 0.00
2) TOTAL, DEFERRED INFLOWS 0.00 0.00 0.00
K. FUND EQUITY
Ending Fund Balance, June 30

Monterey Peninsula UnifiedMonterey County
Unaudited ActualsGeneral Fund
Unrestricted and RestrictedExpenditures by Object
27 66092 0000000Form 01
California Dept of EducationSACS Financial Reporting Software - 2017.2.0File: fund-a (Rev 06/08/2017) Page 4 Printed: 9/6/2017 2:40 PM
2016-17 Unaudited Actuals 2017-18 Budget
Description Resource CodesObjectCodes
Unrestricted(A)
Restricted(B)
Total Fundcol. A + B
(C)Unrestricted
(D)Restricted
(E)
Total Fundcol. D + E
(F)
% DiffColumnC & F
(must agree with line F2) (G9 + H2) - (I6 + J2) 15,766,643.32 1,777,501.47 17,544,144.79

Monterey Peninsula UnifiedMonterey County
Unaudited ActualsGeneral Fund
Unrestricted and RestrictedExpenditures by Object
27 66092 0000000Form 01
California Dept of EducationSACS Financial Reporting Software - 2017.2.0File: fund-a (Rev 06/08/2017) Page 5 Printed: 9/6/2017 2:40 PM
2016-17 Unaudited Actuals 2017-18 Budget
Description Resource CodesObjectCodes
Unrestricted(A)
Restricted(B)
Total Fundcol. A + B
(C)Unrestricted
(D)Restricted
(E)
Total Fundcol. D + E
(F)
% DiffColumnC & F
LCFF SOURCES Principal Apportionment State Aid - Current Year 8011 36,958,616.00 0.00 36,958,616.00 42,691,409.00 0.00 42,691,409.00 15.5%
Education Protection Account State Aid - Current Year 8012 8,891,787.00 0.00 8,891,787.00 11,576,171.00 0.00 11,576,171.00 30.2%
State Aid - Prior Years 8019 (153,591.00) 0.00 (153,591.00) 0.00 0.00 0.00 -100.0%
Tax Relief Subventions Homeowners' Exemptions 8021 192,824.20 0.00 192,824.20 192,824.00 0.00 192,824.00 0.0%
Timber Yield Tax 8022 0.00 0.00 0.00 0.00 0.00 0.00 0.0%
Other Subventions/In-Lieu Taxes 8029 0.00 0.00 0.00 0.00 0.00 0.00 0.0%
County & District Taxes Secured Roll Taxes 8041 36,205,247.12 0.00 36,205,247.12 36,205,248.00 0.00 36,205,248.00 0.0%
Unsecured Roll Taxes 8042 1,599,651.87 0.00 1,599,651.87 1,599,652.00 0.00 1,599,652.00 0.0%
Prior Years' Taxes 8043 291,818.80 0.00 291,818.80 332,781.00 0.00 332,781.00 14.0%
Supplemental Taxes 8044 697,411.23 0.00 697,411.23 697,411.00 0.00 697,411.00 0.0%
Education Revenue Augmentation Fund (ERAF) 8045 1,791,788.98 0.00 1,791,788.98 1,791,789.00 0.00 1,791,789.00 0.0%
Community Redevelopment Funds (SB 617/699/1992) 8047 6,731,332.56 0.00 6,731,332.56 791,948.00 0.00 791,948.00 -88.2%
Penalties and Interest from Delinquent Taxes 8048 40,962.10 0.00 40,962.10 0.00 0.00 0.00 -100.0%
Miscellaneous Funds (EC 41604) Royalties and Bonuses 8081 0.00 0.00 0.00 0.00 0.00 0.00 0.0%
Other In-Lieu Taxes 8082 0.00 0.00 0.00 0.00 0.00 0.00 0.0%
Less: Non-LCFF (50%) Adjustment 8089 0.00 0.00 0.00 0.00 0.00 0.00 0.0%
Subtotal, LCFF Sources 93,247,848.86 0.00 93,247,848.86 95,879,233.00 0.00 95,879,233.00 2.8% LCFF Transfers
Unrestricted LCFF Transfers - Current Year 0000 8091 0.00 0.00 0.00 0.00 0.0%
All Other LCFF Transfers - Current Year All Other 8091 0.00 0.00 0.00 0.00 0.00 0.00 0.0%
Transfers to Charter Schools in Lieu of Property Taxes 8096 (6,332,349.00) 0.00 (6,332,349.00) (6,622,595.00) 0.00 (6,622,595.00) 4.6%
Property Taxes Transfers 8097 0.00 0.00 0.00 0.00 0.00 0.00 0.0%
Monterey Peninsula UnifiedMonterey County
Unaudited ActualsGeneral Fund
Unrestricted and RestrictedExpenditures by Object
27 66092 0000000Form 01
California Dept of EducationSACS Financial Reporting Software - 2017.2.0File: fund-a (Rev 06/08/2017) Page 6 Printed: 9/6/2017 2:40 PM
2016-17 Unaudited Actuals 2017-18 Budget
Description Resource CodesObjectCodes
Unrestricted(A)
Restricted(B)
Total Fundcol. A + B
(C)Unrestricted
(D)Restricted
(E)
Total Fundcol. D + E
(F)
% DiffColumnC & F
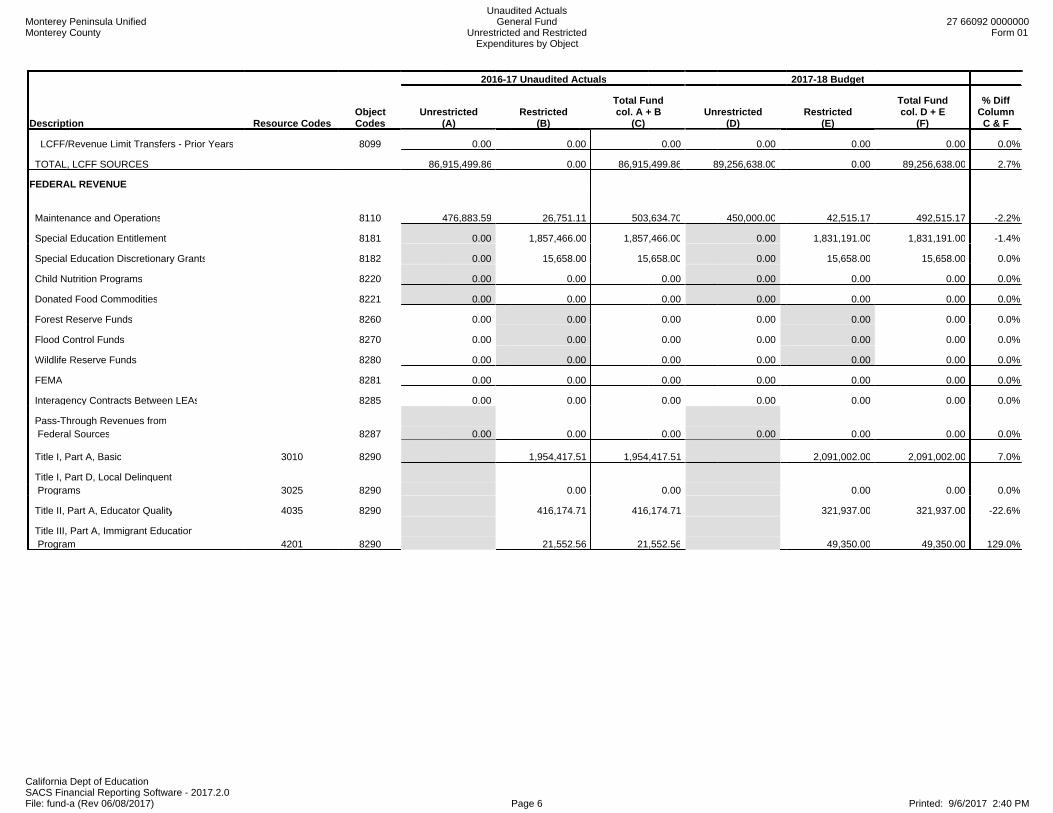
LCFF/Revenue Limit Transfers - Prior Years 8099 0.00 0.00 0.00 0.00 0.00 0.00 0.0%
TOTAL, LCFF SOURCES 86,915,499.86 0.00 86,915,499.86 89,256,638.00 0.00 89,256,638.00 2.7%
FEDERAL REVENUE
Maintenance and Operations 8110 476,883.59 26,751.11 503,634.70 450,000.00 42,515.17 492,515.17 -2.2%
Special Education Entitlement 8181 0.00 1,857,466.00 1,857,466.00 0.00 1,831,191.00 1,831,191.00 -1.4%
Special Education Discretionary Grants 8182 0.00 15,658.00 15,658.00 0.00 15,658.00 15,658.00 0.0%
Child Nutrition Programs 8220 0.00 0.00 0.00 0.00 0.00 0.00 0.0%
Donated Food Commodities 8221 0.00 0.00 0.00 0.00 0.00 0.00 0.0%
Forest Reserve Funds 8260 0.00 0.00 0.00 0.00 0.00 0.00 0.0%
Flood Control Funds 8270 0.00 0.00 0.00 0.00 0.00 0.00 0.0%
Wildlife Reserve Funds 8280 0.00 0.00 0.00 0.00 0.00 0.00 0.0%
FEMA 8281 0.00 0.00 0.00 0.00 0.00 0.00 0.0%
Interagency Contracts Between LEAs 8285 0.00 0.00 0.00 0.00 0.00 0.00 0.0%
Pass-Through Revenues from Federal Sources 8287 0.00 0.00 0.00 0.00 0.00 0.00 0.0%
Title I, Part A, Basic 3010 8290 1,954,417.51 1,954,417.51 2,091,002.00 2,091,002.00 7.0%
Title I, Part D, Local Delinquent Programs 3025 8290 0.00 0.00 0.00 0.00 0.0%
Title II, Part A, Educator Quality 4035 8290 416,174.71 416,174.71 321,937.00 321,937.00 -22.6%
Title III, Part A, Immigrant Education Program 4201 8290 21,552.56 21,552.56 49,350.00 49,350.00 129.0%
Monterey Peninsula UnifiedMonterey County
Unaudited ActualsGeneral Fund
Unrestricted and RestrictedExpenditures by Object
27 66092 0000000Form 01
California Dept of EducationSACS Financial Reporting Software - 2017.2.0File: fund-a (Rev 06/08/2017) Page 7 Printed: 9/6/2017 2:40 PM
2016-17 Unaudited Actuals 2017-18 Budget
Description Resource CodesObjectCodes
Unrestricted(A)
Restricted(B)
Total Fundcol. A + B
(C)Unrestricted
(D)Restricted
(E)
Total Fundcol. D + E
(F)
% DiffColumnC & F
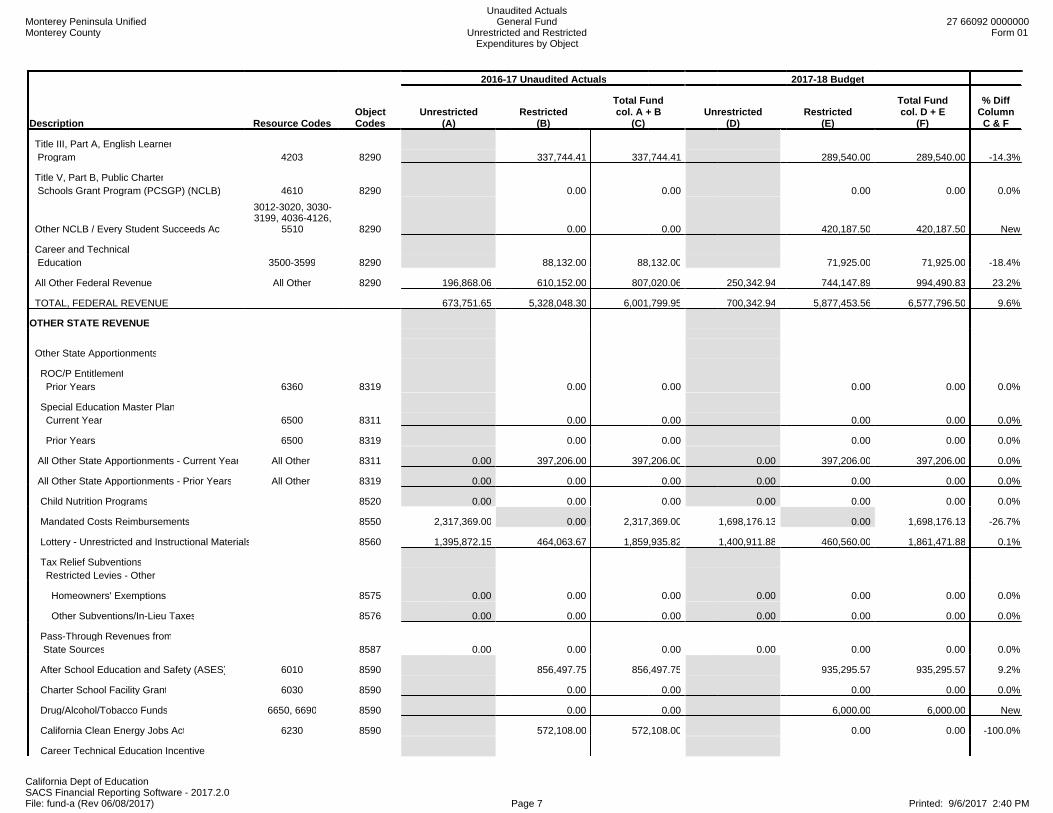
Title III, Part A, English Learner Program 4203 8290 337,744.41 337,744.41 289,540.00 289,540.00 -14.3%
Title V, Part B, Public Charter Schools Grant Program (PCSGP) (NCLB) 4610 8290 0.00 0.00 0.00 0.00 0.0%
Other NCLB / Every Student Succeeds Act
3012-3020, 3030-3199, 4036-4126,
5510 8290 0.00 0.00 420,187.50 420,187.50 New
Career and Technical Education 3500-3599 8290 88,132.00 88,132.00 71,925.00 71,925.00 -18.4%
All Other Federal Revenue All Other 8290 196,868.06 610,152.00 807,020.06 250,342.94 744,147.89 994,490.83 23.2%
TOTAL, FEDERAL REVENUE 673,751.65 5,328,048.30 6,001,799.95 700,342.94 5,877,453.56 6,577,796.50 9.6%
OTHER STATE REVENUE
Other State Apportionments
ROC/P Entitlement Prior Years 6360 8319 0.00 0.00 0.00 0.00 0.0%
Special Education Master Plan Current Year 6500 8311 0.00 0.00 0.00 0.00 0.0%
Prior Years 6500 8319 0.00 0.00 0.00 0.00 0.0%
All Other State Apportionments - Current Year All Other 8311 0.00 397,206.00 397,206.00 0.00 397,206.00 397,206.00 0.0%
All Other State Apportionments - Prior Years All Other 8319 0.00 0.00 0.00 0.00 0.00 0.00 0.0%
Child Nutrition Programs 8520 0.00 0.00 0.00 0.00 0.00 0.00 0.0%
Mandated Costs Reimbursements 8550 2,317,369.00 0.00 2,317,369.00 1,698,176.13 0.00 1,698,176.13 -26.7%
Lottery - Unrestricted and Instructional Materials 8560 1,395,872.15 464,063.67 1,859,935.82 1,400,911.88 460,560.00 1,861,471.88 0.1%
Tax Relief Subventions Restricted Levies - Other
Homeowners' Exemptions 8575 0.00 0.00 0.00 0.00 0.00 0.00 0.0%
Other Subventions/In-Lieu Taxes 8576 0.00 0.00 0.00 0.00 0.00 0.00 0.0%
Pass-Through Revenues from State Sources 8587 0.00 0.00 0.00 0.00 0.00 0.00 0.0%
After School Education and Safety (ASES) 6010 8590 856,497.75 856,497.75 935,295.57 935,295.57 9.2%
Charter School Facility Grant 6030 8590 0.00 0.00 0.00 0.00 0.0%
Drug/Alcohol/Tobacco Funds 6650, 6690 8590 0.00 0.00 6,000.00 6,000.00 New
California Clean Energy Jobs Act 6230 8590 572,108.00 572,108.00 0.00 0.00 -100.0%
Career Technical Education Incentive
Monterey Peninsula UnifiedMonterey County
Unaudited ActualsGeneral Fund
Unrestricted and RestrictedExpenditures by Object
27 66092 0000000Form 01
California Dept of EducationSACS Financial Reporting Software - 2017.2.0File: fund-a (Rev 06/08/2017) Page 8 Printed: 9/6/2017 2:40 PM
2016-17 Unaudited Actuals 2017-18 Budget
Description Resource CodesObjectCodes
Unrestricted(A)
Restricted(B)
Total Fundcol. A + B
(C)Unrestricted
(D)Restricted
(E)
Total Fundcol. D + E
(F)
% DiffColumnC & F
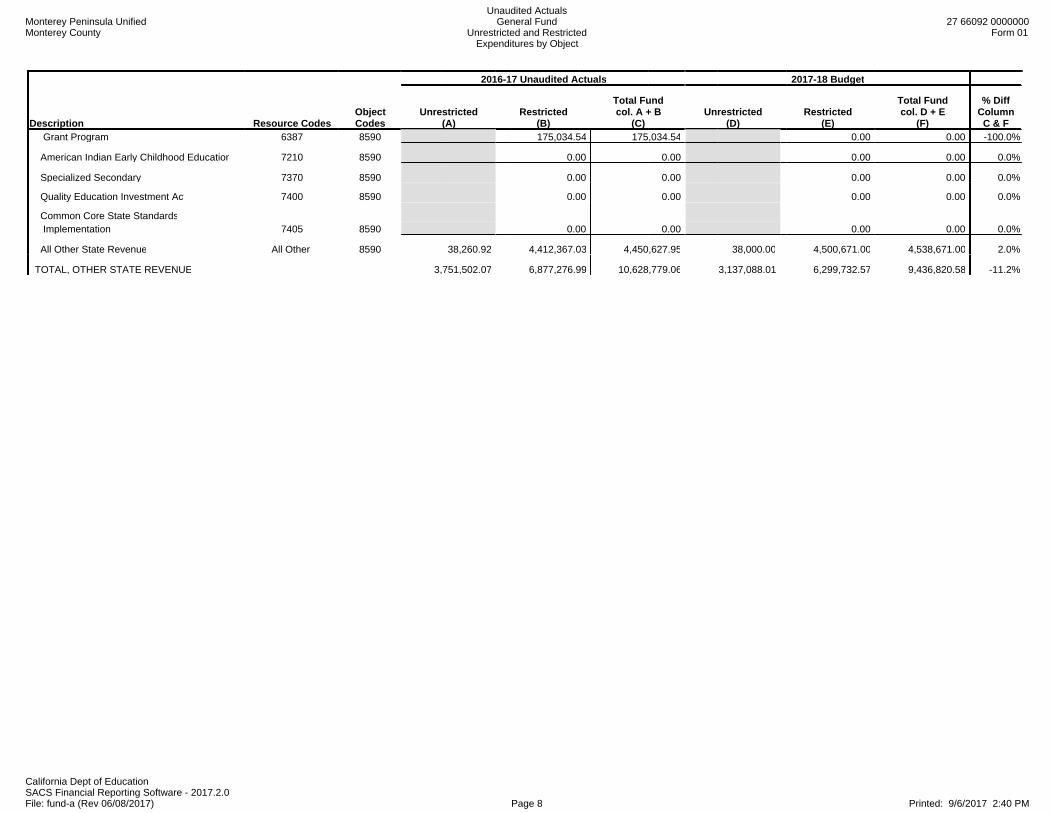
Grant Program 6387 8590 175,034.54 175,034.54 0.00 0.00 -100.0%
American Indian Early Childhood Education 7210 8590 0.00 0.00 0.00 0.00 0.0%
Specialized Secondary 7370 8590 0.00 0.00 0.00 0.00 0.0%
Quality Education Investment Act 7400 8590 0.00 0.00 0.00 0.00 0.0%
Common Core State Standards Implementation 7405 8590 0.00 0.00 0.00 0.00 0.0%
All Other State Revenue All Other 8590 38,260.92 4,412,367.03 4,450,627.95 38,000.00 4,500,671.00 4,538,671.00 2.0%
TOTAL, OTHER STATE REVENUE 3,751,502.07 6,877,276.99 10,628,779.06 3,137,088.01 6,299,732.57 9,436,820.58 -11.2%

Monterey Peninsula UnifiedMonterey County
Unaudited ActualsGeneral Fund
Unrestricted and RestrictedExpenditures by Object
27 66092 0000000Form 01
California Dept of EducationSACS Financial Reporting Software - 2017.2.0File: fund-a (Rev 06/08/2017) Page 9 Printed: 9/6/2017 2:40 PM
2016-17 Unaudited Actuals 2017-18 Budget
Description Resource CodesObjectCodes
Unrestricted(A)
Restricted(B)
Total Fundcol. A + B
(C)Unrestricted
(D)Restricted
(E)
Total Fundcol. D + E
(F)
% DiffColumnC & F
OTHER LOCAL REVENUE
Other Local Revenue County and District Taxes
Other Restricted Levies Secured Roll 8615 0.00 0.00 0.00 0.00 0.00 0.00 0.0%
Unsecured Roll 8616 0.00 0.00 0.00 0.00 0.00 0.00 0.0%
Prior Years' Taxes 8617 0.00 0.00 0.00 0.00 0.00 0.00 0.0%
Supplemental Taxes 8618 0.00 0.00 0.00 0.00 0.00 0.00 0.0%
Non-Ad Valorem Taxes Parcel Taxes 8621 0.00 0.00 0.00 0.00 0.00 0.00 0.0%
Other 8622 0.00 0.00 0.00 0.00 0.00 0.00 0.0%
Community Redevelopment Funds Not Subject to LCFF Deduction 8625 1,267,946.88 0.00 1,267,946.88 650,000.00 0.00 650,000.00 -48.7%
Penalties and Interest from Delinquent Non-LCFF Taxes 8629 0.00 0.00 0.00 0.00 0.00 0.00 0.0%
Sales Sale of Equipment/Supplies 8631 0.00 0.00 0.00 0.00 0.00 0.00 0.0%
Sale of Publications 8632 0.00 0.00 0.00 0.00 0.00 0.00 0.0%
Food Service Sales 8634 0.00 0.00 0.00 0.00 0.00 0.00 0.0%
All Other Sales 8639 0.00 0.00 0.00 0.00 0.00 0.00 0.0%
Leases and Rentals 8650 500,819.87 0.00 500,819.87 440,613.68 0.00 440,613.68 -12.0%
Interest 8660 279,374.23 (4,528.39) 274,845.84 125,700.00 0.00 125,700.00 -54.3%
Net Increase (Decrease) in the Fair Value of Investments 8662 0.00 0.00 0.00 0.00 0.00 0.00 0.0%
Fees and Contracts Adult Education Fees 8671 0.00 0.00 0.00 0.00 0.00 0.00 0.0%
Non-Resident Students 8672 0.00 0.00 0.00 0.00 0.00 0.00 0.0%
Transportation Fees From Individuals 8675 67,587.00 0.00 67,587.00 55,000.00 0.00 55,000.00 -18.6%
Interagency Services 8677 39,225.65 1,147,447.47 1,186,673.12 35,000.00 1,133,495.69 1,168,495.69 -1.5%
Mitigation/Developer Fees 8681 0.00 0.00 0.00 0.00 0.00 0.00 0.0%
All Other Fees and Contracts 8689 0.00 0.00 0.00 0.00 0.00 0.00 0.0%
Other Local Revenue Plus: Misc Funds Non-LCFF

Monterey Peninsula UnifiedMonterey County
Unaudited ActualsGeneral Fund
Unrestricted and RestrictedExpenditures by Object
27 66092 0000000Form 01
California Dept of EducationSACS Financial Reporting Software - 2017.2.0File: fund-a (Rev 06/08/2017) Page 10 Printed: 9/6/2017 2:40 PM
2016-17 Unaudited Actuals 2017-18 Budget
Description Resource CodesObjectCodes
Unrestricted(A)
Restricted(B)
Total Fundcol. A + B
(C)Unrestricted
(D)Restricted
(E)
Total Fundcol. D + E
(F)
% DiffColumnC & F
(50%) Adjustment 8691 0.00 0.00 0.00 0.00 0.00 0.00 0.0%
Pass-Through Revenues From Local Sources 8697 0.00 0.00 0.00 0.00 0.00 0.00 0.0%
All Other Local Revenue 8699 719,387.83 1,686,853.26 2,406,241.09 911,259.34 681,617.77 1,592,877.11 -33.8%
Tuition 8710 0.00 0.00 0.00 0.00 0.00 0.00 0.0%
All Other Transfers In 8781-8783 0.00 0.00 0.00 0.00 0.00 0.00 0.0%
Transfers of Apportionments Special Education SELPA Transfers From Districts or Charter Schools 6500 8791 0.00 0.00 0.00 0.00 0.0%
From County Offices 6500 8792 4,185,647.13 4,185,647.13 4,057,745.00 4,057,745.00 -3.1%
From JPAs 6500 8793 0.00 0.00 0.00 0.00 0.0%
ROC/P Transfers From Districts or Charter Schools 6360 8791 0.00 0.00 0.00 0.00 0.0%
From County Offices 6360 8792 0.00 0.00 0.00 0.00 0.0%
From JPAs 6360 8793 0.00 0.00 0.00 0.00 0.0%
Other Transfers of Apportionments From Districts or Charter Schools All Other 8791 0.00 0.00 0.00 0.00 0.00 0.00 0.0%
From County Offices All Other 8792 0.00 0.00 0.00 0.00 0.00 0.00 0.0%
From JPAs All Other 8793 0.00 0.00 0.00 0.00 0.00 0.00 0.0%
All Other Transfers In from All Others 8799 0.00 0.00 0.00 0.00 0.00 0.00 0.0%
TOTAL, OTHER LOCAL REVENUE 2,874,341.46 7,015,419.47 9,889,760.93 2,217,573.02 5,872,858.46 8,090,431.48 -18.2%
TOTAL, REVENUES 94,215,095.04 19,220,744.76 113,435,839.80 95,311,641.97 18,050,044.59 113,361,686.56 -0.1%

Monterey Peninsula UnifiedMonterey County
Unaudited ActualsGeneral Fund
Unrestricted and RestrictedExpenditures by Object
27 66092 0000000Form 01
California Dept of EducationSACS Financial Reporting Software - 2017.2.0File: fund-a (Rev 06/08/2017) Page 11 Printed: 9/6/2017 2:40 PM
2016-17 Unaudited Actuals 2017-18 Budget
Description Resource CodesObjectCodes
Unrestricted(A)
Restricted(B)
Total Fundcol. A + B
(C)Unrestricted
(D)Restricted
(E)
Total Fundcol. D + E
(F)
% DiffColumnC & F
CERTIFICATED SALARIES
Certificated Teachers' Salaries 1100 30,683,401.35 7,561,941.55 38,245,342.90 29,655,863.07 8,309,154.13 37,965,017.20 -0.7%
Certificated Pupil Support Salaries 1200 1,765,784.61 381,770.50 2,147,555.11 1,848,384.57 329,527.35 2,177,911.92 1.4%
Certificated Supervisors' and Administrators' Salaries 1300 4,773,011.10 476,169.09 5,249,180.19 4,427,208.44 405,249.10 4,832,457.54 -7.9%
Other Certificated Salaries 1900 1,630,481.44 233,776.30 1,864,257.74 1,976,221.87 194,781.55 2,171,003.42 16.5%
TOTAL, CERTIFICATED SALARIES 38,852,678.50 8,653,657.44 47,506,335.94 37,907,677.95 9,238,712.13 47,146,390.08 -0.8%
CLASSIFIED SALARIES
Classified Instructional Salaries 2100 311,851.71 4,907,808.15 5,219,659.86 299,929.25 5,442,697.81 5,742,627.06 10.0%
Classified Support Salaries 2200 5,273,717.99 1,730,160.49 7,003,878.48 5,247,895.81 1,575,073.55 6,822,969.36 -2.6%
Classified Supervisors' and Administrators' Salaries 2300 1,697,634.33 571,373.46 2,269,007.79 1,863,044.84 628,814.45 2,491,859.29 9.8%
Clerical, Technical and Office Salaries 2400 4,229,620.71 503,543.04 4,733,163.75 4,226,982.35 510,993.44 4,737,975.79 0.1%
Other Classified Salaries 2900 1,962,179.33 1,437,409.91 3,399,589.24 1,789,391.03 1,754,316.70 3,543,707.73 4.2%
TOTAL, CLASSIFIED SALARIES 13,475,004.07 9,150,295.05 22,625,299.12 13,427,243.28 9,911,895.95 23,339,139.23 3.2%
EMPLOYEE BENEFITS
STRS 3101-3102 4,781,530.47 4,483,257.51 9,264,787.98 5,387,136.03 5,236,843.07 10,623,979.10 14.7%
PERS 3201-3202 1,736,489.89 1,150,104.16 2,886,594.05 2,034,532.23 1,475,355.60 3,509,887.83 21.6%
OASDI/Medicare/Alternative 3301-3302 1,551,006.93 800,718.12 2,351,725.05 1,549,415.88 865,158.37 2,414,574.25 2.7%
Health and Welfare Benefits 3401-3402 5,883,456.59 2,040,130.30 7,923,586.89 5,954,803.13 2,432,645.88 8,387,449.01 5.9%
Unemployment Insurance 3501-3502 26,161.90 8,872.04 35,033.94 25,659.09 9,518.33 35,177.42 0.4%
Workers' Compensation 3601-3602 2,375,600.07 807,403.73 3,183,003.80 2,328,745.29 867,971.10 3,196,716.39 0.4%
OPEB, Allocated 3701-3702 285,820.33 66,619.08 352,439.41 263,468.21 58,367.60 321,835.81 -8.7%
OPEB, Active Employees 3751-3752 333,416.20 134,382.19 467,798.39 314,255.05 134,522.52 448,777.57 -4.1%
Other Employee Benefits 3901-3902 110,522.34 0.00 110,522.34 145,500.00 0.00 145,500.00 31.6%
TOTAL, EMPLOYEE BENEFITS 17,084,004.72 9,491,487.13 26,575,491.85 18,003,514.91 11,080,382.47 29,083,897.38 9.4%
BOOKS AND SUPPLIES
Approved Textbooks and Core Curricula Materials 4100 126,907.76 418,299.02 545,206.78 1,693,220.25 588,365.37 2,281,585.62 318.5%
Books and Other Reference Materials 4200 191,075.65 41,862.87 232,938.52 262,130.68 25,595.02 287,725.70 23.5%
Materials and Supplies 4300 2,281,812.85 1,294,373.30 3,576,186.15 2,279,852.28 1,081,001.68 3,360,853.96 -6.0%

Monterey Peninsula UnifiedMonterey County
Unaudited ActualsGeneral Fund
Unrestricted and RestrictedExpenditures by Object
27 66092 0000000Form 01
California Dept of EducationSACS Financial Reporting Software - 2017.2.0File: fund-a (Rev 06/08/2017) Page 12 Printed: 9/6/2017 2:40 PM
2016-17 Unaudited Actuals 2017-18 Budget
Description Resource CodesObjectCodes
Unrestricted(A)
Restricted(B)
Total Fundcol. A + B
(C)Unrestricted
(D)Restricted
(E)
Total Fundcol. D + E
(F)
% DiffColumnC & F
Noncapitalized Equipment 4400 161,142.85 269,459.53 430,602.38 100,361.78 124,841.25 225,203.03 -47.7%
Food 4700 0.00 0.00 0.00 0.00 0.00 0.00 0.0%
TOTAL, BOOKS AND SUPPLIES 2,760,939.11 2,023,994.72 4,784,933.83 4,335,564.99 1,819,803.32 6,155,368.31 28.6%
SERVICES AND OTHER OPERATING EXPENDITURES
Subagreements for Services 5100 0.00 0.00 0.00 0.00 0.00 0.00 0.0%
Travel and Conferences 5200 260,785.08 746,251.12 1,007,036.20 174,492.92 317,101.56 491,594.48 -51.2%
Dues and Memberships 5300 53,868.95 741.25 54,610.20 60,922.75 585.00 61,507.75 12.6%
Insurance 5400 - 5450 59,007.00 27,404.00 86,411.00 46,170.00 27,766.15 73,936.15 -14.4%
Operations and Housekeeping Services 5500 1,599,929.60 34,897.47 1,634,827.07 1,885,077.00 35,000.00 1,920,077.00 17.4%
Rentals, Leases, Repairs, and Noncapitalized Improvements 5600 287,075.96 77,914.28 364,990.24 509,399.86 47,623.93 557,023.79 52.6%
Transfers of Direct Costs 5710 (115,615.20) 115,615.20 0.00 (55,243.36) 55,243.36 0.00 0.0%
Transfers of Direct Costs - Interfund 5750 (204,665.82) (218,506.50) (423,172.32) (250,266.25) (231,470.00) (481,736.25) 13.8%
Professional/Consulting Services and Operating Expenditures 5800 4,172,744.13 2,332,916.11 6,505,660.24 3,555,908.93 1,913,275.35 5,469,184.28 -15.9%
Communications 5900 727,602.72 7,332.88 734,935.60 1,193,995.84 10,202.01 1,204,197.85 63.9%
TOTAL, SERVICES AND OTHER OPERATING EXPENDITURES 6,840,732.42 3,124,565.81 9,965,298.23 7,120,457.69 2,175,327.36 9,295,785.05 -6.7%

Monterey Peninsula UnifiedMonterey County
Unaudited ActualsGeneral Fund
Unrestricted and RestrictedExpenditures by Object
27 66092 0000000Form 01
California Dept of EducationSACS Financial Reporting Software - 2017.2.0File: fund-a (Rev 06/08/2017) Page 13 Printed: 9/6/2017 2:40 PM
2016-17 Unaudited Actuals 2017-18 Budget
Description Resource CodesObjectCodes
Unrestricted(A)
Restricted(B)
Total Fundcol. A + B
(C)Unrestricted
(D)Restricted
(E)
Total Fundcol. D + E
(F)
% DiffColumnC & F
CAPITAL OUTLAY
Land 6100 0.00 0.00 0.00 0.00 0.00 0.00 0.0%
Land Improvements 6170 676.55 30,691.04 31,367.59 0.00 0.00 0.00 -100.0%
Buildings and Improvements of Buildings 6200 0.00 0.00 0.00 0.00 0.00 0.00 0.0%
Books and Media for New School Libraries or Major Expansion of School Libraries 6300 0.00 0.00 0.00 0.00 0.00 0.00 0.0%
Equipment 6400 281,660.00 7,006.31 288,666.31 711,203.18 0.00 711,203.18 146.4%
Equipment Replacement 6500 0.00 0.00 0.00 0.00 0.00 0.00 0.0%
TOTAL, CAPITAL OUTLAY 282,336.55 37,697.35 320,033.90 711,203.18 0.00 711,203.18 122.2%
OTHER OUTGO (excluding Transfers of Indirect Costs)
Tuition Tuition for Instruction Under Interdistrict Attendance Agreements 7110 0.00 0.00 0.00 0.00 0.00 0.00 0.0%
State Special Schools 7130 0.00 0.00 0.00 0.00 0.00 0.00 0.0%
Tuition, Excess Costs, and/or Deficit Payments Payments to Districts or Charter Schools 7141 0.00 0.00 0.00 0.00 0.00 0.00 0.0%
Payments to County Offices 7142 302,819.54 1,366,730.23 1,669,549.77 342,583.64 1,376,327.85 1,718,911.49 3.0%
Payments to JPAs 7143 0.00 0.00 0.00 0.00 0.00 0.00 0.0%
Transfers of Pass-Through Revenues To Districts or Charter Schools 7211 0.00 0.00 0.00 0.00 0.00 0.00 0.0%
To County Offices 7212 0.00 0.00 0.00 0.00 0.00 0.00 0.0%
To JPAs 7213 0.00 0.00 0.00 0.00 0.00 0.00 0.0%
Special Education SELPA Transfers of Apportionments To Districts or Charter Schools 6500 7221 0.00 0.00 0.00 0.00 0.0%
To County Offices 6500 7222 0.00 0.00 0.00 0.00 0.0%
To JPAs 6500 7223 0.00 0.00 0.00 0.00 0.0%
ROC/P Transfers of Apportionments To Districts or Charter Schools 6360 7221 0.00 0.00 0.00 0.00 0.0%
To County Offices 6360 7222 0.00 0.00 0.00 0.00 0.0%
To JPAs 6360 7223 0.00 0.00 0.00 0.00 0.0%
Other Transfers of Apportionments All Other 7221-7223 0.00 0.00 0.00 0.00 0.00 0.00 0.0%
All Other Transfers 7281-7283 0.00 0.00 0.00 0.00 0.00 0.00 0.0%
Monterey Peninsula UnifiedMonterey County
Unaudited ActualsGeneral Fund
Unrestricted and RestrictedExpenditures by Object
27 66092 0000000Form 01
California Dept of EducationSACS Financial Reporting Software - 2017.2.0File: fund-a (Rev 06/08/2017) Page 14 Printed: 9/6/2017 2:40 PM
2016-17 Unaudited Actuals 2017-18 Budget
Description Resource CodesObjectCodes
Unrestricted(A)
Restricted(B)
Total Fundcol. A + B
(C)Unrestricted
(D)Restricted
(E)
Total Fundcol. D + E
(F)
% DiffColumnC & F
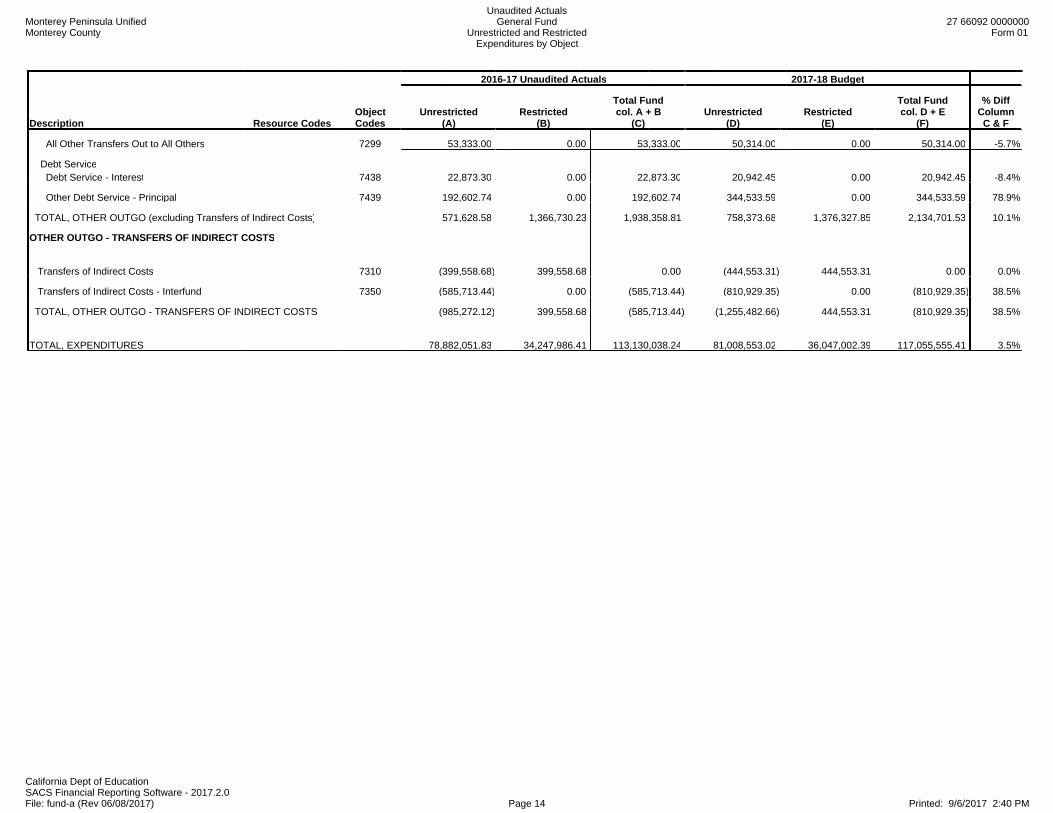
All Other Transfers Out to All Others 7299 53,333.00 0.00 53,333.00 50,314.00 0.00 50,314.00 -5.7%
Debt Service Debt Service - Interest 7438 22,873.30 0.00 22,873.30 20,942.45 0.00 20,942.45 -8.4%
Other Debt Service - Principal 7439 192,602.74 0.00 192,602.74 344,533.59 0.00 344,533.59 78.9%
TOTAL, OTHER OUTGO (excluding Transfers of Indirect Costs) 571,628.58 1,366,730.23 1,938,358.81 758,373.68 1,376,327.85 2,134,701.53 10.1%
OTHER OUTGO - TRANSFERS OF INDIRECT COSTS
Transfers of Indirect Costs 7310 (399,558.68) 399,558.68 0.00 (444,553.31) 444,553.31 0.00 0.0%
Transfers of Indirect Costs - Interfund 7350 (585,713.44) 0.00 (585,713.44) (810,929.35) 0.00 (810,929.35) 38.5%
TOTAL, OTHER OUTGO - TRANSFERS OF INDIRECT COSTS (985,272.12) 399,558.68 (585,713.44) (1,255,482.66) 444,553.31 (810,929.35) 38.5%
TOTAL, EXPENDITURES 78,882,051.83 34,247,986.41 113,130,038.24 81,008,553.02 36,047,002.39 117,055,555.41 3.5%

Monterey Peninsula UnifiedMonterey County
Unaudited ActualsGeneral Fund
Unrestricted and RestrictedExpenditures by Object
27 66092 0000000Form 01
California Dept of EducationSACS Financial Reporting Software - 2017.2.0File: fund-a (Rev 06/08/2017) Page 15 Printed: 9/6/2017 2:40 PM
2016-17 Unaudited Actuals 2017-18 Budget
Description Resource CodesObjectCodes
Unrestricted(A)
Restricted(B)
Total Fundcol. A + B
(C)Unrestricted
(D)Restricted
(E)
Total Fundcol. D + E
(F)
% DiffColumnC & F
INTERFUND TRANSFERS
INTERFUND TRANSFERS IN
From: Special Reserve Fund 8912 0.00 0.00 0.00 0.00 0.00 0.00 0.0%
From: Bond Interest and Redemption Fund 8914 0.00 0.00 0.00 0.00 0.00 0.00 0.0%
Other Authorized Interfund Transfers In 8919 17,418.86 0.00 17,418.86 0.00 0.00 0.00 -100.0%
(a) TOTAL, INTERFUND TRANSFERS IN 17,418.86 0.00 17,418.86 0.00 0.00 0.00 -100.0%
INTERFUND TRANSFERS OUT
To: Child Development Fund 7611 2,171.05 0.00 2,171.05 0.00 0.00 0.00 -100.0%
To: Special Reserve Fund 7612 0.00 0.00 0.00 0.00 0.00 0.00 0.0%
To: State School Building Fund/ County School Facilities Fund 7613 0.00 0.00 0.00 0.00 0.00 0.00 0.0%
To: Cafeteria Fund 7616 300.44 0.00 300.44 0.00 0.00 0.00 -100.0%
Other Authorized Interfund Transfers Out 7619 739,389.51 0.00 739,389.51 738,284.95 0.00 738,284.95 -0.1%
(b) TOTAL, INTERFUND TRANSFERS OUT 741,861.00 0.00 741,861.00 738,284.95 0.00 738,284.95 -0.5%
OTHER SOURCES/USES
SOURCES
State Apportionments Emergency Apportionments 8931 0.00 0.00 0.00 0.00 0.00 0.00 0.0%
Proceeds
Proceeds from Sale/Lease- Purchase of Land/Buildings 8953 0.00 0.00 0.00 0.00 0.00 0.00 0.0%
Other Sources
Transfers from Funds of Lapsed/Reorganized LEAs 8965 0.00 0.00 0.00 0.00 0.00 0.00 0.0%
Long-Term Debt Proceeds Proceeds from Certificates of Participation 8971 0.00 0.00 0.00 0.00 0.00 0.00 0.0%
Proceeds from Capital Leases 8972 0.00 0.00 0.00 0.00 0.00 0.00 0.0%
Proceeds from Lease Revenue Bonds 8973 0.00 0.00 0.00 0.00 0.00 0.00 0.0%
All Other Financing Sources 8979 0.00 0.00 0.00 0.00 0.00 0.00 0.0%

Monterey Peninsula UnifiedMonterey County
Unaudited ActualsGeneral Fund
Unrestricted and RestrictedExpenditures by Object
27 66092 0000000Form 01
California Dept of EducationSACS Financial Reporting Software - 2017.2.0File: fund-a (Rev 06/08/2017) Page 16 Printed: 9/6/2017 2:40 PM
2016-17 Unaudited Actuals 2017-18 Budget
Description Resource CodesObjectCodes
Unrestricted(A)
Restricted(B)
Total Fundcol. A + B
(C)Unrestricted
(D)Restricted
(E)
Total Fundcol. D + E
(F)
% DiffColumnC & F
(c) TOTAL, SOURCES 0.00 0.00 0.00 0.00 0.00 0.00 0.0%
USES
Transfers of Funds from Lapsed/Reorganized LEAs 7651 0.00 0.00 0.00 0.00 0.00 0.00 0.0%
All Other Financing Uses 7699 0.00 0.00 0.00 0.00 0.00 0.00 0.0%
(d) TOTAL, USES 0.00 0.00 0.00 0.00 0.00 0.00 0.0%
CONTRIBUTIONS
Contributions from Unrestricted Revenues 8980 (14,894,399.61) 14,894,399.61 0.00 (17,855,081.70) 17,855,081.70 0.00 0.0%
Contributions from Restricted Revenues 8990 0.00 0.00 0.00 0.00 0.00 0.00 0.0%
(e) TOTAL, CONTRIBUTIONS (14,894,399.61) 14,894,399.61 0.00 (17,855,081.70) 17,855,081.70 0.00 0.0%
TOTAL, OTHER FINANCING SOURCES/USES (a - b + c - d + e) (15,618,841.75) 14,894,399.61 (724,442.14) (18,593,366.65) 17,855,081.70 (738,284.95) 1.9%

Monterey Peninsula UnifiedMonterey County
Unaudited ActualsGeneral Fund
Unrestricted and RestrictedExpenditures by Function
27 66092 0000000Form 01
California Dept of EducationSACS Financial Reporting Software - 2017.2.0File: fund-a (Rev 04/02/2015) Page 1 Printed: 9/6/2017 2:40 PM
2016-17 Unaudited Actuals 2017-18 Budget
Description Function CodesObjectCodes
Unrestricted(A)
Restricted(B)
Total Fundcol. A + B
(C)Unrestricted
(D)Restricted
(E)
Total Fundcol. D + E
(F)
% DiffColumnC & F
A. REVENUES
1) LCFF Sources 8010-8099 86,915,499.86 0.00 86,915,499.86 89,256,638.00 0.00 89,256,638.00 2.7%
2) Federal Revenue 8100-8299 673,751.65 5,328,048.30 6,001,799.95 700,342.94 5,877,453.56 6,577,796.50 9.6%
3) Other State Revenue 8300-8599 3,751,502.07 6,877,276.99 10,628,779.06 3,137,088.01 6,299,732.57 9,436,820.58 -11.2%
4) Other Local Revenue 8600-8799 2,874,341.46 7,015,419.47 9,889,760.93 2,217,573.02 5,872,858.46 8,090,431.48 -18.2%
5) TOTAL, REVENUES 94,215,095.04 19,220,744.76 113,435,839.80 95,311,641.97 18,050,044.59 113,361,686.56 -0.1%
B. EXPENDITURES (Objects 1000-7999)
1) Instruction 1000-1999 42,771,175.68 22,337,383.70 65,108,559.38 43,874,307.54 25,203,158.63 69,077,466.17 6.1%
2) Instruction - Related Services 2000-2999 12,442,882.39 3,975,944.82 16,418,827.21 12,312,213.73 3,465,360.97 15,777,574.70 -3.9%
3) Pupil Services 3000-3999 8,089,642.16 1,957,919.46 10,047,561.62 8,472,947.65 1,811,566.69 10,284,514.34 2.4%
4) Ancillary Services 4000-4999 644,305.95 110,472.56 754,778.51 762,477.12 39,720.00 802,197.12 6.3%
5) Community Services 5000-5999 0.00 252,049.93 252,049.93 0.00 293,049.81 293,049.81 16.3%
6) Enterprise 6000-6999 187,192.44 0.00 187,192.44 232,500.00 0.00 232,500.00 24.2%
7) General Administration 7000-7999 6,482,191.76 592,449.49 7,074,641.25 6,211,339.33 644,812.77 6,856,152.10 -3.1%
8) Plant Services 8000-8999 7,693,032.87 3,655,036.22 11,348,069.09 8,384,393.97 3,213,005.67 11,597,399.64 2.2%
9) Other Outgo 9000-9999Except
7600-7699 571,628.58 1,366,730.23 1,938,358.81 758,373.68 1,376,327.85 2,134,701.53 10.1%
10) TOTAL, EXPENDITURES 78,882,051.83 34,247,986.41 113,130,038.24 81,008,553.02 36,047,002.39 117,055,555.41 3.5%
C. EXCESS (DEFICIENCY) OF REVENUES OVER EXPENDITURES BEFORE OTHER FINANCING SOURCES AND USES (A5 - B10) 15,333,043.21 (15,027,241.65) 305,801.56 14,303,088.95 (17,996,957.80) (3,693,868.85) -1307.9%
D. OTHER FINANCING SOURCES/USES 1) Interfund Transfers a) Transfers In 8900-8929 17,418.86 0.00 17,418.86 0.00 0.00 0.00 -100.0%
b) Transfers Out 7600-7629 741,861.00 0.00 741,861.00 738,284.95 0.00 738,284.95 -0.5%
2) Other Sources/Uses a) Sources 8930-8979 0.00 0.00 0.00 0.00 0.00 0.00 0.0%
b) Uses 7630-7699 0.00 0.00 0.00 0.00 0.00 0.00 0.0%
3) Contributions 8980-8999 (14,894,399.61) 14,894,399.61 0.00 (17,855,081.70) 17,855,081.70 0.00 0.0%
4) TOTAL, OTHER FINANCING SOURCES/USES (15,618,841.75) 14,894,399.61 (724,442.14) (18,593,366.65) 17,855,081.70 (738,284.95) 1.9%
Monterey Peninsula UnifiedMonterey County
Unaudited ActualsGeneral Fund
Unrestricted and RestrictedExpenditures by Function
27 66092 0000000Form 01
California Dept of EducationSACS Financial Reporting Software - 2017.2.0File: fund-a (Rev 04/02/2015) Page 2 Printed: 9/6/2017 2:40 PM
2016-17 Unaudited Actuals 2017-18 Budget
Description Function CodesObjectCodes
Unrestricted(A)
Restricted(B)
Total Fundcol. A + B
(C)Unrestricted
(D)Restricted
(E)
Total Fundcol. D + E
(F)
% DiffColumnC & F
E. NET INCREASE (DECREASE) IN FUND BALANCE (C + D4) (285,798.54) (132,842.04) (418,640.58) (4,290,277.70) (141,876.10) (4,432,153.80) 958.7%
F. FUND BALANCE, RESERVES 1) Beginning Fund Balance a) As of July 1 - Unaudited 9791 16,052,441.86 1,910,343.51 17,962,785.37 15,766,643.32 1,777,501.47 17,544,144.79 -2.3%
b) Audit Adjustments 9793 0.00 0.00 0.00 0.00 0.00 0.00 0.0%
c) As of July 1 - Audited (F1a + F1b) 16,052,441.86 1,910,343.51 17,962,785.37 15,766,643.32 1,777,501.47 17,544,144.79 -2.3%
d) Other Restatements 9795 0.00 0.00 0.00 0.00 0.00 0.00 0.0%
e) Adjusted Beginning Balance (F1c + F1d) 16,052,441.86 1,910,343.51 17,962,785.37 15,766,643.32 1,777,501.47 17,544,144.79 -2.3%
2) Ending Balance, June 30 (E + F1e) 15,766,643.32 1,777,501.47 17,544,144.79 11,476,365.62 1,635,625.37 13,111,990.99 -25.3%
Components of Ending Fund Balance a) Nonspendable Revolving Cash 9711 22,000.00 0.00 22,000.00 22,000.00 0.00 22,000.00 0.0%
Stores 9712 0.00 0.00 0.00 0.00 0.00 0.00 0.0%
Prepaid Expenditures 9713 62,908.15 0.00 62,908.15 0.00 0.00 0.00 -100.0%
All Others 9719 0.00 0.00 0.00 0.00 0.00 0.00 0.0%
b) Restricted 9740 0.00 1,777,501.47 1,777,501.47 0.00 1,635,625.37 1,635,625.37 -8.0%
c) Committed Stabilization Arrangements 9750 0.00 0.00 0.00 0.00 0.00 0.00 0.0%
Other Commitments (by Resource/Object) 9760 0.00 0.00 0.00 0.00 0.00 0.00 0.0%
d) Assigned
Other Assignments (by Resource/Object) 9780 12,265,578.20 0.00 12,265,578.20 7,920,550.41 0.00 7,920,550.41 -35.4%
Estimated vacation liability 0000 9780 25,000.00 25,000.00Set aside for 2017/18 deficit (17/18 July 0000 9780 4,134,100.18 4,134,100.18Set aside for 2018/19 deficit (17/18 July 0000 9780 4,738,028.61 4,738,028.61Set aside for 2019/20 deficit (17/18 July 0000 9780 2,855,373.86 2,855,373.86Set aside for 2019/20 deficit (17/18 July 1100 9780 513,075.55 513,075.55Estimated vacation liability 0000 9780 25,000.00 25,000.00Set aside for 2018/19 deficit (17/18 July 0000 9780 4,738,028.61 4,738,028.61Set aside for 2019/20 deficit (17/18 July 0000 9780 2,439,756.93 2,439,756.93Set aside for 2019/20 deficit (17/18 July 1100 9780 717,764.87 717,764.87
e) Unassigned/unappropriated
Reserve for Economic Uncertainties 9789 3,416,156.97 0.00 3,416,156.97 3,533,815.21 0.00 3,533,815.21 3.4%
Unassigned/Unappropriated Amount 9790 0.00 0.00 0.00 0.00 0.00 0.00 0.0%

Monterey Peninsula UnifiedMonterey County
Unaudited ActualsGeneral Fund
Exhibit: Restricted Balance Detail27 66092 0000000
Form 01
California Dept of EducationSACS Financial Reporting Software - 2017.2.0File: fund-a (Rev 04/06/2011) Page 1 Printed: 9/6/2017 2:40 PM
2016-17 2017-18Resource Description Unaudited Actuals Budget
5640 Medi-Cal Billing Option 247,956.72 247,956.72
6230 California Clean Energy Jobs Act 376,004.40 327,219.85
6264 Educator Effectiveness (15-16) 38,850.40 38,850.40
6300 Lottery: Instructional Materials 7,083.12 7,083.12
6512 Special Ed: Mental Health Services 191,969.07 191,969.07
7338 College Readiness Block Grant 202,634.39 109,542.84
9010 Other Restricted Local 713,003.37 713,003.37
Total, Restricted Balance 1,777,501.47 1,635,625.37
Monterey Peninsula UnifiedMonterey County
Unaudited ActualsCharter Schools Special Revenue Fund
Expenditures by Object27 66092 0000000
Form 09
California Dept of EducationSACS Financial Reporting Software - 2017.2.0File: fund-b (Rev 06/08/2017 Page 1 Printed: 9/6/2017 2:41 PM
Description Resource Codes Object Codes2016-17
Unaudited Actuals2017-18Budget
PercentDifference
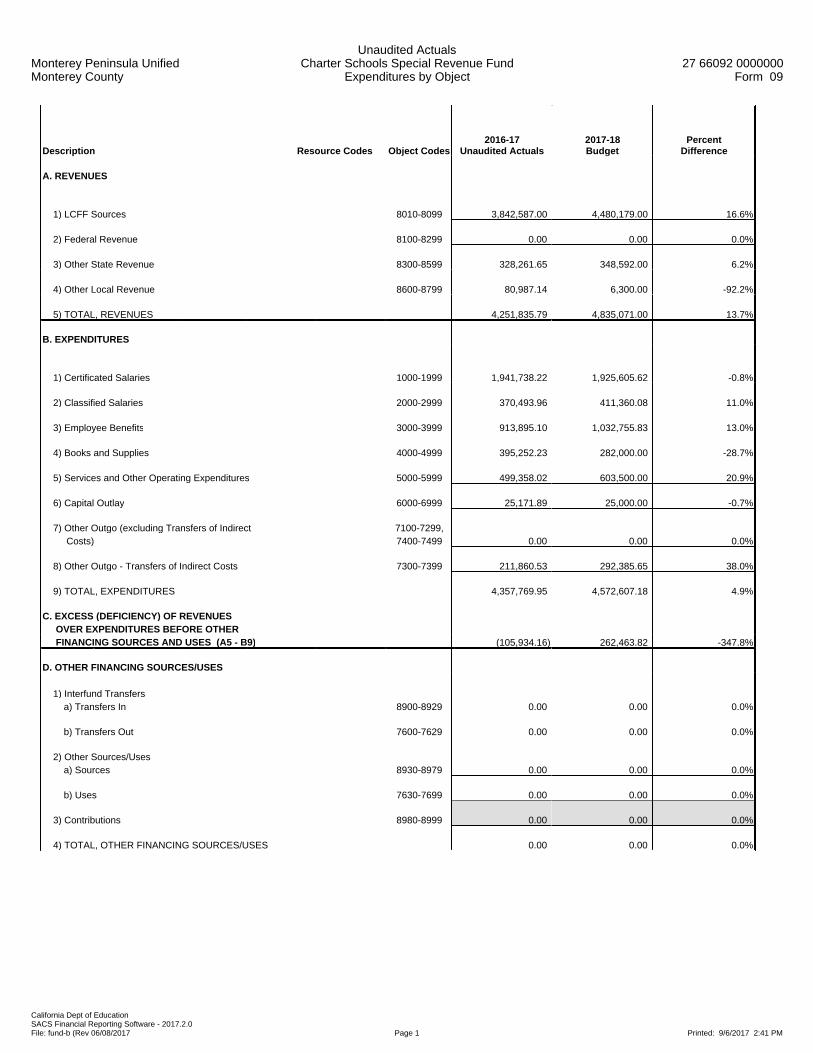
A. REVENUES
1) LCFF Sources 8010-8099 3,842,587.00 4,480,179.00 16.6%
2) Federal Revenue 8100-8299 0.00 0.00 0.0%
3) Other State Revenue 8300-8599 328,261.65 348,592.00 6.2%
4) Other Local Revenue 8600-8799 80,987.14 6,300.00 -92.2%
5) TOTAL, REVENUES 4,251,835.79 4,835,071.00 13.7%
B. EXPENDITURES
1) Certificated Salaries 1000-1999 1,941,738.22 1,925,605.62 -0.8%
2) Classified Salaries 2000-2999 370,493.96 411,360.08 11.0%
3) Employee Benefits 3000-3999 913,895.10 1,032,755.83 13.0%
4) Books and Supplies 4000-4999 395,252.23 282,000.00 -28.7%
5) Services and Other Operating Expenditures 5000-5999 499,358.02 603,500.00 20.9%
6) Capital Outlay 6000-6999 25,171.89 25,000.00 -0.7%
7) Other Outgo (excluding Transfers of Indirect 7100-7299, Costs) 7400-7499 0.00 0.00 0.0%
8) Other Outgo - Transfers of Indirect Costs 7300-7399 211,860.53 292,385.65 38.0%
9) TOTAL, EXPENDITURES 4,357,769.95 4,572,607.18 4.9%
C. EXCESS (DEFICIENCY) OF REVENUES OVER EXPENDITURES BEFORE OTHER FINANCING SOURCES AND USES (A5 - B9) (105,934.16) 262,463.82 -347.8%
D. OTHER FINANCING SOURCES/USES 1) Interfund Transfers a) Transfers In 8900-8929 0.00 0.00 0.0%
b) Transfers Out 7600-7629 0.00 0.00 0.0%
2) Other Sources/Uses a) Sources 8930-8979 0.00 0.00 0.0%
b) Uses 7630-7699 0.00 0.00 0.0%
3) Contributions 8980-8999 0.00 0.00 0.0%
4) TOTAL, OTHER FINANCING SOURCES/USES 0.00 0.00 0.0%

Monterey Peninsula UnifiedMonterey County
Unaudited ActualsCharter Schools Special Revenue Fund
Expenditures by Object27 66092 0000000
Form 09
California Dept of EducationSACS Financial Reporting Software - 2017.2.0File: fund-b (Rev 06/08/2017 Page 2 Printed: 9/6/2017 2:41 PM
Description Resource Codes Object Codes2016-17
Unaudited Actuals2017-18Budget
PercentDifference
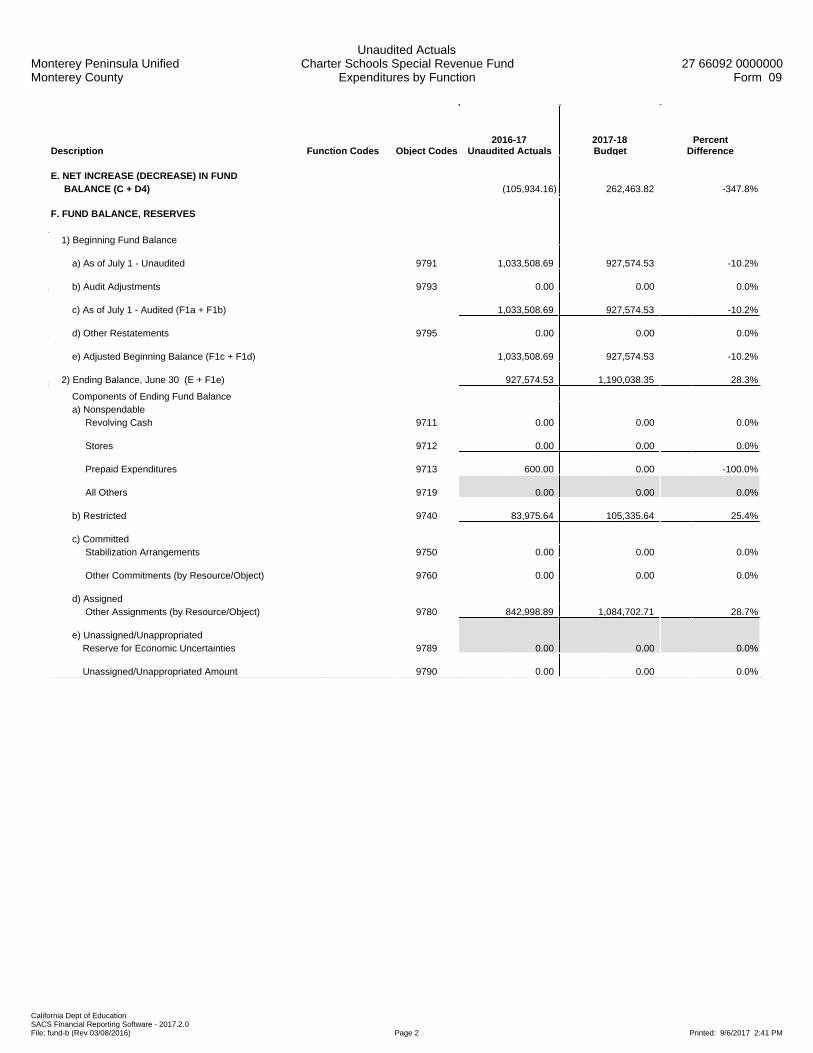
E. NET INCREASE (DECREASE) IN FUND BALANCE (C + D4) (105,934.16) 262,463.82 -347.8%
F. FUND BALANCE, RESERVES 1) Beginning Fund Balance a) As of July 1 - Unaudited 9791 1,033,508.69 927,574.53 -10.2%
b) Audit Adjustments 9793 0.00 0.00 0.0%
c) As of July 1 - Audited (F1a + F1b) 1,033,508.69 927,574.53 -10.2%
d) Other Restatements 9795 0.00 0.00 0.0%
e) Adjusted Beginning Balance (F1c + F1d) 1,033,508.69 927,574.53 -10.2%
2) Ending Balance, June 30 (E + F1e) 927,574.53 1,190,038.35 28.3% Components of Ending Fund Balance a) Nonspendable Revolving Cash 9711 0.00 0.00 0.0%
Stores 9712 0.00 0.00 0.0%
Prepaid Expenditures 9713 600.00 0.00 -100.0%
All Others 9719 0.00 0.00 0.0%
b) Restricted 9740 83,975.64 105,335.64 25.4%
c) Committed Stabilization Arrangements 9750 0.00 0.00 0.0%
Other Commitments 9760 0.00 0.00 0.0%
d) Assigned Other Assignments 9780 842,998.89 1,084,702.71 28.7%
e) Unassigned/Unappropriated Reserve for Economic Uncertainties 9789 0.00 0.00 0.0%
Unassigned/Unappropriated Amount 9790 0.00 0.00 0.0%

Monterey Peninsula UnifiedMonterey County
Unaudited ActualsCharter Schools Special Revenue Fund
Expenditures by Object27 66092 0000000
Form 09
California Dept of EducationSACS Financial Reporting Software - 2017.2.0File: fund-b (Rev 06/08/2017 Page 3 Printed: 9/6/2017 2:41 PM
Description Resource Codes Object Codes2016-17
Unaudited Actuals2017-18Budget
PercentDifference
G. ASSETS 1) Cash a) in County Treasury 9110 1,075,253.91
1) Fair Value Adjustment to Cash in County Treasury 9111 0.00
b) in Banks 9120 0.00
c) in Revolving Fund 9130 0.00
d) with Fiscal Agent 9135 0.00
e) collections awaiting deposit 9140 0.00
2) Investments 9150 0.00
3) Accounts Receivable 9200 42,806.08
4) Due from Grantor Government 9290 0.00
5) Due from Other Funds 9310 44,879.00
6) Stores 9320 0.00
7) Prepaid Expenditures 9330 600.00
8) Other Current Assets 9340 0.00
9) TOTAL, ASSETS 1,163,538.99
H. DEFERRED OUTFLOWS OF RESOURCES
1) Deferred Outflows of Resources 9490 0.00
2) TOTAL, DEFERRED OUTFLOWS 0.00
I. LIABILITIES
1) Accounts Payable 9500 176,187.94
2) Due to Grantor Governments 9590 0.00
3) Due to Other Funds 9610 59,776.52
4) Current Loans 9640 0.00
5) Unearned Revenue 9650 0.00
6) TOTAL, LIABILITIES 235,964.46
J. DEFERRED INFLOWS OF RESOURCES
1) Deferred Inflows of Resources 9690 0.00
2) TOTAL, DEFERRED INFLOWS 0.00
K. FUND EQUITY
Ending Fund Balance, June 30 (must agree with line F2) (G9 + H2) - (I6 + J2) 927,574.53
Monterey Peninsula UnifiedMonterey County
Unaudited ActualsCharter Schools Special Revenue Fund
Expenditures by Object27 66092 0000000
Form 09
California Dept of EducationSACS Financial Reporting Software - 2017.2.0File: fund-b (Rev 06/08/2017 Page 4 Printed: 9/6/2017 2:41 PM
Description Resource Codes Object Codes2016-17
Unaudited Actuals2017-18Budget
PercentDifference
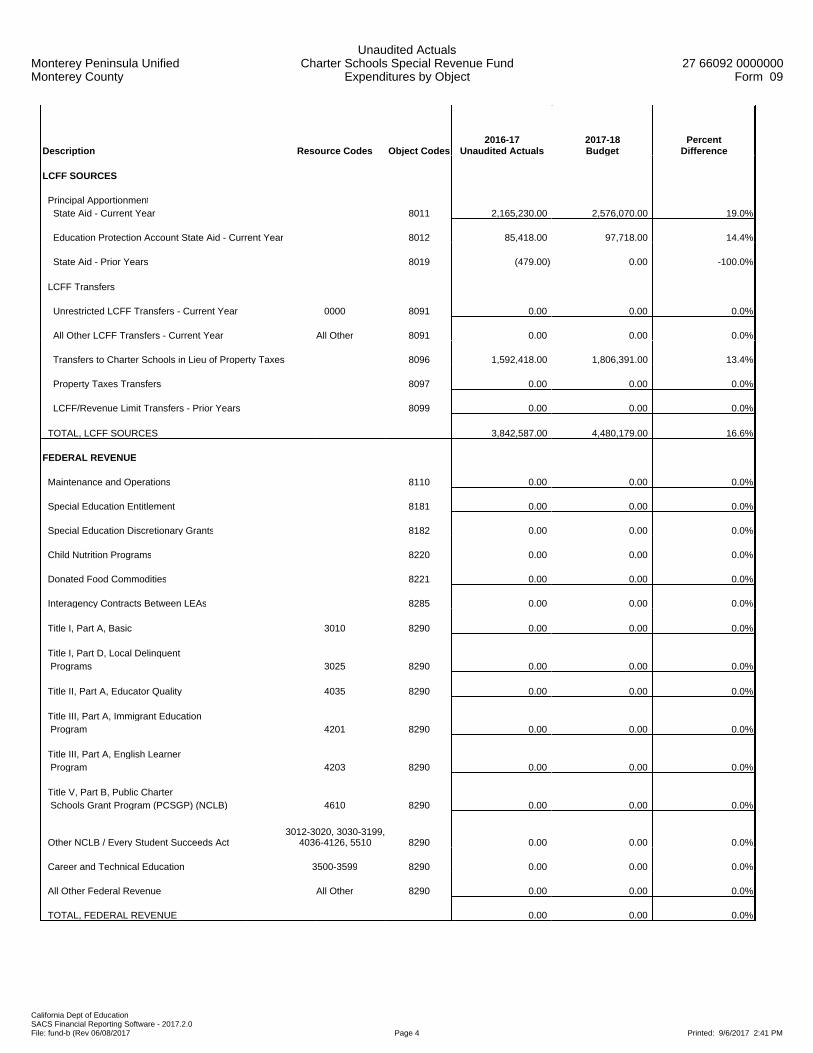
LCFF SOURCES
Principal Apportionment State Aid - Current Year 8011 2,165,230.00 2,576,070.00 19.0%
Education Protection Account State Aid - Current Year 8012 85,418.00 97,718.00 14.4%
State Aid - Prior Years 8019 (479.00) 0.00 -100.0%
LCFF Transfers
Unrestricted LCFF Transfers - Current Year 0000 8091 0.00 0.00 0.0%
All Other LCFF Transfers - Current Year All Other 8091 0.00 0.00 0.0%
Transfers to Charter Schools in Lieu of Property Taxes 8096 1,592,418.00 1,806,391.00 13.4%
Property Taxes Transfers 8097 0.00 0.00 0.0%
LCFF/Revenue Limit Transfers - Prior Years 8099 0.00 0.00 0.0%
TOTAL, LCFF SOURCES 3,842,587.00 4,480,179.00 16.6%
FEDERAL REVENUE
Maintenance and Operations 8110 0.00 0.00 0.0%
Special Education Entitlement 8181 0.00 0.00 0.0%
Special Education Discretionary Grants 8182 0.00 0.00 0.0%
Child Nutrition Programs 8220 0.00 0.00 0.0%
Donated Food Commodities 8221 0.00 0.00 0.0%
Interagency Contracts Between LEAs 8285 0.00 0.00 0.0%
Title I, Part A, Basic 3010 8290 0.00 0.00 0.0%
Title I, Part D, Local Delinquent Programs 3025 8290 0.00 0.00 0.0%
Title II, Part A, Educator Quality 4035 8290 0.00 0.00 0.0%
Title III, Part A, Immigrant Education Program 4201 8290 0.00 0.00 0.0%
Title III, Part A, English Learner Program 4203 8290 0.00 0.00 0.0%
Title V, Part B, Public Charter Schools Grant Program (PCSGP) (NCLB) 4610 8290 0.00 0.00 0.0%
Other NCLB / Every Student Succeeds Act3012-3020, 3030-3199,
4036-4126, 5510 8290 0.00 0.00 0.0%
Career and Technical Education 3500-3599 8290 0.00 0.00 0.0%
All Other Federal Revenue All Other 8290 0.00 0.00 0.0%
TOTAL, FEDERAL REVENUE 0.00 0.00 0.0%

Monterey Peninsula UnifiedMonterey County
Unaudited ActualsCharter Schools Special Revenue Fund
Expenditures by Object27 66092 0000000
Form 09
California Dept of EducationSACS Financial Reporting Software - 2017.2.0File: fund-b (Rev 06/08/2017 Page 5 Printed: 9/6/2017 2:41 PM
Description Resource Codes Object Codes2016-17
Unaudited Actuals2017-18Budget
PercentDifference
OTHER STATE REVENUE
Other State Apportionments
Special Education Master Plan Current Year 6500 8311 0.00 0.00 0.0%
Prior Years 6500 8319 0.00 0.00 0.0%
All Other State Apportionments - Current Year All Other 8311 0.00 0.00 0.0%
All Other State Apportionments - Prior Years All Other 8319 0.00 0.00 0.0%
Child Nutrition Programs 8520 0.00 0.00 0.0%
Mandated Costs Reimbursements 8550 91,311.00 90,639.00 -0.7%
Lottery - Unrestricted and Instructional Materials 8560 90,604.65 86,330.00 -4.7%
After School Education and Safety (ASES) 6010 8590 0.00 0.00 0.0%
Charter School Facility Grant 6030 8590 0.00 0.00 0.0%
Drug/Alcohol/Tobacco Funds 6690 8590 0.00 0.00 0.0%
California Clean Energy Jobs Act 6230 8590 0.00 0.00 0.0%
Career Technical Education Incentive
Grant Program 6387 8590 0.00 0.00 0.0%
Specialized Secondary 7370 8590 0.00 0.00 0.0%
Quality Education Investment Act 7400 8590 0.00 0.00 0.0%
Common Core State Standards Implementation Funds 7405 8590 0.00 0.00 0.0%
All Other State Revenue All Other 8590 146,346.00 171,623.00 17.3%
TOTAL, OTHER STATE REVENUE 328,261.65 348,592.00 6.2%
Monterey Peninsula UnifiedMonterey County
Unaudited ActualsCharter Schools Special Revenue Fund
Expenditures by Object27 66092 0000000
Form 09
California Dept of EducationSACS Financial Reporting Software - 2017.2.0File: fund-b (Rev 06/08/2017 Page 6 Printed: 9/6/2017 2:41 PM
Description Resource Codes Object Codes2016-17
Unaudited Actuals2017-18Budget
PercentDifference
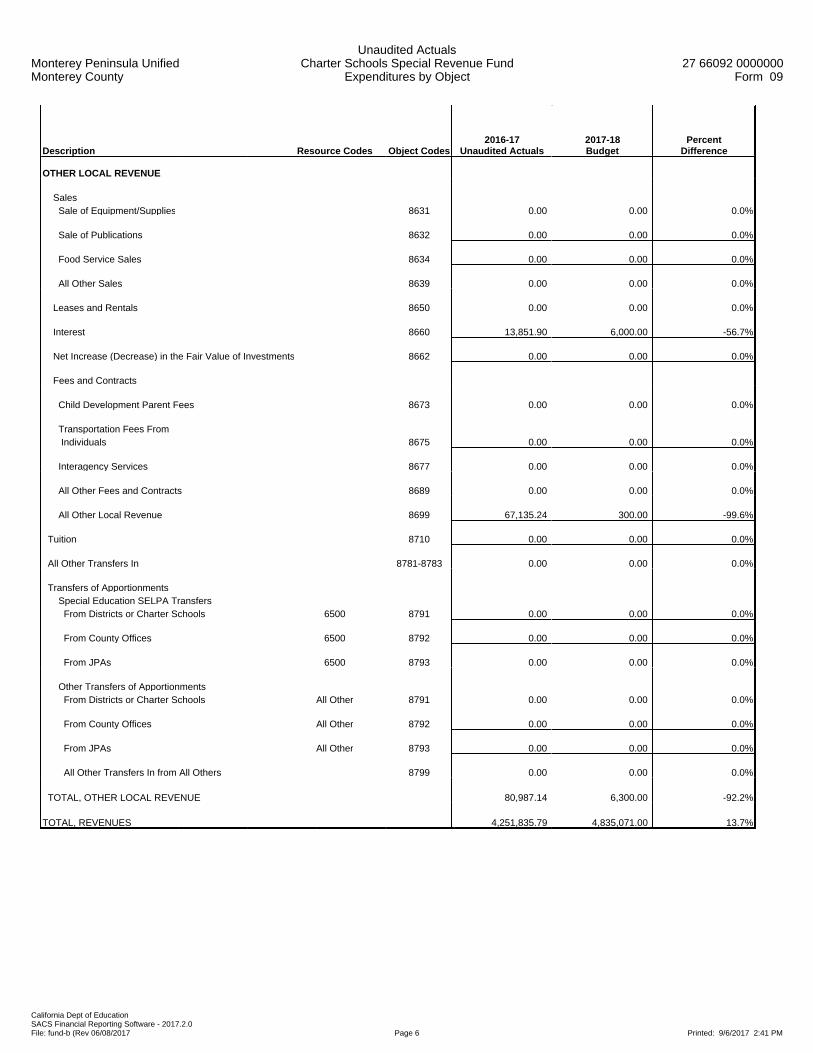
OTHER LOCAL REVENUE
Sales Sale of Equipment/Supplies 8631 0.00 0.00 0.0%
Sale of Publications 8632 0.00 0.00 0.0%
Food Service Sales 8634 0.00 0.00 0.0%
All Other Sales 8639 0.00 0.00 0.0%
Leases and Rentals 8650 0.00 0.00 0.0%
Interest 8660 13,851.90 6,000.00 -56.7%
Net Increase (Decrease) in the Fair Value of Investments 8662 0.00 0.00 0.0%
Fees and Contracts
Child Development Parent Fees 8673 0.00 0.00 0.0%
Transportation Fees From Individuals 8675 0.00 0.00 0.0%
Interagency Services 8677 0.00 0.00 0.0%
All Other Fees and Contracts 8689 0.00 0.00 0.0%
All Other Local Revenue 8699 67,135.24 300.00 -99.6%
Tuition 8710 0.00 0.00 0.0%
All Other Transfers In 8781-8783 0.00 0.00 0.0%
Transfers of Apportionments Special Education SELPA Transfers From Districts or Charter Schools 6500 8791 0.00 0.00 0.0%
From County Offices 6500 8792 0.00 0.00 0.0%
From JPAs 6500 8793 0.00 0.00 0.0%
Other Transfers of Apportionments From Districts or Charter Schools All Other 8791 0.00 0.00 0.0%
From County Offices All Other 8792 0.00 0.00 0.0%
From JPAs All Other 8793 0.00 0.00 0.0%
All Other Transfers In from All Others 8799 0.00 0.00 0.0%
TOTAL, OTHER LOCAL REVENUE 80,987.14 6,300.00 -92.2%
TOTAL, REVENUES 4,251,835.79 4,835,071.00 13.7%
Monterey Peninsula UnifiedMonterey County
Unaudited ActualsCharter Schools Special Revenue Fund
Expenditures by Object27 66092 0000000
Form 09
California Dept of EducationSACS Financial Reporting Software - 2017.2.0File: fund-b (Rev 06/08/2017 Page 7 Printed: 9/6/2017 2:41 PM
Description Resource Codes Object Codes2016-17
Unaudited Actuals2017-18Budget
PercentDifference
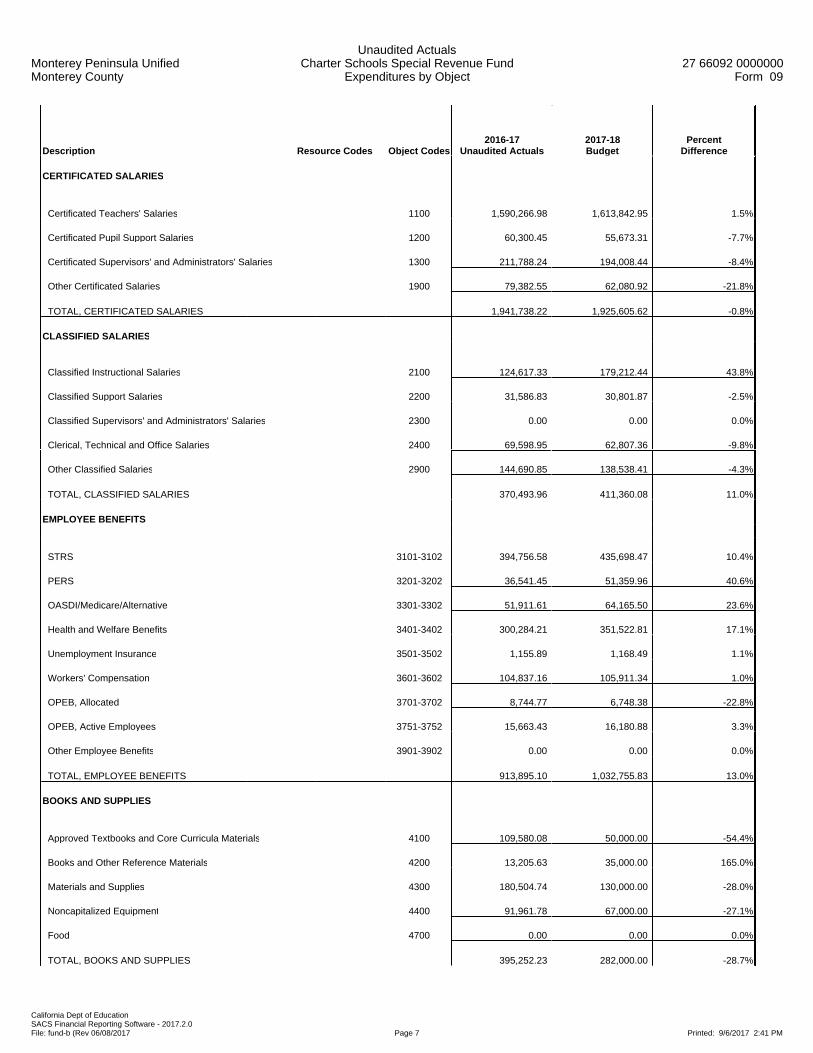
CERTIFICATED SALARIES
Certificated Teachers' Salaries 1100 1,590,266.98 1,613,842.95 1.5%
Certificated Pupil Support Salaries 1200 60,300.45 55,673.31 -7.7%
Certificated Supervisors' and Administrators' Salaries 1300 211,788.24 194,008.44 -8.4%
Other Certificated Salaries 1900 79,382.55 62,080.92 -21.8%
TOTAL, CERTIFICATED SALARIES 1,941,738.22 1,925,605.62 -0.8%
CLASSIFIED SALARIES
Classified Instructional Salaries 2100 124,617.33 179,212.44 43.8%
Classified Support Salaries 2200 31,586.83 30,801.87 -2.5%
Classified Supervisors' and Administrators' Salaries 2300 0.00 0.00 0.0%
Clerical, Technical and Office Salaries 2400 69,598.95 62,807.36 -9.8%
Other Classified Salaries 2900 144,690.85 138,538.41 -4.3%
TOTAL, CLASSIFIED SALARIES 370,493.96 411,360.08 11.0%
EMPLOYEE BENEFITS
STRS 3101-3102 394,756.58 435,698.47 10.4%
PERS 3201-3202 36,541.45 51,359.96 40.6%
OASDI/Medicare/Alternative 3301-3302 51,911.61 64,165.50 23.6%
Health and Welfare Benefits 3401-3402 300,284.21 351,522.81 17.1%
Unemployment Insurance 3501-3502 1,155.89 1,168.49 1.1%
Workers' Compensation 3601-3602 104,837.16 105,911.34 1.0%
OPEB, Allocated 3701-3702 8,744.77 6,748.38 -22.8%
OPEB, Active Employees 3751-3752 15,663.43 16,180.88 3.3%
Other Employee Benefits 3901-3902 0.00 0.00 0.0%
TOTAL, EMPLOYEE BENEFITS 913,895.10 1,032,755.83 13.0%
BOOKS AND SUPPLIES
Approved Textbooks and Core Curricula Materials 4100 109,580.08 50,000.00 -54.4%
Books and Other Reference Materials 4200 13,205.63 35,000.00 165.0%
Materials and Supplies 4300 180,504.74 130,000.00 -28.0%
Noncapitalized Equipment 4400 91,961.78 67,000.00 -27.1%
Food 4700 0.00 0.00 0.0%
TOTAL, BOOKS AND SUPPLIES 395,252.23 282,000.00 -28.7%

Monterey Peninsula UnifiedMonterey County
Unaudited ActualsCharter Schools Special Revenue Fund
Expenditures by Object27 66092 0000000
Form 09
California Dept of EducationSACS Financial Reporting Software - 2017.2.0File: fund-b (Rev 06/08/2017 Page 8 Printed: 9/6/2017 2:41 PM
Description Resource Codes Object Codes2016-17
Unaudited Actuals2017-18Budget
PercentDifference
SERVICES AND OTHER OPERATING EXPENDITURES
Subagreements for Services 5100 0.00 0.00 0.0%
Travel and Conferences 5200 63,024.77 15,000.00 -76.2%
Dues and Memberships 5300 75.00 0.00 -100.0%
Insurance 5400-5450 0.00 0.00 0.0%
Operations and Housekeeping Services 5500 0.00 0.00 0.0%
Rentals, Leases, Repairs, and Noncapitalized Improvements 5600 4,923.40 10,000.00 103.1%
Transfers of Direct Costs 5710 0.00 0.00 0.0%
Transfers of Direct Costs - Interfund 5750 383,344.10 521,500.00 36.0%
Professional/Consulting Services and Operating Expenditures 5800 47,591.74 57,000.00 19.8%
Communications 5900 399.01 0.00 -100.0%
TOTAL, SERVICES AND OTHER OPERATING EXPENDITURES 499,358.02 603,500.00 20.9%
CAPITAL OUTLAY
Land 6100 0.00 0.00 0.0%
Land Improvements 6170 0.00 0.00 0.0%
Buildings and Improvements of Buildings 6200 0.00 0.00 0.0%
Books and Media for New School Libraries or Major Expansion of School Libraries 6300 0.00 0.00 0.0%
Equipment 6400 25,171.89 25,000.00 -0.7%
Equipment Replacement 6500 0.00 0.00 0.0%
TOTAL, CAPITAL OUTLAY 25,171.89 25,000.00 -0.7%

Monterey Peninsula UnifiedMonterey County
Unaudited ActualsCharter Schools Special Revenue Fund
Expenditures by Object27 66092 0000000
Form 09
California Dept of EducationSACS Financial Reporting Software - 2017.2.0File: fund-b (Rev 06/08/2017 Page 9 Printed: 9/6/2017 2:41 PM
Description Resource Codes Object Codes2016-17
Unaudited Actuals2017-18Budget
PercentDifference
OTHER OUTGO (excluding Transfers of Indirect Costs)
Tuition Tuition for Instruction Under Interdistrict Attendance Agreements 7110 0.00 0.00 0.0%
Tuition, Excess Costs, and/or Deficit Payments Payments to Districts or Charter Schools 7141 0.00 0.00 0.0%
Payments to County Offices 7142 0.00 0.00 0.0%
Payments to JPAs 7143 0.00 0.00 0.0%
Other Transfers Out
All Other Transfers 7281-7283 0.00 0.00 0.0%
All Other Transfers Out to All Others 7299 0.00 0.00 0.0%
Debt Service
Debt Service - Interest 7438 0.00 0.00 0.0%
Other Debt Service - Principal 7439 0.00 0.00 0.0%
TOTAL, OTHER OUTGO (excluding Transfers of Indirect Costs) 0.00 0.00 0.0%
OTHER OUTGO - TRANSFERS OF INDIRECT COSTS
Transfers of Indirect Costs 7310 0.00 0.00 0.0%
Transfers of Indirect Costs - Interfund 7350 211,860.53 292,385.65 38.0%
TOTAL, OTHER OUTGO - TRANSFERS OF INDIRECT COSTS 211,860.53 292,385.65 38.0%
TOTAL, EXPENDITURES 4,357,769.95 4,572,607.18 4.9%
Monterey Peninsula UnifiedMonterey County
Unaudited ActualsCharter Schools Special Revenue Fund
Expenditures by Object27 66092 0000000
Form 09
California Dept of EducationSACS Financial Reporting Software - 2017.2.0File: fund-b (Rev 06/08/2017 Page 10 Printed: 9/6/2017 2:41 PM
Description Resource Codes Object Codes2016-17
Unaudited Actuals2017-18Budget
PercentDifference
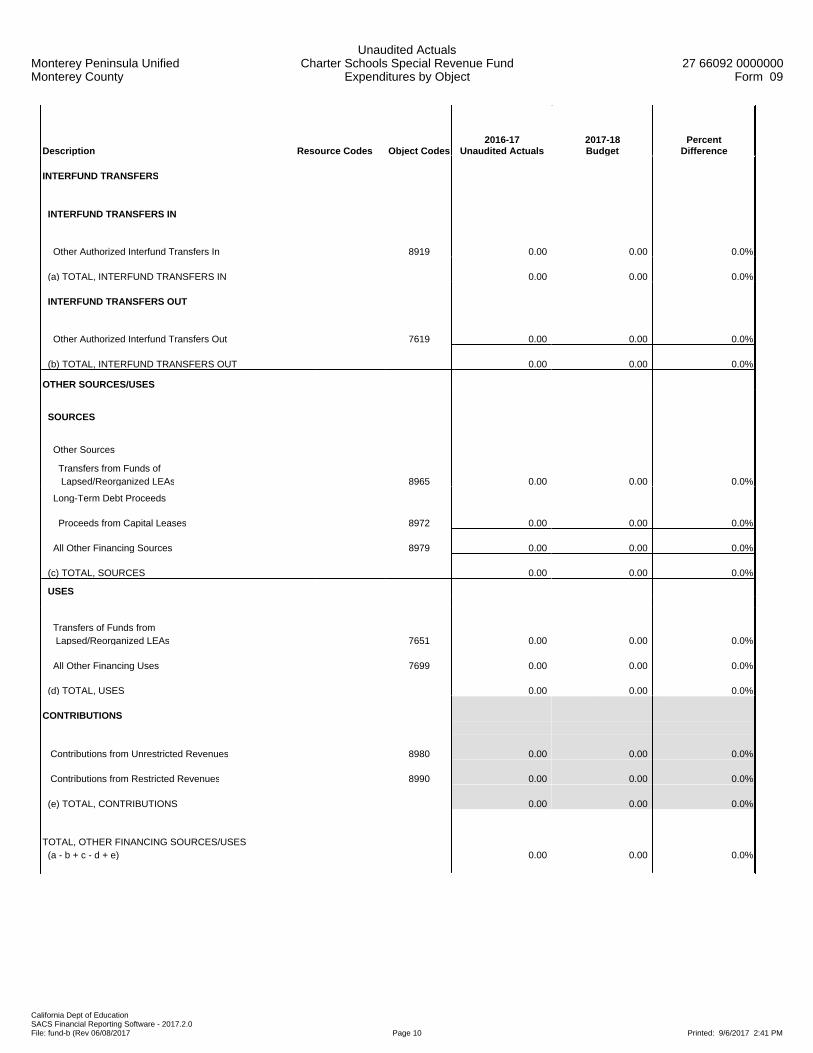
INTERFUND TRANSFERS
INTERFUND TRANSFERS IN
Other Authorized Interfund Transfers In 8919 0.00 0.00 0.0%
(a) TOTAL, INTERFUND TRANSFERS IN 0.00 0.00 0.0%
INTERFUND TRANSFERS OUT
Other Authorized Interfund Transfers Out 7619 0.00 0.00 0.0%
(b) TOTAL, INTERFUND TRANSFERS OUT 0.00 0.00 0.0%
OTHER SOURCES/USES
SOURCES
Other Sources
Transfers from Funds of Lapsed/Reorganized LEAs 8965 0.00 0.00 0.0%
Long-Term Debt Proceeds
Proceeds from Capital Leases 8972 0.00 0.00 0.0%
All Other Financing Sources 8979 0.00 0.00 0.0%
(c) TOTAL, SOURCES 0.00 0.00 0.0%
USES
Transfers of Funds from Lapsed/Reorganized LEAs 7651 0.00 0.00 0.0%
All Other Financing Uses 7699 0.00 0.00 0.0%
(d) TOTAL, USES 0.00 0.00 0.0%
CONTRIBUTIONS
Contributions from Unrestricted Revenues 8980 0.00 0.00 0.0%
Contributions from Restricted Revenues 8990 0.00 0.00 0.0%
(e) TOTAL, CONTRIBUTIONS 0.00 0.00 0.0%
TOTAL, OTHER FINANCING SOURCES/USES (a - b + c - d + e) 0.00 0.00 0.0%
Monterey Peninsula UnifiedMonterey County
Unaudited ActualsCharter Schools Special Revenue Fund
Expenditures by Function27 66092 0000000
Form 09
California Dept of EducationSACS Financial Reporting Software - 2017.2.0File: fund-b (Rev 03/08/2016) Page 1 Printed: 9/6/2017 2:41 PM
Description Function Codes Object Codes2016-17
Unaudited Actuals2017-18Budget
PercentDifference
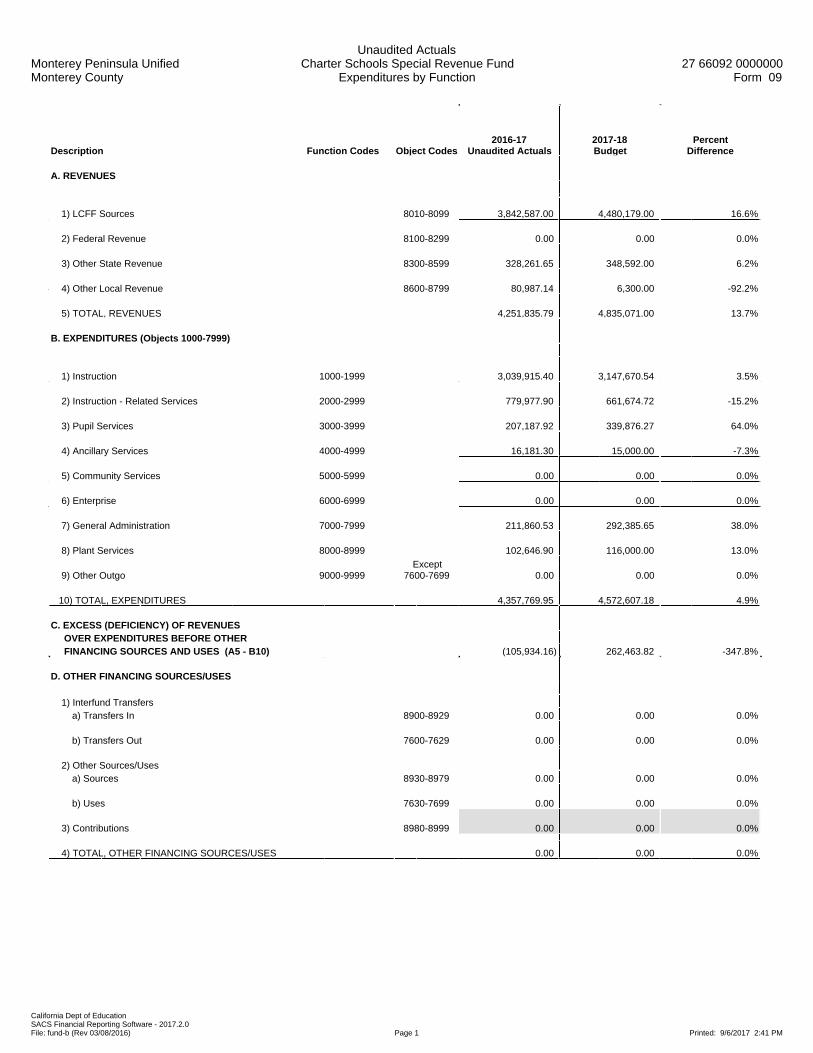
A. REVENUES
1) LCFF Sources 8010-8099 3,842,587.00 4,480,179.00 16.6%
2) Federal Revenue 8100-8299 0.00 0.00 0.0%
3) Other State Revenue 8300-8599 328,261.65 348,592.00 6.2%
4) Other Local Revenue 8600-8799 80,987.14 6,300.00 -92.2%
5) TOTAL, REVENUES 4,251,835.79 4,835,071.00 13.7%
B. EXPENDITURES (Objects 1000-7999)
1) Instruction 1000-1999 3,039,915.40 3,147,670.54 3.5%
2) Instruction - Related Services 2000-2999 779,977.90 661,674.72 -15.2%
3) Pupil Services 3000-3999 207,187.92 339,876.27 64.0%
4) Ancillary Services 4000-4999 16,181.30 15,000.00 -7.3%
5) Community Services 5000-5999 0.00 0.00 0.0%
6) Enterprise 6000-6999 0.00 0.00 0.0%
7) General Administration 7000-7999 211,860.53 292,385.65 38.0%
8) Plant Services 8000-8999 102,646.90 116,000.00 13.0%
9) Other Outgo 9000-9999Except
7600-7699 0.00 0.00 0.0%
10) TOTAL, EXPENDITURES 4,357,769.95 4,572,607.18 4.9%
C. EXCESS (DEFICIENCY) OF REVENUES OVER EXPENDITURES BEFORE OTHER FINANCING SOURCES AND USES (A5 - B10) (105,934.16) 262,463.82 -347.8%
D. OTHER FINANCING SOURCES/USES 1) Interfund Transfers a) Transfers In 8900-8929 0.00 0.00 0.0%
b) Transfers Out 7600-7629 0.00 0.00 0.0%
2) Other Sources/Uses a) Sources 8930-8979 0.00 0.00 0.0%
b) Uses 7630-7699 0.00 0.00 0.0%
3) Contributions 8980-8999 0.00 0.00 0.0%
4) TOTAL, OTHER FINANCING SOURCES/USES 0.00 0.00 0.0%
Monterey Peninsula UnifiedMonterey County
Unaudited ActualsCharter Schools Special Revenue Fund
Expenditures by Function27 66092 0000000
Form 09
California Dept of EducationSACS Financial Reporting Software - 2017.2.0File: fund-b (Rev 03/08/2016) Page 2 Printed: 9/6/2017 2:41 PM
Description Function Codes Object Codes2016-17
Unaudited Actuals2017-18Budget
PercentDifference
E. NET INCREASE (DECREASE) IN FUND BALANCE (C + D4) (105,934.16) 262,463.82 -347.8%
F. FUND BALANCE, RESERVES 1) Beginning Fund Balance
a) As of July 1 - Unaudited 9791 1,033,508.69 927,574.53 -10.2%
b) Audit Adjustments 9793 0.00 0.00 0.0%
c) As of July 1 - Audited (F1a + F1b) 1,033,508.69 927,574.53 -10.2%
d) Other Restatements 9795 0.00 0.00 0.0%
e) Adjusted Beginning Balance (F1c + F1d) 1,033,508.69 927,574.53 -10.2%
2) Ending Balance, June 30 (E + F1e) 927,574.53 1,190,038.35 28.3%
Components of Ending Fund Balance a) Nonspendable Revolving Cash 9711 0.00 0.00 0.0%
Stores 9712 0.00 0.00 0.0%
Prepaid Expenditures 9713 600.00 0.00 -100.0%
All Others 9719 0.00 0.00 0.0%
b) Restricted 9740 83,975.64 105,335.64 25.4%
c) Committed Stabilization Arrangements 9750 0.00 0.00 0.0%
Other Commitments (by Resource/Object) 9760 0.00 0.00 0.0%
d) Assigned Other Assignments (by Resource/Object) 9780 842,998.89 1,084,702.71 28.7%
e) Unassigned/Unappropriated Reserve for Economic Uncertainties 9789 0.00 0.00 0.0%
Unassigned/Unappropriated Amount 9790 0.00 0.00 0.0%

Monterey Peninsula UnifiedMonterey County
Unaudited ActualsCharter Schools Special Revenue Fund
Exhibit: Restricted Balance Detail27 66092 0000000
Form 09
California Dept of EducationSACS Financial Reporting Software - 2017.2.0File: fund-b (Rev 11/14/2012) Page 1 Printed: 9/6/2017 2:41 PM
2016-17 2017-18Resource Description Unaudited Actuals Budget
6264 Educator Effectiveness (15-16) 6,974.13 6,974.13
6300 Lottery: Instructional Materials 0.00 21,360.00
9010 Other Restricted Local 77,001.51 77,001.51
Total, Restricted Balance 83,975.64 105,335.64
Monterey Peninsula UnifiedMonterey County
Unaudited ActualsAdult Education Fund
Expenditures by Object27 66092 0000000
Form 11
California Dept of EducationSACS Financial Reporting Software - 2017.2.0File: fund-b (Rev 06/08/2017 Page 1 Printed: 9/6/2017 2:41 PM
Description Resource Codes Object Codes2016-17
Unaudited Actuals2017-18Budget
PercentDifference
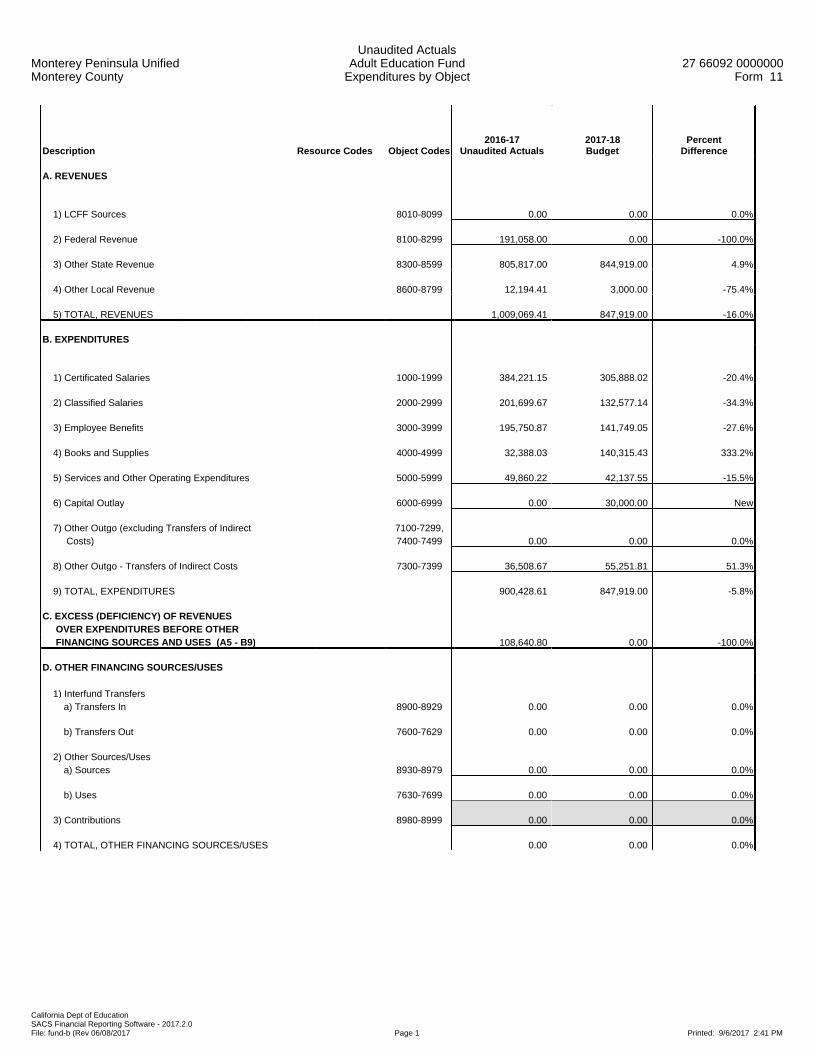
A. REVENUES
1) LCFF Sources 8010-8099 0.00 0.00 0.0%
2) Federal Revenue 8100-8299 191,058.00 0.00 -100.0%
3) Other State Revenue 8300-8599 805,817.00 844,919.00 4.9%
4) Other Local Revenue 8600-8799 12,194.41 3,000.00 -75.4%
5) TOTAL, REVENUES 1,009,069.41 847,919.00 -16.0%
B. EXPENDITURES
1) Certificated Salaries 1000-1999 384,221.15 305,888.02 -20.4%
2) Classified Salaries 2000-2999 201,699.67 132,577.14 -34.3%
3) Employee Benefits 3000-3999 195,750.87 141,749.05 -27.6%
4) Books and Supplies 4000-4999 32,388.03 140,315.43 333.2%
5) Services and Other Operating Expenditures 5000-5999 49,860.22 42,137.55 -15.5%
6) Capital Outlay 6000-6999 0.00 30,000.00 New
7) Other Outgo (excluding Transfers of Indirect 7100-7299, Costs) 7400-7499 0.00 0.00 0.0%
8) Other Outgo - Transfers of Indirect Costs 7300-7399 36,508.67 55,251.81 51.3%
9) TOTAL, EXPENDITURES 900,428.61 847,919.00 -5.8%
C. EXCESS (DEFICIENCY) OF REVENUES OVER EXPENDITURES BEFORE OTHER FINANCING SOURCES AND USES (A5 - B9) 108,640.80 0.00 -100.0%
D. OTHER FINANCING SOURCES/USES 1) Interfund Transfers a) Transfers In 8900-8929 0.00 0.00 0.0%
b) Transfers Out 7600-7629 0.00 0.00 0.0%
2) Other Sources/Uses a) Sources 8930-8979 0.00 0.00 0.0%
b) Uses 7630-7699 0.00 0.00 0.0%
3) Contributions 8980-8999 0.00 0.00 0.0%
4) TOTAL, OTHER FINANCING SOURCES/USES 0.00 0.00 0.0%

Monterey Peninsula UnifiedMonterey County
Unaudited ActualsAdult Education Fund
Expenditures by Object27 66092 0000000
Form 11
California Dept of EducationSACS Financial Reporting Software - 2017.2.0File: fund-b (Rev 06/08/2017 Page 2 Printed: 9/6/2017 2:41 PM
Description Resource Codes Object Codes2016-17
Unaudited Actuals2017-18Budget
PercentDifference
E. NET INCREASE (DECREASE) IN FUND BALANCE (C + D4) 108,640.80 0.00 -100.0%
F. FUND BALANCE, RESERVES 1) Beginning Fund Balance a) As of July 1 - Unaudited 9791 219,990.77 328,631.57 49.4%
b) Audit Adjustments 9793 0.00 0.00 0.0%
c) As of July 1 - Audited (F1a + F1b) 219,990.77 328,631.57 49.4%
d) Other Restatements 9795 0.00 0.00 0.0%
e) Adjusted Beginning Balance (F1c + F1d) 219,990.77 328,631.57 49.4%
2) Ending Balance, June 30 (E + F1e) 328,631.57 328,631.57 0.0% Components of Ending Fund Balance a) Nonspendable Revolving Cash 9711 0.00 0.00 0.0%
Stores 9712 0.00 0.00 0.0%
Prepaid Expenditures 9713 1,416.22 0.00 -100.0%
All Others 9719 0.00 0.00 0.0%
b) Restricted 9740 327,215.35 328,631.57 0.4%
c) Committed Stabilization Arrangements 9750 0.00 0.00 0.0%
Other Commitments 9760 0.00 0.00 0.0%
d) Assigned Other Assignments 9780 0.00 0.00 0.0%
e) Unassigned/Unappropriated Reserve for Economic Uncertainties 9789 0.00 0.00 0.0%
Unassigned/Unappropriated Amount 9790 0.00 0.00 0.0%

Monterey Peninsula UnifiedMonterey County
Unaudited ActualsAdult Education Fund
Expenditures by Object27 66092 0000000
Form 11
California Dept of EducationSACS Financial Reporting Software - 2017.2.0File: fund-b (Rev 06/08/2017 Page 3 Printed: 9/6/2017 2:41 PM
Description Resource Codes Object Codes2016-17
Unaudited Actuals2017-18Budget
PercentDifference
G. ASSETS 1) Cash a) in County Treasury 9110 171,651.57
1) Fair Value Adjustment to Cash in County Treasury 9111 0.00
b) in Banks 9120 0.00
c) in Revolving Fund 9130 0.00
d) with Fiscal Agent 9135 0.00
e) collections awaiting deposit 9140 7,484.47
2) Investments 9150 0.00
3) Accounts Receivable 9200 166,523.82
4) Due from Grantor Government 9290 0.00
5) Due from Other Funds 9310 0.00
6) Stores 9320 0.00
7) Prepaid Expenditures 9330 1,416.22
8) Other Current Assets 9340 0.00
9) TOTAL, ASSETS 347,076.08
H. DEFERRED OUTFLOWS OF RESOURCES
1) Deferred Outflows of Resources 9490 0.00
2) TOTAL, DEFERRED OUTFLOWS 0.00
I. LIABILITIES
1) Accounts Payable 9500 18,444.38
2) Due to Grantor Governments 9590 0.00
3) Due to Other Funds 9610 0.13
4) Current Loans 9640
5) Unearned Revenue 9650 0.00
6) TOTAL, LIABILITIES 18,444.51
J. DEFERRED INFLOWS OF RESOURCES
1) Deferred Inflows of Resources 9690 0.00
2) TOTAL, DEFERRED INFLOWS 0.00
K. FUND EQUITY
Ending Fund Balance, June 30 (must agree with line F2) (G9 + H2) - (I6 + J2) 328,631.57

Monterey Peninsula UnifiedMonterey County
Unaudited ActualsAdult Education Fund
Expenditures by Object27 66092 0000000
Form 11
California Dept of EducationSACS Financial Reporting Software - 2017.2.0File: fund-b (Rev 06/08/2017 Page 4 Printed: 9/6/2017 2:41 PM
Description Resource Codes Object Codes2016-17
Unaudited Actuals2017-18Budget
PercentDifference
LCFF SOURCES
LCFF Transfers
LCFF Transfers - Current Year 8091 0.00 0.00 0.0%
LCFF/Revenue Limit Transfers - Prior Years 8099 0.00 0.00 0.0%
TOTAL, LCFF SOURCES 0.00 0.00 0.0%
FEDERAL REVENUE
Interagency Contracts Between LEAs 8285 0.00 0.00 0.0%
No Child Left Behind 3105, 4045 8290 0.00 0.00 0.0%
Career and Technical Education 3500-3599 8290 0.00 0.00 0.0%
All Other Federal Revenue All Other 8290 191,058.00 0.00 -100.0%
TOTAL, FEDERAL REVENUE 191,058.00 0.00 -100.0%
OTHER STATE REVENUE
Other State Apportionments
All Other State Apportionments - Current Year 8311 0.00 0.00 0.0%
All Other State Apportionments - Prior Years 8319 0.00 0.00 0.0%
Pass-Through Revenues from State Sources 8587 0.00 0.00 0.0%
Adult Education Block Grant Program 6391 8590 750,058.00 823,925.00 9.8%
All Other State Revenue All Other 8590 55,759.00 20,994.00 -62.3%
TOTAL, OTHER STATE REVENUE 805,817.00 844,919.00 4.9%
Monterey Peninsula UnifiedMonterey County
Unaudited ActualsAdult Education Fund
Expenditures by Object27 66092 0000000
Form 11
California Dept of EducationSACS Financial Reporting Software - 2017.2.0File: fund-b (Rev 06/08/2017 Page 5 Printed: 9/6/2017 2:41 PM
Description Resource Codes Object Codes2016-17
Unaudited Actuals2017-18Budget
PercentDifference
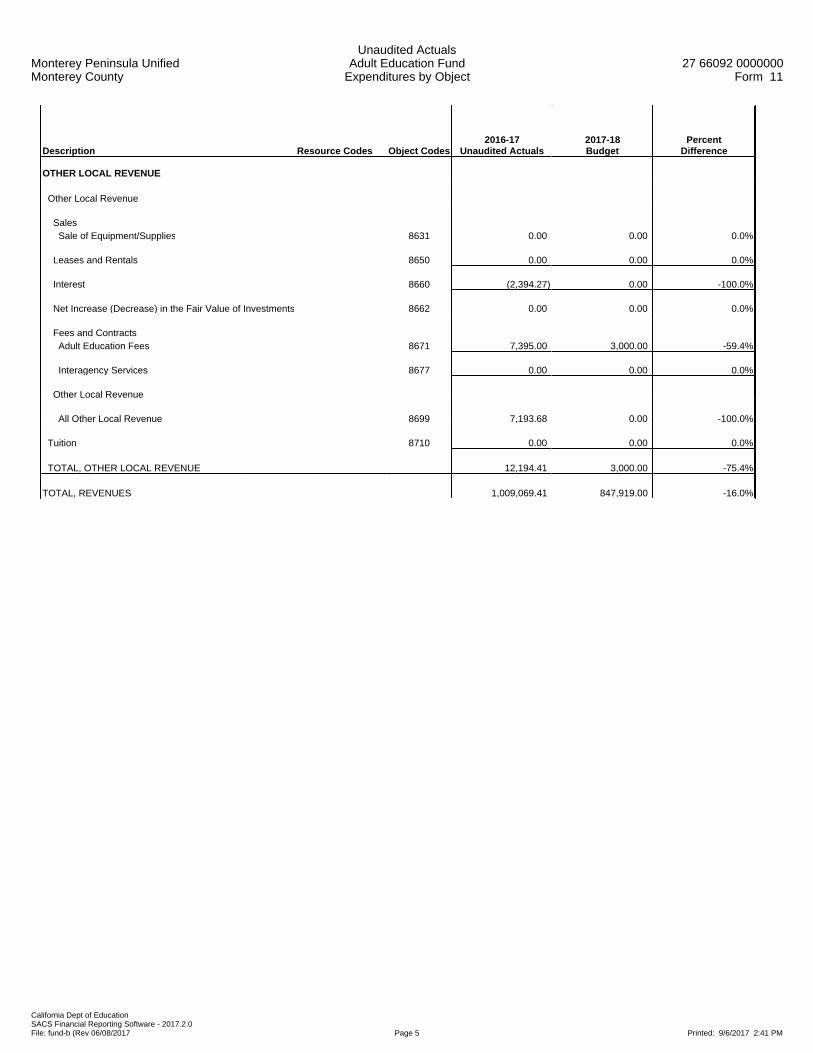
OTHER LOCAL REVENUE
Other Local Revenue
Sales Sale of Equipment/Supplies 8631 0.00 0.00 0.0%
Leases and Rentals 8650 0.00 0.00 0.0%
Interest 8660 (2,394.27) 0.00 -100.0%
Net Increase (Decrease) in the Fair Value of Investments 8662 0.00 0.00 0.0%
Fees and Contracts Adult Education Fees 8671 7,395.00 3,000.00 -59.4%
Interagency Services 8677 0.00 0.00 0.0%
Other Local Revenue
All Other Local Revenue 8699 7,193.68 0.00 -100.0%
Tuition 8710 0.00 0.00 0.0%
TOTAL, OTHER LOCAL REVENUE 12,194.41 3,000.00 -75.4%
TOTAL, REVENUES 1,009,069.41 847,919.00 -16.0%

Monterey Peninsula UnifiedMonterey County
Unaudited ActualsAdult Education Fund
Expenditures by Object27 66092 0000000
Form 11
California Dept of EducationSACS Financial Reporting Software - 2017.2.0File: fund-b (Rev 06/08/2017 Page 6 Printed: 9/6/2017 2:41 PM
Description Resource Codes Object Codes2016-17
Unaudited Actuals2017-18Budget
PercentDifference
CERTIFICATED SALARIES
Certificated Teachers' Salaries 1100 308,629.10 186,944.60 -39.4%
Certificated Pupil Support Salaries 1200 8,142.80 0.00 -100.0%
Certificated Supervisors' and Administrators' Salaries 1300 67,449.25 118,943.42 76.3%
Other Certificated Salaries 1900 0.00 0.00 0.0%
TOTAL, CERTIFICATED SALARIES 384,221.15 305,888.02 -20.4%
CLASSIFIED SALARIES
Classified Instructional Salaries 2100 0.00 0.00 0.0%
Classified Support Salaries 2200 1,951.20 0.00 -100.0%
Classified Supervisors' and Administrators' Salaries 2300 0.00 0.00 0.0%
Clerical, Technical and Office Salaries 2400 139,818.33 132,577.14 -5.2%
Other Classified Salaries 2900 59,930.14 0.00 -100.0%
TOTAL, CLASSIFIED SALARIES 201,699.67 132,577.14 -34.3%
EMPLOYEE BENEFITS
STRS 3101-3102 65,804.22 61,704.15 -6.2%
PERS 3201-3202 24,030.18 22,261.37 -7.4%
OASDI/Medicare/Alternative 3301-3302 21,733.10 15,841.33 -27.1%
Health and Welfare Benefits 3401-3402 53,825.76 19,396.33 -64.0%
Unemployment Insurance 3501-3502 292.65 219.24 -25.1%
Workers' Compensation 3601-3602 26,554.04 19,871.21 -25.2%
OPEB, Allocated 3701-3702 2,033.62 1,359.22 -33.2%
OPEB, Active Employees 3751-3752 1,477.30 1,096.20 -25.8%
Other Employee Benefits 3901-3902 0.00 0.00 0.0%
TOTAL, EMPLOYEE BENEFITS 195,750.87 141,749.05 -27.6%
BOOKS AND SUPPLIES
Approved Textbooks and Core Curricula Materials 4100 0.00 0.00 0.0%
Books and Other Reference Materials 4200 0.00 0.00 0.0%
Materials and Supplies 4300 27,730.87 108,383.92 290.8%
Noncapitalized Equipment 4400 4,657.16 31,931.51 585.6%
TOTAL, BOOKS AND SUPPLIES 32,388.03 140,315.43 333.2%

Monterey Peninsula UnifiedMonterey County
Unaudited ActualsAdult Education Fund
Expenditures by Object27 66092 0000000
Form 11
California Dept of EducationSACS Financial Reporting Software - 2017.2.0File: fund-b (Rev 06/08/2017 Page 7 Printed: 9/6/2017 2:41 PM
Description Resource Codes Object Codes2016-17
Unaudited Actuals2017-18Budget
PercentDifference
SERVICES AND OTHER OPERATING EXPENDITURES
Subagreements for Services 5100 0.00 0.00 0.0%
Travel and Conferences 5200 4,797.49 3,687.55 -23.1%
Dues and Memberships 5300 1,105.00 0.00 -100.0%
Insurance 5400-5450 0.00 0.00 0.0%
Operations and Housekeeping Services 5500 0.00 0.00 0.0%
Rentals, Leases, Repairs, and Noncapitalized Improvements 5600 949.98 1,200.00 26.3%
Transfers of Direct Costs 5710 0.00 0.00 0.0%
Transfers of Direct Costs - Interfund 5750 973.50 0.00 -100.0%
Professional/Consulting Services and Operating Expenditures 5800 41,845.64 37,000.00 -11.6%
Communications 5900 188.61 250.00 32.5%
TOTAL, SERVICES AND OTHER OPERATING EXPENDITURES 49,860.22 42,137.55 -15.5%
CAPITAL OUTLAY
Land 6100 0.00 0.00 0.0%
Land Improvements 6170 0.00 0.00 0.0%
Buildings and Improvements of Buildings 6200 0.00 0.00 0.0%
Equipment 6400 0.00 30,000.00 New
Equipment Replacement 6500 0.00 0.00 0.0%
TOTAL, CAPITAL OUTLAY 0.00 30,000.00 New
OTHER OUTGO (excluding Transfers of Indirect Costs)
Tuition
Tuition, Excess Costs, and/or Deficit Payments Payments to Districts or Charter Schools 7141 0.00 0.00 0.0%
Payments to County Offices 7142 0.00 0.00 0.0%
Payments to JPAs 7143 0.00 0.00 0.0%
Other Transfers Out
Transfers of Pass-Through Revenues To Districts or Charter Schools 7211 0.00 0.00 0.0%
To County Offices 7212 0.00 0.00 0.0%
To JPAs 7213 0.00 0.00 0.0%
Debt Service
Debt Service - Interest 7438 0.00 0.00 0.0%
Other Debt Service - Principal 7439 0.00 0.00 0.0%
TOTAL, OTHER OUTGO (excluding Transfers of Indirect Costs) 0.00 0.00 0.0%

Monterey Peninsula UnifiedMonterey County
Unaudited ActualsAdult Education Fund
Expenditures by Object27 66092 0000000
Form 11
California Dept of EducationSACS Financial Reporting Software - 2017.2.0File: fund-b (Rev 06/08/2017 Page 8 Printed: 9/6/2017 2:41 PM
Description Resource Codes Object Codes2016-17
Unaudited Actuals2017-18Budget
PercentDifference
OTHER OUTGO - TRANSFERS OF INDIRECT COSTS
Transfers of Indirect Costs - Interfund 7350 36,508.67 55,251.81 51.3%
TOTAL, OTHER OUTGO - TRANSFERS OF INDIRECT COSTS 36,508.67 55,251.81 51.3%
TOTAL, EXPENDITURES 900,428.61 847,919.00 -5.8%

Monterey Peninsula UnifiedMonterey County
Unaudited ActualsAdult Education Fund
Expenditures by Object27 66092 0000000
Form 11
California Dept of EducationSACS Financial Reporting Software - 2017.2.0File: fund-b (Rev 06/08/2017 Page 9 Printed: 9/6/2017 2:41 PM
Description Resource Codes Object Codes2016-17
Unaudited Actuals2017-18Budget
PercentDifference
INTERFUND TRANSFERS
INTERFUND TRANSFERS IN
Other Authorized Interfund Transfers In 8919 0.00 0.00 0.0%
(a) TOTAL, INTERFUND TRANSFERS IN 0.00 0.00 0.0%
INTERFUND TRANSFERS OUT
To: State School Building Fund/ County School Facilities Fund 7613 0.00 0.00 0.0%
Other Authorized Interfund Transfers Out 7619 0.00 0.00 0.0%
(b) TOTAL, INTERFUND TRANSFERS OUT 0.00 0.00 0.0%
OTHER SOURCES/USES
SOURCES
Other Sources
Transfers from Funds of Lapsed/Reorganized LEAs 8965 0.00 0.00 0.0%
Long-Term Debt Proceeds
Proceeds from Certificates of Participation 8971 0.00 0.00 0.0%
Proceeds from Capital Leases 8972 0.00 0.00 0.0%
All Other Financing Sources 8979 0.00 0.00 0.0%
(c) TOTAL, SOURCES 0.00 0.00 0.0%
USES
Transfers of Funds from Lapsed/Reorganized LEAs 7651 0.00 0.00 0.0%
All Other Financing Uses 7699 0.00 0.00 0.0%
(d) TOTAL, USES 0.00 0.00 0.0%
CONTRIBUTIONS
Contributions from Unrestricted Revenues 8980 0.00 0.00 0.0%
Contributions from Restricted Revenues 8990 0.00 0.00 0.0%
(e) TOTAL, CONTRIBUTIONS 0.00 0.00 0.0%
TOTAL, OTHER FINANCING SOURCES/USES (a - b + c - d + e) 0.00 0.00 0.0%

Monterey Peninsula UnifiedMonterey County
Unaudited ActualsAdult Education Fund
Expenditures by Function27 66092 0000000
Form 11
California Dept of EducationSACS Financial Reporting Software - 2017.2.0File: fund-b (Rev 03/08/2016) Page 1 Printed: 9/6/2017 2:41 PM
Description Function Codes Object Codes2016-17
Unaudited Actuals2017-18Budget
PercentDifference
A. REVENUES
1) LCFF Sources 8010-8099 0.00 0.00 0.0%
2) Federal Revenue 8100-8299 191,058.00 0.00 -100.0%
3) Other State Revenue 8300-8599 805,817.00 844,919.00 4.9%
4) Other Local Revenue 8600-8799 12,194.41 3,000.00 -75.4%
5) TOTAL, REVENUES 1,009,069.41 847,919.00 -16.0%
B. EXPENDITURES (Objects 1000-7999)
1) Instruction 1000-1999 459,976.94 379,553.17 -17.5%
2) Instruction - Related Services 2000-2999 392,914.52 413,114.02 5.1%
3) Pupil Services 3000-3999 8,883.91 0.00 -100.0%
4) Ancillary Services 4000-4999 0.00 0.00 0.0%
5) Community Services 5000-5999 0.00 0.00 0.0%
6) Enterprise 6000-6999 0.00 0.00 0.0%
7) General Administration 7000-7999 36,508.67 55,251.81 51.3%
8) Plant Services 8000-8999 2,144.57 0.00 -100.0%
9) Other Outgo 9000-9999Except
7600-7699 0.00 0.00 0.0%
10) TOTAL, EXPENDITURES 900,428.61 847,919.00 -5.8%
C. EXCESS (DEFICIENCY) OF REVENUES OVER EXPENDITURES BEFORE OTHER FINANCING SOURCES AND USES (A5 - B10) 108,640.80 0.00 -100.0%
D. OTHER FINANCING SOURCES/USES 1) Interfund Transfers a) Transfers In 8900-8929 0.00 0.00 0.0%
b) Transfers Out 7600-7629 0.00 0.00 0.0%
2) Other Sources/Uses a) Sources 8930-8979 0.00 0.00 0.0%
b) Uses 7630-7699 0.00 0.00 0.0%
3) Contributions 8980-8999 0.00 0.00 0.0%
4) TOTAL, OTHER FINANCING SOURCES/USES 0.00 0.00 0.0%

Monterey Peninsula UnifiedMonterey County
Unaudited ActualsAdult Education Fund
Expenditures by Function27 66092 0000000
Form 11
California Dept of EducationSACS Financial Reporting Software - 2017.2.0File: fund-b (Rev 03/08/2016) Page 2 Printed: 9/6/2017 2:41 PM
Description Function Codes Object Codes2016-17
Unaudited Actuals2017-18Budget
PercentDifference
E. NET INCREASE (DECREASE) IN FUND BALANCE (C + D4) 108,640.80 0.00 -100.0%
F. FUND BALANCE, RESERVES 1) Beginning Fund Balance
a) As of July 1 - Unaudited 9791 219,990.77 328,631.57 49.4%
b) Audit Adjustments 9793 0.00 0.00 0.0%
c) As of July 1 - Audited (F1a + F1b) 219,990.77 328,631.57 49.4%
d) Other Restatements 9795 0.00 0.00 0.0%
e) Adjusted Beginning Balance (F1c + F1d) 219,990.77 328,631.57 49.4%
2) Ending Balance, June 30 (E + F1e) 328,631.57 328,631.57 0.0%
Components of Ending Fund Balance a) Nonspendable Revolving Cash 9711 0.00 0.00 0.0%
Stores 9712 0.00 0.00 0.0%
Prepaid Expenditures 9713 1,416.22 0.00 -100.0%
All Others 9719 0.00 0.00 0.0%
b) Restricted 9740 327,215.35 328,631.57 0.4%
c) Committed Stabilization Arrangements 9750 0.00 0.00 0.0%
Other Commitments (by Resource/Object) 9760 0.00 0.00 0.0%
d) Assigned Other Assignments (by Resource/Object) 9780 0.00 0.00 0.0%
e) Unassigned/Unappropriated Reserve for Economic Uncertainties 9789 0.00 0.00 0.0%
Unassigned/Unappropriated Amount 9790 0.00 0.00 0.0%

Monterey Peninsula UnifiedMonterey County
Unaudited ActualsAdult Education Fund
Exhibit: Restricted Balance Detail27 66092 0000000
Form 11
California Dept of EducationSACS Financial Reporting Software - 2017.2.0File: fund-b (Rev 11/14/2012) Page 1 Printed: 9/6/2017 2:41 PM
2016-17 2017-18Resource Description Unaudited Actuals Budget
6391 Adult Education Block Grant Program 249,547.12 250,963.34
6392 Adult Education Block Grant Data and Accountability 31,364.00 31,364.00
9010 Other Restricted Local 46,304.23 46,304.23
Total, Restricted Balance 327,215.35 328,631.57
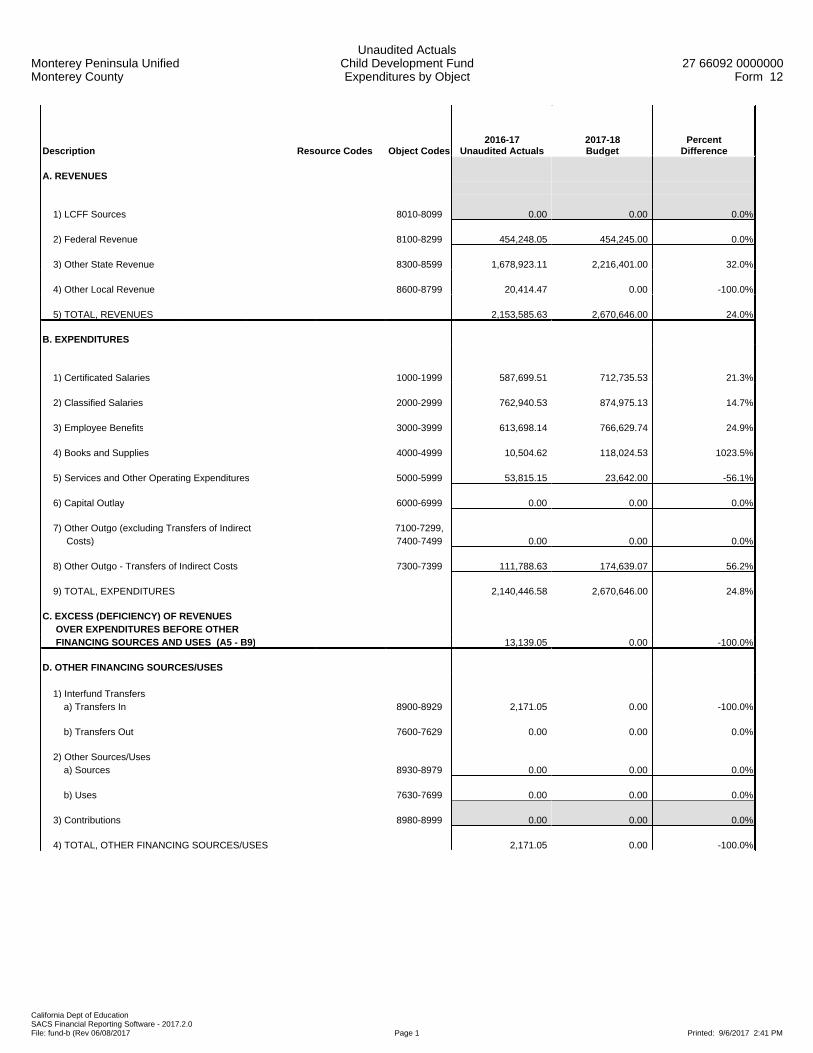
Monterey Peninsula UnifiedMonterey County
Unaudited ActualsChild Development FundExpenditures by Object
27 66092 0000000Form 12
California Dept of EducationSACS Financial Reporting Software - 2017.2.0File: fund-b (Rev 06/08/2017 Page 1 Printed: 9/6/2017 2:41 PM
Description Resource Codes Object Codes2016-17
Unaudited Actuals2017-18Budget
PercentDifference
A. REVENUES
1) LCFF Sources 8010-8099 0.00 0.00 0.0%
2) Federal Revenue 8100-8299 454,248.05 454,245.00 0.0%
3) Other State Revenue 8300-8599 1,678,923.11 2,216,401.00 32.0%
4) Other Local Revenue 8600-8799 20,414.47 0.00 -100.0%
5) TOTAL, REVENUES 2,153,585.63 2,670,646.00 24.0%
B. EXPENDITURES
1) Certificated Salaries 1000-1999 587,699.51 712,735.53 21.3%
2) Classified Salaries 2000-2999 762,940.53 874,975.13 14.7%
3) Employee Benefits 3000-3999 613,698.14 766,629.74 24.9%
4) Books and Supplies 4000-4999 10,504.62 118,024.53 1023.5%
5) Services and Other Operating Expenditures 5000-5999 53,815.15 23,642.00 -56.1%
6) Capital Outlay 6000-6999 0.00 0.00 0.0%
7) Other Outgo (excluding Transfers of Indirect 7100-7299, Costs) 7400-7499 0.00 0.00 0.0%
8) Other Outgo - Transfers of Indirect Costs 7300-7399 111,788.63 174,639.07 56.2%
9) TOTAL, EXPENDITURES 2,140,446.58 2,670,646.00 24.8%
C. EXCESS (DEFICIENCY) OF REVENUES OVER EXPENDITURES BEFORE OTHER FINANCING SOURCES AND USES (A5 - B9) 13,139.05 0.00 -100.0%
D. OTHER FINANCING SOURCES/USES 1) Interfund Transfers a) Transfers In 8900-8929 2,171.05 0.00 -100.0%
b) Transfers Out 7600-7629 0.00 0.00 0.0%
2) Other Sources/Uses a) Sources 8930-8979 0.00 0.00 0.0%
b) Uses 7630-7699 0.00 0.00 0.0%
3) Contributions 8980-8999 0.00 0.00 0.0%
4) TOTAL, OTHER FINANCING SOURCES/USES 2,171.05 0.00 -100.0%

Monterey Peninsula UnifiedMonterey County
Unaudited ActualsChild Development FundExpenditures by Object
27 66092 0000000Form 12
California Dept of EducationSACS Financial Reporting Software - 2017.2.0File: fund-b (Rev 06/08/2017 Page 2 Printed: 9/6/2017 2:41 PM
Description Resource Codes Object Codes2016-17
Unaudited Actuals2017-18Budget
PercentDifference
E. NET INCREASE (DECREASE) IN FUND BALANCE (C + D4) 15,310.10 0.00 -100.0%
F. FUND BALANCE, RESERVES 1) Beginning Fund Balance a) As of July 1 - Unaudited 9791 692.08 16,002.18 2212.2%
b) Audit Adjustments 9793 0.00 0.00 0.0%
c) As of July 1 - Audited (F1a + F1b) 692.08 16,002.18 2212.2%
d) Other Restatements 9795 0.00 0.00 0.0%
e) Adjusted Beginning Balance (F1c + F1d) 692.08 16,002.18 2212.2%
2) Ending Balance, June 30 (E + F1e) 16,002.18 16,002.18 0.0% Components of Ending Fund Balance a) Nonspendable Revolving Cash 9711 0.00 0.00 0.0%
Stores 9712 0.00 0.00 0.0%
Prepaid Expenditures 9713 0.00 0.00 0.0%
All Others 9719 0.00 0.00 0.0%
b) Restricted 9740 16,002.18 16,002.18 0.0%
c) Committed Stabilization Arrangements 9750 0.00 0.00 0.0%
Other Commitments 9760 0.00 0.00 0.0%
d) Assigned Other Assignments 9780 0.00 0.00 0.0%
e) Unassigned/Unappropriated Reserve for Economic Uncertainties 9789 0.00 0.00 0.0%
Unassigned/Unappropriated Amount 9790 0.00 0.00 0.0%
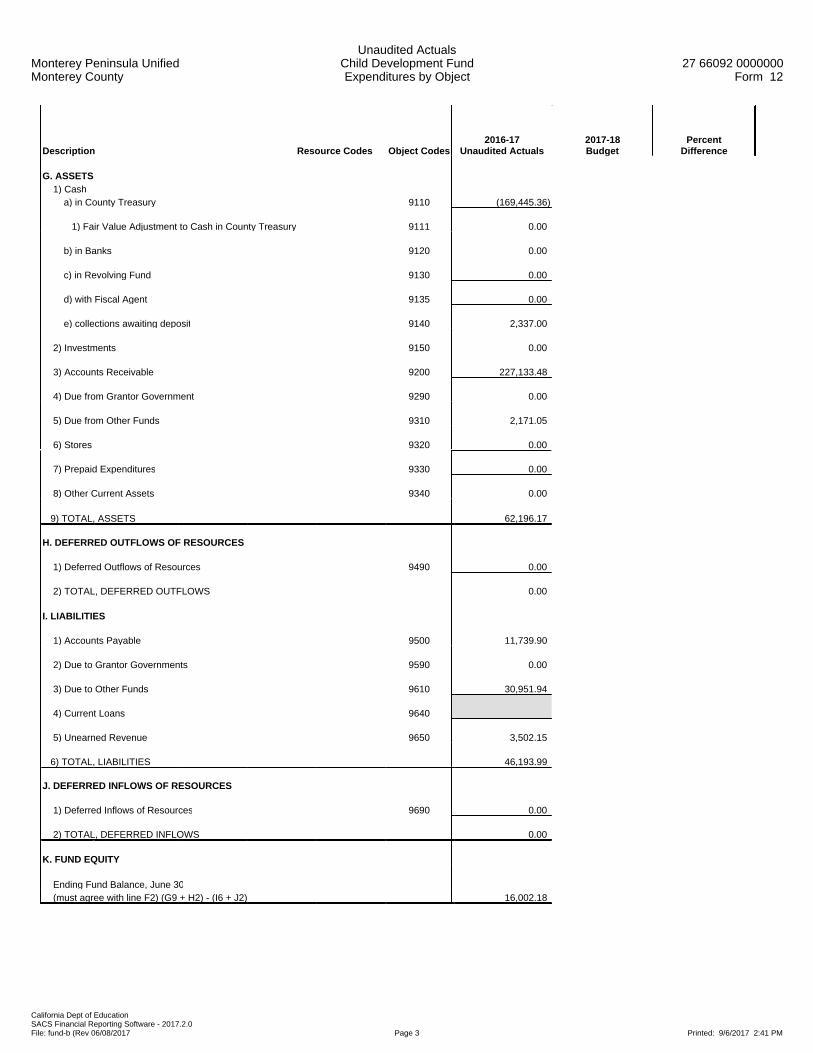
Monterey Peninsula UnifiedMonterey County
Unaudited ActualsChild Development FundExpenditures by Object
27 66092 0000000Form 12
California Dept of EducationSACS Financial Reporting Software - 2017.2.0File: fund-b (Rev 06/08/2017 Page 3 Printed: 9/6/2017 2:41 PM
Description Resource Codes Object Codes2016-17
Unaudited Actuals2017-18Budget
PercentDifference
G. ASSETS 1) Cash a) in County Treasury 9110 (169,445.36)
1) Fair Value Adjustment to Cash in County Treasury 9111 0.00
b) in Banks 9120 0.00
c) in Revolving Fund 9130 0.00
d) with Fiscal Agent 9135 0.00
e) collections awaiting deposit 9140 2,337.00
2) Investments 9150 0.00
3) Accounts Receivable 9200 227,133.48
4) Due from Grantor Government 9290 0.00
5) Due from Other Funds 9310 2,171.05
6) Stores 9320 0.00
7) Prepaid Expenditures 9330 0.00
8) Other Current Assets 9340 0.00
9) TOTAL, ASSETS 62,196.17
H. DEFERRED OUTFLOWS OF RESOURCES
1) Deferred Outflows of Resources 9490 0.00
2) TOTAL, DEFERRED OUTFLOWS 0.00
I. LIABILITIES
1) Accounts Payable 9500 11,739.90
2) Due to Grantor Governments 9590 0.00
3) Due to Other Funds 9610 30,951.94
4) Current Loans 9640
5) Unearned Revenue 9650 3,502.15
6) TOTAL, LIABILITIES 46,193.99
J. DEFERRED INFLOWS OF RESOURCES
1) Deferred Inflows of Resources 9690 0.00
2) TOTAL, DEFERRED INFLOWS 0.00
K. FUND EQUITY
Ending Fund Balance, June 30 (must agree with line F2) (G9 + H2) - (I6 + J2) 16,002.18

Monterey Peninsula UnifiedMonterey County
Unaudited ActualsChild Development FundExpenditures by Object
27 66092 0000000Form 12
California Dept of EducationSACS Financial Reporting Software - 2017.2.0File: fund-b (Rev 06/08/2017 Page 4 Printed: 9/6/2017 2:41 PM
Description Resource Codes Object Codes2016-17
Unaudited Actuals2017-18Budget
PercentDifference
FEDERAL REVENUE
Child Nutrition Programs 8220 0.00 0.00 0.0%
Interagency Contracts Between LEAs 8285 0.00 0.00 0.0%
Title I, Part A, Basic 3010 8290 0.00 0.00 0.0%
All Other Federal Revenue All Other 8290 454,248.05 454,245.00 0.0%
TOTAL, FEDERAL REVENUE 454,248.05 454,245.00 0.0%
OTHER STATE REVENUE
Child Nutrition Programs 8520 0.00 0.00 0.0%
Child Development Apportionments 8530 0.00 0.00 0.0%
Pass-Through Revenues from State Sources 8587 0.00 0.00 0.0%
State Preschool 6105 8590 1,638,698.11 2,159,487.00 31.8%
All Other State Revenue All Other 8590 40,225.00 56,914.00 41.5%
TOTAL, OTHER STATE REVENUE 1,678,923.11 2,216,401.00 32.0%
OTHER LOCAL REVENUE
Other Local Revenue
Sales Sale of Equipment/Supplies 8631 0.00 0.00 0.0%
Food Service Sales 8634 0.00 0.00 0.0%
Interest 8660 (2,881.19) 0.00 -100.0%
Net Increase (Decrease) in the Fair Value of Investments 8662 0.00 0.00 0.0%
Fees and Contracts
Child Development Parent Fees 8673 20,380.24 0.00 -100.0%
Interagency Services 8677 0.00 0.00 0.0%
All Other Fees and Contracts 8689 0.00 0.00 0.0%
Other Local Revenue
All Other Local Revenue 8699 2,915.42 0.00 -100.0%
All Other Transfers In from All Others 8799 0.00 0.00 0.0%
TOTAL, OTHER LOCAL REVENUE 20,414.47 0.00 -100.0%
TOTAL, REVENUES 2,153,585.63 2,670,646.00 24.0%

Monterey Peninsula UnifiedMonterey County
Unaudited ActualsChild Development FundExpenditures by Object
27 66092 0000000Form 12
California Dept of EducationSACS Financial Reporting Software - 2017.2.0File: fund-b (Rev 06/08/2017 Page 5 Printed: 9/6/2017 2:41 PM
Description Resource Codes Object Codes2016-17
Unaudited Actuals2017-18Budget
PercentDifference
CERTIFICATED SALARIES
Certificated Teachers' Salaries 1100 413,762.52 501,513.69 21.2%
Certificated Pupil Support Salaries 1200 0.00 0.00 0.0%
Certificated Supervisors' and Administrators' Salaries 1300 171,752.99 211,221.84 23.0%
Other Certificated Salaries 1900 2,184.00 0.00 -100.0%
TOTAL, CERTIFICATED SALARIES 587,699.51 712,735.53 21.3%
CLASSIFIED SALARIES
Classified Instructional Salaries 2100 566,088.79 659,618.37 16.5%
Classified Support Salaries 2200 47,713.94 43,347.96 -9.2%
Classified Supervisors' and Administrators' Salaries 2300 0.00 0.00 0.0%
Clerical, Technical and Office Salaries 2400 149,095.30 172,008.80 15.4%
Other Classified Salaries 2900 42.50 0.00 -100.0%
TOTAL, CLASSIFIED SALARIES 762,940.53 874,975.13 14.7%
EMPLOYEE BENEFITS
STRS 3101-3102 108,502.58 150,550.07 38.8%
PERS 3201-3202 100,157.48 131,340.67 31.1%
OASDI/Medicare/Alternative 3301-3302 67,557.34 80,662.07 19.4%
Health and Welfare Benefits 3401-3402 255,549.10 311,031.11 21.7%
Unemployment Insurance 3501-3502 674.31 793.78 17.7%
Workers' Compensation 3601-3602 61,148.56 71,955.00 17.7%
OPEB, Allocated 3701-3702 5,101.58 4,633.55 -9.2%
OPEB, Active Employees 3751-3752 15,007.19 15,663.49 4.4%
Other Employee Benefits 3901-3902 0.00 0.00 0.0%
TOTAL, EMPLOYEE BENEFITS 613,698.14 766,629.74 24.9%
BOOKS AND SUPPLIES
Approved Textbooks and Core Curricula Materials 4100 0.00 0.00 0.0%
Books and Other Reference Materials 4200 0.00 0.00 0.0%
Materials and Supplies 4300 10,504.62 117,184.27 1015.5%
Noncapitalized Equipment 4400 0.00 840.26 New
Food 4700 0.00 0.00 0.0%
TOTAL, BOOKS AND SUPPLIES 10,504.62 118,024.53 1023.5%

Monterey Peninsula UnifiedMonterey County
Unaudited ActualsChild Development FundExpenditures by Object
27 66092 0000000Form 12
California Dept of EducationSACS Financial Reporting Software - 2017.2.0File: fund-b (Rev 06/08/2017 Page 6 Printed: 9/6/2017 2:41 PM
Description Resource Codes Object Codes2016-17
Unaudited Actuals2017-18Budget
PercentDifference
SERVICES AND OTHER OPERATING EXPENDITURES
Subagreements for Services 5100 0.00 0.00 0.0%
Travel and Conferences 5200 100.00 0.00 -100.0%
Dues and Memberships 5300 0.00 0.00 0.0%
Insurance 5400-5450 0.00 0.00 0.0%
Operations and Housekeeping Services 5500 0.00 0.00 0.0%
Rentals, Leases, Repairs, and Noncapitalized Improvements 5600 2,410.55 1,500.00 -37.8%
Transfers of Direct Costs 5710 0.00 0.00 0.0%
Transfers of Direct Costs - Interfund 5750 41,196.86 17,600.00 -57.3%
Professional/Consulting Services and Operating Expenditures 5800 9,997.00 4,542.00 -54.6%
Communications 5900 110.74 0.00 -100.0%
TOTAL, SERVICES AND OTHER OPERATING EXPENDITURES 53,815.15 23,642.00 -56.1%
CAPITAL OUTLAY
Land 6100 0.00 0.00 0.0%
Land Improvements 6170 0.00 0.00 0.0%
Buildings and Improvements of Buildings 6200 0.00 0.00 0.0%
Equipment 6400 0.00 0.00 0.0%
Equipment Replacement 6500 0.00 0.00 0.0%
TOTAL, CAPITAL OUTLAY 0.00 0.00 0.0%
OTHER OUTGO (excluding Transfers of Indirect Costs)
Other Transfers Out
All Other Transfers Out to All Others 7299 0.00 0.00 0.0%
Debt Service
Debt Service - Interest 7438 0.00 0.00 0.0%
Other Debt Service - Principal 7439 0.00 0.00 0.0%
TOTAL, OTHER OUTGO (excluding Transfers of Indirect Costs) 0.00 0.00 0.0%
OTHER OUTGO - TRANSFERS OF INDIRECT COSTS
Transfers of Indirect Costs - Interfund 7350 111,788.63 174,639.07 56.2%
TOTAL, OTHER OUTGO - TRANSFERS OF INDIRECT COSTS 111,788.63 174,639.07 56.2%
TOTAL, EXPENDITURES 2,140,446.58 2,670,646.00 24.8%
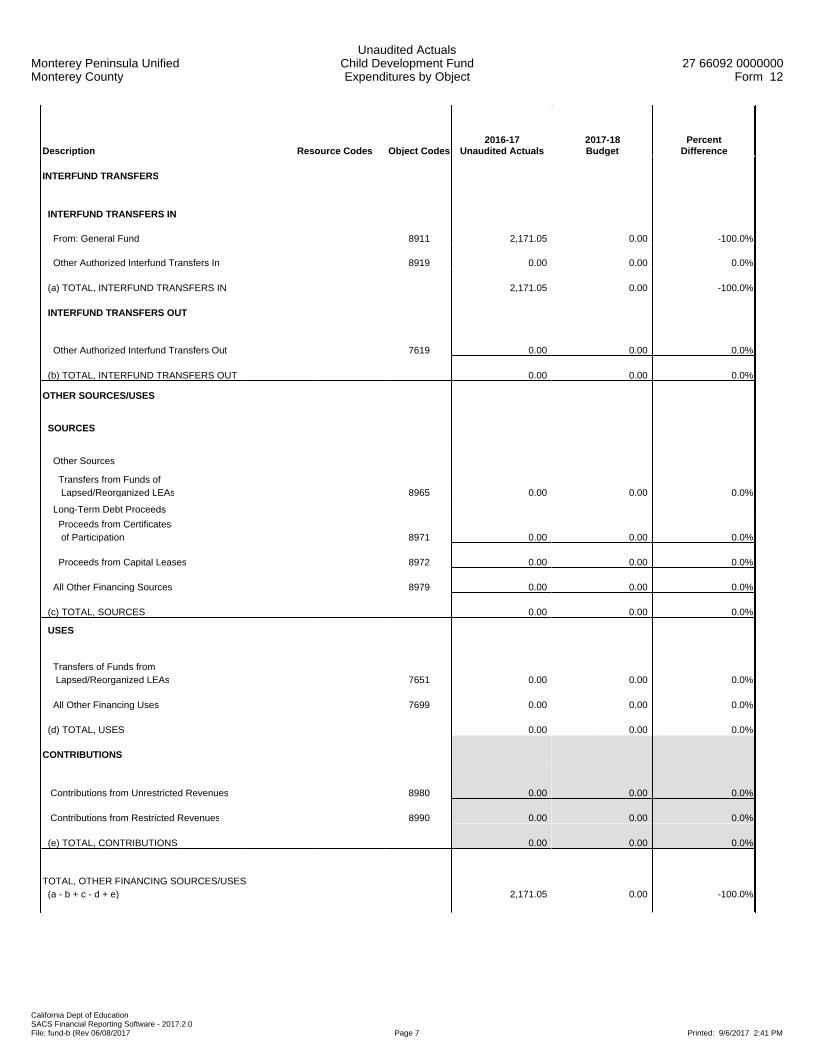
Monterey Peninsula UnifiedMonterey County
Unaudited ActualsChild Development FundExpenditures by Object
27 66092 0000000Form 12
California Dept of EducationSACS Financial Reporting Software - 2017.2.0File: fund-b (Rev 06/08/2017 Page 7 Printed: 9/6/2017 2:41 PM
Description Resource Codes Object Codes2016-17
Unaudited Actuals2017-18Budget
PercentDifference
INTERFUND TRANSFERS
INTERFUND TRANSFERS IN
From: General Fund 8911 2,171.05 0.00 -100.0%
Other Authorized Interfund Transfers In 8919 0.00 0.00 0.0%
(a) TOTAL, INTERFUND TRANSFERS IN 2,171.05 0.00 -100.0%
INTERFUND TRANSFERS OUT
Other Authorized Interfund Transfers Out 7619 0.00 0.00 0.0%
(b) TOTAL, INTERFUND TRANSFERS OUT 0.00 0.00 0.0%
OTHER SOURCES/USES
SOURCES
Other Sources
Transfers from Funds of Lapsed/Reorganized LEAs 8965 0.00 0.00 0.0%
Long-Term Debt Proceeds
Proceeds from Certificates of Participation 8971 0.00 0.00 0.0%
Proceeds from Capital Leases 8972 0.00 0.00 0.0%
All Other Financing Sources 8979 0.00 0.00 0.0%
(c) TOTAL, SOURCES 0.00 0.00 0.0%
USES
Transfers of Funds from Lapsed/Reorganized LEAs 7651 0.00 0.00 0.0%
All Other Financing Uses 7699 0.00 0.00 0.0%
(d) TOTAL, USES 0.00 0.00 0.0%
CONTRIBUTIONS
Contributions from Unrestricted Revenues 8980 0.00 0.00 0.0%
Contributions from Restricted Revenues 8990 0.00 0.00 0.0%
(e) TOTAL, CONTRIBUTIONS 0.00 0.00 0.0%
TOTAL, OTHER FINANCING SOURCES/USES (a - b + c - d + e) 2,171.05 0.00 -100.0%

Monterey Peninsula UnifiedMonterey County
Unaudited ActualsChild Development FundExpenditures by Function
27 66092 0000000Form 12
California Dept of EducationSACS Financial Reporting Software - 2017.2.0File: fund-b (Rev 03/08/2016) Page 1 Printed: 9/6/2017 2:41 PM
Description Function Codes Object Codes2016-17
Unaudited Actuals2017-18Budget
PercentDifference
A. REVENUES
1) LCFF Sources 8010-8099 0.00 0.00 0.0%
2) Federal Revenue 8100-8299 454,248.05 454,245.00 0.0%
3) Other State Revenue 8300-8599 1,678,923.11 2,216,401.00 32.0%
4) Other Local Revenue 8600-8799 20,414.47 0.00 -100.0%
5) TOTAL, REVENUES 2,153,585.63 2,670,646.00 24.0%
B. EXPENDITURES (Objects 1000-7999)
1) Instruction 1000-1999 1,514,890.77 1,897,204.79 25.2%
2) Instruction - Related Services 2000-2999 345,694.12 397,926.68 15.1%
3) Pupil Services 3000-3999 99,477.42 136,300.10 37.0%
4) Ancillary Services 4000-4999 0.00 0.00 0.0%
5) Community Services 5000-5999 0.00 0.00 0.0%
6) Enterprise 6000-6999 0.00 0.00 0.0%
7) General Administration 7000-7999 111,788.63 174,639.07 56.2%
8) Plant Services 8000-8999 68,595.64 64,575.36 -5.9%
9) Other Outgo 9000-9999Except
7600-7699 0.00 0.00 0.0%
10) TOTAL, EXPENDITURES 2,140,446.58 2,670,646.00 24.8%
C. EXCESS (DEFICIENCY) OF REVENUES OVER EXPENDITURES BEFORE OTHER FINANCING SOURCES AND USES (A5 - B10) 13,139.05 0.00 -100.0%
D. OTHER FINANCING SOURCES/USES 1) Interfund Transfers a) Transfers In 8900-8929 2,171.05 0.00 -100.0%
b) Transfers Out 7600-7629 0.00 0.00 0.0%
2) Other Sources/Uses a) Sources 8930-8979 0.00 0.00 0.0%
b) Uses 7630-7699 0.00 0.00 0.0%
3) Contributions 8980-8999 0.00 0.00 0.0%
4) TOTAL, OTHER FINANCING SOURCES/USES 2,171.05 0.00 -100.0%
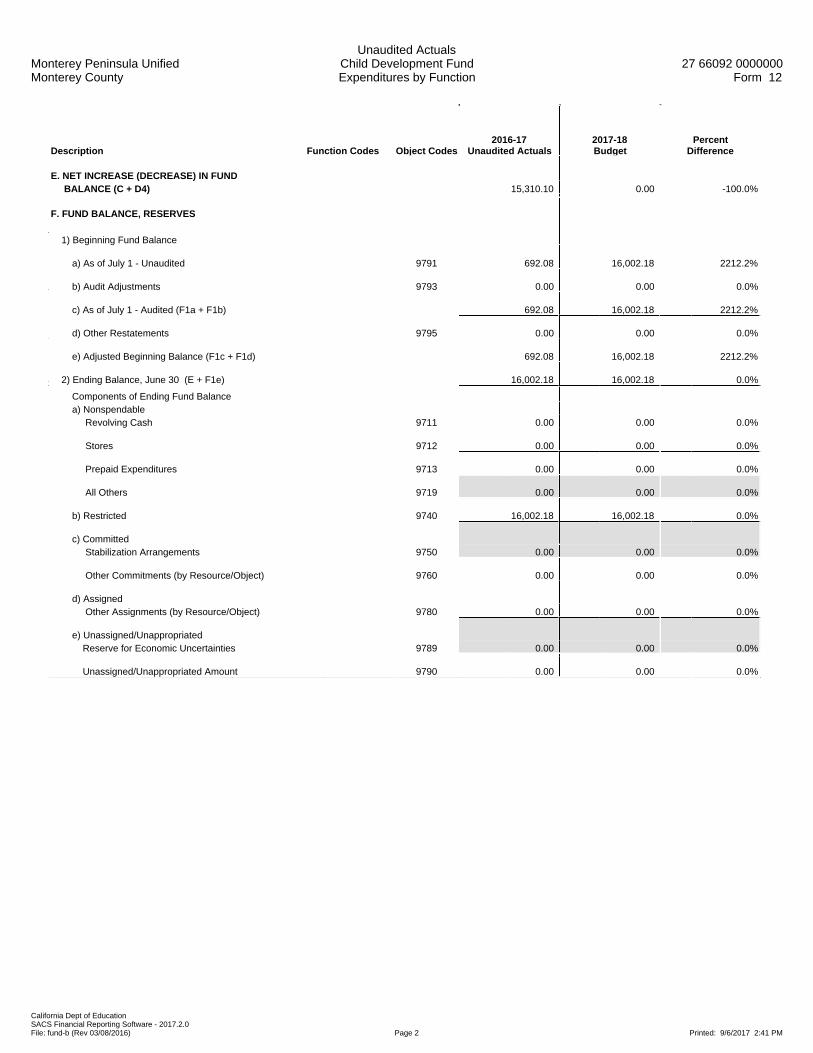
Monterey Peninsula UnifiedMonterey County
Unaudited ActualsChild Development FundExpenditures by Function
27 66092 0000000Form 12
California Dept of EducationSACS Financial Reporting Software - 2017.2.0File: fund-b (Rev 03/08/2016) Page 2 Printed: 9/6/2017 2:41 PM
Description Function Codes Object Codes2016-17
Unaudited Actuals2017-18Budget
PercentDifference
E. NET INCREASE (DECREASE) IN FUND BALANCE (C + D4) 15,310.10 0.00 -100.0%
F. FUND BALANCE, RESERVES 1) Beginning Fund Balance
a) As of July 1 - Unaudited 9791 692.08 16,002.18 2212.2%
b) Audit Adjustments 9793 0.00 0.00 0.0%
c) As of July 1 - Audited (F1a + F1b) 692.08 16,002.18 2212.2%
d) Other Restatements 9795 0.00 0.00 0.0%
e) Adjusted Beginning Balance (F1c + F1d) 692.08 16,002.18 2212.2%
2) Ending Balance, June 30 (E + F1e) 16,002.18 16,002.18 0.0%
Components of Ending Fund Balance a) Nonspendable Revolving Cash 9711 0.00 0.00 0.0%
Stores 9712 0.00 0.00 0.0%
Prepaid Expenditures 9713 0.00 0.00 0.0%
All Others 9719 0.00 0.00 0.0%
b) Restricted 9740 16,002.18 16,002.18 0.0%
c) Committed Stabilization Arrangements 9750 0.00 0.00 0.0%
Other Commitments (by Resource/Object) 9760 0.00 0.00 0.0%
d) Assigned Other Assignments (by Resource/Object) 9780 0.00 0.00 0.0%
e) Unassigned/Unappropriated Reserve for Economic Uncertainties 9789 0.00 0.00 0.0%
Unassigned/Unappropriated Amount 9790 0.00 0.00 0.0%

Monterey Peninsula UnifiedMonterey County
Unaudited ActualsChild Development Fund
Exhibit: Restricted Balance Detail27 66092 0000000
Form 12
California Dept of EducationSACS Financial Reporting Software - 2017.2.0File: fund-b (Rev 11/14/2012) Page 1 Printed: 9/6/2017 2:41 PM
2016-17 2017-18Resource Description Unaudited Actuals Budget
6130 Child Development: Center-Based Reserve Account 15,802.90 15,802.90
9010 Other Restricted Local 199.28 199.28
Total, Restricted Balance 16,002.18 16,002.18

Monterey Peninsula UnifiedMonterey County
Unaudited ActualsCafeteria Special Revenue Fund
Expenditures by Object27 66092 0000000
Form 13
California Dept of EducationSACS Financial Reporting Software - 2017.2.0File: fund-b (Rev 06/08/2017 Page 1 Printed: 9/6/2017 2:42 PM
Description Resource Codes Object Codes2016-17
Unaudited Actuals2017-18Budget
PercentDifference
A. REVENUES
1) LCFF Sources 8010-8099 0.00 0.00 0.0%
2) Federal Revenue 8100-8299 4,065,601.11 3,928,000.00 -3.4%
3) Other State Revenue 8300-8599 287,114.55 285,000.00 -0.7%
4) Other Local Revenue 8600-8799 744,632.31 761,983.75 2.3%
5) TOTAL, REVENUES 5,097,347.97 4,974,983.75 -2.4%
B. EXPENDITURES
1) Certificated Salaries 1000-1999 0.00 0.00 0.0%
2) Classified Salaries 2000-2999 1,696,301.39 1,862,991.86 9.8%
3) Employee Benefits 3000-3999 605,100.87 712,665.25 17.8%
4) Books and Supplies 4000-4999 2,208,108.04 2,701,355.69 22.3%
5) Services and Other Operating Expenditures 5000-5999 80,209.65 221,136.25 175.7%
6) Capital Outlay 6000-6999 63,522.42 200,000.00 214.8%
7) Other Outgo (excluding Transfers of Indirect 7100-7299, Costs) 7400-7499 0.00 0.00 0.0%
8) Other Outgo - Transfers of Indirect Costs 7300-7399 225,555.61 288,652.82 28.0%
9) TOTAL, EXPENDITURES 4,878,797.98 5,986,801.87 22.7%
C. EXCESS (DEFICIENCY) OF REVENUES OVER EXPENDITURES BEFORE OTHER FINANCING SOURCES AND USES (A5 - B9) 218,549.99 (1,011,818.12) -563.0%
D. OTHER FINANCING SOURCES/USES 1) Interfund Transfers a) Transfers In 8900-8929 300.44 0.00 -100.0%
b) Transfers Out 7600-7629 0.00 0.00 0.0%
2) Other Sources/Uses a) Sources 8930-8979 0.00 0.00 0.0%
b) Uses 7630-7699 0.00 0.00 0.0%
3) Contributions 8980-8999 0.00 0.00 0.0%
4) TOTAL, OTHER FINANCING SOURCES/USES 300.44 0.00 -100.0%

Monterey Peninsula UnifiedMonterey County
Unaudited ActualsCafeteria Special Revenue Fund
Expenditures by Object27 66092 0000000
Form 13
California Dept of EducationSACS Financial Reporting Software - 2017.2.0File: fund-b (Rev 06/08/2017 Page 2 Printed: 9/6/2017 2:42 PM
Description Resource Codes Object Codes2016-17
Unaudited Actuals2017-18Budget
PercentDifference
E. NET INCREASE (DECREASE) IN FUND BALANCE (C + D4) 218,850.43 (1,011,818.12) -562.3%
F. FUND BALANCE, RESERVES 1) Beginning Fund Balance a) As of July 1 - Unaudited 9791 1,831,129.84 2,049,980.27 12.0%
b) Audit Adjustments 9793 0.00 0.00 0.0%
c) As of July 1 - Audited (F1a + F1b) 1,831,129.84 2,049,980.27 12.0%
d) Other Restatements 9795 0.00 0.00 0.0%
e) Adjusted Beginning Balance (F1c + F1d) 1,831,129.84 2,049,980.27 12.0%
2) Ending Balance, June 30 (E + F1e) 2,049,980.27 1,038,162.15 -49.4% Components of Ending Fund Balance a) Nonspendable Revolving Cash 9711 0.00 0.00 0.0%
Stores 9712 266,406.75 0.00 -100.0%
Prepaid Expenditures 9713 0.00 0.00 0.0%
All Others 9719 0.00 0.00 0.0%
b) Restricted 9740 1,783,573.52 1,038,162.15 -41.8%
c) Committed Stabilization Arrangements 9750 0.00 0.00 0.0%
Other Commitments 9760 0.00 0.00 0.0%
d) Assigned Other Assignments 9780 0.00 0.00 0.0%
e) Unassigned/Unappropriated Reserve for Economic Uncertainties 9789 0.00 0.00 0.0%
Unassigned/Unappropriated Amount 9790 0.00 0.00 0.0%

Monterey Peninsula UnifiedMonterey County
Unaudited ActualsCafeteria Special Revenue Fund
Expenditures by Object27 66092 0000000
Form 13
California Dept of EducationSACS Financial Reporting Software - 2017.2.0File: fund-b (Rev 06/08/2017 Page 3 Printed: 9/6/2017 2:42 PM
Description Resource Codes Object Codes2016-17
Unaudited Actuals2017-18Budget
PercentDifference
G. ASSETS 1) Cash a) in County Treasury 9110 723,657.88
1) Fair Value Adjustment to Cash in County Treasury 9111 0.00
b) in Banks 9120 6,373.80
c) in Revolving Fund 9130 0.00
d) with Fiscal Agent 9135 0.00
e) collections awaiting deposit 9140 153,228.14
2) Investments 9150 0.00
3) Accounts Receivable 9200 999,674.96
4) Due from Grantor Government 9290 0.00
5) Due from Other Funds 9310 0.01
6) Stores 9320 266,406.75
7) Prepaid Expenditures 9330 0.00
8) Other Current Assets 9340 0.00
9) TOTAL, ASSETS 2,149,341.54
H. DEFERRED OUTFLOWS OF RESOURCES
1) Deferred Outflows of Resources 9490 0.00
2) TOTAL, DEFERRED OUTFLOWS 0.00
I. LIABILITIES
1) Accounts Payable 9500 28,680.72
2) Due to Grantor Governments 9590 0.00
3) Due to Other Funds 9610 70,680.55
4) Current Loans 9640
5) Unearned Revenue 9650 0.00
6) TOTAL, LIABILITIES 99,361.27
J. DEFERRED INFLOWS OF RESOURCES
1) Deferred Inflows of Resources 9690 0.00
2) TOTAL, DEFERRED INFLOWS 0.00
K. FUND EQUITY
Ending Fund Balance, June 30 (must agree with line F2) (G9 + H2) - (I6 + J2) 2,049,980.27

Monterey Peninsula UnifiedMonterey County
Unaudited ActualsCafeteria Special Revenue Fund
Expenditures by Object27 66092 0000000
Form 13
California Dept of EducationSACS Financial Reporting Software - 2017.2.0File: fund-b (Rev 06/08/2017 Page 4 Printed: 9/6/2017 2:42 PM
Description Resource Codes Object Codes2016-17
Unaudited Actuals2017-18Budget
PercentDifference
FEDERAL REVENUE
Child Nutrition Programs 8220 3,739,843.04 3,928,000.00 5.0%
Donated Food Commodities 8221 312,689.83 0.00 -100.0%
All Other Federal Revenue 8290 13,068.24 0.00 -100.0%
TOTAL, FEDERAL REVENUE 4,065,601.11 3,928,000.00 -3.4%
OTHER STATE REVENUE
Child Nutrition Programs 8520 287,114.55 285,000.00 -0.7%
All Other State Revenue 8590 0.00 0.00 0.0%
TOTAL, OTHER STATE REVENUE 287,114.55 285,000.00 -0.7%
OTHER LOCAL REVENUE
Other Local Revenue
Sales Sale of Equipment/Supplies 8631 2,772.32 0.00 -100.0%
Food Service Sales 8634 725,173.77 750,000.00 3.4%
Leases and Rentals 8650 0.00 0.00 0.0%
Interest 8660 11,180.72 8,000.00 -28.4%
Net Increase (Decrease) in the Fair Value of Investments 8662 0.00 0.00 0.0%
Fees and Contracts
Interagency Services 8677 5,254.74 3,683.75 -29.9%
Other Local Revenue
All Other Local Revenue 8699 250.76 300.00 19.6%
TOTAL, OTHER LOCAL REVENUE 744,632.31 761,983.75 2.3%
TOTAL, REVENUES 5,097,347.97 4,974,983.75 -2.4%
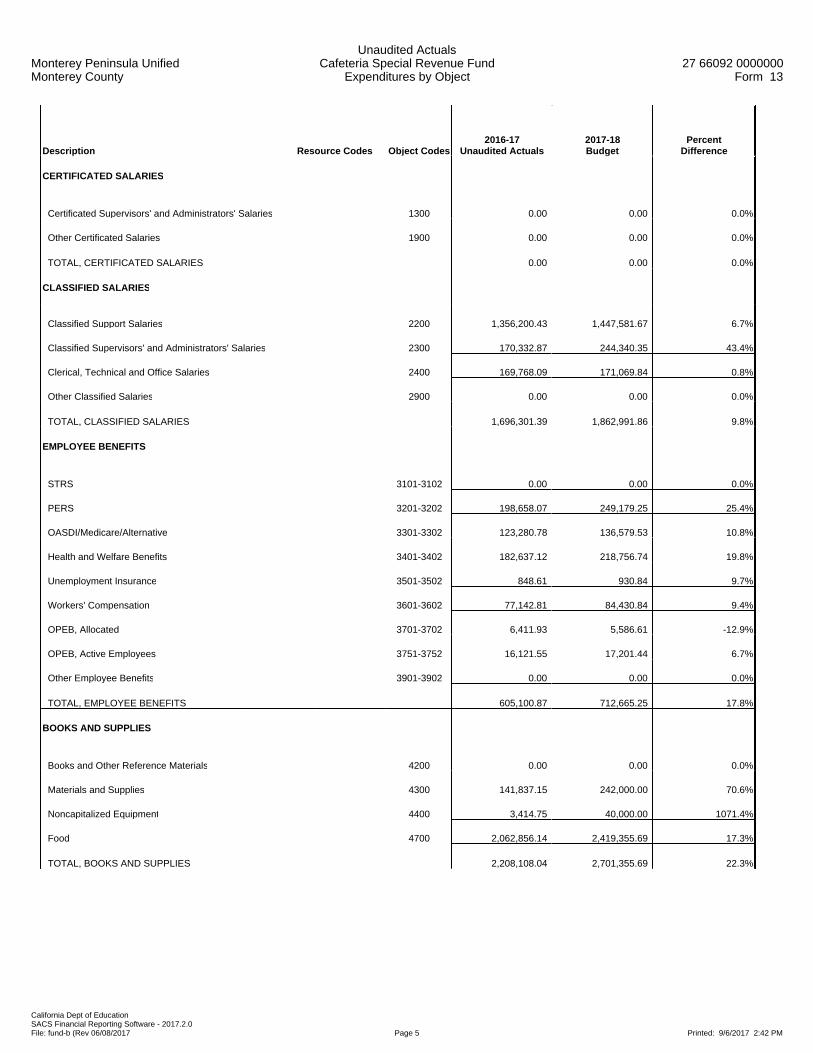
Monterey Peninsula UnifiedMonterey County
Unaudited ActualsCafeteria Special Revenue Fund
Expenditures by Object27 66092 0000000
Form 13
California Dept of EducationSACS Financial Reporting Software - 2017.2.0File: fund-b (Rev 06/08/2017 Page 5 Printed: 9/6/2017 2:42 PM
Description Resource Codes Object Codes2016-17
Unaudited Actuals2017-18Budget
PercentDifference
CERTIFICATED SALARIES
Certificated Supervisors' and Administrators' Salaries 1300 0.00 0.00 0.0%
Other Certificated Salaries 1900 0.00 0.00 0.0%
TOTAL, CERTIFICATED SALARIES 0.00 0.00 0.0%
CLASSIFIED SALARIES
Classified Support Salaries 2200 1,356,200.43 1,447,581.67 6.7%
Classified Supervisors' and Administrators' Salaries 2300 170,332.87 244,340.35 43.4%
Clerical, Technical and Office Salaries 2400 169,768.09 171,069.84 0.8%
Other Classified Salaries 2900 0.00 0.00 0.0%
TOTAL, CLASSIFIED SALARIES 1,696,301.39 1,862,991.86 9.8%
EMPLOYEE BENEFITS
STRS 3101-3102 0.00 0.00 0.0%
PERS 3201-3202 198,658.07 249,179.25 25.4%
OASDI/Medicare/Alternative 3301-3302 123,280.78 136,579.53 10.8%
Health and Welfare Benefits 3401-3402 182,637.12 218,756.74 19.8%
Unemployment Insurance 3501-3502 848.61 930.84 9.7%
Workers' Compensation 3601-3602 77,142.81 84,430.84 9.4%
OPEB, Allocated 3701-3702 6,411.93 5,586.61 -12.9%
OPEB, Active Employees 3751-3752 16,121.55 17,201.44 6.7%
Other Employee Benefits 3901-3902 0.00 0.00 0.0%
TOTAL, EMPLOYEE BENEFITS 605,100.87 712,665.25 17.8%
BOOKS AND SUPPLIES
Books and Other Reference Materials 4200 0.00 0.00 0.0%
Materials and Supplies 4300 141,837.15 242,000.00 70.6%
Noncapitalized Equipment 4400 3,414.75 40,000.00 1071.4%
Food 4700 2,062,856.14 2,419,355.69 17.3%
TOTAL, BOOKS AND SUPPLIES 2,208,108.04 2,701,355.69 22.3%
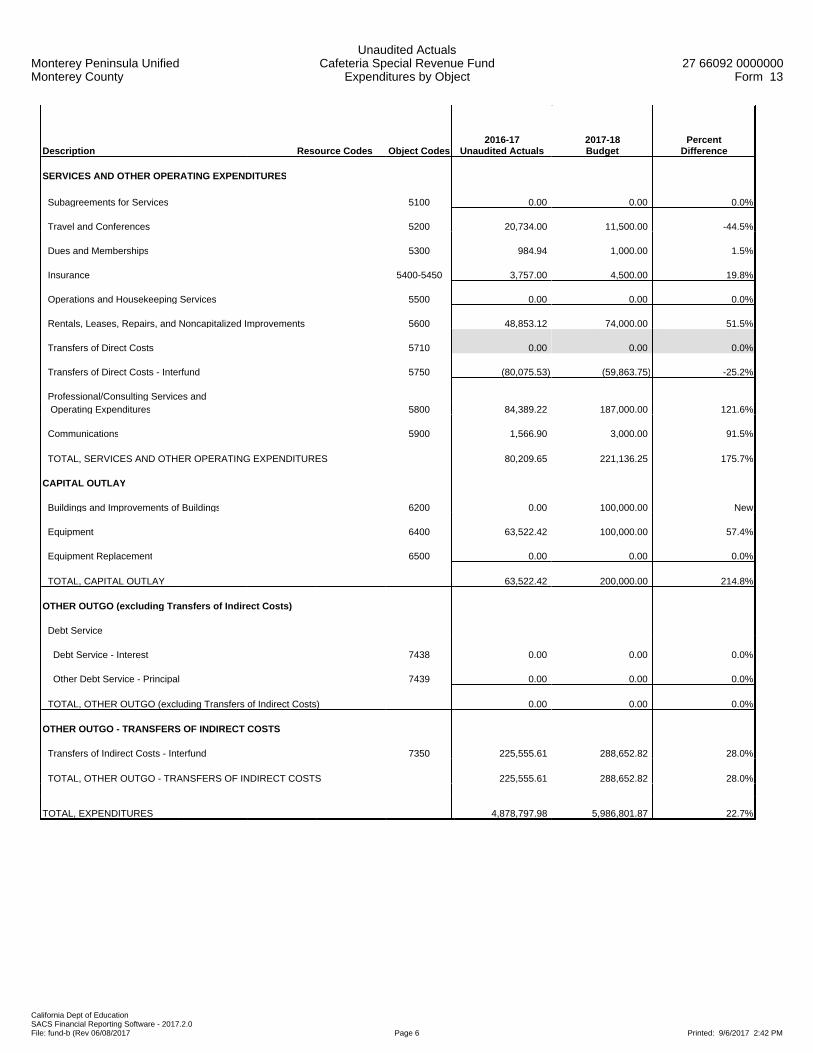
Monterey Peninsula UnifiedMonterey County
Unaudited ActualsCafeteria Special Revenue Fund
Expenditures by Object27 66092 0000000
Form 13
California Dept of EducationSACS Financial Reporting Software - 2017.2.0File: fund-b (Rev 06/08/2017 Page 6 Printed: 9/6/2017 2:42 PM
Description Resource Codes Object Codes2016-17
Unaudited Actuals2017-18Budget
PercentDifference
SERVICES AND OTHER OPERATING EXPENDITURES
Subagreements for Services 5100 0.00 0.00 0.0%
Travel and Conferences 5200 20,734.00 11,500.00 -44.5%
Dues and Memberships 5300 984.94 1,000.00 1.5%
Insurance 5400-5450 3,757.00 4,500.00 19.8%
Operations and Housekeeping Services 5500 0.00 0.00 0.0%
Rentals, Leases, Repairs, and Noncapitalized Improvements 5600 48,853.12 74,000.00 51.5%
Transfers of Direct Costs 5710 0.00 0.00 0.0%
Transfers of Direct Costs - Interfund 5750 (80,075.53) (59,863.75) -25.2%
Professional/Consulting Services and Operating Expenditures 5800 84,389.22 187,000.00 121.6%
Communications 5900 1,566.90 3,000.00 91.5%
TOTAL, SERVICES AND OTHER OPERATING EXPENDITURES 80,209.65 221,136.25 175.7%
CAPITAL OUTLAY
Buildings and Improvements of Buildings 6200 0.00 100,000.00 New
Equipment 6400 63,522.42 100,000.00 57.4%
Equipment Replacement 6500 0.00 0.00 0.0%
TOTAL, CAPITAL OUTLAY 63,522.42 200,000.00 214.8%
OTHER OUTGO (excluding Transfers of Indirect Costs)
Debt Service
Debt Service - Interest 7438 0.00 0.00 0.0%
Other Debt Service - Principal 7439 0.00 0.00 0.0%
TOTAL, OTHER OUTGO (excluding Transfers of Indirect Costs) 0.00 0.00 0.0%
OTHER OUTGO - TRANSFERS OF INDIRECT COSTS
Transfers of Indirect Costs - Interfund 7350 225,555.61 288,652.82 28.0%
TOTAL, OTHER OUTGO - TRANSFERS OF INDIRECT COSTS 225,555.61 288,652.82 28.0%
TOTAL, EXPENDITURES 4,878,797.98 5,986,801.87 22.7%

Monterey Peninsula UnifiedMonterey County
Unaudited ActualsCafeteria Special Revenue Fund
Expenditures by Object27 66092 0000000
Form 13
California Dept of EducationSACS Financial Reporting Software - 2017.2.0File: fund-b (Rev 06/08/2017 Page 7 Printed: 9/6/2017 2:42 PM
Description Resource Codes Object Codes2016-17
Unaudited Actuals2017-18Budget
PercentDifference
INTERFUND TRANSFERS
INTERFUND TRANSFERS IN
From: General Fund 8916 300.44 0.00 -100.0%
Other Authorized Interfund Transfers In 8919 0.00 0.00 0.0%
(a) TOTAL, INTERFUND TRANSFERS IN 300.44 0.00 -100.0%
INTERFUND TRANSFERS OUT
Other Authorized Interfund Transfers Out 7619 0.00 0.00 0.0%
(b) TOTAL, INTERFUND TRANSFERS OUT 0.00 0.00 0.0%
OTHER SOURCES/USES
SOURCES
Other Sources
Transfers from Funds of Lapsed/Reorganized LEAs 8965 0.00 0.00 0.0%
Long-Term Debt Proceeds
Proceeds from Capital Leases 8972 0.00 0.00 0.0%
All Other Financing Sources 8979 0.00 0.00 0.0%
(c) TOTAL, SOURCES 0.00 0.00 0.0%
USES
Transfers of Funds from Lapsed/Reorganized LEAs 7651 0.00 0.00 0.0%
All Other Financing Uses 7699 0.00 0.00 0.0%
(d) TOTAL, USES 0.00 0.00 0.0%
CONTRIBUTIONS
Contributions from Unrestricted Revenues 8980 0.00 0.00 0.0%
Contributions from Restricted Revenues 8990 0.00 0.00 0.0%
(e) TOTAL, CONTRIBUTIONS 0.00 0.00 0.0%
TOTAL, OTHER FINANCING SOURCES/USES (a - b + c - d + e) 300.44 0.00 -100.0%

Monterey Peninsula UnifiedMonterey County
Unaudited ActualsCafeteria Special Revenue Fund
Expenditures by Function27 66092 0000000
Form 13
California Dept of EducationSACS Financial Reporting Software - 2017.2.0File: fund-b (Rev 03/08/2016) Page 1 Printed: 9/6/2017 2:42 PM
Description Function Codes Object Codes2016-17
Unaudited Actuals2017-18Budget
PercentDifference
A. REVENUES
1) LCFF Sources 8010-8099 0.00 0.00 0.0%
2) Federal Revenue 8100-8299 4,065,601.11 3,928,000.00 -3.4%
3) Other State Revenue 8300-8599 287,114.55 285,000.00 -0.7%
4) Other Local Revenue 8600-8799 744,632.31 761,983.75 2.3%
5) TOTAL, REVENUES 5,097,347.97 4,974,983.75 -2.4%
B. EXPENDITURES (Objects 1000-7999)
1) Instruction 1000-1999 0.00 0.00 0.0%
2) Instruction - Related Services 2000-2999 0.00 0.00 0.0%
3) Pupil Services 3000-3999 4,653,242.37 5,598,149.05 20.3%
4) Ancillary Services 4000-4999 0.00 0.00 0.0%
5) Community Services 5000-5999 0.00 0.00 0.0%
6) Enterprise 6000-6999 0.00 0.00 0.0%
7) General Administration 7000-7999 225,555.61 288,652.82 28.0%
8) Plant Services 8000-8999 0.00 100,000.00 New
9) Other Outgo 9000-9999Except
7600-7699 0.00 0.00 0.0%
10) TOTAL, EXPENDITURES 4,878,797.98 5,986,801.87 22.7%
C. EXCESS (DEFICIENCY) OF REVENUES OVER EXPENDITURES BEFORE OTHER FINANCING SOURCES AND USES (A5 - B10) 218,549.99 (1,011,818.12) -563.0%
D. OTHER FINANCING SOURCES/USES 1) Interfund Transfers a) Transfers In 8900-8929 300.44 0.00 -100.0%
b) Transfers Out 7600-7629 0.00 0.00 0.0%
2) Other Sources/Uses a) Sources 8930-8979 0.00 0.00 0.0%
b) Uses 7630-7699 0.00 0.00 0.0%
3) Contributions 8980-8999 0.00 0.00 0.0%
4) TOTAL, OTHER FINANCING SOURCES/USES 300.44 0.00 -100.0%

Monterey Peninsula UnifiedMonterey County
Unaudited ActualsCafeteria Special Revenue Fund
Expenditures by Function27 66092 0000000
Form 13
California Dept of EducationSACS Financial Reporting Software - 2017.2.0File: fund-b (Rev 03/08/2016) Page 2 Printed: 9/6/2017 2:42 PM
Description Function Codes Object Codes2016-17
Unaudited Actuals2017-18Budget
PercentDifference
E. NET INCREASE (DECREASE) IN FUND BALANCE (C + D4) 218,850.43 (1,011,818.12) -562.3%
F. FUND BALANCE, RESERVES 1) Beginning Fund Balance
a) As of July 1 - Unaudited 9791 1,831,129.84 2,049,980.27 12.0%
b) Audit Adjustments 9793 0.00 0.00 0.0%
c) As of July 1 - Audited (F1a + F1b) 1,831,129.84 2,049,980.27 12.0%
d) Other Restatements 9795 0.00 0.00 0.0%
e) Adjusted Beginning Balance (F1c + F1d) 1,831,129.84 2,049,980.27 12.0%
2) Ending Balance, June 30 (E + F1e) 2,049,980.27 1,038,162.15 -49.4%
Components of Ending Fund Balance a) Nonspendable Revolving Cash 9711 0.00 0.00 0.0%
Stores 9712 266,406.75 0.00 -100.0%
Prepaid Expenditures 9713 0.00 0.00 0.0%
All Others 9719 0.00 0.00 0.0%
b) Restricted 9740 1,783,573.52 1,038,162.15 -41.8%
c) Committed Stabilization Arrangements 9750 0.00 0.00 0.0%
Other Commitments (by Resource/Object) 9760 0.00 0.00 0.0%
d) Assigned Other Assignments (by Resource/Object) 9780 0.00 0.00 0.0%
e) Unassigned/Unappropriated Reserve for Economic Uncertainties 9789 0.00 0.00 0.0%
Unassigned/Unappropriated Amount 9790 0.00 0.00 0.0%

Monterey Peninsula UnifiedMonterey County
Unaudited ActualsCafeteria Special Revenue FundExhibit: Restricted Balance Detail
27 66092 0000000Form 13
California Dept of EducationSACS Financial Reporting Software - 2017.2.0File: fund-b (Rev 11/14/2012) Page 1 Printed: 9/6/2017 2:42 PM
2016-17 2017-18Resource Description Unaudited Actuals Budget
5310 Child Nutrition: School Programs (e.g., School Lunch, School B 1,770,417.20 1,025,005.83
5320 Child Nutrition: Child Care Food Program (CCFP) Claims-Cen 13,156.32 13,156.32
Total, Restricted Balance 1,783,573.52 1,038,162.15

Monterey Peninsula UnifiedMonterey County
Unaudited ActualsDeferred Maintenance Fund
Expenditures by Object27 66092 0000000
Form 14
California Dept of EducationSACS Financial Reporting Software - 2017.2.0File: fund-b (Rev 06/08/2017 Page 1 Printed: 9/6/2017 2:42 PM
Description Resource Codes Object Codes2016-17
Unaudited Actuals2017-18Budget
PercentDifference
A. REVENUES
1) LCFF Sources 8010-8099 0.00 0.00 0.0%
2) Federal Revenue 8100-8299 0.00 0.00 0.0%
3) Other State Revenue 8300-8599 0.00 0.00 0.0%
4) Other Local Revenue 8600-8799 4,968.61 0.00 -100.0%
5) TOTAL, REVENUES 4,968.61 0.00 -100.0%
B. EXPENDITURES
1) Certificated Salaries 1000-1999 0.00 0.00 0.0%
2) Classified Salaries 2000-2999 0.00 0.00 0.0%
3) Employee Benefits 3000-3999 0.00 0.00 0.0%
4) Books and Supplies 4000-4999 1,633.29 0.00 -100.0%
5) Services and Other Operating Expenditures 5000-5999 305,643.59 425,000.00 39.1%
6) Capital Outlay 6000-6999 121,291.36 0.00 -100.0%
7) Other Outgo (excluding Transfers of Indirect 7100-7299, Costs) 7400-7499 0.00 0.00 0.0%
8) Other Outgo - Transfers of Indirect Costs 7300-7399 0.00 0.00 0.0%
9) TOTAL, EXPENDITURES 428,568.24 425,000.00 -0.8%
C. EXCESS (DEFICIENCY) OF REVENUES OVER EXPENDITURES BEFORE OTHER FINANCING SOURCES AND USES (A5 - B9) (423,599.63) (425,000.00) 0.3%
D. OTHER FINANCING SOURCES/USES 1) Interfund Transfers a) Transfers In 8900-8929 0.00 0.00 0.0%
b) Transfers Out 7600-7629 0.00 0.00 0.0%
2) Other Sources/Uses a) Sources 8930-8979 0.00 0.00 0.0%
b) Uses 7630-7699 0.00 0.00 0.0%
3) Contributions 8980-8999 0.00 0.00 0.0%
4) TOTAL, OTHER FINANCING SOURCES/USES 0.00 0.00 0.0%
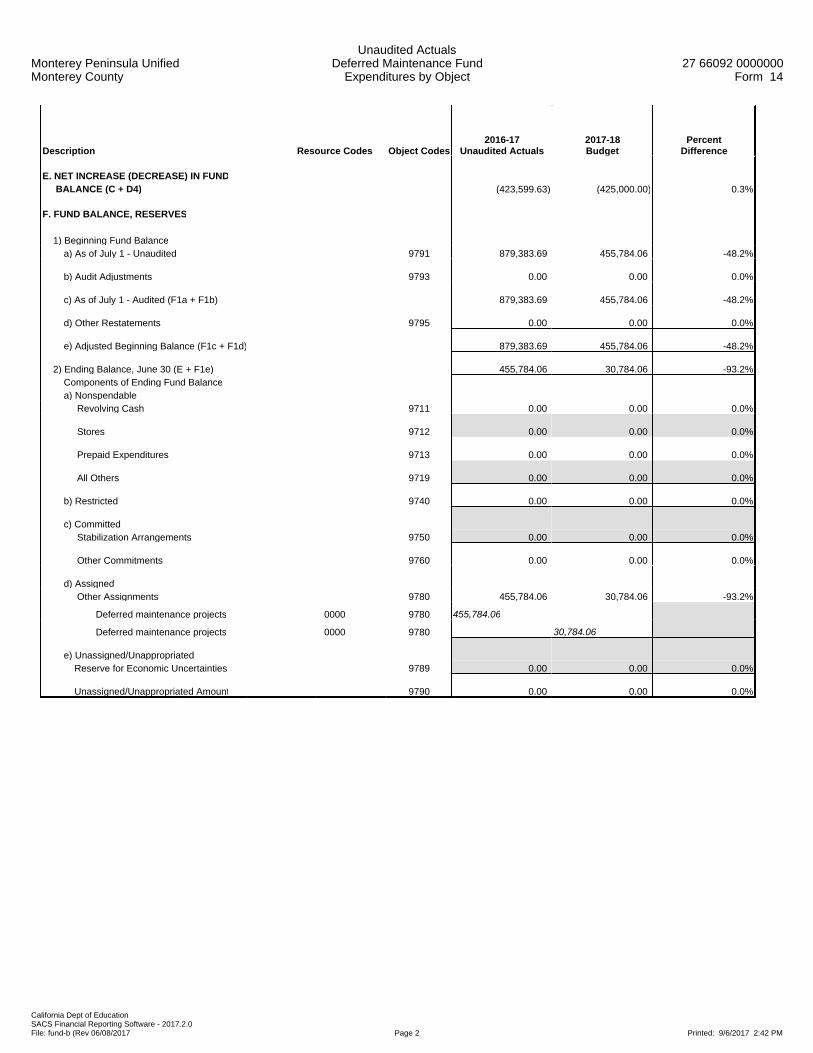
Monterey Peninsula UnifiedMonterey County
Unaudited ActualsDeferred Maintenance Fund
Expenditures by Object27 66092 0000000
Form 14
California Dept of EducationSACS Financial Reporting Software - 2017.2.0File: fund-b (Rev 06/08/2017 Page 2 Printed: 9/6/2017 2:42 PM
Description Resource Codes Object Codes2016-17
Unaudited Actuals2017-18Budget
PercentDifference
E. NET INCREASE (DECREASE) IN FUND BALANCE (C + D4) (423,599.63) (425,000.00) 0.3%
F. FUND BALANCE, RESERVES 1) Beginning Fund Balance a) As of July 1 - Unaudited 9791 879,383.69 455,784.06 -48.2%
b) Audit Adjustments 9793 0.00 0.00 0.0%
c) As of July 1 - Audited (F1a + F1b) 879,383.69 455,784.06 -48.2%
d) Other Restatements 9795 0.00 0.00 0.0%
e) Adjusted Beginning Balance (F1c + F1d) 879,383.69 455,784.06 -48.2%
2) Ending Balance, June 30 (E + F1e) 455,784.06 30,784.06 -93.2% Components of Ending Fund Balance a) Nonspendable Revolving Cash 9711 0.00 0.00 0.0%
Stores 9712 0.00 0.00 0.0%
Prepaid Expenditures 9713 0.00 0.00 0.0%
All Others 9719 0.00 0.00 0.0%
b) Restricted 9740 0.00 0.00 0.0%
c) Committed Stabilization Arrangements 9750 0.00 0.00 0.0%
Other Commitments 9760 0.00 0.00 0.0%
d) Assigned Other Assignments 9780 455,784.06 30,784.06 -93.2%
Deferred maintenance projects 0000 9780 455,784.06
Deferred maintenance projects 0000 9780 30,784.06
e) Unassigned/Unappropriated Reserve for Economic Uncertainties 9789 0.00 0.00 0.0%
Unassigned/Unappropriated Amount 9790 0.00 0.00 0.0%

Monterey Peninsula UnifiedMonterey County
Unaudited ActualsDeferred Maintenance Fund
Expenditures by Object27 66092 0000000
Form 14
California Dept of EducationSACS Financial Reporting Software - 2017.2.0File: fund-b (Rev 06/08/2017 Page 3 Printed: 9/6/2017 2:42 PM
Description Resource Codes Object Codes2016-17
Unaudited Actuals2017-18Budget
PercentDifference
G. ASSETS 1) Cash a) in County Treasury 9110 459,316.30
1) Fair Value Adjustment to Cash in County Treasury 9111 0.00
b) in Banks 9120 0.00
c) in Revolving Fund 9130 0.00
d) with Fiscal Agent 9135 0.00
e) collections awaiting deposit 9140 0.00
2) Investments 9150 0.00
3) Accounts Receivable 9200 1,662.12
4) Due from Grantor Government 9290 0.00
5) Due from Other Funds 9310 0.00
6) Stores 9320 0.00
7) Prepaid Expenditures 9330 0.00
8) Other Current Assets 9340 0.00
9) TOTAL, ASSETS 460,978.42
H. DEFERRED OUTFLOWS OF RESOURCES
1) Deferred Outflows of Resources 9490 0.00
2) TOTAL, DEFERRED OUTFLOWS 0.00
I. LIABILITIES
1) Accounts Payable 9500 5,194.36
2) Due to Grantor Governments 9590 0.00
3) Due to Other Funds 9610 0.00
4) Current Loans 9640
5) Unearned Revenue 9650 0.00
6) TOTAL, LIABILITIES 5,194.36
J. DEFERRED INFLOWS OF RESOURCES
1) Deferred Inflows of Resources 9690 0.00
2) TOTAL, DEFERRED INFLOWS 0.00
K. FUND EQUITY
Ending Fund Balance, June 30 (must agree with line F2) (G9 + H2) - (I6 + J2) 455,784.06

Monterey Peninsula UnifiedMonterey County
Unaudited ActualsDeferred Maintenance Fund
Expenditures by Object27 66092 0000000
Form 14
California Dept of EducationSACS Financial Reporting Software - 2017.2.0File: fund-b (Rev 06/08/2017 Page 4 Printed: 9/6/2017 2:42 PM
Description Resource Codes Object Codes2016-17
Unaudited Actuals2017-18Budget
PercentDifference
LCFF SOURCES
LCFF Transfers
LCFF Transfers - Current Year 8091 0.00 0.00 0.0%
LCFF/Revenue Limit Transfers - Prior Years 8099 0.00 0.00 0.0%
TOTAL, LCFF SOURCES 0.00 0.00 0.0%
OTHER STATE REVENUE
All Other State Revenue 8590 0.00 0.00 0.0%
TOTAL, OTHER STATE REVENUE 0.00 0.00 0.0%
OTHER LOCAL REVENUE
Other Local Revenue
Community Redevelopment Funds Not Subject to LCFF Deduction 8625 0.00 0.00 0.0%
Sales Sale of Equipment/Supplies 8631 0.00 0.00 0.0%
Interest 8660 4,968.61 0.00 -100.0%
Net Increase (Decrease) in the Fair Value of Investments 8662 0.00 0.00 0.0%
Other Local Revenue
All Other Local Revenue 8699 0.00 0.00 0.0%
All Other Transfers In from All Others 8799 0.00 0.00 0.0%
TOTAL, OTHER LOCAL REVENUE 4,968.61 0.00 -100.0%
TOTAL, REVENUES 4,968.61 0.00 -100.0%

Monterey Peninsula UnifiedMonterey County
Unaudited ActualsDeferred Maintenance Fund
Expenditures by Object27 66092 0000000
Form 14
California Dept of EducationSACS Financial Reporting Software - 2017.2.0File: fund-b (Rev 06/08/2017 Page 5 Printed: 9/6/2017 2:42 PM
Description Resource Codes Object Codes2016-17
Unaudited Actuals2017-18Budget
PercentDifference
CLASSIFIED SALARIES
Classified Support Salaries 2200 0.00 0.00 0.0%
Other Classified Salaries 2900 0.00 0.00 0.0%
TOTAL, CLASSIFIED SALARIES 0.00 0.00 0.0%
EMPLOYEE BENEFITS
STRS 3101-3102 0.00 0.00 0.0%
PERS 3201-3202 0.00 0.00 0.0%
OASDI/Medicare/Alternative 3301-3302 0.00 0.00 0.0%
Health and Welfare Benefits 3401-3402 0.00 0.00 0.0%
Unemployment Insurance 3501-3502 0.00 0.00 0.0%
Workers' Compensation 3601-3602 0.00 0.00 0.0%
OPEB, Allocated 3701-3702 0.00 0.00 0.0%
OPEB, Active Employees 3751-3752 0.00 0.00 0.0%
Other Employee Benefits 3901-3902 0.00 0.00 0.0%
TOTAL, EMPLOYEE BENEFITS 0.00 0.00 0.0%
BOOKS AND SUPPLIES
Books and Other Reference Materials 4200 0.00 0.00 0.0%
Materials and Supplies 4300 1,633.29 0.00 -100.0%
Noncapitalized Equipment 4400 0.00 0.00 0.0%
TOTAL, BOOKS AND SUPPLIES 1,633.29 0.00 -100.0%

Monterey Peninsula UnifiedMonterey County
Unaudited ActualsDeferred Maintenance Fund
Expenditures by Object27 66092 0000000
Form 14
California Dept of EducationSACS Financial Reporting Software - 2017.2.0File: fund-b (Rev 06/08/2017 Page 6 Printed: 9/6/2017 2:42 PM
Description Resource Codes Object Codes2016-17
Unaudited Actuals2017-18Budget
PercentDifference
SERVICES AND OTHER OPERATING EXPENDITURES
Subagreements for Services 5100 0.00 0.00 0.0%
Travel and Conferences 5200 0.00 0.00 0.0%
Rentals, Leases, Repairs, and Noncapitalized Improvements 5600 0.00 0.00 0.0%
Transfers of Direct Costs 5710 0.00 0.00 0.0%
Transfers of Direct Costs - Interfund 5750 0.00 0.00 0.0%
Professional/Consulting Services and Operating Expenditures 5800 305,643.59 425,000.00 39.1%
TOTAL, SERVICES AND OTHER OPERATING EXPENDITURES 305,643.59 425,000.00 39.1%
CAPITAL OUTLAY
Land Improvements 6170 20,118.36 0.00 -100.0%
Buildings and Improvements of Buildings 6200 76,325.00 0.00 -100.0%
Equipment 6400 24,848.00 0.00 -100.0%
Equipment Replacement 6500 0.00 0.00 0.0%
TOTAL, CAPITAL OUTLAY 121,291.36 0.00 -100.0%
OTHER OUTGO (excluding Transfers of Indirect Costs)
Debt Service
Debt Service - Interest 7438 0.00 0.00 0.0%
Other Debt Service - Principal 7439 0.00 0.00 0.0%
TOTAL, OTHER OUTGO (excluding Transfers of Indirect Costs) 0.00 0.00 0.0%
TOTAL, EXPENDITURES 428,568.24 425,000.00 -0.8%

Monterey Peninsula UnifiedMonterey County
Unaudited ActualsDeferred Maintenance Fund
Expenditures by Object27 66092 0000000
Form 14
California Dept of EducationSACS Financial Reporting Software - 2017.2.0File: fund-b (Rev 06/08/2017 Page 7 Printed: 9/6/2017 2:42 PM
Description Resource Codes Object Codes2016-17
Unaudited Actuals2017-18Budget
PercentDifference
INTERFUND TRANSFERS
INTERFUND TRANSFERS IN
Other Authorized Interfund Transfers In 8919 0.00 0.00 0.0%
(a) TOTAL, INTERFUND TRANSFERS IN 0.00 0.00 0.0%
INTERFUND TRANSFERS OUT
Other Authorized Interfund Transfers Out 7619 0.00 0.00 0.0%
(b) TOTAL, INTERFUND TRANSFERS OUT 0.00 0.00 0.0%
OTHER SOURCES/USES
SOURCES
Other Sources
Transfers from Funds of Lapsed/Reorganized LEAs 8965 0.00 0.00 0.0%
Long-Term Debt Proceeds
Proceeds from Capital Leases 8972 0.00 0.00 0.0%
All Other Financing Sources 8979 0.00 0.00 0.0%
(c) TOTAL, SOURCES 0.00 0.00 0.0%
USES
Transfers of Funds from Lapsed/Reorganized LEAs 7651 0.00 0.00 0.0%
All Other Financing Uses 7699 0.00 0.00 0.0%
(d) TOTAL, USES 0.00 0.00 0.0%
CONTRIBUTIONS
Contributions from Unrestricted Revenues 8980 0.00 0.00 0.0%
Contributions from Restricted Revenues 8990 0.00 0.00 0.0%
(e) TOTAL, CONTRIBUTIONS 0.00 0.00 0.0%
TOTAL, OTHER FINANCING SOURCES/USES (a - b + c - d + e) 0.00 0.00 0.0%

Monterey Peninsula UnifiedMonterey County
Unaudited ActualsDeferred Maintenance FundExpenditures by Function
27 66092 0000000Form 14
California Dept of EducationSACS Financial Reporting Software - 2017.2.0File: fund-b (Rev 03/08/2016) Page 1 Printed: 9/6/2017 2:42 PM
Description Function Codes Object Codes2016-17
Unaudited Actuals2017-18Budget
PercentDifference
A. REVENUES
1) LCFF Sources 8010-8099 0.00 0.00 0.0%
2) Federal Revenue 8100-8299 0.00 0.00 0.0%
3) Other State Revenue 8300-8599 0.00 0.00 0.0%
4) Other Local Revenue 8600-8799 4,968.61 0.00 -100.0%
5) TOTAL, REVENUES 4,968.61 0.00 -100.0%
B. EXPENDITURES (Objects 1000-7999)
1) Instruction 1000-1999 0.00 0.00 0.0%
2) Instruction - Related Services 2000-2999 0.00 0.00 0.0%
3) Pupil Services 3000-3999 0.00 0.00 0.0%
4) Ancillary Services 4000-4999 0.00 0.00 0.0%
5) Community Services 5000-5999 0.00 0.00 0.0%
6) Enterprise 6000-6999 0.00 0.00 0.0%
7) General Administration 7000-7999 0.00 0.00 0.0%
8) Plant Services 8000-8999 428,568.24 425,000.00 -0.8%
9) Other Outgo 9000-9999Except
7600-7699 0.00 0.00 0.0%
10) TOTAL, EXPENDITURES 428,568.24 425,000.00 -0.8%
C. EXCESS (DEFICIENCY) OF REVENUES OVER EXPENDITURES BEFORE OTHER FINANCING SOURCES AND USES (A5 - B10) (423,599.63) (425,000.00) 0.3%
D. OTHER FINANCING SOURCES/USES 1) Interfund Transfers a) Transfers In 8900-8929 0.00 0.00 0.0%
b) Transfers Out 7600-7629 0.00 0.00 0.0%
2) Other Sources/Uses a) Sources 8930-8979 0.00 0.00 0.0%
b) Uses 7630-7699 0.00 0.00 0.0%
3) Contributions 8980-8999 0.00 0.00 0.0%
4) TOTAL, OTHER FINANCING SOURCES/USES 0.00 0.00 0.0%

Monterey Peninsula UnifiedMonterey County
Unaudited ActualsDeferred Maintenance FundExpenditures by Function
27 66092 0000000Form 14
California Dept of EducationSACS Financial Reporting Software - 2017.2.0File: fund-b (Rev 03/08/2016) Page 2 Printed: 9/6/2017 2:42 PM
Description Function Codes Object Codes2016-17
Unaudited Actuals2017-18Budget
PercentDifference
E. NET INCREASE (DECREASE) IN FUND BALANCE (C + D4) (423,599.63) (425,000.00) 0.3%
F. FUND BALANCE, RESERVES 1) Beginning Fund Balance
a) As of July 1 - Unaudited 9791 879,383.69 455,784.06 -48.2%
b) Audit Adjustments 9793 0.00 0.00 0.0%
c) As of July 1 - Audited (F1a + F1b) 879,383.69 455,784.06 -48.2%
d) Other Restatements 9795 0.00 0.00 0.0%
e) Adjusted Beginning Balance (F1c + F1d) 879,383.69 455,784.06 -48.2%
2) Ending Balance, June 30 (E + F1e) 455,784.06 30,784.06 -93.2%
Components of Ending Fund Balance a) Nonspendable Revolving Cash 9711 0.00 0.00 0.0%
Stores 9712 0.00 0.00 0.0%
Prepaid Expenditures 9713 0.00 0.00 0.0%
All Others 9719 0.00 0.00 0.0%
b) Restricted 9740 0.00 0.00 0.0%
c) Committed Stabilization Arrangements 9750 0.00 0.00 0.0%
Other Commitments (by Resource/Object) 9760 0.00 0.00 0.0%
d) Assigned Other Assignments (by Resource/Object) 9780 455,784.06 30,784.06 -93.2%
Deferred maintenance projects 0000 9780 455,784.06Deferred maintenance projects 0000 9780 30,784.06
e) Unassigned/Unappropriated Reserve for Economic Uncertainties 9789 0.00 0.00 0.0%
Unassigned/Unappropriated Amount 9790 0.00 0.00 0.0%

Monterey Peninsula UnifiedMonterey County
Unaudited ActualsDeferred Maintenance Fund
Exhibit: Restricted Balance Detail27 66092 0000000
Form 14
California Dept of EducationSACS Financial Reporting Software - 2017.2.0File: fund-b (Rev 11/14/2012) Page 1 Printed: 9/6/2017 2:42 PM
2016-17 2017-18Resource Description Unaudited Actuals Budget
Total, Restricted Balance 0.00 0.00
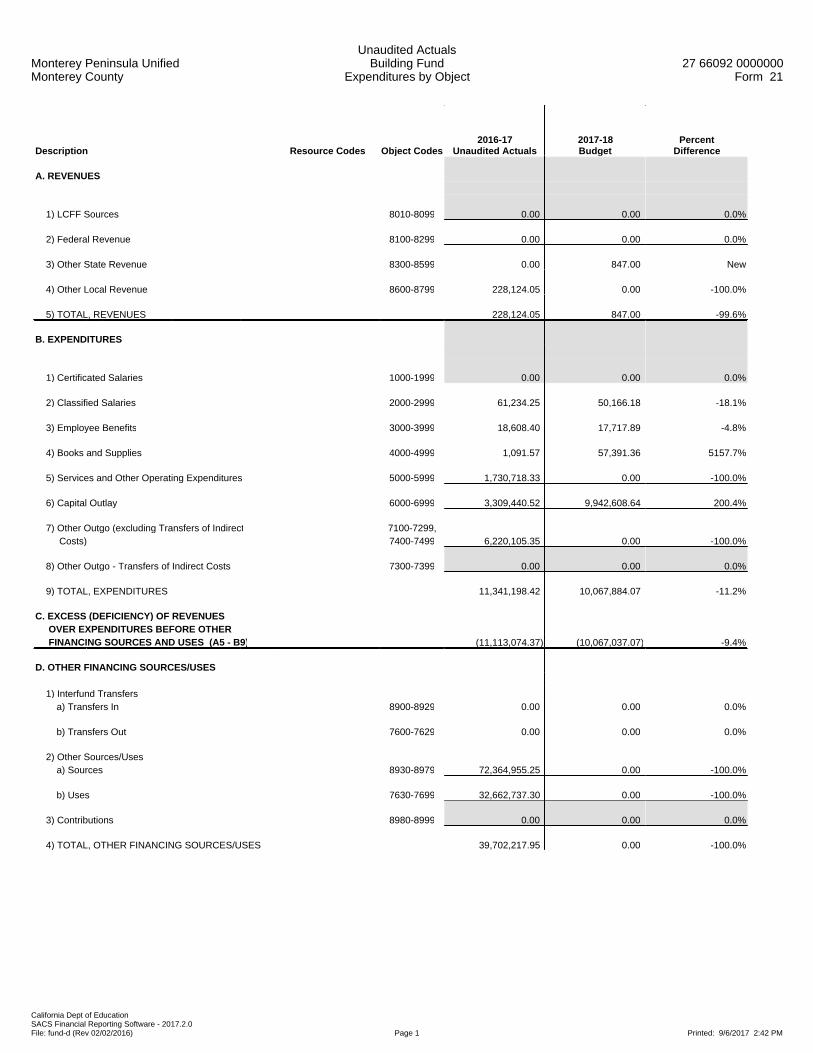
Monterey Peninsula UnifiedMonterey County
Unaudited ActualsBuilding Fund
Expenditures by Object27 66092 0000000
Form 21
California Dept of EducationSACS Financial Reporting Software - 2017.2.0File: fund-d (Rev 02/02/2016) Page 1 Printed: 9/6/2017 2:42 PM
Description Resource Codes Object Codes2016-17
Unaudited Actuals2017-18Budget
PercentDifference
A. REVENUES
1) LCFF Sources 8010-8099 0.00 0.00 0.0%
2) Federal Revenue 8100-8299 0.00 0.00 0.0%
3) Other State Revenue 8300-8599 0.00 847.00 New
4) Other Local Revenue 8600-8799 228,124.05 0.00 -100.0%
5) TOTAL, REVENUES 228,124.05 847.00 -99.6%
B. EXPENDITURES
1) Certificated Salaries 1000-1999 0.00 0.00 0.0%
2) Classified Salaries 2000-2999 61,234.25 50,166.18 -18.1%
3) Employee Benefits 3000-3999 18,608.40 17,717.89 -4.8%
4) Books and Supplies 4000-4999 1,091.57 57,391.36 5157.7%
5) Services and Other Operating Expenditures 5000-5999 1,730,718.33 0.00 -100.0%
6) Capital Outlay 6000-6999 3,309,440.52 9,942,608.64 200.4%
7) Other Outgo (excluding Transfers of Indirect 7100-7299, Costs) 7400-7499 6,220,105.35 0.00 -100.0%
8) Other Outgo - Transfers of Indirect Costs 7300-7399 0.00 0.00 0.0%
9) TOTAL, EXPENDITURES 11,341,198.42 10,067,884.07 -11.2%
C. EXCESS (DEFICIENCY) OF REVENUES OVER EXPENDITURES BEFORE OTHER FINANCING SOURCES AND USES (A5 - B9) (11,113,074.37) (10,067,037.07) -9.4%
D. OTHER FINANCING SOURCES/USES 1) Interfund Transfers a) Transfers In 8900-8929 0.00 0.00 0.0%
b) Transfers Out 7600-7629 0.00 0.00 0.0%
2) Other Sources/Uses a) Sources 8930-8979 72,364,955.25 0.00 -100.0%
b) Uses 7630-7699 32,662,737.30 0.00 -100.0%
3) Contributions 8980-8999 0.00 0.00 0.0%
4) TOTAL, OTHER FINANCING SOURCES/USES 39,702,217.95 0.00 -100.0%

Monterey Peninsula UnifiedMonterey County
Unaudited ActualsBuilding Fund
Expenditures by Object27 66092 0000000
Form 21
California Dept of EducationSACS Financial Reporting Software - 2017.2.0File: fund-d (Rev 02/02/2016) Page 2 Printed: 9/6/2017 2:42 PM
Description Resource Codes Object Codes2016-17
Unaudited Actuals2017-18Budget
PercentDifference
E. NET INCREASE (DECREASE) IN FUND BALANCE (C + D4) 28,589,143.58 (10,067,037.07) -135.2%
F. FUND BALANCE, RESERVES 1) Beginning Fund Balance a) As of July 1 - Unaudited 9791 4,145,527.28 32,734,670.86 689.6%
b) Audit Adjustments 9793 0.00 0.00 0.0%
c) As of July 1 - Audited (F1a + F1b) 4,145,527.28 32,734,670.86 689.6%
d) Other Restatements 9795 0.00 0.00 0.0%
e) Adjusted Beginning Balance (F1c + F1d) 4,145,527.28 32,734,670.86 689.6%
2) Ending Balance, June 30 (E + F1e) 32,734,670.86 22,667,633.79 -30.8% Components of Ending Fund Balance a) Nonspendable Revolving Cash 9711 0.00 0.00 0.0%
Stores 9712 0.00 0.00 0.0%
Prepaid Expenditures 9713 0.00 0.00 0.0%
All Others 9719 0.00 0.00 0.0%
b) Restricted 9740 32,734,670.86 22,667,633.79 -30.8%
c) Committed Stabilization Arrangements 9750 0.00 0.00 0.0%
Other Commitments 9760 0.00 0.00 0.0%
d) Assigned Other Assignments 9780 0.00 0.00 0.0%
e) Unassigned/Unappropriated Reserve for Economic Uncertainties 9789 0.00 0.00 0.0%
Unassigned/Unappropriated Amount 9790 0.00 0.00 0.0%

Monterey Peninsula UnifiedMonterey County
Unaudited ActualsBuilding Fund
Expenditures by Object27 66092 0000000
Form 21
California Dept of EducationSACS Financial Reporting Software - 2017.2.0File: fund-d (Rev 02/02/2016) Page 3 Printed: 9/6/2017 2:42 PM
Description Resource Codes Object Codes2016-17
Unaudited Actuals2017-18Budget
PercentDifference
G. ASSETS 1) Cash a) in County Treasury 9110 32,906,975.00
1) Fair Value Adjustment to Cash in County Treasury 9111 0.00
b) in Banks 9120 0.00
c) in Revolving Fund 9130 0.00
d) with Fiscal Agent 9135 0.00
e) collections awaiting deposit 9140 0.00
2) Investments 9150 0.00
3) Accounts Receivable 9200 101,465.36
4) Due from Grantor Government 9290 0.00
5) Due from Other Funds 9310 0.00
6) Stores 9320 0.00
7) Prepaid Expenditures 9330 0.00
8) Other Current Assets 9340 0.00
9) TOTAL, ASSETS 33,008,440.36
H. DEFERRED OUTFLOWS OF RESOURCES
1) Deferred Outflows of Resources 9490 0.00
2) TOTAL, DEFERRED OUTFLOWS 0.00
I. LIABILITIES
1) Accounts Payable 9500 273,753.62
2) Due to Grantor Governments 9590 0.00
3) Due to Other Funds 9610 15.88
4) Current Loans 9640 0.00
5) Unearned Revenue 9650 0.00
6) TOTAL, LIABILITIES 273,769.50
J. DEFERRED INFLOWS OF RESOURCES
1) Deferred Inflows of Resources 9690 0.00
2) TOTAL, DEFERRED INFLOWS 0.00
K. FUND EQUITY
Ending Fund Balance, June 30 (must agree with line F2) (G9 + H2) - (I6 + J2) 32,734,670.86

Monterey Peninsula UnifiedMonterey County
Unaudited ActualsBuilding Fund
Expenditures by Object27 66092 0000000
Form 21
California Dept of EducationSACS Financial Reporting Software - 2017.2.0File: fund-d (Rev 02/02/2016) Page 4 Printed: 9/6/2017 2:42 PM
Description Resource Codes Object Codes2016-17
Unaudited Actuals2017-18Budget
PercentDifference
FEDERAL REVENUE
FEMA 8281 0.00 0.00 0.0%
All Other Federal Revenue 8290 0.00 0.00 0.0%
TOTAL, FEDERAL REVENUE 0.00 0.00 0.0%
OTHER STATE REVENUE
Tax Relief Subventions Restricted Levies - Other
Homeowners' Exemptions 8575 0.00 0.00 0.0%
Other Subventions/In-Lieu Taxes 8576 0.00 0.00 0.0%
All Other State Revenue 8590 0.00 847.00 New
TOTAL, OTHER STATE REVENUE 0.00 847.00 New
OTHER LOCAL REVENUE
Other Local Revenue County and District Taxes
Other Restricted Levies Secured Roll 8615 0.00 0.00 0.0%
Unsecured Roll 8616 0.00 0.00 0.0%
Prior Years' Taxes 8617 0.00 0.00 0.0%
Supplemental Taxes 8618 0.00 0.00 0.0%
Non-Ad Valorem Taxes Parcel Taxes 8621 0.00 0.00 0.0%
Other 8622 0.00 0.00 0.0%
Community Redevelopment Funds Not Subject to LCFF Deduction 8625 0.00 0.00 0.0%
Penalties and Interest from Delinquent Non-LCFF Taxes 8629 0.00 0.00 0.0%
Sales Sale of Equipment/Supplies 8631 0.00 0.00 0.0%
Leases and Rentals 8650 0.00 0.00 0.0%
Interest 8660 228,124.05 0.00 -100.0%
Net Increase (Decrease) in the Fair Value of Investments 8662 0.00 0.00 0.0%
Other Local Revenue
All Other Local Revenue 8699 0.00 0.00 0.0%
All Other Transfers In from All Others 8799 0.00 0.00 0.0%
TOTAL, OTHER LOCAL REVENUE 228,124.05 0.00 -100.0%
TOTAL, REVENUES 228,124.05 847.00 -99.6%
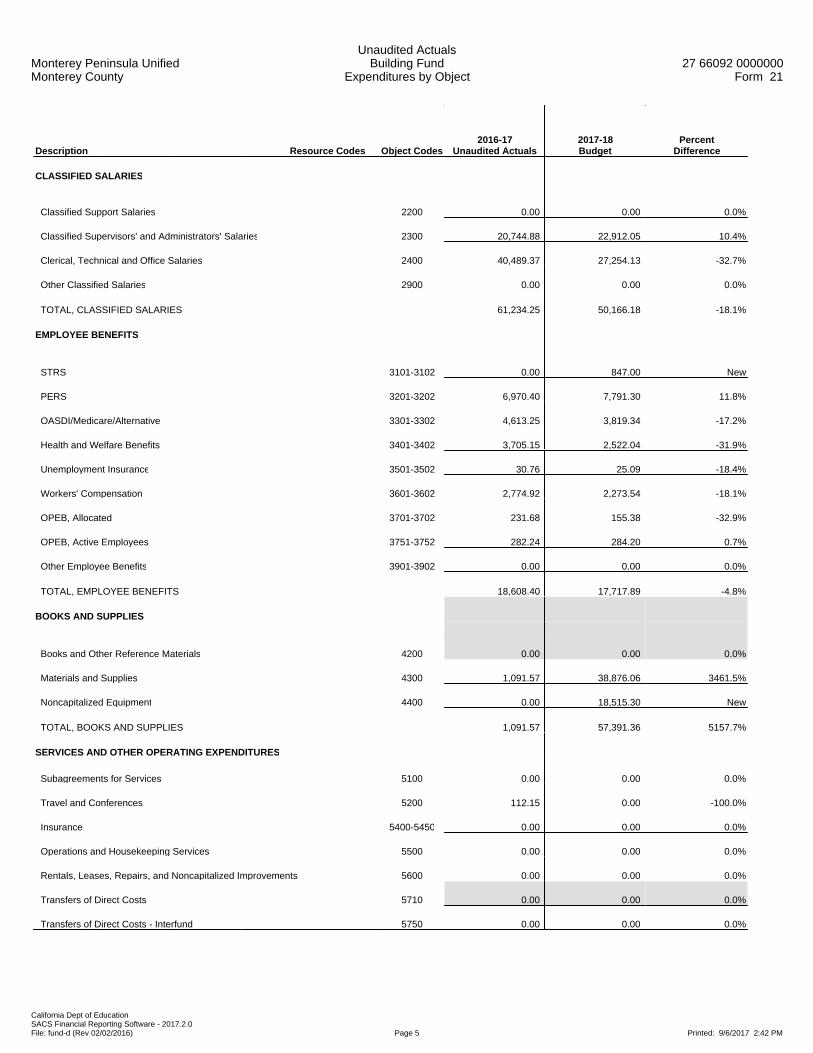
Monterey Peninsula UnifiedMonterey County
Unaudited ActualsBuilding Fund
Expenditures by Object27 66092 0000000
Form 21
California Dept of EducationSACS Financial Reporting Software - 2017.2.0File: fund-d (Rev 02/02/2016) Page 5 Printed: 9/6/2017 2:42 PM
Description Resource Codes Object Codes2016-17
Unaudited Actuals2017-18Budget
PercentDifference
CLASSIFIED SALARIES
Classified Support Salaries 2200 0.00 0.00 0.0%
Classified Supervisors' and Administrators' Salaries 2300 20,744.88 22,912.05 10.4%
Clerical, Technical and Office Salaries 2400 40,489.37 27,254.13 -32.7%
Other Classified Salaries 2900 0.00 0.00 0.0%
TOTAL, CLASSIFIED SALARIES 61,234.25 50,166.18 -18.1%
EMPLOYEE BENEFITS
STRS 3101-3102 0.00 847.00 New
PERS 3201-3202 6,970.40 7,791.30 11.8%
OASDI/Medicare/Alternative 3301-3302 4,613.25 3,819.34 -17.2%
Health and Welfare Benefits 3401-3402 3,705.15 2,522.04 -31.9%
Unemployment Insurance 3501-3502 30.76 25.09 -18.4%
Workers' Compensation 3601-3602 2,774.92 2,273.54 -18.1%
OPEB, Allocated 3701-3702 231.68 155.38 -32.9%
OPEB, Active Employees 3751-3752 282.24 284.20 0.7%
Other Employee Benefits 3901-3902 0.00 0.00 0.0%
TOTAL, EMPLOYEE BENEFITS 18,608.40 17,717.89 -4.8%
BOOKS AND SUPPLIES
Books and Other Reference Materials 4200 0.00 0.00 0.0%
Materials and Supplies 4300 1,091.57 38,876.06 3461.5%
Noncapitalized Equipment 4400 0.00 18,515.30 New
TOTAL, BOOKS AND SUPPLIES 1,091.57 57,391.36 5157.7%
SERVICES AND OTHER OPERATING EXPENDITURES
Subagreements for Services 5100 0.00 0.00 0.0%
Travel and Conferences 5200 112.15 0.00 -100.0%
Insurance 5400-5450 0.00 0.00 0.0%
Operations and Housekeeping Services 5500 0.00 0.00 0.0%
Rentals, Leases, Repairs, and Noncapitalized Improvements 5600 0.00 0.00 0.0%
Transfers of Direct Costs 5710 0.00 0.00 0.0%
Transfers of Direct Costs - Interfund 5750 0.00 0.00 0.0%

Monterey Peninsula UnifiedMonterey County
Unaudited ActualsBuilding Fund
Expenditures by Object27 66092 0000000
Form 21
California Dept of EducationSACS Financial Reporting Software - 2017.2.0File: fund-d (Rev 02/02/2016) Page 6 Printed: 9/6/2017 2:42 PM
Description Resource Codes Object Codes2016-17
Unaudited Actuals2017-18Budget
PercentDifference
Professional/Consulting Services and Operating Expenditures 5800 1,730,537.85 0.00 -100.0%
Communications 5900 68.33 0.00 -100.0%
TOTAL, SERVICES AND OTHER OPERATING EXPENDITURES 1,730,718.33 0.00 -100.0%
CAPITAL OUTLAY
Land 6100 101,390.00 0.00 -100.0%
Land Improvements 6170 2,565,276.38 0.00 -100.0%
Buildings and Improvements of Buildings 6200 642,774.14 9,942,608.64 1446.8%
Books and Media for New School Libraries
or Major Expansion of School Libraries 6300 0.00 0.00 0.0%
Equipment 6400 0.00 0.00 0.0%
Equipment Replacement 6500 0.00 0.00 0.0%
TOTAL, CAPITAL OUTLAY 3,309,440.52 9,942,608.64 200.4%
OTHER OUTGO (excluding Transfers of Indirect Costs)
Other Transfers Out
All Other Transfers Out to All Others 7299 0.00 0.00 0.0%
Debt Service
Repayment of State School Building Fund Aid - Proceeds from Bonds 7435 0.00 0.00 0.0%
Debt Service - Interest 7438 6,220,105.35 0.00 -100.0%
Other Debt Service - Principal 7439 0.00 0.00 0.0%
TOTAL, OTHER OUTGO (excluding Transfers of Indirect Costs) 6,220,105.35 0.00 -100.0%
TOTAL, EXPENDITURES 11,341,198.42 10,067,884.07 -11.2%
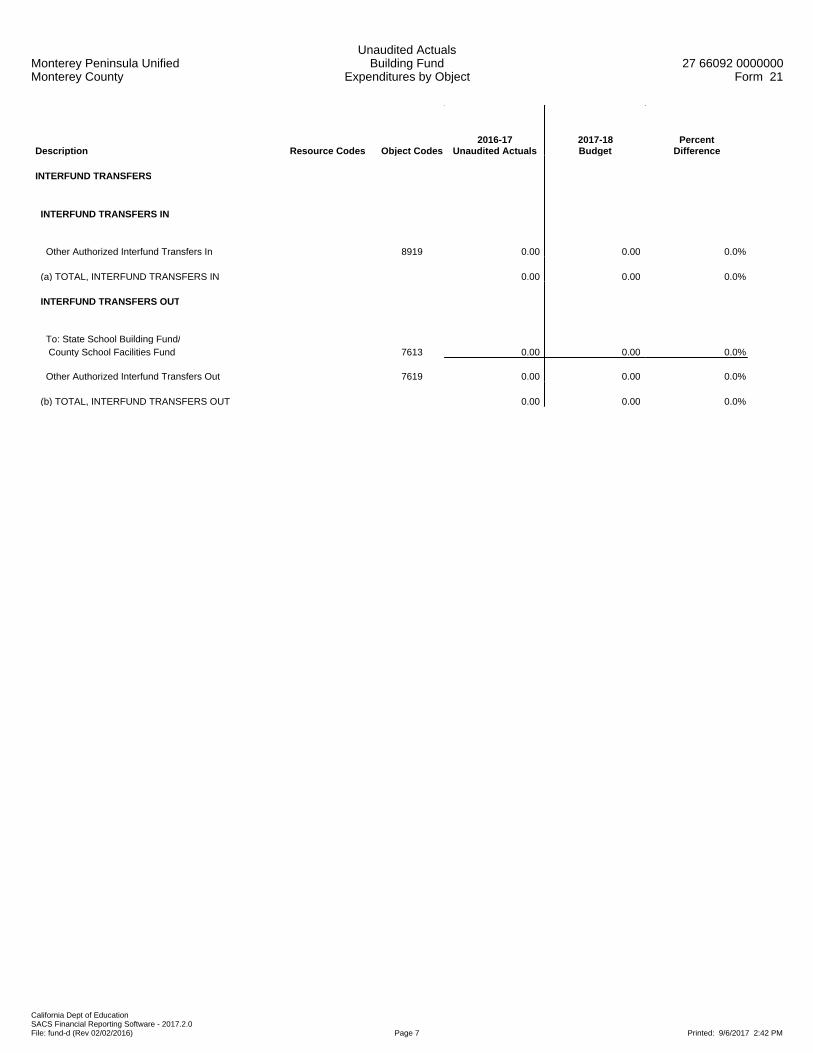
Monterey Peninsula UnifiedMonterey County
Unaudited ActualsBuilding Fund
Expenditures by Object27 66092 0000000
Form 21
California Dept of EducationSACS Financial Reporting Software - 2017.2.0File: fund-d (Rev 02/02/2016) Page 7 Printed: 9/6/2017 2:42 PM
Description Resource Codes Object Codes2016-17
Unaudited Actuals2017-18Budget
PercentDifference
INTERFUND TRANSFERS
INTERFUND TRANSFERS IN
Other Authorized Interfund Transfers In 8919 0.00 0.00 0.0%
(a) TOTAL, INTERFUND TRANSFERS IN 0.00 0.00 0.0%
INTERFUND TRANSFERS OUT
To: State School Building Fund/ County School Facilities Fund 7613 0.00 0.00 0.0%
Other Authorized Interfund Transfers Out 7619 0.00 0.00 0.0%
(b) TOTAL, INTERFUND TRANSFERS OUT 0.00 0.00 0.0%
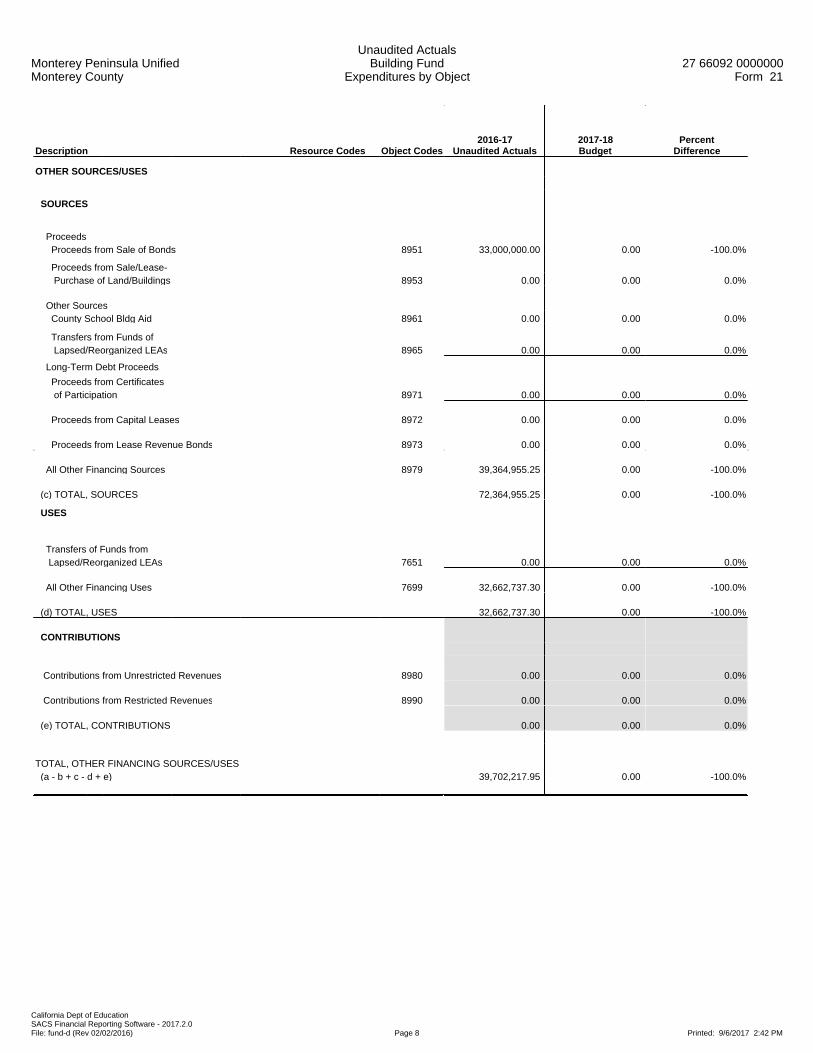
Monterey Peninsula UnifiedMonterey County
Unaudited ActualsBuilding Fund
Expenditures by Object27 66092 0000000
Form 21
California Dept of EducationSACS Financial Reporting Software - 2017.2.0File: fund-d (Rev 02/02/2016) Page 8 Printed: 9/6/2017 2:42 PM
Description Resource Codes Object Codes2016-17
Unaudited Actuals2017-18Budget
PercentDifference
OTHER SOURCES/USES
SOURCES
Proceeds Proceeds from Sale of Bonds 8951 33,000,000.00 0.00 -100.0%
Proceeds from Sale/Lease- Purchase of Land/Buildings 8953 0.00 0.00 0.0%
Other Sources County School Bldg Aid 8961 0.00 0.00 0.0%
Transfers from Funds of Lapsed/Reorganized LEAs 8965 0.00 0.00 0.0%
Long-Term Debt Proceeds
Proceeds from Certificates of Participation 8971 0.00 0.00 0.0%
Proceeds from Capital Leases 8972 0.00 0.00 0.0%
Proceeds from Lease Revenue Bonds 8973 0.00 0.00 0.0%
All Other Financing Sources 8979 39,364,955.25 0.00 -100.0%
(c) TOTAL, SOURCES 72,364,955.25 0.00 -100.0%
USES
Transfers of Funds from Lapsed/Reorganized LEAs 7651 0.00 0.00 0.0%
All Other Financing Uses 7699 32,662,737.30 0.00 -100.0%
(d) TOTAL, USES 32,662,737.30 0.00 -100.0%
CONTRIBUTIONS
Contributions from Unrestricted Revenues 8980 0.00 0.00 0.0%
Contributions from Restricted Revenues 8990 0.00 0.00 0.0%
(e) TOTAL, CONTRIBUTIONS 0.00 0.00 0.0%
TOTAL, OTHER FINANCING SOURCES/USES (a - b + c - d + e) 39,702,217.95 0.00 -100.0%

Monterey Peninsula UnifiedMonterey County
Unaudited ActualsBuilding Fund
Expenditures by Function27 66092 0000000
Form 21
California Dept of EducationSACS Financial Reporting Software - 2017.2.0File: fund-d (Rev 02/02/2016) Page 1 Printed: 9/6/2017 2:42 PM
Description Function Codes Object Codes2016-17
Unaudited Actuals2017-18Budget
PercentDifference
A. REVENUES
1) LCFF Sources 8010-8099 0.00 0.00 0.0%
2) Federal Revenue 8100-8299 0.00 0.00 0.0%
3) Other State Revenue 8300-8599 0.00 847.00 New
4) Other Local Revenue 8600-8799 228,124.05 0.00 -100.0%
5) TOTAL, REVENUES 228,124.05 847.00 -99.6%
B. EXPENDITURES (Objects 1000-7999)
1) Instruction 1000-1999 0.00 0.00 0.0%
2) Instruction - Related Services 2000-2999 0.00 0.00 0.0%
3) Pupil Services 3000-3999 0.00 0.00 0.0%
4) Ancillary Services 4000-4999 0.00 0.00 0.0%
5) Community Services 5000-5999 0.00 0.00 0.0%
6) Enterprise 6000-6999 0.00 0.00 0.0%
7) General Administration 7000-7999 0.00 0.00 0.0%
8) Plant Services 8000-8999 4,488,736.28 10,067,884.07 124.3%
9) Other Outgo 9000-9999Except
7600-7699 6,852,462.14 0.00 -100.0%
10) TOTAL, EXPENDITURES 11,341,198.42 10,067,884.07 -11.2%
C. EXCESS (DEFICIENCY) OF REVENUES OVER EXPENDITURES BEFORE OTHER FINANCING SOURCES AND USES (A5 - B10) (11,113,074.37) (10,067,037.07) -9.4%
D. OTHER FINANCING SOURCES/USES 1) Interfund Transfers a) Transfers In 8900-8929 0.00 0.00 0.0%
b) Transfers Out 7600-7629 0.00 0.00 0.0%
2) Other Sources/Uses a) Sources 8930-8979 72,364,955.25 0.00 -100.0%
b) Uses 7630-7699 32,662,737.30 0.00 -100.0%
3) Contributions 8980-8999 0.00 0.00 0.0%
4) TOTAL, OTHER FINANCING SOURCES/USES 39,702,217.95 0.00 -100.0%

Monterey Peninsula UnifiedMonterey County
Unaudited ActualsBuilding Fund
Expenditures by Function27 66092 0000000
Form 21
California Dept of EducationSACS Financial Reporting Software - 2017.2.0File: fund-d (Rev 02/02/2016) Page 2 Printed: 9/6/2017 2:42 PM
Description Function Codes Object Codes2016-17
Unaudited Actuals2017-18Budget
PercentDifference
E. NET INCREASE (DECREASE) IN FUND BALANCE (C + D4) 28,589,143.58 (10,067,037.07) -135.2%
F. FUND BALANCE, RESERVES 1) Beginning Fund Balance
a) As of July 1 - Unaudited 9791 4,145,527.28 32,734,670.86 689.6%
b) Audit Adjustments 9793 0.00 0.00 0.0%
c) As of July 1 - Audited (F1a + F1b) 4,145,527.28 32,734,670.86 689.6%
d) Other Restatements 9795 0.00 0.00 0.0%
e) Adjusted Beginning Balance (F1c + F1d) 4,145,527.28 32,734,670.86 689.6%
2) Ending Balance, June 30 (E + F1e) 32,734,670.86 22,667,633.79 -30.8% Components of Ending Fund Balance a) Nonspendable Revolving Cash 9711 0.00 0.00 0.0%
Stores 9712 0.00 0.00 0.0%
Prepaid Expenditures 9713 0.00 0.00 0.0%
All Others 9719 0.00 0.00 0.0%
b) Restricted 9740 32,734,670.86 22,667,633.79 -30.8%
c) Committed Stabilization Arrangements 9750 0.00 0.00 0.0%
Other Commitments (by Resource/Object) 9760 0.00 0.00 0.0%
d) Assigned Other Assignments (by Resource/Object) 9780 0.00 0.00 0.0%
e) Unassigned/Unappropriated Reserve for Economic Uncertainties 9789 0.00 0.00 0.0%
Unassigned/Unappropriated Amount 9790 0.00 0.00 0.0%

Monterey Peninsula UnifiedMonterey County
Unaudited ActualsBuilding Fund
Exhibit: Restricted Balance Detail27 66092 0000000
Form 21
California Dept of EducationSACS Financial Reporting Software - 2017.2.0File: fund-d (Rev 04/06/2011) Page 1 Printed: 9/6/2017 2:42 PM
2016-17 2017-18Resource Description Unaudited Actuals Budget
9010 Other Restricted Local 32,734,670.86 22,667,633.79
Total, Restricted Balance 32,734,670.86 22,667,633.79
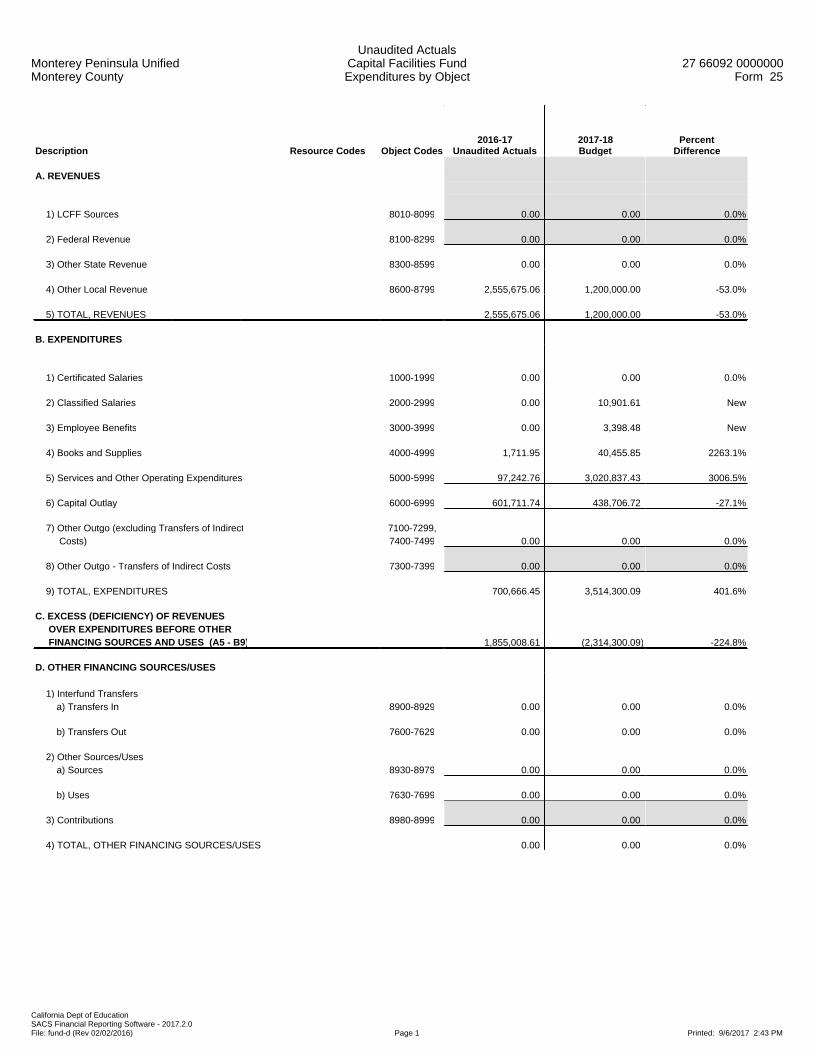
Monterey Peninsula UnifiedMonterey County
Unaudited ActualsCapital Facilities FundExpenditures by Object
27 66092 0000000Form 25
California Dept of EducationSACS Financial Reporting Software - 2017.2.0File: fund-d (Rev 02/02/2016) Page 1 Printed: 9/6/2017 2:43 PM
Description Resource Codes Object Codes2016-17
Unaudited Actuals2017-18Budget
PercentDifference
A. REVENUES
1) LCFF Sources 8010-8099 0.00 0.00 0.0%
2) Federal Revenue 8100-8299 0.00 0.00 0.0%
3) Other State Revenue 8300-8599 0.00 0.00 0.0%
4) Other Local Revenue 8600-8799 2,555,675.06 1,200,000.00 -53.0%
5) TOTAL, REVENUES 2,555,675.06 1,200,000.00 -53.0%
B. EXPENDITURES
1) Certificated Salaries 1000-1999 0.00 0.00 0.0%
2) Classified Salaries 2000-2999 0.00 10,901.61 New
3) Employee Benefits 3000-3999 0.00 3,398.48 New
4) Books and Supplies 4000-4999 1,711.95 40,455.85 2263.1%
5) Services and Other Operating Expenditures 5000-5999 97,242.76 3,020,837.43 3006.5%
6) Capital Outlay 6000-6999 601,711.74 438,706.72 -27.1%
7) Other Outgo (excluding Transfers of Indirect 7100-7299, Costs) 7400-7499 0.00 0.00 0.0%
8) Other Outgo - Transfers of Indirect Costs 7300-7399 0.00 0.00 0.0%
9) TOTAL, EXPENDITURES 700,666.45 3,514,300.09 401.6%
C. EXCESS (DEFICIENCY) OF REVENUES OVER EXPENDITURES BEFORE OTHER FINANCING SOURCES AND USES (A5 - B9) 1,855,008.61 (2,314,300.09) -224.8%
D. OTHER FINANCING SOURCES/USES 1) Interfund Transfers a) Transfers In 8900-8929 0.00 0.00 0.0%
b) Transfers Out 7600-7629 0.00 0.00 0.0%
2) Other Sources/Uses a) Sources 8930-8979 0.00 0.00 0.0%
b) Uses 7630-7699 0.00 0.00 0.0%
3) Contributions 8980-8999 0.00 0.00 0.0%
4) TOTAL, OTHER FINANCING SOURCES/USES 0.00 0.00 0.0%

Monterey Peninsula UnifiedMonterey County
Unaudited ActualsCapital Facilities FundExpenditures by Object
27 66092 0000000Form 25
California Dept of EducationSACS Financial Reporting Software - 2017.2.0File: fund-d (Rev 02/02/2016) Page 2 Printed: 9/6/2017 2:43 PM
Description Resource Codes Object Codes2016-17
Unaudited Actuals2017-18Budget
PercentDifference
E. NET INCREASE (DECREASE) IN FUND BALANCE (C + D4) 1,855,008.61 (2,314,300.09) -224.8%
F. FUND BALANCE, RESERVES 1) Beginning Fund Balance a) As of July 1 - Unaudited 9791 5,876,036.79 7,731,045.40 31.6%
b) Audit Adjustments 9793 0.00 0.00 0.0%
c) As of July 1 - Audited (F1a + F1b) 5,876,036.79 7,731,045.40 31.6%
d) Other Restatements 9795 0.00 0.00 0.0%
e) Adjusted Beginning Balance (F1c + F1d) 5,876,036.79 7,731,045.40 31.6%
2) Ending Balance, June 30 (E + F1e) 7,731,045.40 5,416,745.31 -29.9% Components of Ending Fund Balance a) Nonspendable Revolving Cash 9711 0.00 0.00 0.0%
Stores 9712 0.00 0.00 0.0%
Prepaid Expenditures 9713 0.00 0.00 0.0%
All Others 9719 0.00 0.00 0.0%
b) Restricted 9740 0.00 0.00 0.0%
c) Committed Stabilization Arrangements 9750 0.00 0.00 0.0%
Other Commitments 9760 0.00 0.00 0.0%
d) Assigned Other Assignments 9780 7,731,045.40 5,416,745.31 -29.9%
e) Unassigned/Unappropriated Reserve for Economic Uncertainties 9789 0.00 0.00 0.0%
Unassigned/Unappropriated Amount 9790 0.00 0.00 0.0%
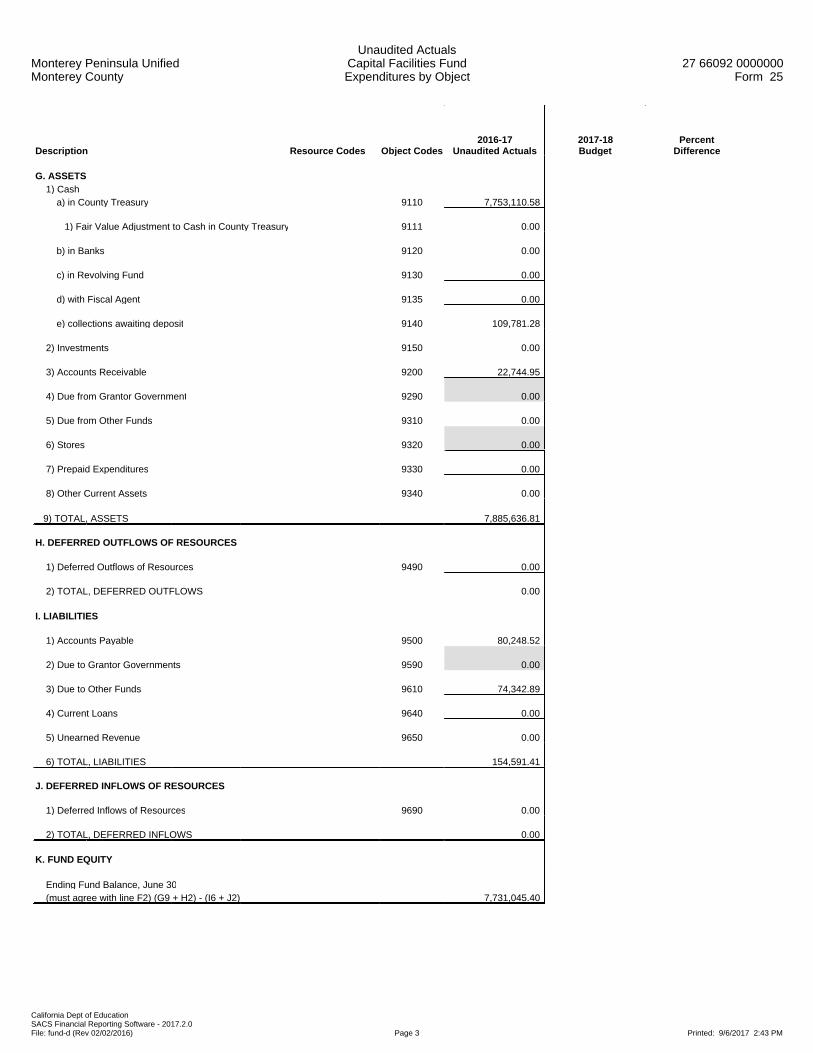
Monterey Peninsula UnifiedMonterey County
Unaudited ActualsCapital Facilities FundExpenditures by Object
27 66092 0000000Form 25
California Dept of EducationSACS Financial Reporting Software - 2017.2.0File: fund-d (Rev 02/02/2016) Page 3 Printed: 9/6/2017 2:43 PM
Description Resource Codes Object Codes2016-17
Unaudited Actuals2017-18Budget
PercentDifference
G. ASSETS 1) Cash a) in County Treasury 9110 7,753,110.58
1) Fair Value Adjustment to Cash in County Treasury 9111 0.00
b) in Banks 9120 0.00
c) in Revolving Fund 9130 0.00
d) with Fiscal Agent 9135 0.00
e) collections awaiting deposit 9140 109,781.28
2) Investments 9150 0.00
3) Accounts Receivable 9200 22,744.95
4) Due from Grantor Government 9290 0.00
5) Due from Other Funds 9310 0.00
6) Stores 9320 0.00
7) Prepaid Expenditures 9330 0.00
8) Other Current Assets 9340 0.00
9) TOTAL, ASSETS 7,885,636.81
H. DEFERRED OUTFLOWS OF RESOURCES
1) Deferred Outflows of Resources 9490 0.00
2) TOTAL, DEFERRED OUTFLOWS 0.00
I. LIABILITIES
1) Accounts Payable 9500 80,248.52
2) Due to Grantor Governments 9590 0.00
3) Due to Other Funds 9610 74,342.89
4) Current Loans 9640 0.00
5) Unearned Revenue 9650 0.00
6) TOTAL, LIABILITIES 154,591.41
J. DEFERRED INFLOWS OF RESOURCES
1) Deferred Inflows of Resources 9690 0.00
2) TOTAL, DEFERRED INFLOWS 0.00
K. FUND EQUITY
Ending Fund Balance, June 30 (must agree with line F2) (G9 + H2) - (I6 + J2) 7,731,045.40

Monterey Peninsula UnifiedMonterey County
Unaudited ActualsCapital Facilities FundExpenditures by Object
27 66092 0000000Form 25
California Dept of EducationSACS Financial Reporting Software - 2017.2.0File: fund-d (Rev 02/02/2016) Page 4 Printed: 9/6/2017 2:43 PM
Description Resource Codes Object Codes2016-17
Unaudited Actuals2017-18Budget
PercentDifference
OTHER STATE REVENUE
Tax Relief Subventions Restricted Levies - Other
Homeowners' Exemptions 8575 0.00 0.00 0.0%
Other Subventions/In-Lieu Taxes 8576 0.00 0.00 0.0%
All Other State Revenue 8590 0.00 0.00 0.0%
TOTAL, OTHER STATE REVENUE 0.00 0.00 0.0%
OTHER LOCAL REVENUE
Other Local Revenue County and District Taxes
Other Restricted Levies Secured Roll 8615 0.00 0.00 0.0%
Unsecured Roll 8616 0.00 0.00 0.0%
Prior Years' Taxes 8617 0.00 0.00 0.0%
Supplemental Taxes 8618 0.00 0.00 0.0%
Non-Ad Valorem Taxes Parcel Taxes 8621 0.00 0.00 0.0%
Other 8622 0.00 0.00 0.0%
Community Redevelopment Funds Not Subject to LCFF Deduction 8625 0.00 0.00 0.0%
Penalties and Interest from Delinquent Non-LCFF Taxes 8629 0.00 0.00 0.0%
Sales Sale of Equipment/Supplies 8631 0.00 0.00 0.0%
Interest 8660 77,578.71 0.00 -100.0%
Net Increase (Decrease) in the Fair Value of Investments 8662 0.00 0.00 0.0%
Fees and Contracts
Mitigation/Developer Fees 8681 2,478,096.35 1,200,000.00 -51.6%
Other Local Revenue
All Other Local Revenue 8699 0.00 0.00 0.0%
All Other Transfers In from All Others 8799 0.00 0.00 0.0%
TOTAL, OTHER LOCAL REVENUE 2,555,675.06 1,200,000.00 -53.0%
TOTAL, REVENUES 2,555,675.06 1,200,000.00 -53.0%
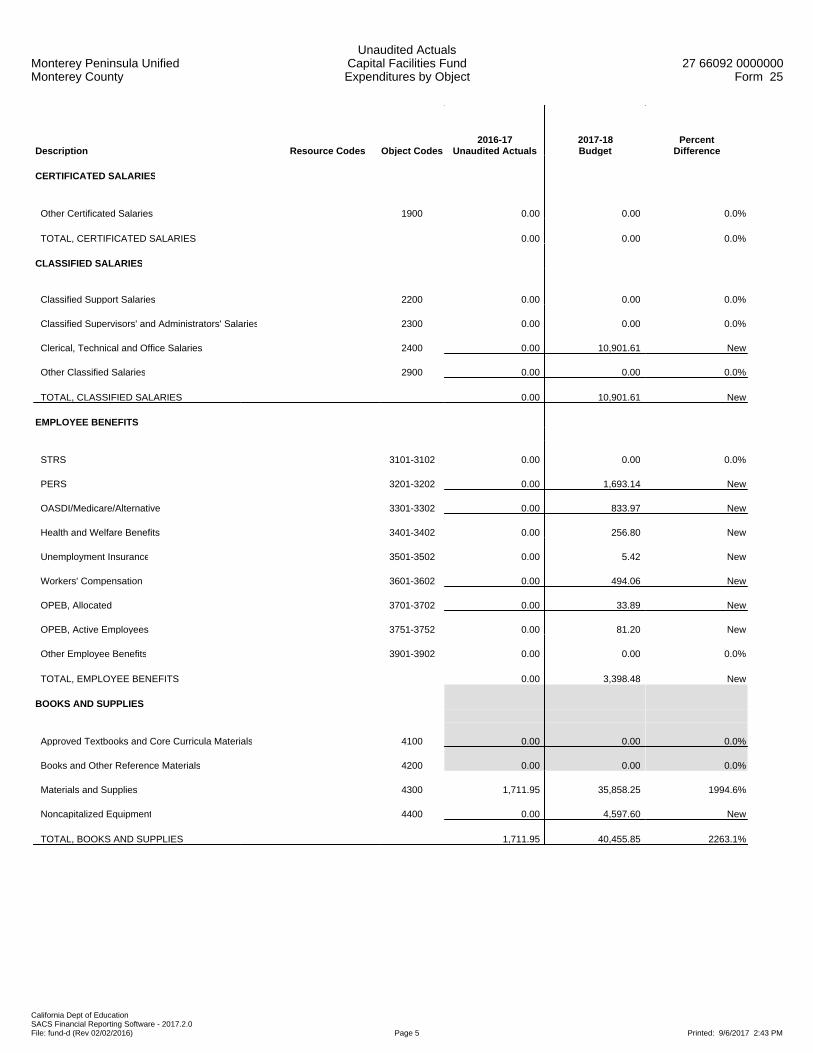
Monterey Peninsula UnifiedMonterey County
Unaudited ActualsCapital Facilities FundExpenditures by Object
27 66092 0000000Form 25
California Dept of EducationSACS Financial Reporting Software - 2017.2.0File: fund-d (Rev 02/02/2016) Page 5 Printed: 9/6/2017 2:43 PM
Description Resource Codes Object Codes2016-17
Unaudited Actuals2017-18Budget
PercentDifference
CERTIFICATED SALARIES
Other Certificated Salaries 1900 0.00 0.00 0.0%
TOTAL, CERTIFICATED SALARIES 0.00 0.00 0.0%
CLASSIFIED SALARIES
Classified Support Salaries 2200 0.00 0.00 0.0%
Classified Supervisors' and Administrators' Salaries 2300 0.00 0.00 0.0%
Clerical, Technical and Office Salaries 2400 0.00 10,901.61 New
Other Classified Salaries 2900 0.00 0.00 0.0%
TOTAL, CLASSIFIED SALARIES 0.00 10,901.61 New
EMPLOYEE BENEFITS
STRS 3101-3102 0.00 0.00 0.0%
PERS 3201-3202 0.00 1,693.14 New
OASDI/Medicare/Alternative 3301-3302 0.00 833.97 New
Health and Welfare Benefits 3401-3402 0.00 256.80 New
Unemployment Insurance 3501-3502 0.00 5.42 New
Workers' Compensation 3601-3602 0.00 494.06 New
OPEB, Allocated 3701-3702 0.00 33.89 New
OPEB, Active Employees 3751-3752 0.00 81.20 New
Other Employee Benefits 3901-3902 0.00 0.00 0.0%
TOTAL, EMPLOYEE BENEFITS 0.00 3,398.48 New
BOOKS AND SUPPLIES
Approved Textbooks and Core Curricula Materials 4100 0.00 0.00 0.0%
Books and Other Reference Materials 4200 0.00 0.00 0.0%
Materials and Supplies 4300 1,711.95 35,858.25 1994.6%
Noncapitalized Equipment 4400 0.00 4,597.60 New
TOTAL, BOOKS AND SUPPLIES 1,711.95 40,455.85 2263.1%

Monterey Peninsula UnifiedMonterey County
Unaudited ActualsCapital Facilities FundExpenditures by Object
27 66092 0000000Form 25
California Dept of EducationSACS Financial Reporting Software - 2017.2.0File: fund-d (Rev 02/02/2016) Page 6 Printed: 9/6/2017 2:43 PM
Description Resource Codes Object Codes2016-17
Unaudited Actuals2017-18Budget
PercentDifference
SERVICES AND OTHER OPERATING EXPENDITURES
Subagreements for Services 5100 0.00 0.00 0.0%
Travel and Conferences 5200 0.00 0.00 0.0%
Insurance 5400-5450 0.00 0.00 0.0%
Operations and Housekeeping Services 5500 0.00 0.00 0.0%
Rentals, Leases, Repairs, and Noncapitalized Improvements 5600 0.00 0.00 0.0%
Transfers of Direct Costs 5710 0.00 0.00 0.0%
Transfers of Direct Costs - Interfund 5750 74,342.89 0.00 -100.0%
Professional/Consulting Services and Operating Expenditures 5800 22,899.87 3,020,837.43 13091.5%
Communications 5900 0.00 0.00 0.0%
TOTAL, SERVICES AND OTHER OPERATING EXPENDITURES 97,242.76 3,020,837.43 3006.5%
CAPITAL OUTLAY
Land 6100 47,992.50 17,742.00 -63.0%
Land Improvements 6170 66,114.00 0.00 -100.0%
Buildings and Improvements of Buildings 6200 487,605.24 420,964.72 -13.7%
Books and Media for New School Libraries
or Major Expansion of School Libraries 6300 0.00 0.00 0.0%
Equipment 6400 0.00 0.00 0.0%
Equipment Replacement 6500 0.00 0.00 0.0%
TOTAL, CAPITAL OUTLAY 601,711.74 438,706.72 -27.1%
OTHER OUTGO (excluding Transfers of Indirect Costs)
Other Transfers Out
All Other Transfers Out to All Others 7299 0.00 0.00 0.0%
Debt Service
Debt Service - Interest 7438 0.00 0.00 0.0%
Other Debt Service - Principal 7439 0.00 0.00 0.0%
TOTAL, OTHER OUTGO (excluding Transfers of Indirect Costs) 0.00 0.00 0.0%
TOTAL, EXPENDITURES 700,666.45 3,514,300.09 401.6%
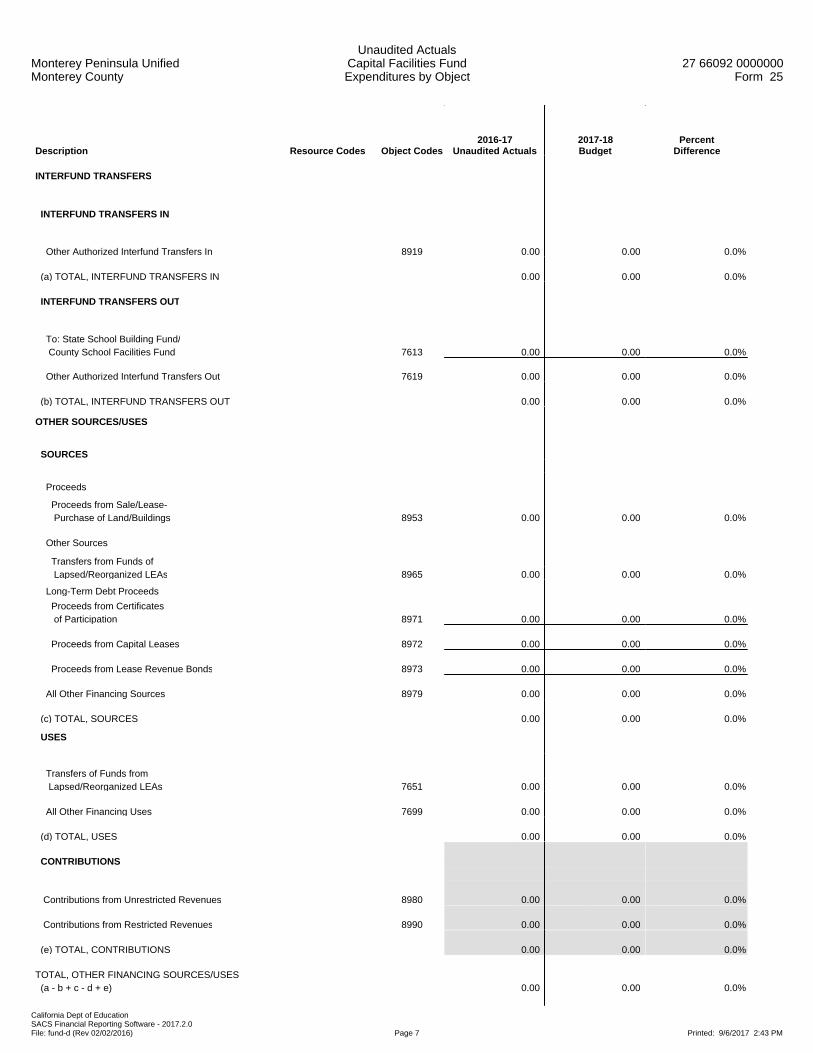
Monterey Peninsula UnifiedMonterey County
Unaudited ActualsCapital Facilities FundExpenditures by Object
27 66092 0000000Form 25
California Dept of EducationSACS Financial Reporting Software - 2017.2.0File: fund-d (Rev 02/02/2016) Page 7 Printed: 9/6/2017 2:43 PM
Description Resource Codes Object Codes2016-17
Unaudited Actuals2017-18Budget
PercentDifference
INTERFUND TRANSFERS
INTERFUND TRANSFERS IN
Other Authorized Interfund Transfers In 8919 0.00 0.00 0.0%
(a) TOTAL, INTERFUND TRANSFERS IN 0.00 0.00 0.0%
INTERFUND TRANSFERS OUT
To: State School Building Fund/ County School Facilities Fund 7613 0.00 0.00 0.0%
Other Authorized Interfund Transfers Out 7619 0.00 0.00 0.0%
(b) TOTAL, INTERFUND TRANSFERS OUT 0.00 0.00 0.0%
OTHER SOURCES/USES
SOURCES
Proceeds
Proceeds from Sale/Lease- Purchase of Land/Buildings 8953 0.00 0.00 0.0%
Other Sources
Transfers from Funds of Lapsed/Reorganized LEAs 8965 0.00 0.00 0.0%
Long-Term Debt Proceeds
Proceeds from Certificates of Participation 8971 0.00 0.00 0.0%
Proceeds from Capital Leases 8972 0.00 0.00 0.0%
Proceeds from Lease Revenue Bonds 8973 0.00 0.00 0.0%
All Other Financing Sources 8979 0.00 0.00 0.0%
(c) TOTAL, SOURCES 0.00 0.00 0.0%
USES
Transfers of Funds from Lapsed/Reorganized LEAs 7651 0.00 0.00 0.0%
All Other Financing Uses 7699 0.00 0.00 0.0%
(d) TOTAL, USES 0.00 0.00 0.0%
CONTRIBUTIONS
Contributions from Unrestricted Revenues 8980 0.00 0.00 0.0%
Contributions from Restricted Revenues 8990 0.00 0.00 0.0%
(e) TOTAL, CONTRIBUTIONS 0.00 0.00 0.0%
TOTAL, OTHER FINANCING SOURCES/USES (a - b + c - d + e) 0.00 0.00 0.0%

Monterey Peninsula UnifiedMonterey County
Unaudited ActualsCapital Facilities Fund
Expenditures by Function27 66092 0000000
Form 25
California Dept of EducationSACS Financial Reporting Software - 2017.2.0File: fund-d (Rev 02/02/2016) Page 1 Printed: 9/6/2017 2:43 PM
Description Function Codes Object Codes2016-17
Unaudited Actuals2017-18Budget
PercentDifference
A. REVENUES
1) LCFF Sources 8010-8099 0.00 0.00 0.0%
2) Federal Revenue 8100-8299 0.00 0.00 0.0%
3) Other State Revenue 8300-8599 0.00 0.00 0.0%
4) Other Local Revenue 8600-8799 2,555,675.06 1,200,000.00 -53.0%
5) TOTAL, REVENUES 2,555,675.06 1,200,000.00 -53.0%
B. EXPENDITURES (Objects 1000-7999)
1) Instruction 1000-1999 0.00 0.00 0.0%
2) Instruction - Related Services 2000-2999 0.00 0.00 0.0%
3) Pupil Services 3000-3999 0.00 0.00 0.0%
4) Ancillary Services 4000-4999 0.00 0.00 0.0%
5) Community Services 5000-5999 0.00 0.00 0.0%
6) Enterprise 6000-6999 0.00 0.00 0.0%
7) General Administration 7000-7999 74,342.89 0.00 -100.0%
8) Plant Services 8000-8999 626,323.56 3,514,300.09 461.1%
9) Other Outgo 9000-9999Except
7600-7699 0.00 0.00 0.0%
10) TOTAL, EXPENDITURES 700,666.45 3,514,300.09 401.6%
C. EXCESS (DEFICIENCY) OF REVENUES OVER EXPENDITURES BEFORE OTHER FINANCING SOURCES AND USES (A5 - B10) 1,855,008.61 (2,314,300.09) -224.8%
D. OTHER FINANCING SOURCES/USES 1) Interfund Transfers a) Transfers In 8900-8929 0.00 0.00 0.0%
b) Transfers Out 7600-7629 0.00 0.00 0.0%
2) Other Sources/Uses a) Sources 8930-8979 0.00 0.00 0.0%
b) Uses 7630-7699 0.00 0.00 0.0%
3) Contributions 8980-8999 0.00 0.00 0.0%
4) TOTAL, OTHER FINANCING SOURCES/USES 0.00 0.00 0.0%

Monterey Peninsula UnifiedMonterey County
Unaudited ActualsCapital Facilities Fund
Expenditures by Function27 66092 0000000
Form 25
California Dept of EducationSACS Financial Reporting Software - 2017.2.0File: fund-d (Rev 02/02/2016) Page 2 Printed: 9/6/2017 2:43 PM
Description Function Codes Object Codes2016-17
Unaudited Actuals2017-18Budget
PercentDifference
E. NET INCREASE (DECREASE) IN FUND BALANCE (C + D4) 1,855,008.61 (2,314,300.09) -224.8%
F. FUND BALANCE, RESERVES 1) Beginning Fund Balance
a) As of July 1 - Unaudited 9791 5,876,036.79 7,731,045.40 31.6%
b) Audit Adjustments 9793 0.00 0.00 0.0%
c) As of July 1 - Audited (F1a + F1b) 5,876,036.79 7,731,045.40 31.6%
d) Other Restatements 9795 0.00 0.00 0.0%
e) Adjusted Beginning Balance (F1c + F1d) 5,876,036.79 7,731,045.40 31.6%
2) Ending Balance, June 30 (E + F1e) 7,731,045.40 5,416,745.31 -29.9% Components of Ending Fund Balance a) Nonspendable Revolving Cash 9711 0.00 0.00 0.0%
Stores 9712 0.00 0.00 0.0%
Prepaid Expenditures 9713 0.00 0.00 0.0%
All Others 9719 0.00 0.00 0.0%
b) Restricted 9740 0.00 0.00 0.0%
c) Committed Stabilization Arrangements 9750 0.00 0.00 0.0%
Other Commitments (by Resource/Object) 9760 0.00 0.00 0.0%
d) Assigned Other Assignments (by Resource/Object) 9780 7,731,045.40 5,416,745.31 -29.9%
e) Unassigned/Unappropriated Reserve for Economic Uncertainties 9789 0.00 0.00 0.0%
Unassigned/Unappropriated Amount 9790 0.00 0.00 0.0%
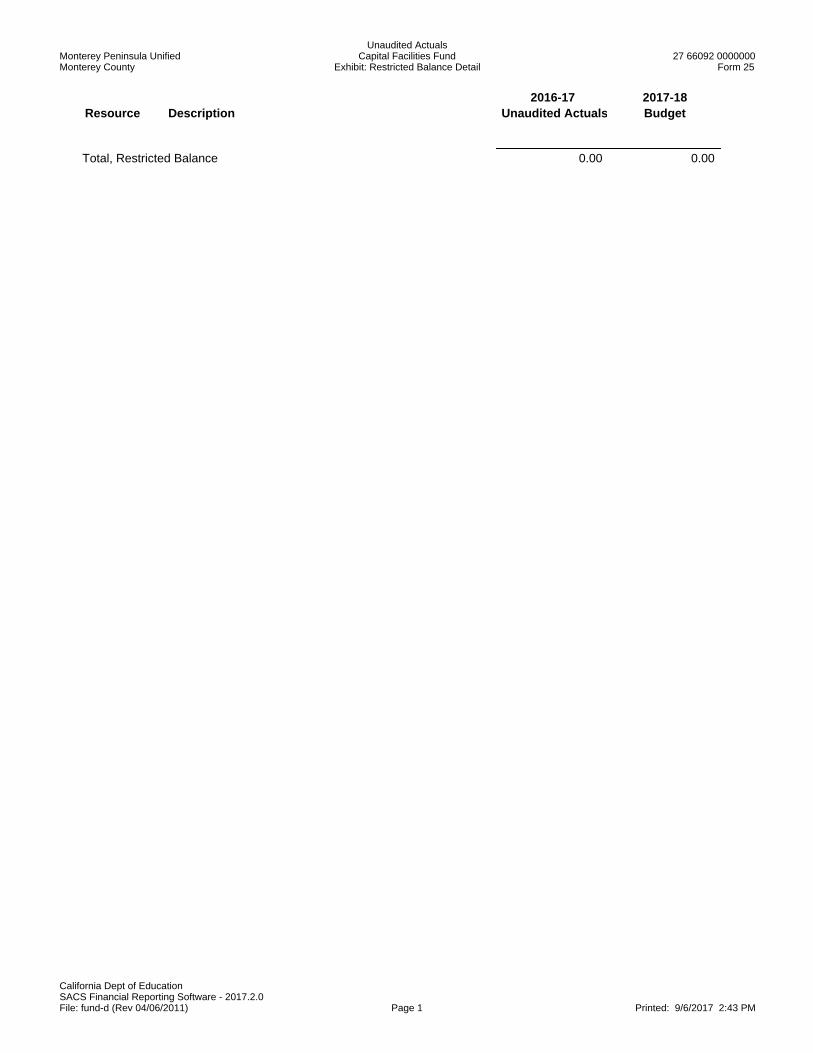
Monterey Peninsula UnifiedMonterey County
Unaudited ActualsCapital Facilities Fund
Exhibit: Restricted Balance Detail27 66092 0000000
Form 25
California Dept of EducationSACS Financial Reporting Software - 2017.2.0File: fund-d (Rev 04/06/2011) Page 1 Printed: 9/6/2017 2:43 PM
2016-17 2017-18Resource Description Unaudited Actuals Budget
Total, Restricted Balance 0.00 0.00

Monterey Peninsula UnifiedMonterey County
Unaudited ActualsSpecial Reserve Fund for Capital Outlay Projects
Expenditures by Object27 66092 0000000
Form 40
California Dept of EducationSACS Financial Reporting Software - 2017.2.0File: fund-d (Rev 02/02/2016) Page 1 Printed: 9/6/2017 2:43 PM
Description Resource Codes Object Codes2016-17
Unaudited Actuals2017-18Budget
PercentDifference
A. REVENUES
1) LCFF Sources 8010-8099 0.00 0.00 0.0%
2) Federal Revenue 8100-8299 0.00 0.00 0.0%
3) Other State Revenue 8300-8599 0.00 0.00 0.0%
4) Other Local Revenue 8600-8799 92,186.01 0.00 -100.0%
5) TOTAL, REVENUES 92,186.01 0.00 -100.0%
B. EXPENDITURES
1) Certificated Salaries 1000-1999 0.00 0.00 0.0%
2) Classified Salaries 2000-2999 56,538.43 0.00 -100.0%
3) Employee Benefits 3000-3999 7,125.65 0.00 -100.0%
4) Books and Supplies 4000-4999 300,577.63 39,517.19 -86.9%
5) Services and Other Operating Expenditures 5000-5999 375,795.86 470,265.37 25.1%
6) Capital Outlay 6000-6999 456,633.13 85,217.44 -81.3%
7) Other Outgo (excluding Transfers of Indirect 7100-7299, Costs) 7400-7499 0.00 0.00 0.0%
8) Other Outgo - Transfers of Indirect Costs 7300-7399 0.00 0.00 0.0%
9) TOTAL, EXPENDITURES 1,196,670.70 595,000.00 -50.3%
C. EXCESS (DEFICIENCY) OF REVENUES OVER EXPENDITURES BEFORE OTHER FINANCING SOURCES AND USES (A5 - B9) (1,104,484.69) (595,000.00) -46.1%
D. OTHER FINANCING SOURCES/USES 1) Interfund Transfers a) Transfers In 8900-8929 0.00 0.00 0.0%
b) Transfers Out 7600-7629 0.00 0.00 0.0%
2) Other Sources/Uses a) Sources 8930-8979 0.00 0.00 0.0%
b) Uses 7630-7699 0.00 0.00 0.0%
3) Contributions 8980-8999 0.00 0.00 0.0%
4) TOTAL, OTHER FINANCING SOURCES/USES 0.00 0.00 0.0%

Monterey Peninsula UnifiedMonterey County
Unaudited ActualsSpecial Reserve Fund for Capital Outlay Projects
Expenditures by Object27 66092 0000000
Form 40
California Dept of EducationSACS Financial Reporting Software - 2017.2.0File: fund-d (Rev 02/02/2016) Page 2 Printed: 9/6/2017 2:43 PM
Description Resource Codes Object Codes2016-17
Unaudited Actuals2017-18Budget
PercentDifference
E. NET INCREASE (DECREASE) IN FUND BALANCE (C + D4) (1,104,484.69) (595,000.00) -46.1%
F. FUND BALANCE, RESERVES 1) Beginning Fund Balance a) As of July 1 - Unaudited 9791 1,745,726.51 641,241.82 -63.3%
b) Audit Adjustments 9793 0.00 0.00 0.0%
c) As of July 1 - Audited (F1a + F1b) 1,745,726.51 641,241.82 -63.3%
d) Other Restatements 9795 0.00 0.00 0.0%
e) Adjusted Beginning Balance (F1c + F1d) 1,745,726.51 641,241.82 -63.3%
2) Ending Balance, June 30 (E + F1e) 641,241.82 46,241.82 -92.8% Components of Ending Fund Balance a) Nonspendable Revolving Cash 9711 0.00 0.00 0.0%
Stores 9712 0.00 0.00 0.0%
Prepaid Expenditures 9713 0.00 0.00 0.0%
All Others 9719 0.00 0.00 0.0%
b) Restricted 9740 0.00 0.00 0.0%
c) Committed Stabilization Arrangements 9750 0.00 0.00 0.0%
Other Commitments 9760 0.00 0.00 0.0%
d) Assigned Other Assignments 9780 641,241.82 46,241.82 -92.8%
e) Unassigned/Unappropriated Reserve for Economic Uncertainties 9789 0.00 0.00 0.0%
Unassigned/Unappropriated Amount 9790 0.00 0.00 0.0%

Monterey Peninsula UnifiedMonterey County
Unaudited ActualsSpecial Reserve Fund for Capital Outlay Projects
Expenditures by Object27 66092 0000000
Form 40
California Dept of EducationSACS Financial Reporting Software - 2017.2.0File: fund-d (Rev 02/02/2016) Page 3 Printed: 9/6/2017 2:43 PM
Description Resource Codes Object Codes2016-17
Unaudited Actuals2017-18Budget
PercentDifference
G. ASSETS 1) Cash a) in County Treasury 9110 645,185.33
1) Fair Value Adjustment to Cash in County Treasury 9111 0.00
b) in Banks 9120 0.00
c) in Revolving Fund 9130 0.00
d) with Fiscal Agent 9135 0.00
e) collections awaiting deposit 9140 6,483.87
2) Investments 9150 0.00
3) Accounts Receivable 9200 22,685.64
4) Due from Grantor Government 9290 0.00
5) Due from Other Funds 9310 0.00
6) Stores 9320 0.00
7) Prepaid Expenditures 9330 0.00
8) Other Current Assets 9340 0.00
9) TOTAL, ASSETS 674,354.84
H. DEFERRED OUTFLOWS OF RESOURCES
1) Deferred Outflows of Resources 9490 0.00
2) TOTAL, DEFERRED OUTFLOWS 0.00
I. LIABILITIES
1) Accounts Payable 9500 32,966.82
2) Due to Grantor Governments 9590 0.00
3) Due to Other Funds 9610 146.20
4) Current Loans 9640 0.00
5) Unearned Revenue 9650 0.00
6) TOTAL, LIABILITIES 33,113.02
J. DEFERRED INFLOWS OF RESOURCES
1) Deferred Inflows of Resources 9690 0.00
2) TOTAL, DEFERRED INFLOWS 0.00
K. FUND EQUITY
Ending Fund Balance, June 30 (must agree with line F2) (G9 + H2) - (I6 + J2) 641,241.82
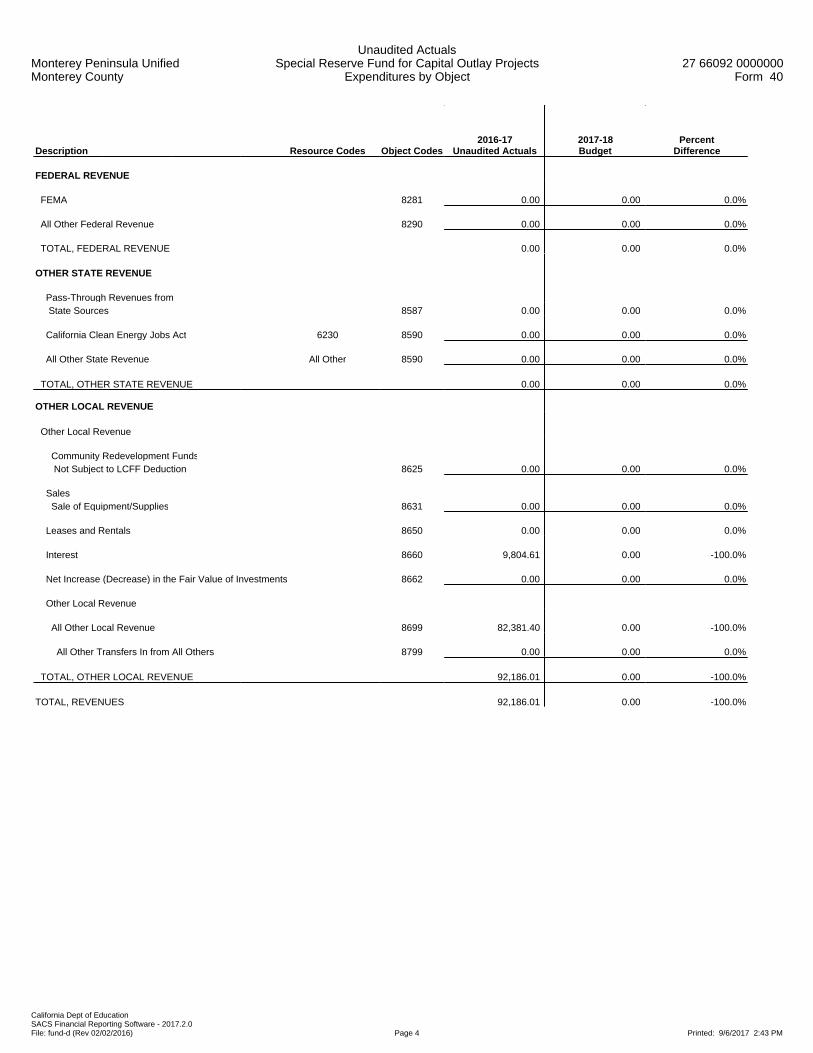
Monterey Peninsula UnifiedMonterey County
Unaudited ActualsSpecial Reserve Fund for Capital Outlay Projects
Expenditures by Object27 66092 0000000
Form 40
California Dept of EducationSACS Financial Reporting Software - 2017.2.0File: fund-d (Rev 02/02/2016) Page 4 Printed: 9/6/2017 2:43 PM
Description Resource Codes Object Codes2016-17
Unaudited Actuals2017-18Budget
PercentDifference
FEDERAL REVENUE
FEMA 8281 0.00 0.00 0.0%
All Other Federal Revenue 8290 0.00 0.00 0.0%
TOTAL, FEDERAL REVENUE 0.00 0.00 0.0%
OTHER STATE REVENUE
Pass-Through Revenues from State Sources 8587 0.00 0.00 0.0%
California Clean Energy Jobs Act 6230 8590 0.00 0.00 0.0%
All Other State Revenue All Other 8590 0.00 0.00 0.0%
TOTAL, OTHER STATE REVENUE 0.00 0.00 0.0%
OTHER LOCAL REVENUE
Other Local Revenue
Community Redevelopment Funds Not Subject to LCFF Deduction 8625 0.00 0.00 0.0%
Sales Sale of Equipment/Supplies 8631 0.00 0.00 0.0%
Leases and Rentals 8650 0.00 0.00 0.0%
Interest 8660 9,804.61 0.00 -100.0%
Net Increase (Decrease) in the Fair Value of Investments 8662 0.00 0.00 0.0%
Other Local Revenue
All Other Local Revenue 8699 82,381.40 0.00 -100.0%
All Other Transfers In from All Others 8799 0.00 0.00 0.0%
TOTAL, OTHER LOCAL REVENUE 92,186.01 0.00 -100.0%
TOTAL, REVENUES 92,186.01 0.00 -100.0%

Monterey Peninsula UnifiedMonterey County
Unaudited ActualsSpecial Reserve Fund for Capital Outlay Projects
Expenditures by Object27 66092 0000000
Form 40
California Dept of EducationSACS Financial Reporting Software - 2017.2.0File: fund-d (Rev 02/02/2016) Page 5 Printed: 9/6/2017 2:43 PM
Description Resource Codes Object Codes2016-17
Unaudited Actuals2017-18Budget
PercentDifference
CLASSIFIED SALARIES
Classified Support Salaries 2200 56,538.43 0.00 -100.0%
Classified Supervisors' and Administrators' Salaries 2300 0.00 0.00 0.0%
Clerical, Technical and Office Salaries 2400 0.00 0.00 0.0%
Other Classified Salaries 2900 0.00 0.00 0.0%
TOTAL, CLASSIFIED SALARIES 56,538.43 0.00 -100.0%
EMPLOYEE BENEFITS
STRS 3101-3102 0.00 0.00 0.0%
PERS 3201-3202 0.00 0.00 0.0%
OASDI/Medicare/Alternative 3301-3302 4,325.32 0.00 -100.0%
Health and Welfare Benefits 3401-3402 0.00 0.00 0.0%
Unemployment Insurance 3501-3502 28.28 0.00 -100.0%
Workers' Compensation 3601-3602 2,562.35 0.00 -100.0%
OPEB, Allocated 3701-3702 209.70 0.00 -100.0%
OPEB, Active Employees 3751-3752 0.00 0.00 0.0%
Other Employee Benefits 3901-3902 0.00 0.00 0.0%
TOTAL, EMPLOYEE BENEFITS 7,125.65 0.00 -100.0%
BOOKS AND SUPPLIES
Books and Other Reference Materials 4200 0.00 0.00 0.0%
Materials and Supplies 4300 176,944.00 17,457.30 -90.1%
Noncapitalized Equipment 4400 123,633.63 22,059.89 -82.2%
TOTAL, BOOKS AND SUPPLIES 300,577.63 39,517.19 -86.9%
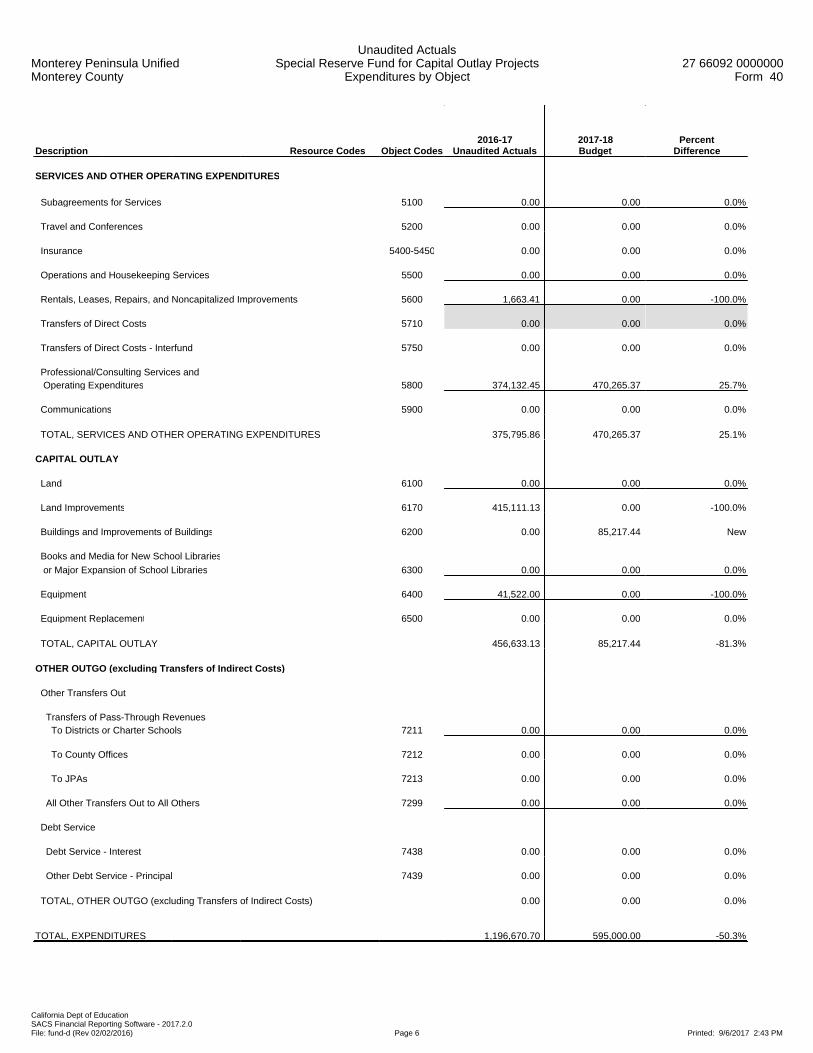
Monterey Peninsula UnifiedMonterey County
Unaudited ActualsSpecial Reserve Fund for Capital Outlay Projects
Expenditures by Object27 66092 0000000
Form 40
California Dept of EducationSACS Financial Reporting Software - 2017.2.0File: fund-d (Rev 02/02/2016) Page 6 Printed: 9/6/2017 2:43 PM
Description Resource Codes Object Codes2016-17
Unaudited Actuals2017-18Budget
PercentDifference
SERVICES AND OTHER OPERATING EXPENDITURES
Subagreements for Services 5100 0.00 0.00 0.0%
Travel and Conferences 5200 0.00 0.00 0.0%
Insurance 5400-5450 0.00 0.00 0.0%
Operations and Housekeeping Services 5500 0.00 0.00 0.0%
Rentals, Leases, Repairs, and Noncapitalized Improvements 5600 1,663.41 0.00 -100.0%
Transfers of Direct Costs 5710 0.00 0.00 0.0%
Transfers of Direct Costs - Interfund 5750 0.00 0.00 0.0%
Professional/Consulting Services and Operating Expenditures 5800 374,132.45 470,265.37 25.7%
Communications 5900 0.00 0.00 0.0%
TOTAL, SERVICES AND OTHER OPERATING EXPENDITURES 375,795.86 470,265.37 25.1%
CAPITAL OUTLAY
Land 6100 0.00 0.00 0.0%
Land Improvements 6170 415,111.13 0.00 -100.0%
Buildings and Improvements of Buildings 6200 0.00 85,217.44 New
Books and Media for New School Libraries
or Major Expansion of School Libraries 6300 0.00 0.00 0.0%
Equipment 6400 41,522.00 0.00 -100.0%
Equipment Replacement 6500 0.00 0.00 0.0%
TOTAL, CAPITAL OUTLAY 456,633.13 85,217.44 -81.3%
OTHER OUTGO (excluding Transfers of Indirect Costs)
Other Transfers Out
Transfers of Pass-Through Revenues To Districts or Charter Schools 7211 0.00 0.00 0.0%
To County Offices 7212 0.00 0.00 0.0%
To JPAs 7213 0.00 0.00 0.0%
All Other Transfers Out to All Others 7299 0.00 0.00 0.0%
Debt Service
Debt Service - Interest 7438 0.00 0.00 0.0%
Other Debt Service - Principal 7439 0.00 0.00 0.0%
TOTAL, OTHER OUTGO (excluding Transfers of Indirect Costs) 0.00 0.00 0.0%
TOTAL, EXPENDITURES 1,196,670.70 595,000.00 -50.3%
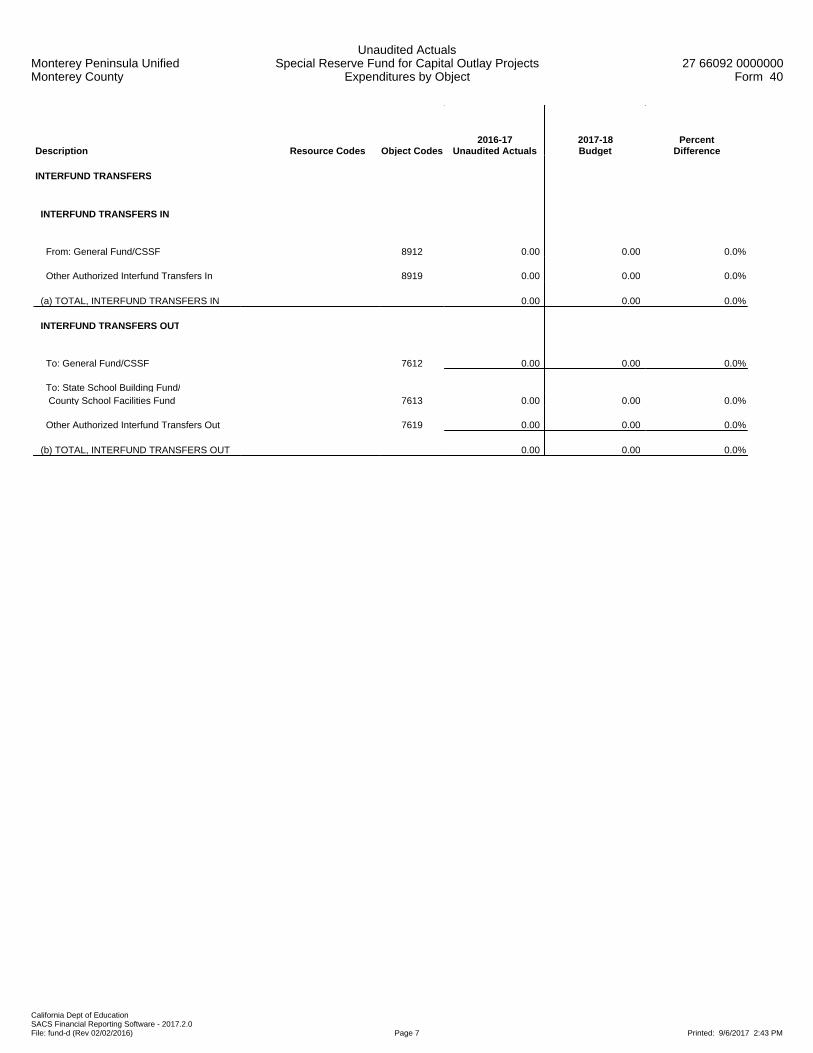
Monterey Peninsula UnifiedMonterey County
Unaudited ActualsSpecial Reserve Fund for Capital Outlay Projects
Expenditures by Object27 66092 0000000
Form 40
California Dept of EducationSACS Financial Reporting Software - 2017.2.0File: fund-d (Rev 02/02/2016) Page 7 Printed: 9/6/2017 2:43 PM
Description Resource Codes Object Codes2016-17
Unaudited Actuals2017-18Budget
PercentDifference
INTERFUND TRANSFERS
INTERFUND TRANSFERS IN
From: General Fund/CSSF 8912 0.00 0.00 0.0%
Other Authorized Interfund Transfers In 8919 0.00 0.00 0.0%
(a) TOTAL, INTERFUND TRANSFERS IN 0.00 0.00 0.0%
INTERFUND TRANSFERS OUT
To: General Fund/CSSF 7612 0.00 0.00 0.0%
To: State School Building Fund/ County School Facilities Fund 7613 0.00 0.00 0.0%
Other Authorized Interfund Transfers Out 7619 0.00 0.00 0.0%
(b) TOTAL, INTERFUND TRANSFERS OUT 0.00 0.00 0.0%

Monterey Peninsula UnifiedMonterey County
Unaudited ActualsSpecial Reserve Fund for Capital Outlay Projects
Expenditures by Object27 66092 0000000
Form 40
California Dept of EducationSACS Financial Reporting Software - 2017.2.0File: fund-d (Rev 02/02/2016) Page 8 Printed: 9/6/2017 2:43 PM
Description Resource Codes Object Codes2016-17
Unaudited Actuals2017-18Budget
PercentDifference
OTHER SOURCES/USES
SOURCES
Proceeds
Proceeds from Sale/Lease- Purchase of Land/Buildings 8953 0.00 0.00 0.0%
Other Sources
Transfers from Funds of Lapsed/Reorganized LEAs 8965 0.00 0.00 0.0%
Long-Term Debt Proceeds
Proceeds from Certificates of Participation 8971 0.00 0.00 0.0%
Proceeds from Capital Leases 8972 0.00 0.00 0.0%
Proceeds from Lease Revenue Bonds 8973 0.00 0.00 0.0%
All Other Financing Sources 8979 0.00 0.00 0.0%
(c) TOTAL, SOURCES 0.00 0.00 0.0%
USES
Transfers of Funds from Lapsed/Reorganized LEAs 7651 0.00 0.00 0.0%
All Other Financing Uses 7699 0.00 0.00 0.0%
(d) TOTAL, USES 0.00 0.00 0.0%
CONTRIBUTIONS
Contributions from Unrestricted Revenues 8980 0.00 0.00 0.0%
Contributions from Restricted Revenues 8990 0.00 0.00 0.0%
(e) TOTAL, CONTRIBUTIONS 0.00 0.00 0.0%
TOTAL, OTHER FINANCING SOURCES/USES (a - b + c - d + e) 0.00 0.00 0.0%
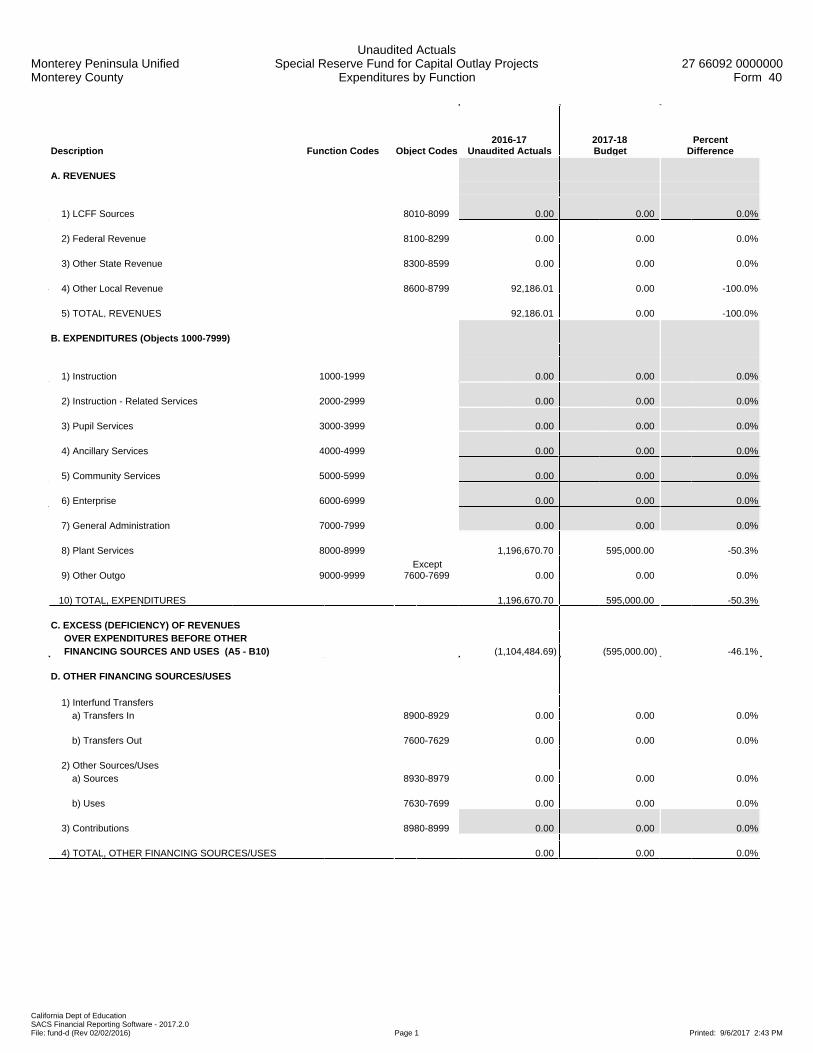
Monterey Peninsula UnifiedMonterey County
Unaudited ActualsSpecial Reserve Fund for Capital Outlay Projects
Expenditures by Function27 66092 0000000
Form 40
California Dept of EducationSACS Financial Reporting Software - 2017.2.0File: fund-d (Rev 02/02/2016) Page 1 Printed: 9/6/2017 2:43 PM
Description Function Codes Object Codes2016-17
Unaudited Actuals2017-18Budget
PercentDifference
A. REVENUES
1) LCFF Sources 8010-8099 0.00 0.00 0.0%
2) Federal Revenue 8100-8299 0.00 0.00 0.0%
3) Other State Revenue 8300-8599 0.00 0.00 0.0%
4) Other Local Revenue 8600-8799 92,186.01 0.00 -100.0%
5) TOTAL, REVENUES 92,186.01 0.00 -100.0%
B. EXPENDITURES (Objects 1000-7999)
1) Instruction 1000-1999 0.00 0.00 0.0%
2) Instruction - Related Services 2000-2999 0.00 0.00 0.0%
3) Pupil Services 3000-3999 0.00 0.00 0.0%
4) Ancillary Services 4000-4999 0.00 0.00 0.0%
5) Community Services 5000-5999 0.00 0.00 0.0%
6) Enterprise 6000-6999 0.00 0.00 0.0%
7) General Administration 7000-7999 0.00 0.00 0.0%
8) Plant Services 8000-8999 1,196,670.70 595,000.00 -50.3%
9) Other Outgo 9000-9999Except
7600-7699 0.00 0.00 0.0%
10) TOTAL, EXPENDITURES 1,196,670.70 595,000.00 -50.3%
C. EXCESS (DEFICIENCY) OF REVENUES OVER EXPENDITURES BEFORE OTHER FINANCING SOURCES AND USES (A5 - B10) (1,104,484.69) (595,000.00) -46.1%
D. OTHER FINANCING SOURCES/USES 1) Interfund Transfers a) Transfers In 8900-8929 0.00 0.00 0.0%
b) Transfers Out 7600-7629 0.00 0.00 0.0%
2) Other Sources/Uses a) Sources 8930-8979 0.00 0.00 0.0%
b) Uses 7630-7699 0.00 0.00 0.0%
3) Contributions 8980-8999 0.00 0.00 0.0%
4) TOTAL, OTHER FINANCING SOURCES/USES 0.00 0.00 0.0%

Monterey Peninsula UnifiedMonterey County
Unaudited ActualsSpecial Reserve Fund for Capital Outlay Projects
Expenditures by Function27 66092 0000000
Form 40
California Dept of EducationSACS Financial Reporting Software - 2017.2.0File: fund-d (Rev 02/02/2016) Page 2 Printed: 9/6/2017 2:43 PM
Description Function Codes Object Codes2016-17
Unaudited Actuals2017-18Budget
PercentDifference
E. NET INCREASE (DECREASE) IN FUND BALANCE (C + D4) (1,104,484.69) (595,000.00) -46.1%
F. FUND BALANCE, RESERVES 1) Beginning Fund Balance
a) As of July 1 - Unaudited 9791 1,745,726.51 641,241.82 -63.3%
b) Audit Adjustments 9793 0.00 0.00 0.0%
c) As of July 1 - Audited (F1a + F1b) 1,745,726.51 641,241.82 -63.3%
d) Other Restatements 9795 0.00 0.00 0.0%
e) Adjusted Beginning Balance (F1c + F1d) 1,745,726.51 641,241.82 -63.3%
2) Ending Balance, June 30 (E + F1e) 641,241.82 46,241.82 -92.8% Components of Ending Fund Balance a) Nonspendable Revolving Cash 9711 0.00 0.00 0.0%
Stores 9712 0.00 0.00 0.0%
Prepaid Expenditures 9713 0.00 0.00 0.0%
All Others 9719 0.00 0.00 0.0%
b) Restricted 9740 0.00 0.00 0.0%
c) Committed Stabilization Arrangements 9750 0.00 0.00 0.0%
Other Commitments (by Resource/Object) 9760 0.00 0.00 0.0%
d) Assigned Other Assignments (by Resource/Object) 9780 641,241.82 46,241.82 -92.8%
e) Unassigned/Unappropriated Reserve for Economic Uncertainties 9789 0.00 0.00 0.0%
Unassigned/Unappropriated Amount 9790 0.00 0.00 0.0%
Monterey Peninsula UnifiedMonterey County
Unaudited ActualsSpecial Reserve Fund for Capital Outlay Projects
Exhibit: Restricted Balance Detail27 66092 0000000
Form 40
California Dept of EducationSACS Financial Reporting Software - 2017.2.0File: fund-d (Rev 04/06/2011) Page 1 Printed: 9/6/2017 2:43 PM
2016-17 2017-18Resource Description Unaudited Actuals Budget
Total, Restricted Balance 0.00 0.00

Monterey Peninsula UnifiedMonterey County
Unaudited ActualsBond Interest and Redemption Fund
Expenditures by Object27 66092 0000000
Form 51
California Dept of EducationSACS Financial Reporting Software - 2017.2.0File: fund-d (Rev 02/02/2016) Page 1 Printed: 9/6/2017 2:44 PM
Description Resource Codes Object Codes2016-17
Unaudited Actuals2017-18Budget
PercentDifference
A. REVENUES
1) LCFF Sources 8010-8099 0.00 0.00 0.0%
2) Federal Revenue 8100-8299 0.00 0.00 0.0%
3) Other State Revenue 8300-8599 19,830.16 0.00 -100.0%
4) Other Local Revenue 8600-8799 3,473,268.78 0.00 -100.0%
5) TOTAL, REVENUES 3,493,098.94 0.00 -100.0%
B. EXPENDITURES
1) Certificated Salaries 1000-1999 0.00 0.00 0.0%
2) Classified Salaries 2000-2999 0.00 0.00 0.0%
3) Employee Benefits 3000-3999 0.00 0.00 0.0%
4) Books and Supplies 4000-4999 0.00 0.00 0.0%
5) Services and Other Operating Expenditures 5000-5999 0.00 0.00 0.0%
6) Capital Outlay 6000-6999 0.00 0.00 0.0%
7) Other Outgo (excluding Transfers of Indirect 7100-7299, Costs) 7400-7499 2,789,430.38 0.00 -100.0%
8) Other Outgo - Transfers of Indirect Costs 7300-7399 0.00 0.00 0.0%
9) TOTAL, EXPENDITURES 2,789,430.38 0.00 -100.0%
C. EXCESS (DEFICIENCY) OF REVENUES OVER EXPENDITURES BEFORE OTHER FINANCING SOURCES AND USES (A5 - B9) 703,668.56 0.00 -100.0%
D. OTHER FINANCING SOURCES/USES 1) Interfund Transfers a) Transfers In 8900-8929 0.00 0.00 0.0%
b) Transfers Out 7600-7629 0.00 0.00 0.0%
2) Other Sources/Uses a) Sources 8930-8979 1,148,992.60 0.00 -100.0%
b) Uses 7630-7699 0.00 0.00 0.0%
3) Contributions 8980-8999 0.00 0.00 0.0%
4) TOTAL, OTHER FINANCING SOURCES/USES 1,148,992.60 0.00 -100.0%

Monterey Peninsula UnifiedMonterey County
Unaudited ActualsBond Interest and Redemption Fund
Expenditures by Object27 66092 0000000
Form 51
California Dept of EducationSACS Financial Reporting Software - 2017.2.0File: fund-d (Rev 02/02/2016) Page 2 Printed: 9/6/2017 2:44 PM
Description Resource Codes Object Codes2016-17
Unaudited Actuals2017-18Budget
PercentDifference
E. NET INCREASE (DECREASE) IN FUND BALANCE (C + D4) 1,852,661.16 0.00 -100.0%
F. FUND BALANCE, RESERVES 1) Beginning Fund Balance a) As of July 1 - Unaudited 9791 2,445,512.45 4,303,133.64 76.0%
b) Audit Adjustments 9793 0.00 0.00 0.0%
c) As of July 1 - Audited (F1a + F1b) 2,445,512.45 4,303,133.64 76.0%
d) Other Restatements 9795 4,960.03 0.00 -100.0%
e) Adjusted Beginning Balance (F1c + F1d) 2,450,472.48 4,303,133.64 75.6%
2) Ending Balance, June 30 (E + F1e) 4,303,133.64 4,303,133.64 0.0% Components of Ending Fund Balance a) Nonspendable Revolving Cash 9711 0.00 0.00 0.0%
Stores 9712 0.00 0.00 0.0%
Prepaid Expenditures 9713 0.00 0.00 0.0%
All Others 9719 0.00 0.00 0.0%
b) Restricted 9740 0.00 0.00 0.0%
c) Committed Stabilization Arrangements 9750 0.00 0.00 0.0%
Other Commitments 9760 0.00 0.00 0.0%
d) Assigned Other Assignments 9780 4,303,133.64 4,303,133.64 0.0%
e) Unassigned/Unappropriated Reserve for Economic Uncertainties 9789 0.00 0.00 0.0%
Unassigned/Unappropriated Amount 9790 0.00 0.00 0.0%

Monterey Peninsula UnifiedMonterey County
Unaudited ActualsBond Interest and Redemption Fund
Expenditures by Object27 66092 0000000
Form 51
California Dept of EducationSACS Financial Reporting Software - 2017.2.0File: fund-d (Rev 02/02/2016) Page 3 Printed: 9/6/2017 2:44 PM
Description Resource Codes Object Codes2016-17
Unaudited Actuals2017-18Budget
PercentDifference
G. ASSETS 1) Cash a) in County Treasury 9110 4,303,133.64
1) Fair Value Adjustment to Cash in County Treasury 9111 0.00
b) in Banks 9120 0.00
c) in Revolving Fund 9130 0.00
d) with Fiscal Agent 9135 0.00
e) collections awaiting deposit 9140 0.00
2) Investments 9150 0.00
3) Accounts Receivable 9200 0.00
4) Due from Grantor Government 9290 0.00
5) Due from Other Funds 9310 0.00
6) Stores 9320 0.00
7) Prepaid Expenditures 9330 0.00
8) Other Current Assets 9340 0.00
9) TOTAL, ASSETS 4,303,133.64
H. DEFERRED OUTFLOWS OF RESOURCES
1) Deferred Outflows of Resources 9490 0.00
2) TOTAL, DEFERRED OUTFLOWS 0.00
I. LIABILITIES
1) Accounts Payable 9500 0.00
2) Due to Grantor Governments 9590 0.00
3) Due to Other Funds 9610 0.00
4) Current Loans 9640 0.00
5) Unearned Revenue 9650 0.00
6) TOTAL, LIABILITIES 0.00
J. DEFERRED INFLOWS OF RESOURCES
1) Deferred Inflows of Resources 9690 0.00
2) TOTAL, DEFERRED INFLOWS 0.00
K. FUND EQUITY
Ending Fund Balance, June 30 (must agree with line F2) (G9 + H2) - (I6 + J2) 4,303,133.64

Monterey Peninsula UnifiedMonterey County
Unaudited ActualsBond Interest and Redemption Fund
Expenditures by Object27 66092 0000000
Form 51
California Dept of EducationSACS Financial Reporting Software - 2017.2.0File: fund-d (Rev 02/02/2016) Page 4 Printed: 9/6/2017 2:44 PM
Description Resource Codes Object Codes2016-17
Unaudited Actuals2017-18Budget
PercentDifference
FEDERAL REVENUE
All Other Federal Revenue 8290 0.00 0.00 0.0%
TOTAL, FEDERAL REVENUE 0.00 0.00 0.0%
OTHER STATE REVENUE
Tax Relief Subventions Voted Indebtedness Levies
Homeowners' Exemptions 8571 19,830.16 0.00 -100.0%
Other Subventions/In-Lieu Taxes 8572 0.00 0.00 0.0%
TOTAL, OTHER STATE REVENUE 19,830.16 0.00 -100.0%
OTHER LOCAL REVENUE
Other Local Revenue County and District Taxes Voted Indebtedness Levies Secured Roll 8611 3,151,445.77 0.00 -100.0%
Unsecured Roll 8612 195,574.72 0.00 -100.0%
Prior Years' Taxes 8613 34,227.84 0.00 -100.0%
Supplemental Taxes 8614 79,315.46 0.00 -100.0%
Penalties and Interest from Delinquent Non-LCFF Taxes 8629 0.00 0.00 0.0%
Interest 8660 12,704.99 0.00 -100.0%
Net Increase (Decrease) in the Fair Value of Investments 8662 0.00 0.00 0.0%
Other Local Revenue
All Other Local Revenue 8699 0.00 0.00 0.0%
All Other Transfers In from All Others 8799 0.00 0.00 0.0%
TOTAL, OTHER LOCAL REVENUE 3,473,268.78 0.00 -100.0%
TOTAL, REVENUES 3,493,098.94 0.00 -100.0%
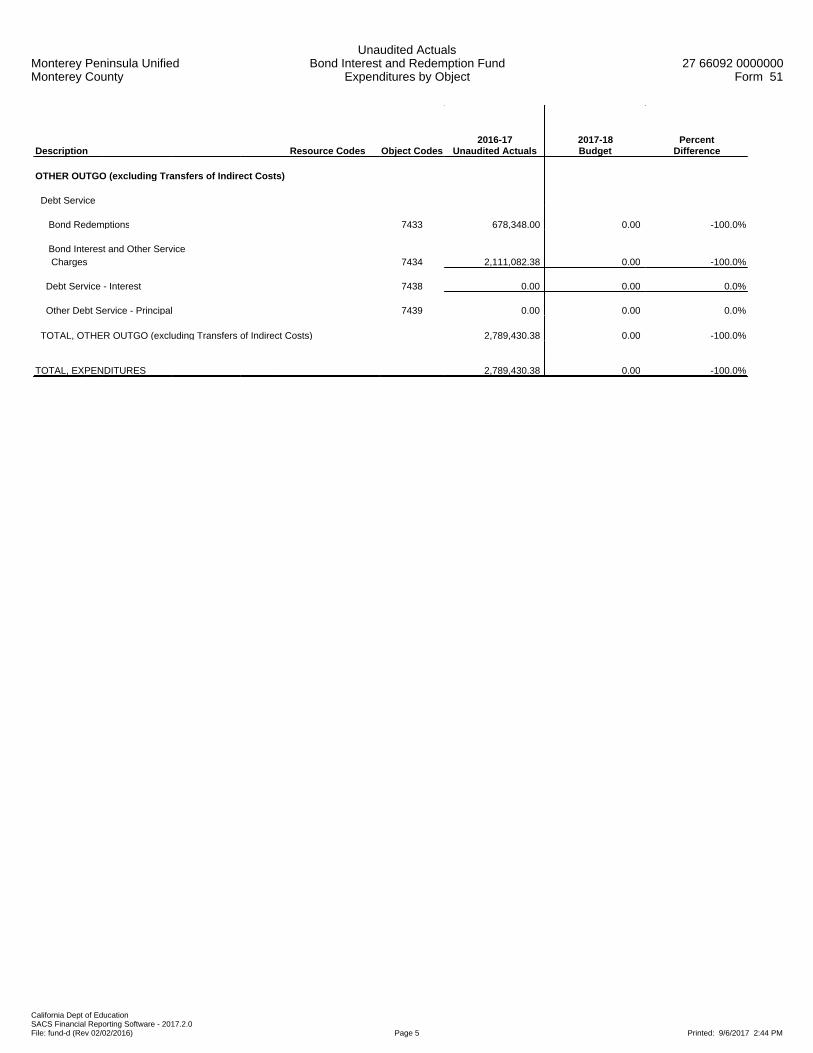
Monterey Peninsula UnifiedMonterey County
Unaudited ActualsBond Interest and Redemption Fund
Expenditures by Object27 66092 0000000
Form 51
California Dept of EducationSACS Financial Reporting Software - 2017.2.0File: fund-d (Rev 02/02/2016) Page 5 Printed: 9/6/2017 2:44 PM
Description Resource Codes Object Codes2016-17
Unaudited Actuals2017-18Budget
PercentDifference
OTHER OUTGO (excluding Transfers of Indirect Costs)
Debt Service
Bond Redemptions 7433 678,348.00 0.00 -100.0%
Bond Interest and Other Service Charges 7434 2,111,082.38 0.00 -100.0%
Debt Service - Interest 7438 0.00 0.00 0.0%
Other Debt Service - Principal 7439 0.00 0.00 0.0%
TOTAL, OTHER OUTGO (excluding Transfers of Indirect Costs) 2,789,430.38 0.00 -100.0%
TOTAL, EXPENDITURES 2,789,430.38 0.00 -100.0%

Monterey Peninsula UnifiedMonterey County
Unaudited ActualsBond Interest and Redemption Fund
Expenditures by Object27 66092 0000000
Form 51
California Dept of EducationSACS Financial Reporting Software - 2017.2.0File: fund-d (Rev 02/02/2016) Page 6 Printed: 9/6/2017 2:44 PM
Description Resource Codes Object Codes2016-17
Unaudited Actuals2017-18Budget
PercentDifference
INTERFUND TRANSFERS
INTERFUND TRANSFERS IN
Other Authorized Interfund Transfers In 8919 0.00 0.00 0.0%
(a) TOTAL, INTERFUND TRANSFERS IN 0.00 0.00 0.0%
INTERFUND TRANSFERS OUT
To: General Fund 7614 0.00 0.00 0.0%
Other Authorized Interfund Transfers Out 7619 0.00 0.00 0.0%
(b) TOTAL, INTERFUND TRANSFERS OUT 0.00 0.00 0.0%
OTHER SOURCES/USES
SOURCES
Other Sources
Transfers from Funds of Lapsed/Reorganized LEAs 8965 0.00 0.00 0.0%
All Other Financing Sources 8979 1,148,992.60 0.00 -100.0%
(c) TOTAL, SOURCES 1,148,992.60 0.00 -100.0%
USES
Transfers of Funds from Lapsed/Reorganized LEAs 7651 0.00 0.00 0.0%
All Other Financing Uses 7699 0.00 0.00 0.0%
(d) TOTAL, USES 0.00 0.00 0.0%
CONTRIBUTIONS
Contributions from Unrestricted Revenues 8980 0.00 0.00 0.0%
Contributions from Restricted Revenues 8990 0.00 0.00 0.0%
(e) TOTAL, CONTRIBUTIONS 0.00 0.00 0.0%
TOTAL, OTHER FINANCING SOURCES/USES (a - b + c - d + e) 1,148,992.60 0.00 -100.0%
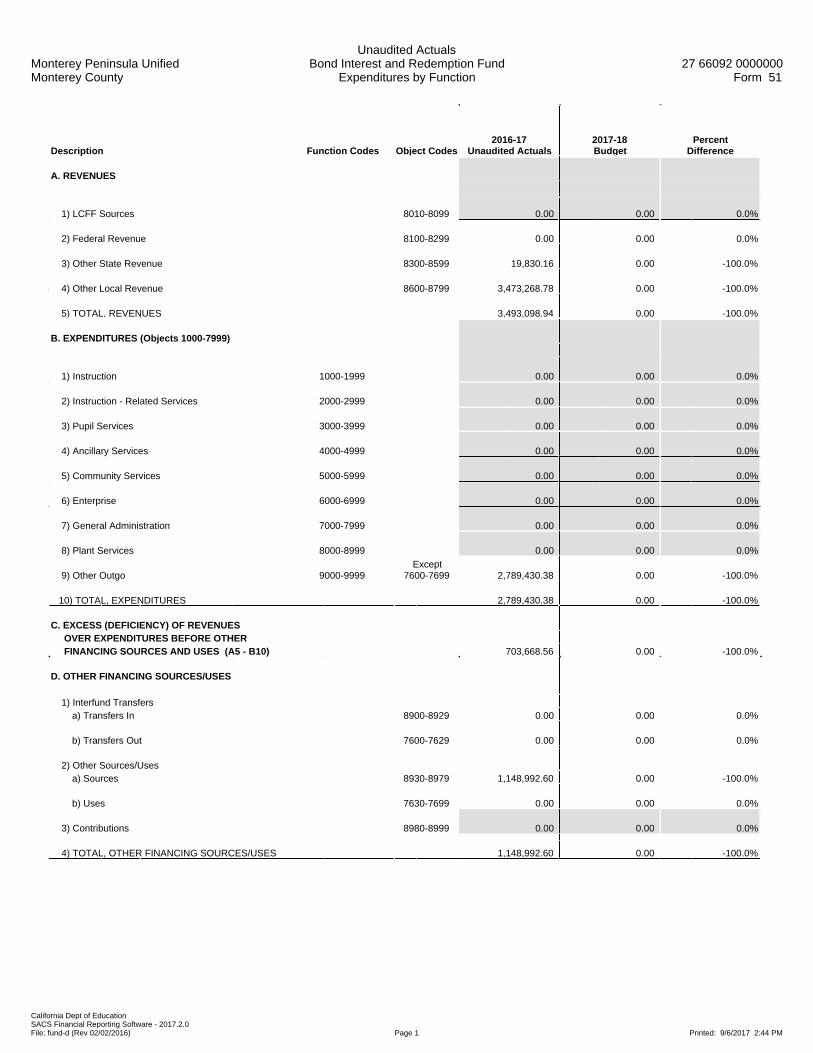
Monterey Peninsula UnifiedMonterey County
Unaudited ActualsBond Interest and Redemption Fund
Expenditures by Function27 66092 0000000
Form 51
California Dept of EducationSACS Financial Reporting Software - 2017.2.0File: fund-d (Rev 02/02/2016) Page 1 Printed: 9/6/2017 2:44 PM
Description Function Codes Object Codes2016-17
Unaudited Actuals2017-18Budget
PercentDifference
A. REVENUES
1) LCFF Sources 8010-8099 0.00 0.00 0.0%
2) Federal Revenue 8100-8299 0.00 0.00 0.0%
3) Other State Revenue 8300-8599 19,830.16 0.00 -100.0%
4) Other Local Revenue 8600-8799 3,473,268.78 0.00 -100.0%
5) TOTAL, REVENUES 3,493,098.94 0.00 -100.0%
B. EXPENDITURES (Objects 1000-7999)
1) Instruction 1000-1999 0.00 0.00 0.0%
2) Instruction - Related Services 2000-2999 0.00 0.00 0.0%
3) Pupil Services 3000-3999 0.00 0.00 0.0%
4) Ancillary Services 4000-4999 0.00 0.00 0.0%
5) Community Services 5000-5999 0.00 0.00 0.0%
6) Enterprise 6000-6999 0.00 0.00 0.0%
7) General Administration 7000-7999 0.00 0.00 0.0%
8) Plant Services 8000-8999 0.00 0.00 0.0%
9) Other Outgo 9000-9999Except
7600-7699 2,789,430.38 0.00 -100.0%
10) TOTAL, EXPENDITURES 2,789,430.38 0.00 -100.0%
C. EXCESS (DEFICIENCY) OF REVENUES OVER EXPENDITURES BEFORE OTHER FINANCING SOURCES AND USES (A5 - B10) 703,668.56 0.00 -100.0%
D. OTHER FINANCING SOURCES/USES 1) Interfund Transfers a) Transfers In 8900-8929 0.00 0.00 0.0%
b) Transfers Out 7600-7629 0.00 0.00 0.0%
2) Other Sources/Uses a) Sources 8930-8979 1,148,992.60 0.00 -100.0%
b) Uses 7630-7699 0.00 0.00 0.0%
3) Contributions 8980-8999 0.00 0.00 0.0%
4) TOTAL, OTHER FINANCING SOURCES/USES 1,148,992.60 0.00 -100.0%

Monterey Peninsula UnifiedMonterey County
Unaudited ActualsBond Interest and Redemption Fund
Expenditures by Function27 66092 0000000
Form 51
California Dept of EducationSACS Financial Reporting Software - 2017.2.0File: fund-d (Rev 02/02/2016) Page 2 Printed: 9/6/2017 2:44 PM
Description Function Codes Object Codes2016-17
Unaudited Actuals2017-18Budget
PercentDifference
E. NET INCREASE (DECREASE) IN FUND BALANCE (C + D4) 1,852,661.16 0.00 -100.0%
F. FUND BALANCE, RESERVES 1) Beginning Fund Balance
a) As of July 1 - Unaudited 9791 2,445,512.45 4,303,133.64 76.0%
b) Audit Adjustments 9793 0.00 0.00 0.0%
c) As of July 1 - Audited (F1a + F1b) 2,445,512.45 4,303,133.64 76.0%
d) Other Restatements 9795 4,960.03 0.00 -100.0%
e) Adjusted Beginning Balance (F1c + F1d) 2,450,472.48 4,303,133.64 75.6%
2) Ending Balance, June 30 (E + F1e) 4,303,133.64 4,303,133.64 0.0% Components of Ending Fund Balance a) Nonspendable Revolving Cash 9711 0.00 0.00 0.0%
Stores 9712 0.00 0.00 0.0%
Prepaid Expenditures 9713 0.00 0.00 0.0%
All Others 9719 0.00 0.00 0.0%
b) Restricted 9740 0.00 0.00 0.0%
c) Committed Stabilization Arrangements 9750 0.00 0.00 0.0%
Other Commitments (by Resource/Object) 9760 0.00 0.00 0.0%
d) Assigned Other Assignments (by Resource/Object) 9780 4,303,133.64 4,303,133.64 0.0%
e) Unassigned/Unappropriated Reserve for Economic Uncertainties 9789 0.00 0.00 0.0%
Unassigned/Unappropriated Amount 9790 0.00 0.00 0.0%

Monterey Peninsula UnifiedMonterey County
Unaudited ActualsBond Interest and Redemption Fund
Exhibit: Restricted Balance Detail27 66092 0000000
Form 51
California Dept of EducationSACS Financial Reporting Software - 2017.2.0File: fund-d (Rev 04/06/2011) Page 1 Printed: 9/6/2017 2:44 PM
2016-17 2017-18Resource Description Unaudited Actuals Budget
Total, Restricted Balance 0.00 0.00

Monterey Peninsula UnifiedMonterey County
Unaudited ActualsOther Enterprise FundExpenses by Object
27 66092 0000000Form 63
California Dept of EducationSACS Financial Reporting Software - 2017.2.0File: fund-e (Rev 03/20/2017) Page 1 Printed: 9/6/2017 2:44 PM
Description Resource Codes Object Codes2016-17
Unaudited Actuals2017-18Budget
PercentDifference
A. REVENUES
1) LCFF Sources 8010-8099 0.00 0.00 0.0%
2) Federal Revenue 8100-8299 0.00 0.00 0.0%
3) Other State Revenue 8300-8599 359.00 611.00 70.2%
4) Other Local Revenue 8600-8799 186,818.32 344,920.00 84.6%
5) TOTAL, REVENUES 187,177.32 345,531.00 84.6%
B. EXPENSES
1) Certificated Salaries 1000-1999 4,846.40 40,170.53 728.9%
2) Classified Salaries 2000-2999 112,554.08 179,900.07 59.8%
3) Employee Benefits 3000-3999 48,934.36 81,591.59 66.7%
4) Books and Supplies 4000-4999 1,737.18 39,993.81 2202.2%
5) Services and Other Operating Expenses 5000-5999 5,449.44 3,875.00 -28.9%
6) Depreciation 6000-6999 0.00 0.00 0.0%
7) Other Outgo (excluding Transfers of Indirect 7100-7299, Costs) 7400-7499 0.00 0.00 0.0%
8) Other Outgo - Transfers of Indirect Costs 7300-7399 0.00 0.00 0.0%
9) TOTAL, EXPENSES 173,521.46 345,531.00 99.1%
C. EXCESS (DEFICIENCY) OF REVENUES OVER EXPENSES BEFORE OTHER FINANCING SOURCES AND USES (A5 - B9) 13,655.86 0.00 -100.0%
D. OTHER FINANCING SOURCES/USES 1) Interfund Transfers a) Transfers In 8900-8929 5,306.00 0.00 -100.0%
b) Transfers Out 7600-7629 17,418.86 0.00 -100.0%
2) Other Sources/Uses a) Sources 8930-8979 0.00 0.00 0.0%
b) Uses 7630-7699 0.00 0.00 0.0%
3) Contributions 8980-8999 0.00 0.00 0.0%
4) TOTAL, OTHER FINANCING SOURCES/USES (12,112.86) 0.00 -100.0%

Monterey Peninsula UnifiedMonterey County
Unaudited ActualsOther Enterprise FundExpenses by Object
27 66092 0000000Form 63
California Dept of EducationSACS Financial Reporting Software - 2017.2.0File: fund-e (Rev 03/20/2017) Page 2 Printed: 9/6/2017 2:44 PM
Description Resource Codes Object Codes2016-17
Unaudited Actuals2017-18Budget
PercentDifference
E. NET INCREASE (DECREASE) IN NET POSITION (C + D4) 1,543.00 0.00 -100.0%
F. NET POSITION 1) Beginning Net Position a) As of July 1 - Unaudited 9791 0.00 0.00 0.0%
b) Audit Adjustments 9793 (1,543.00) 0.00 -100.0%
c) As of July 1 - Audited (F1a + F1b) (1,543.00) 0.00 -100.0%
d) Other Restatements 9795 0.00 0.00 0.0%
e) Adjusted Beginning Net Position (F1c + F1d) (1,543.00) 0.00 -100.0%
2) Ending Net Position, June 30 (E + F1e) 0.00 0.00 0.0% Components of Ending Net Position a) Net Investment in Capital Assets 9796 0.00 0.00 0.0%
b) Restricted Net Position 9797 0.00 0.00 0.0%
c) Unrestricted Net Position 9790 0.00 0.00 0.0%
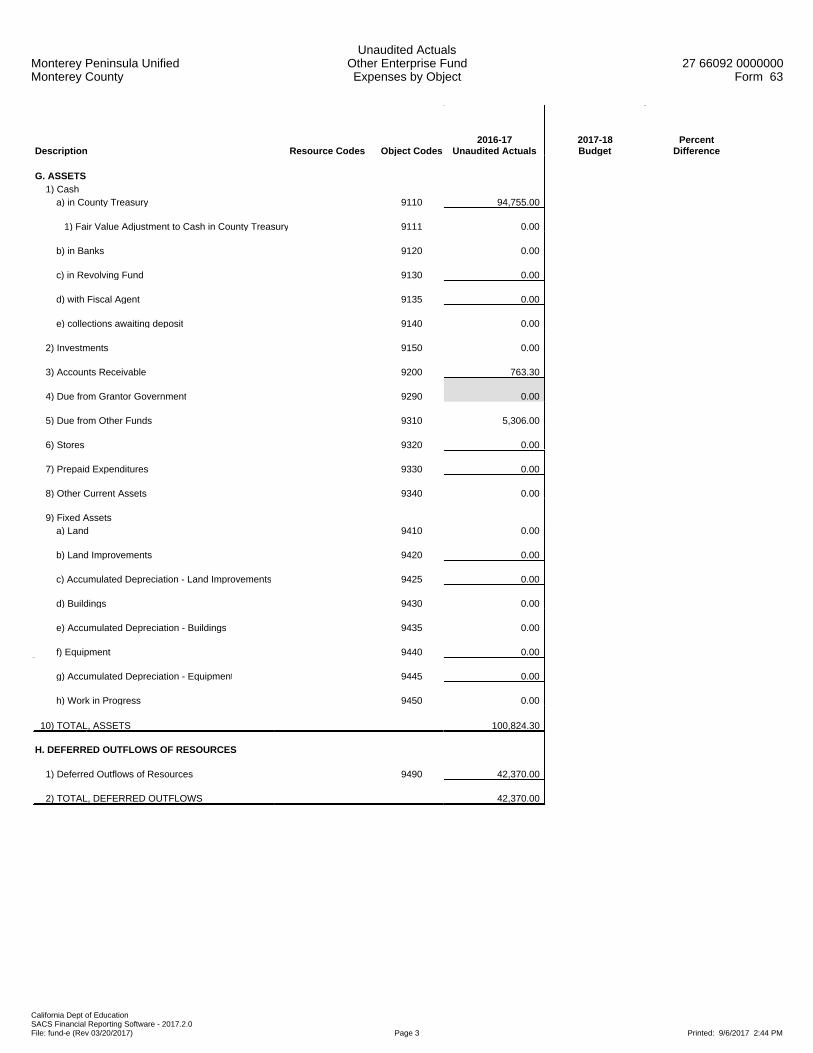
Monterey Peninsula UnifiedMonterey County
Unaudited ActualsOther Enterprise FundExpenses by Object
27 66092 0000000Form 63
California Dept of EducationSACS Financial Reporting Software - 2017.2.0File: fund-e (Rev 03/20/2017) Page 3 Printed: 9/6/2017 2:44 PM
Description Resource Codes Object Codes2016-17
Unaudited Actuals2017-18Budget
PercentDifference
G. ASSETS 1) Cash a) in County Treasury 9110 94,755.00
1) Fair Value Adjustment to Cash in County Treasury 9111 0.00
b) in Banks 9120 0.00
c) in Revolving Fund 9130 0.00
d) with Fiscal Agent 9135 0.00
e) collections awaiting deposit 9140 0.00
2) Investments 9150 0.00
3) Accounts Receivable 9200 763.30
4) Due from Grantor Government 9290 0.00
5) Due from Other Funds 9310 5,306.00
6) Stores 9320 0.00
7) Prepaid Expenditures 9330 0.00
8) Other Current Assets 9340 0.00
9) Fixed Assets a) Land 9410 0.00
b) Land Improvements 9420 0.00
c) Accumulated Depreciation - Land Improvements 9425 0.00
d) Buildings 9430 0.00
e) Accumulated Depreciation - Buildings 9435 0.00
f) Equipment 9440 0.00
g) Accumulated Depreciation - Equipment 9445 0.00
h) Work in Progress 9450 0.00
10) TOTAL, ASSETS 100,824.30
H. DEFERRED OUTFLOWS OF RESOURCES
1) Deferred Outflows of Resources 9490 42,370.00
2) TOTAL, DEFERRED OUTFLOWS 42,370.00

Monterey Peninsula UnifiedMonterey County
Unaudited ActualsOther Enterprise FundExpenses by Object
27 66092 0000000Form 63
California Dept of EducationSACS Financial Reporting Software - 2017.2.0File: fund-e (Rev 03/20/2017) Page 4 Printed: 9/6/2017 2:44 PM
Description Resource Codes Object Codes2016-17
Unaudited Actuals2017-18Budget
PercentDifference
I. LIABILITIES
1) Accounts Payable 9500 167.44
2) Due to Grantor Governments 9590 0.00
3) Due to Other Funds 9610 17,418.86
4) Current Loans 9640
5) Unearned Revenue 9650 0.00
6) Long-Term Liabilities a) Net Pension Liability 9663 123,478.00
b) Net OPEB Obligation 9664 0.00
c) Compensated Absences 9665 0.00
d) COPs Payable 9666 0.00
e) Capital Leases Payable 9667 0.00
f) Lease Revenue Bonds Payable 9668 0.00
g) Other General Long-Term Liabilities 9669 0.00
7) TOTAL, LIABILITIES 141,064.30
J. DEFERRED INFLOWS OF RESOURCES
1) Deferred Inflows of Resources 9690 2,130.00
2) TOTAL, DEFERRED INFLOWS 2,130.00
K. NET POSITION
Net Position, June 30 (must agree with line F2) (G10 + H2) - (I7 + J2) 0.00

Monterey Peninsula UnifiedMonterey County
Unaudited ActualsOther Enterprise FundExpenses by Object
27 66092 0000000Form 63
California Dept of EducationSACS Financial Reporting Software - 2017.2.0File: fund-e (Rev 03/20/2017) Page 5 Printed: 9/6/2017 2:44 PM
Description Resource Codes Object Codes2016-17
Unaudited Actuals2017-18Budget
PercentDifference
OTHER STATE REVENUE
STRS On-Behalf Pension Contributions 7690 8590 359.00 611.00 70.2%
All Other State Revenue All Other 8590 0.00 0.00 0.0%
TOTAL, OTHER STATE REVENUE 359.00 611.00 70.2%
OTHER LOCAL REVENUE
Other Local Revenue
Sales
All Other Sales 8639 0.00 0.00 0.0%
Leases and Rentals 8650 0.00 0.00 0.0%
Interest 8660 784.91 0.00 -100.0%
Net Increase (Decrease) in the Fair Value of Investments 8662 0.00 0.00 0.0%
Fees and Contracts
All Other Fees and Contracts 8689 186,033.41 344,920.00 85.4%
Other Local Revenue
All Other Local Revenue 8699 0.00 0.00 0.0%
TOTAL, OTHER LOCAL REVENUE 186,818.32 344,920.00 84.6%
TOTAL, REVENUES 187,177.32 345,531.00 84.6%

Monterey Peninsula UnifiedMonterey County
Unaudited ActualsOther Enterprise FundExpenses by Object
27 66092 0000000Form 63
California Dept of EducationSACS Financial Reporting Software - 2017.2.0File: fund-e (Rev 03/20/2017) Page 6 Printed: 9/6/2017 2:44 PM
Description Resource Codes Object Codes2016-17
Unaudited Actuals2017-18Budget
PercentDifference
CERTIFICATED SALARIES
Certificated Teachers' Salaries 1100 4,846.40 40,170.53 728.9%
Certificated Pupil Support Salaries 1200 0.00 0.00 0.0%
Certificated Supervisors' and Administrators' Salaries 1300 0.00 0.00 0.0%
Other Certificated Salaries 1900 0.00 0.00 0.0%
TOTAL, CERTIFICATED SALARIES 4,846.40 40,170.53 728.9%
CLASSIFIED SALARIES
Classified Instructional Salaries 2100 0.00 63,911.50 New
Classified Support Salaries 2200 0.00 0.00 0.0%
Classified Supervisors' and Administrators' Salaries 2300 0.00 0.00 0.0%
Clerical, Technical and Office Salaries 2400 0.00 0.00 0.0%
Other Classified Salaries 2900 112,554.08 115,988.57 3.1%
TOTAL, CLASSIFIED SALARIES 112,554.08 179,900.07 59.8%
EMPLOYEE BENEFITS
STRS 3101-3102 1,129.69 1,873.84 65.9%
PERS 3201-3202 17,104.11 24,207.34 41.5%
OASDI/Medicare/Alternative 3301-3302 8,636.94 16,265.48 88.3%
Health and Welfare Benefits 3401-3402 15,352.58 26,929.05 75.4%
Unemployment Insurance 3501-3502 58.58 110.04 87.8%
Workers' Compensation 3601-3602 5,320.70 9,973.59 87.4%
OPEB, Allocated 3701-3702 446.02 506.76 13.6%
OPEB, Active Employees 3751-3752 885.74 1,725.49 94.8%
Other Employee Benefits 3901-3902 0.00 0.00 0.0%
TOTAL, EMPLOYEE BENEFITS 48,934.36 81,591.59 66.7%
BOOKS AND SUPPLIES
Approved Textbooks and Core Curricula Materials 4100 0.00 0.00 0.0%
Books and Other Reference Materials 4200 0.00 0.00 0.0%
Materials and Supplies 4300 1,737.18 39,993.81 2202.2%
Noncapitalized Equipment 4400 0.00 0.00 0.0%
Food 4700 0.00 0.00 0.0%
TOTAL, BOOKS AND SUPPLIES 1,737.18 39,993.81 2202.2%
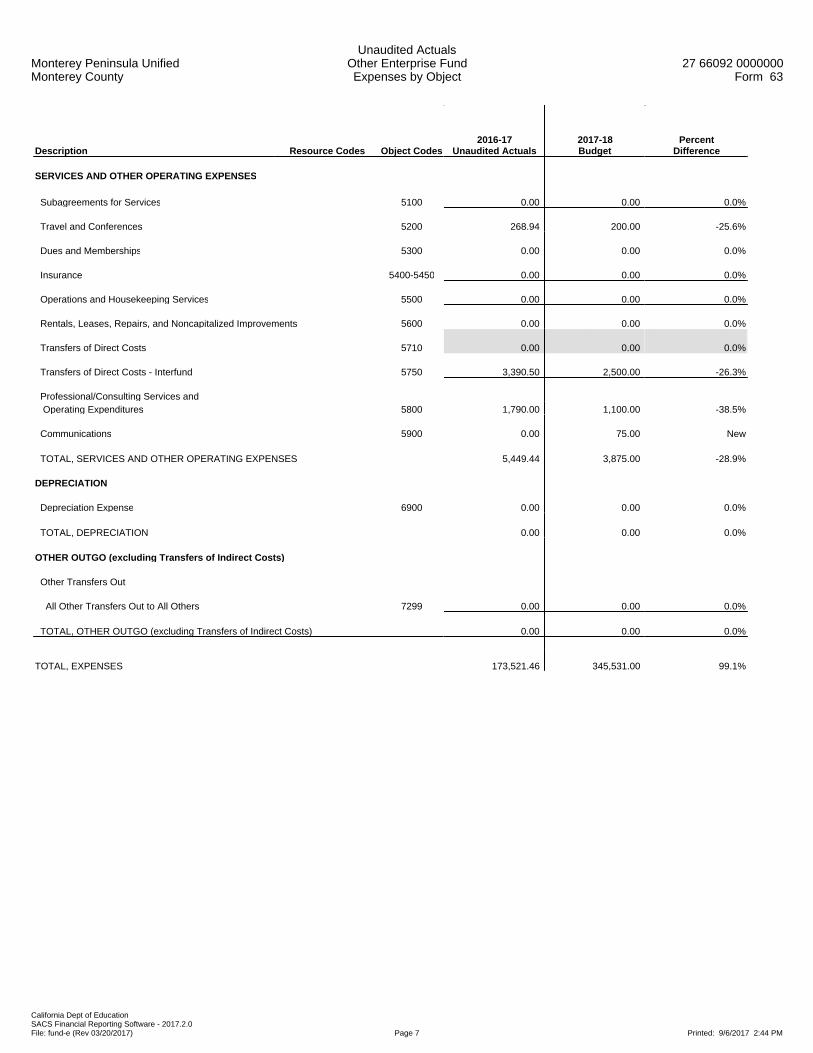
Monterey Peninsula UnifiedMonterey County
Unaudited ActualsOther Enterprise FundExpenses by Object
27 66092 0000000Form 63
California Dept of EducationSACS Financial Reporting Software - 2017.2.0File: fund-e (Rev 03/20/2017) Page 7 Printed: 9/6/2017 2:44 PM
Description Resource Codes Object Codes2016-17
Unaudited Actuals2017-18Budget
PercentDifference
SERVICES AND OTHER OPERATING EXPENSES
Subagreements for Services 5100 0.00 0.00 0.0%
Travel and Conferences 5200 268.94 200.00 -25.6%
Dues and Memberships 5300 0.00 0.00 0.0%
Insurance 5400-5450 0.00 0.00 0.0%
Operations and Housekeeping Services 5500 0.00 0.00 0.0%
Rentals, Leases, Repairs, and Noncapitalized Improvements 5600 0.00 0.00 0.0%
Transfers of Direct Costs 5710 0.00 0.00 0.0%
Transfers of Direct Costs - Interfund 5750 3,390.50 2,500.00 -26.3%
Professional/Consulting Services and Operating Expenditures 5800 1,790.00 1,100.00 -38.5%
Communications 5900 0.00 75.00 New
TOTAL, SERVICES AND OTHER OPERATING EXPENSES 5,449.44 3,875.00 -28.9%
DEPRECIATION
Depreciation Expense 6900 0.00 0.00 0.0%
TOTAL, DEPRECIATION 0.00 0.00 0.0%
OTHER OUTGO (excluding Transfers of Indirect Costs)
Other Transfers Out
All Other Transfers Out to All Others 7299 0.00 0.00 0.0%
TOTAL, OTHER OUTGO (excluding Transfers of Indirect Costs) 0.00 0.00 0.0%
TOTAL, EXPENSES 173,521.46 345,531.00 99.1%

Monterey Peninsula UnifiedMonterey County
Unaudited ActualsOther Enterprise FundExpenses by Object
27 66092 0000000Form 63
California Dept of EducationSACS Financial Reporting Software - 2017.2.0File: fund-e (Rev 03/20/2017) Page 8 Printed: 9/6/2017 2:44 PM
Description Resource Codes Object Codes2016-17
Unaudited Actuals2017-18Budget
PercentDifference
INTERFUND TRANSFERS
INTERFUND TRANSFERS IN
Other Authorized Interfund Transfers In 8919 5,306.00 0.00 -100.0%
(a) TOTAL, INTERFUND TRANSFERS IN 5,306.00 0.00 -100.0%
INTERFUND TRANSFERS OUT
Other Authorized Interfund Transfers Out 7619 17,418.86 0.00 -100.0%
(b) TOTAL, INTERFUND TRANSFERS OUT 17,418.86 0.00 -100.0%
OTHER SOURCES/USES
SOURCES
Other Sources
Transfers from Funds of Lapsed/Reorganized LEAs 8965 0.00 0.00 0.0%
(c) TOTAL, SOURCES 0.00 0.00 0.0%
USES
Transfers of Funds from Lapsed/Reorganized LEAs 7651 0.00 0.00 0.0%
(d) TOTAL, USES 0.00 0.00 0.0%
CONTRIBUTIONS
Contributions from Unrestricted Revenues 8980 0.00 0.00 0.0%
Contributions from Restricted Revenues 8990 0.00 0.00 0.0%
(e) TOTAL, CONTRIBUTIONS 0.00 0.00 0.0%
TOTAL, OTHER FINANCING SOURCES/USES (a - b + c - d + e) (12,112.86) 0.00 -100.0%

Monterey Peninsula UnifiedMonterey County
Unaudited ActualsOther Enterprise FundExpenses by Function
27 66092 0000000Form 63
California Dept of EducationSACS Financial Reporting Software - 2017.2.0File: fund-e (Rev 03/20/2017) Page 1 Printed: 9/6/2017 2:44 PM
Description Function Codes Object Codes2016-17
Unaudited Actuals2017-18Budget
PercentDifference
A. REVENUES
1) LCFF Sources 8010-8099 0.00 0.00 0.0%
2) Federal Revenue 8100-8299 0.00 0.00 0.0%
3) Other State Revenue 8300-8599 359.00 611.00 70.2%
4) Other Local Revenue 8600-8799 186,818.32 344,920.00 84.6%
5) TOTAL, REVENUES 187,177.32 345,531.00 84.6%
B. EXPENSES (Objects 1000-7999)
1) Instruction 1000-1999 0.00 0.00 0.0%
2) Instruction - Related Services 2000-2999 0.00 0.00 0.0%
3) Pupil Services 3000-3999 0.00 0.00 0.0%
4) Ancillary Services 4000-4999 0.00 0.00 0.0%
5) Community Services 5000-5999 0.00 0.00 0.0%
6) Enterprise 6000-6999 173,521.46 345,531.00 99.1%
7) General Administration 7000-7999 0.00 0.00 0.0%
8) Plant Services 8000-8999 0.00 0.00 0.0%
9) Other Outgo 9000-9999Except
7600-7699 0.00 0.00 0.0%
10) TOTAL, EXPENSES 173,521.46 345,531.00 99.1%
C. EXCESS (DEFICIENCY) OF REVENUES OVER EXPENSES BEFORE OTHER FINANCING SOURCES AND USES (A5 - B10) 13,655.86 0.00 -100.0%
D. OTHER FINANCING SOURCES/USES 1) Interfund Transfers a) Transfers In 8900-8929 5,306.00 0.00 -100.0%
b) Transfers Out 7600-7629 17,418.86 0.00 -100.0%
2) Other Sources/Uses a) Sources 8930-8979 0.00 0.00 0.0%
b) Uses 7630-7699 0.00 0.00 0.0%
3) Contributions 8980-8999 0.00 0.00 0.0%
4) TOTAL, OTHER FINANCING SOURCES/USES (12,112.86) 0.00 -100.0%
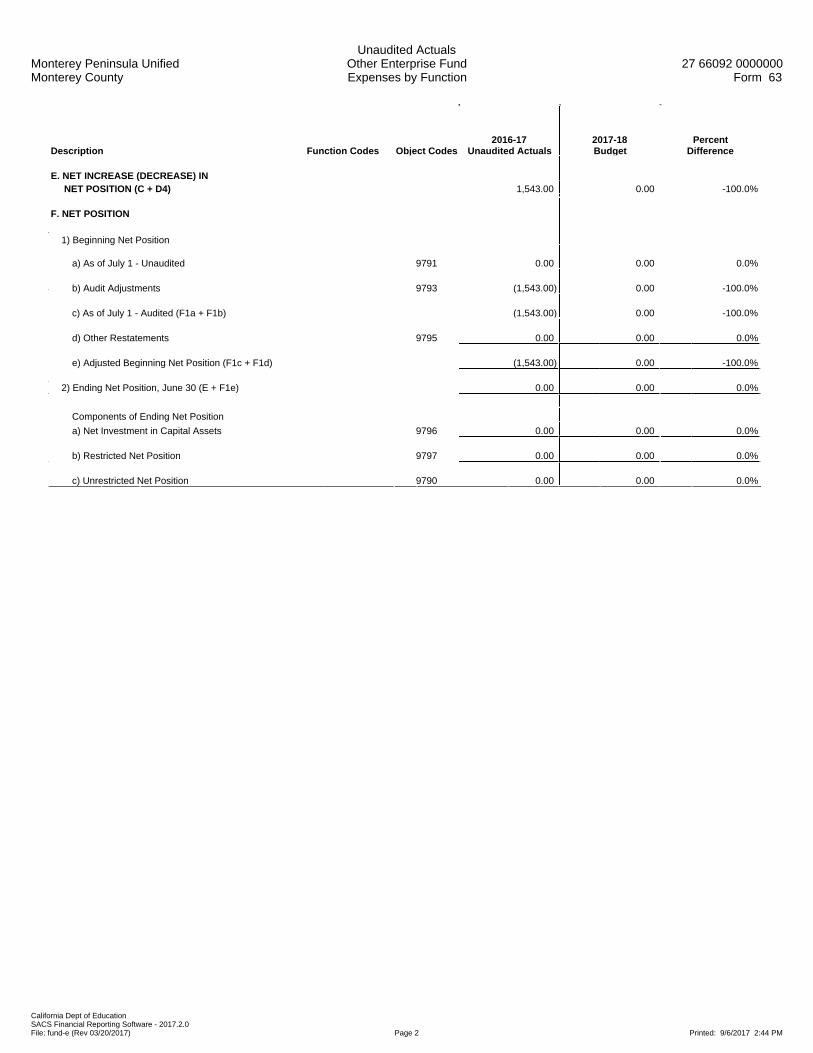
Monterey Peninsula UnifiedMonterey County
Unaudited ActualsOther Enterprise FundExpenses by Function
27 66092 0000000Form 63
California Dept of EducationSACS Financial Reporting Software - 2017.2.0File: fund-e (Rev 03/20/2017) Page 2 Printed: 9/6/2017 2:44 PM
Description Function Codes Object Codes2016-17
Unaudited Actuals2017-18Budget
PercentDifference
E. NET INCREASE (DECREASE) IN NET POSITION (C + D4) 1,543.00 0.00 -100.0%
F. NET POSITION 1) Beginning Net Position
a) As of July 1 - Unaudited 9791 0.00 0.00 0.0%
b) Audit Adjustments 9793 (1,543.00) 0.00 -100.0%
c) As of July 1 - Audited (F1a + F1b) (1,543.00) 0.00 -100.0%
d) Other Restatements 9795 0.00 0.00 0.0%
e) Adjusted Beginning Net Position (F1c + F1d) (1,543.00) 0.00 -100.0%
2) Ending Net Position, June 30 (E + F1e) 0.00 0.00 0.0%
Components of Ending Net Position
a) Net Investment in Capital Assets 9796 0.00 0.00 0.0%
b) Restricted Net Position 9797 0.00 0.00 0.0%
c) Unrestricted Net Position 9790 0.00 0.00 0.0%

Monterey Peninsula UnifiedMonterey County
Unaudited ActualsOther Enterprise Fund
Exhibit: Restricted Net Position Detail27 66092 0000000
Form 63
California Dept of EducationSACS Financial Reporting Software - 2017.2.0File: fund-e (Rev 11/30/2012) Page 1 Printed: 9/6/2017 2:44 PM
2016-17 2017-18Resource Description Unaudited Actuals Budget
Total, Restricted Net Position 0.00 0.00
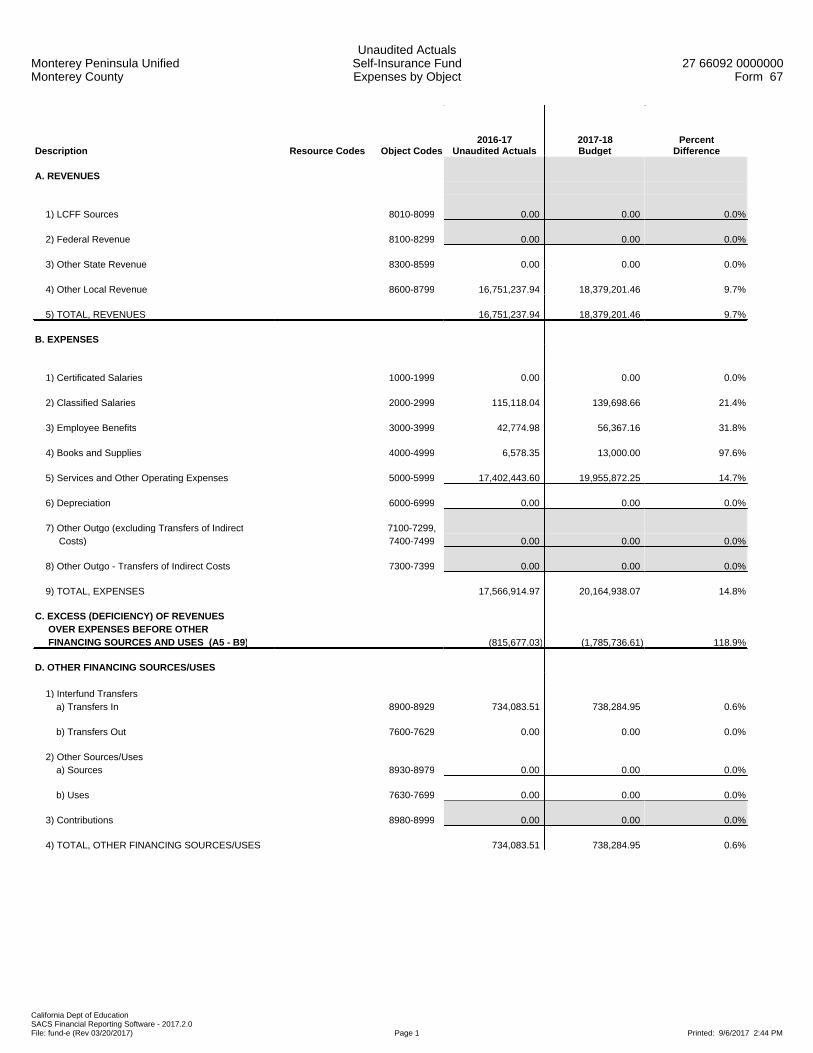
Monterey Peninsula UnifiedMonterey County
Unaudited ActualsSelf-Insurance FundExpenses by Object
27 66092 0000000Form 67
California Dept of EducationSACS Financial Reporting Software - 2017.2.0File: fund-e (Rev 03/20/2017) Page 1 Printed: 9/6/2017 2:44 PM
Description Resource Codes Object Codes2016-17
Unaudited Actuals2017-18Budget
PercentDifference
A. REVENUES
1) LCFF Sources 8010-8099 0.00 0.00 0.0%
2) Federal Revenue 8100-8299 0.00 0.00 0.0%
3) Other State Revenue 8300-8599 0.00 0.00 0.0%
4) Other Local Revenue 8600-8799 16,751,237.94 18,379,201.46 9.7%
5) TOTAL, REVENUES 16,751,237.94 18,379,201.46 9.7%
B. EXPENSES
1) Certificated Salaries 1000-1999 0.00 0.00 0.0%
2) Classified Salaries 2000-2999 115,118.04 139,698.66 21.4%
3) Employee Benefits 3000-3999 42,774.98 56,367.16 31.8%
4) Books and Supplies 4000-4999 6,578.35 13,000.00 97.6%
5) Services and Other Operating Expenses 5000-5999 17,402,443.60 19,955,872.25 14.7%
6) Depreciation 6000-6999 0.00 0.00 0.0%
7) Other Outgo (excluding Transfers of Indirect 7100-7299, Costs) 7400-7499 0.00 0.00 0.0%
8) Other Outgo - Transfers of Indirect Costs 7300-7399 0.00 0.00 0.0%
9) TOTAL, EXPENSES 17,566,914.97 20,164,938.07 14.8%
C. EXCESS (DEFICIENCY) OF REVENUES OVER EXPENSES BEFORE OTHER FINANCING SOURCES AND USES (A5 - B9) (815,677.03) (1,785,736.61) 118.9%
D. OTHER FINANCING SOURCES/USES 1) Interfund Transfers a) Transfers In 8900-8929 734,083.51 738,284.95 0.6%
b) Transfers Out 7600-7629 0.00 0.00 0.0%
2) Other Sources/Uses a) Sources 8930-8979 0.00 0.00 0.0%
b) Uses 7630-7699 0.00 0.00 0.0%
3) Contributions 8980-8999 0.00 0.00 0.0%
4) TOTAL, OTHER FINANCING SOURCES/USES 734,083.51 738,284.95 0.6%

Monterey Peninsula UnifiedMonterey County
Unaudited ActualsSelf-Insurance FundExpenses by Object
27 66092 0000000Form 67
California Dept of EducationSACS Financial Reporting Software - 2017.2.0File: fund-e (Rev 03/20/2017) Page 2 Printed: 9/6/2017 2:44 PM
Description Resource Codes Object Codes2016-17
Unaudited Actuals2017-18Budget
PercentDifference
E. NET INCREASE (DECREASE) IN NET POSITION (C + D4) (81,593.52) (1,047,451.66) 1183.7%
F. NET POSITION 1) Beginning Net Position a) As of July 1 - Unaudited 9791 6,055,080.50 5,973,486.98 -1.3%
b) Audit Adjustments 9793 0.00 0.00 0.0%
c) As of July 1 - Audited (F1a + F1b) 6,055,080.50 5,973,486.98 -1.3%
d) Other Restatements 9795 0.00 0.00 0.0%
e) Adjusted Beginning Net Position (F1c + F1d) 6,055,080.50 5,973,486.98 -1.3%
2) Ending Net Position, June 30 (E + F1e) 5,973,486.98 4,926,035.32 -17.5% Components of Ending Net Position a) Net Investment in Capital Assets 9796 0.00 0.00 0.0%
b) Restricted Net Position 9797 0.00 0.00 0.0%
c) Unrestricted Net Position 9790 5,973,486.98 4,926,035.32 -17.5%
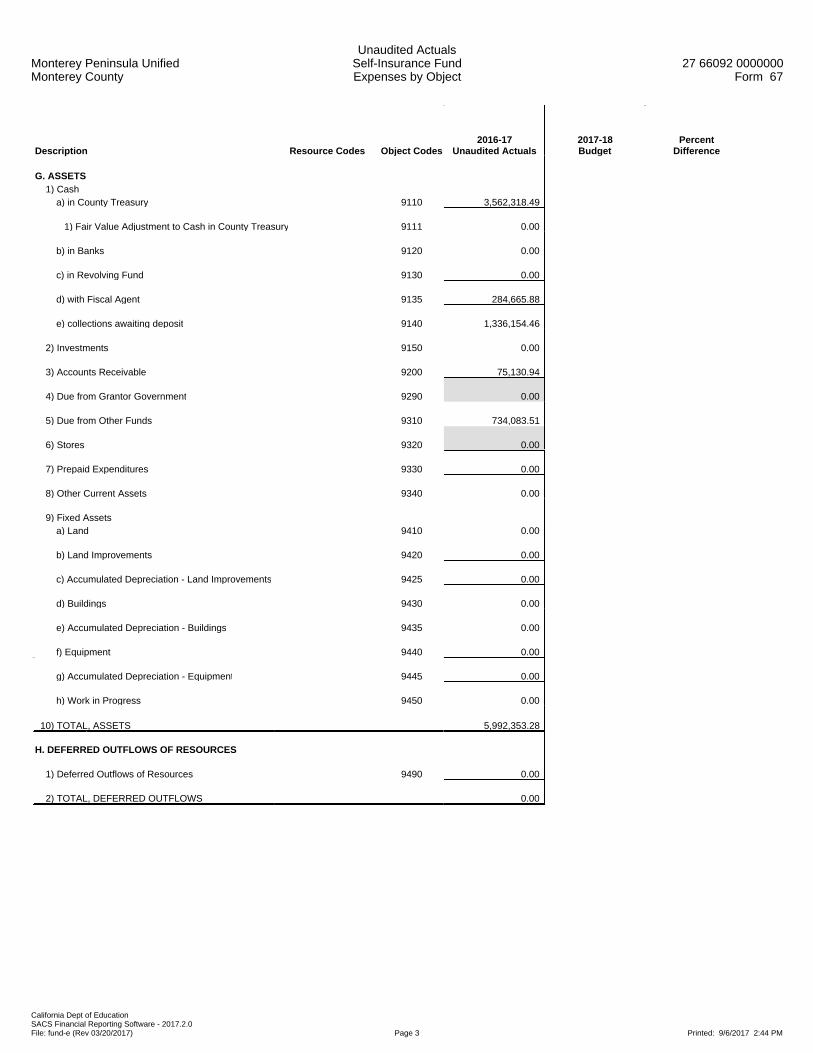
Monterey Peninsula UnifiedMonterey County
Unaudited ActualsSelf-Insurance FundExpenses by Object
27 66092 0000000Form 67
California Dept of EducationSACS Financial Reporting Software - 2017.2.0File: fund-e (Rev 03/20/2017) Page 3 Printed: 9/6/2017 2:44 PM
Description Resource Codes Object Codes2016-17
Unaudited Actuals2017-18Budget
PercentDifference
G. ASSETS 1) Cash a) in County Treasury 9110 3,562,318.49
1) Fair Value Adjustment to Cash in County Treasury 9111 0.00
b) in Banks 9120 0.00
c) in Revolving Fund 9130 0.00
d) with Fiscal Agent 9135 284,665.88
e) collections awaiting deposit 9140 1,336,154.46
2) Investments 9150 0.00
3) Accounts Receivable 9200 75,130.94
4) Due from Grantor Government 9290 0.00
5) Due from Other Funds 9310 734,083.51
6) Stores 9320 0.00
7) Prepaid Expenditures 9330 0.00
8) Other Current Assets 9340 0.00
9) Fixed Assets a) Land 9410 0.00
b) Land Improvements 9420 0.00
c) Accumulated Depreciation - Land Improvements 9425 0.00
d) Buildings 9430 0.00
e) Accumulated Depreciation - Buildings 9435 0.00
f) Equipment 9440 0.00
g) Accumulated Depreciation - Equipment 9445 0.00
h) Work in Progress 9450 0.00
10) TOTAL, ASSETS 5,992,353.28
H. DEFERRED OUTFLOWS OF RESOURCES
1) Deferred Outflows of Resources 9490 0.00
2) TOTAL, DEFERRED OUTFLOWS 0.00
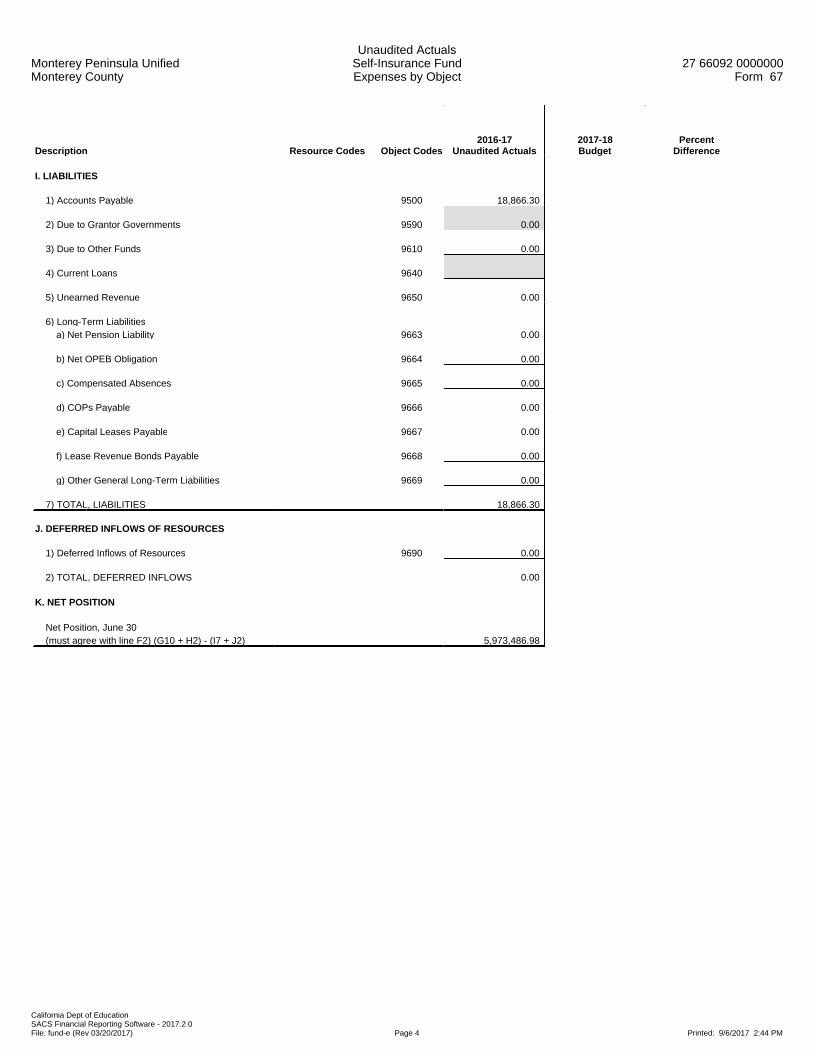
Monterey Peninsula UnifiedMonterey County
Unaudited ActualsSelf-Insurance FundExpenses by Object
27 66092 0000000Form 67
California Dept of EducationSACS Financial Reporting Software - 2017.2.0File: fund-e (Rev 03/20/2017) Page 4 Printed: 9/6/2017 2:44 PM
Description Resource Codes Object Codes2016-17
Unaudited Actuals2017-18Budget
PercentDifference
I. LIABILITIES
1) Accounts Payable 9500 18,866.30
2) Due to Grantor Governments 9590 0.00
3) Due to Other Funds 9610 0.00
4) Current Loans 9640
5) Unearned Revenue 9650 0.00
6) Long-Term Liabilities a) Net Pension Liability 9663 0.00
b) Net OPEB Obligation 9664 0.00
c) Compensated Absences 9665 0.00
d) COPs Payable 9666 0.00
e) Capital Leases Payable 9667 0.00
f) Lease Revenue Bonds Payable 9668 0.00
g) Other General Long-Term Liabilities 9669 0.00
7) TOTAL, LIABILITIES 18,866.30
J. DEFERRED INFLOWS OF RESOURCES
1) Deferred Inflows of Resources 9690 0.00
2) TOTAL, DEFERRED INFLOWS 0.00
K. NET POSITION
Net Position, June 30 (must agree with line F2) (G10 + H2) - (I7 + J2) 5,973,486.98
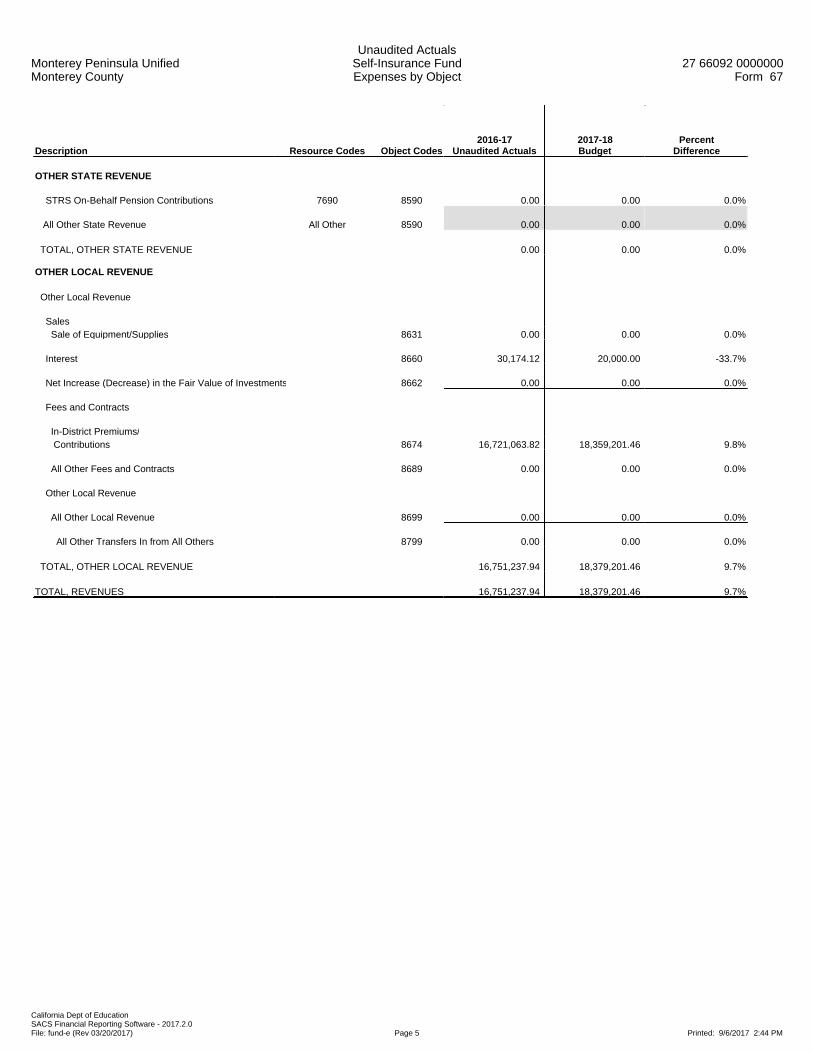
Monterey Peninsula UnifiedMonterey County
Unaudited ActualsSelf-Insurance FundExpenses by Object
27 66092 0000000Form 67
California Dept of EducationSACS Financial Reporting Software - 2017.2.0File: fund-e (Rev 03/20/2017) Page 5 Printed: 9/6/2017 2:44 PM
Description Resource Codes Object Codes2016-17
Unaudited Actuals2017-18Budget
PercentDifference
OTHER STATE REVENUE
STRS On-Behalf Pension Contributions 7690 8590 0.00 0.00 0.0%
All Other State Revenue All Other 8590 0.00 0.00 0.0%
TOTAL, OTHER STATE REVENUE 0.00 0.00 0.0%
OTHER LOCAL REVENUE
Other Local Revenue
Sales Sale of Equipment/Supplies 8631 0.00 0.00 0.0%
Interest 8660 30,174.12 20,000.00 -33.7%
Net Increase (Decrease) in the Fair Value of Investments 8662 0.00 0.00 0.0%
Fees and Contracts
In-District Premiums/ Contributions 8674 16,721,063.82 18,359,201.46 9.8%
All Other Fees and Contracts 8689 0.00 0.00 0.0%
Other Local Revenue
All Other Local Revenue 8699 0.00 0.00 0.0%
All Other Transfers In from All Others 8799 0.00 0.00 0.0%
TOTAL, OTHER LOCAL REVENUE 16,751,237.94 18,379,201.46 9.7%
TOTAL, REVENUES 16,751,237.94 18,379,201.46 9.7%
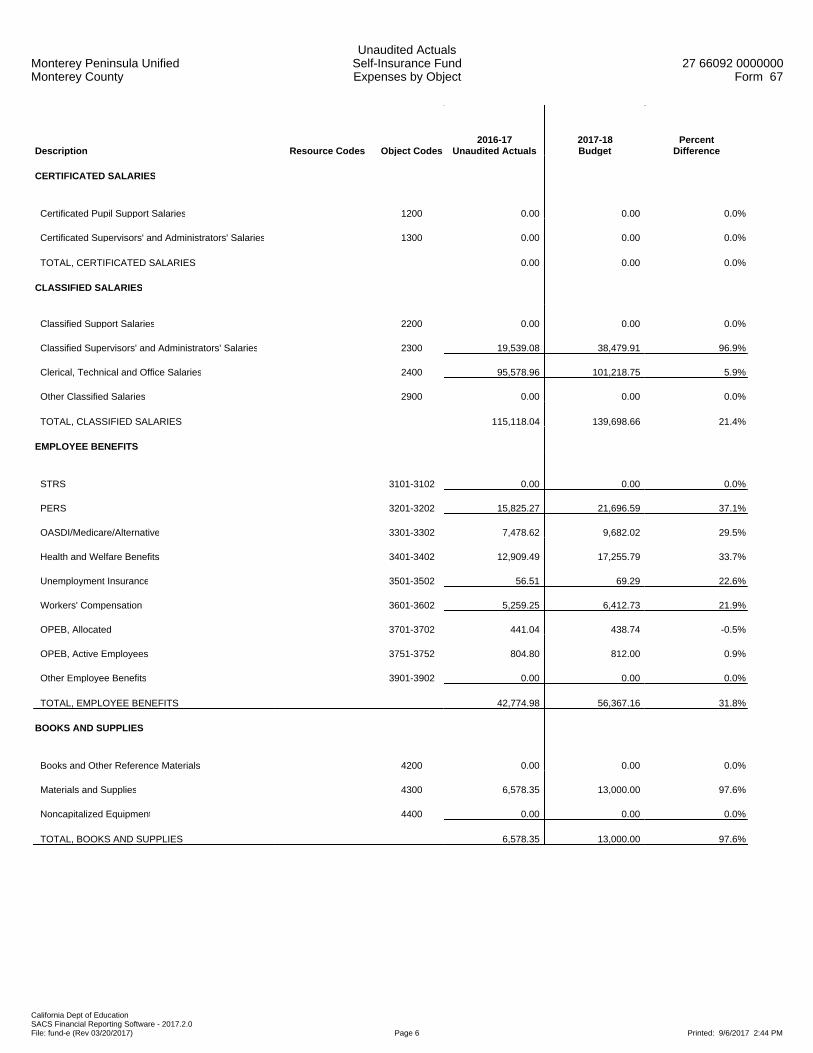
Monterey Peninsula UnifiedMonterey County
Unaudited ActualsSelf-Insurance FundExpenses by Object
27 66092 0000000Form 67
California Dept of EducationSACS Financial Reporting Software - 2017.2.0File: fund-e (Rev 03/20/2017) Page 6 Printed: 9/6/2017 2:44 PM
Description Resource Codes Object Codes2016-17
Unaudited Actuals2017-18Budget
PercentDifference
CERTIFICATED SALARIES
Certificated Pupil Support Salaries 1200 0.00 0.00 0.0%
Certificated Supervisors' and Administrators' Salaries 1300 0.00 0.00 0.0%
TOTAL, CERTIFICATED SALARIES 0.00 0.00 0.0%
CLASSIFIED SALARIES
Classified Support Salaries 2200 0.00 0.00 0.0%
Classified Supervisors' and Administrators' Salaries 2300 19,539.08 38,479.91 96.9%
Clerical, Technical and Office Salaries 2400 95,578.96 101,218.75 5.9%
Other Classified Salaries 2900 0.00 0.00 0.0%
TOTAL, CLASSIFIED SALARIES 115,118.04 139,698.66 21.4%
EMPLOYEE BENEFITS
STRS 3101-3102 0.00 0.00 0.0%
PERS 3201-3202 15,825.27 21,696.59 37.1%
OASDI/Medicare/Alternative 3301-3302 7,478.62 9,682.02 29.5%
Health and Welfare Benefits 3401-3402 12,909.49 17,255.79 33.7%
Unemployment Insurance 3501-3502 56.51 69.29 22.6%
Workers' Compensation 3601-3602 5,259.25 6,412.73 21.9%
OPEB, Allocated 3701-3702 441.04 438.74 -0.5%
OPEB, Active Employees 3751-3752 804.80 812.00 0.9%
Other Employee Benefits 3901-3902 0.00 0.00 0.0%
TOTAL, EMPLOYEE BENEFITS 42,774.98 56,367.16 31.8%
BOOKS AND SUPPLIES
Books and Other Reference Materials 4200 0.00 0.00 0.0%
Materials and Supplies 4300 6,578.35 13,000.00 97.6%
Noncapitalized Equipment 4400 0.00 0.00 0.0%
TOTAL, BOOKS AND SUPPLIES 6,578.35 13,000.00 97.6%
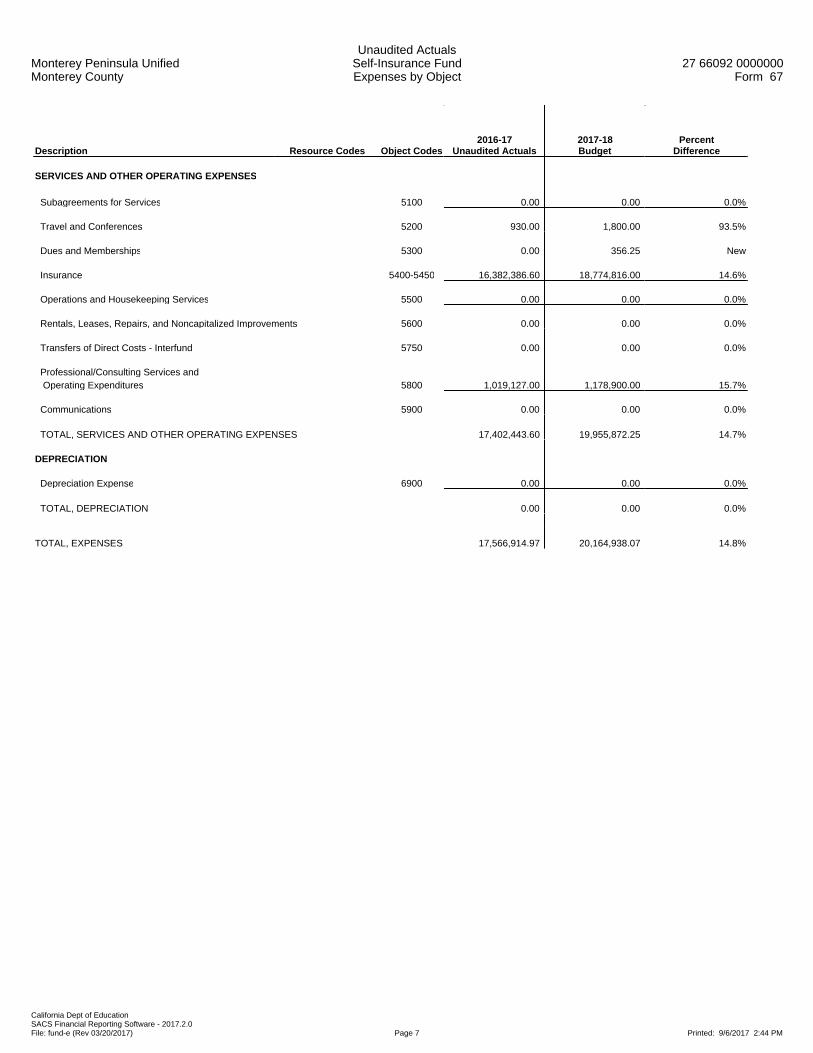
Monterey Peninsula UnifiedMonterey County
Unaudited ActualsSelf-Insurance FundExpenses by Object
27 66092 0000000Form 67
California Dept of EducationSACS Financial Reporting Software - 2017.2.0File: fund-e (Rev 03/20/2017) Page 7 Printed: 9/6/2017 2:44 PM
Description Resource Codes Object Codes2016-17
Unaudited Actuals2017-18Budget
PercentDifference
SERVICES AND OTHER OPERATING EXPENSES
Subagreements for Services 5100 0.00 0.00 0.0%
Travel and Conferences 5200 930.00 1,800.00 93.5%
Dues and Memberships 5300 0.00 356.25 New
Insurance 5400-5450 16,382,386.60 18,774,816.00 14.6%
Operations and Housekeeping Services 5500 0.00 0.00 0.0%
Rentals, Leases, Repairs, and Noncapitalized Improvements 5600 0.00 0.00 0.0%
Transfers of Direct Costs - Interfund 5750 0.00 0.00 0.0%
Professional/Consulting Services and Operating Expenditures 5800 1,019,127.00 1,178,900.00 15.7%
Communications 5900 0.00 0.00 0.0%
TOTAL, SERVICES AND OTHER OPERATING EXPENSES 17,402,443.60 19,955,872.25 14.7%
DEPRECIATION
Depreciation Expense 6900 0.00 0.00 0.0%
TOTAL, DEPRECIATION 0.00 0.00 0.0%
TOTAL, EXPENSES 17,566,914.97 20,164,938.07 14.8%

Monterey Peninsula UnifiedMonterey County
Unaudited ActualsSelf-Insurance FundExpenses by Object
27 66092 0000000Form 67
California Dept of EducationSACS Financial Reporting Software - 2017.2.0File: fund-e (Rev 03/20/2017) Page 8 Printed: 9/6/2017 2:44 PM
Description Resource Codes Object Codes2016-17
Unaudited Actuals2017-18Budget
PercentDifference
INTERFUND TRANSFERS
INTERFUND TRANSFERS IN
Other Authorized Interfund Transfers In 8919 734,083.51 738,284.95 0.6%
(a) TOTAL, INTERFUND TRANSFERS IN 734,083.51 738,284.95 0.6%
INTERFUND TRANSFERS OUT
Other Authorized Interfund Transfers Out 7619 0.00 0.00 0.0%
(b) TOTAL, INTERFUND TRANSFERS OUT 0.00 0.00 0.0%
OTHER SOURCES/USES
SOURCES
Other Sources
Transfers from Funds of Lapsed/Reorganized LEAs 8965 0.00 0.00 0.0%
(c) TOTAL, SOURCES 0.00 0.00 0.0%
USES
Transfers of Funds from Lapsed/Reorganized LEAs 7651 0.00 0.00 0.0%
(d) TOTAL, USES 0.00 0.00 0.0%
CONTRIBUTIONS
Contributions from Unrestricted Revenues 8980 0.00 0.00 0.0%
Contributions from Restricted Revenues 8990 0.00 0.00 0.0%
(e) TOTAL, CONTRIBUTIONS 0.00 0.00 0.0%
TOTAL, OTHER FINANCING SOURCES/USES (a - b + c - d + e) 734,083.51 738,284.95 0.6%
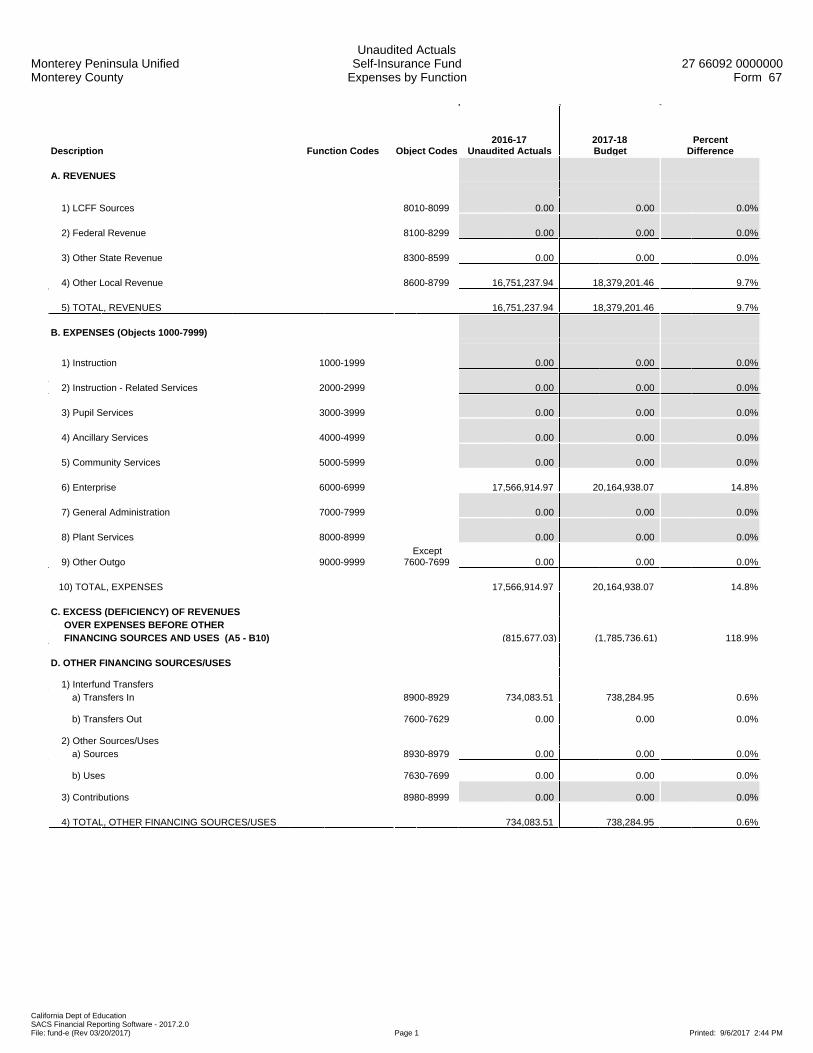
Monterey Peninsula UnifiedMonterey County
Unaudited ActualsSelf-Insurance Fund
Expenses by Function27 66092 0000000
Form 67
California Dept of EducationSACS Financial Reporting Software - 2017.2.0File: fund-e (Rev 03/20/2017) Page 1 Printed: 9/6/2017 2:44 PM
Description Function Codes Object Codes2016-17
Unaudited Actuals2017-18Budget
PercentDifference
A. REVENUES
1) LCFF Sources 8010-8099 0.00 0.00 0.0%
2) Federal Revenue 8100-8299 0.00 0.00 0.0%
3) Other State Revenue 8300-8599 0.00 0.00 0.0%
4) Other Local Revenue 8600-8799 16,751,237.94 18,379,201.46 9.7%
5) TOTAL, REVENUES 16,751,237.94 18,379,201.46 9.7%
B. EXPENSES (Objects 1000-7999)
1) Instruction 1000-1999 0.00 0.00 0.0%
2) Instruction - Related Services 2000-2999 0.00 0.00 0.0%
3) Pupil Services 3000-3999 0.00 0.00 0.0%
4) Ancillary Services 4000-4999 0.00 0.00 0.0%
5) Community Services 5000-5999 0.00 0.00 0.0%
6) Enterprise 6000-6999 17,566,914.97 20,164,938.07 14.8%
7) General Administration 7000-7999 0.00 0.00 0.0%
8) Plant Services 8000-8999 0.00 0.00 0.0%
9) Other Outgo 9000-9999Except
7600-7699 0.00 0.00 0.0%
10) TOTAL, EXPENSES 17,566,914.97 20,164,938.07 14.8%
C. EXCESS (DEFICIENCY) OF REVENUES OVER EXPENSES BEFORE OTHER FINANCING SOURCES AND USES (A5 - B10) (815,677.03) (1,785,736.61) 118.9%
D. OTHER FINANCING SOURCES/USES 1) Interfund Transfers a) Transfers In 8900-8929 734,083.51 738,284.95 0.6%
b) Transfers Out 7600-7629 0.00 0.00 0.0%
2) Other Sources/Uses a) Sources 8930-8979 0.00 0.00 0.0%
b) Uses 7630-7699 0.00 0.00 0.0%
3) Contributions 8980-8999 0.00 0.00 0.0%
4) TOTAL, OTHER FINANCING SOURCES/USES 734,083.51 738,284.95 0.6%

Monterey Peninsula UnifiedMonterey County
Unaudited ActualsSelf-Insurance Fund
Expenses by Function27 66092 0000000
Form 67
California Dept of EducationSACS Financial Reporting Software - 2017.2.0File: fund-e (Rev 03/20/2017) Page 2 Printed: 9/6/2017 2:44 PM
Description Function Codes Object Codes2016-17
Unaudited Actuals2017-18Budget
PercentDifference
E. NET INCREASE (DECREASE) IN NET POSITION (C + D4) (81,593.52) (1,047,451.66) 1183.7%
F. NET POSITION 1) Beginning Net Position
a) As of July 1 - Unaudited 9791 6,055,080.50 5,973,486.98 -1.3%
b) Audit Adjustments 9793 0.00 0.00 0.0%
c) As of July 1 - Audited (F1a + F1b) 6,055,080.50 5,973,486.98 -1.3%
d) Other Restatements 9795 0.00 0.00 0.0%
e) Adjusted Beginning Net Position (F1c + F1d) 6,055,080.50 5,973,486.98 -1.3%
2) Ending Net Position, June 30 (E + F1e) 5,973,486.98 4,926,035.32 -17.5%
Components of Ending Net Position
a) Net Investment in Capital Assets 9796 0.00 0.00 0.0%
b) Restricted Net Position 9797 0.00 0.00 0.0%
c) Unrestricted Net Position 9790 5,973,486.98 4,926,035.32 -17.5%
Monterey Peninsula UnifiedMonterey County
Unaudited ActualsSelf-Insurance Fund
Exhibit: Restricted Net Position Detail27 66092 0000000
Form 67
California Dept of EducationSACS Financial Reporting Software - 2017.2.0File: fund-e (Rev 11/30/2012) Page 1 Printed: 9/6/2017 2:44 PM
2016-17 2017-18Resource Description Unaudited Actuals Budget
Total, Restricted Net Position 0.00 0.00

Monterey Peninsula UnifiedMonterey County
Unaudited ActualsFoundation Private-Purpose Trust Fund
Expenses by Object27 66092 0000000
Form 73
California Dept of EducationSACS Financial Reporting Software - 2017.2.0File: fund-e (Rev 03/20/2017) Page 1 Printed: 9/6/2017 2:45 PM
Description Resource Codes Object Codes2016-17
Unaudited Actuals2017-18Budget
PercentDifference
A. REVENUES
1) LCFF Sources 8010-8099 0.00 0.00 0.0%
2) Federal Revenue 8100-8299 0.00 0.00 0.0%
3) Other State Revenue 8300-8599 0.00 0.00 0.0%
4) Other Local Revenue 8600-8799 39,241.83 10,000.00 -74.5%
5) TOTAL, REVENUES 39,241.83 10,000.00 -74.5%
B. EXPENSES
1) Certificated Salaries 1000-1999 0.00 0.00 0.0%
2) Classified Salaries 2000-2999 0.00 0.00 0.0%
3) Employee Benefits 3000-3999 0.00 0.00 0.0%
4) Books and Supplies 4000-4999 0.00 0.00 0.0%
5) Services and Other Operating Expenses 5000-5999 40,127.32 10,000.00 -75.1%
6) Depreciation 6000-6999 0.00 0.00 0.0%
7) Other Outgo (excluding Transfers of Indirect 7100-7299, Costs) 7400-7499 0.00 0.00 0.0%
8) Other Outgo - Transfers of Indirect Costs 7300-7399 0.00 0.00 0.0%
9) TOTAL, EXPENSES 40,127.32 10,000.00 -75.1%
C. EXCESS (DEFICIENCY) OF REVENUES OVER EXPENSES BEFORE OTHER FINANCING SOURCES AND USES (A5 - B9) (885.49) 0.00 -100.0%
D. OTHER FINANCING SOURCES/USES 1) Interfund Transfers a) Transfers In 8900-8929 0.00 0.00 0.0%
b) Transfers Out 7600-7629 0.00 0.00 0.0%
2) Other Sources/Uses a) Sources 8930-8979 0.00 0.00 0.0%
b) Uses 7630-7699 0.00 0.00 0.0%
3) Contributions 8980-8999 0.00 0.00 0.0%
4) TOTAL, OTHER FINANCING SOURCES/USES 0.00 0.00 0.0%

Monterey Peninsula UnifiedMonterey County
Unaudited ActualsFoundation Private-Purpose Trust Fund
Expenses by Object27 66092 0000000
Form 73
California Dept of EducationSACS Financial Reporting Software - 2017.2.0File: fund-e (Rev 03/20/2017) Page 2 Printed: 9/6/2017 2:45 PM
Description Resource Codes Object Codes2016-17
Unaudited Actuals2017-18Budget
PercentDifference
E. NET INCREASE (DECREASE) IN NET POSITION (C + D4) (885.49) 0.00 -100.0%
F. NET POSITION 1) Beginning Net Position a) As of July 1 - Unaudited 9791 227,344.82 226,459.33 -0.4%
b) Audit Adjustments 9793 0.00 0.00 0.0%
c) As of July 1 - Audited (F1a + F1b) 227,344.82 226,459.33 -0.4%
d) Other Restatements 9795 0.00 0.00 0.0%
e) Adjusted Beginning Net Position (F1c + F1d) 227,344.82 226,459.33 -0.4%
2) Ending Net Position, June 30 (E + F1e) 226,459.33 226,459.33 0.0% Components of Ending Net Position a) Net Investment in Capital Assets 9796 0.00 0.00 0.0%
b) Restricted Net Position 9797 0.00 0.00 0.0%
c) Unrestricted Net Position 9790 226,459.33 226,459.33 0.0%

Monterey Peninsula UnifiedMonterey County
Unaudited ActualsFoundation Private-Purpose Trust Fund
Expenses by Object27 66092 0000000
Form 73
California Dept of EducationSACS Financial Reporting Software - 2017.2.0File: fund-e (Rev 03/20/2017) Page 3 Printed: 9/6/2017 2:45 PM
Description Resource Codes Object Codes2016-17
Unaudited Actuals2017-18Budget
PercentDifference
G. ASSETS 1) Cash a) in County Treasury 9110 225,791.40
1) Fair Value Adjustment to Cash in County Treasury 9111 0.00
b) in Banks 9120 0.00
c) in Revolving Fund 9130 0.00
d) with Fiscal Agent 9135 0.00
e) collections awaiting deposit 9140 0.00
2) Investments 9150 0.00
3) Accounts Receivable 9200 667.93
4) Due from Grantor Government 9290 0.00
5) Due from Other Funds 9310 0.00
6) Stores 9320 0.00
7) Prepaid Expenditures 9330 0.00
8) Other Current Assets 9340 0.00
9) Fixed Assets a) Land 9410 0.00
b) Land Improvements 9420 0.00
c) Accumulated Depreciation - Land Improvements 9425 0.00
d) Buildings 9430 0.00
e) Accumulated Depreciation - Buildings 9435 0.00
f) Equipment 9440 0.00
g) Accumulated Depreciation - Equipment 9445 0.00
h) Work in Progress 9450 0.00
10) TOTAL, ASSETS 226,459.33
H. DEFERRED OUTFLOWS OF RESOURCES
1) Deferred Outflows of Resources 9490 0.00
2) TOTAL, DEFERRED OUTFLOWS 0.00

Monterey Peninsula UnifiedMonterey County
Unaudited ActualsFoundation Private-Purpose Trust Fund
Expenses by Object27 66092 0000000
Form 73
California Dept of EducationSACS Financial Reporting Software - 2017.2.0File: fund-e (Rev 03/20/2017) Page 4 Printed: 9/6/2017 2:45 PM
Description Resource Codes Object Codes2016-17
Unaudited Actuals2017-18Budget
PercentDifference
I. LIABILITIES
1) Accounts Payable 9500 0.00
2) Due to Grantor Governments 9590 0.00
3) Due to Other Funds 9610 0.00
4) Current Loans 9640
5) Unearned Revenue 9650 0.00
6) Long-Term Liabilities a) Net Pension Liability 9663 0.00
b) Net OPEB Obligation 9664 0.00
c) Compensated Absences 9665 0.00
d) COPs Payable 9666 0.00
e) Capital Leases Payable 9667 0.00
f) Lease Revenue Bonds Payable 9668 0.00
g) Other General Long-Term Liabilities 9669 0.00
7) TOTAL, LIABILITIES 0.00
J. DEFERRED INFLOWS OF RESOURCES
1) Deferred Inflows of Resources 9690 0.00
2) TOTAL, DEFERRED INFLOWS 0.00
K. NET POSITION
Net Position, June 30 (must agree with line F2) (G10 + H2) - (I7 + J2) 226,459.33

Monterey Peninsula UnifiedMonterey County
Unaudited ActualsFoundation Private-Purpose Trust Fund
Expenses by Object27 66092 0000000
Form 73
California Dept of EducationSACS Financial Reporting Software - 2017.2.0File: fund-e (Rev 03/20/2017) Page 5 Printed: 9/6/2017 2:45 PM
Description Resource Codes Object Codes2016-17
Unaudited Actuals2017-18Budget
PercentDifference
OTHER STATE REVENUE
STRS On-Behalf Pension Contributions 7690 8590 0.00 0.00 0.0%
All Other State Revenue All Other 8590 0.00 0.00 0.0%
TOTAL, OTHER STATE REVENUE 0.00 0.00 0.0%
OTHER LOCAL REVENUE
Other Local Revenue
Sales Sale of Equipment/Supplies 8631 0.00 0.00 0.0%
Interest 8660 2,729.53 0.00 -100.0%
Net Increase (Decrease) in the Fair Value of Investments 8662 0.00 0.00 0.0%
Other Local Revenue
All Other Local Revenue 8699 36,512.30 10,000.00 -72.6%
TOTAL, OTHER LOCAL REVENUE 39,241.83 10,000.00 -74.5%
TOTAL, REVENUES 39,241.83 10,000.00 -74.5%

Monterey Peninsula UnifiedMonterey County
Unaudited ActualsFoundation Private-Purpose Trust Fund
Expenses by Object27 66092 0000000
Form 73
California Dept of EducationSACS Financial Reporting Software - 2017.2.0File: fund-e (Rev 03/20/2017) Page 6 Printed: 9/6/2017 2:45 PM
Description Resource Codes Object Codes2016-17
Unaudited Actuals2017-18Budget
PercentDifference
CERTIFICATED SALARIES
Certificated Teachers' Salaries 1100 0.00 0.00 0.0%
Certificated Pupil Support Salaries 1200 0.00 0.00 0.0%
Certificated Supervisors' and Administrators' Salaries 1300 0.00 0.00 0.0%
Other Certificated Salaries 1900 0.00 0.00 0.0%
TOTAL, CERTIFICATED SALARIES 0.00 0.00 0.0%
CLASSIFIED SALARIES
Classified Instructional Salaries 2100 0.00 0.00 0.0%
Classified Support Salaries 2200 0.00 0.00 0.0%
Classified Supervisors' and Administrators' Salaries 2300 0.00 0.00 0.0%
Clerical, Technical and Office Salaries 2400 0.00 0.00 0.0%
Other Classified Salaries 2900 0.00 0.00 0.0%
TOTAL, CLASSIFIED SALARIES 0.00 0.00 0.0%
EMPLOYEE BENEFITS
STRS 3101-3102 0.00 0.00 0.0%
PERS 3201-3202 0.00 0.00 0.0%
OASDI/Medicare/Alternative 3301-3302 0.00 0.00 0.0%
Health and Welfare Benefits 3401-3402 0.00 0.00 0.0%
Unemployment Insurance 3501-3502 0.00 0.00 0.0%
Workers' Compensation 3601-3602 0.00 0.00 0.0%
OPEB, Allocated 3701-3702 0.00 0.00 0.0%
OPEB, Active Employees 3751-3752 0.00 0.00 0.0%
Other Employee Benefits 3901-3902 0.00 0.00 0.0%
TOTAL, EMPLOYEE BENEFITS 0.00 0.00 0.0%
BOOKS AND SUPPLIES
Approved Textbooks and Core Curricula Materials 4100 0.00 0.00 0.0%
Books and Other Reference Materials 4200 0.00 0.00 0.0%
Materials and Supplies 4300 0.00 0.00 0.0%
Noncapitalized Equipment 4400 0.00 0.00 0.0%
Food 4700 0.00 0.00 0.0%
TOTAL, BOOKS AND SUPPLIES 0.00 0.00 0.0%

Monterey Peninsula UnifiedMonterey County
Unaudited ActualsFoundation Private-Purpose Trust Fund
Expenses by Object27 66092 0000000
Form 73
California Dept of EducationSACS Financial Reporting Software - 2017.2.0File: fund-e (Rev 03/20/2017) Page 7 Printed: 9/6/2017 2:45 PM
Description Resource Codes Object Codes2016-17
Unaudited Actuals2017-18Budget
PercentDifference
SERVICES AND OTHER OPERATING EXPENSES
Subagreements for Services 5100 0.00 0.00 0.0%
Travel and Conferences 5200 0.00 0.00 0.0%
Dues and Memberships 5300 0.00 0.00 0.0%
Insurance 5400-5450 0.00 0.00 0.0%
Operations and Housekeeping Services 5500 0.00 0.00 0.0%
Rentals, Leases, Repairs, and Noncapitalized Improvements 5600 0.00 0.00 0.0%
Transfers of Direct Costs 5710 0.00 0.00 0.0%
Transfers of Direct Costs - Interfund 5750 0.00 0.00 0.0%
Professional/Consulting Services and Operating Expenditures 5800 40,127.32 10,000.00 -75.1%
Communications 5900 0.00 0.00 0.0%
TOTAL, SERVICES AND OTHER OPERATING EXPENSES 40,127.32 10,000.00 -75.1%
DEPRECIATION
Depreciation Expense 6900 0.00 0.00 0.0%
TOTAL, DEPRECIATION 0.00 0.00 0.0%
OTHER OUTGO (excluding Transfers of Indirect Costs)
All Other Transfers Out to All Others 7299 0.00 0.00 0.0%
TOTAL, OTHER OUTGO (excluding Transfers of Indirect Costs) 0.00 0.00 0.0%
TOTAL, EXPENSES 40,127.32 10,000.00 -75.1%
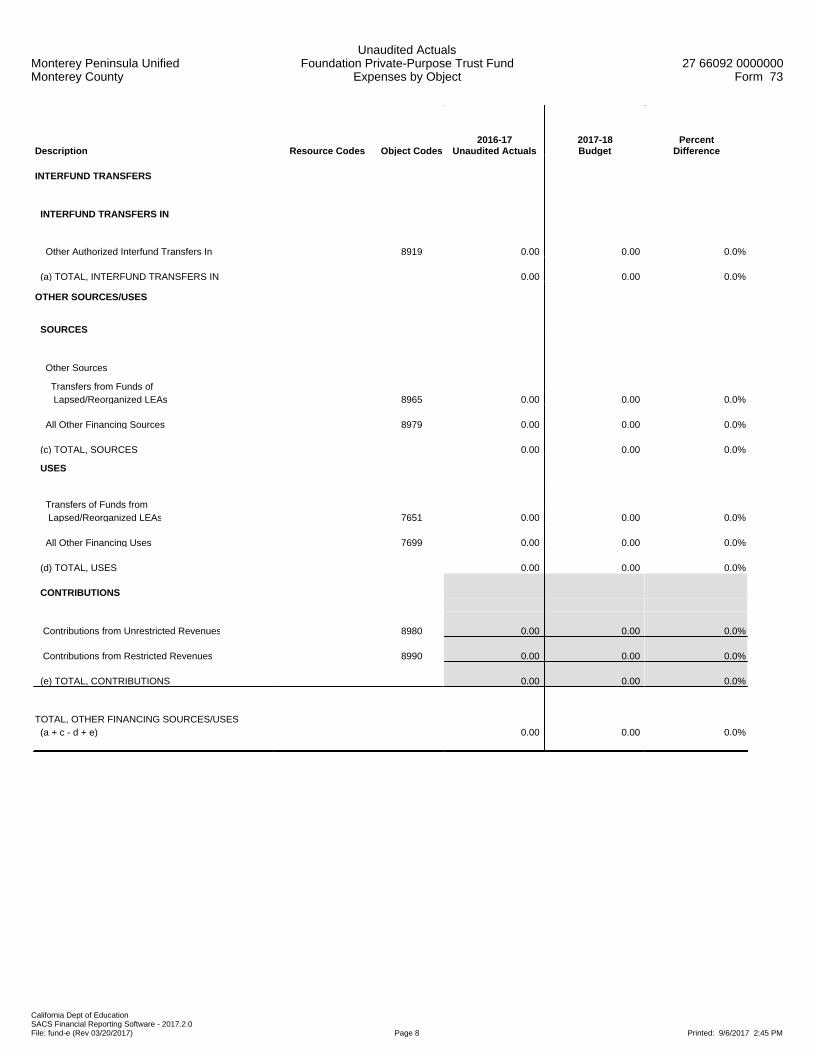
Monterey Peninsula UnifiedMonterey County
Unaudited ActualsFoundation Private-Purpose Trust Fund
Expenses by Object27 66092 0000000
Form 73
California Dept of EducationSACS Financial Reporting Software - 2017.2.0File: fund-e (Rev 03/20/2017) Page 8 Printed: 9/6/2017 2:45 PM
Description Resource Codes Object Codes2016-17
Unaudited Actuals2017-18Budget
PercentDifference
INTERFUND TRANSFERS
INTERFUND TRANSFERS IN
Other Authorized Interfund Transfers In 8919 0.00 0.00 0.0%
(a) TOTAL, INTERFUND TRANSFERS IN 0.00 0.00 0.0%
OTHER SOURCES/USES
SOURCES
Other Sources
Transfers from Funds of Lapsed/Reorganized LEAs 8965 0.00 0.00 0.0%
All Other Financing Sources 8979 0.00 0.00 0.0%
(c) TOTAL, SOURCES 0.00 0.00 0.0%
USES
Transfers of Funds from Lapsed/Reorganized LEAs 7651 0.00 0.00 0.0%
All Other Financing Uses 7699 0.00 0.00 0.0%
(d) TOTAL, USES 0.00 0.00 0.0%
CONTRIBUTIONS
Contributions from Unrestricted Revenues 8980 0.00 0.00 0.0%
Contributions from Restricted Revenues 8990 0.00 0.00 0.0%
(e) TOTAL, CONTRIBUTIONS 0.00 0.00 0.0%
TOTAL, OTHER FINANCING SOURCES/USES (a + c - d + e) 0.00 0.00 0.0%

Monterey Peninsula UnifiedMonterey County
Unaudited ActualsFoundation Private-Purpose Trust Fund
Expenses by Function27 66092 0000000
Form 73
California Dept of EducationSACS Financial Reporting Software - 2017.2.0File: fund-e (Rev 03/20/2017) Page 1 Printed: 9/6/2017 2:45 PM
Description Function Codes Object Codes2016-17
Unaudited Actuals2017-18Budget
PercentDifference
A. REVENUES
1) LCFF Sources 8010-8099 0.00 0.00 0.0%
2) Federal Revenue 8100-8299 0.00 0.00 0.0%
3) Other State Revenue 8300-8599 0.00 0.00 0.0%
4) Other Local Revenue 8600-8799 39,241.83 10,000.00 -74.5%
5) TOTAL, REVENUES 39,241.83 10,000.00 -74.5%
B. EXPENSES (Objects 1000-7999)
1) Instruction 1000-1999 0.00 0.00 0.0%
2) Instruction - Related Services 2000-2999 0.00 0.00 0.0%
3) Pupil Services 3000-3999 40,127.32 10,000.00 -75.1%
4) Ancillary Services 4000-4999 0.00 0.00 0.0%
5) Community Services 5000-5999 0.00 0.00 0.0%
6) Enterprise 6000-6999 0.00 0.00 0.0%
7) General Administration 7000-7999 0.00 0.00 0.0%
8) Plant Services 8000-8999 0.00 0.00 0.0%
9) Other Outgo 9000-9999Except
7600-7699 0.00 0.00 0.0%
10) TOTAL, EXPENSES 40,127.32 10,000.00 -75.1%
C. EXCESS (DEFICIENCY) OF REVENUES OVER EXPENSES BEFORE OTHER FINANCING SOURCES AND USES (A5 - B10) (885.49) 0.00 -100.0%
D. OTHER FINANCING SOURCES/USES 1) Interfund Transfers a) Transfers In 8900-8929 0.00 0.00 0.0%
b) Transfers Out 7600-7629 0.00 0.00 0.0%
2) Other Sources/Uses a) Sources 8930-8979 0.00 0.00 0.0%
b) Uses 7630-7699 0.00 0.00 0.0%
3) Contributions 8980-8999 0.00 0.00 0.0%
4) TOTAL, OTHER FINANCING SOURCES/USES 0.00 0.00 0.0%
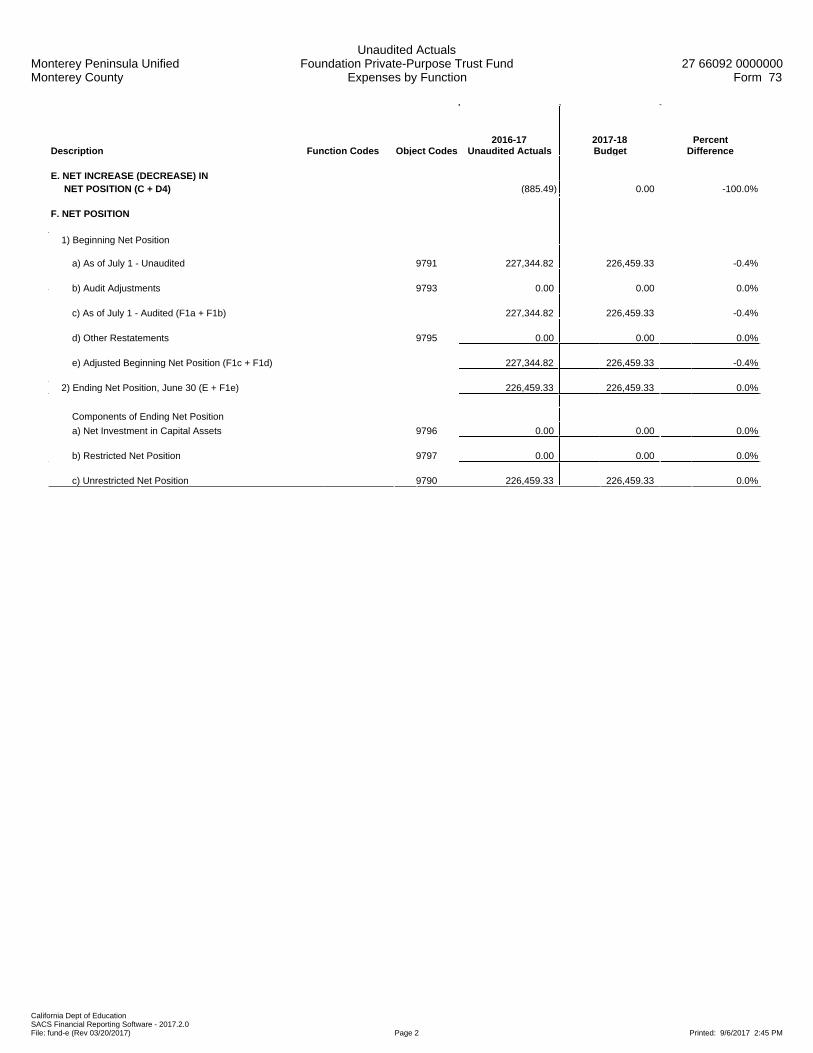
Monterey Peninsula UnifiedMonterey County
Unaudited ActualsFoundation Private-Purpose Trust Fund
Expenses by Function27 66092 0000000
Form 73
California Dept of EducationSACS Financial Reporting Software - 2017.2.0File: fund-e (Rev 03/20/2017) Page 2 Printed: 9/6/2017 2:45 PM
Description Function Codes Object Codes2016-17
Unaudited Actuals2017-18Budget
PercentDifference
E. NET INCREASE (DECREASE) IN NET POSITION (C + D4) (885.49) 0.00 -100.0%
F. NET POSITION 1) Beginning Net Position
a) As of July 1 - Unaudited 9791 227,344.82 226,459.33 -0.4%
b) Audit Adjustments 9793 0.00 0.00 0.0%
c) As of July 1 - Audited (F1a + F1b) 227,344.82 226,459.33 -0.4%
d) Other Restatements 9795 0.00 0.00 0.0%
e) Adjusted Beginning Net Position (F1c + F1d) 227,344.82 226,459.33 -0.4%
2) Ending Net Position, June 30 (E + F1e) 226,459.33 226,459.33 0.0%
Components of Ending Net Position
a) Net Investment in Capital Assets 9796 0.00 0.00 0.0%
b) Restricted Net Position 9797 0.00 0.00 0.0%
c) Unrestricted Net Position 9790 226,459.33 226,459.33 0.0%

Monterey Peninsula UnifiedMonterey County
Unaudited ActualsFoundation Private-Purpose Trust FundExhibit: Restricted Net Position Detail
27 66092 0000000Form 73
California Dept of EducationSACS Financial Reporting Software - 2017.2.0File: fund-e (Rev 11/30/2012) Page 1 Printed: 9/6/2017 2:45 PM
2016-17 2017-18Resource Description Unaudited Actuals Budget
Total, Restricted Net Position 0.00 0.00
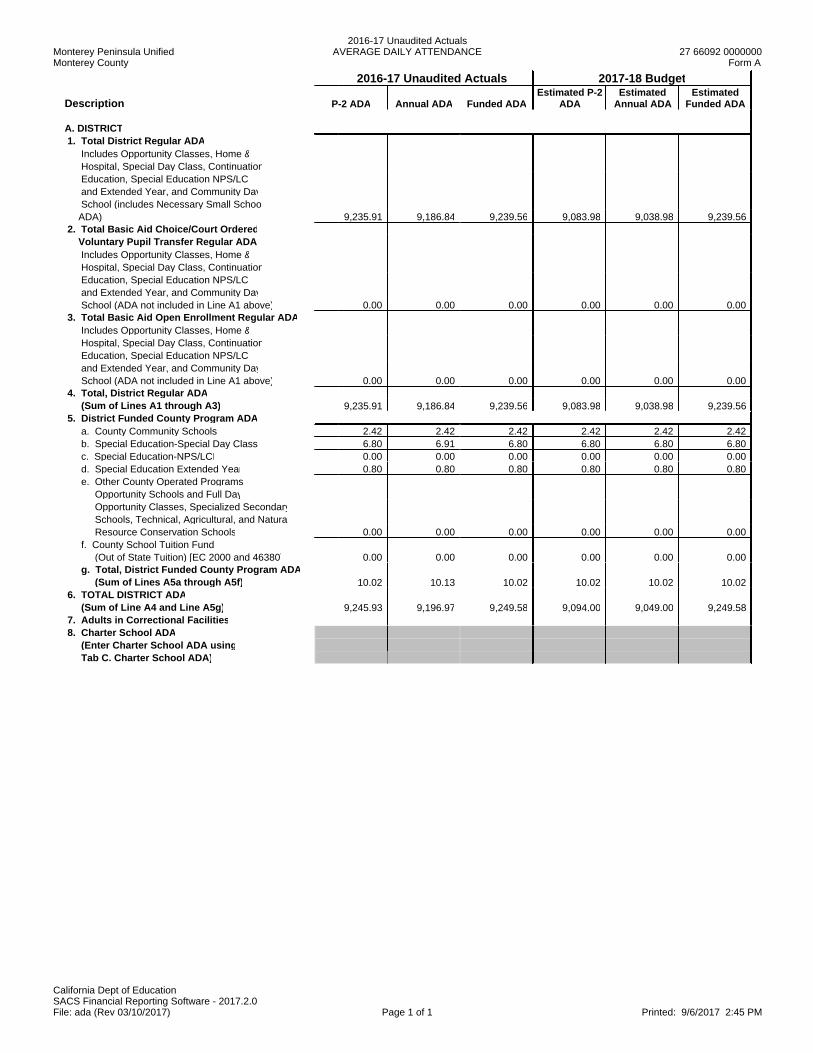
Monterey Peninsula UnifiedMonterey County
2016-17 Unaudited ActualsAVERAGE DAILY ATTENDANCE 27 66092 0000000
Form A
California Dept of EducationSACS Financial Reporting Software - 2017.2.0File: ada (Rev 03/10/2017) Page 1 of 1 Printed: 9/6/2017 2:45 PM
2016-17 Unaudited Actuals 2017-18 Budget2017-18 Budget
Description P-2 ADA Annual ADA Funded ADAEstimated P-2
ADAEstimated
Annual ADAEstimated
Funded ADA
A. DISTRICT 1. Total District Regular ADA Includes Opportunity Classes, Home & Hospital, Special Day Class, Continuation Education, Special Education NPS/LCI and Extended Year, and Community Day School (includes Necessary Small School ADA) 9,235.91 9,186.84 9,239.56 9,083.98 9,038.98 9,239.56 2. Total Basic Aid Choice/Court Ordered Voluntary Pupil Transfer Regular ADA Includes Opportunity Classes, Home & Hospital, Special Day Class, Continuation Education, Special Education NPS/LCI and Extended Year, and Community Day School (ADA not included in Line A1 above) 0.00 0.00 0.00 0.00 0.00 0.00 3. Total Basic Aid Open Enrollment Regular ADA Includes Opportunity Classes, Home & Hospital, Special Day Class, Continuation Education, Special Education NPS/LCI and Extended Year, and Community Day School (ADA not included in Line A1 above) 0.00 0.00 0.00 0.00 0.00 0.00 4. Total, District Regular ADA (Sum of Lines A1 through A3) 9,235.91 9,186.84 9,239.56 9,083.98 9,038.98 9,239.56 5. District Funded County Program ADA a. County Community Schools 2.42 2.42 2.42 2.42 2.42 2.42 b. Special Education-Special Day Class 6.80 6.91 6.80 6.80 6.80 6.80 c. Special Education-NPS/LCI 0.00 0.00 0.00 0.00 0.00 0.00 d. Special Education Extended Year 0.80 0.80 0.80 0.80 0.80 0.80 e. Other County Operated Programs: Opportunity Schools and Full Day Opportunity Classes, Specialized Secondary Schools, Technical, Agricultural, and Natura Resource Conservation Schools 0.00 0.00 0.00 0.00 0.00 0.00 f. County School Tuition Fund (Out of State Tuition) [EC 2000 and 46380] 0.00 0.00 0.00 0.00 0.00 0.00 g. Total, District Funded County Program ADA (Sum of Lines A5a through A5f) 10.02 10.13 10.02 10.02 10.02 10.02 6. TOTAL DISTRICT ADA (Sum of Line A4 and Line A5g) 9,245.93 9,196.97 9,249.58 9,094.00 9,049.00 9,249.58 7. Adults in Correctional Facilities 8. Charter School ADA (Enter Charter School ADA using Tab C. Charter School ADA)

Monterey Peninsula UnifiedMonterey County
2016-17 Unaudited ActualsAVERAGE DAILY ATTENDANCE 27 66092 0000000
Form A
California Dept of EducationSACS Financial Reporting Software - 2017.2.0File: ada (Rev 02/03/2016) Page 1 of 1 Printed: 9/6/2017 2:45 PM
2016-17 Unaudited Actuals 2017-18 Budget2017-18 BudgetEstimated P-2 Estimated Estimated
Description P-2 ADA Annual ADA Funded ADA ADA Annual ADA Funded ADA
B. COUNTY OFFICE OF EDUCATION 1. County Program Alternative Education ADA a. County Group Home and Institution Pupils b. Juvenile Halls, Homes, and Camps c. Probation Referred, On Probation or Parole, Expelled per EC 48915(a) or (c) [EC 2574(c)(4)(A)] d. Total, County Program Alternative Education ADA (Sum of Lines B1a through B1c) 0.00 0.00 0.00 0.00 0.00 0.00 2. District Funded County Program ADA a. County Community Schools b. Special Education-Special Day Class c. Special Education-NPS/LCI d. Special Education Extended Year e. Other County Operated Programs: Opportunity Schools and Full Day Opportunity Classes, Specialized Secondary Schools, Technical, Agricultural, and Natural Resource Conservation Schools f. County School Tuition Fund (Out of State Tuition) [EC 2000 and 46380] g. Total, District Funded County Program ADA (Sum of Lines B2a through B2f) 0.00 0.00 0.00 0.00 0.00 0.00 3. TOTAL COUNTY OFFICE ADA (Sum of Lines B1d and B2g) 0.00 0.00 0.00 0.00 0.00 0.00 4. Adults in Correctional Facilities 5. County Operations Grant ADA 6. Charter School ADA (Enter Charter School ADA using Tab C. Charter School ADA)

Monterey Peninsula UnifiedMonterey County
2016-17 Unaudited ActualsAVERAGE DAILY ATTENDANCE 27 66092 0000000
Form A
California Dept of EducationSACS Financial Reporting Software - 2017.2.0File: ada (Rev 02/03/2016) Page 1 of 1 Printed: 9/6/2017 2:45 PM
2016-17 Unaudited Actuals 2017-18 Budget2017-18 Budget
Description P-2 ADA Annual ADA Funded ADAEstimated P-2
ADAEstimated
Annual ADAEstimated
Funded ADAC. CHARTER SCHOOL ADA Authorizing LEAs reporting charter school SACS financial data in their Fund 01, 09, or 62 use this worksheet to report ADA for those charter schools Authorizing LEAs reporting charter school SACS financial data in their Fund 01, 09, or 62 use this worksheet to report ADA for those charter schools Charter schools reporting SACS financial data separately from their authorizing LEAs in Fund 01 or Fund 62 use this worksheet to report their ADA Charter schools reporting SACS financial data separately from their authorizing LEAs in Fund 01 or Fund 62 use this worksheet to report their ADA
FUND 01: Charter School ADA corresponding to SACS financial data reported in Fund 01 FUND 01: Charter School ADA corresponding to SACS financial data reported in Fund 01
1. Total Charter School Regular ADA 2. Charter School County Program Alternative Education ADA a. County Group Home and Institution Pupils b. Juvenile Halls, Homes, and Camps c. Probation Referred, On Probation or Parole, Expelled per EC 48915(a) or (c) [EC 2574(c)(4)(A)] d. Total, Charter School County Program Alternative Education ADA (Sum of Lines C2a through C2c) 0.00 0.00 0.00 0.00 0.00 0.00 3. Charter School Funded County Program ADA a. County Community Schools b. Special Education-Special Day Class c. Special Education-NPS/LCI d. Special Education Extended Year e. Other County Operated Programs: Opportunity Schools and Full Day Opportunity Classes, Specialized Secondary Schools, Technical, Agricultural, and Natura Resource Conservation Schools f. Total, Charter School Funded County Program ADA (Sum of Lines C3a through C3e) 0.00 0.00 0.00 0.00 0.00 0.00 4. TOTAL CHARTER SCHOOL ADA (Sum of Lines C1, C2d, and C3f) 0.00 0.00 0.00 0.00 0.00 0.00
FUND 09 or 62: Charter School ADA corresponding to SACS financial data reported in Fund 09 or Fund 62
5. Total Charter School Regular ADA 427.09 426.24 427.09 488.59 488.59 488.59 6. Charter School County Program Alternative Education ADA a. County Group Home and Institution Pupils 0.00 0.00 0.00 0.00 0.00 0.00 b. Juvenile Halls, Homes, and Camps 0.00 0.00 0.00 0.00 0.00 0.00 c. Probation Referred, On Probation or Parole, Expelled per EC 48915(a) or (c) [EC 2574(c)(4)(A)] 0.00 0.00 0.00 0.00 0.00 0.00 d. Total, Charter School County Program Alternative Education ADA (Sum of Lines C6a through C6c) 0.00 0.00 0.00 0.00 0.00 0.00 7. Charter School Funded County Program ADA a. County Community Schools 0.00 0.00 0.00 0.00 0.00 0.00 b. Special Education-Special Day Class 0.00 0.00 0.00 0.00 0.00 0.00 c. Special Education-NPS/LCI 0.00 0.00 0.00 0.00 0.00 0.00 d. Special Education Extended Year 0.00 0.00 0.00 0.00 0.00 0.00 e. Other County Operated Programs: Opportunity Schools and Full Day Opportunity Classes, Specialized Secondary Schools, Technical, Agricultural, and Natura Resource Conservation Schools 0.00 0.00 0.00 0.00 0.00 0.00 f. Total, Charter School Funded County Program ADA (Sum of Lines C7a through C7e) 0.00 0.00 0.00 0.00 0.00 0.00 8. TOTAL CHARTER SCHOOL ADA (Sum of Lines C5, C6d, and C7f) 427.09 426.24 427.09 488.59 488.59 488.59 9. TOTAL CHARTER SCHOOL ADA Reported in Fund 01, 09, or 62 (Sum of Lines C4 and C8) 427.09 426.24 427.09 488.59 488.59 488.59
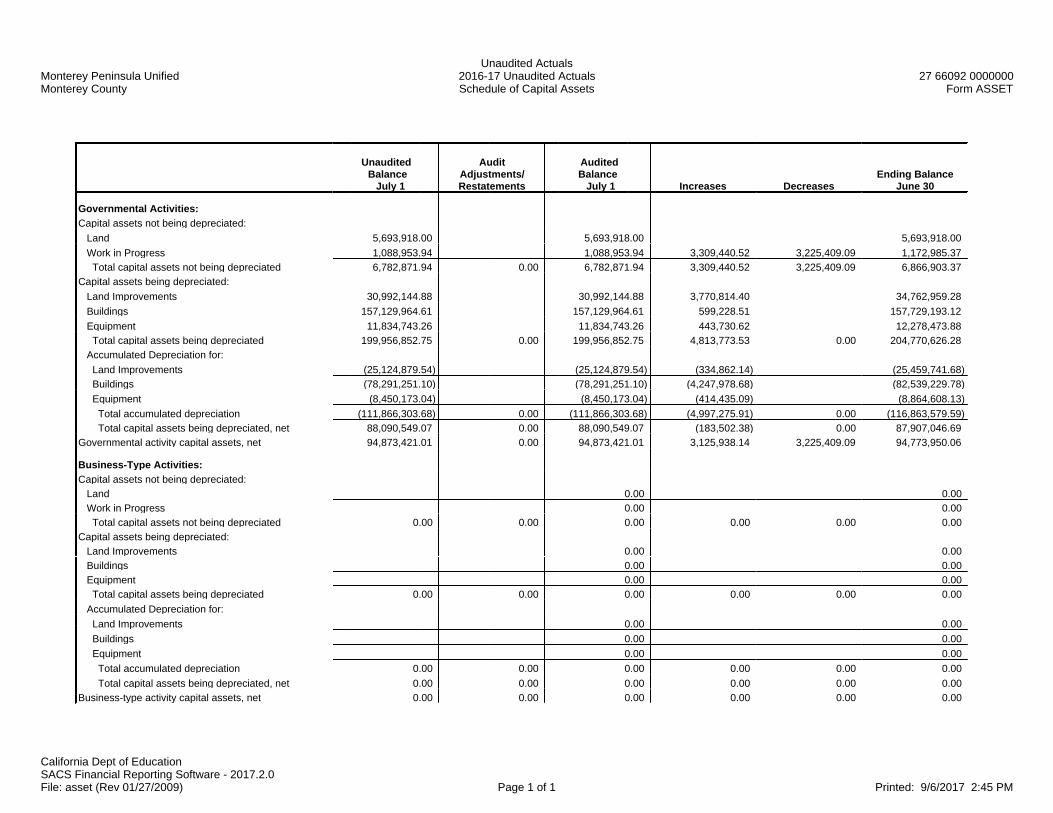
Monterey Peninsula UnifiedMonterey County
Unaudited Actuals2016-17 Unaudited ActualsSchedule of Capital Assets
27 66092 0000000Form ASSET
California Dept of EducationSACS Financial Reporting Software - 2017.2.0File: asset (Rev 01/27/2009) Page 1 of 1 Printed: 9/6/2017 2:45 PM
Unaudited Balance July 1
AuditAdjustments/Restatements
AuditedBalance July 1 Increases Decreases
Ending BalanceJune 30
Governmental Activities:
Capital assets not being depreciated:
Land 5,693,918.00 5,693,918.00 5,693,918.00
Work in Progress 1,088,953.94 1,088,953.94 3,309,440.52 3,225,409.09 1,172,985.37
Total capital assets not being depreciated 6,782,871.94 0.00 6,782,871.94 3,309,440.52 3,225,409.09 6,866,903.37
Capital assets being depreciated:
Land Improvements 30,992,144.88 30,992,144.88 3,770,814.40 34,762,959.28
Buildings 157,129,964.61 157,129,964.61 599,228.51 157,729,193.12
Equipment 11,834,743.26 11,834,743.26 443,730.62 12,278,473.88
Total capital assets being depreciated 199,956,852.75 0.00 199,956,852.75 4,813,773.53 0.00 204,770,626.28
Accumulated Depreciation for:
Land Improvements (25,124,879.54) (25,124,879.54) (334,862.14) (25,459,741.68)
Buildings (78,291,251.10) (78,291,251.10) (4,247,978.68) (82,539,229.78)
Equipment (8,450,173.04) (8,450,173.04) (414,435.09) (8,864,608.13)
Total accumulated depreciation (111,866,303.68) 0.00 (111,866,303.68) (4,997,275.91) 0.00 (116,863,579.59)
Total capital assets being depreciated, net 88,090,549.07 0.00 88,090,549.07 (183,502.38) 0.00 87,907,046.69
Governmental activity capital assets, net 94,873,421.01 0.00 94,873,421.01 3,125,938.14 3,225,409.09 94,773,950.06
Business-Type Activities:
Capital assets not being depreciated:
Land 0.00 0.00
Work in Progress 0.00 0.00
Total capital assets not being depreciated 0.00 0.00 0.00 0.00 0.00 0.00
Capital assets being depreciated:
Land Improvements 0.00 0.00
Buildings 0.00 0.00
Equipment 0.00 0.00
Total capital assets being depreciated 0.00 0.00 0.00 0.00 0.00 0.00
Accumulated Depreciation for:
Land Improvements 0.00 0.00
Buildings 0.00 0.00
Equipment 0.00 0.00
Total accumulated depreciation 0.00 0.00 0.00 0.00 0.00 0.00
Total capital assets being depreciated, net 0.00 0.00 0.00 0.00 0.00 0.00
Business-type activity capital assets, net 0.00 0.00 0.00 0.00 0.00 0.00

Monterey Peninsula UnifiedMonterey County
Unaudited Actuals2016-17 Unaudited Actuals
GENERAL FUNDCurrent Expense Formula/Minimum Classroom Compensation
27 66092 0000000Form CEA
California Dept of EducationSACS Financial Reporting Software - 2017.2.0File: cea (Rev 05/25/2017) Page 1 of 2 Printed: 9/6/2017 2:46 PM
PART I - CURRENTEXPENSE FORMULA
Total Expensefor Year
(1)EDPNo.
Reductions(See Note 1)
(2)EDPNo.
Current Expenseof Education(Col 1 - Col 2)
(3)EDPNo.
Reductions(Extracted)
(See Note 2)(4a)
Reductions(Overrides)*(See Note 2)
(4b)EDPNo.
Current Expense-Part II
(Col 3 - Col 4)(5)
EDPNo.
1000 - CertificatedSalaries 47,506,335.94 301 0.00 303 47,506,335.94 305 173,302.81 307 47,333,033.13 309
2000 - Classified Salaries 22,625,299.12 311 0.00 313 22,625,299.12 315 2,687,896.55 317 19,937,402.57 319
3000 - Employee Benefits 26,575,491.85 321 352,439.41 323 26,223,052.44 325 1,050,931.62 327 25,172,120.82 329
4000 - Books, SuppliesEquip Replace. (6500) 4,784,933.83 331 5,478.74 333 4,779,455.09 335 1,527,853.69 337 3,251,601.40 339
5000 - Services. . . &7300 - Indirect Costs 9,379,584.79 341 19,599.44 343 9,359,985.35 345 1,190,021.98 347 8,169,963.37 349
TOTAL 110,494,127.94 365 TOTAL 103,864,121.29 369
Note 1 - In Column 2, report expenditures for the following programs: Nonagency (Goals 7100-7199), Community Services (Goal 8100), Food Services
(Function 3700), Fringe Benefits for Retired Persons (Objects 3701-3702), and Facilities Acquisition & Construction (Function 8500).
Note 2 - In Column 4, report expenditures for: Transportation (Function 3600), Lottery Expenditures (Resource 1100), Special Education Students in
Nonpublic Schools (Function 1180), and other federal or state categorical aid in which funds were granted for expenditures in a program not
incurring any teacher salary expenditures or requiring disbursement of the funds without regard to the requirements of EC Section 41372
* If an amount (even zero) is entered in any row of Column 4b or in Line 13b, the form uses only the values in Column 4b and Line 13b rather than the
values in Column 4a and Line 13a.
PART II: MINIMUM CLASSROOM COMPENSATION (Instruction, Functions 1000-1999) ObjectEDPNo.
1. Teacher Salaries as Per EC 41011. . . . . . . . . . . . . . . . . . . . . . . . . . . . . . . . . . . . . . . . . . . . . . . . . . . . . . . . . . . . . . . . . . . . . . . 1100 38,245,342.90 375
2. Salaries of Instructional Aides Per EC 41011. . . . . . . . . . . . . . . . . . . . . . . . . . . . . . . . . . . . . . . . . . . . . . . . . . . . . . . . . . . . . . . 2100 5,032,754.94 380
3. STRS. . . . . . . . . . . . . . . . . . . . . . . . . . . . . . . . . . . . . . . . . . . . . . . . . . . . . . . . . . . . . . . . . . . . . . . . . . . . . . . . . . . . . . . . . . . . . . 3101 & 3102 7,402,432.92 382
4. PERS. . . . . . . . . . . . . . . . . . . . . . . . . . . . . . . . . . . . . . . . . . . . . . . . . . . . . . . . . . . . . . . . . . . . . . . . . . . . . . . . . . . . . . . . . . . . . . 3201 & 3202 824,050.84 383
5. OASDI - Regular, Medicare and Alternative. . . . . . . . . . . . . . . . . . . . . . . . . . . . . . . . . . . . . . . . . . . . . . . . . . . . . . . . . . . . . . . . 3301 & 3302 1,005,915.53 384
6. Health & Welfare Benefits (EC 41372)
(Include Health, Dental, Vision, Pharmaceutical, and
Annuity Plans). . . . . . . . . . . . . . . . . . . . . . . . . . . . . . . . . . . . . . . . . . . . . . . . . . . . . . . . . . . . . . . . . . . . . . . . . . . . . . . . . . . . . . . 3401 & 3402 5,011,734.26 385
7. Unemployment Insurance. . . . . . . . . . . . . . . . . . . . . . . . . . . . . . . . . . . . . . . . . . . . . . . . . . . . . . . . . . . . . . . . . . . . . . . . . . . . . . 3501 & 3502 22,115.27 390
8. Workers' Compensation Insurance. . . . . . . . . . . . . . . . . . . . . . . . . . . . . . . . . . . . . . . . . . . . . . . . . . . . . . . . . . . . . . . . . . . . . . . 3601 & 3602 2,010,283.78 392
9. OPEB, Active Employees (EC 41372). . . . . . . . . . . . . . . . . . . . . . . . . . . . . . . . . . . . . . . . . . . . . . . . . . . . . . . . . . . . . . . . . . . . 3751 & 3752 293,338.64
10. Other Benefits (EC 22310). . . . . . . . . . . . . . . . . . . . . . . . . . . . . . . . . . . . . . . . . . . . . . . . . . . . . . . . . . . . . . . . . . . . . . . . . . . . . 3901 & 3902 0.00 393
11. SUBTOTAL Salaries and Benefits (Sum Lines 1 - 10). . . . . . . . . . . . . . . . . . . . . . . . . . . . . . . . . . . . . . . . . . . . . . . . . . . . . . . . . . . . . . . . . . . . . . . . . . . . . . 59,847,969.08 395
12. Less: Teacher and Instructional Aide Salaries and
Benefits deducted in Column 2. . . . . . . . . . . . . . . . . . . . . . . . . . . . . . . . . . . . . . . . . . . . . . . . . . . . . . . . . . . . . . . . . . . . . . . . . . . . . . . . . . . . . . . . . . . . . . . . 0.00
13a. Less: Teacher and Instructional Aide Salaries and
Benefits (other than Lottery) deducted in Column 4a (Extracted). . . . . . . . . . . . . . . . . . . . . . . . . . . . . . . . . . . . . . . . . . . . . . . . . . . . . . . . . . . . . . . . . . . . . . 267,676.85 396 b. Less: Teacher and Instructional Aide Salaries and Benefits (other than Lottery) deducted in Column 4b (Overrides)*. . . . . . . . . . . . . . . . . . . . . . . . . . . . . . . . . . . . . . . . . . . . . . . . . . . . . . . . . . . . . . . . . . . . . 396
14. TOTAL SALARIES AND BENEFITS. . . . . . . . . . . . . . . . . . . . . . . . . . . . . . . . . . . . . . . . . . . . . . . . . . . . . . . . . . . . . . . . . . . . . . . . . . . . . . . . . . . . . . . . . . . . 59,580,292.23 397
15. Percent of Current Cost of Education Expended for Classroom
Compensation (EDP 397 divided by EDP 369) Line 15 must
equal or exceed 60% for elementary, 55% for unified and 50%
for high school districts to avoid penalty under provisions of EC 41372. . . . . . . . . . . . . . . . . . . . . . . . . . . . . . . . . . . . . . . . . . . . . . . . . . . . . . . . . . . . . . . . . 57.36%
16. District is exempt from EC 41372 because it meets the provisions
of EC 41374. (If exempt, enter 'X') . . . . . . . . . . . . . . . . . . . . . . . . . . . . . . . . . . . . . . . . . . . . . . . . . . . . . . . . . . . . . . . . . . . . . . . . . . . . . . . . . . . . . . . . . . . .
PART III: DEFICIENCY AMOUNT
A deficiency amount (Line 5) is only applicable to districts not meeting the minimum classroom compensation percentage required under EC 41372 and not exempt under thprovisions of EC 41374.A deficiency amount (Line 5) is only applicable to districts not meeting the minimum classroom compensation percentage required under EC 41372 and not exempt under thprovisions of EC 41374.1. Minimum percentage required (60% elementary, 55% unified, 50% high) . . . . . . . . . . . . . . . . . . . . . . . . . . . . . . . . . . . . . . . . . . . . . . . . . . . . . . . . . . . . . . 55.00%2. Percentage spent by this district (Part II, Line 15) . . . . . . . . . . . . . . . . . . . . . . . . . . . . . . . . . . . . . . . . . . . . . . . . . . . . . . . . . . . . . . . . . . . . . . . . . . . . . . . . . 57.36%3. Percentage below the minimum (Part III, Line 1 minus Line 2) . . . . . . . . . . . . . . . . . . . . . . . . . . . . . . . . . . . . . . . . . . . . . . . . . . . . . . . . . . . . . . . . . . . . . . . 0.00%4. District's Current Expense of Education after reductions in columns 4a or 4b (Part I, EDP 369). . . . . . . . . . . . . . . . . . . . . . . . . . . . . . . . . . . . . . . . . . . . . . 103,864,121.29
5. Deficiency Amount (Part III, Line 3 times Line 4) . . . . . . . . . . . . . . . . . . . . . . . . . . . . . . . . . . . . . . . . . . . . . . . . . . . . . . . . . . . . . . . . . . . . . . . . . . . . . . . . . 0.00
PART IV: Explanation for adjustments entered in Part I, Column 4b (required)
Monterey Peninsula UnifiedMonterey County
Unaudited Actuals2016-17 Unaudited Actuals
GENERAL FUNDCurrent Expense Formula/Minimum Classroom Compensation
27 66092 0000000Form CEA
California Dept of EducationSACS Financial Reporting Software - 2017.2.0File: cea (Rev 05/25/2017) Page 2 of 2 Printed: 9/6/2017 2:46 PM

Monterey Peninsula UnifiedMonterey County
Unaudited Actuals2016-17 Unaudited Actuals
Schedule of Long-Term Liabilities27 66092 0000000
Form DEBT
California Dept of EducationSACS Financial Reporting Software - 2017.2.0File: debt (Rev 06/22/2015) Page 1 of 1 Printed: 9/6/2017 2:47 PM
Unaudited Balance July 1
AuditAdjustments/Restatements
AuditedBalance July 1 Increases Decreases
Ending BalanceJune 30
Amounts Due WithinOne Year
Governmental Activities:
General Obligation Bonds Payable 54,140,987.44 54,140,987.44 72,235,000.00 33,023,348.00 93,352,639.44 947,479.00 State School Building Loans Payable 0.00 0.00 Certificates of Participation Payable 0.00 0.00 Capital Leases Payable 0.00 0.00 Lease Revenue Bonds Payable 0.00 0.00 Other General Long-Term Debt 8,248,109.71 (110,774.71) 8,137,335.00 1,299,999.57 1,401,823.77 8,035,510.80 396,485.59 Net Pension Liability 87,609,734.00 87,609,734.00 22,929,788.00 110,539,522.00 Net OPEB Obligation 8,071,718.00 8,071,718.00 1,950,907.00 1,023,659.00 8,998,966.00 Compensated Absences Payable 617,566.59 617,566.59 29,785.55 647,352.14
Governmental activities long-term liabilities 158,688,115.74 (110,774.71) 158,577,341.03 98,445,480.12 35,448,830.77 221,573,990.38 1,343,964.59
Business-Type Activities:
General Obligation Bonds Payable 0.00 0.00 State School Building Loans Payable 0.00 0.00 Certificates of Participation Payable 0.00 0.00 Capital Leases Payable 0.00 0.00 Lease Revenue Bonds Payable 0.00 0.00 Other General Long-Term Debt 0.00 0.00 Net Pension Liability 0.00 0.00 Net OPEB Obligation 0.00 0.00 Compensated Absences Payable 0.00 0.00
Business-type activities long-term liabilities 0.00 0.00 0.00 0.00 0.00 0.00 0.00

Monterey Peninsula UnifiedMonterey County
Unaudited ActualsFiscal Year 2016-17
School District Appropriations Limit Calculations27 66092 0000000
Form GANN
California Dept of EducationSACS Financial Reporting Software - 2017.2.0File: gann-d (Rev 05/18/2017) Page 1 of 3 Printed: 9/6/2017 2:47 PM
2016-17Calculations
2017-18Calculations
Extracted Entered Data/ Extracted Entered Data/
Data Adjustments* Totals Data Adjustments* Totals
A. PRIOR YEAR DATA 2015-16 Actual 2016-17 Actual
(2015-16 Actual Appropriations Limit and Gann ADA
are from district's prior year Gann data reported to the CDE)
1. FINAL PRIOR YEAR APPROPRIATIONS LIMIT
(Preload/Line D11, PY column) 61,759,445.68 61,759,445.68 65,375,277.18
2. PRIOR YEAR GANN ADA (Preload/Line B3, PY column) 9,628.92 9,628.92 9,673.02
ADJUSTMENTS TO PRIOR YEAR LIMIT Adjustments to 2015-16 Adjustments to 2016-17
3. District Lapses, Reorganizations and Other Transfers4. Temporary Voter Approved Increases5. Less: Lapses of Voter Approved Increases6. TOTAL ADJUSTMENTS TO PRIOR YEAR LIMIT
(Lines A3 plus A4 minus A5) 0.00 0.00
7. ADJUSTMENTS TO PRIOR YEAR ADA(Only for district lapses, reorganizations and
other transfers, and only if adjustments to the
appropriations limit are entered in Line A3 above)
B. CURRENT YEAR GANN ADA 2016-17 P2 Report 2017-18 P2 Estimate(2016-17 data should tie to Principal ApportionmentSoftware Attendance reports and include ADA for charter schoolsreporting with the district)
1. Total K-12 ADA (Form A, Line A6) 9,245.93 9,245.93 9,094.00 9,094.00
2. Total Charter Schools ADA (Form A, Line C9) 427.09 427.09 488.59 488.59
3. TOTAL CURRENT YEAR P2 ADA (Line B1 plus B2) 9,673.02 9,582.59
C. LOCAL PROCEEDS OF TAXES/STATE AID RECEIVED 2016-17 Actual 2017-18 BudgetTAXES AND SUBVENTIONS (Funds 01, 09, and 62)
1. Homeowners' Exemption (Object 8021) 192,824.20 192,824.20 192,824.00 192,824.00
2. Timber Yield Tax (Object 8022) 0.00 0.00 0.00 0.00
3. Other Subventions/In-Lieu Taxes (Object 8029) 0.00 0.00 0.00 0.00
4. Secured Roll Taxes (Object 8041) 36,205,247.12 36,205,247.12 36,205,248.00 36,205,248.00
5. Unsecured Roll Taxes (Object 8042) 1,599,651.87 1,599,651.87 1,599,652.00 1,599,652.00
6. Prior Years' Taxes (Object 8043) 291,818.80 291,818.80 332,781.00 332,781.00
7. Supplemental Taxes (Object 8044) 697,411.23 697,411.23 697,411.00 697,411.00
8. Ed. Rev. Augmentation Fund (ERAF) (Object 8045) 1,791,788.98 1,791,788.98 1,791,789.00 1,791,789.00
9. Penalties and Int. from Delinquent Taxes (Object 8048) 40,962.10 40,962.10 0.00 0.00
10. Other In-Lieu Taxes (Object 8082) 0.00 0.00 0.00 0.00
11. Comm. Redevelopment Funds (objects 8047 & 8625) 7,999,279.44 7,999,279.44 1,441,948.00 1,441,948.00
12. Parcel Taxes (Object 8621) 0.00 0.00 0.00 0.00
13. Other Non-Ad Valorem Taxes (Object 8622) (Taxes only) 0.00 0.00 0.00 0.00
14. Penalties and Int. from Delinquent Non-LCFF
Taxes (Object 8629) (Only those for the above taxes) 0.00 0.00 0.00 0.00
15. Transfers to Charter Schools
in Lieu of Property Taxes (Object 8096)16. TOTAL TAXES AND SUBVENTIONS
(Lines C1 through C15) 48,818,983.74 0.00 48,818,983.74 42,261,653.00 0.00 42,261,653.00
OTHER LOCAL REVENUES (Funds 01, 09, and 62)
17. To General Fund from Bond Interest and Redemption
Fund (Excess debt service taxes) (Object 8914) 0.00 0.00 0.00 0.00
18. TOTAL LOCAL PROCEEDS OF TAXES
(Lines C16 plus C17) 48,818,983.74 0.00 48,818,983.74 42,261,653.00 0.00 42,261,653.00
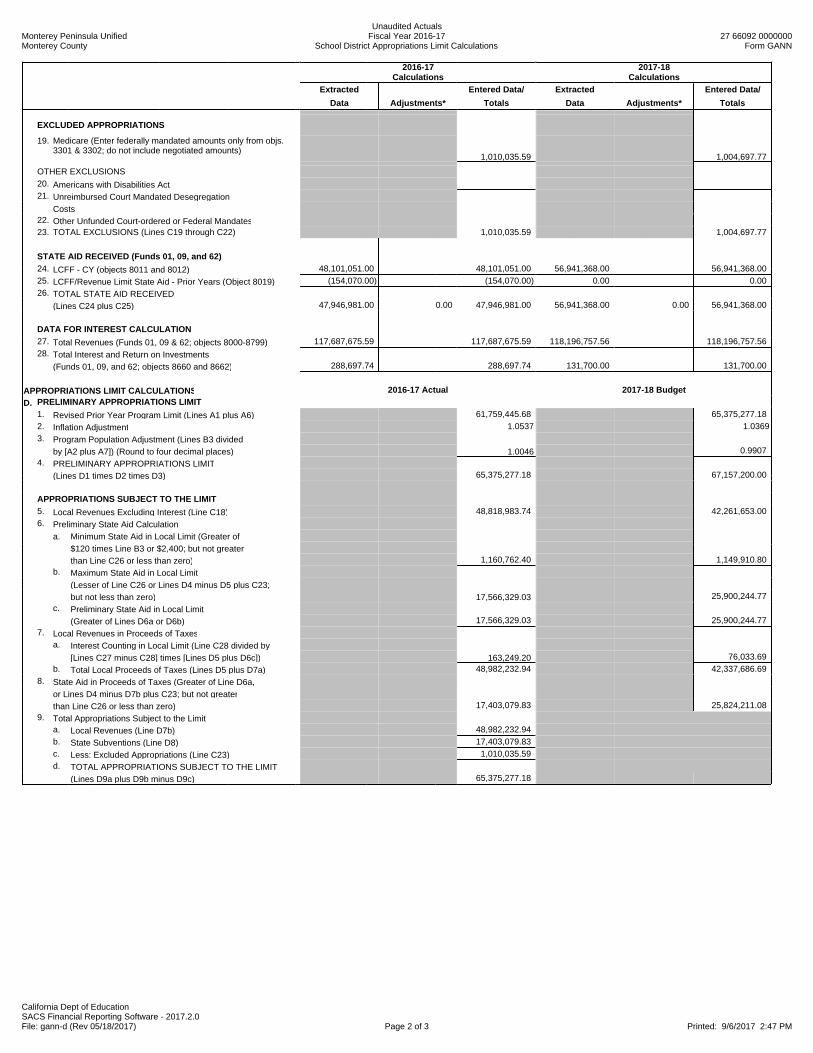
Monterey Peninsula UnifiedMonterey County
Unaudited ActualsFiscal Year 2016-17
School District Appropriations Limit Calculations27 66092 0000000
Form GANN
California Dept of EducationSACS Financial Reporting Software - 2017.2.0File: gann-d (Rev 05/18/2017) Page 2 of 3 Printed: 9/6/2017 2:47 PM
2016-17Calculations
2017-18Calculations
Extracted Entered Data/ Extracted Entered Data/
Data Adjustments* Totals Data Adjustments* Totals
EXCLUDED APPROPRIATIONS
19. Medicare (Enter federally mandated amounts only from objs.3301 & 3302; do not include negotiated amounts)
1,010,035.59 1,004,697.77
OTHER EXCLUSIONS
20. Americans with Disabilities Act21. Unreimbursed Court Mandated Desegregation
Costs 22. Other Unfunded Court-ordered or Federal Mandates23. TOTAL EXCLUSIONS (Lines C19 through C22) 1,010,035.59 1,004,697.77
STATE AID RECEIVED (Funds 01, 09, and 62)
24. LCFF - CY (objects 8011 and 8012) 48,101,051.00 48,101,051.00 56,941,368.00 56,941,368.00
25. LCFF/Revenue Limit State Aid - Prior Years (Object 8019) (154,070.00) (154,070.00) 0.00 0.00
26. TOTAL STATE AID RECEIVED
(Lines C24 plus C25) 47,946,981.00 0.00 47,946,981.00 56,941,368.00 0.00 56,941,368.00
DATA FOR INTEREST CALCULATION
27. Total Revenues (Funds 01, 09 & 62; objects 8000-8799) 117,687,675.59 117,687,675.59 118,196,757.56 118,196,757.56
28. Total Interest and Return on Investments
(Funds 01, 09, and 62; objects 8660 and 8662) 288,697.74 288,697.74 131,700.00 131,700.00
APPROPRIATIONS LIMIT CALCULATIONS 2016-17 Actual 2017-18 Budget
D. PRELIMINARY APPROPRIATIONS LIMIT
1. Revised Prior Year Program Limit (Lines A1 plus A6) 61,759,445.68 65,375,277.18
2. Inflation Adjustment 1.0537 1.0369
3. Program Population Adjustment (Lines B3 divided
by [A2 plus A7]) (Round to four decimal places) 1.0046 0.9907
4. PRELIMINARY APPROPRIATIONS LIMIT
(Lines D1 times D2 times D3) 65,375,277.18 67,157,200.00
APPROPRIATIONS SUBJECT TO THE LIMIT
5. Local Revenues Excluding Interest (Line C18) 48,818,983.74 42,261,653.00
6. Preliminary State Aid Calculation
a. Minimum State Aid in Local Limit (Greater of
$120 times Line B3 or $2,400; but not greater
than Line C26 or less than zero) 1,160,762.40 1,149,910.80
b. Maximum State Aid in Local Limit
(Lesser of Line C26 or Lines D4 minus D5 plus C23;
but not less than zero) 17,566,329.03 25,900,244.77
c. Preliminary State Aid in Local Limit
(Greater of Lines D6a or D6b) 17,566,329.03 25,900,244.77
7. Local Revenues in Proceeds of Taxesa. Interest Counting in Local Limit (Line C28 divided by
[Lines C27 minus C28] times [Lines D5 plus D6c]) 163,249.20 76,033.69
b. Total Local Proceeds of Taxes (Lines D5 plus D7a) 48,982,232.94 42,337,686.69
8. State Aid in Proceeds of Taxes (Greater of Line D6a,
or Lines D4 minus D7b plus C23; but not greater
than Line C26 or less than zero) 17,403,079.83 25,824,211.08
9. Total Appropriations Subject to the Limita. Local Revenues (Line D7b) 48,982,232.94
b. State Subventions (Line D8) 17,403,079.83
c. Less: Excluded Appropriations (Line C23) 1,010,035.59
d. TOTAL APPROPRIATIONS SUBJECT TO THE LIMIT
(Lines D9a plus D9b minus D9c) 65,375,277.18
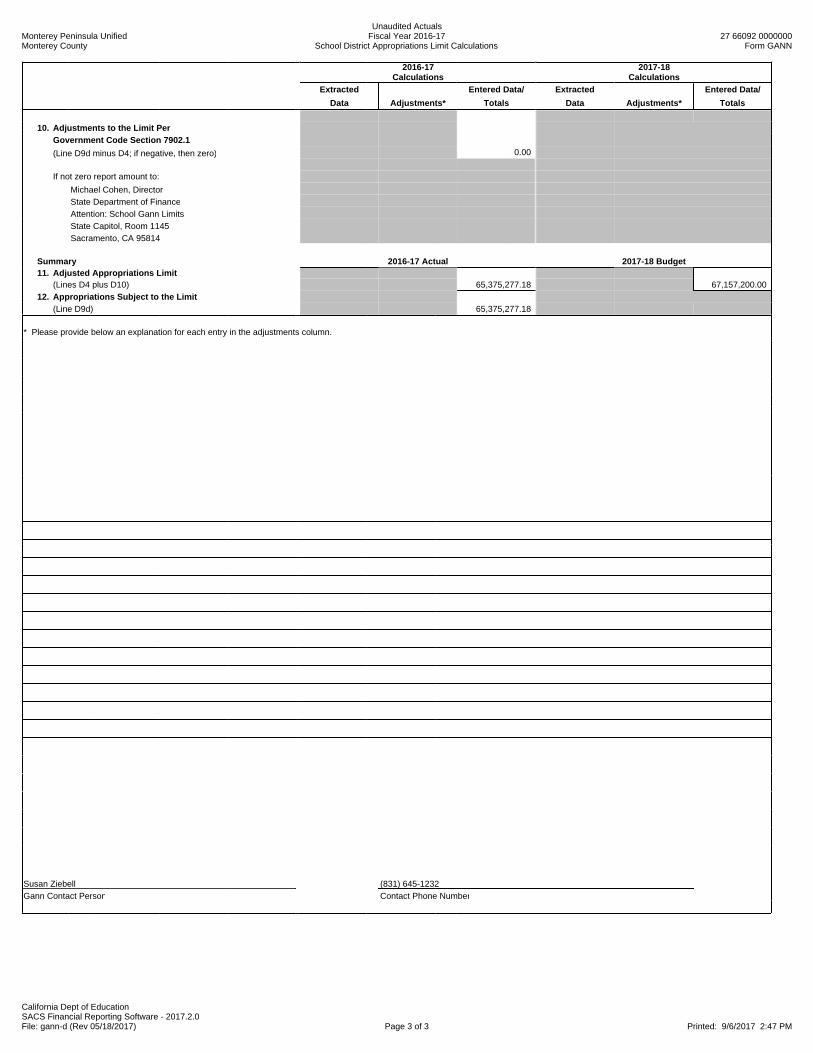
Monterey Peninsula UnifiedMonterey County
Unaudited ActualsFiscal Year 2016-17
School District Appropriations Limit Calculations27 66092 0000000
Form GANN
California Dept of EducationSACS Financial Reporting Software - 2017.2.0File: gann-d (Rev 05/18/2017) Page 3 of 3 Printed: 9/6/2017 2:47 PM
2016-17Calculations
2017-18Calculations
Extracted Entered Data/ Extracted Entered Data/
Data Adjustments* Totals Data Adjustments* Totals
10. Adjustments to the Limit Per
Government Code Section 7902.1
(Line D9d minus D4; if negative, then zero) 0.00
If not zero report amount to:
Michael Cohen, Director
State Department of Finance
Attention: School Gann Limits
State Capitol, Room 1145
Sacramento, CA 95814
Summary 2016-17 Actual 2017-18 Budget11. Adjusted Appropriations Limit
(Lines D4 plus D10) 65,375,277.18 67,157,200.00
12. Appropriations Subject to the Limit
(Line D9d) 65,375,277.18
* Please provide below an explanation for each entry in the adjustments column.
Susan Ziebell (831) 645-1232
Gann Contact Person Contact Phone Number
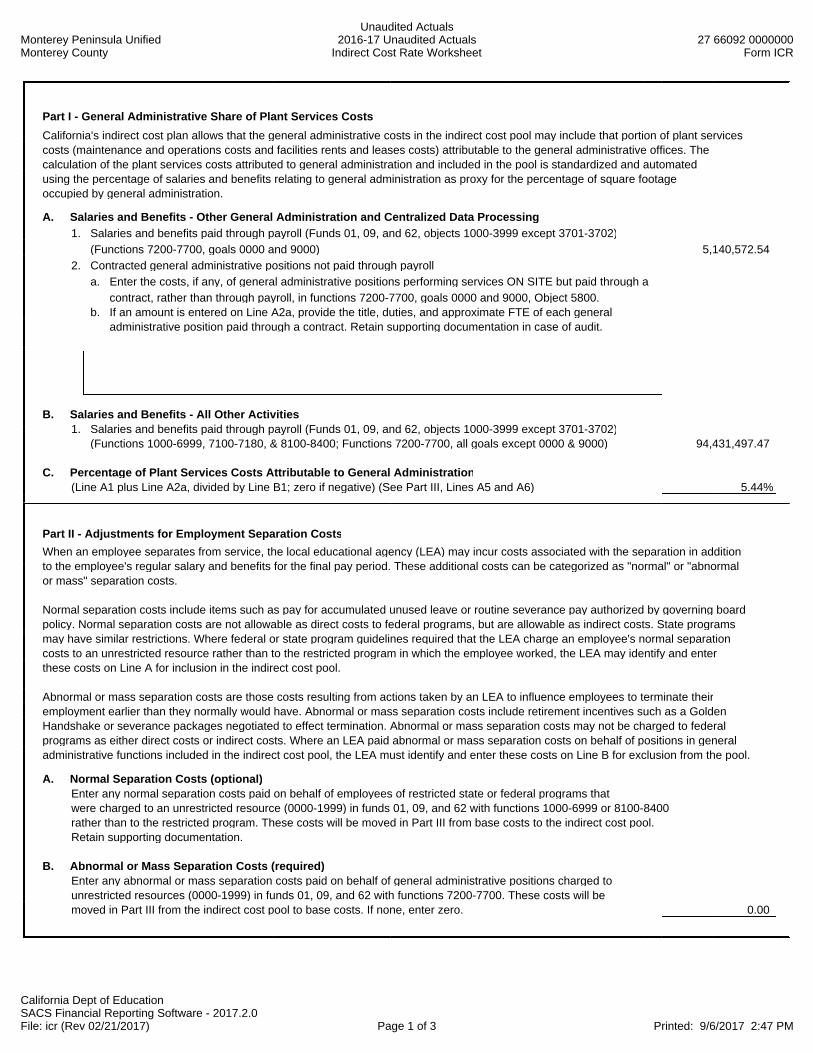
Monterey Peninsula UnifiedMonterey County
Unaudited Actuals2016-17 Unaudited Actuals
Indirect Cost Rate Worksheet27 66092 0000000
Form ICR
California Dept of EducationSACS Financial Reporting Software - 2017.2.0File: icr (Rev 02/21/2017) Page 1 of 3 Printed: 9/6/2017 2:47 PM
Part I - General Administrative Share of Plant Services Costs
California's indirect cost plan allows that the general administrative costs in the indirect cost pool may include that portion of plant services costs (maintenance and operations costs and facilities rents and leases costs) attributable to the general administrative offices. The calculation of the plant services costs attributed to general administration and included in the pool is standardized and automated using the percentage of salaries and benefits relating to general administration as proxy for the percentage of square footage occupied by general administration.
A. Salaries and Benefits - Other General Administration and Centralized Data Processing
1. Salaries and benefits paid through payroll (Funds 01, 09, and 62, objects 1000-3999 except 3701-3702)
(Functions 7200-7700, goals 0000 and 9000) 5,140,572.54
2. Contracted general administrative positions not paid through payroll
a. Enter the costs, if any, of general administrative positions performing services ON SITE but paid through a
contract, rather than through payroll, in functions 7200-7700, goals 0000 and 9000, Object 5800. b. If an amount is entered on Line A2a, provide the title, duties, and approximate FTE of each general administrative position paid through a contract. Retain supporting documentation in case of audit.
B. Salaries and Benefits - All Other Activities 1. Salaries and benefits paid through payroll (Funds 01, 09, and 62, objects 1000-3999 except 3701-3702) (Functions 1000-6999, 7100-7180, & 8100-8400; Functions 7200-7700, all goals except 0000 & 9000) 94,431,497.47 C. Percentage of Plant Services Costs Attributable to General Administration (Line A1 plus Line A2a, divided by Line B1; zero if negative) (See Part III, Lines A5 and A6) 5.44%
Part II - Adjustments for Employment Separation Costs
When an employee separates from service, the local educational agency (LEA) may incur costs associated with the separation in addition to the employee's regular salary and benefits for the final pay period. These additional costs can be categorized as "normal" or "abnormal or mass" separation costs.
Normal separation costs include items such as pay for accumulated unused leave or routine severance pay authorized by governing board policy. Normal separation costs are not allowable as direct costs to federal programs, but are allowable as indirect costs. State programs may have similar restrictions. Where federal or state program guidelines required that the LEA charge an employee's normal separation costs to an unrestricted resource rather than to the restricted program in which the employee worked, the LEA may identify and enter these costs on Line A for inclusion in the indirect cost pool.
Abnormal or mass separation costs are those costs resulting from actions taken by an LEA to influence employees to terminate their employment earlier than they normally would have. Abnormal or mass separation costs include retirement incentives such as a Golden Handshake or severance packages negotiated to effect termination. Abnormal or mass separation costs may not be charged to federal programs as either direct costs or indirect costs. Where an LEA paid abnormal or mass separation costs on behalf of positions in general administrative functions included in the indirect cost pool, the LEA must identify and enter these costs on Line B for exclusion from the pool.
A. Normal Separation Costs (optional) Enter any normal separation costs paid on behalf of employees of restricted state or federal programs that were charged to an unrestricted resource (0000-1999) in funds 01, 09, and 62 with functions 1000-6999 or 8100-8400 rather than to the restricted program. These costs will be moved in Part III from base costs to the indirect cost pool. Retain supporting documentation.
B. Abnormal or Mass Separation Costs (required) Enter any abnormal or mass separation costs paid on behalf of general administrative positions charged to unrestricted resources (0000-1999) in funds 01, 09, and 62 with functions 7200-7700. These costs will be moved in Part III from the indirect cost pool to base costs. If none, enter zero. 0.00

Monterey Peninsula UnifiedMonterey County
Unaudited Actuals2016-17 Unaudited Actuals
Indirect Cost Rate Worksheet27 66092 0000000
Form ICR
California Dept of EducationSACS Financial Reporting Software - 2017.2.0File: icr (Rev 02/21/2017) Page 2 of 3 Printed: 9/6/2017 2:47 PM
Part III - Indirect Cost Rate Calculation (Funds 01, 09, and 62, unless indicated otherwise)
A. Indirect Costs
1. Other General Administration, less portion charged to restricted resources or specific goals
(Functions 7200-7600, objects 1000-5999, minus Line B9) 5,512,009.86
2. Centralized Data Processing, less portion charged to restricted resources or specific goals
(Function 7700, objects 1000-5999, minus Line B10) 1,224,624.96 3. External Financial Audit - Single Audit (Function 7190, resources 0000-1999, goals 0000 and 9000, objects 5000-5999)
82,850.00 4. Staff Relations and Negotiations (Function 7120, resources 0000-1999, goals 0000 and 9000, objects 1000-5999) 0.00 5. Plant Maintenance and Operations (portion relating to general administrative offices only)
(Functions 8100-8400, objects 1000-5999 except 5100, times Part I, Line C) 612,522.46 6. Facilities Rents and Leases (portion relating to general administrative offices only) (Function 8700, resources 0000-1999, objects 1000-5999 except 5100, times Part I, Line C) (172.34) 7. Adjustment for Employment Separation Costs a. Plus: Normal Separation Costs (Part II, Line A) 0.00
b. Less: Abnormal or Mass Separation Costs (Part II, Line B) 0.00 8. Total Indirect Costs (Lines A1 through A7a, minus Line A7b) 7,431,834.94 9. Carry-Forward Adjustment (Part IV, Line F) 974,117.44 10. Total Adjusted Indirect Costs (Line A8 plus Line A9) 8,405,952.38
B. Base Costs
1. Instruction (Functions 1000-1999, objects 1000-5999 except 5100) 68,142,430.58
2. Instruction-Related Services (Functions 2000-2999, objects 1000-5999 except 5100) 17,167,126.58
3. Pupil Services (Functions 3000-3999, objects 1000-5999 except 5100) 10,141,546.35
4. Ancillary Services (Functions 4000-4999, objects 1000-5999 except 5100) 770,959.81
5. Community Services (Functions 5000-5999, objects 1000-5999 except 5100) 252,049.93
6. Enterprise (Function 6000, objects 1000-5999 except 5100) 187,192.44 7. Board and Superintendent (Functions 7100-7180, objects 1000-5999, minus Part III, Line A4) 671,899.28 8. External Financial Audit - Single Audit and Other (Functions 7190-7191, objects 5000-5999, minus Part III, Line A3) 0.00
9. Other General Administration (portion charged to restricted resources or specific goals only)
(Functions 7200-7600, resources 2000-9999, objects 1000-5999; Functions 7200-7600, resources 0000-1999, all goals except 0000 and 9000, objects 1000-5999) 168,970.59
10. Centralized Data Processing (portion charged to restricted resources or specific goals only)
(Function 7700, resources 2000-9999, objects 1000-5999; Function 7700, resources 0000-1999, all goals except 0000 and 9000, objects 1000-5999) 0.00 11. Plant Maintenance and Operations (all except portion relating to general administrative offices)
(Functions 8100-8400, objects 1000-5999 except 5100, minus Part III, Line A5) 10,647,081.66
12. Facilities Rents and Leases (all except portion relating to general administrative offices)
(Function 8700, objects 1000-5999 except 5100, minus Part III, Line A6) (2,995.66) 13. Adjustment for Employment Separation Costs a. Less: Normal Separation Costs (Part II, Line A) 0.00 b. Plus: Abnormal or Mass Separation Costs (Part II, Line B) 0.00 14. Adult Education (Fund 11, functions 1000-6999, 8100-8400, and 8700, objects 1000-5999 except 5100) 863,919.94
15. Child Development (Fund 12, functions 1000-6999, 8100-8400, and 8700, objects 1000-5999 except 5100) 2,028,657.95
16. Cafeteria (Funds 13 and 61, functions 1000-6999, 8100-8400, and 8700, objects 1000-5999 except 5100) 4,589,719.95
17. Foundation (Funds 19 and 57, functions 1000-6999, 8100-8400, and 8700, objects 1000-5999 except 5100) 0.00
18. Total Base Costs (Lines B1 through B12 and Lines B13b through B17, minus Line B13a) 115,628,559.40
C. Straight Indirect Cost Percentage Before Carry-Forward Adjustment (For information only - not for use when claiming/recovering indirect costs) (Line A8 divided by Line B18) 6.43%
D. Preliminary Proposed Indirect Cost Rate (For final approved fixed-with-carry-forward rate for use in 2018-19 see www.cde.ca.gov/fg/ac/ic)
(Line A10 divided by Line B18) 7.27%
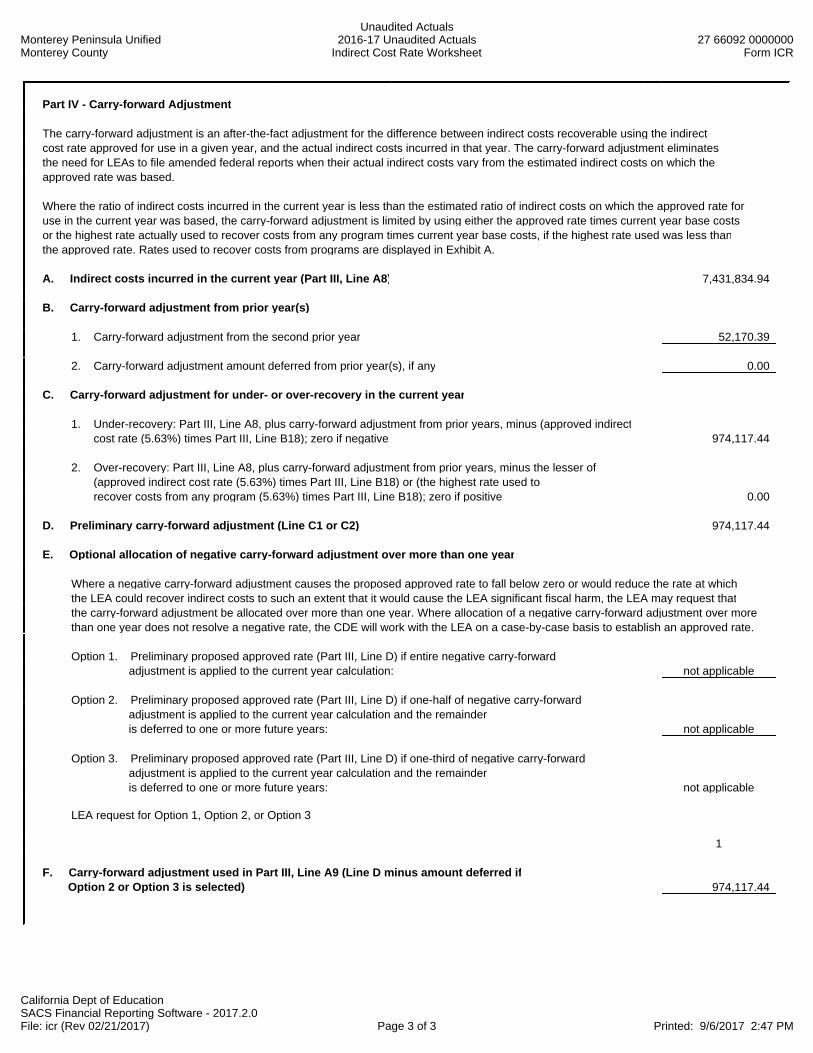
Monterey Peninsula UnifiedMonterey County
Unaudited Actuals2016-17 Unaudited Actuals
Indirect Cost Rate Worksheet27 66092 0000000
Form ICR
California Dept of EducationSACS Financial Reporting Software - 2017.2.0File: icr (Rev 02/21/2017) Page 3 of 3 Printed: 9/6/2017 2:47 PM
Part IV - Carry-forward Adjustment
The carry-forward adjustment is an after-the-fact adjustment for the difference between indirect costs recoverable using the indirect cost rate approved for use in a given year, and the actual indirect costs incurred in that year. The carry-forward adjustment eliminates the need for LEAs to file amended federal reports when their actual indirect costs vary from the estimated indirect costs on which the approved rate was based.
Where the ratio of indirect costs incurred in the current year is less than the estimated ratio of indirect costs on which the approved rate for use in the current year was based, the carry-forward adjustment is limited by using either the approved rate times current year base costs, or the highest rate actually used to recover costs from any program times current year base costs, if the highest rate used was less than the approved rate. Rates used to recover costs from programs are displayed in Exhibit A.
A. Indirect costs incurred in the current year (Part III, Line A8) 7,431,834.94
B. Carry-forward adjustment from prior year(s)
1. Carry-forward adjustment from the second prior year 52,170.39
2. Carry-forward adjustment amount deferred from prior year(s), if any 0.00
C. Carry-forward adjustment for under- or over-recovery in the current year
1. Under-recovery: Part III, Line A8, plus carry-forward adjustment from prior years, minus (approved indirect cost rate (5.63%) times Part III, Line B18); zero if negative 974,117.44
2. Over-recovery: Part III, Line A8, plus carry-forward adjustment from prior years, minus the lesser of (approved indirect cost rate (5.63%) times Part III, Line B18) or (the highest rate used to recover costs from any program (5.63%) times Part III, Line B18); zero if positive 0.00
D. Preliminary carry-forward adjustment (Line C1 or C2) 974,117.44
E. Optional allocation of negative carry-forward adjustment over more than one year
Where a negative carry-forward adjustment causes the proposed approved rate to fall below zero or would reduce the rate at which the LEA could recover indirect costs to such an extent that it would cause the LEA significant fiscal harm, the LEA may request that the carry-forward adjustment be allocated over more than one year. Where allocation of a negative carry-forward adjustment over more than one year does not resolve a negative rate, the CDE will work with the LEA on a case-by-case basis to establish an approved rate.
Option 1. Preliminary proposed approved rate (Part III, Line D) if entire negative carry-forward adjustment is applied to the current year calculation: not applicable
Option 2. Preliminary proposed approved rate (Part III, Line D) if one-half of negative carry-forward adjustment is applied to the current year calculation and the remainder is deferred to one or more future years: not applicable
Option 3. Preliminary proposed approved rate (Part III, Line D) if one-third of negative carry-forward adjustment is applied to the current year calculation and the remainder is deferred to one or more future years: not applicable
LEA request for Option 1, Option 2, or Option 3
1
F. Carry-forward adjustment used in Part III, Line A9 (Line D minus amount deferred if Option 2 or Option 3 is selected) 974,117.44

Monterey Peninsula UnifiedMonterey County
Unaudited Actuals2016-17 Unaudited Actuals
Exhibit A: Indirect Cost Rates Charged to Programs27 66092 0000000
Form ICR
California Dept of EducationSACS Financial Reporting Software - 2017.2.0File: icr (Rev 03/16/2012) Page 1 of 1 Printed: 9/6/2017 2:47 PM
Approved indirect cost rate: 5.63%Highest rate used in any program: 5.63%
Fund Resource
Eligible Expenditures(Objects 1000-5999
except Object 5100)Indirect Costs Charged
(Objects 7310 and 7350)RateUsed
01 3010 1,852,826.28 104,328.07 5.63%01 3310 1,758,464.45 99,001.55 5.63%01 3385 14,823.44 834.56 5.63%01 3550 83,935.24 4,196.76 5.00%01 4035 395,129.07 22,181.80 5.61%01 4201 20,403.83 1,148.73 5.63%01 4203 333,305.68 6,622.43 1.99%01 5640 232,670.28 13,099.34 5.63%01 6010 823,676.95 40,785.61 4.95%01 6264 425,847.47 23,851.55 5.60%01 6387 165,705.33 9,329.21 5.63%01 6512 424,125.94 23,878.29 5.63%01 6520 124,121.15 6,974.85 5.62%01 7220 141,553.36 7,969.45 5.63%01 7338 72,874.77 4,102.84 5.63%01 9010 1,455,924.53 31,253.64 2.15%09 6264 8,155.36 459.15 5.63%11 6391 638,986.32 35,974.92 5.63%11 9010 9,480.62 533.75 5.63%12 5210 430,088.55 24,210.92 5.63%12 6105 1,555,554.40 87,577.71 5.63%13 5310 4,404,995.37 216,725.77 4.92%13 5320 69,408.33 3,414.88 4.92%13 5340 5,365.50 263.98 4.92%13 5370 92,223.42 4,537.33 4.92%13 5454 12,472.59 613.65 4.92%
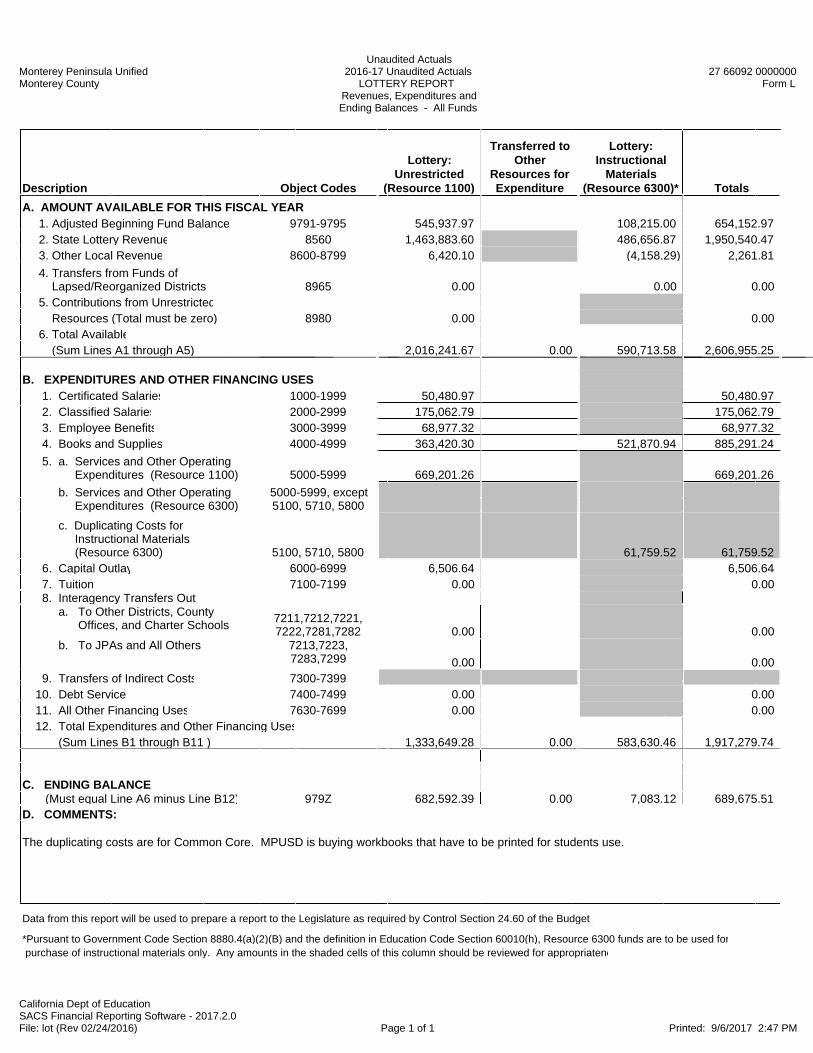
Monterey Peninsula UnifiedMonterey County
Unaudited Actuals2016-17 Unaudited Actuals
LOTTERY REPORTRevenues, Expenditures andEnding Balances - All Funds
27 66092 0000000Form L
California Dept of EducationSACS Financial Reporting Software - 2017.2.0File: lot (Rev 02/24/2016) Page 1 of 1 Printed: 9/6/2017 2:47 PM
Description Object Codes
Lottery:Unrestricted
(Resource 1100)
Transferred toOther
Resources forExpenditure
Lottery:Instructional
Materials(Resource 6300)* Totals
A. AMOUNT AVAILABLE FOR THIS FISCAL YEAR 1. Adjusted Beginning Fund Balance 9791-9795 545,937.97 108,215.00 654,152.97 2. State Lottery Revenue 8560 1,463,883.60 486,656.87 1,950,540.47 3. Other Local Revenue 8600-8799 6,420.10 (4,158.29) 2,261.81
4. Transfers from Funds of Lapsed/Reorganized Districts 8965 0.00 0.00 0.00 5. Contributions from Unrestricted Resources (Total must be zero) 8980 0.00 0.00 6. Total Available (Sum Lines A1 through A5) 2,016,241.67 0.00 590,713.58 2,606,955.25
B. EXPENDITURES AND OTHER FINANCING USES 1. Certificated Salaries 1000-1999 50,480.97 50,480.97 2. Classified Salaries 2000-2999 175,062.79 175,062.79 3. Employee Benefits 3000-3999 68,977.32 68,977.32 4. Books and Supplies 4000-4999 363,420.30 521,870.94 885,291.24
5. a. Services and Other Operating Expenditures (Resource 1100) 5000-5999 669,201.26 669,201.26
b. Services and Other Operating Expenditures (Resource 6300)
5000-5999, except5100, 5710, 5800
c. Duplicating Costs for Instructional Materials (Resource 6300) 5100, 5710, 5800 61,759.52 61,759.52 6. Capital Outlay 6000-6999 6,506.64 6,506.64 7. Tuition 7100-7199 0.00 0.00 8. Interagency Transfers Out a. To Other Districts, County Offices, and Charter Schools
7211,7212,7221,7222,7281,7282 0.00 0.00
b. To JPAs and All Others 7213,7223,7283,7299 0.00 0.00
9. Transfers of Indirect Costs 7300-7399 10. Debt Service 7400-7499 0.00 0.00 11. All Other Financing Uses 7630-7699 0.00 0.00 12. Total Expenditures and Other Financing Uses (Sum Lines B1 through B11 ) 1,333,649.28 0.00 583,630.46 1,917,279.74
C. ENDING BALANCE (Must equal Line A6 minus Line B12) 979Z 682,592.39 0.00 7,083.12 689,675.51D. COMMENTS:
The duplicating costs are for Common Core. MPUSD is buying workbooks that have to be printed for students use.
Data from this report will be used to prepare a report to the Legislature as required by Control Section 24.60 of the Budget A
*Pursuant to Government Code Section 8880.4(a)(2)(B) and the definition in Education Code Section 60010(h), Resource 6300 funds are to be used for purchase of instructional materials only. Any amounts in the shaded cells of this column should be reviewed for appropriatene
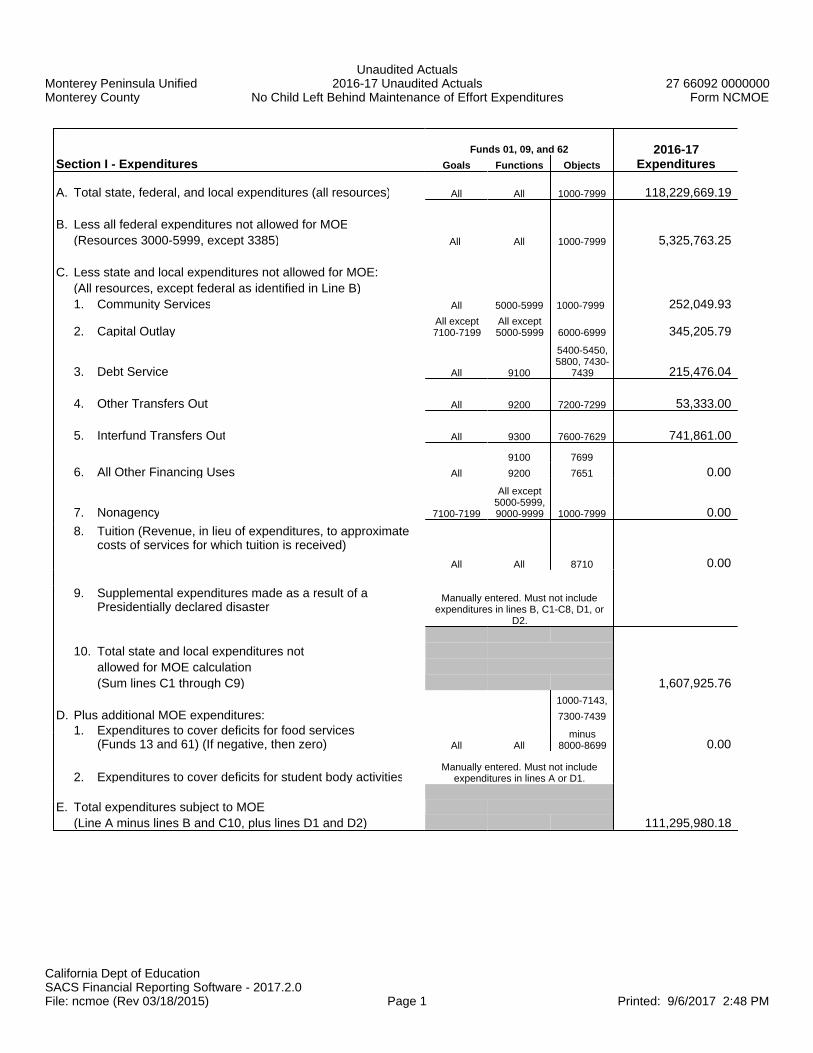
Monterey Peninsula UnifiedMonterey County
Unaudited Actuals2016-17 Unaudited Actuals
No Child Left Behind Maintenance of Effort Expenditures27 66092 0000000
Form NCMOE
California Dept of EducationSACS Financial Reporting Software - 2017.2.0File: ncmoe (Rev 03/18/2015) Page 1 Printed: 9/6/2017 2:48 PM
Funds 01, 09, and 62
Section I - Expenditures Goals Functions Objects
2016-17Expenditures
A. Total state, federal, and local expenditures (all resources) All All 1000-7999 118,229,669.19
B. Less all federal expenditures not allowed for MOE(Resources 3000-5999, except 3385) All All 1000-7999 5,325,763.25
C. Less state and local expenditures not allowed for MOE:(All resources, except federal as identified in Line B)1. Community Services All 5000-5999 1000-7999 252,049.93
2. Capital OutlayAll except7100-7199
All except5000-5999 6000-6999 345,205.79
3. Debt Service All 9100
5400-5450,5800, 7430-
7439 215,476.04
4. Other Transfers Out All 9200 7200-7299 53,333.00
5. Interfund Transfers Out All 9300 7600-7629 741,861.00
9100 7699
6. All Other Financing Uses All 9200 7651 0.00
7. Nonagency 7100-7199
All except5000-5999,9000-9999 1000-7999 0.00
8. Tuition (Revenue, in lieu of expenditures, to approximatecosts of services for which tuition is received)
All All 8710 0.00
9. Supplemental expenditures made as a result of aPresidentially declared disaster
Manually entered. Must not includeexpenditures in lines B, C1-C8, D1, or
D2.
10. Total state and local expenditures not allowed for MOE calculation(Sum lines C1 through C9) 1,607,925.76
1000-7143,
D. Plus additional MOE expenditures: 7300-7439
1. Expenditures to cover deficits for food services(Funds 13 and 61) (If negative, then zero) All All
minus8000-8699 0.00
2. Expenditures to cover deficits for student body activitiesManually entered. Must not include
expenditures in lines A or D1.
E. Total expenditures subject to MOE(Line A minus lines B and C10, plus lines D1 and D2) 111,295,980.18

Monterey Peninsula UnifiedMonterey County
Unaudited Actuals2016-17 Unaudited Actuals
No Child Left Behind Maintenance of Effort Expenditures27 66092 0000000
Form NCMOE
California Dept of EducationSACS Financial Reporting Software - 2017.2.0File: ncmoe (Rev 03/18/2015) Page 2 Printed: 9/6/2017 2:48 PM
Section II - Expenditures Per ADA
2016-17Annual ADA/
Exps. Per ADA
A. Average Daily Attendance(Form A, Annual ADA column, sum of lines A6 and C9)
9,623.21
B. Expenditures per ADA (Line I.E divided by Line II.A) 11,565.37
Section III - MOE Calculation (For data collection only. Finaldetermination will be done by CDE) Total Per ADA
A. Base expenditures (Preloaded expenditures from prior year official CDEMOE calculation). (Note: If the prior year MOE was not met, CDE hasadjusted the prior year base to 90 percent of the preceding prior yearamount rather than the actual prior year expenditure amount.)
105,188,219.67 10,978.461. Adjustment to base expenditure and expenditure per ADA amounts for
LEAs failing prior year MOE calculation (From Section IV) 0.00 0.00
2. Total adjusted base expenditure amounts (Line A plus Line A.1) 105,188,219.67 10,978.46
B. Required effort (Line A.2 times 90%) 94,669,397.70 9,880.61
C. Current year expenditures (Line I.E and Line II.B) 111,295,980.18 11,565.37
D. MOE deficiency amount, if any (Line B minus Line C)(If negative, then zero) 0.00 0.00
E. MOE determination(If one or both of the amounts in line D are zero, the MOE requirement MOE Metis met; if both amounts are positive, the MOE requirement is not met. Ifeither column in Line A.2 or Line C equals zero, the MOE calculation isincomplete.)
F. MOE deficiency percentage, if MOE not met; otherwise, zero(Line D divided by Line B)(Funding under NCLB covered programs in FY 2018-19 maybe reduced by the lower of the two percentages) 0.00% 0.00%

Monterey Peninsula UnifiedMonterey County
Unaudited Actuals2016-17 Unaudited Actuals
No Child Left Behind Maintenance of Effort Expenditures27 66092 0000000
Form NCMOE
California Dept of EducationSACS Financial Reporting Software - 2017.2.0File: ncmoe (Rev 03/18/2015) Page 3 Printed: 9/6/2017 2:48 PM
SECTION IV - Detail of Adjustments to Base Expenditures (used in Section III, Line A.1)
Description of AdjustmentsTotal
ExpendituresExpenditures
Per ADA
Total adjustments to base expenditures 0.00 0.00

Monterey Peninsula UnifiedMonterey County
Unaudited Actuals2016-17
General Fund and Charter Schools FundsProgram Cost Report
27 66092 0000000Form PCR
California Dept of EducationSACS Financial Reporting Software - 2017.2.0File: pcr (Rev 05/05/2016) Page 1 Printed: 9/6/2017 2:48 PM
------------------------- Direct Costs ------------------------- Central Admin Total Costs byDirect Charged Allocated Subtotal Costs Other Costs Program(Schedule DCC) (Schedule AC) (col. 1 + 2) (col. 3 x Sch. CAC line E) (Schedule OC) (col. 3 + 4 + 5)
Goal Program/Activity Column 1 Column 2 Column 3 Column 4 Column 5 Column 6 Instructional
Goals0001 Pre-Kindergarten 122,789.49 20,985.97 143,775.46 9,534.14 153,309.601110 Regular Education, K–12 69,268,603.91 9,661,144.64 78,929,748.55 5,234,046.80 84,163,795.353100 Alternative Schools 0.00 0.00 0.00 0.00 0.003200 Continuation Schools 1,051,567.12 167,887.77 1,219,454.89 80,865.38 1,300,320.273300 Independent Study Centers 928,868.21 83,943.88 1,012,812.09 67,162.33 1,079,974.423400 Opportunity Schools 0.00 0.00 0.00 0.00 0.003550 Community Day Schools 388,224.79 41,971.94 430,196.73 28,527.52 458,724.253700 Specialized Secondary Programs 0.00 0.00 0.00 0.00 0.003800 Career Technical Education 166,264.33 0.00 166,264.33 11,025.44 177,289.774110 Regular Education, Adult 0.00 0.00 0.00 0.00 0.004610 Adult Independent Study Centers 0.00 0.00 0.00 0.00 0.004620 Adult Correctional Education 0.00 0.00 0.00 0.00 0.004630 Adult Career Technical Education 0.00 0.00 0.00 0.00 0.004760 Bilingual 0.00 0.00 0.00 0.00 0.004850 Migrant Education 0.00 0.00 0.00 0.00 0.00
5000-5999 Special Education 20,889,659.45 2,513,188.28 23,402,847.73 1,551,906.63 24,954,754.366000 Regional Occupational Ctr/Prg (ROC/P) 2,021,454.28 293,803.60 2,315,257.88 153,531.06 2,468,788.94
Other Goals7110 Nonagency - Educational 0.00 0.00 0.00 0.00 0.007150 Nonagency - Other 17,014.05 0.00 17,014.05 1,128.25 18,142.308100 Community Services 0.00 0.00 0.00 0.00 0.008500 Child Care and Development Services 252,049.93 0.00 252,049.93 16,714.12 268,764.05
Other Costs ---- Food Services 8,064.13 8,064.13---- Enterprise 187,192.44 187,192.44---- Facilities Acquisition & Construction 31,367.59 31,367.59---- Other Outgo 2,680,219.81 2,680,219.81
OtherFunds
----
Adult Education, Child Development,Cafeteria, Foundation ([Column 3 +CAC, line C5] times CAC, line E) 146,901.80 146,901.80 505,913.03 652,814.83
----
Indirect Cost Transfers to Other Funds(Net of Funds 01, 09, 62, Function 7210,Object 7350) (373,852.91) (373,852.91)
----Total General Fund and CharterSchools Funds Expenditures 95,106,495.56 12,929,827.88 108,036,323.44 7,286,501.79 2,906,843.97 118,229,669.20

Monterey Peninsula UnifiedMonterey County
Unaudited Actuals2016-17
General Fund and Charter Schools FundsProgram Cost Report
Schedule of Direct Charged Costs (DCC)
27 66092 0000000Form PCR
California Dept of EducationSACS Financial Reporting Software - 2017.2.0File: pcr (Rev 05/05/2016) Page 1 Printed: 9/6/2017 2:48 PM
Instruction
InstructionalSupervision andAdministration
Library, Media,Technology and
Other InstructionalResources
SchoolAdministration
Pupil SupportServices Pupil Transportation Ancillary Services
CommunityServices
GeneralAdministration
Plant Maintenanceand Operations
Facilities Rents andLeases
Goal Type of Program(Functions 1000-
1999)(Functions 2100-
2200)(Functions 2420-
2495) (Function 2700)(Functions 3110-3160 and 3900) (Function 3600)
(Functions 4000-4999)
(Functions 5000-5999)
(Functions 7000-7999, except
7210)*(Functions 8100-
8400) (Function 8700) TotalInstructional
Goals
0001 Pre-Kindergarten 83,801.36 61.24 23,729.23 15,197.66 0.00 0.00 0.00 0.00 0.00 122,789.49
1110 Regular Education, K–12 47,913,591.38 2,413,228.36 4,319,221.65 8,134,467.03 5,450,767.66 49,631.37 753,972.69 131,701.75 102,022.02 69,268,603.91
3100 Alternative Schools 0.00 0.00 0.00 0.00 0.00 0.00 0.00 0.00 0.00 0.00
3200 Continuation Schools 754,095.21 147.58 3,213.40 140,632.49 145,671.32 0.00 7,787.12 20.00 0.00 1,051,567.12
3300 Independent Study Centers 859,503.16 0.00 0.00 69,365.05 0.00 0.00 0.00 0.00 0.00 928,868.21
3400 Opportunity Schools 0.00 0.00 0.00 0.00 0.00 0.00 0.00 0.00 0.00 0.00
3550 Community Day Schools 247,626.77 0.00 57,443.36 83,028.58 106.08 20.00 0.00 0.00 0.00 388,224.79
3700Specialized SecondaryPrograms 0.00 0.00 0.00 0.00 0.00 0.00 0.00 0.00 0.00 0.00
3800 Career Technical Education 148,659.56 17,604.77 0.00 0.00 0.00 0.00 0.00 0.00 0.00 166,264.33
4110 Regular Education, Adult 0.00 0.00 0.00 0.00 0.00 0.00 0.00 0.00 0.00 0.00
4610Adult Independent StudyCenters 0.00 0.00 0.00 0.00 0.00 0.00 0.00 0.00 0.00 0.00
4620 Adult Correctional Education 0.00 0.00 0.00 0.00 0.00 0.00 0.00 0.00 0.00 0.00
4630Adult Career TechnicalEducation 0.00 0.00 0.00 0.00 0.00 0.00 0.00 0.00 0.00 0.00
4760 Bilingual 0.00 0.00 0.00 0.00 0.00 0.00 0.00 0.00 0.00 0.00
4850 Migrant Education 0.00 0.00 0.00 0.00 0.00 0.00 0.00 0.00 0.00 0.00
5000-5999 Special Education 16,410,606.96 13,880.83 11,029.64 1,597,876.29 1,565,422.81 1,290,500.76 0.00 342.16 0.00 20,889,659.45
6000 ROC/P 1,730,590.38 3,717.31 339.42 277,607.17 0.00 0.00 9,200.00 0.00 0.00 2,021,454.28
Other Goals
7110 Nonagency - Educational 0.00 0.00 0.00 0.00 0.00 0.00 0.00 0.00 0.00 0.00 0.00 0.00
7150 Nonagency - Other 0.00 17,014.05 0.00 0.00 0.00 0.00 0.00 0.00 0.00 0.00 17,014.05
8100 Community Services 0.00 0.00 0.00 0.00 0.00 0.00 0.00 0.00 0.00 0.00
8500Child Care and DevelopmentServices 0.00 0.00 0.00 0.00 0.00 0.00 252,049.93 0.00 0.00 0.00 252,049.93
Total Direct Charged Costs 68,148,474.78 2,465,654.14 4,414,976.70 10,318,174.27 7,161,967.87 1,340,152.13 770,959.81 252,049.93 0.00 132,063.91 102,022.02 95,106,495.56* Functions 7100-7199 for goals 8100 and 8500

Monterey Peninsula UnifiedMonterey County
Unaudited Actuals2016-17
General Fund and Charter Schools FundsProgram Cost Report
Schedule of Allocated Support Costs (AC)
27 66092 0000000Form PCR
California Dept of EducationSACS Financial Reporting Software - 2017.2.0File: pcr (Rev 05/05/2016) Page 1 Printed: 9/6/2017 2:48 PM
Allocated Support Costs (Based on factors input on Form PCRAF)
Goal Type of Program Full-Time Equivalents Classroom Units Pupils Transported Total Instructional Goals
0001 Pre-Kindergarten 0.00 20,985.97 0.00 20,985.971110 Regular Education, K–12 0.00 8,352,156.36 1,308,988.28 9,661,144.643100 Alternative Schools 0.00 0.00 0.00 0.003200 Continuation Schools 0.00 167,887.77 0.00 167,887.773300 Independent Study Centers 0.00 83,943.88 0.00 83,943.883400 Opportunity Schools 0.00 0.00 0.00 0.003550 Community Day Schools 0.00 41,971.94 0.00 41,971.943700 Specialized Secondary Programs 0.00 0.00 0.00 0.003800 Career Technical Education 0.00 0.00 0.00 0.004110 Regular Education, Adult 0.00 0.00 0.00 0.004610 Adult Independent Study Centers 0.00 0.00 0.00 0.004620 Adult Correctional Education 0.00 0.00 0.00 0.004630 Adult Career Technical Education 0.00 0.00 0.00 0.004760 Bilingual 0.00 0.00 0.00 0.004850 Migrant Education 0.00 0.00 0.00 0.00
5000-5999 Special Education (allocated to 5001) 0.00 2,077,611.15 435,577.13 2,513,188.286000 ROC/P 0.00 293,803.60 0.00 293,803.60
Other Goals7110 Nonagency - Educational 0.00 0.00 0.00 0.007150 Nonagency - Other 0.00 0.00 0.00 0.008100 Community Services 0.00 0.00 0.00 0.008500 Child Care and Development Svcs 0.00 0.00 0.00 0.00
Other Funds- - Adult Education (Fund 11) 0.00 0.00- - Child Development (Fund 12) 0.00 146,901.80 0.00 146,901.80- - Cafeteria (Funds 13 and 61) 0.00 0.00
Total Allocated Support Costs 0.00 11,185,262.47 1,744,565.41 12,929,827.88

Monterey Peninsula UnifiedMonterey County
Unaudited Actuals2016-17
Program Cost ReportSchedule of Central Administration Costs (CAC)
27 66092 0000000Form PCR
California Dept of EducationSACS Financial Reporting Software - 2017.2.0File: pcr (Rev 05/24/2011) Page 1 Printed: 9/6/2017 2:48 PM
A. Central Administration Costs in General Fund and Charter Schools Funds
1Board and Superintendent (Funds 01, 09, and 62, Functions 7100-7180, Goals 0000-6999 and9000, Objects 1000-7999) 671,899.28
2External Financial Audits (Funds 01, 09, and 62, Functions 7190-7191, Goals 0000-6999 and9000, Objects 1000-7999) 82,850.00
3Other General Administration (Funds 01, 09, and 62, Functions 7200-7600 except 7210, Goal0000, Objects 1000-7999) 5,680,980.45
4Centralized Data Processing (Funds 01, 09, and 62, Function 7700, Goal 0000, Objects 1000-7999) 1,224,624.96
5 Total Central Administration Costs in General Fund and Charter Schools Funds 7,660,354.69
B. Direct Charged and Allocated Costs in General Fund and Charter Schools Funds1 Total Direct Charged Costs (from Form PCR, Column 1, Total) 95,106,495.56
2 Total Allocated Costs (from Form PCR, Column 2, Total) 12,929,827.88
3 Total Direct Charged and Allocated Costs in General Fund and Charter Schools Funds 108,036,323.44
C. Direct Charged Costs in Other Funds1 Adult Education (Fund 11, Objects 1000-5999, except 5100) 863,919.94
2 Child Development (Fund 12, Objects 1000-5999, except 5100) 2,028,657.95
3 Cafeteria (Funds 13 & 61, Objects 1000-5999, except 5100) 4,589,719.95
4 Foundation (Funds 19 & 57, Objects 1000-5999, except 5100) 0.00
5 Total Direct Charged Costs in Other Funds 7,482,297.84
D. Total Direct Charged and Allocated Costs (B3 + C5) 115,518,621.28
E. Ratio of Central Administration Costs to Direct Charged and Allocated Costs (A5/D) 6.63%

Monterey Peninsula UnifiedMonterey County
Unaudited Actuals2016-17
General Fund and Charter Schools FundsProgram Cost Report
Schedule of Other Costs (OC)
27 66092 0000000Form PCR
California Dept of EducationSACS Financial Reporting Software - 2017.2.0File: pcr (Rev 05/24/2011) Page 1 Printed: 9/6/2017 2:48 PM
Type of Activity
Food Services
(Function 3700)
Enterprise
(Function 6000)
Facilities Acquisition &Construction
(Function 8500)
Other Outgo
(Functions 9000-9999) Total
Food Services(Objects 1000-5999, 6400, and 6500) 8,064.13 8,064.13
Enterprise(Objects 1000-5999, 6400, and 6500) 187,192.44 187,192.44
Facilities Acquisition & Construction(Objects 1000-6500) 31,367.59 31,367.59
Other Outgo(Objects 1000-7999) 2,680,219.81 2,680,219.81
Total Other Costs 8,064.13 187,192.44 31,367.59 2,680,219.81 2,906,843.97

Monterey Peninsula UnifiedMonterey County
Unaudited Actuals2016-17
General Fund and Charter Schools FundsProgram Cost Report
Schedule of Allocation Factors (AF) for Support Costs
27 66092 0000000Form PCRAF
California Dept of EducationSACS Financial Reporting Software - 2017.2.0File: pcraf (Rev 05/05/2016) Page 1 of 1 Printed: 9/6/2017 2:48 PM
- - - - - - - - - - - - - - - - - - - Teacher Full-Time Equivalents - - - - - - - - - - - - - - - - - - - - - - - - - - - - - Classroom Units - - - - - - - - Pupils Transported
Instructional Supervisionand Administration
Library, Media,Technology and OtherInstructional Resources School Administration Pupil Support Services
Plant Maintenance andOperations
Facilities Rents andLeases Pupil Transportation
(Functions 2100-2200) (Functions 2420-2495) (Function 2700) (Functions 3100-3199 &3900)
(Functions 8100-8400) (Function 8700) (Function 3600)
A. Amount of Undistributed Expenditures, Funds 01, 09, and 62, Goals 0000 and 9000 (will be allocated based on factors input) 0.00 0.00 0.00 0.00 11,290,452.49 (105,190.02) 1,744,565.41B. Enter Allocation Factor(s) by Goal: FTE Factor(s) FTE Factor(s) FTE Factor(s) FTE Factor(s) CU Factor(s) CU Factor(s) PT Factor(s) (Note: Allocation factors are only needed for a column if there are undistributed expenditures in line A.)
Instructional Goals Description
0001 Pre-Kindergarten 0.00 0.00 0.00 0.00 1.00 0.00 0.00
1110 Regular Education, K–12 0.00 0.00 0.00 0.00 403.00 38.00 1,160.00
3100 Alternative Schools 0.00 0.00 0.00 0.00 0.00 0.00 0.00
3200 Continuation Schools 0.00 0.00 0.00 0.00 8.00 0.00 0.00
3300 Independent Study Centers 0.00 0.00 0.00 0.00 4.00 0.00 0.00
3400 Opportunity Schools 0.00 0.00 0.00 0.00 0.00 0.00 0.00
3550 Community Day Schools 0.00 0.00 0.00 0.00 2.00 0.00 0.00
3700 Specialized Secondary Programs 0.00 0.00 0.00 0.00 0.00 0.00 0.00
3800 Career Technical Education 0.00 0.00 0.00 0.00 0.00 0.00 0.00
4110 Regular Education, Adult 0.00 0.00 0.00 0.00 0.00 0.00 0.00
4610 Adult Independent Study Centers 0.00 0.00 0.00 0.00 0.00 0.00 0.00
4620 Adult Correctional Education 0.00 0.00 0.00 0.00 0.00 0.00 0.00
4630 Adult Career Technical Education 0.00 0.00 0.00 0.00 0.00 0.00 0.00
4760 Bilingual 0.00 0.00 0.00 0.00 0.00 0.00 0.00
4850 Migrant Education 0.00 0.00 0.00 0.00 0.00 0.00 0.00
5000-5999 Special Education (allocated to 5001) 0.00 0.00 0.00 0.00 99.00 0.00 386.00
6000 ROC/P 0.00 0.00 0.00 0.00 14.00 0.00 0.00
Other Goals Description
7110 Nonagency - Educational 0.00 0.00 0.00 0.00 0.00 0.00 0.00
7150 Nonagency - Other 0.00 0.00 0.00 0.00 0.00 0.00 0.00
8100 Community Services 0.00 0.00 0.00 0.00 0.00 0.00 0.00
8500 Child Care and Development Services 0.00 0.00 0.00 0.00 0.00 0.00 0.00
Other Funds Description
- - Adult Education (Fund 11) 0.00
- - Child Development (Fund 12) 0.00 0.00 0.00 0.00 7.00 0.00 0.00
- - Cafeteria (Funds 13 & 61) 0.00 0.00
C. Total Allocation Factors 0.00 0.00 0.00 0.00 538.00 38.00 1,546.00

Monterey Peninsula UnifiedMonterey County
Unaudited ActualsSpecial Education Maintenance of Effort
2016-17 Actual vs. 2015-16 Actual Comparison2016-17 Expenditures by LEA (LE-CY)
27 66092 0000000Report SEMA
California Dept of EducationSACS Financial Reporting Software - 2017.2.0File: sema (Rev 03/03/2015) Page 1 of 2 Printed: 9/6/2017 3:20 PM
SpecialEducation,Unspecified
RegionalizedServices
RegionalizedProgram
SpecialistSpecial
Education, Infants
SpecialEducation,PreschoolStudents
Spec. Education,Ages 5-22
Severely Disabled
Spec. Education,Ages 5-22
NonseverelyDisabled
Object Code Description (Goal 5001) (Goal 5050) (Goal 5060) (Goal 5710) (Goal 5730) (Goal 5750) (Goal 5770) Adjustments* Total
UNDUPLICATED PUPIL COUNT 1,217
TOTAL EXPENDITURES (Funds 01, 09, & 62; resources 0000-9999)
1000-1999 Certificated Salaries 361,343.47 0.00 0.00 188,010.84 260,471.85 2,450,368.23 3,911,107.55 7,171,301.94
2000-2999 Classified Salaries 1,052,549.53 0.00 0.00 88,380.90 92,344.93 3,523,126.80 1,820,871.72 6,577,273.88
3000-3999 Employee Benefits 603,013.41 0.00 0.00 103,312.73 136,751.13 2,379,558.54 2,217,772.72 5,440,408.53
4000-4999 Books and Supplies 129,704.80 0.00 0.00 2,677.11 2,857.08 14,292.13 32,593.10 182,124.22
5000-5999 Services and Other Operating Expenditures 494,898.49 0.00 0.00 29,671.26 12,695.88 670,485.14 310,800.11 1,518,550.88
6000-6999 Capital Outlay 0.00 0.00 0.00 0.00 0.00 0.00 0.00 0.00
7130 State Special Schools 0.00 0.00 0.00 0.00 0.00 0.00 0.00 0.00
7430-7439 Debt Service 0.00 0.00 0.00 0.00 0.00 0.00 0.00 0.00
Total Direct Costs 2,641,509.70 0.00 0.00 412,052.84 505,120.87 9,037,830.84 8,293,145.20 0.00 20,889,659.45
7310 Transfers of Indirect Costs 13,099.34 0.00 0.00 834.56 0.00 23,878.29 105,976.40 143,788.59
7350 Transfers of Indirect Costs - Interfund 0.00 0.00 0.00 0.00 0.00 0.00 0.00 0.00
PCRA Program Cost Report Allocations 2,513,188.30 2,513,188.30
Total Indirect Costs and PCR Allocations 2,526,287.64 0.00 0.00 834.56 0.00 23,878.29 105,976.40 0.00 2,656,976.89
TOTAL COSTS 5,167,797.34 0.00 0.00 412,887.40 505,120.87 9,061,709.13 8,399,121.60 0.00 23,546,636.34FEDERAL EXPENDITURES (Funds 01, 09, and 62; resources 3000-5999, except 3385)
1000-1999 Certificated Salaries 0.00 0.00 0.00 0.00 0.00 79,754.61 20,721.35 100,475.962000-2999 Classified Salaries 0.00 0.00 0.00 0.00 0.00 (1,479.32) 1,017,044.13 1,015,564.813000-3999 Employee Benefits 0.00 0.00 0.00 0.00 0.00 26,108.48 434,613.84 460,722.324000-4999 Books and Supplies 0.00 0.00 0.00 0.00 0.00 0.00 0.00 0.005000-5999 Services and Other Operating Expenditures 232,670.28 0.00 0.00 0.00 0.00 142,961.55 219,470.90 595,102.736000-6999 Capital Outlay 0.00 0.00 0.00 0.00 0.00 0.00 0.00 0.00
7130 State Special Schools 0.00 0.00 0.00 0.00 0.00 0.00 0.00 0.007430-7439 Debt Service 0.00 0.00 0.00 0.00 0.00 0.00 0.00 0.00
Total Direct Costs 232,670.28 0.00 0.00 0.00 0.00 247,345.32 1,691,850.22 0.00 2,171,865.82
7310 Transfers of Indirect Costs 13,099.34 0.00 0.00 0.00 0.00 0.00 99,001.55 112,100.897350 Transfers of Indirect Costs - Interfund 0.00 0.00 0.00 0.00 0.00 0.00 0.00 0.00
Total Indirect Costs 13,099.34 0.00 0.00 0.00 0.00 0.00 99,001.55 0.00 112,100.89TOTAL BEFORE OBJECT 8980 245,769.62 0.00 0.00 0.00 0.00 247,345.32 1,790,851.77 0.00 2,283,966.71
8980 Less: Contributions from Unrestricted Revenues to FederalResources (Resources 3310-3400, except 3385, all goals;resources 3000-3178 & 3410-5810, goals 5000-5999)
0.00TOTAL COSTS 2,283,966.71
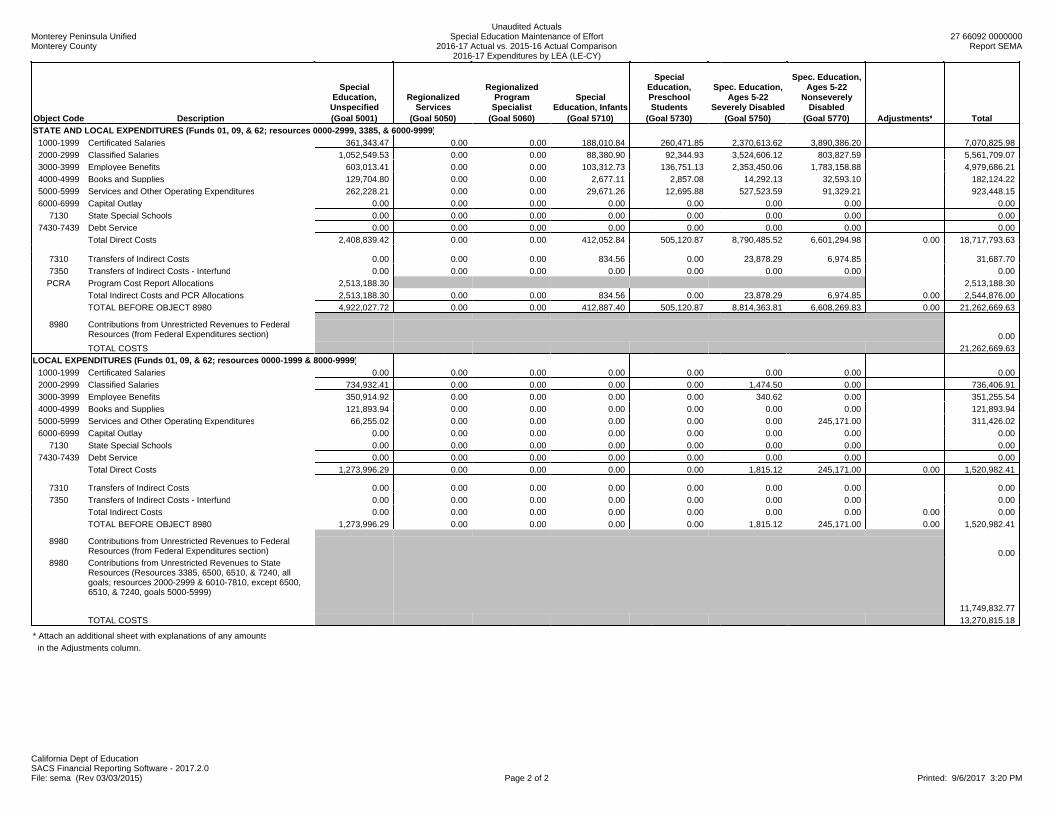
Monterey Peninsula UnifiedMonterey County
Unaudited ActualsSpecial Education Maintenance of Effort
2016-17 Actual vs. 2015-16 Actual Comparison2016-17 Expenditures by LEA (LE-CY)
27 66092 0000000Report SEMA
California Dept of EducationSACS Financial Reporting Software - 2017.2.0File: sema (Rev 03/03/2015) Page 2 of 2 Printed: 9/6/2017 3:20 PM
SpecialEducation,Unspecified
RegionalizedServices
RegionalizedProgram
SpecialistSpecial
Education, Infants
SpecialEducation,PreschoolStudents
Spec. Education,Ages 5-22
Severely Disabled
Spec. Education,Ages 5-22
NonseverelyDisabled
Object Code Description (Goal 5001) (Goal 5050) (Goal 5060) (Goal 5710) (Goal 5730) (Goal 5750) (Goal 5770) Adjustments* Total
STATE AND LOCAL EXPENDITURES (Funds 01, 09, & 62; resources 0000-2999, 3385, & 6000-9999)
1000-1999 Certificated Salaries 361,343.47 0.00 0.00 188,010.84 260,471.85 2,370,613.62 3,890,386.20 7,070,825.98
2000-2999 Classified Salaries 1,052,549.53 0.00 0.00 88,380.90 92,344.93 3,524,606.12 803,827.59 5,561,709.07
3000-3999 Employee Benefits 603,013.41 0.00 0.00 103,312.73 136,751.13 2,353,450.06 1,783,158.88 4,979,686.21
4000-4999 Books and Supplies 129,704.80 0.00 0.00 2,677.11 2,857.08 14,292.13 32,593.10 182,124.22
5000-5999 Services and Other Operating Expenditures 262,228.21 0.00 0.00 29,671.26 12,695.88 527,523.59 91,329.21 923,448.15
6000-6999 Capital Outlay 0.00 0.00 0.00 0.00 0.00 0.00 0.00 0.00
7130 State Special Schools 0.00 0.00 0.00 0.00 0.00 0.00 0.00 0.00
7430-7439 Debt Service 0.00 0.00 0.00 0.00 0.00 0.00 0.00 0.00
Total Direct Costs 2,408,839.42 0.00 0.00 412,052.84 505,120.87 8,790,485.52 6,601,294.98 0.00 18,717,793.63
7310 Transfers of Indirect Costs 0.00 0.00 0.00 834.56 0.00 23,878.29 6,974.85 31,687.70
7350 Transfers of Indirect Costs - Interfund 0.00 0.00 0.00 0.00 0.00 0.00 0.00 0.00
PCRA Program Cost Report Allocations 2,513,188.30 2,513,188.30
Total Indirect Costs and PCR Allocations 2,513,188.30 0.00 0.00 834.56 0.00 23,878.29 6,974.85 0.00 2,544,876.00
TOTAL BEFORE OBJECT 8980 4,922,027.72 0.00 0.00 412,887.40 505,120.87 8,814,363.81 6,608,269.83 0.00 21,262,669.63
8980 Contributions from Unrestricted Revenues to FederalResources (from Federal Expenditures section) 0.00
TOTAL COSTS 21,262,669.63LOCAL EXPENDITURES (Funds 01, 09, & 62; resources 0000-1999 & 8000-9999)
1000-1999 Certificated Salaries 0.00 0.00 0.00 0.00 0.00 0.00 0.00 0.00
2000-2999 Classified Salaries 734,932.41 0.00 0.00 0.00 0.00 1,474.50 0.00 736,406.91
3000-3999 Employee Benefits 350,914.92 0.00 0.00 0.00 0.00 340.62 0.00 351,255.54
4000-4999 Books and Supplies 121,893.94 0.00 0.00 0.00 0.00 0.00 0.00 121,893.94
5000-5999 Services and Other Operating Expenditures 66,255.02 0.00 0.00 0.00 0.00 0.00 245,171.00 311,426.02
6000-6999 Capital Outlay 0.00 0.00 0.00 0.00 0.00 0.00 0.00 0.00
7130 State Special Schools 0.00 0.00 0.00 0.00 0.00 0.00 0.00 0.00
7430-7439 Debt Service 0.00 0.00 0.00 0.00 0.00 0.00 0.00 0.00
Total Direct Costs 1,273,996.29 0.00 0.00 0.00 0.00 1,815.12 245,171.00 0.00 1,520,982.41
7310 Transfers of Indirect Costs 0.00 0.00 0.00 0.00 0.00 0.00 0.00 0.00
7350 Transfers of Indirect Costs - Interfund 0.00 0.00 0.00 0.00 0.00 0.00 0.00 0.00
Total Indirect Costs 0.00 0.00 0.00 0.00 0.00 0.00 0.00 0.00 0.00
TOTAL BEFORE OBJECT 8980 1,273,996.29 0.00 0.00 0.00 0.00 1,815.12 245,171.00 0.00 1,520,982.41
8980 Contributions from Unrestricted Revenues to FederalResources (from Federal Expenditures section) 0.00
8980 Contributions from Unrestricted Revenues to StateResources (Resources 3385, 6500, 6510, & 7240, allgoals; resources 2000-2999 & 6010-7810, except 6500,6510, & 7240, goals 5000-5999)
11,749,832.77
TOTAL COSTS 13,270,815.18
* Attach an additional sheet with explanations of any amounts
in the Adjustments column.

Monterey Peninsula UnifiedMonterey County
Unaudited ActualsSpecial Education Maintenance of Effort
2016-17 Actual vs. 2015-16 Actual Comparison2015-16 Expenditures by LEA (LE-PY)
27 66092 0000000Report SEMA
California Dept of EducationSACS Financial Reporting Software - 2017.2.0File: sema (Rev 04/14/2010) Page 1 of 1 Printed: 9/6/2017 3:21 PM
2015-16 Expenditures A. State and Local B. Local Only1. Enter Total Costs amounts from the 2015-16 Report SEMA, 2015-16 Expenditures by
LEA (LE-CY) worksheet, Total Column, for the State and Local Expenditures sectionand the Local Expenditures section 20,125,105.87 11,222,671.85
2. Enter audit adjustments of 2015-16 special education expenditures fromSACS2017ALL data, not included in Line 1 (explain below)(Funds 01, 09, and 62; resources 0000-2999 & 6000-9999; Object 9793) 0.00 0.00
3. Enter restatements of 2016-17 special education beginning fund balances fromSACS2017ALL data, not included in Line 1 (explain below)(Funds 01, 09, and 62; resources 0000-2999 & 6000-9999; Object 9795) 0.00 0.00
4. Enter any other adjustments, not included in Line 1 (explain below) 0.00 0.00
5. 2015-16 Expenditures, Adjusted for 2016-17 MOE Calculation(Sum lines 1 through 4) 20,125,105.87 11,222,671.85
C. Unduplicated Pupil Count1. Enter the unduplicated pupil count reported in 2015-16 Report SEMA,
2015-16 Expenditures by LEA (LE-CY) worksheet 1,190.00
2. Enter any adjustments not included in Line C1 (explain below)
3. 2015-16 Unduplicated Pupil Count, Adjusted for 2016-17 MOE Calculation(Line C1 plus Line C2) 1,190.00

Monterey Peninsula UnifiedMonterey County
Unaudited ActualsSpecial Education Maintenance of Effort
2016-17 Actual vs. Comparison Year's ActualLEA Maintenance of Effort Calculation (LMC-A)
27 66092 0000000Report SEMA
California Dept of EducationSACS Financial Reporting Software - 2017.2.0File: sema (Rev 05/24/2017) Page 1 of 4 Printed: 9/6/2017 3:21 PM
SELPA: (??)
This form is used to check maintenance of effort (MOE) for an LEA, whether the LEA is a member of a SELPA or is a single-LEA SELPA. If amember of a SELPA, submit this form together with the 2016-17 Expenditures by LEA (LE-CY) and the 2015-16 Expenditures by LEA (LE-PY) tothe SELPA AU. If a single-LEA SELPA, submit the forms to the CDE.
Per the federal Subsequent Years Rule, in order to determine the required level of effort, the LEA must look back to the last fiscal year in which theLEA maintained effort using the same method by which it is currently establishing the compliance standard. To meet the requirement of theSubsequent Years Rule, the LMC-A worksheet has been revised to make changes to sections 3.A.1, 3.A.2, 3.B.1, and 3.B.2. The revised sectionsallow the LEA to compare the 2016-17 expenditures to the most recent fiscal year the LEA met MOE using that method, which is the comparisonyear. To ensure the LEA is comparing 2016-17 expenditures to the appropriate comparison year, the LEA is required to complete the SubsequentYears Tracking (SYT) worksheet with their LMC-A worksheet. The SYT worksheet tracks the result for each of the four methods back to FY 2011-12, which is the baseline year for LEA MOE calculations established by the Office of Special Education Programs. The SYT worksheet is availableat: http://www.cde.ca.gov/sp/se/as/documents/subseqyrtrckwrksht.xls.
There are four methods that the LEA can use to demonstrate the compliance standard. They are (1) combined state and local expenditures; (2)combined state and local expenditures on a per capita basis; (3) local expenditures only; and (4) local expenditures only on a per capita basis.
The LEA is only required to pass one of the tests to meet the MOE requirement. However, the LEA is required to show results for all four methods.These results are necessary both for historical purposes and for the possibility that the LEA may want, or need, to switch methods in future years.
SECTION 1 Exempt Reduction Under 34 CFR Section 300.204
If your LEA determines that a reduction in expenditures occurred as a result of one or more of the following conditions, you maycalculate a reduction to the required MOE standard. Reductions may apply to combined state and local MOE standard, local onlyMOE standard, or both. If the LEA meets one of the conditions below, the LEA must complete and include the IDEA MOEExemption Worksheet available at: http://www.cde.ca.gov/sp/se/as/documents/leamoeexempwrksht.xls
1. Voluntary departure, by retirement or otherwise, or departure for just cause, of special education or related services personnel.
2. A decrease in the enrollment of children with disabilities.
3. The termination of the obligation of the agency to provide a program of special education to a particular child with a disability that is an exceptionally costly program, as determined by the SEA, because the child
a. Has left the jurisdiction of the agency; b. Has reached the age at which the obligation of the agency to provide free appropriate public education (FAPE) to the child has terminated; or c. No longer needs the program of special education.
4. The termination of costly expenditures for long-term purchases, such as the acquisition of equipment or the construction of school facilities.
5. The assumption of cost by the high cost fund operated by the SEA under 34 CFR Sec. 300.704(c).
Provide the condition number, if any, to be used in the calculation below: State and Local Local Only
Total exempt reductions 0.00 0.00
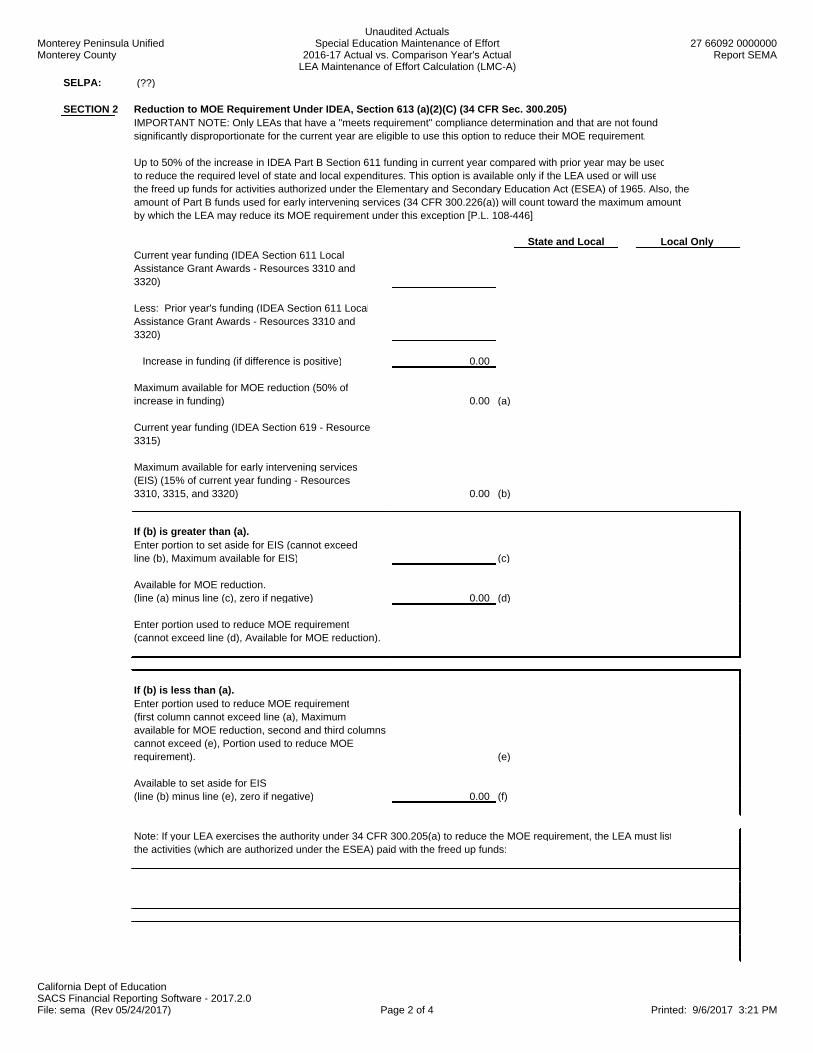
Monterey Peninsula UnifiedMonterey County
Unaudited ActualsSpecial Education Maintenance of Effort
2016-17 Actual vs. Comparison Year's ActualLEA Maintenance of Effort Calculation (LMC-A)
27 66092 0000000Report SEMA
California Dept of EducationSACS Financial Reporting Software - 2017.2.0File: sema (Rev 05/24/2017) Page 2 of 4 Printed: 9/6/2017 3:21 PM
SELPA: (??)
SECTION 2 Reduction to MOE Requirement Under IDEA, Section 613 (a)(2)(C) (34 CFR Sec. 300.205)IMPORTANT NOTE: Only LEAs that have a "meets requirement" compliance determination and that are not found significantly disproportionate for the current year are eligible to use this option to reduce their MOE requirement.
Up to 50% of the increase in IDEA Part B Section 611 funding in current year compared with prior year may be usedto reduce the required level of state and local expenditures. This option is available only if the LEA used or will usethe freed up funds for activities authorized under the Elementary and Secondary Education Act (ESEA) of 1965. Also, the amount of Part B funds used for early intervening services (34 CFR 300.226(a)) will count toward the maximum amount by which the LEA may reduce its MOE requirement under this exception [P.L. 108-446].
State and Local Local Only Current year funding (IDEA Section 611 Local Assistance Grant Awards - Resources 3310 and3320)
Less: Prior year's funding (IDEA Section 611 LocalAssistance Grant Awards - Resources 3310 and3320)
Increase in funding (if difference is positive) 0.00
Maximum available for MOE reduction (50% ofincrease in funding) 0.00 (a)
Current year funding (IDEA Section 619 - Resource 3315)
Maximum available for early intervening services(EIS) (15% of current year funding - Resources3310, 3315, and 3320) 0.00 (b)
If (b) is greater than (a).Enter portion to set aside for EIS (cannot exceedline (b), Maximum available for EIS) (c)
Available for MOE reduction.(line (a) minus line (c), zero if negative) 0.00 (d)
Enter portion used to reduce MOE requirement(cannot exceed line (d), Available for MOE reduction).
If (b) is less than (a).Enter portion used to reduce MOE requirement(first column cannot exceed line (a), Maximum available for MOE reduction, second and third columns cannot exceed (e), Portion used to reduce MOErequirement). (e)
Available to set aside for EIS(line (b) minus line (e), zero if negative) 0.00 (f)
Note: If your LEA exercises the authority under 34 CFR 300.205(a) to reduce the MOE requirement, the LEA must listthe activities (which are authorized under the ESEA) paid with the freed up funds:

Monterey Peninsula UnifiedMonterey County
Unaudited ActualsSpecial Education Maintenance of Effort
2016-17 Actual vs. Comparison Year's ActualLEA Maintenance of Effort Calculation (LMC-A)
27 66092 0000000Report SEMA
California Dept of EducationSACS Financial Reporting Software - 2017.2.0File: sema (Rev 05/24/2017) Page 3 of 4 Printed: 9/6/2017 3:21 PM
SELPA: (??)
SECTION 3 Column A Column B Column C
Actual Expenditures Actual Expenditures(LE-CY Worksheet) Comparison Year Difference
FY 2016-17 FY 2015-16 (A - B)
A. COMBINED STATE AND LOCAL EXPENDITURES METHOD
1. Under "Comparison Year," enter the most recent year in which MOE compliance was met using the actual vs. actual method based on state and local expenditures.
a. Total special education expenditures 23,546,636.34
b. Less: Expenditures paid from federal sources 2,283,966.71
c. Expenditures paid from state and local sources 21,262,669.63 20,125,105.87 Add/Less: Adjustments required for MOE calculation 0.00 Comparison year's expenditures, adjusted for MOE calculation 20,125,105.87
Less: Exempt reduction(s) for SECTION1 0.00
Less: 50% reduction from SECTION 2 0.00 Net expenditures paid from state and local sources 21,262,669.63 20,125,105.87 1,137,563.76
If the difference in Column C for the Section 3.A.1 is positive or zero, the MOE compliance requirement is met based on the
combination of state and local expenditures.
Actual Comparison YearFY 2016-17 FY 2015-16 Difference
2. Under "Comparison Year," enter the most recent year in which MOE compliance was met using the actual vs. actual method based on the per capita state and local expenditures.
a. Total special education expenditures 23,546,636.34
b. Less: Expenditures paid from federal sources 2,283,966.71
c. Expenditures paid from state and local sources 21,262,669.63 20,125,105.87 Add/Less: Adjustments required for MOE calculation 0.00 Comparison year's expenditures, adjusted for MOE calculation 20,125,105.87
Less: Exempt reduction(s) from SECTION 1 0.00 Less: 50% reduction from SECTION 2 0.00 Net expenditures paid from state and local sources 21,262,669.63 20,125,105.87 1,137,563.76
d. Special education unduplicated pupil count 1,217 1,190
e. Per capita state and local expenditures (A2c/A2d) 17,471.38 16,911.85 559.53
If the difference in Column C for the Section 3.A.2 is positive or zero, the MOE compliance requirement is met based on the per capita state and local expenditures.
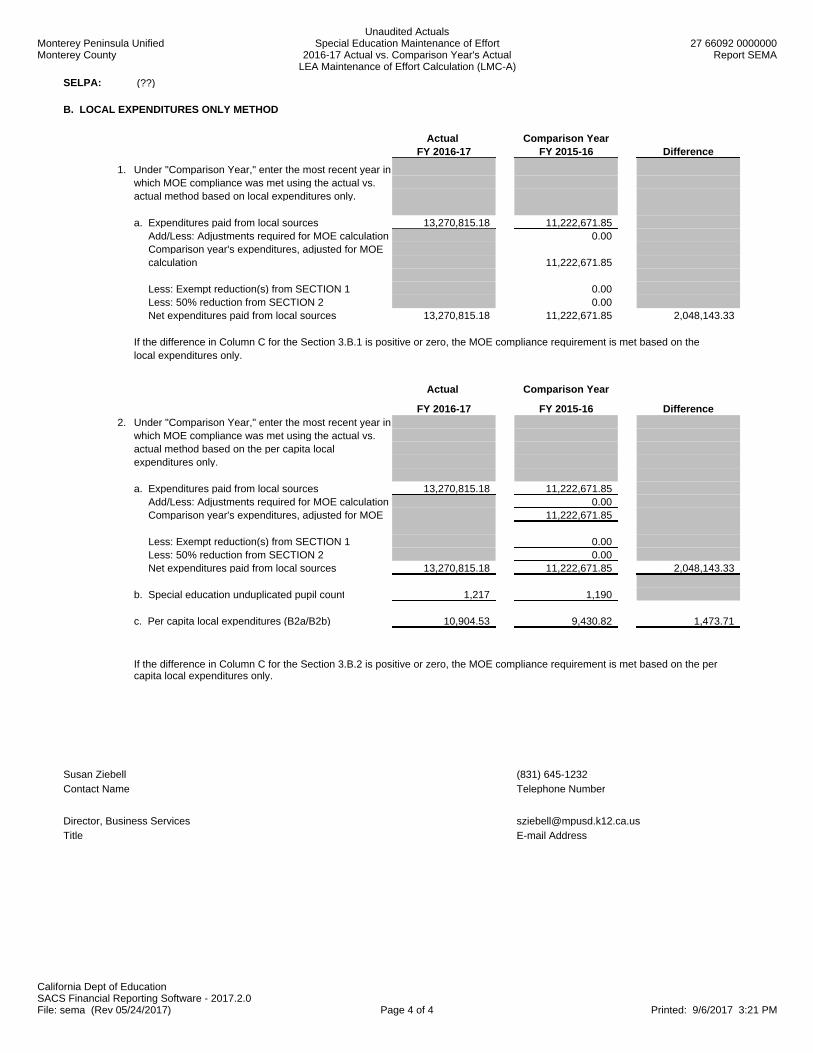
Monterey Peninsula UnifiedMonterey County
Unaudited ActualsSpecial Education Maintenance of Effort
2016-17 Actual vs. Comparison Year's ActualLEA Maintenance of Effort Calculation (LMC-A)
27 66092 0000000Report SEMA
California Dept of EducationSACS Financial Reporting Software - 2017.2.0File: sema (Rev 05/24/2017) Page 4 of 4 Printed: 9/6/2017 3:21 PM
SELPA: (??)
B. LOCAL EXPENDITURES ONLY METHOD
Actual Comparison YearFY 2016-17 FY 2015-16 Difference
1. Under "Comparison Year," enter the most recent year in which MOE compliance was met using the actual vs. actual method based on local expenditures only.
a. Expenditures paid from local sources 13,270,815.18 11,222,671.85 Add/Less: Adjustments required for MOE calculation 0.00 Comparison year's expenditures, adjusted for MOE calculation 11,222,671.85
Less: Exempt reduction(s) from SECTION 1 0.00 Less: 50% reduction from SECTION 2 0.00 Net expenditures paid from local sources 13,270,815.18 11,222,671.85 2,048,143.33
If the difference in Column C for the Section 3.B.1 is positive or zero, the MOE compliance requirement is met based on the local expenditures only.
Actual Comparison Year
FY 2016-17 FY 2015-16 Difference2. Under "Comparison Year," enter the most recent year in
which MOE compliance was met using the actual vs. actual method based on the per capita local expenditures only.
a. Expenditures paid from local sources 13,270,815.18 11,222,671.85 Add/Less: Adjustments required for MOE calculation 0.00 Comparison year's expenditures, adjusted for MOE 11,222,671.85
Less: Exempt reduction(s) from SECTION 1 0.00 Less: 50% reduction from SECTION 2 0.00 Net expenditures paid from local sources 13,270,815.18 11,222,671.85 2,048,143.33
b. Special education unduplicated pupil count 1,217 1,190
c. Per capita local expenditures (B2a/B2b) 10,904.53 9,430.82 1,473.71
If the difference in Column C for the Section 3.B.2 is positive or zero, the MOE compliance requirement is met based on the percapita local expenditures only.
Susan Ziebell (831) 645-1232
Contact Name Telephone Number
Director, Business Services [email protected]
Title E-mail Address

Monterey Peninsula UnifiedMonterey County
Unaudited ActualsSpecial Education Maintenance of Effort
2017-18 Budget vs. 2016-17 Actual Comparison2017-18 Budget by LEA (LB-B)
27 66092 0000000Report SEMB
California Dept of EducationSACS Financial Reporting Software - 2017.2.0File: semb (Rev 06/09/2017) Page 1 of 2 Printed: 9/6/2017 3:22 PM
SpecialEducation,Unspecified
RegionalizedServices
RegionalizedProgram
SpecialistSpecial
Education, Infants
SpecialEducation,PreschoolStudents
Spec. Education,Ages 5-22
Severely Disabled
Spec. Education,Ages 5-22
NonseverelyDisabled
Object Code Description (Goal 5001) (Goal 5050) (Goal 5060) (Goal 5710) (Goal 5730) (Goal 5750) (Goal 5770) Adjustments* Total
UNDUPLICATED PUPIL COUNT 1,217
TOTAL BUDGET (Funds 01, 09, & 62; resources 0000-9999)
1000-1999 Certificated Salaries 331,389.24 0.00 0.00 186,823.56 288,713.10 2,678,875.28 4,560,576.74 8,046,377.92
2000-2999 Classified Salaries 1,089,204.77 0.00 0.00 58,346.43 71,448.96 3,881,465.72 2,165,471.56 7,265,937.44
3000-3999 Employee Benefits 647,350.12 0.00 0.00 101,429.92 141,128.17 2,878,634.38 2,753,076.93 6,521,619.52
4000-4999 Books and Supplies 150,500.00 0.00 0.00 1,500.00 3,000.00 58,700.00 250,175.27 463,875.27
5000-5999 Services and Other Operating Expenditures 370,123.57 0.00 0.00 60,894.04 15,000.00 656,914.43 238,735.82 1,341,667.86
6000-6999 Capital Outlay 0.00 0.00 0.00 0.00 0.00 0.00 0.00 0.00
7130 State Special Schools 0.00 0.00 0.00 0.00 0.00 0.00 0.00 0.00
7430-7439 Debt Service 0.00 0.00 0.00 0.00 0.00 0.00 0.00 0.00
Total Direct Costs 2,588,567.70 0.00 0.00 408,993.95 519,290.23 10,154,589.81 9,968,036.32 0.00 23,639,478.01
7310 Transfers of Indirect Costs 0.00 0.00 0.00 1,046.20 0.00 20,044.79 136,441.76 157,532.75
7350 Transfers of Indirect Costs - Interfund 0.00 0.00 0.00 0.00 0.00 0.00 0.00 0.00
Total Indirect Costs 0.00 0.00 0.00 1,046.20 0.00 20,044.79 136,441.76 0.00 157,532.75
TOTAL COSTS 2,588,567.70 0.00 0.00 410,040.15 519,290.23 10,174,634.60 10,104,478.08 0.00 23,797,010.76STATE AND LOCAL BUDGET (Funds 01, 09, & 62; resources 0000-2999, 3385, & 6000-9999)
1000-1999 Certificated Salaries 331,389.24 0.00 0.00 186,823.56 288,713.10 2,596,839.26 4,560,576.74 7,964,341.90
2000-2999 Classified Salaries 1,089,204.77 0.00 0.00 58,346.43 71,448.96 3,879,317.62 947,906.47 6,046,224.25
3000-3999 Employee Benefits 647,350.12 0.00 0.00 101,429.92 141,128.17 2,851,581.03 2,220,939.43 5,962,428.67
4000-4999 Books and Supplies 150,500.00 0.00 0.00 1,500.00 3,000.00 58,700.00 250,175.27 463,875.27
5000-5999 Services and Other Operating Expenditures 295,468.85 0.00 0.00 60,894.04 15,000.00 461,417.41 196,220.65 1,029,000.95
6000-6999 Capital Outlay 0.00 0.00 0.00 0.00 0.00 0.00 0.00 0.00
7130 State Special Schools 0.00 0.00 0.00 0.00 0.00 0.00 0.00 0.00
7430-7439 Debt Service 0.00 0.00 0.00 0.00 0.00 0.00 0.00 0.00
Total Direct Costs 2,513,912.98 0.00 0.00 408,993.95 519,290.23 9,847,855.32 8,175,818.56 0.00 21,465,871.04
7310 Transfers of Indirect Costs 0.00 0.00 0.00 1,046.20 0.00 20,044.79 8,743.67 29,834.66
7350 Transfers of Indirect Costs - Interfund 0.00 0.00 0.00 0.00 0.00 0.00 0.00 0.00
Total Indirect Costs 0.00 0.00 0.00 1,046.20 0.00 20,044.79 8,743.67 0.00 29,834.66
TOTAL BEFORE OBJECT 8980 2,513,912.98 0.00 0.00 410,040.15 519,290.23 9,867,900.11 8,184,562.23 0.00 21,495,705.70
8980 Contributions from Unrestricted Revenues to FederalResources (Resources 3310-3400, except 3385, allgoals; resources 3000-3178 & 3410-5810, goals5000-5999)
0.00
TOTAL COSTS 21,495,705.70
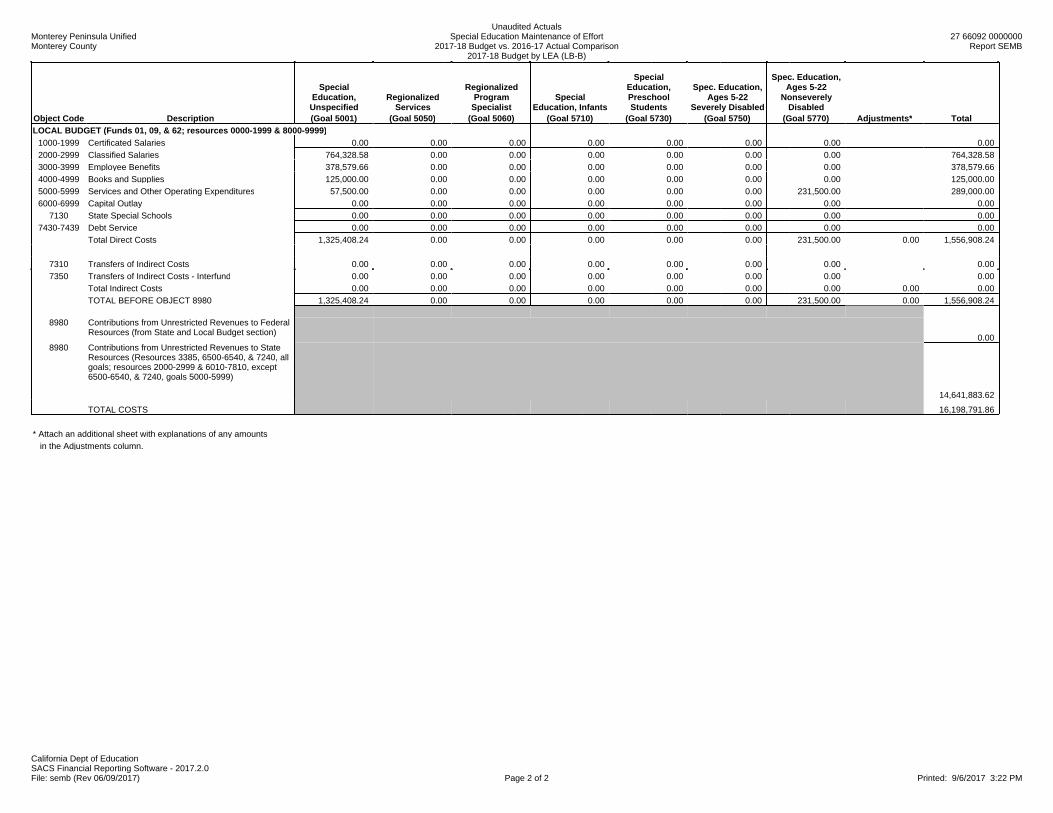
Monterey Peninsula UnifiedMonterey County
Unaudited ActualsSpecial Education Maintenance of Effort
2017-18 Budget vs. 2016-17 Actual Comparison2017-18 Budget by LEA (LB-B)
27 66092 0000000Report SEMB
California Dept of EducationSACS Financial Reporting Software - 2017.2.0File: semb (Rev 06/09/2017) Page 2 of 2 Printed: 9/6/2017 3:22 PM
SpecialEducation,Unspecified
RegionalizedServices
RegionalizedProgram
SpecialistSpecial
Education, Infants
SpecialEducation,PreschoolStudents
Spec. Education,Ages 5-22
Severely Disabled
Spec. Education,Ages 5-22
NonseverelyDisabled
Object Code Description (Goal 5001) (Goal 5050) (Goal 5060) (Goal 5710) (Goal 5730) (Goal 5750) (Goal 5770) Adjustments* Total
LOCAL BUDGET (Funds 01, 09, & 62; resources 0000-1999 & 8000-9999)
1000-1999 Certificated Salaries 0.00 0.00 0.00 0.00 0.00 0.00 0.00 0.00
2000-2999 Classified Salaries 764,328.58 0.00 0.00 0.00 0.00 0.00 0.00 764,328.58
3000-3999 Employee Benefits 378,579.66 0.00 0.00 0.00 0.00 0.00 0.00 378,579.66
4000-4999 Books and Supplies 125,000.00 0.00 0.00 0.00 0.00 0.00 0.00 125,000.00
5000-5999 Services and Other Operating Expenditures 57,500.00 0.00 0.00 0.00 0.00 0.00 231,500.00 289,000.00
6000-6999 Capital Outlay 0.00 0.00 0.00 0.00 0.00 0.00 0.00 0.00
7130 State Special Schools 0.00 0.00 0.00 0.00 0.00 0.00 0.00 0.00
7430-7439 Debt Service 0.00 0.00 0.00 0.00 0.00 0.00 0.00 0.00
Total Direct Costs 1,325,408.24 0.00 0.00 0.00 0.00 0.00 231,500.00 0.00 1,556,908.24
7310 Transfers of Indirect Costs 0.00 0.00 0.00 0.00 0.00 0.00 0.00 0.00
7350 Transfers of Indirect Costs - Interfund 0.00 0.00 0.00 0.00 0.00 0.00 0.00 0.00
Total Indirect Costs 0.00 0.00 0.00 0.00 0.00 0.00 0.00 0.00 0.00
TOTAL BEFORE OBJECT 8980 1,325,408.24 0.00 0.00 0.00 0.00 0.00 231,500.00 0.00 1,556,908.24
8980 Contributions from Unrestricted Revenues to FederalResources (from State and Local Budget section)
0.008980 Contributions from Unrestricted Revenues to State
Resources (Resources 3385, 6500-6540, & 7240, allgoals; resources 2000-2999 & 6010-7810, except6500-6540, & 7240, goals 5000-5999)
14,641,883.62
TOTAL COSTS 16,198,791.86
* Attach an additional sheet with explanations of any amounts
in the Adjustments column.

Monterey Peninsula UnifiedMonterey County
Unaudited ActualsSpecial Education Maintenance of Effort
2017-18 Budget vs. 2016-17 Actual Comparison2016-17 Expenditures by LEA (LE-B)
27 66092 0000000Report SEMB
California Dept of EducationSACS Financial Reporting Software - 2017.2.0File: semb (Rev 06/09/2017) Page 1 of 2 Printed: 9/6/2017 3:22 PM
SpecialEducation,Unspecified
RegionalizedServices
RegionalizedProgram
SpecialistSpecial
Education, Infants
SpecialEducation,PreschoolStudents
Spec. Education,Ages 5-22
Severely Disabled
Spec. Education,Ages 5-22
NonseverelyDisabled
Object Code Description (Goal 5001) (Goal 5050) (Goal 5060) (Goal 5710) (Goal 5730) (Goal 5750) (Goal 5770) Adjustments* Total
UNDUPLICATED PUPIL COUNT 1,217
TOTAL EXPENDITURES (Funds 01, 09, & 62; resources 0000-9999)
1000-1999 Certificated Salaries 361,343.47 0.00 0.00 188,010.84 260,471.85 2,450,368.23 3,911,107.55 7,171,301.94
2000-2999 Classified Salaries 1,052,549.53 0.00 0.00 88,380.90 92,344.93 3,523,126.80 1,820,871.72 6,577,273.88
3000-3999 Employee Benefits 603,013.41 0.00 0.00 103,312.73 136,751.13 2,379,558.54 2,217,772.72 5,440,408.53
4000-4999 Books and Supplies 129,704.80 0.00 0.00 2,677.11 2,857.08 14,292.13 32,593.10 182,124.22
5000-5999 Services and Other Operating Expenditures 494,898.49 0.00 0.00 29,671.26 12,695.88 670,485.14 310,800.11 1,518,550.88
6000-6999 Capital Outlay 0.00 0.00 0.00 0.00 0.00 0.00 0.00 0.00
7130 State Special Schools 0.00 0.00 0.00 0.00 0.00 0.00 0.00 0.00
7430-7439 Debt Service 0.00 0.00 0.00 0.00 0.00 0.00 0.00 0.00
Total Direct Costs 2,641,509.70 0.00 0.00 412,052.84 505,120.87 9,037,830.84 8,293,145.20 0.00 20,889,659.45
7310 Transfers of Indirect Costs 13,099.34 0.00 0.00 834.56 0.00 23,878.29 105,976.40 143,788.59
7350 Transfers of Indirect Costs - Interfund 0.00 0.00 0.00 0.00 0.00 0.00 0.00 0.00
PCRA Program Cost Report Allocations (non-add) 2,513,188.30 2,513,188.30
Total Indirect Costs 13,099.34 0.00 0.00 834.56 0.00 23,878.29 105,976.40 0.00 143,788.59
TOTAL COSTS 2,654,609.04 0.00 0.00 412,887.40 505,120.87 9,061,709.13 8,399,121.60 0.00 21,033,448.04FEDERAL EXPENDITURES (Funds 01, 09, and 62; resources 3000-5999, except 3385)
1000-1999 Certificated Salaries 0.00 0.00 0.00 0.00 0.00 79,754.61 20,721.35 100,475.96
2000-2999 Classified Salaries 0.00 0.00 0.00 0.00 0.00 (1,479.32) 1,017,044.13 1,015,564.81
3000-3999 Employee Benefits 0.00 0.00 0.00 0.00 0.00 26,108.48 434,613.84 460,722.32
4000-4999 Books and Supplies 0.00 0.00 0.00 0.00 0.00 0.00 0.00 0.00
5000-5999 Services and Other Operating Expenditures 232,670.28 0.00 0.00 0.00 0.00 142,961.55 219,470.90 595,102.73
6000-6999 Capital Outlay 0.00 0.00 0.00 0.00 0.00 0.00 0.00 0.00
7130 State Special Schools 0.00 0.00 0.00 0.00 0.00 0.00 0.00 0.00
7430-7439 Debt Service 0.00 0.00 0.00 0.00 0.00 0.00 0.00 0.00
Total Direct Costs 232,670.28 0.00 0.00 0.00 0.00 247,345.32 1,691,850.22 0.00 2,171,865.82
7310 Transfers of Indirect Costs 13,099.34 0.00 0.00 0.00 0.00 0.00 99,001.55 112,100.89
7350 Transfers of Indirect Costs - Interfund 0.00 0.00 0.00 0.00 0.00 0.00 0.00 0.00
Total Indirect Costs 13,099.34 0.00 0.00 0.00 0.00 0.00 99,001.55 0.00 112,100.89
TOTAL BEFORE OBJECT 8980 245,769.62 0.00 0.00 0.00 0.00 247,345.32 1,790,851.77 0.00 2,283,966.71
8980 Less: Contributions from Unrestricted Revenues toFederal Resources (Resources 3310-3400, except3385, all goals; resources 3000-3178 & 3410-5810,goals 5000-5999)
0.00
TOTAL COSTS 2,283,966.71

Monterey Peninsula UnifiedMonterey County
Unaudited ActualsSpecial Education Maintenance of Effort
2017-18 Budget vs. 2016-17 Actual Comparison2016-17 Expenditures by LEA (LE-B)
27 66092 0000000Report SEMB
California Dept of EducationSACS Financial Reporting Software - 2017.2.0File: semb (Rev 06/09/2017) Page 2 of 2 Printed: 9/6/2017 3:22 PM
SpecialEducation,Unspecified
RegionalizedServices
RegionalizedProgram
SpecialistSpecial
Education, Infants
SpecialEducation,PreschoolStudents
Spec. Education,Ages 5-22
Severely Disabled
Spec. Education,Ages 5-22
NonseverelyDisabled
Object Code Description (Goal 5001) (Goal 5050) (Goal 5060) (Goal 5710) (Goal 5730) (Goal 5750) (Goal 5770) Adjustments* Total
STATE AND LOCAL EXPENDITURES (Funds 01, 09, & 62; resources 0000-2999, 3385, & 6000-9999)
1000-1999 Certificated Salaries 361,343.47 0.00 0.00 188,010.84 260,471.85 2,370,613.62 3,890,386.20 7,070,825.98
2000-2999 Classified Salaries 1,052,549.53 0.00 0.00 88,380.90 92,344.93 3,524,606.12 803,827.59 5,561,709.07
3000-3999 Employee Benefits 603,013.41 0.00 0.00 103,312.73 136,751.13 2,353,450.06 1,783,158.88 4,979,686.21
4000-4999 Books and Supplies 129,704.80 0.00 0.00 2,677.11 2,857.08 14,292.13 32,593.10 182,124.22
5000-5999 Services and Other Operating Expenditures 262,228.21 0.00 0.00 29,671.26 12,695.88 527,523.59 91,329.21 923,448.15
6000-6999 Capital Outlay 0.00 0.00 0.00 0.00 0.00 0.00 0.00 0.00
7130 State Special Schools 0.00 0.00 0.00 0.00 0.00 0.00 0.00 0.00
7430-7439 Debt Service 0.00 0.00 0.00 0.00 0.00 0.00 0.00 0.00
Total Direct Costs 2,408,839.42 0.00 0.00 412,052.84 505,120.87 8,790,485.52 6,601,294.98 0.00 18,717,793.63
7310 Transfers of Indirect Costs 0.00 0.00 0.00 834.56 0.00 23,878.29 6,974.85 31,687.70
7350 Transfers of Indirect Costs - Interfund 0.00 0.00 0.00 0.00 0.00 0.00 0.00 0.00
PCRA Program Cost Report Allocations (non-add) 2,513,188.30 2,513,188.30
Total Indirect Costs 0.00 0.00 0.00 834.56 0.00 23,878.29 6,974.85 0.00 31,687.70
TOTAL BEFORE OBJECT 8980 2,408,839.42 0.00 0.00 412,887.40 505,120.87 8,814,363.81 6,608,269.83 0.00 18,749,481.33
8980 Contributions from Unrestricted Revenues to FederalResources (from Federal Expenditures section) 0.00
TOTAL COSTS 18,749,481.33LOCAL EXPENDITURES (Funds 01, 09, & 62; resources 0000-1999 & 8000-9999)
1000-1999 Certificated Salaries 0.00 0.00 0.00 0.00 0.00 0.00 0.00 0.00
2000-2999 Classified Salaries 734,932.41 0.00 0.00 0.00 0.00 1,474.50 0.00 736,406.91
3000-3999 Employee Benefits 350,914.92 0.00 0.00 0.00 0.00 340.62 0.00 351,255.54
4000-4999 Books and Supplies 121,893.94 0.00 0.00 0.00 0.00 0.00 0.00 121,893.94
5000-5999 Services and Other Operating Expenditures 66,255.02 0.00 0.00 0.00 0.00 0.00 245,171.00 311,426.02
6000-6999 Capital Outlay 0.00 0.00 0.00 0.00 0.00 0.00 0.00 0.00
7130 State Special Schools 0.00 0.00 0.00 0.00 0.00 0.00 0.00 0.00
7430-7439 Debt Service 0.00 0.00 0.00 0.00 0.00 0.00 0.00 0.00
Total Direct Costs 1,273,996.29 0.00 0.00 0.00 0.00 1,815.12 245,171.00 0.00 1,520,982.41
7310 Transfers of Indirect Costs 0.00 0.00 0.00 0.00 0.00 0.00 0.00 0.00
7350 Transfers of Indirect Costs - Interfund 0.00 0.00 0.00 0.00 0.00 0.00 0.00 0.00
Total Indirect Costs 0.00 0.00 0.00 0.00 0.00 0.00 0.00 0.00 0.00
TOTAL BEFORE OBJECT 8980 1,273,996.29 0.00 0.00 0.00 0.00 1,815.12 245,171.00 0.00 1,520,982.41
8980 Contributions from Unrestricted Revenues to FederalResources (from Federal Expenditures section)
0.008980 Contributions from Unrestricted Revenues to State
Resources (Resources 3385, 6500, 6510, & 7240, allgoals; resources 2000-2999 & 6010-7810, except6500, 6510, & 7240, goals 5000-5999)
11,749,832.77
TOTAL COSTS 13,270,815.18
* Attach an additional sheet with explanations of any amounts
in the Adjustments column.

Monterey Peninsula UnifiedMonterey County
Unaudited ActualsSpecial Education Maintenance of Effort
2017-18 Budget vs. Comparison Year's ActualLEA Maintenance of Effort Calculation (LMC-B)
27 66092 0000000Report SEMB
California Dept of EducationSACS Financial Reporting Software - 2017.2.0File: semb (Rev 05/22/2017) Page 1 of 4 Printed: 9/6/2017 3:22 PM
SELPA:
This form is used to check maintenance of effort (MOE) for an LEA, whether the LEA is a member of a SELPA or is a single-LEA SELPA. If amember of a SELPA, submit this form together with the 2017-18 Budget by LEA (LB-B) and the 2016-17 Expenditures by LEA (LE-B) to the SELPAAU. If a single-LEA SELPA, submit the forms to the CDE.
Per the federal Subsequent Years Rule, in order to determine the required level of effort, the LEA must look back to the last fiscal year in which theLEA maintained effort using the same method by which it is currently establishing the eligibility standard. To meet the requirement of the SubsequentYears Rule, the LMC-B worksheet has been revised to make changes to sections 3.A.1, 3.A.2, 3.B.1, and 3.B.2. The revised sections allow the LEAto compare the 2017-18 budgeted expenditures to the most recent fiscal year the LEA met MOE using that method, which is the comparison year. Toensure the LEA is comparing 2017-18 budgeted expenditures to the appropriate comparison year, the LEA is required to complete the SubsequentYears Tracking (SYT) worksheet with their LMC-B worksheet. The SYT worksheet tracks the result for each of the four methods back to FY 2011-12,which is the baseline year for LEA MOE calculations established by the Office of Special Education Programs. The SYT worksheet is available athttp://www.cde.ca.gov/sp/se/as/documents/subseqyrtrckwrksht.xls.
There are four methods that the LEA can use to demonstrate the eligibility standard. They are (1) combined state and local expenditures; (2)combined state and local expenditures on a per capita basis; (3) local expenditures only; and (4) local expenditures only on a per capita basis.
The LEA is only required to pass one of the tests to meet the MOE requirement. However, the LEA is required to show results for all four methods.These results are necessary both for historical purposes and for the possibility that the LEA may want, or need, to switch methods in future years.
SECTION 1 Exempt Reduction Under 34 CFR Section 300.204
If your LEA determines that a reduction in expenditures occurred as a result of one or more of the following conditions, you maycalculate a reduction to the required MOE standard. Reductions may apply to combined state and local MOE standard, local onlyMOE standard, or both. If the LEA meets one of the conditions below, the LEA must complete and include the IDEA MOE ExemptionWorksheet available at: http://www.cde.ca.gov/sp/se/as/documents/leamoeexempwrksht.xls.
1. Voluntary departure, by retirement or otherwise, or departure for just cause, of special education or related services personnel.
2. A decrease in the enrollment of children with disabilities.
3. The termination of the obligation of the agency to provide a program of special education to a particular child with a disability that is an exceptionally costly program, as determined by the SEA, because the child
a. Has left the jurisdiction of the agency; b. Has reached the age at which the obligation of the agency to provide free appropriate public education (FAPE) to the child has terminated; or c. No longer needs the program of special education.
4. The termination of costly expenditures for long-term purchases, such as the acquisition of equipment or the construction of school facilities.
5. The assumption of cost by the high cost fund operated by the SEA under 34 CFR Sec. 300.704(c).
Provide the condition number, if any, to be used in the calculation below: State and Local Local Only
Total exempt reductions 0.00 0.00

Monterey Peninsula UnifiedMonterey County
Unaudited ActualsSpecial Education Maintenance of Effort
2017-18 Budget vs. Comparison Year's ActualLEA Maintenance of Effort Calculation (LMC-B)
27 66092 0000000Report SEMB
California Dept of EducationSACS Financial Reporting Software - 2017.2.0File: semb (Rev 05/22/2017) Page 2 of 4 Printed: 9/6/2017 3:22 PM
SELPA:
SECTION 2 Reduction to MOE Requirement Under IDEA, Section 613 (a)(2)(C) (34 CFR Sec. 300.205)IMPORTANT NOTE: Only LEAs that have a "meets requirement" compliance determination and that are not found significantly disproportionate for the current year are eligible to use this option to reduce their MOE requirement.
Up to 50% of the increase in IDEA Part B Section 611 funding in current year compared with prior year may be usedto reduce the required level of state and local expenditures. This option is available only if the LEA used or will usethe freed up funds for activities authorized under the Elementary and Secondary Education Act (ESEA) of 1965. Also, the amount of Part B funds used for early intervening services (34 CFR 300.226(a)) will count toward the maximum amount by which the LEA may reduce its MOE requirement under this exception [P.L. 108-446].
State and Local Local Only Current year funding (IDEA Section 611 Local Assistance Grant Awards - Resources 3310 and3320)
Less: Prior year's funding (IDEA Section 611 LocalAssistance Grant Awards - Resources 3310 and3320)
Increase in funding (if difference is positive) 0.00
Maximum available for MOE reduction (50% ofincrease in funding) 0.00 (a)
Current year funding (IDEA Section 619 - Resource 3315)
Maximum available for early intervening services(EIS) (15% of current year funding - Resources3310, 3315, and 3320) 0.00 (b)
If (b) is greater than (a).Enter portion to set aside for EIS (cannot exceedline (b), Maximum available for EIS) (c)
Available for MOE reduction.(line (a) minus line (c), zero if negative) 0.00 (d)
Enter portion used to reduce MOE requirement(cannot exceed line (d), Available for MOE reduction).
If (b) is less than (a).Enter portion used to reduce MOE requirement(first column cannot exceed line (a), Maximum available for MOE reduction, second and third columns cannot exceed (e), Portion used to reduce MOErequirement). (e)
Available to set aside for EIS(line (b) minus line (e), zero if negative) 0.00 (f)
Note: If your LEA exercises the authority under 34 CFR 300.205(a) to reduce the MOE requirement, the LEA must list the activities(which are authorized under the ESEA) paid with the freed up funds:

Monterey Peninsula UnifiedMonterey County
Unaudited ActualsSpecial Education Maintenance of Effort
2017-18 Budget vs. Comparison Year's ActualLEA Maintenance of Effort Calculation (LMC-B)
27 66092 0000000Report SEMB
California Dept of EducationSACS Financial Reporting Software - 2017.2.0File: semb (Rev 05/22/2017) Page 3 of 4 Printed: 9/6/2017 3:22 PM
SELPA:
SECTION 3 Column A Column B Column C
Budgeted Amounts Actual Expenditures
(LB-B Worksheet) Comparison Year Difference
FY 2017-18 FY 2016-17 (A - B)
A. COMBINED STATE AND LOCAL EXPENDITURES METHOD
1. Under "Comparison Year," enter the most recent year in which MOE compliance was met using the actual vs. actual method based on state and local expenditures.
a. Total special education expenditures 23,797,010.76
b. Less: Expenditures paid from federal sources 2,301,305.06
c. Expenditures paid from state and local sources 21,495,705.70 18,749,481.33 Add/Less: Adjustments required for MOE calculation 0.00 Comparison year's expenditures, adjusted for MOE calculation 18,749,481.33
Less: Exempt reduction(s) from SECTION 1 0.00 Less: 50% reduction from SECTION 2 0.00 Net expenditures paid from state and local sources 21,495,705.70 18,749,481.33 2,746,224.37
If the difference in Column C for the Section 3.A.1 is positive or zero, the MOE Eligibility requirement is met based on the combination of state and local expenditures.
Budgeted Amounts Comparison YearFY 2017-18 FY 2016-17 Difference
2. Under "Comparison Year," enter the most recent year in which MOE compliance was met using the actual vs. actual method based on the per capita state and local expenditures.
a. Total special education expenditures 23,797,010.76
b. Less: Expenditures paid from federal sources 2,301,305
c. Expenditures paid from state and local sources 21,495,705.70 18,749,481.33 Add/Less: Adjustments required for MOE calculation 0.00 Comparison year's expenditures, adjusted for MOE calculation 18,749,481.33
Less: Exempt reduction(s) from SECTION 1 0.00 Less: 50% reduction from SECTION 2 0.00 Net expenditures paid from state and local sources 21,495,705.70 18,749,481.33
d. Special education unduplicated pupil count 1217 1217
e. Per capita state and local expenditures (A2c/A2d) 17,662.86 15,406.31 2,256.55
If the difference in Column C for the Section 3.A.2 is positive or zero, the MOE eligibility requirement is met based on the per capitastate and local expenditures.

Monterey Peninsula UnifiedMonterey County
Unaudited ActualsSpecial Education Maintenance of Effort
2017-18 Budget vs. Comparison Year's ActualLEA Maintenance of Effort Calculation (LMC-B)
27 66092 0000000Report SEMB
California Dept of EducationSACS Financial Reporting Software - 2017.2.0File: semb (Rev 05/22/2017) Page 4 of 4 Printed: 9/6/2017 3:22 PM
SELPA:
B. LOCAL EXPENDITURES ONLY METHOD
Budget Comparison YearFY 2017-18 FY 2016-17 Difference
1. Under "Comparison Year," enter the most recent year in which MOE compliance was met using the actual vs. actual method based on local expenditures only.
a. Expenditures paid from local sources 16,198,791.86 13,270,815.18 Add/Less: Adjustments required for MOE calculation 0.00 Comparison year's expenditures, adjusted for MOE calculation 13,270,815.18
Less: Exempt reduction(s) from SECTION 1 0.00 Less: 50% reduction from SECTION 2 0.00 Net expenditures paid from local sources 16,198,791.86 13,270,815.18 2,927,976.68
If the difference in Column C for the Section 3.B.1 is positive or zero, the MOE eligibility requirement is met based on the localexpenditures only.
Budget Comparison Year
FY 2017-18 FY 2016-17 Difference2. Under "Comparison Year," enter the most recent year
in which MOE compliance was met using the actual vs.actual method based on per capita local expenditures
a. Expenditures paid from local sources 16,198,791.86 13,270,815.18 Add/Less: Adjustments required for MOE calculation 0.00 Comparison year's expenditures, adjusted for MOE calculation 13,270,815.18
Less: Exempt reduction(s) from SECTION 1 0.00 Less: 50% reduction from SECTION 2 0.00 Net expenditures paid from local sources 16,198,791.86 13,270,815.18 2,927,976.68
b. Special education unduplicated pupil count 1,217 1,217
c. Per capita local expenditures (B2a/B2b) 13,310.43 10,904.53 2,405.90
If the difference in Column C for the Section 3.B.2 is positive or zero, the MOE eligibility requirement is met based on the per capitalocal expenditures only.
Susan Ziebell (831) 645-1232
Contact Name Telephone Number
Director, Business Services [email protected]
Title E-mail Address

Monterey Peninsula UnifiedMonterey County
Unaudited Actuals2016-17 Unaudited Actuals
SUMMARY OF INTERFUND ACTIVITIESFOR ALL FUNDS
27 66092 0000000Form SIAA
California Dept of EducationSACS Financial Reporting Software - 2017.2.0File: siaa (Rev 05/16/2016) Page 1 of 2 Printed: 9/6/2017 2:49 PM
Direct Costs - Interfund Indirect Costs - Interfund Interfund Interfund Due From Due To
DescriptionTransfers In
5750Transfers Out
5750Transfers In
7350Transfers Out
7350Transfers In8900-8929
Transfers Out7600-7629
Other Funds9310
Other Funds9610
01 GENERAL FUND Expenditure Detail 0.00 (423,172.32) 0.00 (585,713.44) Other Sources/Uses Detail 17,418.86 741,861.00 Fund Reconciliation 253,332.97 786,439.5709 CHARTER SCHOOLS SPECIAL REVENUE FUND Expenditure Detail 383,344.10 0.00 211,860.53 0.00 Other Sources/Uses Detail 0.00 0.00 Fund Reconciliation 44,879.00 59,776.5210 SPECIAL EDUCATION PASS-THROUGH FUND Expenditure Detail Other Sources/Uses Detail Fund Reconciliation 0.00 0.0011 ADULT EDUCATION FUND Expenditure Detail 973.50 0.00 36,508.67 0.00 Other Sources/Uses Detail 0.00 0.00 Fund Reconciliation 0.00 0.1312 CHILD DEVELOPMENT FUND Expenditure Detail 41,196.86 0.00 111,788.63 0.00 Other Sources/Uses Detail 2,171.05 0.00 Fund Reconciliation 2,171.05 30,951.9413 CAFETERIA SPECIAL REVENUE FUND Expenditure Detail 0.00 (80,075.53) 225,555.61 0.00 Other Sources/Uses Detail 300.44 0.00 Fund Reconciliation 0.01 70,680.5514 DEFERRED MAINTENANCE FUND Expenditure Detail 0.00 0.00 Other Sources/Uses Detail 0.00 0.00 Fund Reconciliation 0.00 0.0015 PUPIL TRANSPORTATION EQUIPMENT FUND Expenditure Detail 0.00 0.00 Other Sources/Uses Detail 0.00 0.00 Fund Reconciliation 0.00 0.0017 SPECIAL RESERVE FUND FOR OTHER THAN CAPITAL OUTLAY
Expenditure Detail Other Sources/Uses Detail 0.00 0.00 Fund Reconciliation 0.00 0.0018 SCHOOL BUS EMISSIONS REDUCTION FUND Expenditure Detail 0.00 0.00 Other Sources/Uses Detail 0.00 0.00 Fund Reconciliation 0.00 0.0019 FOUNDATION SPECIAL REVENUE FUND Expenditure Detail 0.00 0.00 0.00 0.00 Other Sources/Uses Detail 0.00 Fund Reconciliation 0.00 0.0020 SPECIAL RESERVE FUND FOR POSTEMPLOYMENT BENEFITS
Expenditure Detail Other Sources/Uses Detail 0.00 0.00 Fund Reconciliation 0.00 0.0021 BUILDING FUND Expenditure Detail 0.00 0.00 Other Sources/Uses Detail 0.00 0.00 Fund Reconciliation 0.00 15.8825 CAPITAL FACILITIES FUND Expenditure Detail 74,342.89 0.00 Other Sources/Uses Detail 0.00 0.00 Fund Reconciliation 0.00 74,342.8930 STATE SCHOOL BUILDING LEASE/PURCHASE FUND Expenditure Detail 0.00 0.00 Other Sources/Uses Detail 0.00 0.00 Fund Reconciliation 0.00 0.0035 COUNTY SCHOOL FACILITIES FUND Expenditure Detail 0.00 0.00 Other Sources/Uses Detail 0.00 0.00 Fund Reconciliation 0.00 0.0040 SPECIAL RESERVE FUND FOR CAPITAL OUTLAY PROJECTS
Expenditure Detail 0.00 0.00 Other Sources/Uses Detail 0.00 0.00 Fund Reconciliation 0.00 146.2049 CAP PROJ FUND FOR BLENDED COMPONENT UNITS Expenditure Detail 0.00 0.00 Other Sources/Uses Detail 0.00 0.00 Fund Reconciliation 0.00 0.0051 BOND INTEREST AND REDEMPTION FUND Expenditure Detail Other Sources/Uses Detail 0.00 0.00 Fund Reconciliation 0.00 0.0052 DEBT SVC FUND FOR BLENDED COMPONENT UNITS Expenditure Detail Other Sources/Uses Detail 0.00 0.00 Fund Reconciliation 0.00 0.0053 TAX OVERRIDE FUND Expenditure Detail Other Sources/Uses Detail 0.00 0.00 Fund Reconciliation 0.00 0.0056 DEBT SERVICE FUND Expenditure Detail Other Sources/Uses Detail 0.00 0.00 Fund Reconciliation 0.00 0.0057 FOUNDATION PERMANENT FUND Expenditure Detail 0.00 0.00 0.00 0.00 Other Sources/Uses Detail 0.00 Fund Reconciliation 0.00 0.0061 CAFETERIA ENTERPRISE FUND Expenditure Detail 0.00 0.00 0.00 0.00 Other Sources/Uses Detail 0.00 0.00 Fund Reconciliation 0.00 0.00
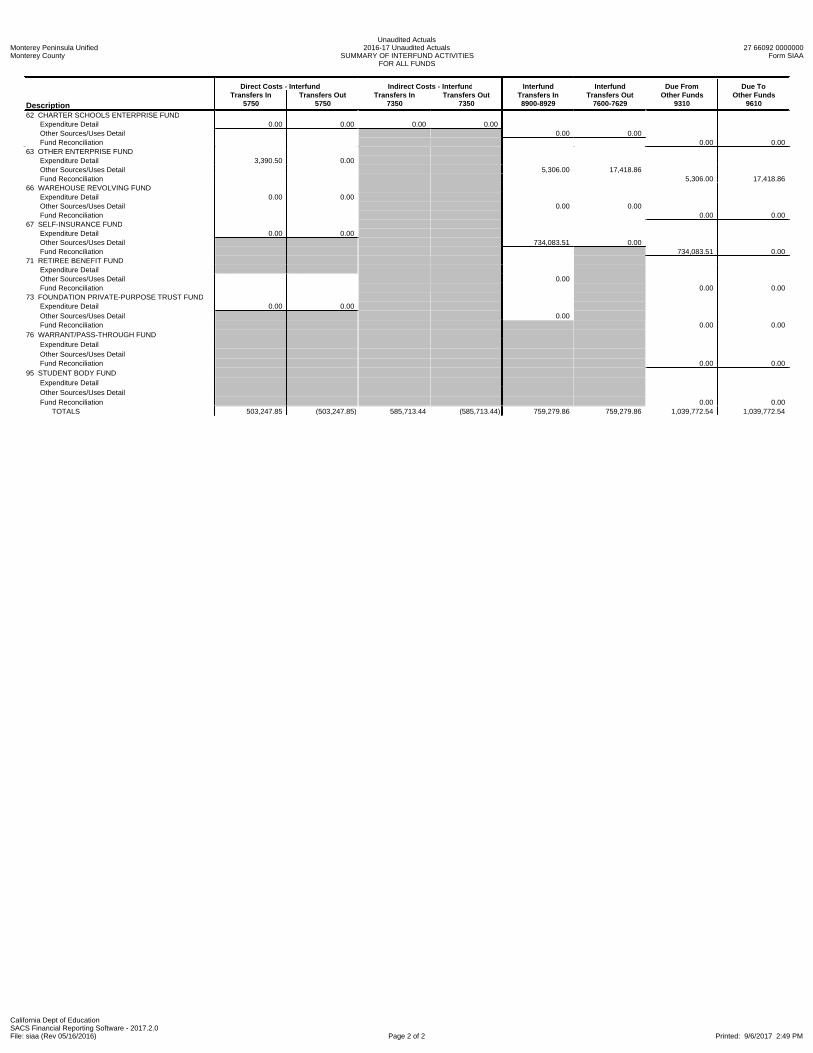
Monterey Peninsula UnifiedMonterey County
Unaudited Actuals2016-17 Unaudited Actuals
SUMMARY OF INTERFUND ACTIVITIESFOR ALL FUNDS
27 66092 0000000Form SIAA
California Dept of EducationSACS Financial Reporting Software - 2017.2.0File: siaa (Rev 05/16/2016) Page 2 of 2 Printed: 9/6/2017 2:49 PM
Direct Costs - Interfund Indirect Costs - Interfund Interfund Interfund Due From Due To
DescriptionTransfers In
5750Transfers Out
5750Transfers In
7350Transfers Out
7350Transfers In8900-8929
Transfers Out7600-7629
Other Funds9310
Other Funds9610
62 CHARTER SCHOOLS ENTERPRISE FUND Expenditure Detail 0.00 0.00 0.00 0.00 Other Sources/Uses Detail 0.00 0.00 Fund Reconciliation 0.00 0.0063 OTHER ENTERPRISE FUND Expenditure Detail 3,390.50 0.00 Other Sources/Uses Detail 5,306.00 17,418.86 Fund Reconciliation 5,306.00 17,418.8666 WAREHOUSE REVOLVING FUND Expenditure Detail 0.00 0.00 Other Sources/Uses Detail 0.00 0.00 Fund Reconciliation 0.00 0.0067 SELF-INSURANCE FUND Expenditure Detail 0.00 0.00 Other Sources/Uses Detail 734,083.51 0.00 Fund Reconciliation 734,083.51 0.0071 RETIREE BENEFIT FUND Expenditure Detail Other Sources/Uses Detail 0.00 Fund Reconciliation 0.00 0.0073 FOUNDATION PRIVATE-PURPOSE TRUST FUND Expenditure Detail 0.00 0.00 Other Sources/Uses Detail 0.00 Fund Reconciliation 0.00 0.0076 WARRANT/PASS-THROUGH FUND Expenditure Detail Other Sources/Uses Detail Fund Reconciliation 0.00 0.0095 STUDENT BODY FUND Expenditure Detail Other Sources/Uses Detail Fund Reconciliation 0.00 0.00 TOTALS 503,247.85 (503,247.85) 585,713.44 (585,713.44) 759,279.86 759,279.86 1,039,772.54 1,039,772.54

Monterey Peninsula UnifiedMonterey County
Unaudited Actuals2016-17 Unaudited Actuals
Determination of Major Funds27 66092 0000000
Report DTERM
California Dept of EducationSACS Financial Reporting Software - 2017.2.0File: dterm (Rev 06/23/2014) Page 1 of 1 Printed: 9/6/2017 3:13 PM
5%Criterion
Governmental Funds
Assets &Deferred
Outflows ofResources
Object Codes9100-9399 &9490-9499
Liabilities &Deferred
Inflows ofResources
Object Codes9500-9650 &9690-9699
RevenuesObject Codes8000-8799
ExpendituresObject Codes1000-7499
10%Criterion
for sameelement
AutomaticMajorFund?
General Fund01 General Fund 24,879,116 7,334,971 113,435,840 113,130,038 n/a n/a Always
Special Revenue Funds09 Charter Schools Special Revenue Fund 1,163,539 235,964 4,251,836 4,357,77010 Special Education Pass-Through Fund 11 Adult Education Fund 347,076 18,445 1,009,069 900,42912 Child Development Fund 62,196 46,194 2,153,586 2,140,44713 Cafeteria Special Revenue Fund 2,149,342 99,361 5,097,348 4,878,79814 Deferred Maintenance Fund 460,978 5,194 4,969 428,56815 Pupil Transportation Equipment Fund 17 Special Reserve Fund for Other Than Capital Outlay Projects 18 School Bus Emissions Reduction Fund 19 Foundation Special Revenue Fund 20 Special Reserve Fund for Postemployment Benefits
Capital Project Funds21 Building Fund 33,008,440 273,770 228,124 11,341,198 Yes Yes Yes25 Capital Facilities Fund 7,885,637 154,591 2,555,675 700,666 Yes Yes Yes30 State School Building Lease-Purchase Fund 35 County School Facilities Fund 40 Special Reserve Fund for Capital Outlay Projects 674,355 33,113 92,186 1,196,67149 Capital Project Fund for Blended Component Units
Debt Service Funds51 Bond Interest and Redemption Fund 4,303,134 3,493,099 2,789,43052 Debt Service Fund for Blended Component Units 53 Tax Override Fund 56 Debt Service Fund
Permanent Funds57 Foundation Permanent Fund
Total Governmental Funds 74,933,813 8,201,603 132,321,732 141,864,015
10% of Total Governmental Funds 7,493,381 820,160 13,232,173 14,186,402
Automatic10% 5% Major
Enterprise Funds
Assets &Deferred
Outflows ofResources
Object Codes9100-9499
Liabilities &Deferred
Inflows ofResources
Object Codes9500-9699
RevenuesObject Codes8000-8799
ExpensesObject Codes1000-7399 Criterion Criterion Fund?
61 Cafeteria Enterprise Fund 62 Charter Schools Enterprise Fund 63 Other Enterprise Fund 143,194 143,194 187,177 173,521 Yes
Total Enterprise Funds 143,194 143,194 187,177 173,521
10% of Total Enterprise Funds 14,319 14,319 18,718 17,352
Total Governmental & Enterprise Funds 75,077,007 8,344,797 132,508,909 142,037,536
5% of Total Gov'tl & Enterprise Funds 3,753,850 417,240 6,625,445 7,101,877
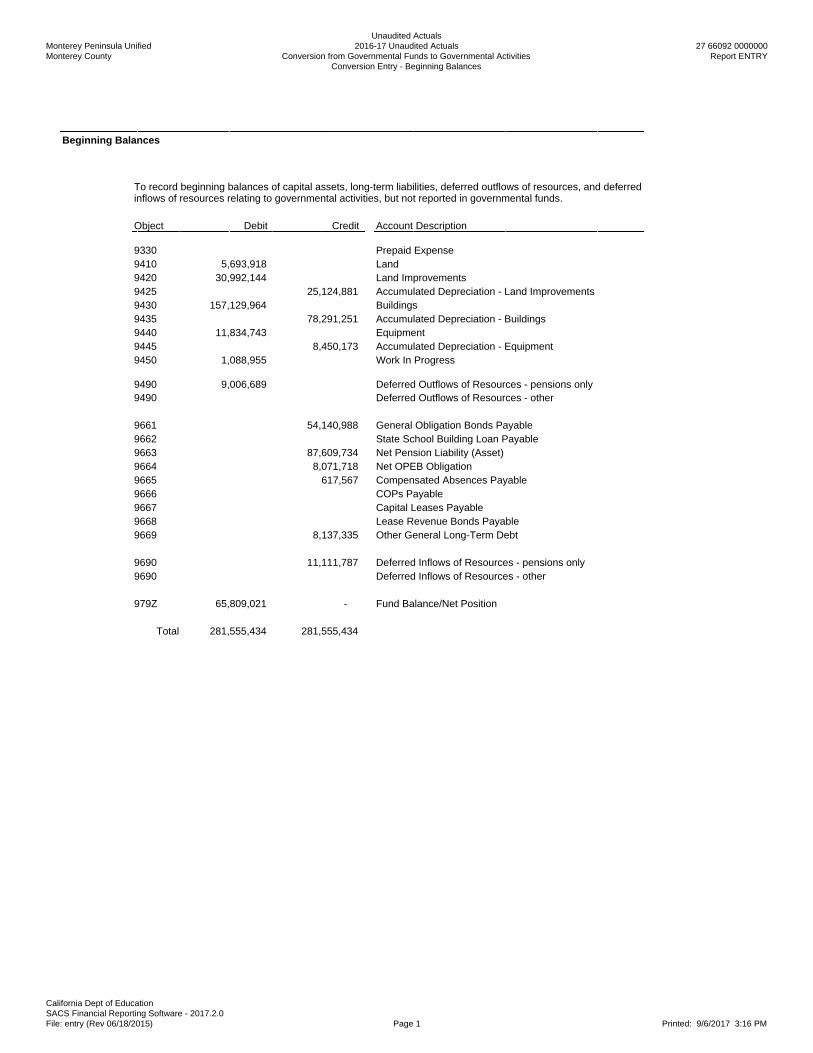
Monterey Peninsula UnifiedMonterey County
Unaudited Actuals2016-17 Unaudited Actuals
Conversion from Governmental Funds to Governmental ActivitiesConversion Entry - Beginning Balances
27 66092 0000000Report ENTRY
California Dept of EducationSACS Financial Reporting Software - 2017.2.0File: entry (Rev 06/18/2015) Page 1 Printed: 9/6/2017 3:16 PM
Beginning Balances
To record beginning balances of capital assets, long-term liabilities, deferred outflows of resources, and deferredinflows of resources relating to governmental activities, but not reported in governmental funds.
Object Debit Credit Account Description
9330 Prepaid Expense9410 5,693,918 Land9420 30,992,144 Land Improvements9425 25,124,881 Accumulated Depreciation - Land Improvements9430 157,129,964 Buildings9435 78,291,251 Accumulated Depreciation - Buildings9440 11,834,743 Equipment9445 8,450,173 Accumulated Depreciation - Equipment9450 1,088,955 Work In Progress
9490 9,006,689 Deferred Outflows of Resources - pensions only9490 Deferred Outflows of Resources - other
9661 54,140,988 General Obligation Bonds Payable9662 State School Building Loan Payable9663 87,609,734 Net Pension Liability (Asset)9664 8,071,718 Net OPEB Obligation9665 617,567 Compensated Absences Payable9666 COPs Payable9667 Capital Leases Payable9668 Lease Revenue Bonds Payable9669 8,137,335 Other General Long-Term Debt
9690 11,111,787 Deferred Inflows of Resources - pensions only9690 Deferred Inflows of Resources - other
979Z 65,809,021 - Fund Balance/Net Position
Total 281,555,434 281,555,434

Monterey Peninsula UnifiedMonterey County
Unaudited Actuals2016-17 Unaudited Actuals
Conversion from Governmental Funds to Governmental ActivitiesConversion Entry - CE001 Data by Function
27 66092 0000000Report ENTRY
California Dept of EducationSACS Financial Reporting Software - 2017.2.0File: entry (Rev 04/18/2007) Page 1 Printed: 9/6/2017 3:17 PM
By Function
Fund ResourceProjectYear Goal Function Object Value
01 0000 0 1110 1000 6400 6,044.20Total, Instruction (Functions 1000-1999) 6,044.20
Total, Instructional Supervision and Administration (Functions 2000-2999except 2420 and 2700)
0.00
Total, Instructional Library, Media, and Technology (Function 2420) 0.00
01 1100 0 1110 2700 6400 6,506.6409 0000 0 1110 2700 6400 25,171.89Total, School Site Administration (Function 2700) 31,678.53
Total, All Other Pupil Services (Functions 3000-3999 except 3600 and3700)
0.00
01 0000 0 0000 3600 6400 113,203.19Total, Home-to-School Transportation (Function 3600) 113,203.19
13 5310 0 0000 3700 6400 56,300.4213 5380 0 0000 3700 6400 7,222.00Total, Food Services (Function 3700) 63,522.42
Total, Ancillary Services (Functions 4000-4999) 0.00
Total, Community Services (Functions 5000-5999) 0.00
Total, Enterprise Activities (Functions 6000-6999) 0.00
Total, All Other General Administration(Functions 7000-7999 except 7700)
0.00
Total, Centralized Data Processing (Function 7700) 0.00
01 0000 0 0000 8100 6400 155,905.9701 8150 0 0000 8100 6400 7,006.3114 0000 0 0000 8100 6400 24,848.0040 0000 0 0000 8100 6400 41,522.00
Total, Plant Services (Functions 8000-8999 except 8500) 229,282.28
01 0000 0 1110 8500 6170 676.5501 9010 0 1110 8500 6170 30,691.0414 0000 0 0000 8500 6170 20,118.3614 0000 0 0000 8500 6200 76,325.00
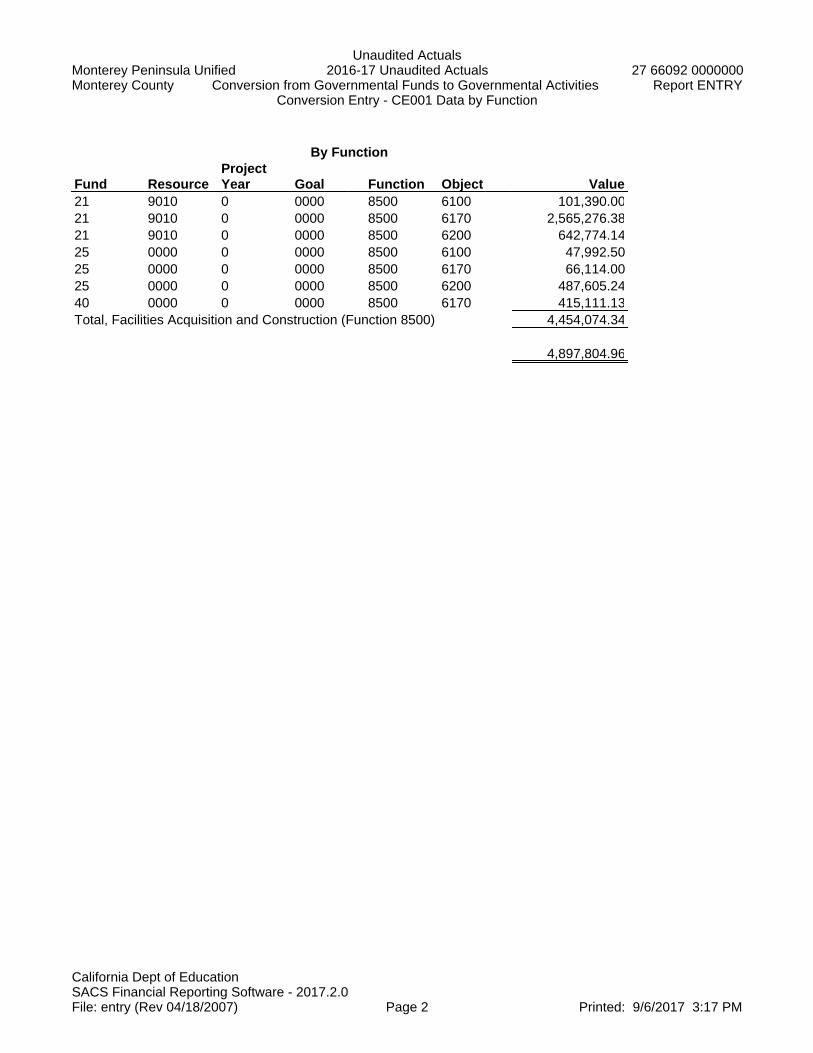
Monterey Peninsula UnifiedMonterey County
Unaudited Actuals2016-17 Unaudited Actuals
Conversion from Governmental Funds to Governmental ActivitiesConversion Entry - CE001 Data by Function
27 66092 0000000Report ENTRY
California Dept of EducationSACS Financial Reporting Software - 2017.2.0File: entry (Rev 04/18/2007) Page 2 Printed: 9/6/2017 3:17 PM
By Function
Fund ResourceProjectYear Goal Function Object Value
21 9010 0 0000 8500 6100 101,390.0021 9010 0 0000 8500 6170 2,565,276.3821 9010 0 0000 8500 6200 642,774.1425 0000 0 0000 8500 6100 47,992.5025 0000 0 0000 8500 6170 66,114.0025 0000 0 0000 8500 6200 487,605.2440 0000 0 0000 8500 6170 415,111.13Total, Facilities Acquisition and Construction (Function 8500) 4,454,074.34
4,897,804.96
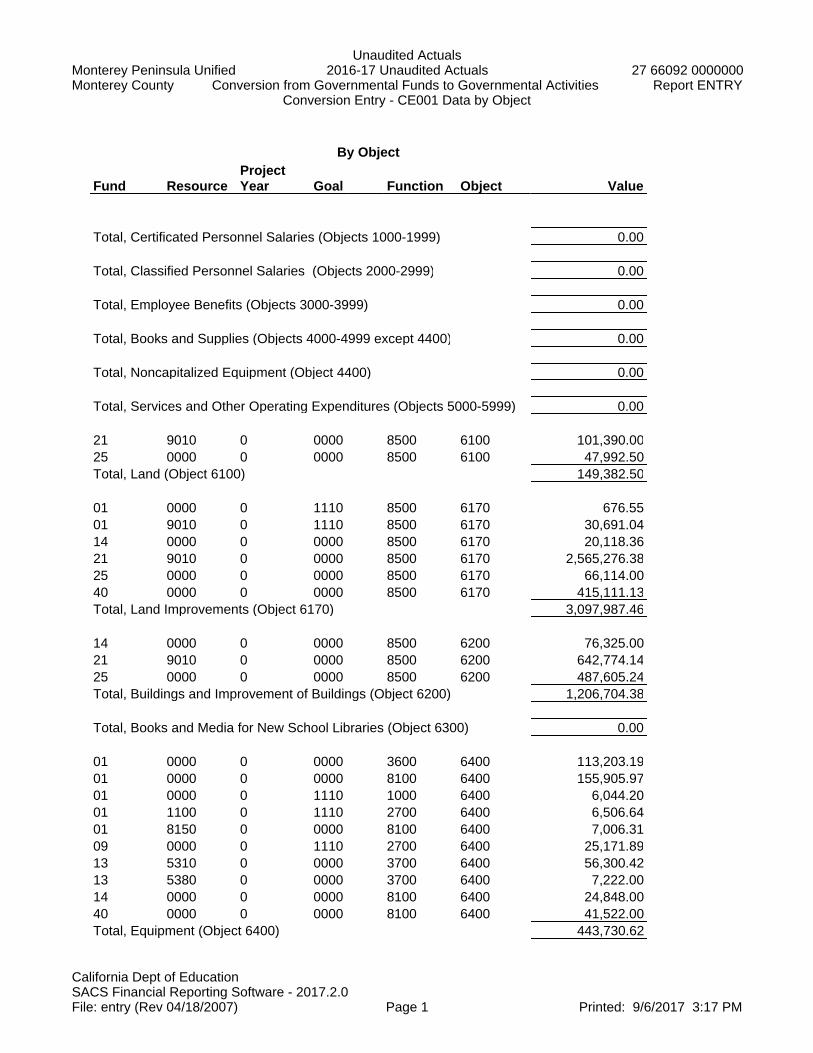
Monterey Peninsula UnifiedMonterey County
Unaudited Actuals2016-17 Unaudited Actuals
Conversion from Governmental Funds to Governmental ActivitiesConversion Entry - CE001 Data by Object
27 66092 0000000Report ENTRY
California Dept of EducationSACS Financial Reporting Software - 2017.2.0File: entry (Rev 04/18/2007) Page 1 Printed: 9/6/2017 3:17 PM
By Object
Fund ResourceProjectYear Goal Function Object Value
Total, Certificated Personnel Salaries (Objects 1000-1999) 0.00
Total, Classified Personnel Salaries (Objects 2000-2999) 0.00
Total, Employee Benefits (Objects 3000-3999) 0.00
Total, Books and Supplies (Objects 4000-4999 except 4400) 0.00
Total, Noncapitalized Equipment (Object 4400) 0.00
Total, Services and Other Operating Expenditures (Objects 5000-5999) 0.00
21 9010 0 0000 8500 6100 101,390.0025 0000 0 0000 8500 6100 47,992.50Total, Land (Object 6100) 149,382.50
01 0000 0 1110 8500 6170 676.5501 9010 0 1110 8500 6170 30,691.0414 0000 0 0000 8500 6170 20,118.3621 9010 0 0000 8500 6170 2,565,276.3825 0000 0 0000 8500 6170 66,114.0040 0000 0 0000 8500 6170 415,111.13Total, Land Improvements (Object 6170) 3,097,987.46
14 0000 0 0000 8500 6200 76,325.0021 9010 0 0000 8500 6200 642,774.1425 0000 0 0000 8500 6200 487,605.24Total, Buildings and Improvement of Buildings (Object 6200) 1,206,704.38
Total, Books and Media for New School Libraries (Object 6300) 0.00
01 0000 0 0000 3600 6400 113,203.1901 0000 0 0000 8100 6400 155,905.9701 0000 0 1110 1000 6400 6,044.2001 1100 0 1110 2700 6400 6,506.6401 8150 0 0000 8100 6400 7,006.3109 0000 0 1110 2700 6400 25,171.8913 5310 0 0000 3700 6400 56,300.4213 5380 0 0000 3700 6400 7,222.0014 0000 0 0000 8100 6400 24,848.0040 0000 0 0000 8100 6400 41,522.00Total, Equipment (Object 6400) 443,730.62

Monterey Peninsula UnifiedMonterey County
Unaudited Actuals2016-17 Unaudited Actuals
Conversion from Governmental Funds to Governmental ActivitiesConversion Entry - CE001 Data by Object
27 66092 0000000Report ENTRY
California Dept of EducationSACS Financial Reporting Software - 2017.2.0File: entry (Rev 04/18/2007) Page 2 Printed: 9/6/2017 3:17 PM
By Object
Fund ResourceProjectYear Goal Function Object Value
Total, Equipment Replacement (Object 6500) 0.00
4,897,804.96

Monterey Peninsula UnifiedMonterey County
Unaudited Actuals2016-17 Unaudited Actuals
Conversion from Governmental Funds to Governmental ActivitiesConversion Entry - Detail
27 66092 0000000Report ENTRY
California Dept of EducationSACS Financial Reporting Software - 2017.2.0File: entry (Rev 04/21/2016) Page 1 Printed: 9/6/2017 3:16 PM
Entry CE001 Capital Outlay Expenditures
To eliminate capital outlay expenditures made in governmental funds for acquisition or construction of capital assets, and instead report capital assets on the statement of net position.
Function Extracted Default Conversion User ConversionObject (Resource) Data of Extracted Data Adjustments Entry Account Description
Debit Credit Debit Credit Debit Credit
[see extract] 1000 6,044 - 6,044 6,044 - - Instruction
[see extract] 2100 0 - - - - Instructional Supervision and Administration
[see extract] 2420 0 - - - - Instructional Library, Media and Technology
[see extract] 2700 31,679 - 31,679 31,679 - - School Site Administration
[see extract] 3600 113,203 - 113,203 113,203 - - Home-to-School Transportation
[see extract] 3700 63,522 - 63,522 63,522 - - Food Services
[see extract] 3900 0 - - - - All Other Pupil Services
[see extract] 4000 0 - - - - Ancillary Services
[see extract] 5000 0 - - - - Community Services
[see extract] 6000 0 - - - - Enterprise Activities
[see extract] 7200 0 - - - - All Other General Administration
[see extract] 7700 0 - - - - Centralized Data Processing
[see extract] 8100 229,282 - 229,282 214,449 - 443,731 Plant Services
[see extract] 8500 4,454,074 - 4,454,074 - 4,454,074 Facilities Acquisition and Construction
9410 149,383 - 149,383 - - Land
9420 3,097,987 - 2,517,283 580,704 - Land Improvements
9430 1,206,704 - 642,774 563,930 - Buildings
9440 443,731 - - 443,731 - Equipment
9450 3,309,440 3,309,440 - Work In Progress
TOTALS 4,897,805 4,897,804 3,523,888 3,523,889 4,897,805 4,897,805
Entry CE002 Debt Service Expenditures
To eliminate expenditures for debt service - principal, and instead reduce the related liabilities.
Function Extracted Default Conversion User ConversionObject (Resource) Data of Extracted Data Adjustments Entry Account Description
Debit Credit Debit Credit Debit Credit7432 9100 0 - - - - Debt Service, State School Building Repayment
7433 9100 678,348 - 678,348 - 678,348 Debt Service, Bond Redemptions
7435 9100 0 - - - - Debt Service, Repayment of State School Building Aid Funds - Proceeds From Bonds
7436 9100 0 - - - - Debt Service, Payments to Original District for Acquisition of Property
7439 9100 192,603 - 192,603 - 192,603 Debt Service, Other Debt Service - Principal
9661 678,348 - - 678,348 - General Obligation Bonds Payable
9662 - - - - State School Building Loan Payable
9666 - - COPS Payable
9667 - - Capital Leases Payable
9668 - - Lease Revenue Bonds Payable
9669 192,603 - - 192,603 - Other General Long-Term Debt
TOTALS 870,951 870,951 0 0 870,951 870,951

Monterey Peninsula UnifiedMonterey County
Unaudited Actuals2016-17 Unaudited Actuals
Conversion from Governmental Funds to Governmental ActivitiesConversion Entry - Detail
27 66092 0000000Report ENTRY
California Dept of EducationSACS Financial Reporting Software - 2017.2.0File: entry (Rev 04/21/2016) Page 2 Printed: 9/6/2017 3:16 PM
Entry CE003 Debt Issuance
To eliminate other financing sources, other financing uses, and expenditures relating to the issuance of debt, and instead reflect long-term liabilities, net of discount or premium; prepaid debt insurance costs; and deferred gain or loss on debt refunding.
Function Extracted Default Conversion User ConversionObject (Resource) Data of Extracted Data Adjustments Entry Account description
Debit Credit Debit Credit Debit Credit5400 9100 0 - - - - Debt Service, Insurance5450 9100 0 - - - - Debt Service, Other Insurance7699 9100 32,662,737 - 32,662,737 - 32,662,737 Debt Service, Other Financing Uses
8931 0 - - - - Emergency Apportionments
8951 33,000,000 33,000,000 - 33,000,000 - Proceeds from Sale of Bonds
8961 0 - - - - County School Building Aid
8971 0 - - - - Proceeds from Certificates of Participation8972 0 - - - - Proceeds from Capital Leases
8973 0 - - - - Proceeds from Lease Revenue Bonds
8979 40,513,948 40,513,948 - 40,513,948 - All Other Financing Sources
9330 - - 0 961,211 - 961,211 Prepaid Expense
9490 - - Deferred Outflows of Resources
9661 - 33,000,000 6,890,000 - 39,890,000 General Obligation Bonds Payable
9662 - - State School Building Loan Payable
9666 - - - - COPS Payable
9667 - - - - Capital Leases Payable
9668 - - - - Lease Revenue Bonds Payable
9669 - 7,851,211 7,851,211 - - Other General Long-Term Debt
9690 - - Deferred Inflows of Resources
TOTALS 73,513,948 73,513,948 7,851,211 7,851,211 73,513,948 73,513,948
Entry CE004 Donated and Contributed Capital Assets
To recognize donations or contributions of capital assets, not reported within governmental funds but reported in the government-wide statements, at market value on the date of donation.
Function Extracted Default Conversion User ConversionObject (Resource) Data of Extracted Data Adjustments Entry Account Description
Debit Credit Debit Credit Debit Credit
8699 (0000-1999) - - Local Revenues (General Revenues)8699 (2000-9999) - - Local Revenues (Program Revenues)
9410 - - Land
9420 - - Land Improvements
9430 - - Buildings
9440 - - Equipment
9450 - - Work In Progress
TOTALS 0 0 0 0
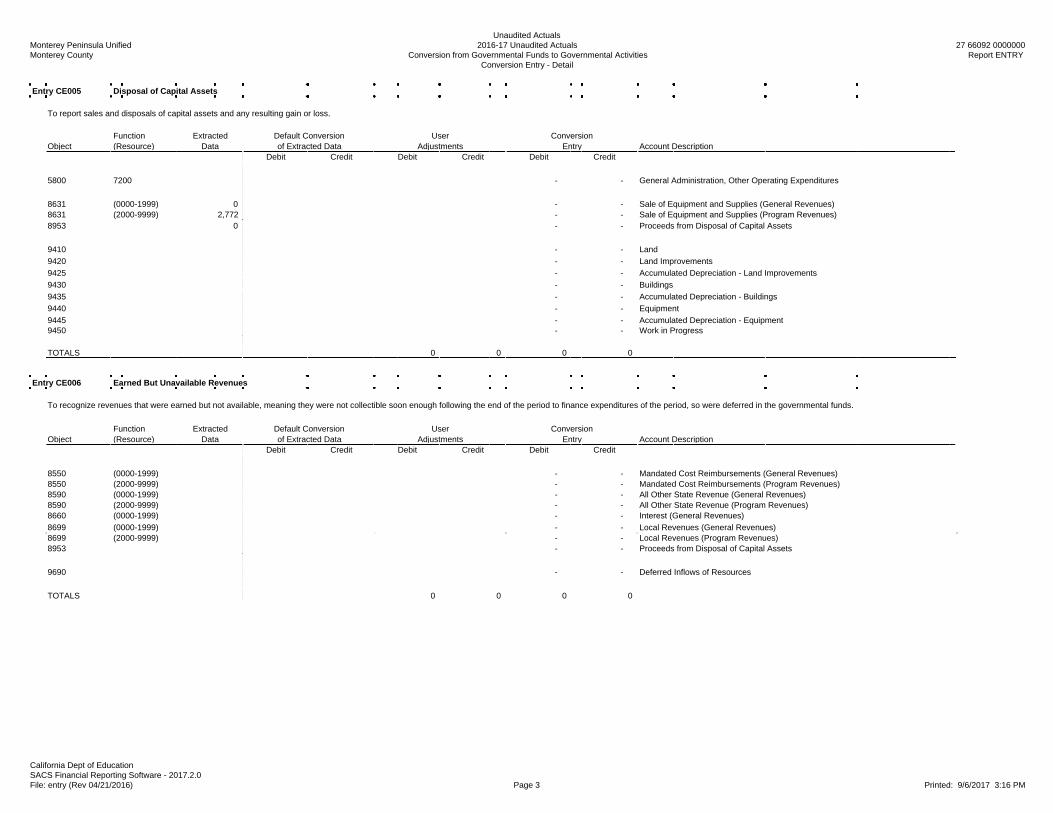
Monterey Peninsula UnifiedMonterey County
Unaudited Actuals2016-17 Unaudited Actuals
Conversion from Governmental Funds to Governmental ActivitiesConversion Entry - Detail
27 66092 0000000Report ENTRY
California Dept of EducationSACS Financial Reporting Software - 2017.2.0File: entry (Rev 04/21/2016) Page 3 Printed: 9/6/2017 3:16 PM
Entry CE005 Disposal of Capital Assets
To report sales and disposals of capital assets and any resulting gain or loss.
Function Extracted Default Conversion User ConversionObject (Resource) Data of Extracted Data Adjustments Entry Account Description
Debit Credit Debit Credit Debit Credit
5800 7200 - - General Administration, Other Operating Expenditures
8631 (0000-1999) 0 - - Sale of Equipment and Supplies (General Revenues)8631 (2000-9999) 2,772 - - Sale of Equipment and Supplies (Program Revenues)8953 0 - - Proceeds from Disposal of Capital Assets
9410 - - Land
9420 - - Land Improvements
9425 - - Accumulated Depreciation - Land Improvements
9430 - - Buildings
9435 - - Accumulated Depreciation - Buildings
9440 - - Equipment
9445 - - Accumulated Depreciation - Equipment9450 - - Work in Progress
TOTALS 0 0 0 0
Entry CE006 Earned But Unavailable Revenues
To recognize revenues that were earned but not available, meaning they were not collectible soon enough following the end of the period to finance expenditures of the period, so were deferred in the governmental funds.
Function Extracted Default Conversion User ConversionObject (Resource) Data of Extracted Data Adjustments Entry Account Description
Debit Credit Debit Credit Debit Credit
8550 (0000-1999) - - Mandated Cost Reimbursements (General Revenues)8550 (2000-9999) - - Mandated Cost Reimbursements (Program Revenues)8590 (0000-1999) - - All Other State Revenue (General Revenues)8590 (2000-9999) - - All Other State Revenue (Program Revenues)8660 (0000-1999) - - Interest (General Revenues)
8699 (0000-1999) - - Local Revenues (General Revenues)8699 (2000-9999) - - Local Revenues (Program Revenues)8953 - - Proceeds from Disposal of Capital Assets
9690 - - Deferred Inflows of Resources
TOTALS 0 0 0 0

Monterey Peninsula UnifiedMonterey County
Unaudited Actuals2016-17 Unaudited Actuals
Conversion from Governmental Funds to Governmental ActivitiesConversion Entry - Detail
27 66092 0000000Report ENTRY
California Dept of EducationSACS Financial Reporting Software - 2017.2.0File: entry (Rev 04/21/2016) Page 4 Printed: 9/6/2017 3:16 PM
Entry CE007 Elimination of Revenues Relating to Prior Periods
To eliminate certain revenues and unavailable revenues that were recognized in the government-wide statements in a prior period, but that were reported in governmental funds in the current period.
Function Extracted Default Conversion User ConversionObject (Resource) Data of Extracted Data Adjustments Entry Account Description
Debit Credit Debit Credit Debit Credit
8550 (0000-1999) - - Mandated Cost Reimbursements (General Revenues)8550 (2000-9999) - - Mandated Cost Reimbursements (Program Revenues)8590 (0000-1999) - - All Other State Revenue (General Revenues)8590 (2000-9999) - - All Other State Revenue (Program Revenues)8660 (0000-1999) - - Interest (General Revenues)
8699 (0000-1999) - - Local Revenues (General Revenues)8699 (2000-9999) - - Local Revenues (Program Revenues)8953 - - Proceeds from Disposal of Capital Assets
9690 - - Deferred Inflows of Resources979Z - - - - Fund Balance/Net Position
TOTALS 0 0 0 0
Entry CE008 Liability for Unmatured Interest on Long-Term Debt
In governmental funds, unmatured interest on long-term debt is recognized in the period when it is due. On the government-wide statements, unmatured interest on long-term debt is recognized when it is incurred.
Function Extracted Default Conversion User ConversionObject (Resource) Data of Extracted Data Adjustments Entry Account Description
Debit Credit Debit Credit Debit Credit
7434 9100 2,403,218 2,403,218 - Debt Service, Bond Interest and Other Service Charges
7438 9100 - - Debt Service, Debt Service - Interest
9500 2,403,218 - 2,403,218 Accounts Payable
9661 - - General Obligation Bonds Payable
TOTALS 2,403,218 2,403,218 2,403,218 2,403,218
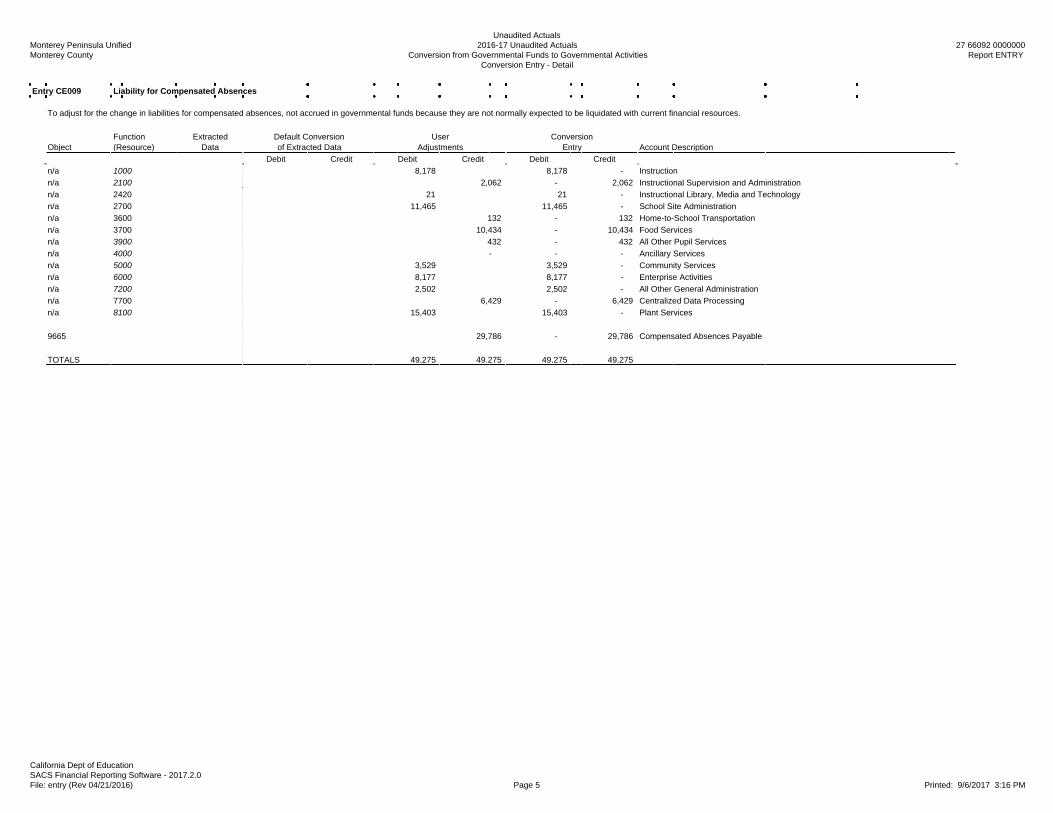
Monterey Peninsula UnifiedMonterey County
Unaudited Actuals2016-17 Unaudited Actuals
Conversion from Governmental Funds to Governmental ActivitiesConversion Entry - Detail
27 66092 0000000Report ENTRY
California Dept of EducationSACS Financial Reporting Software - 2017.2.0File: entry (Rev 04/21/2016) Page 5 Printed: 9/6/2017 3:16 PM
Entry CE009 Liability for Compensated Absences
To adjust for the change in liabilities for compensated absences, not accrued in governmental funds because they are not normally expected to be liquidated with current financial resources.
Function Extracted Default Conversion User ConversionObject (Resource) Data of Extracted Data Adjustments Entry Account Description
Debit Credit Debit Credit Debit Credit
n/a 1000 8,178 8,178 - Instruction
n/a 2100 2,062 - 2,062 Instructional Supervision and Administration
n/a 2420 21 21 - Instructional Library, Media and Technology
n/a 2700 11,465 11,465 - School Site Administration
n/a 3600 132 - 132 Home-to-School Transportation
n/a 3700 10,434 - 10,434 Food Services
n/a 3900 432 - 432 All Other Pupil Services
n/a 4000 - - - Ancillary Services
n/a 5000 3,529 3,529 - Community Services
n/a 6000 8,177 8,177 - Enterprise Activities
n/a 7200 2,502 2,502 - All Other General Administration
n/a 7700 6,429 - 6,429 Centralized Data Processing
n/a 8100 15,403 15,403 - Plant Services
9665 29,786 - 29,786 Compensated Absences Payable
TOTALS 49,275 49,275 49,275 49,275

Monterey Peninsula UnifiedMonterey County
Unaudited Actuals2016-17 Unaudited Actuals
Conversion from Governmental Funds to Governmental ActivitiesConversion Entry - Detail
27 66092 0000000Report ENTRY
California Dept of EducationSACS Financial Reporting Software - 2017.2.0File: entry (Rev 04/21/2016) Page 6 Printed: 9/6/2017 3:16 PM
Entry CE010 Expenditures Relating to Prior Periods
To eliminate expenditures in governmental funds relating to a prior period that were not recognized in the prior period because they did not involve the use of current financial resources. Typical examples are interest on long term debt that maturedand was paid in the current period, payments on structured legal settlements or revenue repayment plans, and retirement incentives paid over time.
Function Extracted Default Conversion User ConversionObject (Resource) Data of Extracted Data Adjustments Entry Account Description
Debit Credit Debit Credit Debit Creditn/a 1000 - - Instructionn/a 2100 - - Instructional Supervision and Administrationn/a 2420 - - Instructional Library, Media and Technologyn/a 2700 - - School Site Administrationn/a 3600 - - Home-to-School Transportationn/a 3700 - - Food Servicesn/a 3900 - - All Other Pupil Servicesn/a 4000 - - Ancillary Servicesn/a 5000 - - Community Servicesn/a 6000 - - Enterprise Activitiesn/a 7200 - - All Other General Administrationn/a 7700 - - Centralized Data Processingn/a 8100 - - Plant Services7434 9100 766,359 - 766,359 Debt Service, Bond Interest and Other Charges
7438 9100 - - Debt Service, Debt Service - Interest8XXX [ranges per Fund Consolidation] - - General Revenues: Federal and State Aid Not Restricted to Specific Purposes8XXX [ranges per Fund Consolidation] - - General Revenues: Interagency Revenue8XXX [ranges per Fund Consolidation] - - General Revenues: Miscellaneous8XXX [ranges per Fund Consolidation] - - Program Revenues: Charges for Services8XXX [ranges per Fund Consolidation] - - Program Revenues: Operating Grants and Contributions8XXX [ranges per Fund Consolidation] - - Program Revenues: Capital Grants and Contributions
9669 - - Other General Long-Term Debt979Z 766,359 766,359 - Fund Balance/Net Position
TOTALS 766,359 766,359 766,359 766,359
Entry CE011 Adjustments to Work in Progress
To adjust the Work in Progress account for previously capitalized projects now completed, or to write off previously capitalized planning costs for canceled projects that will not be completed.
Function Extracted Default Conversion User ConversionObject (Resource) Data of Extracted Data Adjustments Entry Account Description
Debit Credit Debit Credit Debit Credit
7200 - - All Other General Administration
9410 - - Land
9420 3,190,111 3,190,111 - Land Improvements
9430 35,298 35,298 - Buildings
9440 - - Equipment
9450 3,225,409 - 3,225,409 Work in Progress
TOTALS 3,225,409 3,225,409 3,225,409 3,225,409

Monterey Peninsula UnifiedMonterey County
Unaudited Actuals2016-17 Unaudited Actuals
Conversion from Governmental Funds to Governmental ActivitiesConversion Entry - Detail
27 66092 0000000Report ENTRY
California Dept of EducationSACS Financial Reporting Software - 2017.2.0File: entry (Rev 04/21/2016) Page 7 Printed: 9/6/2017 3:16 PM
Entry CE012 Depreciation
To recognize the current year depreciation or permanent impairment of capital assets and adjust the related contra-asset accounts for accumulated depreciation.
Function Extracted Default Conversion User ConversionObject (Resource) Data of Extracted Data Adjustments Entry Account Description
Debit Credit Debit Credit Debit Credit
6900 1000 419,092 419,092 - Instruction
6900 2100 - - Instructional Supervision and Administration6900 2420 52,473 52,473 - Instructional Library, Media and Technology
6900 2700 14,569 14,569 - School Site Administration
6900 3600 173,457 173,457 - Home-to-School Transportation
6900 3700 42,669 42,669 - Food Services
6900 3900 - - All Other Pupil Services
6900 4000 863 863 - Ancillary Services
6900 5000 - - Community Services
6900 6000 - - Enterprise Activities
6900 7200 71,304 71,304 - All Other General Administration
6900 7700 5,533 5,533 - Centralized Data Processing6900 8100 4,217,316 4,217,316 - Plant Services
6900 0000 - - Depreciation (Unallocated)
9425 334,862 - 334,862 Accumulated Depreciation - Land Improvements
9435 4,247,979 - 4,247,979 Accumulated Depreciation - Buildings
9445 414,435 - 414,435 Accumulated Depreciation - Equipment
TOTALS 4,997,276 4,997,276 4,997,276 4,997,276
Entry CE013 Amortization
To recognize amortization of debt issue premiums or discounts, deferred gain or loss on debt refunding, and prepaid debt insurance costs.
Function Extracted Default Conversion User ConversionObject (Resource) Data of Extracted Data Adjustments Entry Account Description
Debit Credit Debit Credit Debit Credit
5400 9100 - - Debt Service, Insurance 7434 9100 - - Debt Service, Bond Interest and Other Service Charges
7438 9100 292,137 1,157,167 - 865,030 Debt Service, Debt Service - Interest
9330 - - Prepaid Expense
9490 - - Deferred Outflows of Resources9661 - - General Obligation Bonds Payable9662 - - State School Building Loan Payable9666 - - COPS Payable9667 - - Capital Leases Payable9668 - - Lease Revenue Bonds Payable9669 1,157,167 292,137 865,030 - Other General Long-Term Debt9690 - - Deferred Inflows of Resources
TOTALS 1,449,304 1,449,304 865,030 865,030

Monterey Peninsula UnifiedMonterey County
Unaudited Actuals2016-17 Unaudited Actuals
Conversion from Governmental Funds to Governmental ActivitiesConversion Entry - Detail
27 66092 0000000Report ENTRY
California Dept of EducationSACS Financial Reporting Software - 2017.2.0File: entry (Rev 04/21/2016) Page 8 Printed: 9/6/2017 3:16 PM
Entry CE014 Incorporation of Assets, Deferred Outflows of Resources, Liabilities, and Deferred Inflows of Resources of Internal Service Funds
To incorporate assets, deferred outflows of resources, liabilities, and deferred inflows of resources of internal service funds, which primarily serve governmental funds, with those of governmental funds for purposes of government-wide reporting.
Function Extracted Default Conversion User ConversionObject (Resource) Data of Extracted Data Adjustments Entry Account Description
Debit Credit Debit Credit Debit Credit
9110 3,562,318 3,562,318 - 3,562,318 - Cash in County Treasury
9111 0 - - - - Fair Value Adjustment to Cash in County Treasury9120 0 - - - - Cash In Banks
9130 0 - - - - Revolving Cash Account
9135 284,666 284,666 - 284,666 - Cash with a Fiscal Agent/Trustee
9140 1,336,154 1,336,154 - 1,336,154 - Cash Collections Awaiting Deposit
9150 0 - - - - Investments
9200 75,131 75,131 - 75,131 - Accounts Receivable
9310 734,084 734,084 - 734,084 - Due from Other Funds
9320 0 - - - - Stores
9330 0 - - - - Prepaid Expenditures (Expenses)
9340 0 - - - - Other Current Assets
9410 0 - - - - Land
9420 0 - - - - Land Improvements
9425 0 - - - - Accumulated Depreciation-Land Improvements
9430 0 - - - - Buildings
9435 0 - - - - Accumulated Depreciation-Buildings
9440 0 - - - - Equipment
9445 0 - - - - Accumulated Depreciation-Equipment
9450 0 - - - - Work in Progress9490 - - Deferred Outflows of Resources - pensions only9490 0 - - - - Deferred Outflows of Resources - other
9500 18,866 - 18,866 - 18,866 Accounts Payable
9610 0 - - - - Due to Other Funds
9650 0 - - - - Unearned Revenue9663 0 - - - - Net Pension Liability (Asset)9664 0 - - - - Net OPEB Obligation
9665 0 - - - - Compensated Absences Payable
9666 0 - - - - COPs Payable
9667 0 - - - - Capital Leases Payable
9668 0 - - - - Lease Revenue Bonds Payable
9669 0 - - - - Other General Long-Term Debt9690 - - Deferred Inflows of Resources - pensions only9690 0 - - - - Deferred Inflows of Resources - other
979Z - 5,973,487 - 5,973,487 Fund Balance/Net Position
TOTALS 5,992,353 5,992,353 0 0 5,992,353 5,992,353
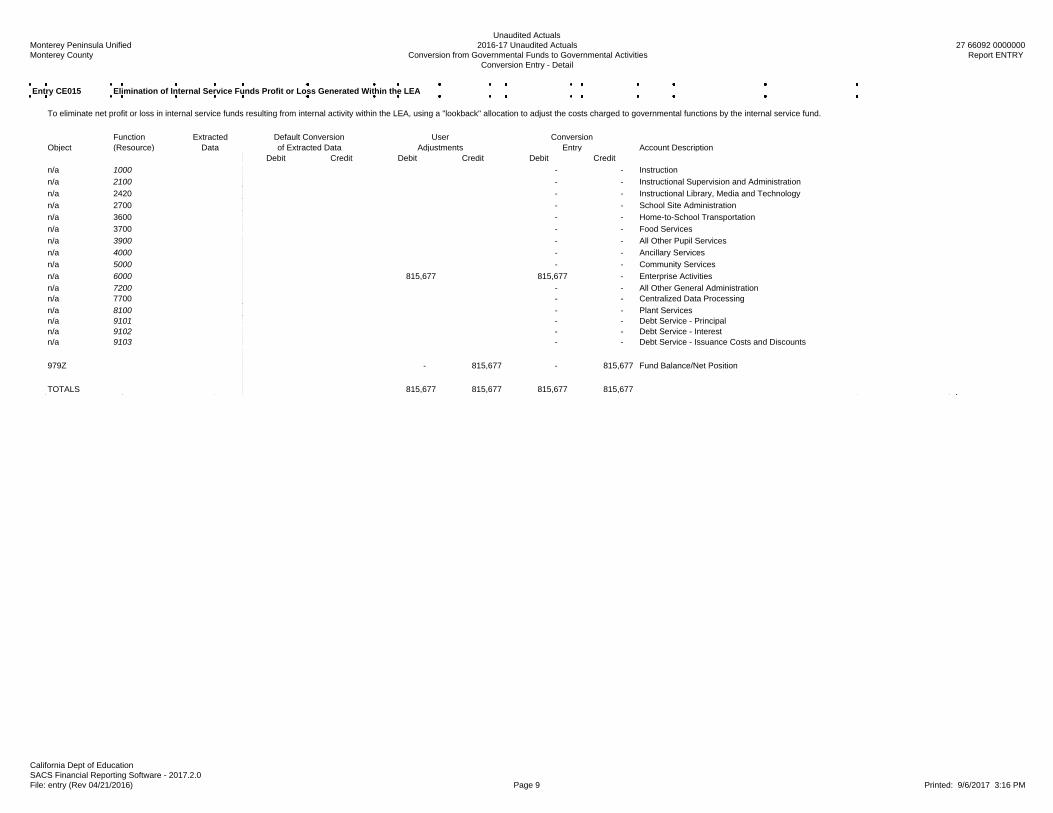
Monterey Peninsula UnifiedMonterey County
Unaudited Actuals2016-17 Unaudited Actuals
Conversion from Governmental Funds to Governmental ActivitiesConversion Entry - Detail
27 66092 0000000Report ENTRY
California Dept of EducationSACS Financial Reporting Software - 2017.2.0File: entry (Rev 04/21/2016) Page 9 Printed: 9/6/2017 3:16 PM
Entry CE015 Elimination of Internal Service Funds Profit or Loss Generated Within the LEA
To eliminate net profit or loss in internal service funds resulting from internal activity within the LEA, using a "lookback" allocation to adjust the costs charged to governmental functions by the internal service fund.
Function Extracted Default Conversion User ConversionObject (Resource) Data of Extracted Data Adjustments Entry Account Description
Debit Credit Debit Credit Debit Credit
n/a 1000 - - Instruction
n/a 2100 - - Instructional Supervision and Administration
n/a 2420 - - Instructional Library, Media and Technology
n/a 2700 - - School Site Administration
n/a 3600 - - Home-to-School Transportation
n/a 3700 - - Food Services
n/a 3900 - - All Other Pupil Services
n/a 4000 - - Ancillary Services
n/a 5000 - - Community Services
n/a 6000 815,677 815,677 - Enterprise Activities
n/a 7200 - - All Other General Administrationn/a 7700 - - Centralized Data Processing
n/a 8100 - - Plant Services n/a 9101 - - Debt Service - Principaln/a 9102 - - Debt Service - Interestn/a 9103 - - Debt Service - Issuance Costs and Discounts
979Z - 815,677 - 815,677 Fund Balance/Net Position
TOTALS 815,677 815,677 815,677 815,677

Monterey Peninsula UnifiedMonterey County
Unaudited Actuals2016-17 Unaudited Actuals
Conversion from Governmental Funds to Governmental ActivitiesConversion Entry - Detail
27 66092 0000000Report ENTRY
California Dept of EducationSACS Financial Reporting Software - 2017.2.0File: entry (Rev 04/21/2016) Page 10 Printed: 9/6/2017 3:16 PM
Entry CE016 Incorporation of Internal Service Fund External Activities and Interfund Transfers
To include that portion of internal service fund revenues, expenses and net profit generated by parties outside the LEA, and any interfund transfers within the LEA.
Function Extracted Default Conversion User ConversionObject (Resource) Data of Extracted Data Adjustments Entry Account Description
Debit Credit Debit Credit Debit Credit
n/a 6000 - - Enterprise Activities
n/a 9200 - - Transfers Between Agencies
7619 9300 0 - - - - Interfund Transfers, Other Authorized Transfers Out 8631 (0000-1999) - - Sale of Equipment and Supplies (General Revenues)8631 (2000-9999) - - Sale of Equipment and Supplies (Program Revenues)
8639 (0000-1999) - - All Other Sales (General Revenues)8639 (2000-9999) - - All Other Sales (Program Revenues)
8660 (0000-1999) - - Interest (General Revenues)8660 (2000-9999) - - Interest (Program Revenues)8662 (0000-1999) - - Net Increase (Decrease) in the Fair Value of Investments (General Revenues)8662 (2000-9999) - - Net Increase (Decrease) in the Fair Value of Investments (Program Revenues)
8689 (0000-1999) - - Fees and Contracts (General Revenues)8689 (2000-9999) - - Fees and Contracts (Program Revenues)
8699 (0000-1999) - - Other Local Revenue (General Revenues)8699 (2000-9999) - - Other Local Revenue (Program Revenues)
8799 (0000-1999) - - Other Transfers In from All Others (General Revenues)8799 (2000-9999) - - Other Transfers In from All Others (Program Revenues)8919 734,084 - 734,084 - 734,084 Interfund Transfers, Other Authorized Transfers In 8965 - - Transfers From Funds of Lapsed/Reorganized Districts
979Z 734,084 - - - 734,084 - Fund Balance/Net Position
TOTALS 0 0 734,084 734,084

Monterey Peninsula UnifiedMonterey County
Unaudited Actuals2016-17 Unaudited Actuals
Conversion from Governmental Funds to Governmental ActivitiesConversion Entry - Detail
27 66092 0000000Report ENTRY
California Dept of EducationSACS Financial Reporting Software - 2017.2.0File: entry (Rev 04/21/2016) Page 11 Printed: 9/6/2017 3:16 PM
Entry CE017 Reclassification of Interfund Transfers Involving Fiduciary Funds
To reclassify interfund transfers involving fiduciary funds as transactions with external parties, rather than internal transactions. Note: Entry CE017 must be completed and saved before preparing Entry CE019.
Function Extracted Default Conversion User ConversionObject (Resource) Data of Extracted Data Adjustments Entry Account Description
Debit Credit Debit Credit Debit Credit
Governmental Funds (Funds 01-60)
7299 9200 - - - - Transfers Between Agencies, All Other Transfers to All Others
7619 9300 739,390 - - - - Interfund Transfers, Other Authorized Interfund Transfers Out
8799 (0000-1999) - - - - Other Transfers In from All Others (General Revenues)8799 (2000-9999) - - Other Transfers In from All Others (Program Revenues)8919 17,419 - - - - Interfund Transfers, Other Authorized Interfund Transfers In
Proprietary Funds:Enterprise Funds (Funds 61-65)
7299 9200 - - Transfers Between Agencies, All Other Transfers to All Others7619 9300 17,419 - - Interfund Transfers, Other Authorized Interfund Transfers Out
8799 (0000-1999) - - Other Transfers In from All Others (General Revenues)8799 (2000-9999) - - Other Transfers In from All Others (Program Revenues)8919 5,306 - - Interfund Transfers, Other Authorized Interfund Transfers In
Proprietary Funds:Internal Service Funds (Funds 66-70)
7299 9200 - - Transfers Between Agencies, All Other Transfers to All Others7619 9300 0 - - Interfund Transfers, Other Authorized Interfund Transfers Out
8799 (0000-1999) - - Other Transfers In from All Others (General Revenues)8799 (2000-9999) - - Other Transfers In from All Others (Program Revenues)8919 734,084 - - Interfund Transfers, Other Authorized Interfund Transfers In
Fiduciary Funds (Funds 71-95)7299 9200 - - - - Transfers Between Agencies, All Other Transfers to All Others7619 9300 0 - - - - Interfund Transfers, Other Authorized Interfund Transfers Out
8799 - - - - Other Transfers In from All Others 8919 0 - - - - Interfund Transfers, Other Authorized Interfund Transfers In
TOTALS 0 0 0 0 0 0

Monterey Peninsula UnifiedMonterey County
Unaudited Actuals2016-17 Unaudited Actuals
Conversion from Governmental Funds to Governmental ActivitiesConversion Entry - Detail
27 66092 0000000Report ENTRY
California Dept of EducationSACS Financial Reporting Software - 2017.2.0File: entry (Rev 04/21/2016) Page 12 Printed: 9/6/2017 3:16 PM
Entry CE018 Reclassification of Interfund Balances Involving Fiduciary Funds
To reclassify Interfund balances involving fiduciary funds as balances due to or due from external parties, rather than internal transactions. Note: Entry CE018 must be completed and saved before preparing Entry CE020.
Function Extracted Default Conversion User ConversionObject (Resource) Data of Extracted Data Adjustments Entry Account Description
Debit Credit Debit Credit Debit Credit
Governmental Funds (Funds 01-60)
9200 - - - - Accounts Receivable
9310 300,383 - - - - Due from Other Funds9500 - - - - Accounts Payable9610 1,022,354 - - - - Due to Other Funds
Proprietary Funds:Enterprise Funds (Funds 61-65)
9200 - - Accounts Receivable9310 5,306 - - Due from Other Funds
9500 - - Accounts Payable9610 17,419 - - Due to Other Funds
Proprietary Funds:Internal Service Funds (Funds 66-70)
9200 - - Accounts Receivable9310 734,084 - - Due from Other Funds
9500 - - Accounts Payable9610 0 - - Due to Other Funds
Fiduciary Funds (Funds 71-95)
9200 - - - - Accounts Receivable9310 0 - - - - Due from Other Funds
9500 - - - - Accounts Payable9610 0 - - - - Due to Other Funds
TOTALS 0 0 0 0 0 0

Monterey Peninsula UnifiedMonterey County
Unaudited Actuals2016-17 Unaudited Actuals
Conversion from Governmental Funds to Governmental ActivitiesConversion Entry - Detail
27 66092 0000000Report ENTRY
California Dept of EducationSACS Financial Reporting Software - 2017.2.0File: entry (Rev 04/21/2016) Page 13 Printed: 9/6/2017 3:16 PM
Entry CE019 Elimination of Internal Transfers
To eliminate interfund transfers among governmental and internal service funds consolidated in the government-wide statement of activities. Note: Entry CE017 must be completed and saved before preparing Entry CE019.
Function Extracted Data, Default Conversion User ConversionObject (Resource) net of CE017 of Extracted Data Adjustments Entry Account Description
Debit Credit Debit Credit Debit CreditGovernmental Funds (Funds 01-60)
7611 9300 2,171 - 2,171 - 2,171 Interfund Transfers, From General Fund to Child Development Fund
7612 9300 0 - - - - Interfund Transfers, Between General Fund and Special Reserve Fund7613 9300 0 - - - - Interfund Transfers, To State School Building Fund/County School Facility Fund7614 9300 0 - - - - Interfund Transfers, From Bond Interest and Redemption Fund to the General Fund
7615 9300 0 - - - -Interfund Transfers, From General, Special Reserve, and Building Funds to DeferredMaintenance Fund
7616 9300 300 - 300 - 300 Interfund Transfers, From General Fund to Cafeteria Fund7619 9300 739,390 - 734,084 - 734,084 Interfund Transfers, Other Authorized Interfund Transfers Out
8911 2,171 2,171 - 2,171 - Interfund Transfers, To Child Development Fund from General Fund8912 0 - - - - Interfund Transfers, Between General Fund and Special Reserve Fund
8913 0 - - - -Interfund Transfers, To State School Building Fund/County School Facility Fund fromAll Other Funds
8914 0 - - - - Interfund Transfers, To General Fund From Bond Interest and Redemption Fund
8915 0 - - - -Interfund Transfers, To Deferred Maintenance Fund From General, Special Reserve,and Building Funds
8916 300 300 - 300 - Interfund Transfers, To Cafeteria Fund From General Fund8919 17,419 - - - - Interfund Transfers, Other Authorized Interfund Transfers In
Proprietary Funds:Enterprise Funds (Funds 61-65)7619 9300 17,419 Interfund Transfers, Other Authorized Interfund Transfers Out
8916 0 Interfund Transfers, To Cafeteria Fund From General Fund 8919 5,306 Interfund Transfers, Other Authorized Interfund Transfers InProprietary Funds:Internal Service Funds (Funds 66-70)7619 9300 0 - - - - Interfund Transfers, Other Authorized Interfund Transfers Out
8919 734,084 734,084 - 734,084 - Interfund Transfers, Other Authorized Interfund Transfers InFiduciary Funds (Funds 71-95)7619 9300 0 Interfund Transfers, Other Authorized Interfund Transfers Out
8919 0 Interfund Transfers, Other Authorized Interfund Transfers InTOTALS 736,555 736,555 0 0 736,555 736,555

Monterey Peninsula UnifiedMonterey County
Unaudited Actuals2016-17 Unaudited Actuals
Conversion from Governmental Funds to Governmental ActivitiesConversion Entry - Detail
27 66092 0000000Report ENTRY
California Dept of EducationSACS Financial Reporting Software - 2017.2.0File: entry (Rev 04/21/2016) Page 14 Printed: 9/6/2017 3:16 PM
Entry CE020 Elimination of Internal Balances
To eliminate internal balances among governmental and internal service funds for consolidation in the government-wide statement of activities. Note: Entry CE018 must be completed and saved before preparing Entry CE020.
Function Extracted Data, Default Conversion User ConversionObject (Resource) net of CE018 of Extracted Data Adjustments Entry Account Description
Debit Credit Debit Credit Debit CreditGovernmental Funds (Funds 01-60)
9310 300,383 - 282,964 - 282,964 Due From Other Funds
9610 1,022,354 1,017,048 - 1,017,048 - Due To Other Funds
Proprietary Funds:Enterprise Funds (Funds 61-65)
9310 5,306 Due From Other Funds
9610 17,419 Due To Other Funds
Proprietary Funds:Internal Service Funds (Funds 66-70)
9310 734,084 - 734,084 - 734,084 Due From Other Funds
9610 0 - - - - Due To Other Funds
Fiduciary Funds (Funds 71-95)
9310 0 Due From Other Funds
9610 0 Due To Other Funds
TOTALS 1,017,048 1,017,048 0 0 1,017,048 1,017,048
Entry CE021 Postemployment Benefits Other Than Pensions (OPEB)
To recognize any difference between OPEB costs as defined by generally accepted accounting principles, and amounts actually contributed.
Function Extracted Default Conversion User ConversionObject (Resource) Data of Extracted Data Adjustments Entry Account Description
Debit Credit Debit Credit Debit Creditn/a 1000 570,762 570,762 - Instructionn/a 2100 8,998 8,998 - Instructional Supervision and Administrationn/a 2420 36,330 36,330 - Instructional Library, Media and Technologyn/a 2700 86,927 86,927 - School Site Administrationn/a 3600 61,548 61,548 - Home-to-School Transportationn/a 3700 25,908 25,908 - Food Servicesn/a 3900 14,858 14,858 - All Other Pupil Servicesn/a 4000 2,000 2,000 - Ancillary Servicesn/a 5000 1,809 1,809 - Community Servicesn/a 6000 2,964 2,964 - Enterprise Activitiesn/a 7200 40,175 40,175 - All Other General Administrationn/a 7700 3,983 3,983 - Centralized Data Processingn/a 8100 70,986 70,986 - Plant Services
9664 927,248 - 927,248 Net OPEB Obligation
TOTALS 927,248 927,248 927,248 927,248

Monterey Peninsula UnifiedMonterey County
Unaudited Actuals2016-17 Unaudited Actuals
Conversion from Governmental Funds to Governmental ActivitiesConversion Entry - Detail
27 66092 0000000Report ENTRY
California Dept of EducationSACS Financial Reporting Software - 2017.2.0File: entry (Rev 04/21/2016) Page 15 Printed: 9/6/2017 3:16 PM
Entry CE022 Other Liabilities Not Normally Liquidated with Current Financial Resources
To accrue expenses and liabilities for obligations incurred during the year that will not be liquidated with current financial resources, other than compensated absences, long-term debt, OPEB, and pensions. Examples include special terminationbenefits such as retirement incentives financed over time, and structured legal settlements.
Function Extracted Default Conversion User ConversionObject (Resource) Data of Extracted Data Adjustments Entry Account Description
Debit Credit Debit Credit Debit Creditn/a 1000 5,402 - 5,402 Instructionn/a 2100 - - Instructional Supervision and Administrationn/a 2420 - - Instructional Library, Media and Technologyn/a 2700 - - School Site Administrationn/a 3600 - - Home-to-School Transportationn/a 3700 - - Food Servicesn/a 3900 - - All Other Pupil Servicesn/a 4000 - - Ancillary Servicesn/a 5000 - - Community Servicesn/a 6000 - - Enterprise Activitiesn/a 7200 - - All Other General Administrationn/a 7700 - - Centralized Data Processingn/a 8100 - - Plant Services8XXX [ranges per Fund Consolidation] - - General Revenues: Federal and State Aid Not Restricted to Specific Purposes8XXX [ranges per Fund Consolidation] - - General Revenues: Interagency Revenue8XXX [ranges per Fund Consolidation] - - General Revenues: Miscellaneous8XXX [ranges per Fund Consolidation] - - Program Revenues: Charges for Services8XXX [ranges per Fund Consolidation] - - Program Revenues: Operating Grants and Contributions8XXX [ranges per Fund Consolidation] - - Program Revenues: Capital Grants and Contributions
9669 5,402 5,402 - Other General Long-Term Debt
TOTALS 5,402 5,402 5,402 5,402

Monterey Peninsula UnifiedMonterey County
Unaudited Actuals2016-17 Unaudited Actuals
Conversion from Governmental Funds to Governmental ActivitiesConversion Entry - Detail
27 66092 0000000Report ENTRY
California Dept of EducationSACS Financial Reporting Software - 2017.2.0File: entry (Rev 04/21/2016) Page 16 Printed: 9/6/2017 3:16 PM
Entry CE023 Employer's Net Pension Liability and Pension Expense
To adjust for the LEA's share of the change in net pension liabilities; and to recognize pension expense, deferred outflows of resources relating to pensions, and deferred inflows of resources relating to pensions.
Function Extracted Default Conversion User ConversionObject (Resource) Data of Extracted Data Adjustments Entry Account Description
Debit Credit Debit Credit Debit Credit
n/a 1000 2,181,925 2,181,925 - Instruction
n/a 2100 153,241 153,241 - Instructional Supervision and Administrationn/a 2420 37,145 37,145 - Instructional Library, Media and Technologyn/a 2700 428,831 428,831 - School Site Administrationn/a 3600 128,925 128,925 - Home-to-School Transportationn/a 3700 121,185 121,185 - Food Servicesn/a 3900 227,782 227,782 - All Other Pupil Servicesn/a 4000 10,259 10,259 - Ancillary Servicesn/a 5000 10,382 10,382 - Community Servicesn/a 6000 15,143 15,143 - Enterprise Activitiesn/a 7200 243,707 243,707 - All Other General Administrationn/a 7700 41,570 41,570 - Centralized Data Processingn/a 8100 385,497 385,497 - Plant Services
9490 12,673,279 12,673,279 - Deferred Outflows of Resources - pensions only9663 22,929,788 - 22,929,788 Net Pension Liability (Asset)9690 6,270,917 6,270,917 - Deferred Inflows of Resources - pensions only
TOTALS 22,929,788 22,929,788 22,929,788 22,929,788
Entry CE024 Employer Pension Contributions Made Subsequent to Measurement Date
To adjust for employer pension contribution expenditures made by the LEA subsequent to the pension plan measurement date.
Function Extracted Default Conversion User Conversion
Object (Resource) Data of Extracted Data Adjustments Entry Account Description
Debit Credit Debit Credit Debit Credit
3100-3299 1000 5,858,373 - 5,858,373 5,858,373 1,182,876 - 1,182,876 Instruction
3100-3299 2100 401,384 - 401,384 401,384 78,957 - 78,957 Instructional Supervision and Administration
3100-3299 2420 66,290 - 66,290 66,290 13,840 - 13,840 Instructional Library, Media and Technology
3100-3299 2700 949,177 - 949,177 949,177 194,070 - 194,070 School Site Administration
3100-3299 3600 203,244 - 203,244 203,244 46,844 - 46,844 Home-to-School Transportation
3100-3299 3700 198,658 - 198,658 198,658 44,033 - 44,033 Food Services
3100-3299 3900 510,913 - 510,913 510,913 106,434 - 106,434 All Other Pupil Services
3100-3299 4000 31,644 - 31,644 31,644 6,085 - 6,085 Ancillary Services
3100-3299 5000 18,113 - 18,113 18,113 3,773 - 3,773 Community Services
3100-3299 6000 0 - - 5,601 - 5,601 Enterprise Activities
3100-3299 7200 479,933 - 479,933 479,933 100,484 - 100,484 All Other General Administration
3100-3299 7700 60,969 - 60,969 60,969 15,203 - 15,203 Centralized Data Processing
3100-3299 8100 662,437 - 662,437 662,437 141,050 - 141,050 Plant Services
9490 9,441,135 - 1,939,250 9,441,135 1,939,250 - Deferred Outflows of Resources - pensions only
TOTALS 9,441,135 9,441,135 9,441,135 11,380,385 11,380,385 1,939,250 1,939,250

Monterey Peninsula UnifiedMonterey County
Unaudited Actuals2016-17 Unaudited Actuals
Conversion from Governmental Funds to Governmental ActivitiesConversion Entry - Detail
27 66092 0000000Report ENTRY
California Dept of EducationSACS Financial Reporting Software - 2017.2.0File: entry (Rev 04/21/2016) Page 17 Printed: 9/6/2017 3:16 PM
Entry CE025 State's Share of Pension Expense - Special Funding Situation
To record pension expense for the portion of the State's proportionate share of collective pension expense that is associated with the LEA, net of the State's on-behalf contribution already recognized in the governmental funds.
Function Extracted Default Conversion User Conversion
Object (Resource) Data of Extracted Data Adjustments Entry Account Description
Debit Credit Debit Credit Debit Credit
n/a 1000 661,588 661,588 - Instruction
n/a 2100 39,480 39,480 - Instructional Supervision and Administration
n/a 2420 583 583 - Instructional Library, Media and Technology
n/a 2700 64,885 64,885 - School Site Administration
n/a 3600 - - - Home-to-School Transportation
n/a 3700 - - - Food Services
n/a 3900 40,147 40,147 - All Other Pupil Services
n/a 4000 3,998 3,998 - Ancillary Services
n/a 5000 - - - Community Services
n/a 6000 167 167 - Enterprise Activities
n/a 7200 20,240 20,240 - All Other General Administration
n/a 7700 167 167 - Centralized Data Processing
n/a 8100 1,665 1,665 - Plant Services
8590 (2000-9999) 832,920 - 832,920 All Other State Revenue (Program Revenues)
TOTALS 832,920 832,920 832,920 832,920

Monterey Peninsula UnifiedMonterey County
Unaudited Actuals2016-17 Unaudited Actuals
Conversion from Governmental Funds to Governmental ActivitiesConversion Entry - Summary
27 66092 0000000Report ENTRY
California Dept of EducationSACS Financial Reporting Software - 2017.2.0File: entry (Rev 04/21/2016) Page 1 Printed: 9/6/2017 3:17 PM
(Note: After completion of Conversion Entry - Detail, and before completion of the Conversion Entry - Summary, the ConversionEntry workbook must be saved, closed and reopened.)
Entry # Object Function Debit Credit
CE001 Capital Outlay ExpendituresTo eliminate capital outlay expenditures made in governmental funds for acquisition orconstruction of capital assets, and instead report capital assets on the statement ofnet position.
Land Improvements 9420 580,704Buildings 9430 563,930Equipment 9440 443,731Work In Progress 9450 3,309,440
Plant Services 8100 443,731
Facilities Acquisition and Construction 8500 4,454,074
Total 4,897,805 4,897,805
Entry # Object Function Debit Credit
CE002 Debt Service ExpendituresTo eliminate expenditures for debt service - principal, and instead reduce the relatedliabilities.
General Obligation Bonds Payable 9661 678,348
Other General Long-Term Debt 9669 192,603
Debt Service-Principal 9101 870,951
Total 870,951 870,951

Monterey Peninsula UnifiedMonterey County
Unaudited Actuals2016-17 Unaudited Actuals
Conversion from Governmental Funds to Governmental ActivitiesConversion Entry - Summary
27 66092 0000000Report ENTRY
California Dept of EducationSACS Financial Reporting Software - 2017.2.0File: entry (Rev 04/21/2016) Page 2 Printed: 9/6/2017 3:17 PM
Entry # Object Function Debit Credit
CE003 Debt IssuanceTo eliminate other financing sources, other financing uses, and expenditures relatingto the issuance of debt, and instead reflect long-term liabilities, net of discount orpremium; prepaid debt insurance costs; and deferred gain or loss on debt refunding.
Proceeds from Sale of Bonds 8951 33,000,000
All Other Financing Sources 8979 40,513,948
Debt Service-Issuance Costs and Discounts 9103 32,662,737Prepaid Expense 9330 961,211
General Obligation Bonds Payable 9661 39,890,000
Total 73,513,948 73,513,948
Entry # Object Function Debit Credit
CE004 Donated and Contributed Capital AssetsTo recognize donations or contributions of capital assets, not reported withingovernmental funds but reported in the government-wide statements, at market valueon the date of donation.
Total 0 0

Monterey Peninsula UnifiedMonterey County
Unaudited Actuals2016-17 Unaudited Actuals
Conversion from Governmental Funds to Governmental ActivitiesConversion Entry - Summary
27 66092 0000000Report ENTRY
California Dept of EducationSACS Financial Reporting Software - 2017.2.0File: entry (Rev 04/21/2016) Page 3 Printed: 9/6/2017 3:17 PM
Entry # Object Function Debit Credit
CE005 Disposal of Capital AssetsTo report sales and disposals of capital assets and any resulting gain or loss.
Total 0 0
Entry # Object Function Debit Credit
CE006 Earned But Unavailable RevenuesTo recognize revenues that were earned but not available, meaning they were notcollectible soon enough following the end of the period to finance expenditures of theperiod, so were deferred in the governmental funds.
Total 0 0
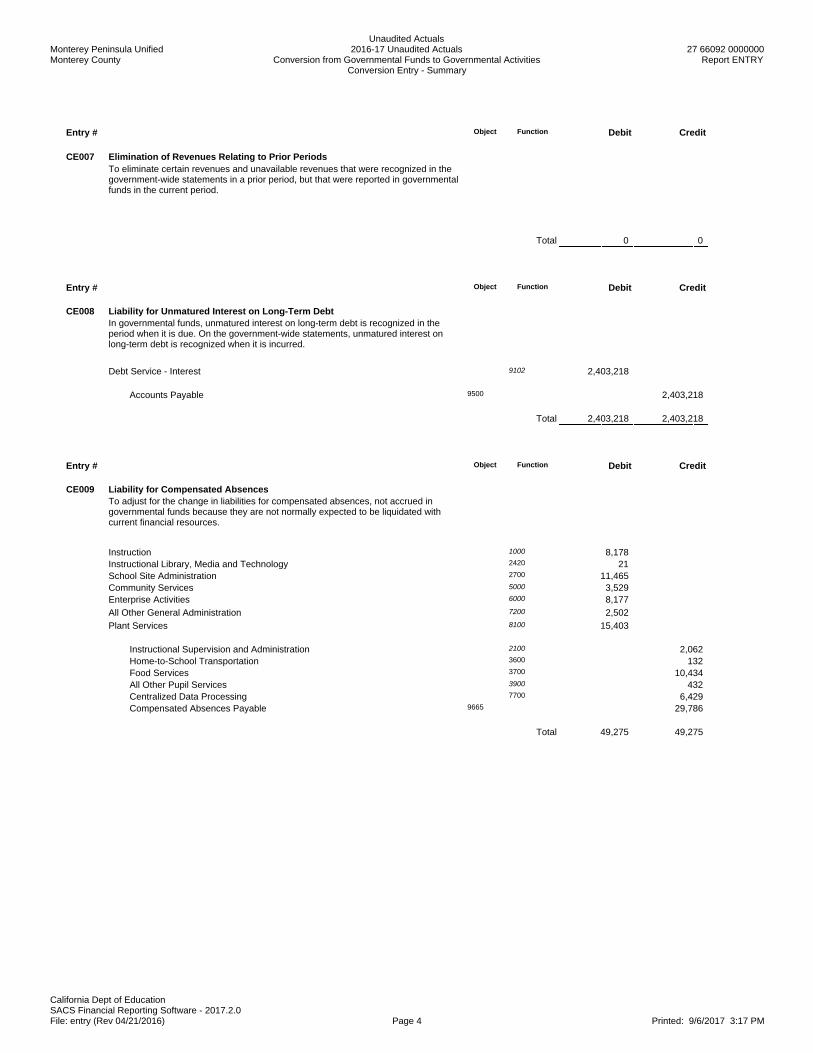
Monterey Peninsula UnifiedMonterey County
Unaudited Actuals2016-17 Unaudited Actuals
Conversion from Governmental Funds to Governmental ActivitiesConversion Entry - Summary
27 66092 0000000Report ENTRY
California Dept of EducationSACS Financial Reporting Software - 2017.2.0File: entry (Rev 04/21/2016) Page 4 Printed: 9/6/2017 3:17 PM
Entry # Object Function Debit Credit
CE007 Elimination of Revenues Relating to Prior PeriodsTo eliminate certain revenues and unavailable revenues that were recognized in thegovernment-wide statements in a prior period, but that were reported in governmentalfunds in the current period.
Total 0 0
Entry # Object Function Debit Credit
CE008 Liability for Unmatured Interest on Long-Term DebtIn governmental funds, unmatured interest on long-term debt is recognized in theperiod when it is due. On the government-wide statements, unmatured interest onlong-term debt is recognized when it is incurred.
Debt Service - Interest 9102 2,403,218
Accounts Payable 9500 2,403,218
Total 2,403,218 2,403,218
Entry # Object Function Debit Credit
CE009 Liability for Compensated AbsencesTo adjust for the change in liabilities for compensated absences, not accrued ingovernmental funds because they are not normally expected to be liquidated withcurrent financial resources.
Instruction 1000 8,178Instructional Library, Media and Technology 2420 21School Site Administration 2700 11,465Community Services 5000 3,529Enterprise Activities 6000 8,177
All Other General Administration 7200 2,502
Plant Services 8100 15,403
Instructional Supervision and Administration 2100 2,062Home-to-School Transportation 3600 132Food Services 3700 10,434All Other Pupil Services 3900 432Centralized Data Processing 7700 6,429Compensated Absences Payable 9665 29,786
Total 49,275 49,275

Monterey Peninsula UnifiedMonterey County
Unaudited Actuals2016-17 Unaudited Actuals
Conversion from Governmental Funds to Governmental ActivitiesConversion Entry - Summary
27 66092 0000000Report ENTRY
California Dept of EducationSACS Financial Reporting Software - 2017.2.0File: entry (Rev 04/21/2016) Page 5 Printed: 9/6/2017 3:17 PM
Entry # Object Function Debit Credit
CE010 Expenditures Relating to Prior PeriodsTo eliminate expenditures in governmental funds relating to a prior period that werenot recognized in the prior period because they did not involve the use of currentfinancial resources. Typical examples are interest on long term debt that matured andwas paid in the current period, payments on structured legal settlements or revenuerepayment plans, and retirement incentives paid over time.
Fund Balance/Net Position 979Z 766,359
Debt Service - Interest 9102 766,359
Total 766,359 766,359
Entry # Object Function Debit Credit
CE011 Adjustments to Work in ProgressTo adjust the Work in Progress account for previously capitalized projects nowcompleted, or to write off previously capitalized planning costs for canceled projectsthat will not be completed.
Land Improvements 9420 3,190,111Buildings 9430 35,298
Work in Progress 9450 3,225,409
Total 3,225,409 3,225,409
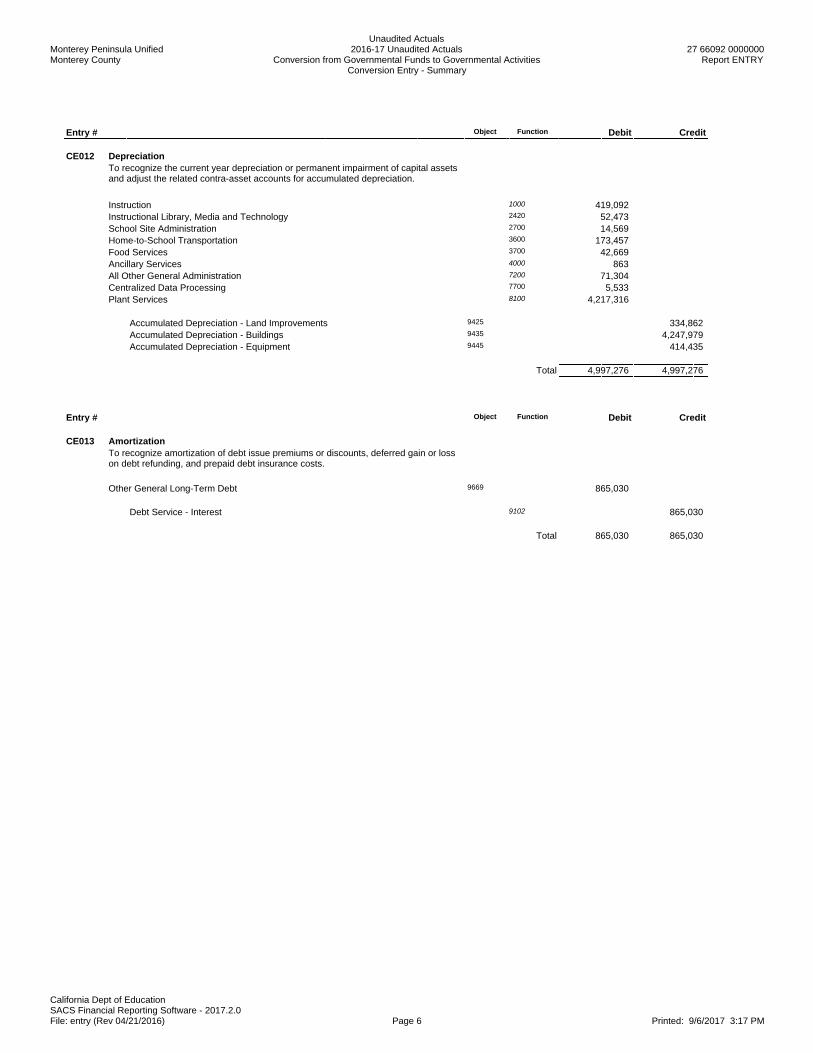
Monterey Peninsula UnifiedMonterey County
Unaudited Actuals2016-17 Unaudited Actuals
Conversion from Governmental Funds to Governmental ActivitiesConversion Entry - Summary
27 66092 0000000Report ENTRY
California Dept of EducationSACS Financial Reporting Software - 2017.2.0File: entry (Rev 04/21/2016) Page 6 Printed: 9/6/2017 3:17 PM
Entry # Object Function Debit Credit
CE012 DepreciationTo recognize the current year depreciation or permanent impairment of capital assetsand adjust the related contra-asset accounts for accumulated depreciation.
Instruction 1000 419,092Instructional Library, Media and Technology 2420 52,473School Site Administration 2700 14,569Home-to-School Transportation 3600 173,457Food Services 3700 42,669Ancillary Services 4000 863All Other General Administration 7200 71,304Centralized Data Processing 7700 5,533Plant Services 8100 4,217,316
Accumulated Depreciation - Land Improvements 9425 334,862Accumulated Depreciation - Buildings 9435 4,247,979Accumulated Depreciation - Equipment 9445 414,435
Total 4,997,276 4,997,276
Entry # Object Function Debit Credit
CE013 AmortizationTo recognize amortization of debt issue premiums or discounts, deferred gain or losson debt refunding, and prepaid debt insurance costs.
Other General Long-Term Debt 9669 865,030
Debt Service - Interest 9102 865,030
Total 865,030 865,030

Monterey Peninsula UnifiedMonterey County
Unaudited Actuals2016-17 Unaudited Actuals
Conversion from Governmental Funds to Governmental ActivitiesConversion Entry - Summary
27 66092 0000000Report ENTRY
California Dept of EducationSACS Financial Reporting Software - 2017.2.0File: entry (Rev 04/21/2016) Page 7 Printed: 9/6/2017 3:17 PM
Entry # Object Function Debit Credit
CE014 Incorporation of Assets, Deferred Outflows of Resources, Liabilities, and Deferred Inflows of Resources of Internal Service FundsTo incorporate assets, deferred outflows of resources, liabilities, and deferred inflowsof resources of internal service funds, which primarily serve governmental funds, withthose of governmental funds for purposes of government-wide reporting.
Cash in County Treasury 9110 3,562,318Cash with a Fiscal Agent/Trustee 9135 284,666Cash Collections Awaiting Deposit 9140 1,336,154Accounts Receivable 9200 75,131Due from Other Funds 9310 734,084
Accounts Payable 9500 18,866Fund Balance/Net Position 979Z 5,973,487
Total 5,992,353 5,992,353
Entry # Object Function Debit Credit
CE015 Elimination of Internal Service Funds Profit or Loss Generated Within the LEATo eliminate net profit or loss in internal service funds resulting from internal activitywithin the LEA, using a "lookback" allocation to adjust the costs charged togovernmental functions by the internal service fund.
Enterprise Activities 6000 815,677
Fund Balance/Net Position 979Z 815,677
Total 815,677 815,677

Monterey Peninsula UnifiedMonterey County
Unaudited Actuals2016-17 Unaudited Actuals
Conversion from Governmental Funds to Governmental ActivitiesConversion Entry - Summary
27 66092 0000000Report ENTRY
California Dept of EducationSACS Financial Reporting Software - 2017.2.0File: entry (Rev 04/21/2016) Page 8 Printed: 9/6/2017 3:17 PM
Entry # Object Function Debit Credit
CE016 Incorporation of Internal Service Fund External Activities and Interfund Transfers To include that portion of internal service fund revenues, expenses and net profitgenerated by parties outside the LEA, and any interfund transfers within the LEA.
Fund Balance/Net Position 979Z 734,084
Interfund Transfers, Other Authorized Transfers In 8919 734,084
Total 734,084 734,084
Entry # Object Function Debit Credit
CE017 Reclassification of Interfund Transfers Involving Fiduciary FundsTo reclassify interfund transfers involving fiduciary funds as transactions with externalparties, rather than internal transactions.
Governmental Funds (Funds 01-60)
Proprietary Funds:Enterprise Funds (Funds 61-65)
Proprietary Funds:Internal Service Funds (Funds 66-70)
Fiduciary Funds (Funds 71-95)
Total 0 0

Monterey Peninsula UnifiedMonterey County
Unaudited Actuals2016-17 Unaudited Actuals
Conversion from Governmental Funds to Governmental ActivitiesConversion Entry - Summary
27 66092 0000000Report ENTRY
California Dept of EducationSACS Financial Reporting Software - 2017.2.0File: entry (Rev 04/21/2016) Page 9 Printed: 9/6/2017 3:17 PM
Entry # Object Function Debit Credit
CE018 Reclassification of Interfund Balances Involving Fiduciary FundsTo reclassify Interfund balances involving fiduciary funds as balances due to or duefrom external parties, rather than internal transactions.
Governmental Funds (Funds 01-60)
Proprietary Funds:Enterprise Funds (Funds 61-65)
Proprietary Funds:Internal Service Funds (Funds 66-70)
Fiduciary Funds (Funds 71-95)
Total 0 0
Entry # Object Function Debit Credit
CE019 Elimination of Internal Transfers To eliminate interfund transfers among governmental and internal service fundsconsolidated in the government-wide statement of activities.
Interfund Transfers, To Child Development Fund from General Fund 8911 2,171Interfund Transfers, To Cafeteria Fund From General Fund 8916 300Interfund Transfers, Other Authorized Interfund Transfers In 8919 734,084
Interfund Transfers 9300 736,555
Total 736,555 736,555

Monterey Peninsula UnifiedMonterey County
Unaudited Actuals2016-17 Unaudited Actuals
Conversion from Governmental Funds to Governmental ActivitiesConversion Entry - Summary
27 66092 0000000Report ENTRY
California Dept of EducationSACS Financial Reporting Software - 2017.2.0File: entry (Rev 04/21/2016) Page 10 Printed: 9/6/2017 3:17 PM
Entry # Object Function Debit Credit
CE020 Elimination of Internal Balances To eliminate internal balances among governmental and internal service funds forconsolidation in the government-wide statement of activities.
Due To Other Funds 9610 1,017,048
Due From Other Funds 9310 1,017,048
Total 1,017,048 1,017,048
Entry # Object Function Debit Credit
CE021 Postemployment Benefits Other Than Pensions (OPEB) To recognize any difference between OPEB costs as defined by generally acceptedaccounting principles, and amounts actually contributed.
Instruction 1000 570,762Instructional Supervision and Administration 2100 8,998Instructional Library, Media and Technology 2420 36,330School Site Administration 2700 86,927Home-to-School Transportation 3600 61,548Food Services 3700 25,908All Other Pupil Services 3900 14,858Ancillary Services 4000 2,000Community Services 5000 1,809Enterprise Activities 6000 2,964All Other General Administration 7200 40,175Centralized Data Processing 7700 3,983Plant Services 8100 70,986
Net OPEB Obligation 9664 927,248
Total 927,248 927,248
Entry # Object Function Debit Credit
CE022 Other Liabilities Not Normally Liquidated with Current Financial Resources To accrue expenses and liabilities for obligations incurred during the year that will notbe liquidated with current financial resources, other than compensated absences,long-term debt, OPEB, and pensions. Examples include special termination benefitssuch as retirement incentives financed over time, and structured legal settlements.
Other General Long-Term Debt 9669 5,402
Instruction 1000 5,402
Total 5,402 5,402

Monterey Peninsula UnifiedMonterey County
Unaudited Actuals2016-17 Unaudited Actuals
Conversion from Governmental Funds to Governmental ActivitiesConversion Entry - Summary
27 66092 0000000Report ENTRY
California Dept of EducationSACS Financial Reporting Software - 2017.2.0File: entry (Rev 04/21/2016) Page 11 Printed: 9/6/2017 3:17 PM
Entry # Object Function Debit Credit
CE023 Employer's Net Pension Liability and Pension ExpenseTo adjust for the LEA's share of the change in net pension liabilities; and to recognizepension expense, deferred outflows of resources relating to pensions, and deferredinflows of resources relating to pensions.
Instruction 1000 2,181,925Instructional Supervision and Administration 2100 153,241Instructional Library, Media and Technology 2420 37,145School Site Administration 2700 428,831Home-to-School Transportation 3600 128,925Food Services 3700 121,185All Other Pupil Services 3900 227,782Ancillary Services 4000 10,259Community Services 5000 10,382Enterprise Activities 6000 15,143All Other General Administration 7200 243,707Centralized Data Processing 7700 41,570Plant Services 8100 385,497
Deferred Outflows of Resources - pensions only 9490 12,673,279Deferred Inflows of Resources - pensions only 9690 6,270,917
Net Pension Liability (Asset) 9663 22,929,788
Total 22,929,788 22,929,788
Entry # Object Function Debit Credit
CE024 Employer Pension Contributions Made Subsequent to Measurement Date
To adjust for employer pension contribution expenditures made by the LEAsubsequent to the pension plan measurement date.
Deferred Outflows of Resources - pensions only 9490 1,939,250
Instruction 1000 1,182,876
Instructional Supervision and Administration 2100 78,957
Instructional Library, Media and Technology 2420 13,840
School Site Administration 2700 194,070
Home-to-School Transportation 3600 46,844
Food Services 3700 44,033
All Other Pupil Services 3900 106,434
Ancillary Services 4000 6,085
Community Services 5000 3,773
Enterprise Activities 6000 5,601
All Other General Administration 7200 100,484
Centralized Data Processing 7700 15,203
Plant Services 8100 141,050
Total 1,939,250 1,939,250
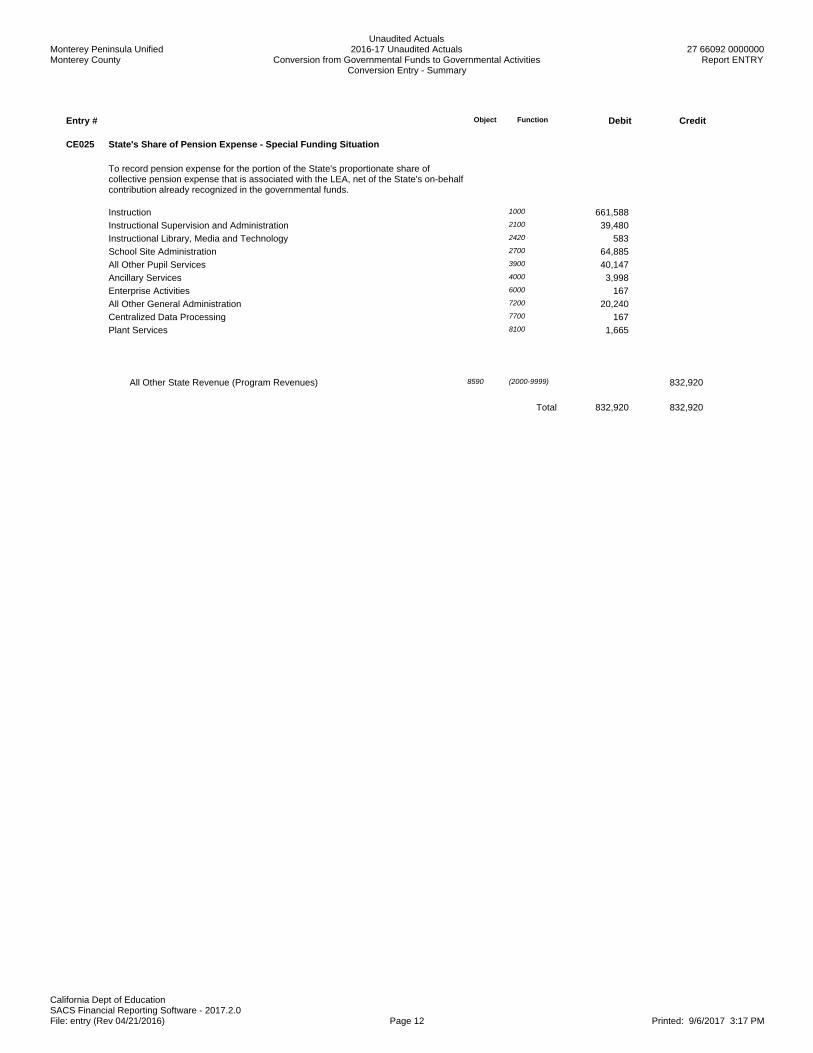
Monterey Peninsula UnifiedMonterey County
Unaudited Actuals2016-17 Unaudited Actuals
Conversion from Governmental Funds to Governmental ActivitiesConversion Entry - Summary
27 66092 0000000Report ENTRY
California Dept of EducationSACS Financial Reporting Software - 2017.2.0File: entry (Rev 04/21/2016) Page 12 Printed: 9/6/2017 3:17 PM
Entry # Object Function Debit Credit
CE025 State's Share of Pension Expense - Special Funding Situation
To record pension expense for the portion of the State's proportionate share ofcollective pension expense that is associated with the LEA, net of the State's on-behalfcontribution already recognized in the governmental funds.
Instruction 1000 661,588
Instructional Supervision and Administration 2100 39,480
Instructional Library, Media and Technology 2420 583
School Site Administration 2700 64,885
All Other Pupil Services 3900 40,147
Ancillary Services 4000 3,998
Enterprise Activities 6000 167
All Other General Administration 7200 20,240
Centralized Data Processing 7700 167
Plant Services 8100 1,665
All Other State Revenue (Program Revenues) 8590 (2000-9999) 832,920
Total 832,920 832,920

Monterey Peninsula UnifiedMonterey County
Unaudited Actuals2016-17 Unaudited Actuals
Reconciliation of the Governmental Funds Statement of Revenues,Expenditures, and Changes in Fund Balances to the
Statement of Activities
27 66092 0000000Report GSA
California Dept of EducationSACS Financial Reporting Software - 2017.2.0File: gsa (Rev 05/05/2015) Page 1 Printed: 9/6/2017 3:18 PM
Total change in fund balances, governmental funds: 30,586,956
Amounts reported for governmental activities in the statement of activities are different from amounts reported in governmental funds because:
Capital outlay: In governmental funds, the costs of capital assets are reported as expenditures in the period when the assets are acquired. In the
statement of activities, costs of capital assets are allocated over their estimated useful lives as depreciation expense. The difference between
capital outlay expenditures and depreciation expense for the period is:
Expenditures for capital outlay: 4,897,805
Depreciation expense: (4,997,276)Net: (99,471)
Debt service: In governmental funds, repayments of long-term debt are reported as expenditures. In the government-wide statements, repayments of
long-term debt are reported as reductions of liabilities. Expenditures for repayment of the principal portion of long-term debt were: 870,951
Debt proceeds: In governmental funds, proceeds from debt are recognized as Other Financing Sources. In the government-wide statements, proceeds from debt are reported as increases to liabilities. Amounts recognized in governmental funds as proceeds from debt, net of issue premium or discount, were: (40,851,211)
Debt issue costs for prepaid debt insurance: In governmental funds, debt issue costs are recognized as expenditures in the period they are incurred. In
the government-wide statements, debt issue costs for prepaid debt insurance are amortized over the life of the debt. The difference between debt
issue costs for prepaid insurance incurred in the current period and prepaid insurance costs amortized for the period is:
Prepaid debt insurance incurred during the period: -
Prepaid debt insurance amortized for the period: -
Net: -
Donated capital assets: In governmental funds, donated capital assets are not reported because they do not affect current financial resources. In the
government-wide statements, donated capital assets are reported as revenue and as increasesto capital assets, at their fair market value on the date
of donation. The fair market value of capital assets donated was: -
Gain or loss from disposal of capital assets: In governmental funds, the entire proceeds from disposal of capital assets are reported as revenue. In the
statement of activities, only the resulting gain or loss is reported. The difference between the proceeds from disposal of capital assets and the
resulting gain or loss is: -
Earned but unavailable revenues: In governmental funds, revenues are recognized only to the extent that they are "available," meaning they will be
collected soon enough after the end of the period to finance expenditures of that period. In the government-wide statements, revenue is recognized
when earned, regardless of availability. The amount of earned but unavailable revenues relating to the current period, less revenues that became
available in the current period but related to a prior period, is: -
Unmatured interest on long-term debt: In governmental funds, interest on long-term debt is recognized in the period that it becomes due. In the
government-wide statement of activities, it is recognized in the period that it is incurred. Unmatured interest owing at the end of the period, less
matured interest paid during the period but owing from the prior period, was: (1,636,859)
Compensated absences: In governmental funds, compensated absences are measured by the amounts paid during the period. In the statement of
activities, compensated absences are measured by the amounts earned. The difference between compensated absences paid and compensated
absences earned was: (29,786)
Other expenditures relating to prior periods: Certain expenditures recognized in governmental funds relate to prior periods. Typical examples, in addition
to compensated absences and interest on long-term debt, are payments on structured legal settlements or retirement incentives paid over time. These
expenditures are recognized in the government-wide statement of activities in the period in which the obligations are first incurred, so they must not
be recognized again in the current period. Expenditures relating to prior periods (described below) were: -
Pensions: In government funds, pension costs are recognized when employer contributions are made. in the statement of activities,
pension costs are recognized on the accrual basis. This year, the difference between accrual-basis pension costs and actual employer contributions
was: (2,046,342)
Postemployment benefits other than pensions (OPEB): In governmental funds, OPEB costs are recognized when employer contributions
are made. In the statement of activities, OPEB costs are recognized on the accrual basis. This year, the difference between OPEB costs
and actual employer contributions was: (927,248)
Other liabilities not normally liquidated with current financial resources: In the government-wide statements, expenses must be accrued in connection
with any liabilities incurred during the period that are not expected to be liquidated with current financial resources, in addition to compensated absences
and long-term debt. Examples include special termination benefits such as retirement incentives financed over time, and structured legal settlements.
This year, expenses incurred for such obligations were: 5,402
Cost write-off for canceled capital projects: If a planned capital project is canceled and will not be completed, costs previously capitalized as
Work in Progress must be written off to expense. Costs written off for canceled projects were: -
Amortization of debt issue premium or discount or deferred gain or loss from debt refunding: In governmental funds, if debt is issued at a premium or at a discount, the premium or discount is recognized as an Other Financing Source or an Other Financing Use in the period it is incurred. In thegovernment-wide statements, the premium or discount, plus any deferred gain or loss from debt refunding, is amortized as interest over the life of
the debt. Amortization of debt issue premium or discount, or deferred gain or loss from debt refunding, for the period is: 865,030
Internal Service Funds: Internal service funds are used to conduct certain activities for which costs are charged to other funds on a full cost-recovery
basis. Because internal service funds are presumed to benefit governmental activities, internal service activities are reported as governmental
in the statement of activities. The net increase or decrease in internal service funds was: (81,594)
Change in net position of governmental activities (minor differences may be due to rounding): (13,344,172)
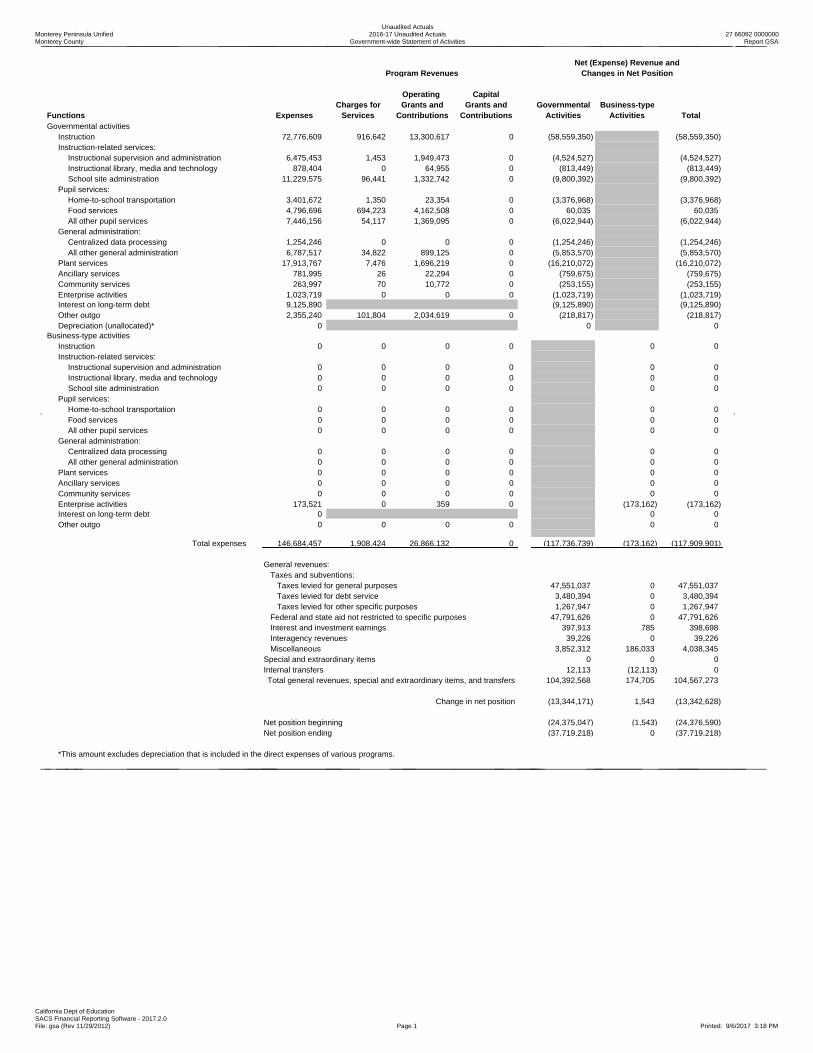
Monterey Peninsula UnifiedMonterey County
Unaudited Actuals2016-17 Unaudited Actuals
Government-wide Statement of Activities27 66092 0000000
Report GSA
California Dept of EducationSACS Financial Reporting Software - 2017.2.0File: gsa (Rev 11/29/2012) Page 1 Printed: 9/6/2017 3:18 PM
Net (Expense) Revenue andProgram Revenues Changes in Net Position
Operating CapitalCharges for Grants and Grants and Governmental Business-type
Functions Expenses Services Contributions Contributions Activities Activities TotalGovernmental activities
Instruction 72,776,609 916,642 13,300,617 0 (58,559,350) (58,559,350)Instruction-related services:
Instructional supervision and administration 6,475,453 1,453 1,949,473 0 (4,524,527) (4,524,527)Instructional library, media and technology 878,404 0 64,955 0 (813,449) (813,449)School site administration 11,229,575 96,441 1,332,742 0 (9,800,392) (9,800,392)
Pupil services:Home-to-school transportation 3,401,672 1,350 23,354 0 (3,376,968) (3,376,968)Food services 4,796,696 694,223 4,162,508 0 60,035 60,035All other pupil services 7,446,156 54,117 1,369,095 0 (6,022,944) (6,022,944)
General administration:Centralized data processing 1,254,246 0 0 0 (1,254,246) (1,254,246)All other general administration 6,787,517 34,822 899,125 0 (5,853,570) (5,853,570)
Plant services 17,913,767 7,476 1,696,219 0 (16,210,072) (16,210,072)Ancillary services 781,995 26 22,294 0 (759,675) (759,675)Community services 263,997 70 10,772 0 (253,155) (253,155)Enterprise activities 1,023,719 0 0 0 (1,023,719) (1,023,719)Interest on long-term debt 9,125,890 (9,125,890) (9,125,890)Other outgo 2,355,240 101,804 2,034,619 0 (218,817) (218,817)Depreciation (unallocated)* 0 0 0
Business-type activitiesInstruction 0 0 0 0 0 0Instruction-related services:
Instructional supervision and administration 0 0 0 0 0 0Instructional library, media and technology 0 0 0 0 0 0School site administration 0 0 0 0 0 0
Pupil services:Home-to-school transportation 0 0 0 0 0 0Food services 0 0 0 0 0 0All other pupil services 0 0 0 0 0 0
General administration:Centralized data processing 0 0 0 0 0 0All other general administration 0 0 0 0 0 0
Plant services 0 0 0 0 0 0Ancillary services 0 0 0 0 0 0Community services 0 0 0 0 0 0Enterprise activities 173,521 0 359 0 (173,162) (173,162)Interest on long-term debt 0 0 0Other outgo 0 0 0 0 0 0
Total expenses 146,684,457 1,908,424 26,866,132 0 (117,736,739) (173,162) (117,909,901)
General revenues: Taxes and subventions: Taxes levied for general purposes 47,551,037 0 47,551,037 Taxes levied for debt service 3,480,394 0 3,480,394 Taxes levied for other specific purposes 1,267,947 0 1,267,947 Federal and state aid not restricted to specific purposes 47,791,626 0 47,791,626 Interest and investment earnings 397,913 785 398,698 Interagency revenues 39,226 0 39,226 Miscellaneous 3,852,312 186,033 4,038,345Special and extraordinary items 0 0 0Internal transfers 12,113 (12,113) 0Total general revenues, special and extraordinary items, and transfers 104,392,568 174,705 104,567,273
Change in net position (13,344,171) 1,543 (13,342,628)
Net position beginning (24,375,047) (1,543) (24,376,590)Net position ending (37,719,218) 0 (37,719,218)
*This amount excludes depreciation that is included in the direct expenses of various programs.

Monterey Peninsula UnifiedMonterey County
Unaudited Actuals2016-17 Unaudited Actuals
Reconciliation of theGovernmental Funds Balance Sheet to the
Statement of Net Position
27 66092 0000000Report GSNP
California Dept of EducationSACS Financial Reporting Software - 2017.2.0File: gsnp (Rev 08/28/2015) Page 1 of 2 Printed: 9/6/2017 3:18 PM
Total fund balances, governmental funds: 66,732,209
Amounts reported for assets, deferred outflows of resources, liabilities, and deferred inflows of resources for governmental activities in the statement of
net position are different from amounts reported in governmental funds because:
Capital assets: In governmental funds, only current assets are reported. In the statement of net position, all assets are reported, including
capital assets and accumulated depreciation.
Capital assets relating to governmental activities, at historical cost: 211,637,529
Accumulated depreciation: (116,863,581)
Net: 94,773,948
Unamortized costs: In governmental funds, debt issue costs are recognized as expenditures in the period they are incurred. In the
government-wide statements, debt issue costs for prepaid debt insurance are amortized over the life of the debt. Unamortized debt
insurance costs included in prepaid expense on the statement of net position are: (961,211)
Unmatured interest on long-term debt: In governmental funds, interest on long-term debt is not recognized until the period in which it matures
and is paid. In the government-wide statement of activities, it is recognized in the period that it is incurred. The additional liability for
unmatured interest owing at the end of the period was: (2,403,218)
Deferred recognition of earned but unavailable revenues: In governmental funds, revenue is recognized only to the extent that it is "available,"
meaning it will be collected soon enough after the end of the period to finance expenditures of that period. Receivables for revenues that are
earned but unavailable are deferred until the period in which the revenues become available. In the government-wide statements, revenue is
recognized when earned, regardless of availability. The amount of unavailable revenues that were deferred in governmental funds, but are
recognized in the government-wide statements, is: -
Long-term liabilities: In governmental funds, only current liabilities are reported. In the statement of net position, all liabilities, including
long-term liaibilities, are reported. Long-term liabilities relating to governmental activities consist of:
General obligation bonds payable 93,352,640
State school building loans payable -
Net Pension Liability (Asset) 110,539,522
Net OPEB Obligation 8,998,966
Compensated absences payable 647,353
Certificates of participation payable -
Capital leases payable -
Lease revenue bonds payable -
Other general long-term debt 7,074,300
Deferred gain or loss on debt refunding -
Total: (220,612,781)
Deferred outflows and inflows of resources relating to pensions: In governmental funds, deferred outflows and inflows of resources
relating to pensions are not reported because they are applicable to future periods. In the statement of net position, deferred outflows
and inflows of resources relating to pensions are reported.
Deferred outflows of resourcesrelating to pensions 23,619,218

Monterey Peninsula UnifiedMonterey County
Unaudited Actuals2016-17 Unaudited Actuals
Reconciliation of theGovernmental Funds Balance Sheet to the
Statement of Net Position
27 66092 0000000Report GSNP
California Dept of EducationSACS Financial Reporting Software - 2017.2.0File: gsnp (Rev 08/28/2015) Page 2 of 2 Printed: 9/6/2017 3:18 PM
Deferred inflows of resources relatingto pensions (4,840,870)
Internal service funds: Internal service funds are used to conduct certain activities for which costs are charged to other funds on a full
cost-recovery basis. Because internal service funds are presumed to operate for the benefit of governmental activities, assets, deferred
outflows of resources, liabilities, and deferred inflows of resources of internal service funds are reported with governmental
activities in the statement of net position. Net position for internal service funds is: 5,973,487
Total net position, governmental activities (minor differences may be due to rounding): (37,719,218)

Monterey Peninsula UnifiedMonterey County
Unaudited Actuals2016-17 Unaudited Actuals
Government-wide Statement of Net Position27 66092 0000000
Report GSNP
California Dept of EducationSACS Financial Reporting Software - 2017.2.0File: gsnp (Rev 05/04/2015) Page 1 of 1 Printed: 9/6/2017 3:18 PM
Governmental Business-typeActivities Activities Total
AssetsCash 74,963,962 94,755 75,058,717Investments 0 0 0Receivables 4,596,406 763 4,597,169Due from (to) other funds 12,113 (12,113) 0Stores 266,407 0 266,407Prepaid expenses (896,287) 0 (896,287)Other current assets 0 0 0Capital assets:
Land 5,693,918 0 5,693,918Land Improvements 34,762,959 0 34,762,959Buildings 157,729,192 0 157,729,192Equipment 12,278,474 0 12,278,474Work in progress 1,172,986 0 1,172,986
Less accumulated depreciation (116,863,581) 0 (116,863,581)Total assets 173,716,549 83,405 173,799,954
Deferred Outflows of Resources 23,619,218 42,370 23,661,588
LiabilitiesAccounts payable and other current liabilities 8,251,524 167 8,251,691Current loans 0 0 0Unearned revenue 1,349,810 0 1,349,810Long-term liabilities: Unbalanced 220,612,781 123,478 220,736,259
Due within one year 0Due in more than one year 0
Total liabilities 230,214,115 123,645 230,337,760
Deferred Inflows of Resources 4,840,870 2,130 4,843,000
Net PositionNet investment in capital assets 0Restricted for:
Capital projects 0Debt service 0Educational programs 0Other purposes (expendable) 0Other purposes (nonexpendable) 0
Unrestricted 0Total net position Unbalanced (37,719,218) 0 (37,719,218)

Monterey Peninsula UnifiedMonterey County
Unaudited Actuals2016-17 Unaudited Actuals
Conversion from Governmental Funds to Governmental ActivitiesConversion Worksheet
27 66092 0000000Report CNVRT
California Dept of EducationSACS Financial Reporting Software - 2017.2.0File: cnvrt (Rev 04/21/2016) Page 1 Printed: 9/6/2017 3:14 PM
Conversion Entries
Resource Function Object
Governmental Funds,Capital Assets, DeferredOutflows of Resources,Long-Term Liabilities,
and Deferred Inflows ofResources Entry Amounts Entry Numbers
Other WorksheetAdjustments * Statement of Activities
Statement of NetPosition
Assets Funds 01-57, except where indicated
Cash 9110-9140 69,780,824 5,183,138 CE014 74,963,962
Investments 9150 0 0 CE014 0
Receivables 9200-9290 4,521,275 75,131 CE014, CE018 4,596,406
Due from Other Funds 9310 300,383 (282,964) CE014, CE018, CE020 17,419
Stores 9320 266,407 0 CE014 266,407
Prepaids 9330 64,924 (961,211) CE003, CE013, CE014 (896,287)
Other Current Assets 9340 0 0 CE014 0
Land 9410 5,693,918 0CE001, CE004, CE005,CE011, CE014 5,693,918
Land Improvements 9420 30,992,144 3,770,815CE001, CE004, CE005,CE011, CE014 34,762,959
Accumulated Depreciation - LandImprovements 9425 (25,124,881) (334,862) CE005, CE012, CE014 (25,459,743)
Buildings 9430 157,129,964 599,228CE001, CE004, CE005,CE011, CE014 157,729,192
Accumulated Depreciation - Buildings 9435 (78,291,251) (4,247,979) CE005, CE012, CE014 (82,539,230)
Equipment 9440 11,834,743 443,731CE001, CE004, CE005,CE011, CE014 12,278,474
Accumulated Depreciation - Equipment 9445 (8,450,173) (414,435) CE005, CE012, CE014 (8,864,608)
Work in Progress 9450 1,088,955 84,031CE001, CE004, CE005,CE011, CE014 1,172,986
Deferred Outflows of Resources - pensions only 9490 9,006,689 14,612,529 CE014, CE023, CE024 23,619,218Deferred Outflows of Resources - other 9490 0 0 CE003, CE013, CE014 0

Monterey Peninsula UnifiedMonterey County
Unaudited Actuals2016-17 Unaudited Actuals
Conversion from Governmental Funds to Governmental ActivitiesConversion Worksheet
27 66092 0000000Report CNVRT
California Dept of EducationSACS Financial Reporting Software - 2017.2.0File: cnvrt (Rev 04/21/2016) Page 2 Printed: 9/6/2017 3:14 PM
Conversion Entries
Resource Function Object
Governmental Funds,Capital Assets, DeferredOutflows of Resources,Long-Term Liabilities,
and Deferred Inflows ofResources Entry Amounts Entry Numbers
Other WorksheetAdjustments * Statement of Activities
Statement of NetPosition
Liabilities
Accounts Payable and Other CurrentLiabilities 9500-9599, 9620 5,829,440 2,422,084 CE008, CE014, CE018 8,251,524
Due to Other Funds 9610 1,022,354 (1,017,048) CE014, CE018, CE020 5,306
Current Loans 9640 0 0
Unearned Revenue 9650 1,349,810 0 CE014 1,349,810
General Obligation Bonds Payable 9661 54,140,988 39,211,652CE002, CE003, CE008,CE013 93,352,640
State School Building Loan Payable 9662 0 0 CE002, CE003, CE013 0
Net Pension Liability (Asset) 9663 87,609,734 22,929,788 CE014, CE023 110,539,522
Net OPEB Obligation 9664 8,071,718 927,248 CE014, CE021 8,998,966
Compensated Absences Payable 9665 617,567 29,786 CE009, CE014 647,353
COPs Payable 9666 0 0CE002, CE003, CE013,CE014 0
Capital Leases Payable 9667 0 0CE002, CE003, CE013,CE014 0
Lease Revenue Bonds Payable 9668 0 0CE002, CE003, CE013,CE014 0
Other General Long-Term Debt 9669 8,137,335 (1,063,035)CE002, CE003, CE010,CE013, CE014, CE022 7,074,300
Deferred Inflows of Resources - pensions only 9690 11,111,787 (6,270,917) CE014, CE023 4,840,870
Deferred Inflows of Resources - other 9690 0 0CE003, CE006, CE007,CE013, CE014 0
Fund Balance / Net Position 979Z 923,188 (38,642,406) 0 (37,719,218)

Monterey Peninsula UnifiedMonterey County
Unaudited Actuals2016-17 Unaudited Actuals
Conversion from Governmental Funds to Governmental ActivitiesConversion Worksheet
27 66092 0000000Report CNVRT
California Dept of EducationSACS Financial Reporting Software - 2017.2.0File: cnvrt (Rev 04/21/2016) Page 3 Printed: 9/6/2017 3:14 PM
Conversion Entries
Resource Function Object
Governmental Funds,Capital Assets, DeferredOutflows of Resources,Long-Term Liabilities,
and Deferred Inflows ofResources Entry Amounts Entry Numbers
Other WorksheetAdjustments * Statement of Activities
Statement of NetPosition
General Revenues
Taxes and Subventions:
Taxes Levied for General Purposes 0000-9999 8020-8079, 8097 47,551,037 47,551,037
Taxes Levied for Debt Service 0000-9999 8571-8572, 8610-8614 3,480,394 3,480,394
Taxes Levied for Other Specific Purposes 0000-9999 8575-8576, 8615-8629 1,267,947 1,267,947
Federal and State Aid Not Restricted toSpecific Purposes 0000-1999
8010-8019, 8092,8096,8100-8544, 8546-8560,8587-8590 47,791,626 0
CE006, CE007, CE010,CE022 47,791,626
Interest and Investment Earnings 0000-1999 8660-8662 397,913 0 CE006, CE007, CE016 397,913
Interagency Revenue 0000-1999 8677, 8780-8799 39,226 0CE010, CE016, CE017,CE022 39,226
8081-8089, 8631-8659, CE004, CE005, CE006
Miscellaneous 0000-1999 8663-8676, 8678-8710 3,852,312 0CE007, CE010, CE016,CE022 3,852,312
Program Revenues
Charges for Services 2000-99998081-8089, 8631-8659,8663-8698, 8700-8710 1,908,424 0
CE005, CE010, CE016,CE022 1,908,424
6200, 7710 8290, 8587, 8699
8010-8019, 8100-8544,8546-8560, 8587-8590,
Operating Grants and Contributions
2000-6199,6201-7709,7711-9999
8660-8662, 8699,8780-8799 26,032,853 832,920
CE004, CE006, CE007,CE010, CE016, CE017,CE022, CE25 26,865,773
0000-7709,7711-9999 85457710 8545, 8660-8662
Capital Grants and Contributions 6200 8590, 8660-8662 0 0 CE010, CE022 0
Expenditures
Instruction 1000-1999 1000-7999 70,123,342 2,653,267
CE001, CE009, CE010,CE012, CE015, CE021,CE022, CE023, CE024,CE025 72,776,609
Instruction-Related Services:
Instructional Supervision and Administration
2000-2999, except2420, 2700 1000-7999 6,354,753 120,700
CE001, CE009, CE010,CE012, CE015, CE021,CE022, CE023, CE024,CE025 6,475,453
Instructional Library, Media and Technology 2420 1000-7999 765,692 112,712
CE001, CE009, CE010,CE012, CE015, CE021,CE022, CE023, CE024,CE025 878,404
School Site Administration 2700 1000-7999 10,816,968 412,607
CE001, CE009, CE010,CE012, CE015, CE021,CE022, CE023, CE024,CE025 11,229,575

Monterey Peninsula UnifiedMonterey County
Unaudited Actuals2016-17 Unaudited Actuals
Conversion from Governmental Funds to Governmental ActivitiesConversion Worksheet
27 66092 0000000Report CNVRT
California Dept of EducationSACS Financial Reporting Software - 2017.2.0File: cnvrt (Rev 04/21/2016) Page 4 Printed: 9/6/2017 3:14 PM
Conversion Entries
Resource Function Object
Governmental Funds,Capital Assets, DeferredOutflows of Resources,Long-Term Liabilities,
and Deferred Inflows ofResources Entry Amounts Entry Numbers
Other WorksheetAdjustments * Statement of Activities
Statement of NetPosition
Pupil Services:
Home-To-School Transportation 3600 1000-7999 3,084,718 316,954
CE001, CE009, CE010,CE012, CE015, CE021,CE022, CE023, CE024,CE025 3,401,672

Monterey Peninsula UnifiedMonterey County
Unaudited Actuals2016-17 Unaudited Actuals
Conversion from Governmental Funds to Governmental ActivitiesConversion Worksheet
27 66092 0000000Report CNVRT
California Dept of EducationSACS Financial Reporting Software - 2017.2.0File: cnvrt (Rev 04/21/2016) Page 5 Printed: 9/6/2017 3:14 PM
Conversion Entries
Resource Function Object
Governmental Funds,Capital Assets, DeferredOutflows of Resources,Long-Term Liabilities,
and Deferred Inflows ofResources Entry Amounts Entry Numbers
Other WorksheetAdjustments * Statement of Activities
Statement of NetPosition
Food Services 3700 1000-7999 4,661,401 135,295
CE001, CE009, CE010,CE012, CE015, CE021,CE022, CE023, CE024,CE025 4,796,696
All Other Pupil Services3000-3999, except3600, 3700 1000-7999 7,270,235 175,921
CE001, CE009, CE010,CE012, CE015, CE021,CE022, CE023, CE024,CE025 7,446,156
General Administration:
Centralized Data Processing 7700 1000-7999 1,224,625 29,621
CE001, CE009, CE010,CE012, CE015, CE021,CE022, CE023, CE024,CE025 1,254,246
All Other General Administration 7100-7699 1000-7999 6,510,073 277,444
CE001, CE005, CE009,CE010, CE011, CE012,CE015, CE021, CE022,CE023, CE024, CE025 6,787,517
Plant Services8000-8999, except8500 1000-7999 13,807,681 4,106,086
CE001, CE009, CE010,CE012, CE015, CE021,CE022, CE023, CE024,CE025 17,913,767
Facility Acquisition and Construction 8500 1000-7999 4,454,074 (4,454,074) CE001
Ancillary Services 4000-4999 1000-7999 770,960 11,035
CE001, CE009, CE010,CE012, CE015, CE021,CE022, CE023, CE024,CE025 781,995
Community Services 5000-5999 1000-7999 252,050 11,947
CE001, CE009, CE010,CE012, CE015, CE021,CE022, CE023, CE024,CE025 263,997
Enterprise Activities 6000-6999 1000-7999 187,192 836,527
CE001, CE009, CE010,CE012, CE015, CE016,CE021, CE022, CE023,CE024, CE025 1,023,719
Other Outgo:
Transfers Between Agencies 9200 7110-7299 1,722,883 0 CE016, CE017 1,722,883
Debt Service - Principal 9100, 91017431-7439, except 7434,7438 870,951 (870,951) CE002, CE015
Debt Service - Interest 9100, 9102 7434, 7438 8,354,061 771,829CE008, CE010, CE013,CE015 9,125,890
Debt Service - Issuance Costs and Discounts 9100, 9103
5400, 5450,5800, 7699 33,295,094 (32,662,737) CE003, CE013, CE015 632,357
All Other Outgo 9100-93001000-6999, except 5400,5450, 5800 0 0
Depreciation (Unallocated) 0000 6900 0 0 CE012 0

Monterey Peninsula UnifiedMonterey County
Unaudited Actuals2016-17 Unaudited Actuals
Conversion from Governmental Funds to Governmental ActivitiesConversion Worksheet
27 66092 0000000Report CNVRT
California Dept of EducationSACS Financial Reporting Software - 2017.2.0File: cnvrt (Rev 04/21/2016) Page 6 Printed: 9/6/2017 3:14 PM
Conversion Entries
Resource Function Object
Governmental Funds,Capital Assets, DeferredOutflows of Resources,Long-Term Liabilities,
and Deferred Inflows ofResources Entry Amounts Entry Numbers
Other WorksheetAdjustments * Statement of Activities
Statement of NetPosition
Other Financing Sources and Uses
Interfund Transfers In 8910-8929 19,890 (2,471) CE016, CE017, CE019 17,419
Interfund Transfers Out 9300 7600-7629 741,861 (736,555) CE016, CE017, CE019 5,306
Proceeds from Long-Term Debt 8931-8951, 8971-8973 33,000,000 (33,000,000) CE003
Proceeds from Disposal of Capital Assets 8953 0 0 CE005, CE006, CE007 0
All Other Financing Sources 8961-8965, 8979 40,513,948 (40,513,948) CE003, CE016 0
All Other Financing Uses 9200 7651 0 0
* The Other Worksheet Adjustments column is to allow the user to make any other entry, not provided for in the Conversion Entries 1 through 22. Generally, worksheet adjustments should not be necessary. See the SACS Software User Guide for additional guidelines.

Monterey Peninsula UnifiedMonterey County
Unaudited Actuals2016-17 Unaudited Actuals
Conversion from Governmental Funds to Governmental ActivitiesFund Consolidation
27 66092 0000000Report CNVRT
California Dept of EducationSACS Financial Reporting Software - 2017.2.0File: cnvrt (Rev 04/21/2016) Page 1 Printed: 9/6/2017 3:14 PM
Fund 01 Fund 09 Fund 11 Fund 12 Fund 13 Fund 14 Fund 21
Resource Function Object General FundCharter Schools
Special Revenue Fund Adult Education FundChild Development
FundCafeteria Special
Revenue FundDeferred Maintenance
Fund Building Fund
Assets Funds 01-57, except where indicated
Cash 9110-9140 21,626,296.46 1,075,253.91 179,136.04 (167,108.36) 883,259.82 459,316.30 32,906,975.00
Investments 9150 0.00 0.00 0.00 0.00 0.00 0.00 0.00
Receivables 9200-9290 2,936,578.27 42,806.08 166,523.82 227,133.48 999,674.96 1,662.12 101,465.36
Due from Other Funds 9310 253,332.97 44,879.00 0.00 2,171.05 0.01 0.00 0.00
Stores 9320 0.00 0.00 0.00 0.00 266,406.75 0.00 0.00
Prepaids 9330 62,908.15 600.00 1,416.22 0.00 0.00 0.00 0.00
Other Current Assets 9340 0.00 0.00 0.00 0.00 0.00 0.00 0.00
Land 9410
Land Improvements 9420
Accumulated Depreciation - Land Improvements 9425
Buildings 9430
Accumulated Depreciation - Buildings 9435
Equipment 9440
Accumulated Depreciation - Equipment 9445
Work in Progress 9450
Deferred Outflows of Resources - pensions only 9490
Deferred Outflows of Resources - other 9490 0.00 0.00 0.00 0.00 0.00 0.00 0.00
Liabilities
Accounts Payable and Other Current Liabilities9500-9599,9620 5,202,223.32 176,187.94 18,444.38 11,739.90 28,680.72 5,194.36 273,753.62
Due to Other Funds 9610 786,439.57 59,776.52 0.13 30,951.94 70,680.55 0.00 15.88
Current Loans 9640 0.00 0.00 0.00 0.00 0.00 0.00 0.00
Unearned Revenue 9650 1,346,308.17 0.00 0.00 3,502.15 0.00 0.00 0.00
General Obligation Bonds Payable 9661
State School Building Loan Payable 9662
Net Pension Liability (Asset) 9663
Net OPEB Obligation 9664
Compensated Absences Payable 9665
COPs Payable 9666
Capital Leases Payable 9667
Lease Revenue Bonds Payable 9668
Other General Long-Term Debt 9669
Deferred Inflows of Resources - pensions only 9690
Deferred Inflows of Resources - other 9690 0.00 0.00 0.00 0.00 0.00 0.00 0.00

Monterey Peninsula UnifiedMonterey County
Unaudited Actuals2016-17 Unaudited Actuals
Conversion from Governmental Funds to Governmental ActivitiesFund Consolidation
27 66092 0000000Report CNVRT
California Dept of EducationSACS Financial Reporting Software - 2017.2.0File: cnvrt (Rev 04/21/2016) Page 2 Printed: 9/6/2017 3:14 PM
Fund 01 Fund 09 Fund 11 Fund 12 Fund 13 Fund 14 Fund 21
Resource Function Object General FundCharter Schools
Special Revenue Fund Adult Education FundChild Development
FundCafeteria Special
Revenue FundDeferred Maintenance
Fund Building Fund
Fund Balance / Net Position 979Z 17,544,144.79 927,574.53 328,631.57 16,002.18 2,049,980.27 455,784.06 32,734,670.86

Monterey Peninsula UnifiedMonterey County
Unaudited Actuals2016-17 Unaudited Actuals
Conversion from Governmental Funds to Governmental ActivitiesFund Consolidation
27 66092 0000000Report CNVRT
California Dept of EducationSACS Financial Reporting Software - 2017.2.0File: cnvrt (Rev 04/21/2016) Page 3 Printed: 9/6/2017 3:14 PM
Resource Function Object
Assets Funds 01-57, except where indicated
Cash 9110-9140
Investments 9150
Receivables 9200-9290
Due from Other Funds 9310
Stores 9320
Prepaids 9330
Other Current Assets 9340
Land 9410
Land Improvements 9420
Accumulated Depreciation - Land Improvements 9425
Buildings 9430
Accumulated Depreciation - Buildings 9435
Equipment 9440
Accumulated Depreciation - Equipment 9445
Work in Progress 9450
Deferred Outflows of Resources - pensions only 9490
Deferred Outflows of Resources - other 9490
Liabilities
Accounts Payable and Other Current Liabilities9500-9599,9620
Due to Other Funds 9610
Current Loans 9640
Unearned Revenue 9650
General Obligation Bonds Payable 9661
State School Building Loan Payable 9662
Net Pension Liability (Asset) 9663
Net OPEB Obligation 9664
Compensated Absences Payable 9665
COPs Payable 9666
Capital Leases Payable 9667
Lease Revenue Bonds Payable 9668
Other General Long-Term Debt 9669
Deferred Inflows of Resources - pensions only 9690
Deferred Inflows of Resources - other 9690
Fund 25 Fund 40 Fund 51
Capital Facilities Fund
Special Reserve Fundfor Capital Outlay
ProjectsBond Interest andRedemption Fund
Total GovernmentalFunds
Capital Assets,Deferred Outflows of
Resources, Long-Term Liabilities, andDeferred Inflows of
Resources
Total GovernmentalFunds, Capital
Assets, DeferredOutflows of
Resources, Long-Term Liabilities, andDeferred Inflows of
Resources
7,862,891.86 651,669.20 4,303,133.64 69,780,824 69,780,824
0.00 0.00 0.00 0 0
22,744.95 22,685.64 0.00 4,521,275 4,521,275
0.00 0.00 0.00 300,383 300,383
0.00 0.00 0.00 266,407 266,407
0.00 0.00 0.00 64,924 0 64,924
0.00 0.00 0.00 0 0
5,693,918 5,693,918
30,992,144 30,992,144
(25,124,881) (25,124,881)
157,129,964 157,129,964
(78,291,251) (78,291,251)
11,834,743 11,834,743
(8,450,173) (8,450,173)
1,088,955 1,088,955
9,006,689 9,006,689
0.00 0.00 0.00 0 0 0
80,248.52 32,966.82 0.00 5,829,440 5,829,440
74,342.89 146.20 0.00 1,022,354 1,022,354
0.00 0.00 0.00 0 0
0.00 0.00 0.00 1,349,810 1,349,810
54,140,988 54,140,988
0 0
87,609,734 87,609,734
8,071,718 8,071,718
617,567 617,567
0 0
0 0
0 0
8,137,335 8,137,335
11,111,787 11,111,787
0.00 0.00 0.00 0 0 0

Monterey Peninsula UnifiedMonterey County
Unaudited Actuals2016-17 Unaudited Actuals
Conversion from Governmental Funds to Governmental ActivitiesFund Consolidation
27 66092 0000000Report CNVRT
California Dept of EducationSACS Financial Reporting Software - 2017.2.0File: cnvrt (Rev 04/21/2016) Page 4 Printed: 9/6/2017 3:14 PM
Resource Function Object
Fund 25 Fund 40 Fund 51
Capital Facilities Fund
Special Reserve Fundfor Capital Outlay
ProjectsBond Interest andRedemption Fund
Total GovernmentalFunds
Capital Assets,Deferred Outflows of
Resources, Long-Term Liabilities, andDeferred Inflows of
Resources
Total GovernmentalFunds, Capital
Assets, DeferredOutflows of
Resources, Long-Term Liabilities, andDeferred Inflows of
Resources
Fund Balance / Net Position 979Z 7,731,045.40 641,241.82 4,303,133.64 66,732,209 (65,809,021) 923,188

Monterey Peninsula UnifiedMonterey County
Unaudited Actuals2016-17 Unaudited Actuals
Conversion from Governmental Funds to Governmental ActivitiesFund Consolidation
27 66092 0000000Report CNVRT
California Dept of EducationSACS Financial Reporting Software - 2017.2.0File: cnvrt (Rev 04/21/2016) Page 5 Printed: 9/6/2017 3:14 PM
Fund 01 Fund 09 Fund 11 Fund 12 Fund 13 Fund 14 Fund 21
Resource Function Object General FundCharter Schools
Special Revenue Fund Adult Education FundChild Development
FundCafeteria Special
Revenue FundDeferred Maintenance
Fund Building Fund
General RevenuesTaxes and Subventions:
Taxes Levied for General Purposes 0000-99998020-8079,8097 47,551,036.86 0.00 0.00 0.00 0.00 0.00 0.00
Taxes Levied for Debt Service 0000-99998571-8572,8610-8614 0.00 0.00 0.00 0.00 0.00 0.00 0.00
Taxes Levied for Other Specific Purposes 0000-99998575-8576,8615-8629 1,267,946.88 0.00 0.00 0.00 0.00 0.00 0.00
Federal and State Aid Not Restricted to SpecificPurposes 0000-1999
8010-8019,8092, 8096,8100-8544,8546-8560,8587-8590 43,789,716.72 4,001,909.45 0.00 0.00 0.00 0.00 0.00
Interest and Investment Earnings 0000-1999 8660-8662 279,374.23 13,481.80 0.00 0.00 0.00 4,968.61 0.00
Interagency Revenues 0000-19998677,8780-8799 39,225.65 0.00 0.00 0.00 0.00 0.00 0.00
Miscellaneous 0000-1999
8081-8089,8631-8659,8663-8676,8678-8710 1,287,794.70 4,039.53 0.00 0.00 0.00 0.00 0.00
Program Revenues
Charges for Services 2000-9999
8081-8089,8631-8659,8663-8698,8700-8710 1,147,447.47 0.00 7,395.00 20,380.24 733,200.83 0.00 0.00
6200, 77108290, 8587,8699
2000-6199,6201-7709,
8010-8019,8100-8544,8546-8560,8587-8590,8660-8662,8699,
Operating Grants and Contributions 7711-9999 8780-8799 18,073,297.29 232,405.01 1,001,674.41 2,133,205.39 4,364,147.14 0.00 228,124.05
0000-7709,7711-9999 8545
77108545,8660-8662
Capital Grants and Contributions 62008590,8660-8662 0.00 0.00 0.00 0.00 0.00 0.00 0.00
Expenditures
Instruction 1000-1999 1000-7999 65,108,559.38 3,039,915.40 459,976.94 1,514,890.77 0.00 0.00 0.00
Instruction - Related Services:
Instructional Supervision and Administration
2000-2999,except 2420,2700 1000-7999 5,931,592.47 183,346.31 78,194.63 161,619.99 0.00 0.00 0.00
Instructional Library, Media and Technology 2420 1000-7999 645,493.97 120,198.09 0.00 0.00 0.00 0.00 0.00
School Site Administration 2700 1000-7999 9,841,740.77 476,433.50 314,719.89 184,074.13 0.00 0.00 0.00

Monterey Peninsula UnifiedMonterey County
Unaudited Actuals2016-17 Unaudited Actuals
Conversion from Governmental Funds to Governmental ActivitiesFund Consolidation
27 66092 0000000Report CNVRT
California Dept of EducationSACS Financial Reporting Software - 2017.2.0File: cnvrt (Rev 04/21/2016) Page 6 Printed: 9/6/2017 3:14 PM
Resource Function Object
Fund 25 Fund 40 Fund 51
Capital Facilities Fund
Special Reserve Fundfor Capital Outlay
ProjectsBond Interest andRedemption Fund
Total GovernmentalFunds
Capital Assets,Deferred Outflows of
Resources, Long-Term Liabilities, andDeferred Inflows of
Resources
Total GovernmentalFunds, Capital
Assets, DeferredOutflows of
Resources, Long-Term Liabilities, andDeferred Inflows of
Resources
General RevenuesTaxes and Subventions:
Taxes Levied for General Purposes 0000-99998020-8079,8097
Taxes Levied for Debt Service 0000-99998571-8572,8610-8614
Taxes Levied for Other Specific Purposes 0000-99998575-8576,8615-8629
Federal and State Aid Not Restricted to SpecificPurposes 0000-1999
8010-8019,8092, 8096,8100-8544,8546-8560,8587-8590
Interest and Investment Earnings 0000-1999 8660-8662
Interagency Revenues 0000-19998677,8780-8799
Miscellaneous 0000-1999
8081-8089,8631-8659,8663-8676,8678-8710
Program Revenues
Charges for Services 2000-9999
8081-8089,8631-8659,8663-8698,8700-8710
6200, 77108290, 8587,8699
2000-6199,6201-7709,
8010-8019,8100-8544,8546-8560,8587-8590,8660-8662,8699,
Operating Grants and Contributions 7711-9999 8780-8799
0000-7709,7711-9999 8545
77108545,8660-8662
Capital Grants and Contributions 62008590,8660-8662
Expenditures
Instruction 1000-1999 1000-7999
Instruction - Related Services:
Instructional Supervision and Administration
2000-2999,except 2420,2700 1000-7999
Instructional Library, Media and Technology 2420 1000-7999
School Site Administration 2700 1000-7999
0.00 0.00 0.00 47,551,037 47,551,037
0.00 0.00 3,480,393.95 3,480,394 3,480,394
0.00 0.00 0.00 1,267,947 1,267,947
0.00 0.00 0.00 47,791,626 47,791,626
77,578.71 9,804.61 12,704.99 397,913 397,913
0.00 0.00 0.00 39,226 39,226
2,478,096.35 82,381.40 0.00 3,852,312 3,852,312
0.00 0.00 0.00 1,908,424 1,908,424
0.00 0.00 0.00 26,032,853 26,032,853
0.00 0.00 0.00 0 0
0.00 0.00 0.00 70,123,342 70,123,342
0.00 0.00 0.00 6,354,753 6,354,753
0.00 0.00 0.00 765,692 765,692
0.00 0.00 0.00 10,816,968 10,816,968

Monterey Peninsula UnifiedMonterey County
Unaudited Actuals2016-17 Unaudited Actuals
Conversion from Governmental Funds to Governmental ActivitiesFund Consolidation
27 66092 0000000Report CNVRT
California Dept of EducationSACS Financial Reporting Software - 2017.2.0File: cnvrt (Rev 04/21/2016) Page 7 Printed: 9/6/2017 3:14 PM
Fund 01 Fund 09 Fund 11 Fund 12 Fund 13 Fund 14 Fund 21
Resource Function Object General FundCharter Schools
Special Revenue Fund Adult Education FundChild Development
FundCafeteria Special
Revenue FundDeferred Maintenance
Fund Building Fund
Pupil Services:
Home-To-School Transportation 3600 1000-7999 3,035,086.17 49,631.37 0.00 0.00 0.00 0.00 0.00
Food Services 3700 1000-7999 8,064.13 0.00 0.00 94.62 4,653,242.37 0.00 0.00
All Other Pupil Services
3000-3999,except 3600,3700 1000-7999 7,004,411.32 157,556.55 8,883.91 99,382.80 0.00 0.00 0.00
General Administration:
Centralized Data Processing 7700 1000-7999 1,224,624.96 0.00 0.00 0.00 0.00 0.00 0.00
All Other General Administration 7100-7699 1000-7999 5,850,016.29 211,860.53 36,508.67 111,788.63 225,555.61 0.00 0.00
Plant Services8000-8999,except 8500 1000-7999 11,316,701.50 102,646.90 2,144.57 68,595.64 0.00 332,124.88 1,179,295.76
Facility Acquisition and Construction 8500 1000-7999 31,367.59 0.00 0.00 0.00 0.00 96,443.36 3,309,440.52
Ancillary Services 4000-4999 1000-7999 754,778.51 16,181.30 0.00 0.00 0.00 0.00 0.00
Community Services 5000-5999 1000-7999 252,049.93 0.00 0.00 0.00 0.00 0.00 0.00
Enterprise Activities 6000-6999 1000-7999 187,192.44 0.00 0.00 0.00 0.00 0.00 0.00
Other Outgo:
Transfers Between Agencies 9200 7110-7299 1,722,882.77 0.00 0.00 0.00 0.00 0.00 0.00
Debt Service - Principal 9100, 9101
7431-7439,except 7434and 7438 192,602.74 0.00 0.00 0.00 0.00 0.00 0.00
Debt Service - Interest 9100, 9102 7434, 7438 22,873.30 0.00 0.00 0.00 0.00 0.00 6,220,105.35
Debt Service - Issuance Costs and Discounts 9100, 91035400, 5450,5800, 7699 0.00 0.00 0.00 0.00 0.00 0.00 33,295,094.09
All Other Outgo 9100-9300
1000-6999,except 5400,5450, and5800 0.00 0.00 0.00 0.00 0.00 0.00 0.00
Depreciation (Unallocated) 0000 6900 0.00 0.00 0.00 0.00 0.00 0.00 0.00
Other Financing Sources and Uses
Interfund Transfers In 8910-8929 17,418.86 0.00 0.00 2,171.05 300.44 0.00 0.00
Interfund Transfers Out 9300 7600-7629 741,861.00 0.00 0.00 0.00 0.00 0.00 0.00
Proceeds from Long-Term Debt8931-8951,8971-8973 0.00 0.00 0.00 0.00 0.00 0.00 33,000,000.00
Proceeds from Disposal of Capital Assets 8953 0.00 0.00 0.00 0.00 0.00 0.00 0.00
All Other Financing Sources8961-8965,8979 0.00 0.00 0.00 0.00 0.00 0.00 39,364,955.25
All Other Financing Uses 9200 7651-7699 0.00 0.00 0.00 0.00 0.00 0.00 0.00
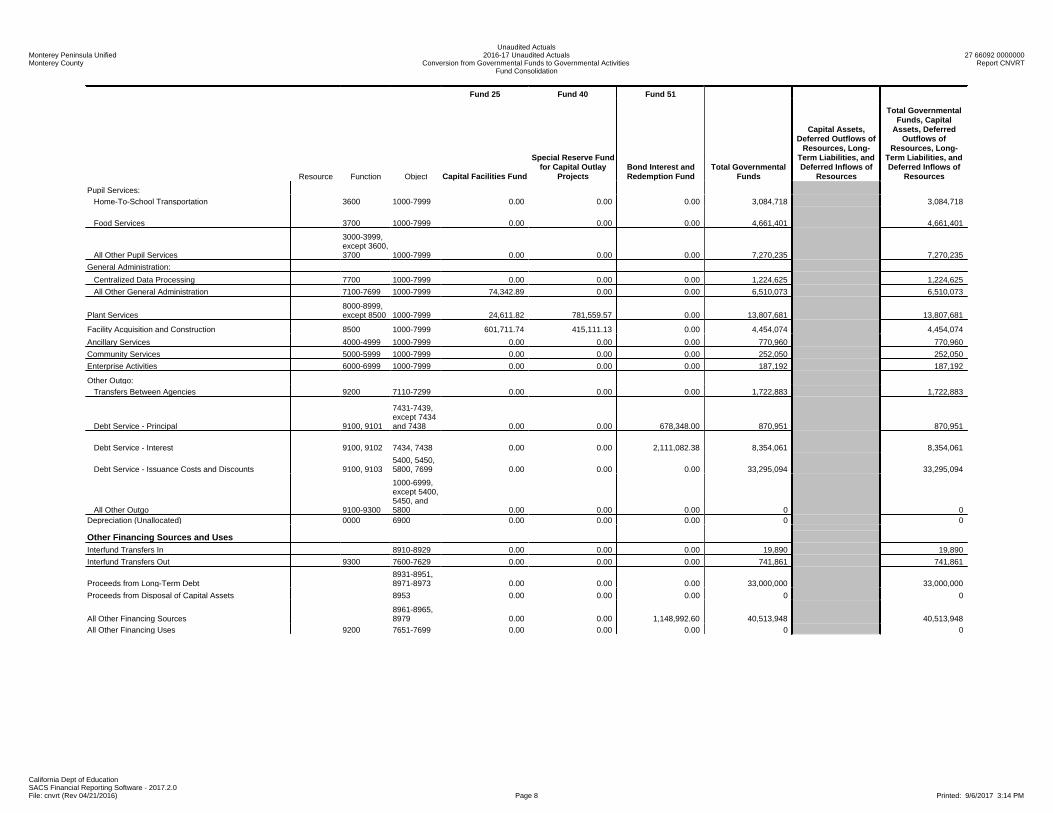
Monterey Peninsula UnifiedMonterey County
Unaudited Actuals2016-17 Unaudited Actuals
Conversion from Governmental Funds to Governmental ActivitiesFund Consolidation
27 66092 0000000Report CNVRT
California Dept of EducationSACS Financial Reporting Software - 2017.2.0File: cnvrt (Rev 04/21/2016) Page 8 Printed: 9/6/2017 3:14 PM
Resource Function Object
Fund 25 Fund 40 Fund 51
Capital Facilities Fund
Special Reserve Fundfor Capital Outlay
ProjectsBond Interest andRedemption Fund
Total GovernmentalFunds
Capital Assets,Deferred Outflows of
Resources, Long-Term Liabilities, andDeferred Inflows of
Resources
Total GovernmentalFunds, Capital
Assets, DeferredOutflows of
Resources, Long-Term Liabilities, andDeferred Inflows of
Resources
Pupil Services:
Home-To-School Transportation 3600 1000-7999
Food Services 3700 1000-7999
All Other Pupil Services
3000-3999,except 3600,3700 1000-7999
General Administration:
Centralized Data Processing 7700 1000-7999
All Other General Administration 7100-7699 1000-7999
Plant Services8000-8999,except 8500 1000-7999
Facility Acquisition and Construction 8500 1000-7999
Ancillary Services 4000-4999 1000-7999
Community Services 5000-5999 1000-7999
Enterprise Activities 6000-6999 1000-7999
Other Outgo:
Transfers Between Agencies 9200 7110-7299
Debt Service - Principal 9100, 9101
7431-7439,except 7434and 7438
Debt Service - Interest 9100, 9102 7434, 7438
Debt Service - Issuance Costs and Discounts 9100, 91035400, 5450,5800, 7699
All Other Outgo 9100-9300
1000-6999,except 5400,5450, and5800
Depreciation (Unallocated) 0000 6900
Other Financing Sources and Uses
Interfund Transfers In 8910-8929
Interfund Transfers Out 9300 7600-7629
Proceeds from Long-Term Debt8931-8951,8971-8973
Proceeds from Disposal of Capital Assets 8953
All Other Financing Sources8961-8965,8979
All Other Financing Uses 9200 7651-7699
0.00 0.00 0.00 3,084,718 3,084,718
0.00 0.00 0.00 4,661,401 4,661,401
0.00 0.00 0.00 7,270,235 7,270,235
0.00 0.00 0.00 1,224,625 1,224,625
74,342.89 0.00 0.00 6,510,073 6,510,073
24,611.82 781,559.57 0.00 13,807,681 13,807,681
601,711.74 415,111.13 0.00 4,454,074 4,454,074
0.00 0.00 0.00 770,960 770,960
0.00 0.00 0.00 252,050 252,050
0.00 0.00 0.00 187,192 187,192
0.00 0.00 0.00 1,722,883 1,722,883
0.00 0.00 678,348.00 870,951 870,951
0.00 0.00 2,111,082.38 8,354,061 8,354,061
0.00 0.00 0.00 33,295,094 33,295,094
0.00 0.00 0.00 0 00.00 0.00 0.00 0 0
0.00 0.00 0.00 19,890 19,890
0.00 0.00 0.00 741,861 741,861
0.00 0.00 0.00 33,000,000 33,000,000
0.00 0.00 0.00 0 0
0.00 0.00 1,148,992.60 40,513,948 40,513,948
0.00 0.00 0.00 0 0

Monterey Peninsula UnifiedMonterey County
Unaudited Actuals2016-17 Unaudited Actuals
Conversion from Governmental Funds to Governmental ActivitiesIdentification of Program Revenues by Function
Detail
27 66092 0000000Report CNVRT
California Dept of EducationSACS Financial Reporting Software - 2017.2.0File: cnvrt (Rev 05/09/2007) Page 1 Printed: 9/6/2017 3:15 PM
Charges for Services: Governmental Activities Extracted expenditures by function, default identification of program revenues by function, and user adjustmenExtracted expenditures by function, default identification of program revenues by function, and user adjustmen
Program Revenues
Funds Resource by Resource Function: 1000 2100 2420 2700 3600 3700 3900 4000 5000 6000 7200 7700 8100 8500 9000 Total
01-57 5310 Child Nutrition: School Programs (e.g. 727,946 Expenditures by function - - - - - 4,461,296 - - - - 216,726 - - - - 4,678,022
Percentage of total 95.36714% 4.63286% 100.00000%
Default revenue by function - - - - - 694,221 - - - - 33,725 - - - - 727,946
User adjustments -Adjusted revenue by function - - - - - 694,221 - - - - 33,725 - - - - 727,946
01-57 6105 Child Development: California State P 20,380 Expenditures by function 1,197,289 107,839 - 115,393 - 95 99,383 - - - 87,578 - 35,556 - - 1,643,133
Percentage of total 72.86623% 6.56301% 7.02274% 0.00578% 6.04838% 5.32994% 2.16391% 99.99999%
Default revenue by function 14,850 1,338 - 1,431 - 1 1,233 - - - 1,086 - 441 - - 20,380
User adjustments -Adjusted revenue by function 14,850 1,338 - 1,431 - 1 1,233 - - - 1,086 - 441 - - 20,380
01-57 6500 Special Education 1,147,447 Expenditures by function 13,513,518 892 - 1,414,866 20,111 - 787,402 - - - - - 342 - 1,352,820 17,089,951
Percentage of total 79.07289% 0.00522% 8.27894% 0.11768% 4.60740% 0.00200% 7.91588% 100.00001%
Default revenue by function 907,320 60 - 94,996 1,350 - 52,867 - - - - - 23 - 90,831 1,147,447
User adjustments -Adjusted revenue by function 907,320 60 - 94,996 1,350 - 52,867 - - - - - 23 - 90,831 1,147,447
01-57 9010 Other Restricted Loca 12,650 Expenditures by function 797,607 197,102 300 48,837 - 5,255 60,000 92,460 252,050 - 41,348 - 1,202,524 3,340,132 39,515,199 45,552,814
Percentage of total 1.75095% 0.43269% 0.00066% 0.10721% 0.01154% 0.13172% 0.20297% 0.55331% 0.09077% 2.63985% 7.33244% 86.74590% 100.00001%
Default revenue by function 221 55 - 14 - 1 17 26 70 - 11 - 334 928 10,973 12,650
User adjustments (5,750) 6,678 (928) -Adjusted revenue by function (5,529) 55 - 14 - 1 17 26 70 - 11 - 7,012 - 10,973 12,650
Total Charges for Services (from fundconsolidation worksheet) 1,908,423
Subtotal of Charges for Services by function 916,641 1,453 96,441 1,350 694,223 54,117 26 70 34,822 7,476 101,804 1,908,423
User identification of conversion entries, adjustments, and rounding differences, by functio 1 1
Adjusted Charges for Services by function (agrees to conversion worksheet 916,642 1,453 - 96,441 1,350 694,223 54,117 26 70 - 34,822 - 7,476 101,804 1,908,424

Monterey Peninsula UnifiedMonterey County
Unaudited Actuals2016-17 Unaudited Actuals
Conversion from Governmental Funds to Governmental ActivitiesIdentification of Program Revenues by Function
Detail
27 66092 0000000Report CNVRT
California Dept of EducationSACS Financial Reporting Software - 2017.2.0File: cnvrt (Rev 05/09/2007) Page 2 Printed: 9/6/2017 3:15 PM
Operating Grants and Contributions: Governmental Activities Extracted expenditures by function, default identification of program revenues by function, and user adjustmenExtracted expenditures by function, default identification of program revenues by function, and user adjustmen
Funds Resource
ProgramRevenues by
Resource Function: 1000 2100 2420 2700 3600 3700 3900 4000 5000 6000 7200 7700 8100 8500 9000 Total
01-57 3010 NCLB: Title I, Part A, Basic Grants Low 1,957,154 Expenditures by function 1,130,006 509,844 62,419 - - - 108,567 - - - 146,319 - - - - 1,957,155
Percentage of total 57.73717% 26.05026% 3.18927% 5.54718% 7.47611% 99.99999%
Default revenue by function 1,130,005 509,844 62,419 - - - 108,567 - - - 146,319 - - - - 1,957,154
User adjustments -Adjusted revenue by function 1,130,005 509,844 62,419 - - - 108,567 - - - 146,319 - - - - 1,957,154
01-57 3310 Special Ed: IDEA Basic Local Assistan 1,857,466 Expenditures by function 1,440,312 - - - - - 318,152 - - - 99,002 - - - - 1,857,466
Percentage of total 77.54177% 17.12828% 5.32995% 100.00000%
Default revenue by function 1,440,312 - - - - - 318,152 - - - 99,002 - - - - 1,857,466
User adjustments -Adjusted revenue by function 1,440,312 - - - - - 318,152 - - - 99,002 - - - - 1,857,466
01-57 3385 Special Ed: IDEA Early Intervention G 15,658 Expenditures by function - - - - - - 14,823 - - - 835 - - - - 15,658
Percentage of total 94.66726% 5.33274% 100.00000%
Default revenue by function - - - - - - 14,823 - - - 835 - - - - 15,658
User adjustments -Adjusted revenue by function - - - - - - 14,823 - - - 835 - - - - 15,658
01-57 3550 Carl D. Perkins Career and Technical 88,132 Expenditures by function 83,617 318 - - - - - - - - 4,197 - - - - 88,132
Percentage of total 94.87700% 0.36082% 4.76217% 99.99999%
Default revenue by function 83,617 318 - - - - - - - - 4,197 - - - - 88,132
User adjustments -Adjusted revenue by function 83,617 318 - - - - - - - - 4,197 - - - - 88,132
01-57 3905 Adult Education: Adult Basic Educatio 74,830 Expenditures by function 29,602 44,258 - 970 - - - - - - - - - - - 74,830
Percentage of total 39.55900% 59.14473% 1.29627% 100.00000%
Default revenue by function 29,602 44,258 - 970 - - - - - - - - - - - 74,830
User adjustments -Adjusted revenue by function 29,602 44,258 - 970 - - - - - - - - - - - 74,830
01-57 3913 Adult Education: Adult Secondary Edu 90,375 Expenditures by function 90,375 - - - - - - - - - - - - - - 90,375
Percentage of total 100.00000% 100.00000%
Default revenue by function 90,375 - - - - - - - - - - - - - - 90,375
User adjustments -Adjusted revenue by function 90,375 - - - - - - - - - - - - - - 90,375
01-57 3926 Adult Education: English Literacy & C 25,853 Expenditures by function 25,853 - - - - - - - - - - - - - - 25,853
Percentage of total 100.00000% 100.00000%
Default revenue by function 25,853 - - - - - - - - - - - - - - 25,853
User adjustments -Adjusted revenue by function 25,853 - - - - - - - - - - - - - - 25,853
01-57 4035 ESEA: Title II, Part A, Teacher Quality 417,311 Expenditures by function 89,717 284,740 - - - - - - - - 42,853 - - - - 417,310
Percentage of total 21.49889% 68.23225% 10.26886% 100.00000%
Default revenue by function 89,717 284,741 - - - - - - - - 42,853 - - - - 417,311
User adjustments -Adjusted revenue by function 89,717 284,741 - - - - - - - - 42,853 - - - - 417,311
01-57 4201 ESEA: Title III, Immigrant Education P 21,553 Expenditures by function 14,429 5,974 - - - - - - - - 1,149 - - - - 21,552
Percentage of total 66.94970% 27.71901% 5.33129% 100.00000%
Default revenue by function 14,430 5,974 - - - - - - - - 1,149 - - - - 21,553
User adjustments -Adjusted revenue by function 14,430 5,974 - - - - - - - - 1,149 - - - - 21,553
01-57 4203 ESEA: Title III, English Learner Stude 339,928 Expenditures by function 37,837 295,468 - - - - - - - - 6,622 - - - - 339,927
Percentage of total 11.13092% 86.92102% 1.94807% 100.00001%
Default revenue by function 37,837 295,469 - - - - - - - - 6,622 - - - - 339,928
User adjustments -Adjusted revenue by function 37,837 295,469 - - - - - - - - 6,622 - - - - 339,928
01-57 5210 Head Start 452,128 Expenditures by function 286,809 45,435 - 64,805 - - - - - - 24,211 - 33,040 - - 454,300
Percentage of total 63.13207% 10.00110% 14.26480% 5.32930% 7.27273% 100.00000%
Default revenue by function 285,438 45,218 - 64,495 - - - - - - 24,095 - 32,882 - - 452,128
User adjustments -Adjusted revenue by function 285,438 45,218 - 64,495 - - - - - - 24,095 - 32,882 - - 452,128
01-57 5310 Child Nutrition: School Programs (e.g. 4,164,123 Expenditures by function - - - - - 4,461,296 - - - - 216,726 - - - - 4,678,022
Percentage of total 95.36714% 4.63286% 100.00000%
Default revenue by function - - - - - 3,971,205 - - - - 192,918 - - - - 4,164,123
User adjustments -

Monterey Peninsula UnifiedMonterey County
Unaudited Actuals2016-17 Unaudited Actuals
Conversion from Governmental Funds to Governmental ActivitiesIdentification of Program Revenues by Function
Detail
27 66092 0000000Report CNVRT
California Dept of EducationSACS Financial Reporting Software - 2017.2.0File: cnvrt (Rev 05/09/2007) Page 3 Printed: 9/6/2017 3:15 PM
Adjusted revenue by function - - - - - 3,971,205 - - - - 192,918 - - - - 4,164,123
01-57 5320 Child Nutrition: Child Care Food Progr 77,344 Expenditures by function - - - - - 69,408 - - - - 3,415 - - - - 72,823
Percentage of total 95.31055% 4.68945% 100.00000%
Default revenue by function - - - - - 73,717 - - - - 3,627 - - - - 77,344
User adjustments -Adjusted revenue by function - - - - - 73,717 - - - - 3,627 - - - - 77,344
01-57 5340 Child Nutrition: CCFP Cash in Lieu of 5,629 Expenditures by function - - - - - 5,366 - - - - 264 - - - - 5,630
Percentage of total 95.31083% 4.68917% 100.00000%
Default revenue by function - - - - - 5,365 - - - - 264 - - - - 5,629
User adjustments -Adjusted revenue by function - - - - - 5,365 - - - - 264 - - - - 5,629
01-57 5370 Child Nutrition: Fresh Fruit and Vegeta 96,761 Expenditures by function - - - - - 92,223 - - - - 4,537 - - - - 96,760
Percentage of total 95.31108% 4.68892% 100.00000%
Default revenue by function - - - - - 92,224 - - - - 4,537 - - - - 96,761
User adjustments -Adjusted revenue by function - - - - - 92,224 - - - - 4,537 - - - - 96,761
01-57 5380 Child Nutrition: School Breakfast Start 7,222 Expenditures by function - - - - - 7,222 - - - - - - - - - 7,222
Percentage of total 100.00000% 100.00000%
Default revenue by function - - - - - 7,222 - - - - - - - - - 7,222
User adjustments -Adjusted revenue by function - - - - - 7,222 - - - - - - - - - 7,222
01-57 5454 Child Nutrition: Team Nutrition 13,068 Expenditures by function - - - - - 12,473 - - - - 614 - - - - 13,087
Percentage of total 95.30832% 4.69168% 100.00000%
Default revenue by function - - - - - 12,455 - - - - 613 - - - - 13,068
User adjustments -Adjusted revenue by function - - - - - 12,455 - - - - 613 - - - - 13,068
01-57 5640 Medi-Cal Billing Option 238,453 Expenditures by function - - - - - - 232,670 - - - 13,099 - - - - 245,769
Percentage of total 94.67020% 5.32980% 100.00000%
Default revenue by function - - - - - - 225,744 - - - 12,709 - - - - 238,453
User adjustments -Adjusted revenue by function - - - - - - 225,744 - - - 12,709 - - - - 238,453
01-57 5810 Other Restricted Federa 398,450 Expenditures by function 190,245 140,345 - 354 - - 67,506 - - - - - - - - 398,450
Percentage of total 47.74627% 35.22274% 0.08884% 16.94215% 100.00000%
Default revenue by function 190,245 140,345 - 354 - - 67,506 - - - - - - - - 398,450
User adjustments -Adjusted revenue by function 190,245 140,345 - 354 - - 67,506 - - - - - - - - 398,450
01-57 6010 After School Education and Safety (AS 856,514 Expenditures by function 740,803 81,726 - 1,147 - - - - - - 40,786 - - - - 864,462
Percentage of total 85.69526% 9.45397% 0.13268% 4.71808% 99.99999%
Default revenue by function 733,992 80,975 - 1,136 - - - - - - 40,411 - - - - 856,514
User adjustments -Adjusted revenue by function 733,992 80,975 - 1,136 - - - - - - 40,411 - - - - 856,514
01-57 6105 Child Development: California State P 1,637,981 Expenditures by function 1,197,289 107,839 - 115,393 - 95 99,383 - - - 87,578 - 35,556 - - 1,643,133
Percentage of total 72.86623% 6.56301% 7.02274% 0.00578% 6.04838% 5.32994% 2.16391% 99.99999%
Default revenue by function 1,193,535 107,501 - 115,031 - 95 99,071 - - - 87,303 - 35,444 - - 1,637,980
User adjustments 1 1Adjusted revenue by function 1,193,536 107,501 - 115,031 - 95 99,071 - - - 87,303 - 35,444 - - 1,637,981
01-57 6130 Child Development: Center-Based Re 7 Expenditures by function - - - - - - - - - - - - - - - -
Percentage of total
Default revenue by function - - - - - - - - - - - - - - - -
User adjustments 7 7Adjusted revenue by function 7 - - - - - - - - - - - - - - 7
01-57 6230 California Clean Energy Jobs Ac 572,108 Expenditures by function - - - 2,880 - - - - - - 43,837 - 440,586 - - 487,303
Percentage of total 0.59101% 8.99584% 90.41315% 100.00000%
Default revenue by function - - - 3,381 - - - - - - 51,466 - 517,261 - - 572,108
User adjustments -Adjusted revenue by function - - - 3,381 - - - - - - 51,466 - 517,261 - - 572,108
01-57 6264 Educator Effectiveness (15-16) 2,196 Expenditures by function 189,564 244,439 - - - - - - - - 24,311 - - - - 458,314
Percentage of total 41.36116% 53.33440% 5.30444% 100.00000%
Default revenue by function 908 1,171 - - - - - - - - 116 - - - - 2,195
User adjustments 1 1Adjusted revenue by function 909 1,171 - - - - - - - - 116 - - - - 2,196
01-57 6300 Lottery: Instructional Materials 482,499 Expenditures by function 583,630 - - - - - - - - - - - - - - 583,630
Percentage of total 100.00000% 100.00000%
Default revenue by function 482,499 - - - - - - - - - - - - - - 482,499

Monterey Peninsula UnifiedMonterey County
Unaudited Actuals2016-17 Unaudited Actuals
Conversion from Governmental Funds to Governmental ActivitiesIdentification of Program Revenues by Function
Detail
27 66092 0000000Report CNVRT
California Dept of EducationSACS Financial Reporting Software - 2017.2.0File: cnvrt (Rev 05/09/2007) Page 4 Printed: 9/6/2017 3:15 PM
User adjustments -Adjusted revenue by function 482,499 - - - - - - - - - - - - - - 482,499
01-57 6387 Career Technical Education Incentive 175,035 Expenditures by function 148,101 17,605 - - - - - - - - 9,329 - - - - 175,035
Percentage of total 84.61222% 10.05799% 5.32979% 100.00000%
Default revenue by function 148,101 17,605 - - - - - - - - 9,329 - - - - 175,035
User adjustments -Adjusted revenue by function 148,101 17,605 - - - - - - - - 9,329 - - - - 175,035
01-57 6391 Adult Education Block Grant Program 752,782 Expenditures by function 289,141 28,688 - 310,128 - - 8,884 - - - 35,975 - 2,145 - - 674,961
Percentage of total 42.83818% 4.25032% 45.94754% 1.31622% 5.32994% 0.31780% 100.00000%
Default revenue by function 322,478 31,996 - 345,885 - - 9,908 - - - 40,123 - 2,392 - - 752,782
User adjustments -Adjusted revenue by function 322,478 31,996 - 345,885 - - 9,908 - - - 40,123 - 2,392 - - 752,782
01-57 6392 Adult Education Block Grant Data and 31,364 Expenditures by function - - - - - - - - - - - - - - - -
Percentage of total
Default revenue by function - - - - - - - - - - - - - - - -
User adjustments 31,364 31,364Adjusted revenue by function 31,364 - - - - - - - - - - - - - - 31,364
01-57 6500 Special Education 4,192,671 Expenditures by function 13,513,518 892 - 1,414,866 20,111 - 787,402 - - - - - 342 - 1,352,820 17,089,951
Percentage of total 79.07289% 0.00522% 8.27894% 0.11768% 4.60740% 0.00200% 7.91588% 100.00001%
Default revenue by function 3,315,266 219 - 347,109 4,934 - 193,173 - - - - - 84 - 331,887 4,192,672
User adjustments (1) (1)Adjusted revenue by function 3,315,265 219 - 347,109 4,934 - 193,173 - - - - - 84 - 331,887 4,192,671
01-57 6510 Special Ed: Early Ed Individuals with E 397,206 Expenditures by function 238,063 - - 77,203 2,459 - 65,571 - - - - - - - 13,911 397,207
Percentage of total 59.93424% 19.43647% 0.61907% 16.50802% 3.50220% 100.00000%
Default revenue by function 238,062 - - 77,203 2,459 - 65,571 - - - - - - - 13,911 397,206
User adjustments -Adjusted revenue by function 238,062 - - 77,203 2,459 - 65,571 - - - - - - - 13,911 397,206
01-57 6512 Special Ed: Mental Health Services 417,668 Expenditures by function 231,062 - - 68,486 17,120 - 107,458 - - - 23,878 - - - - 448,004
Percentage of total 51.57588% 15.28692% 3.82139% 23.98595% 5.32986% 100.00000%
Default revenue by function 215,416 - - 63,849 15,961 - 100,182 - - - 22,261 - - - - 417,669
User adjustments (1) (1)Adjusted revenue by function 215,415 - - 63,849 15,961 - 100,182 - - - 22,261 - - - - 417,668
01-57 6520 Special Ed: Project Workability I LEA 131,096 Expenditures by function 99,268 23,438 - 1,415 - - - - - - 6,975 - - - - 131,096
Percentage of total 75.72161% 17.87850% 1.07936% 5.32053% 100.00000%
Default revenue by function 99,268 23,438 - 1,415 - - - - - - 6,975 - - - - 131,096
User adjustments -Adjusted revenue by function 99,268 23,438 - 1,415 - - - - - - 6,975 - - - - 131,096
01-57 7220 Partnership Academies Program 149,523 Expenditures by function 113,195 11,628 - 16,730 - - - - - - 7,969 - - - - 149,522
Percentage of total 75.70458% 7.77678% 11.18899% 5.32965% 100.00000%
Default revenue by function 113,196 11,628 - 16,730 - - - - - - 7,969 - - - - 149,523
User adjustments -Adjusted revenue by function 113,196 11,628 - 16,730 - - - - - - 7,969 - - - - 149,523
01-57 7338 College Readiness Block Gran 279,612 Expenditures by function 28,177 44,697 - - - - - - - - 4,103 - - - - 76,977
Percentage of total 36.60444% 58.06540% 5.33016% 100.00000%
Default revenue by function 102,350 162,358 - - - - - - - - 14,904 - - - - 279,612
User adjustments -Adjusted revenue by function 102,350 162,358 - - - - - - - - 14,904 - - - - 279,612
01-57 7690 STRS On-Behalf Pension Contribution 3,645,668 Expenditures by function 2,907,728 177,991 2,523 293,097 - - 163,834 18,342 - - 76,761 - 5,392 - - 3,645,668
Percentage of total 79.75844% 4.88226% 0.06921% 8.03960% 4.49394% 0.50312% 2.10554% 0.14790% 100.00001%
Default revenue by function 2,907,728 177,991 2,523 293,097 - - 163,834 18,342 - - 76,761 - 5,392 - - 3,645,668
User adjustments -Adjusted revenue by function 2,907,728 177,991 2,523 293,097 - - 163,834 18,342 - - 76,761 - 5,392 - - 3,645,668
01-57 8150 Ongoing & Major Maintenance Accoun 20,626 Expenditures by function - - - - - - - - - - 69 - 3,154,796 - - 3,154,865
Percentage of total 0.00219% 99.99781% 100.00000%
Default revenue by function - - - - - - - - - - - - 20,626 - - 20,626
User adjustments -Adjusted revenue by function - - - - - - - - - - - - 20,626 - - 20,626
01-57 9010 Other Restricted Loca 1,946,860 Expenditures by function 797,607 197,102 300 48,837 - 5,255 60,000 92,460 252,050 - 41,348 - 1,202,524 3,340,132 39,515,199 45,552,814
Percentage of total 1.75095% 0.43269% 0.00066% 0.10721% 0.01154% 0.13172% 0.20297% 0.55331% 0.09077% 2.63985% 7.33244% 86.74590% 100.00001%
Default revenue by function 34,089 8,424 13 2,087 - 225 2,564 3,952 10,772 - 1,767 - 51,394 142,752 1,688,821 1,946,860
User adjustments (887,992) 1,030,744 (142,752) -Adjusted revenue by function (853,903) 8,424 13 2,087 - 225 2,564 3,952 10,772 - 1,767 - 1,082,138 - 1,688,821 1,946,860

Monterey Peninsula UnifiedMonterey County
Unaudited Actuals2016-17 Unaudited Actuals
Conversion from Governmental Funds to Governmental ActivitiesIdentification of Program Revenues by Function
Detail
27 66092 0000000Report CNVRT
California Dept of EducationSACS Financial Reporting Software - 2017.2.0File: cnvrt (Rev 05/09/2007) Page 5 Printed: 9/6/2017 3:15 PM
Total Operating Grants & Contributions (from fundconsolidation worksheet) 26,032,854
Subtotal of Operating Grants and Contributions by function 12,467,698 1,949,473 64,955 1,332,742 23,354 4,162,508 1,369,095 22,294 10,772 899,125 1,696,219 2,034,619 26,032,854
User identification of conversion entries, adjustments, and rounding differences, by functio 832,919 832,919
Adjusted Operating Grants and Contributions by function (agrees to conversion workshee 13,300,617 1,949,473 64,955 1,332,742 23,354 4,162,508 1,369,095 22,294 10,772 - 899,125 - 1,696,219 2,034,619 26,865,773
Monterey Peninsula UnifiedMonterey County
Unaudited Actuals2016-17 Unaudited Actuals
Conversion from Governmental Funds to Governmental ActivitiesIdentification of Program Revenues by Function
Detail
27 66092 0000000Report CNVRT
California Dept of EducationSACS Financial Reporting Software - 2017.2.0File: cnvrt (Rev 05/09/2007) Page 6 Printed: 9/6/2017 3:15 PM
Capital Grants and Contributions: Governmental Activities Note: Extracted expenditures are not used as the basis for identification of Capital Grants and Contributions to functions. Capital Grants and Contributions are program revenues of the function that will utilize the aNote: Extracted expenditures are not used as the basis for identification of Capital Grants and Contributions to functions. Capital Grants and Contributions are program revenues of the function that will utilize the a
Funds Resource
ProgramRevenues by
Resource Function: 1000 2100 2420 2700 3600 3700 3900 4000 5000 6000 7200 7700 8100 8500 9000 Total
Total Capital Grants & Contributions (from fundconsolidation worksheet) -
Subtotal of Capital Grants and Contributions by function
User identification of conversion entries, adjustments, and rounding differences, by functio -
Adjusted Capital Grants and Contributions by function (agrees to conversion workshee - - - - - - - - - - - - - - -
Monterey Peninsula UnifiedMonterey County
Unaudited Actuals2016-17 Unaudited Actuals
Conversion from Governmental Funds to Governmental ActivitiesIdentification of Program Revenues by Function
Detail
27 66092 0000000Report CNVRT
California Dept of EducationSACS Financial Reporting Software - 2017.2.0File: cnvrt (Rev 05/09/2007) Page 7 Printed: 9/6/2017 3:15 PM
Charges for Services: Business-type Activities Extracted expenditures by function, default identification of program revenues by function, and user adjustmenExtracted expenditures by function, default identification of program revenues by function, and user adjustmen
Program Revenues
Funds Resource by Resource Function: 1000 2100 2420 2700 3600 3700 3900 4000 5000 6000 7200 7700 8100 8500 9000 Total
Total Charges for Services -
Adjusted Charges for Services by function
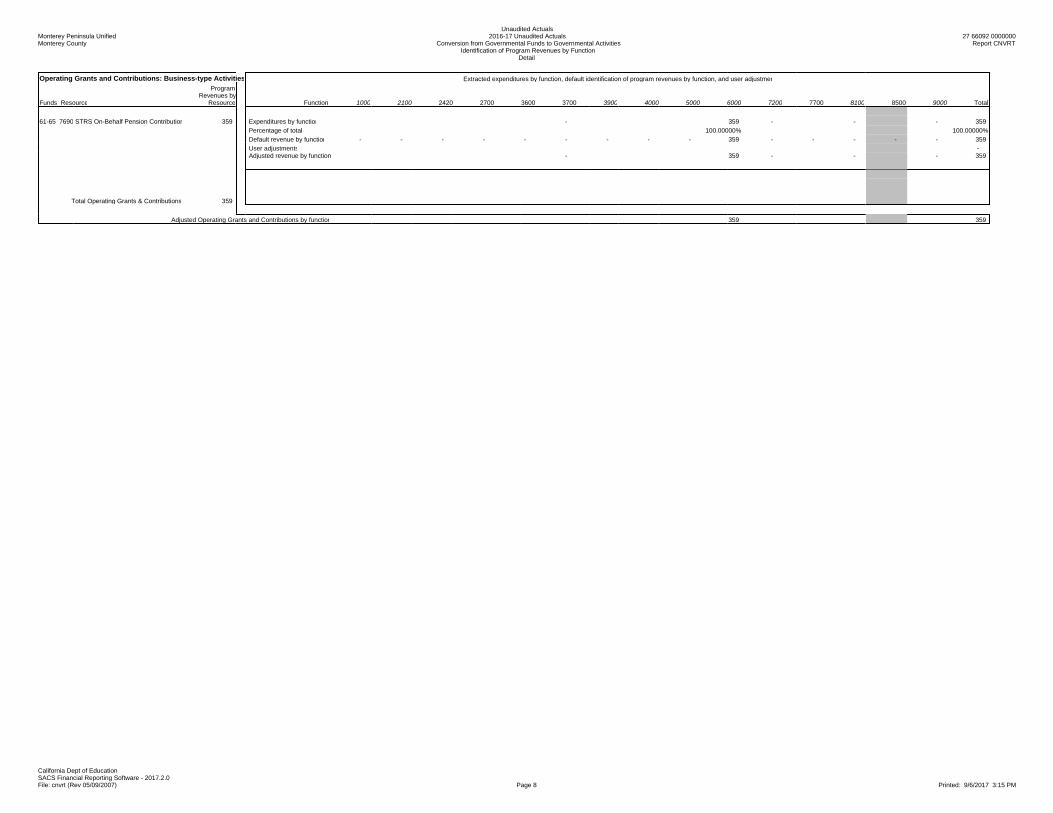
Monterey Peninsula UnifiedMonterey County
Unaudited Actuals2016-17 Unaudited Actuals
Conversion from Governmental Funds to Governmental ActivitiesIdentification of Program Revenues by Function
Detail
27 66092 0000000Report CNVRT
California Dept of EducationSACS Financial Reporting Software - 2017.2.0File: cnvrt (Rev 05/09/2007) Page 8 Printed: 9/6/2017 3:15 PM
Operating Grants and Contributions: Business-type Activities Extracted expenditures by function, default identification of program revenues by function, and user adjustmenExtracted expenditures by function, default identification of program revenues by function, and user adjustmen
Funds Resource
ProgramRevenues by
Resource Function: 1000 2100 2420 2700 3600 3700 3900 4000 5000 6000 7200 7700 8100 8500 9000 Total
61-65 7690 STRS On-Behalf Pension Contribution 359 Expenditures by function - 359 - - - 359
Percentage of total 100.00000% 100.00000%
Default revenue by function - - - - - - - - - 359 - - - - - 359
User adjustments -Adjusted revenue by function - 359 - - - 359
Total Operating Grants & Contributions 359
Adjusted Operating Grants and Contributions by function 359 359

Monterey Peninsula UnifiedMonterey County
Unaudited Actuals2016-17 Unaudited Actuals
Conversion from Governmental Funds to Governmental ActivitiesIdentification of Program Revenues by Function
Detail
27 66092 0000000Report CNVRT
California Dept of EducationSACS Financial Reporting Software - 2017.2.0File: cnvrt (Rev 05/09/2007) Page 9 Printed: 9/6/2017 3:15 PM
Capital Grants and Contributions: Business-type Activities Note: Extracted expenditures are not used as the basis for identification of Capital Grants and Contributions to functions. Capital Grants and Contributions are program revenues of the function that will utilize the aNote: Extracted expenditures are not used as the basis for identification of Capital Grants and Contributions to functions. Capital Grants and Contributions are program revenues of the function that will utilize the a
Funds Resource
ProgramRevenues by
Resource Function: 1000 2100 2420 2700 3600 3700 3900 4000 5000 6000 7200 7700 8100 8500 9000 Total
Total Capital Grants & Contributions -
Adjusted Capital Grants and Contributions by function
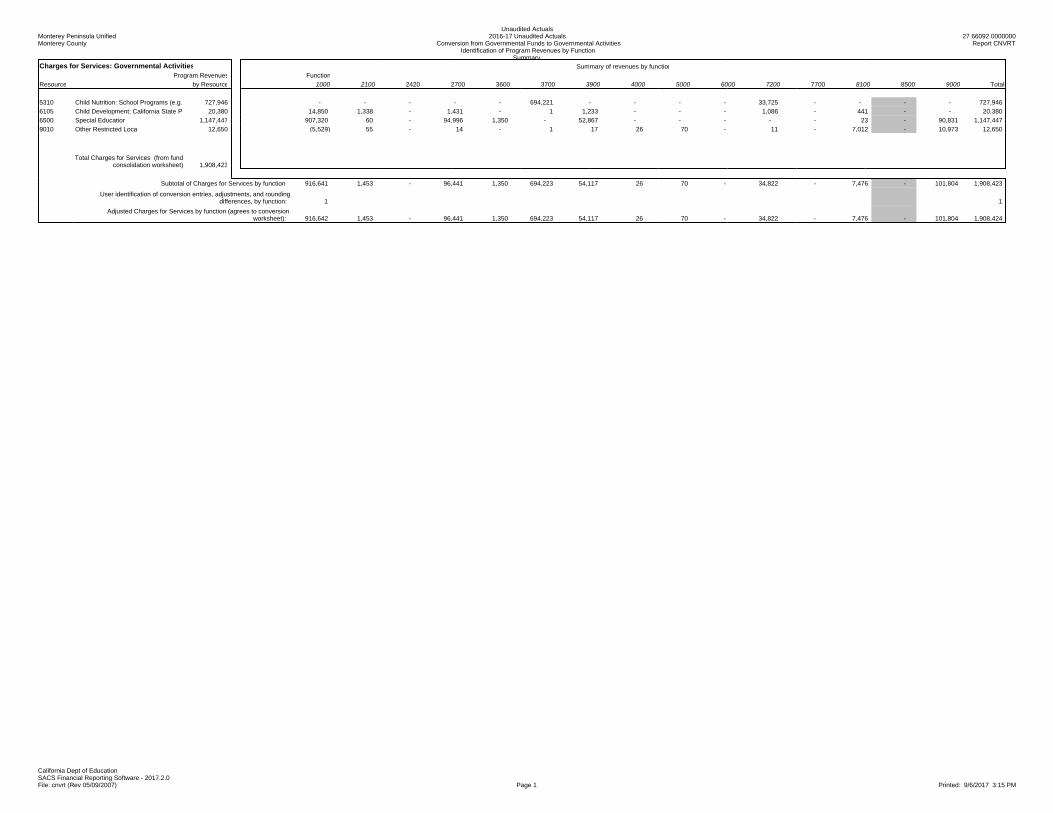
Monterey Peninsula UnifiedMonterey County
Unaudited Actuals2016-17 Unaudited Actuals
Conversion from Governmental Funds to Governmental ActivitiesIdentification of Program Revenues by Function
Summary
27 66092 0000000Report CNVRT
California Dept of EducationSACS Financial Reporting Software - 2017.2.0File: cnvrt (Rev 05/09/2007) Page 1 Printed: 9/6/2017 3:15 PM
Charges for Services: Governmental Activities Summary of revenues by functionSummary of revenues by function
Program Revenues Function
Resource by Resource 1000 2100 2420 2700 3600 3700 3900 4000 5000 6000 7200 7700 8100 8500 9000 Total
5310 Child Nutrition: School Programs (e.g. 727,946 - - - - - 694,221 - - - - 33,725 - - - - 727,946
6105 Child Development: California State P 20,380 14,850 1,338 - 1,431 - 1 1,233 - - - 1,086 - 441 - - 20,380
6500 Special Education 1,147,447 907,320 60 - 94,996 1,350 - 52,867 - - - - - 23 - 90,831 1,147,447
9010 Other Restricted Loca 12,650 (5,529) 55 - 14 - 1 17 26 70 - 11 - 7,012 - 10,973 12,650
Total Charges for Services (from fundconsolidation worksheet) 1,908,423
Subtotal of Charges for Services by function 916,641 1,453 - 96,441 1,350 694,223 54,117 26 70 - 34,822 - 7,476 - 101,804 1,908,423
User identification of conversion entries, adjustments, and roundingdifferences, by function: 1 1
Adjusted Charges for Services by function (agrees to conversionworksheet): 916,642 1,453 - 96,441 1,350 694,223 54,117 26 70 - 34,822 - 7,476 - 101,804 1,908,424

Monterey Peninsula UnifiedMonterey County
Unaudited Actuals2016-17 Unaudited Actuals
Conversion from Governmental Funds to Governmental ActivitiesIdentification of Program Revenues by Function
Summary
27 66092 0000000Report CNVRT
California Dept of EducationSACS Financial Reporting Software - 2017.2.0File: cnvrt (Rev 05/09/2007) Page 2 Printed: 9/6/2017 3:15 PM
Operating Grants and Contributions: Governmental Activitie Summary of revenues by functionSummary of revenues by function
Resource
ProgramRevenues by
ResourceFunction
1000 2100 2420 2700 3600 3700 3900 4000 5000 6000 7200 7700 8100 8500 9000 Total
3010 NCLB: Title I, Part A, Basic Grants Low 1,957,154 1,130,005 509,844 62,419 - - - 108,567 - - - 146,319 - - - - 1,957,154
3310 Special Ed: IDEA Basic Local Assistan 1,857,466 1,440,312 - - - - - 318,152 - - - 99,002 - - - - 1,857,466
3385 Special Ed: IDEA Early Intervention G 15,658 - - - - - - 14,823 - - - 835 - - - - 15,658
3550 Carl D. Perkins Career and Technical 88,132 83,617 318 - - - - - - - - 4,197 - - - - 88,132
3905 Adult Education: Adult Basic Educatio 74,830 29,602 44,258 - 970 - - - - - - - - - - - 74,830
3913 Adult Education: Adult Secondary Edu 90,375 90,375 - - - - - - - - - - - - - - 90,375
3926 Adult Education: English Literacy & C 25,853 25,853 - - - - - - - - - - - - - - 25,853
4035 ESEA: Title II, Part A, Teacher Quality 417,311 89,717 284,741 - - - - - - - - 42,853 - - - - 417,311
4201 ESEA: Title III, Immigrant Education P 21,553 14,430 5,974 - - - - - - - - 1,149 - - - - 21,553
4203 ESEA: Title III, English Learner Stude 339,928 37,837 295,469 - - - - - - - - 6,622 - - - - 339,928
5210 Head Start 452,128 285,438 45,218 - 64,495 - - - - - - 24,095 - 32,882 - - 452,128
5310 Child Nutrition: School Programs (e.g. 4,164,123 - - - - - 3,971,205 - - - - 192,918 - - - - 4,164,123
5320 Child Nutrition: Child Care Food Progr 77,344 - - - - - 73,717 - - - - 3,627 - - - - 77,344
5340 Child Nutrition: CCFP Cash in Lieu of 5,629 - - - - - 5,365 - - - - 264 - - - - 5,629
5370 Child Nutrition: Fresh Fruit and Vegeta 96,761 - - - - - 92,224 - - - - 4,537 - - - - 96,761
5380 Child Nutrition: School Breakfast Start 7,222 - - - - - 7,222 - - - - - - - - - 7,222
5454 Child Nutrition: Team Nutrition 13,068 - - - - - 12,455 - - - - 613 - - - - 13,068
5640 Medi-Cal Billing Option 238,453 - - - - - - 225,744 - - - 12,709 - - - - 238,453
5810 Other Restricted Federa 398,450 190,245 140,345 - 354 - - 67,506 - - - - - - - - 398,450
6010 After School Education and Safety (AS 856,514 733,992 80,975 - 1,136 - - - - - - 40,411 - - - - 856,514
6105 Child Development: California State P 1,637,981 1,193,536 107,501 - 115,031 - 95 99,071 - - - 87,303 - 35,444 - - 1,637,981
6130 Child Development: Center-Based Re 7 7 - - - - - - - - - - - - - - 7
6230 California Clean Energy Jobs Ac 572,108 - - - 3,381 - - - - - - 51,466 - 517,261 - - 572,108
6264 Educator Effectiveness (15-16) 2,196 909 1,171 - - - - - - - - 116 - - - - 2,196
6300 Lottery: Instructional Materials 482,499 482,499 - - - - - - - - - - - - - - 482,499
6387 Career Technical Education Incentive 175,035 148,101 17,605 - - - - - - - - 9,329 - - - - 175,035
6391 Adult Education Block Grant Program 752,782 322,478 31,996 - 345,885 - - 9,908 - - - 40,123 - 2,392 - - 752,782
6392 Adult Education Block Grant Data and 31,364 31,364 - - - - - - - - - - - - - - 31,364
6500 Special Education 4,192,671 3,315,265 219 - 347,109 4,934 - 193,173 - - - - - 84 - 331,887 4,192,671
6510 Special Ed: Early Ed Individuals with E 397,206 238,062 - - 77,203 2,459 - 65,571 - - - - - - - 13,911 397,206
6512 Special Ed: Mental Health Services 417,668 215,415 - - 63,849 15,961 - 100,182 - - - 22,261 - - - - 417,668
6520 Special Ed: Project Workability I LEA 131,096 99,268 23,438 - 1,415 - - - - - - 6,975 - - - - 131,096
7220 Partnership Academies Program 149,523 113,196 11,628 - 16,730 - - - - - - 7,969 - - - - 149,523
7338 College Readiness Block Gran 279,612 102,350 162,358 - - - - - - - - 14,904 - - - - 279,612
7690 STRS On-Behalf Pension Contribution 3,645,668 2,907,728 177,991 2,523 293,097 - - 163,834 18,342 - - 76,761 - 5,392 - - 3,645,668
8150 Ongoing & Major Maintenance Accoun 20,626 - - - - - - - - - - - - 20,626 - - 20,626
9010 Other Restricted Loca 1,946,860 (853,903) 8,424 13 2,087 - 225 2,564 3,952 10,772 - 1,767 - 1,082,138 - 1,688,821 1,946,860
Total Operating Grants & Contributions (from fundconsolidation worksheet) 26,032,854
Subtotal of Operating Grants and Contributions by function 12,467,698 1,949,473 64,955 1,332,742 23,354 4,162,508 1,369,095 22,294 10,772 - 899,125 - 1,696,219 - 2,034,619 26,032,854
User identification of conversion entries, adjustments, and roundingdifferences, by function: 832,919 832,919
Adjusted Operating Grants and Contributions by function (agrees toconversion worksheet): 13,300,617 1,949,473 64,955 1,332,742 23,354 4,162,508 1,369,095 22,294 10,772 - 899,125 - 1,696,219 - 2,034,619 26,865,773
Monterey Peninsula UnifiedMonterey County
Unaudited Actuals2016-17 Unaudited Actuals
Conversion from Governmental Funds to Governmental ActivitiesIdentification of Program Revenues by Function
Summary
27 66092 0000000Report CNVRT
California Dept of EducationSACS Financial Reporting Software - 2017.2.0File: cnvrt (Rev 05/09/2007) Page 3 Printed: 9/6/2017 3:15 PM
Capital Grants and Contributions: Governmental Activities Summary of revenues by functionSummary of revenues by function
Resource
ProgramRevenues by
ResourceFunction
1000 2100 2420 2700 3600 3700 3900 4000 5000 6000 7200 7700 8100 8500 9000 Total
Total Capital Grants & Contributions (from fundconsolidation worksheet) -
Subtotal of Capital Grants and Contributions by function - -
User identification of conversion entries, adjustments, and roundingdifferences, by function: -
Adjusted Capital Grants and Contributions by function (agrees to conversionworksheet): - - - - - - - - - - - - - - - -
Monterey Peninsula UnifiedMonterey County
Unaudited Actuals2016-17 Unaudited Actuals
Conversion from Governmental Funds to Governmental ActivitiesIdentification of Program Revenues by Function
Summary
27 66092 0000000Report CNVRT
California Dept of EducationSACS Financial Reporting Software - 2017.2.0File: cnvrt (Rev 05/09/2007) Page 4 Printed: 9/6/2017 3:15 PM
Charges for Services: Business-type Activities Summary of revenues by functionSummary of revenues by function
Program Revenues Function
Resource by Resource 1000 2100 2420 2700 3600 3700 3900 4000 5000 6000 7200 7700 8100 8500 9000 Total
Total Charges for Services -
Adjusted Charges for Services by function

Monterey Peninsula UnifiedMonterey County
Unaudited Actuals2016-17 Unaudited Actuals
Conversion from Governmental Funds to Governmental ActivitiesIdentification of Program Revenues by Function
Summary
27 66092 0000000Report CNVRT
California Dept of EducationSACS Financial Reporting Software - 2017.2.0File: cnvrt (Rev 05/09/2007) Page 5 Printed: 9/6/2017 3:15 PM
Operating Grants and Contributions: Business-type Activitie Summary of revenues by functionSummary of revenues by function
Resource
ProgramRevenues by
ResourceFunction
1000 2100 2420 2700 3600 3700 3900 4000 5000 6000 7200 7700 8100 8500 9000 Total
7690 STRS On-Behalf Pension Contribution 359 - 359 - - - - 359
Total Operating Grants & Contributions 359
Adjusted Operating Grants and Contributions by function 359 359
Monterey Peninsula UnifiedMonterey County
Unaudited Actuals2016-17 Unaudited Actuals
Conversion from Governmental Funds to Governmental ActivitiesIdentification of Program Revenues by Function
Summary
27 66092 0000000Report CNVRT
California Dept of EducationSACS Financial Reporting Software - 2017.2.0File: cnvrt (Rev 05/09/2007) Page 6 Printed: 9/6/2017 3:15 PM
Capital Grants and Contributions: Business-type Activities Summary of revenues by functionSummary of revenues by function
Resource
ProgramRevenues by
ResourceFunction
1000 2100 2420 2700 3600 3700 3900 4000 5000 6000 7200 7700 8100 8500 9000 Total
Total Capital Grants & Contributions -
Adjusted Capital Grants and Contributions by function

Monterey Peninsula UnifiedMonterey County
Unaudited ActualsComponents of Ending Fund Balance/Net Position 27 66092 0000000
Form CEFB:01:0000
California Dept of EducationSACS Financial Reporting Software - 2017.2.0File: cefb (REV 06/11/2013) Page 1 of 1 Printed: 9/6/2017 2:52 PM
Fund: 01 General FundResource: 0000 Unrestricted
Description Object2016-17
Unaudited ActualsEnding Fund Balance 979Z 15,253,567.77
Components of Ending Fund Balance Nonspendable Revolving Cash 9711 22,000.00 Stores 9712 0.00 Prepaid Expenditures 9713 62,908.15 All Others 9719 0.00
Restricted 9740 0.00
Committed Stabilization Arrangements 9750 0.00 Other Commitments 9760 0.00 Assigned Other Assignments 9780 11,752,502.65
Estimated vacation liability 9780 25,000.00Set aside for 2017/18 deficit (17/18 July 1 Budget) 9780 4,134,100.18Set aside for 2018/19 deficit (17/18 July 1 Budget) 9780 4,738,028.61Set aside for 2019/20 deficit (17/18 July 1 Budget) 9780 2,855,373.86
Unassigned/Unappropriated Reserve for Economic Uncertainties 9789 3,416,156.97 Unassigned/Unappropriated 9790 0.00
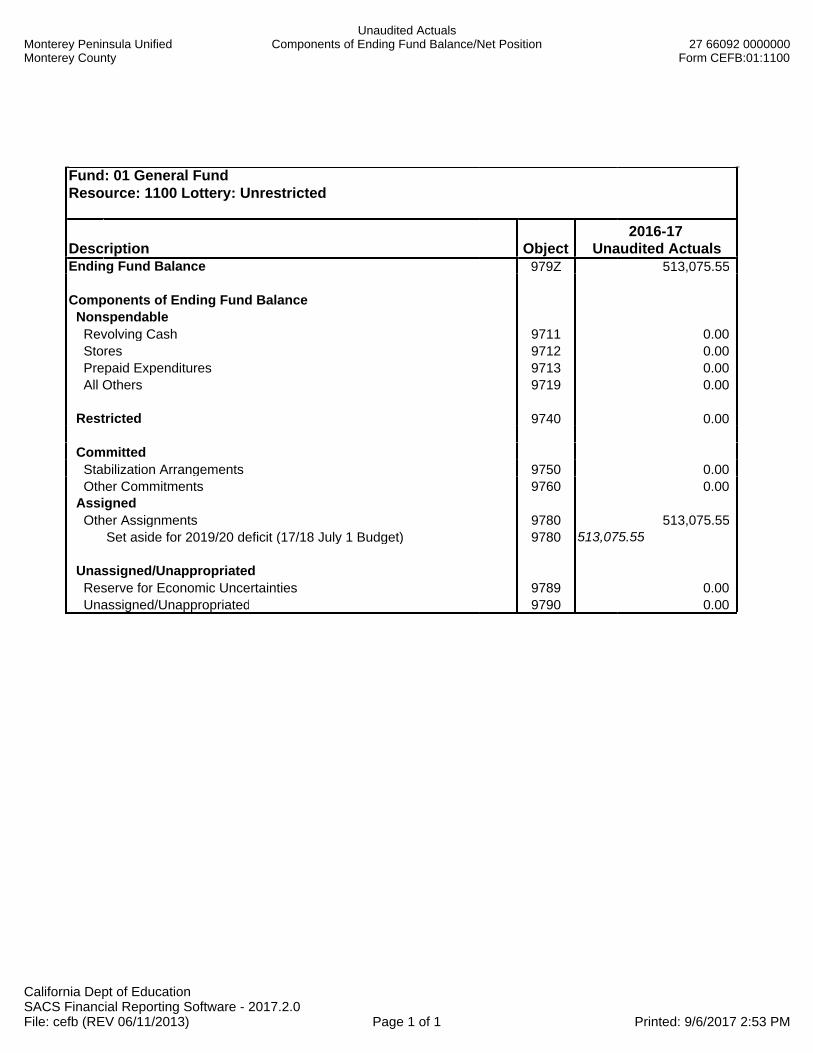
Monterey Peninsula UnifiedMonterey County
Unaudited ActualsComponents of Ending Fund Balance/Net Position 27 66092 0000000
Form CEFB:01:1100
California Dept of EducationSACS Financial Reporting Software - 2017.2.0File: cefb (REV 06/11/2013) Page 1 of 1 Printed: 9/6/2017 2:53 PM
Fund: 01 General FundResource: 1100 Lottery: Unrestricted
Description Object2016-17
Unaudited ActualsEnding Fund Balance 979Z 513,075.55
Components of Ending Fund Balance Nonspendable Revolving Cash 9711 0.00 Stores 9712 0.00 Prepaid Expenditures 9713 0.00 All Others 9719 0.00
Restricted 9740 0.00
Committed Stabilization Arrangements 9750 0.00 Other Commitments 9760 0.00 Assigned Other Assignments 9780 513,075.55
Set aside for 2019/20 deficit (17/18 July 1 Budget) 9780 513,075.55
Unassigned/Unappropriated Reserve for Economic Uncertainties 9789 0.00 Unassigned/Unappropriated 9790 0.00
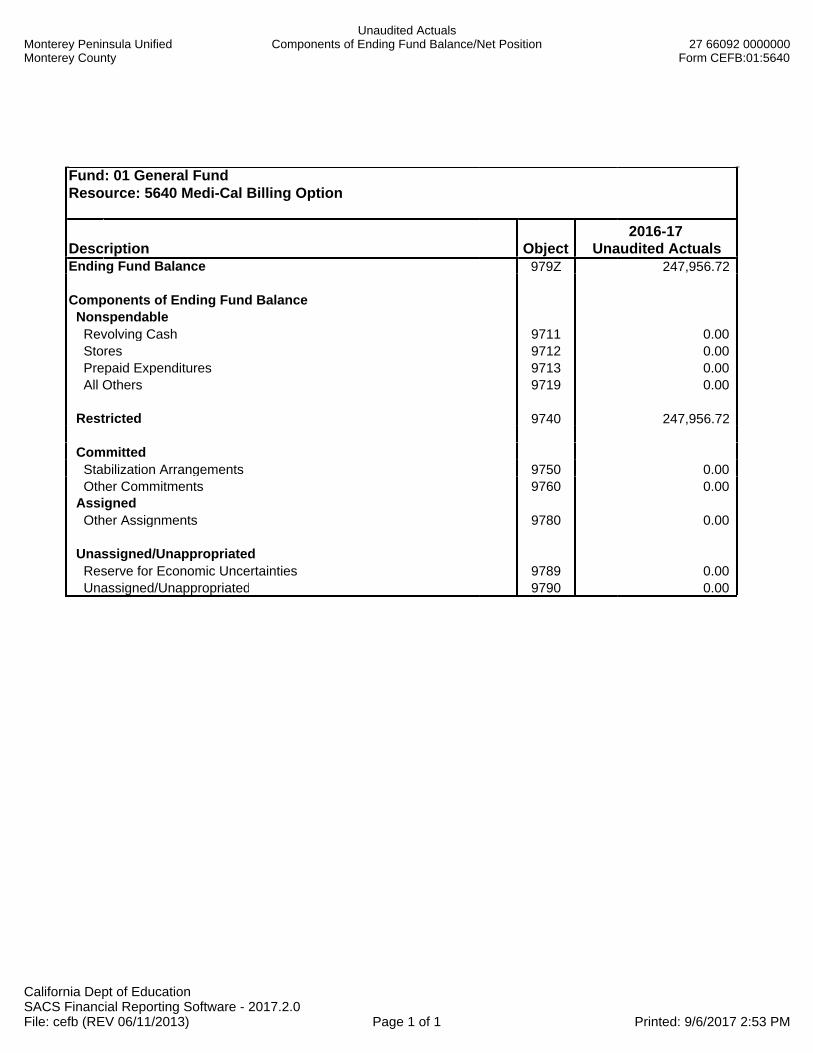
Monterey Peninsula UnifiedMonterey County
Unaudited ActualsComponents of Ending Fund Balance/Net Position 27 66092 0000000
Form CEFB:01:5640
California Dept of EducationSACS Financial Reporting Software - 2017.2.0File: cefb (REV 06/11/2013) Page 1 of 1 Printed: 9/6/2017 2:53 PM
Fund: 01 General FundResource: 5640 Medi-Cal Billing Option
Description Object2016-17
Unaudited ActualsEnding Fund Balance 979Z 247,956.72
Components of Ending Fund Balance Nonspendable Revolving Cash 9711 0.00 Stores 9712 0.00 Prepaid Expenditures 9713 0.00 All Others 9719 0.00
Restricted 9740 247,956.72
Committed Stabilization Arrangements 9750 0.00 Other Commitments 9760 0.00 Assigned Other Assignments 9780 0.00
Unassigned/Unappropriated Reserve for Economic Uncertainties 9789 0.00 Unassigned/Unappropriated 9790 0.00

Monterey Peninsula UnifiedMonterey County
Unaudited ActualsComponents of Ending Fund Balance/Net Position 27 66092 0000000
Form CEFB:01:6264
California Dept of EducationSACS Financial Reporting Software - 2017.2.0File: cefb (REV 06/11/2013) Page 1 of 1 Printed: 9/6/2017 2:54 PM
Fund: 01 General FundResource: 6264 Educator Effectiveness (15-16)
Description Object2016-17
Unaudited ActualsEnding Fund Balance 979Z 38,850.40
Components of Ending Fund Balance Nonspendable Revolving Cash 9711 0.00 Stores 9712 0.00 Prepaid Expenditures 9713 0.00 All Others 9719 0.00
Restricted 9740 38,850.40
Committed Stabilization Arrangements 9750 0.00 Other Commitments 9760 0.00 Assigned Other Assignments 9780 0.00
Unassigned/Unappropriated Reserve for Economic Uncertainties 9789 0.00 Unassigned/Unappropriated 9790 0.00

Monterey Peninsula UnifiedMonterey County
Unaudited ActualsComponents of Ending Fund Balance/Net Position 27 66092 0000000
Form CEFB:01:6300
California Dept of EducationSACS Financial Reporting Software - 2017.2.0File: cefb (REV 06/11/2013) Page 1 of 1 Printed: 9/6/2017 2:54 PM
Fund: 01 General FundResource: 6300 Lottery: Instructional Materials
Description Object2016-17
Unaudited ActualsEnding Fund Balance 979Z 7,083.12
Components of Ending Fund Balance Nonspendable Revolving Cash 9711 0.00 Stores 9712 0.00 Prepaid Expenditures 9713 0.00 All Others 9719 0.00
Restricted 9740 7,083.12
Committed Stabilization Arrangements 9750 0.00 Other Commitments 9760 0.00 Assigned Other Assignments 9780 0.00
Unassigned/Unappropriated Reserve for Economic Uncertainties 9789 0.00 Unassigned/Unappropriated 9790 0.00

Monterey Peninsula UnifiedMonterey County
Unaudited ActualsComponents of Ending Fund Balance/Net Position 27 66092 0000000
Form CEFB:01:6512
California Dept of EducationSACS Financial Reporting Software - 2017.2.0File: cefb (REV 06/11/2013) Page 1 of 1 Printed: 9/6/2017 2:55 PM
Fund: 01 General FundResource: 6512 Special Ed: Mental Health Services
Description Object2016-17
Unaudited ActualsEnding Fund Balance 979Z 191,969.07
Components of Ending Fund Balance Nonspendable Revolving Cash 9711 0.00 Stores 9712 0.00 Prepaid Expenditures 9713 0.00 All Others 9719 0.00
Restricted 9740 191,969.07
Committed Stabilization Arrangements 9750 0.00 Other Commitments 9760 0.00 Assigned Other Assignments 9780 0.00
Unassigned/Unappropriated Reserve for Economic Uncertainties 9789 0.00 Unassigned/Unappropriated 9790 0.00

Monterey Peninsula UnifiedMonterey County
Unaudited ActualsComponents of Ending Fund Balance/Net Position 27 66092 0000000
Form CEFB:01:7338
California Dept of EducationSACS Financial Reporting Software - 2017.2.0File: cefb (REV 06/11/2013) Page 1 of 1 Printed: 9/6/2017 2:55 PM
Fund: 01 General FundResource: 7338 College Readiness Block Grant
Description Object2016-17
Unaudited ActualsEnding Fund Balance 979Z 202,634.39
Components of Ending Fund Balance Nonspendable Revolving Cash 9711 0.00 Stores 9712 0.00 Prepaid Expenditures 9713 0.00 All Others 9719 0.00
Restricted 9740 202,634.39
Committed Stabilization Arrangements 9750 0.00 Other Commitments 9760 0.00 Assigned Other Assignments 9780 0.00
Unassigned/Unappropriated Reserve for Economic Uncertainties 9789 0.00 Unassigned/Unappropriated 9790 0.00

Monterey Peninsula UnifiedMonterey County
Unaudited ActualsComponents of Ending Fund Balance/Net Position 27 66092 0000000
Form CEFB:01:9010
California Dept of EducationSACS Financial Reporting Software - 2017.2.0File: cefb (REV 06/11/2013) Page 1 of 1 Printed: 9/6/2017 2:55 PM
Fund: 01 General FundResource: 9010 Other Restricted Local
Description Object2016-17
Unaudited ActualsEnding Fund Balance 979Z 713,003.37
Components of Ending Fund Balance Nonspendable Revolving Cash 9711 0.00 Stores 9712 0.00 Prepaid Expenditures 9713 0.00 All Others 9719 0.00
Restricted 9740 713,003.37
Committed Stabilization Arrangements 9750 0.00 Other Commitments 9760 0.00 Assigned Other Assignments 9780 0.00
Unassigned/Unappropriated Reserve for Economic Uncertainties 9789 0.00 Unassigned/Unappropriated 9790 0.00

Monterey Peninsula UnifiedMonterey County
Unaudited ActualsComponents of Ending Fund Balance/Net Position 27 66092 0000000
Form CEFB:09:0000
California Dept of EducationSACS Financial Reporting Software - 2017.2.0File: cefb (REV 06/11/2013) Page 1 of 1 Printed: 9/6/2017 2:56 PM
Fund: 09 Charter Schools Special Revenue FundResource: 0000 Unrestricted
Description Object2016-17
Unaudited ActualsEnding Fund Balance 979Z 674,082.05
Components of Ending Fund Balance Nonspendable Revolving Cash 9711 0.00 Stores 9712 0.00 Prepaid Expenditures 9713 600.00 All Others 9719 0.00
Restricted 9740 0.00
Committed Stabilization Arrangements 9750 0.00 Other Commitments 9760 0.00 Assigned Other Assignments 9780 673,482.05
Unassigned/Unappropriated Reserve for Economic Uncertainties 9789 0.00 Unassigned/Unappropriated 9790 0.00

Monterey Peninsula UnifiedMonterey County
Unaudited ActualsComponents of Ending Fund Balance/Net Position 27 66092 0000000
Form CEFB:09:1100
California Dept of EducationSACS Financial Reporting Software - 2017.2.0File: cefb (REV 06/11/2013) Page 1 of 1 Printed: 9/6/2017 2:56 PM
Fund: 09 Charter Schools Special Revenue FundResource: 1100 Lottery: Unrestricted
Description Object2016-17
Unaudited ActualsEnding Fund Balance 979Z 169,516.84
Components of Ending Fund Balance Nonspendable Revolving Cash 9711 0.00 Stores 9712 0.00 Prepaid Expenditures 9713 0.00 All Others 9719 0.00
Restricted 9740 0.00
Committed Stabilization Arrangements 9750 0.00 Other Commitments 9760 0.00 Assigned Other Assignments 9780 169,516.84
Unassigned/Unappropriated Reserve for Economic Uncertainties 9789 0.00 Unassigned/Unappropriated 9790 0.00

Monterey Peninsula UnifiedMonterey County
Unaudited ActualsComponents of Ending Fund Balance/Net Position 27 66092 0000000
Form CEFB:09:6264
California Dept of EducationSACS Financial Reporting Software - 2017.2.0File: cefb (REV 06/11/2013) Page 1 of 1 Printed: 9/6/2017 2:56 PM
Fund: 09 Charter Schools Special Revenue FundResource: 6264 Educator Effectiveness (15-16)
Description Object2016-17
Unaudited ActualsEnding Fund Balance 979Z 6,974.13
Components of Ending Fund Balance Nonspendable Revolving Cash 9711 0.00 Stores 9712 0.00 Prepaid Expenditures 9713 0.00 All Others 9719 0.00
Restricted 9740 6,974.13
Committed Stabilization Arrangements 9750 0.00 Other Commitments 9760 0.00 Assigned Other Assignments 9780 0.00
Unassigned/Unappropriated Reserve for Economic Uncertainties 9789 0.00 Unassigned/Unappropriated 9790 0.00

Monterey Peninsula UnifiedMonterey County
Unaudited ActualsComponents of Ending Fund Balance/Net Position 27 66092 0000000
Form CEFB:09:9010
California Dept of EducationSACS Financial Reporting Software - 2017.2.0File: cefb (REV 06/11/2013) Page 1 of 1 Printed: 9/6/2017 2:57 PM
Fund: 09 Charter Schools Special Revenue FundResource: 9010 Other Restricted Local
Description Object2016-17
Unaudited ActualsEnding Fund Balance 979Z 77,001.51
Components of Ending Fund Balance Nonspendable Revolving Cash 9711 0.00 Stores 9712 0.00 Prepaid Expenditures 9713 0.00 All Others 9719 0.00
Restricted 9740 77,001.51
Committed Stabilization Arrangements 9750 0.00 Other Commitments 9760 0.00 Assigned Other Assignments 9780 0.00
Unassigned/Unappropriated Reserve for Economic Uncertainties 9789 0.00 Unassigned/Unappropriated 9790 0.00
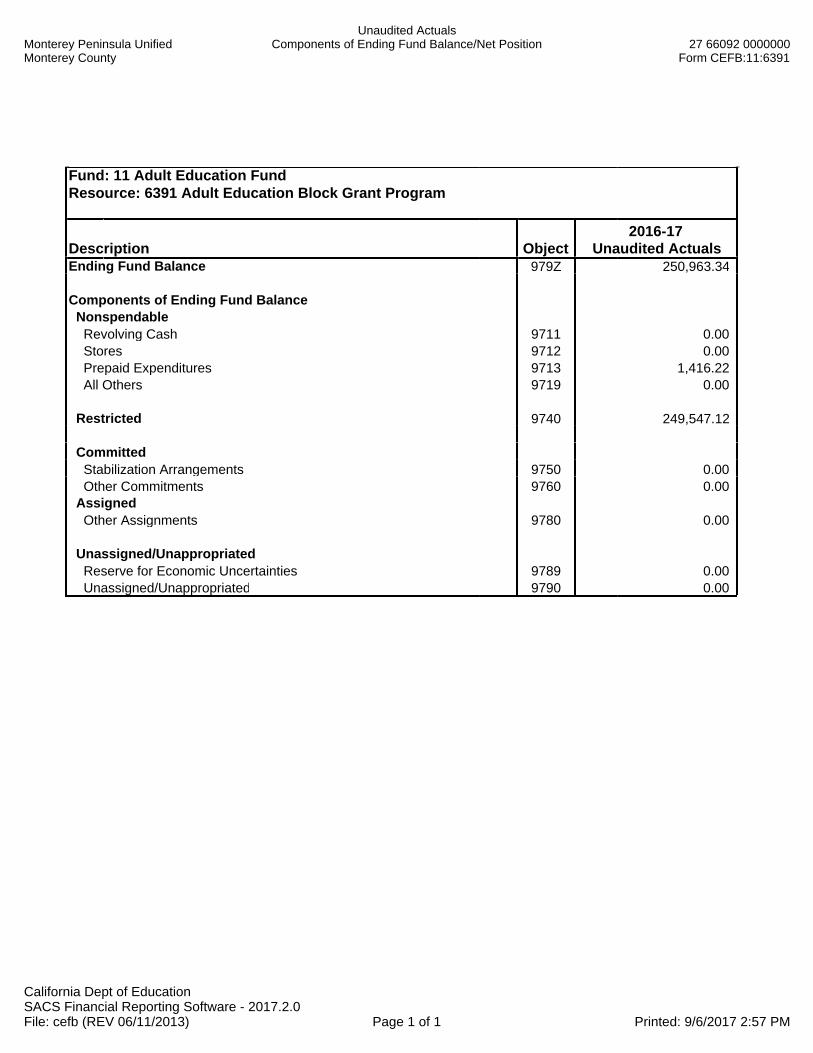
Monterey Peninsula UnifiedMonterey County
Unaudited ActualsComponents of Ending Fund Balance/Net Position 27 66092 0000000
Form CEFB:11:6391
California Dept of EducationSACS Financial Reporting Software - 2017.2.0File: cefb (REV 06/11/2013) Page 1 of 1 Printed: 9/6/2017 2:57 PM
Fund: 11 Adult Education FundResource: 6391 Adult Education Block Grant Program
Description Object2016-17
Unaudited ActualsEnding Fund Balance 979Z 250,963.34
Components of Ending Fund Balance Nonspendable Revolving Cash 9711 0.00 Stores 9712 0.00 Prepaid Expenditures 9713 1,416.22 All Others 9719 0.00
Restricted 9740 249,547.12
Committed Stabilization Arrangements 9750 0.00 Other Commitments 9760 0.00 Assigned Other Assignments 9780 0.00
Unassigned/Unappropriated Reserve for Economic Uncertainties 9789 0.00 Unassigned/Unappropriated 9790 0.00
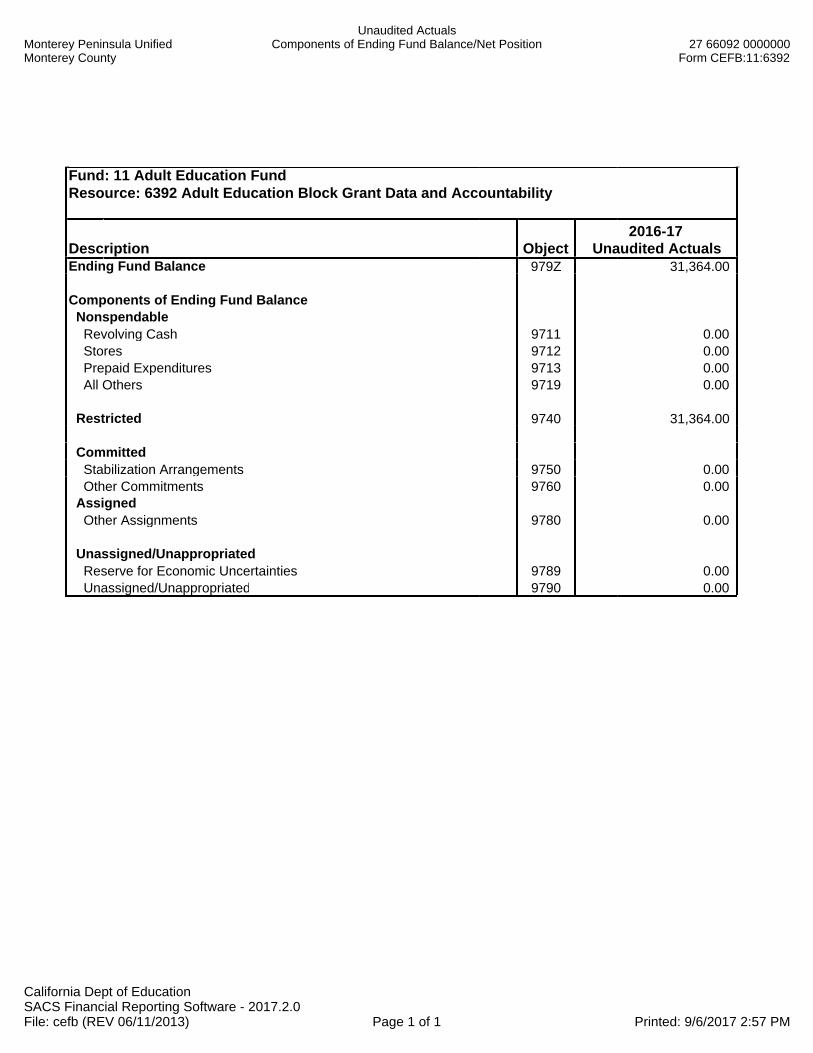
Monterey Peninsula UnifiedMonterey County
Unaudited ActualsComponents of Ending Fund Balance/Net Position 27 66092 0000000
Form CEFB:11:6392
California Dept of EducationSACS Financial Reporting Software - 2017.2.0File: cefb (REV 06/11/2013) Page 1 of 1 Printed: 9/6/2017 2:57 PM
Fund: 11 Adult Education FundResource: 6392 Adult Education Block Grant Data and Accountability
Description Object2016-17
Unaudited ActualsEnding Fund Balance 979Z 31,364.00
Components of Ending Fund Balance Nonspendable Revolving Cash 9711 0.00 Stores 9712 0.00 Prepaid Expenditures 9713 0.00 All Others 9719 0.00
Restricted 9740 31,364.00
Committed Stabilization Arrangements 9750 0.00 Other Commitments 9760 0.00 Assigned Other Assignments 9780 0.00
Unassigned/Unappropriated Reserve for Economic Uncertainties 9789 0.00 Unassigned/Unappropriated 9790 0.00

Monterey Peninsula UnifiedMonterey County
Unaudited ActualsComponents of Ending Fund Balance/Net Position 27 66092 0000000
Form CEFB:11:9010
California Dept of EducationSACS Financial Reporting Software - 2017.2.0File: cefb (REV 06/11/2013) Page 1 of 1 Printed: 9/6/2017 2:58 PM
Fund: 11 Adult Education FundResource: 9010 Other Restricted Local
Description Object2016-17
Unaudited ActualsEnding Fund Balance 979Z 46,304.23
Components of Ending Fund Balance Nonspendable Revolving Cash 9711 0.00 Stores 9712 0.00 Prepaid Expenditures 9713 0.00 All Others 9719 0.00
Restricted 9740 46,304.23
Committed Stabilization Arrangements 9750 0.00 Other Commitments 9760 0.00 Assigned Other Assignments 9780 0.00
Unassigned/Unappropriated Reserve for Economic Uncertainties 9789 0.00 Unassigned/Unappropriated 9790 0.00

Monterey Peninsula UnifiedMonterey County
Unaudited ActualsComponents of Ending Fund Balance/Net Position 27 66092 0000000
Form CEFB:12:6130
California Dept of EducationSACS Financial Reporting Software - 2017.2.0File: cefb (REV 06/11/2013) Page 1 of 1 Printed: 9/6/2017 2:58 PM
Fund: 12 Child Development FundResource: 6130 Child Development: Center-Based Reserve Account
Description Object2016-17
Unaudited ActualsEnding Fund Balance 979Z 15,802.90
Components of Ending Fund Balance Nonspendable Revolving Cash 9711 0.00 Stores 9712 0.00 Prepaid Expenditures 9713 0.00 All Others 9719 0.00
Restricted 9740 15,802.90
Committed Stabilization Arrangements 9750 0.00 Other Commitments 9760 0.00 Assigned Other Assignments 9780 0.00
Unassigned/Unappropriated Reserve for Economic Uncertainties 9789 0.00 Unassigned/Unappropriated 9790 0.00

Monterey Peninsula UnifiedMonterey County
Unaudited ActualsComponents of Ending Fund Balance/Net Position 27 66092 0000000
Form CEFB:12:9010
California Dept of EducationSACS Financial Reporting Software - 2017.2.0File: cefb (REV 06/11/2013) Page 1 of 1 Printed: 9/6/2017 2:58 PM
Fund: 12 Child Development FundResource: 9010 Other Restricted Local
Description Object2016-17
Unaudited ActualsEnding Fund Balance 979Z 199.28
Components of Ending Fund Balance Nonspendable Revolving Cash 9711 0.00 Stores 9712 0.00 Prepaid Expenditures 9713 0.00 All Others 9719 0.00
Restricted 9740 199.28
Committed Stabilization Arrangements 9750 0.00 Other Commitments 9760 0.00 Assigned Other Assignments 9780 0.00
Unassigned/Unappropriated Reserve for Economic Uncertainties 9789 0.00 Unassigned/Unappropriated 9790 0.00

Monterey Peninsula UnifiedMonterey County
Unaudited ActualsComponents of Ending Fund Balance/Net Position 27 66092 0000000
Form CEFB:13:5310
California Dept of EducationSACS Financial Reporting Software - 2017.2.0File: cefb (REV 06/11/2013) Page 1 of 1 Printed: 9/6/2017 2:59 PM
Fund: 13 Cafeteria Special Revenue FundResource: 5310 Child Nutrition: School Programs (e.g., School Lunch, School Breakfast, Milk,Pr
Description Object2016-17
Unaudited ActualsEnding Fund Balance 979Z 2,036,823.95
Components of Ending Fund Balance Nonspendable Revolving Cash 9711 0.00 Stores 9712 266,406.75 Prepaid Expenditures 9713 0.00 All Others 9719 0.00
Restricted 9740 1,770,417.20
Committed Stabilization Arrangements 9750 0.00 Other Commitments 9760 0.00 Assigned Other Assignments 9780 0.00
Unassigned/Unappropriated Reserve for Economic Uncertainties 9789 0.00 Unassigned/Unappropriated 9790 0.00
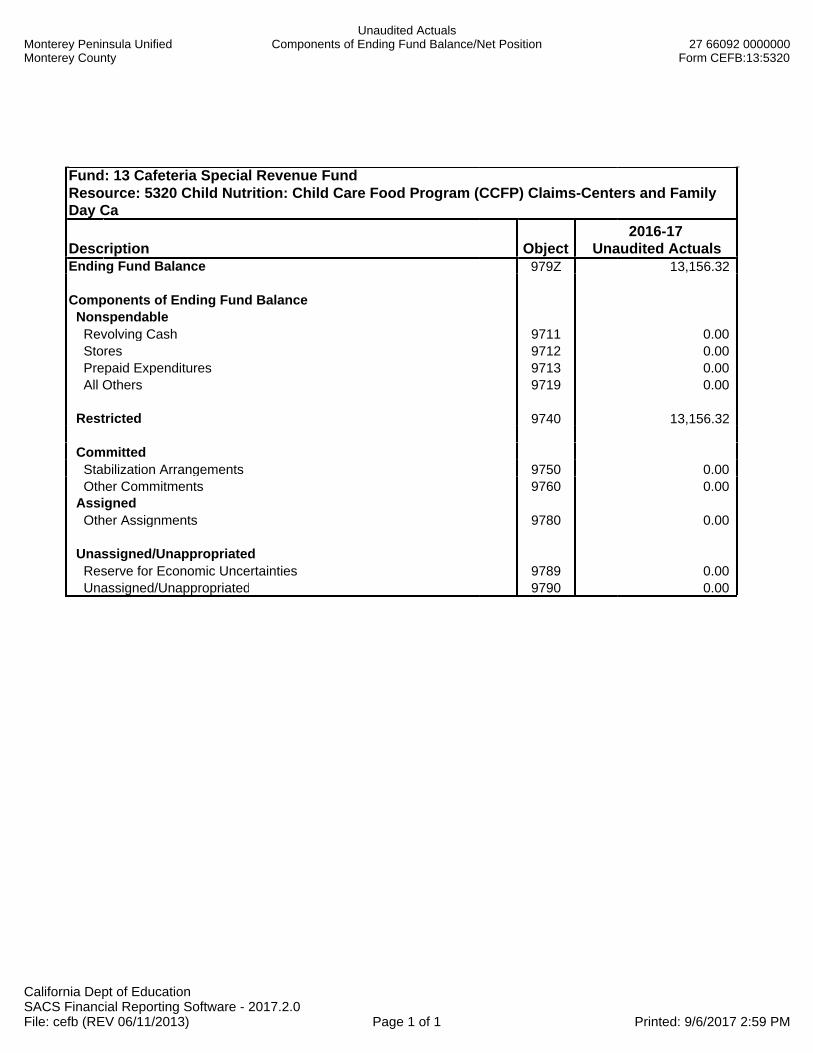
Monterey Peninsula UnifiedMonterey County
Unaudited ActualsComponents of Ending Fund Balance/Net Position 27 66092 0000000
Form CEFB:13:5320
California Dept of EducationSACS Financial Reporting Software - 2017.2.0File: cefb (REV 06/11/2013) Page 1 of 1 Printed: 9/6/2017 2:59 PM
Fund: 13 Cafeteria Special Revenue FundResource: 5320 Child Nutrition: Child Care Food Program (CCFP) Claims-Centers and FamilyDay Ca
Description Object2016-17
Unaudited ActualsEnding Fund Balance 979Z 13,156.32
Components of Ending Fund Balance Nonspendable Revolving Cash 9711 0.00 Stores 9712 0.00 Prepaid Expenditures 9713 0.00 All Others 9719 0.00
Restricted 9740 13,156.32
Committed Stabilization Arrangements 9750 0.00 Other Commitments 9760 0.00 Assigned Other Assignments 9780 0.00
Unassigned/Unappropriated Reserve for Economic Uncertainties 9789 0.00 Unassigned/Unappropriated 9790 0.00

Monterey Peninsula UnifiedMonterey County
Unaudited ActualsComponents of Ending Fund Balance/Net Position 27 66092 0000000
Form CEFB:14:0000
California Dept of EducationSACS Financial Reporting Software - 2017.2.0File: cefb (REV 06/11/2013) Page 1 of 1 Printed: 9/6/2017 2:59 PM
Fund: 14 Deferred Maintenance FundResource: 0000 Unrestricted
Description Object2016-17
Unaudited ActualsEnding Fund Balance 979Z 455,784.06
Components of Ending Fund Balance Nonspendable Revolving Cash 9711 0.00 Stores 9712 0.00 Prepaid Expenditures 9713 0.00 All Others 9719 0.00
Restricted 9740 0.00
Committed Stabilization Arrangements 9750 0.00 Other Commitments 9760 0.00 Assigned Other Assignments 9780 455,784.06
Deferred maintenance projects 9780 455,784.06
Unassigned/Unappropriated Reserve for Economic Uncertainties 9789 0.00 Unassigned/Unappropriated 9790 0.00

Monterey Peninsula UnifiedMonterey County
Unaudited ActualsComponents of Ending Fund Balance/Net Position 27 66092 0000000
Form CEFB:21:9010
California Dept of EducationSACS Financial Reporting Software - 2017.2.0File: cefb (REV 06/11/2013) Page 1 of 1 Printed: 9/6/2017 2:59 PM
Fund: 21 Building FundResource: 9010 Other Restricted Local
Description Object2016-17
Unaudited ActualsEnding Fund Balance 979Z 32,734,670.86
Components of Ending Fund Balance Nonspendable Revolving Cash 9711 0.00 Stores 9712 0.00 Prepaid Expenditures 9713 0.00 All Others 9719 0.00
Restricted 9740 32,734,670.86
Committed Stabilization Arrangements 9750 0.00 Other Commitments 9760 0.00 Assigned Other Assignments 9780 0.00
Unassigned/Unappropriated Reserve for Economic Uncertainties 9789 0.00 Unassigned/Unappropriated 9790 0.00

Monterey Peninsula UnifiedMonterey County
Unaudited ActualsComponents of Ending Fund Balance/Net Position 27 66092 0000000
Form CEFB:25:0000
California Dept of EducationSACS Financial Reporting Software - 2017.2.0File: cefb (REV 06/11/2013) Page 1 of 1 Printed: 9/6/2017 3:00 PM
Fund: 25 Capital Facilities FundResource: 0000 Unrestricted
Description Object2016-17
Unaudited ActualsEnding Fund Balance 979Z 7,731,045.40
Components of Ending Fund Balance Nonspendable Revolving Cash 9711 0.00 Stores 9712 0.00 Prepaid Expenditures 9713 0.00 All Others 9719 0.00
Restricted 9740 0.00
Committed Stabilization Arrangements 9750 0.00 Other Commitments 9760 0.00 Assigned Other Assignments 9780 7,731,045.40
Unassigned/Unappropriated Reserve for Economic Uncertainties 9789 0.00 Unassigned/Unappropriated 9790 0.00

Monterey Peninsula UnifiedMonterey County
Unaudited ActualsComponents of Ending Fund Balance/Net Position 27 66092 0000000
Form CEFB:40:0000
California Dept of EducationSACS Financial Reporting Software - 2017.2.0File: cefb (REV 06/11/2013) Page 1 of 1 Printed: 9/6/2017 3:00 PM
Fund: 40 Special Reserve Fund for Capital Outlay ProjectsResource: 0000 Unrestricted
Description Object2016-17
Unaudited ActualsEnding Fund Balance 979Z 641,241.82
Components of Ending Fund Balance Nonspendable Revolving Cash 9711 0.00 Stores 9712 0.00 Prepaid Expenditures 9713 0.00 All Others 9719 0.00
Restricted 9740 0.00
Committed Stabilization Arrangements 9750 0.00 Other Commitments 9760 0.00 Assigned Other Assignments 9780 641,241.82
Unassigned/Unappropriated Reserve for Economic Uncertainties 9789 0.00 Unassigned/Unappropriated 9790 0.00

Monterey Peninsula UnifiedMonterey County
Unaudited ActualsComponents of Ending Fund Balance/Net Position 27 66092 0000000
Form CEFB:51:0000
California Dept of EducationSACS Financial Reporting Software - 2017.2.0File: cefb (REV 06/11/2013) Page 1 of 1 Printed: 9/6/2017 3:00 PM
Fund: 51 Bond Interest and Redemption FundResource: 0000 Unrestricted
Description Object2016-17
Unaudited ActualsEnding Fund Balance 979Z 4,303,133.64
Components of Ending Fund Balance Nonspendable Revolving Cash 9711 0.00 Stores 9712 0.00 Prepaid Expenditures 9713 0.00 All Others 9719 0.00
Restricted 9740 0.00
Committed Stabilization Arrangements 9750 0.00 Other Commitments 9760 0.00 Assigned Other Assignments 9780 4,303,133.64
Unassigned/Unappropriated Reserve for Economic Uncertainties 9789 0.00 Unassigned/Unappropriated 9790 0.00
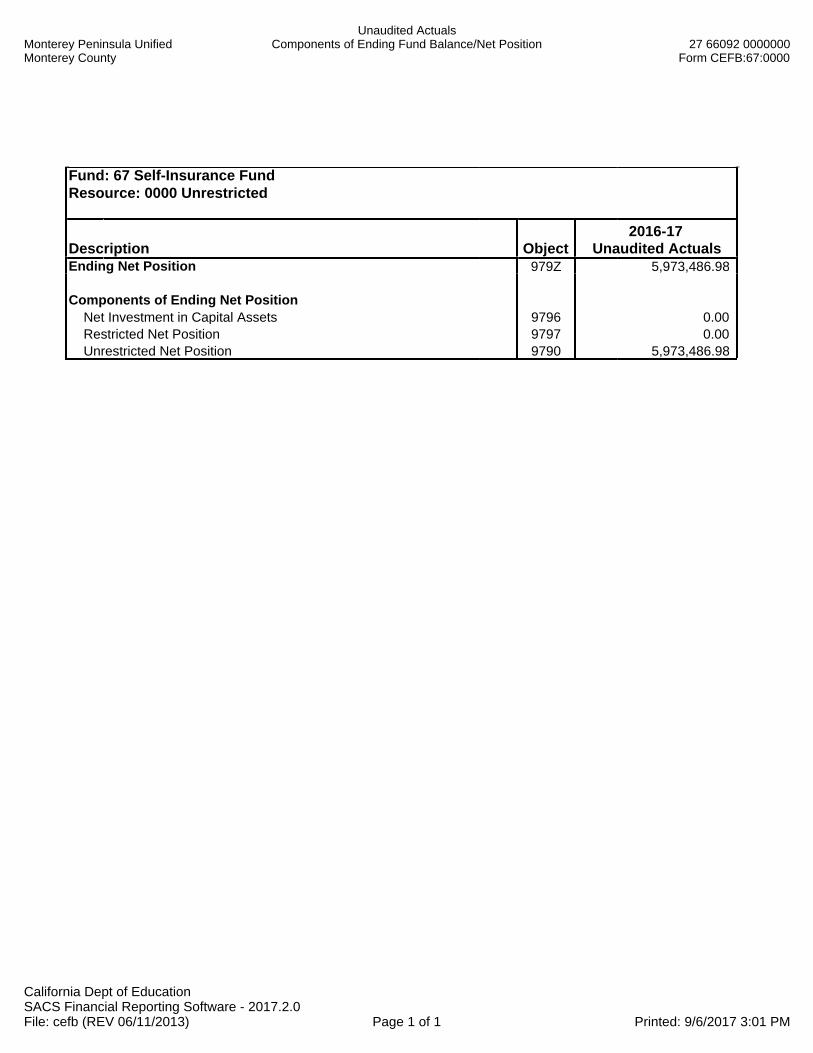
Monterey Peninsula UnifiedMonterey County
Unaudited ActualsComponents of Ending Fund Balance/Net Position 27 66092 0000000
Form CEFB:67:0000
California Dept of EducationSACS Financial Reporting Software - 2017.2.0File: cefb (REV 06/11/2013) Page 1 of 1 Printed: 9/6/2017 3:01 PM
Fund: 67 Self-Insurance FundResource: 0000 Unrestricted
Description Object2016-17
Unaudited ActualsEnding Net Position 979Z 5,973,486.98
Components of Ending Net Position Net Investment in Capital Assets 9796 0.00 Restricted Net Position 9797 0.00 Unrestricted Net Position 9790 5,973,486.98
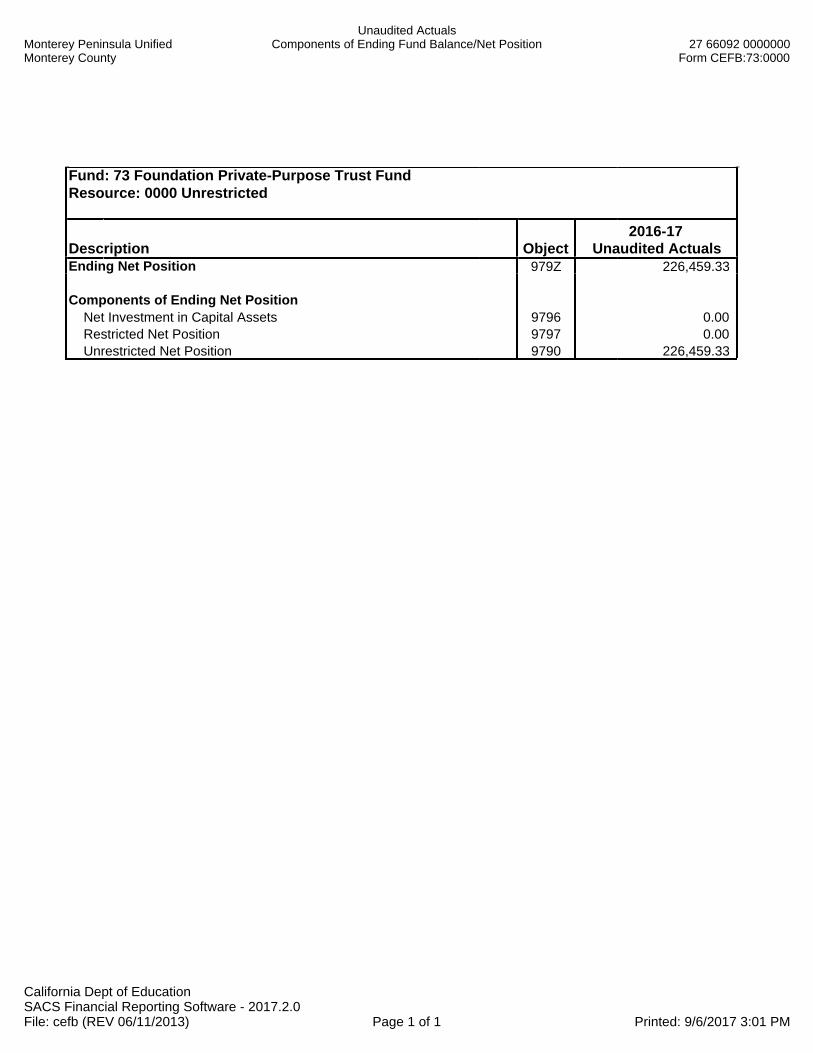
Monterey Peninsula UnifiedMonterey County
Unaudited ActualsComponents of Ending Fund Balance/Net Position 27 66092 0000000
Form CEFB:73:0000
California Dept of EducationSACS Financial Reporting Software - 2017.2.0File: cefb (REV 06/11/2013) Page 1 of 1 Printed: 9/6/2017 3:01 PM
Fund: 73 Foundation Private-Purpose Trust FundResource: 0000 Unrestricted
Description Object2016-17
Unaudited ActualsEnding Net Position 979Z 226,459.33
Components of Ending Net Position Net Investment in Capital Assets 9796 0.00 Restricted Net Position 9797 0.00 Unrestricted Net Position 9790 226,459.33

Monterey Peninsula UnifiedMonterey County
Unaudited ActualsComponents of Ending Fund Balance/Net Position 27 66092 0000000
Form CEFB:01:6230
California Dept of EducationSACS Financial Reporting Software - 2017.2.0File: cefb (REV 06/11/2013) Page 1 of 1 Printed: 9/6/2017 2:54 PM
Fund: 01 General FundResource: 6230 California Clean Energy Jobs Act
Description Object2016-17
Unaudited ActualsEnding Fund Balance 979Z 376,004.40
Components of Ending Fund Balance Nonspendable Revolving Cash 9711 0.00 Stores 9712 0.00 Prepaid Expenditures 9713 0.00 All Others 9719 0.00
Restricted 9740 376,004.40
Committed Stabilization Arrangements 9750 0.00 Other Commitments 9760 0.00 Assigned Other Assignments 9780 0.00
Unassigned/Unappropriated Reserve for Economic Uncertainties 9789 0.00 Unassigned/Unappropriated 9790 0.00
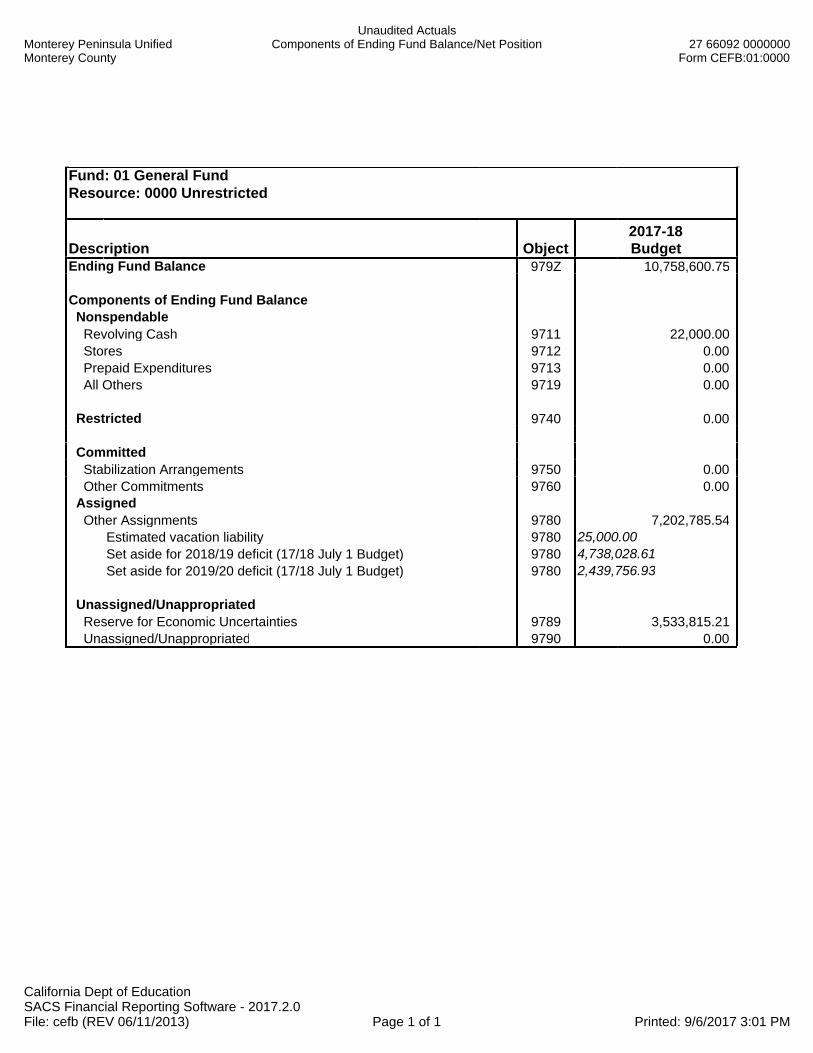
Monterey Peninsula UnifiedMonterey County
Unaudited ActualsComponents of Ending Fund Balance/Net Position 27 66092 0000000
Form CEFB:01:0000
California Dept of EducationSACS Financial Reporting Software - 2017.2.0File: cefb (REV 06/11/2013) Page 1 of 1 Printed: 9/6/2017 3:01 PM
Fund: 01 General FundResource: 0000 Unrestricted
Description Object2017-18Budget
Ending Fund Balance 979Z 10,758,600.75
Components of Ending Fund Balance Nonspendable Revolving Cash 9711 22,000.00 Stores 9712 0.00 Prepaid Expenditures 9713 0.00 All Others 9719 0.00
Restricted 9740 0.00
Committed Stabilization Arrangements 9750 0.00 Other Commitments 9760 0.00 Assigned Other Assignments 9780 7,202,785.54
Estimated vacation liability 9780 25,000.00Set aside for 2018/19 deficit (17/18 July 1 Budget) 9780 4,738,028.61Set aside for 2019/20 deficit (17/18 July 1 Budget) 9780 2,439,756.93
Unassigned/Unappropriated Reserve for Economic Uncertainties 9789 3,533,815.21 Unassigned/Unappropriated 9790 0.00

Monterey Peninsula UnifiedMonterey County
Unaudited ActualsComponents of Ending Fund Balance/Net Position 27 66092 0000000
Form CEFB:01:1100
California Dept of EducationSACS Financial Reporting Software - 2017.2.0File: cefb (REV 06/11/2013) Page 1 of 1 Printed: 9/6/2017 3:03 PM
Fund: 01 General FundResource: 1100 Lottery: Unrestricted
Description Object2017-18Budget
Ending Fund Balance 979Z 717,764.87
Components of Ending Fund Balance Nonspendable Revolving Cash 9711 0.00 Stores 9712 0.00 Prepaid Expenditures 9713 0.00 All Others 9719 0.00
Restricted 9740 0.00
Committed Stabilization Arrangements 9750 0.00 Other Commitments 9760 0.00 Assigned Other Assignments 9780 717,764.87
Set aside for 2019/20 deficit (17/18 July 1 Budget) 9780 717,764.87
Unassigned/Unappropriated Reserve for Economic Uncertainties 9789 0.00 Unassigned/Unappropriated 9790 0.00
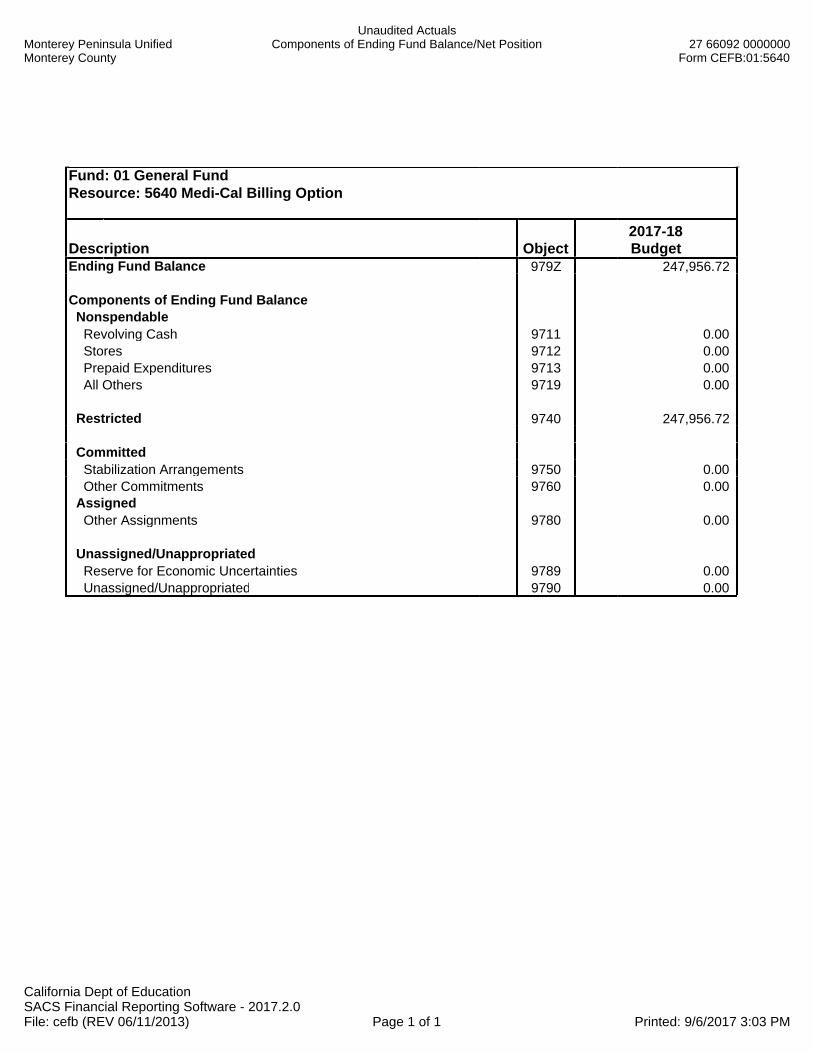
Monterey Peninsula UnifiedMonterey County
Unaudited ActualsComponents of Ending Fund Balance/Net Position 27 66092 0000000
Form CEFB:01:5640
California Dept of EducationSACS Financial Reporting Software - 2017.2.0File: cefb (REV 06/11/2013) Page 1 of 1 Printed: 9/6/2017 3:03 PM
Fund: 01 General FundResource: 5640 Medi-Cal Billing Option
Description Object2017-18Budget
Ending Fund Balance 979Z 247,956.72
Components of Ending Fund Balance Nonspendable Revolving Cash 9711 0.00 Stores 9712 0.00 Prepaid Expenditures 9713 0.00 All Others 9719 0.00
Restricted 9740 247,956.72
Committed Stabilization Arrangements 9750 0.00 Other Commitments 9760 0.00 Assigned Other Assignments 9780 0.00
Unassigned/Unappropriated Reserve for Economic Uncertainties 9789 0.00 Unassigned/Unappropriated 9790 0.00

Monterey Peninsula UnifiedMonterey County
Unaudited ActualsComponents of Ending Fund Balance/Net Position 27 66092 0000000
Form CEFB:01:6230
California Dept of EducationSACS Financial Reporting Software - 2017.2.0File: cefb (REV 06/11/2013) Page 1 of 1 Printed: 9/6/2017 3:03 PM
Fund: 01 General FundResource: 6230 California Clean Energy Jobs Act
Description Object2017-18Budget
Ending Fund Balance 979Z 327,219.85
Components of Ending Fund Balance Nonspendable Revolving Cash 9711 0.00 Stores 9712 0.00 Prepaid Expenditures 9713 0.00 All Others 9719 0.00
Restricted 9740 327,219.85
Committed Stabilization Arrangements 9750 0.00 Other Commitments 9760 0.00 Assigned Other Assignments 9780 0.00
Unassigned/Unappropriated Reserve for Economic Uncertainties 9789 0.00 Unassigned/Unappropriated 9790 0.00

Monterey Peninsula UnifiedMonterey County
Unaudited ActualsComponents of Ending Fund Balance/Net Position 27 66092 0000000
Form CEFB:01:6264
California Dept of EducationSACS Financial Reporting Software - 2017.2.0File: cefb (REV 06/11/2013) Page 1 of 1 Printed: 9/6/2017 3:04 PM
Fund: 01 General FundResource: 6264 Educator Effectiveness (15-16)
Description Object2017-18Budget
Ending Fund Balance 979Z 38,850.40
Components of Ending Fund Balance Nonspendable Revolving Cash 9711 0.00 Stores 9712 0.00 Prepaid Expenditures 9713 0.00 All Others 9719 0.00
Restricted 9740 38,850.40
Committed Stabilization Arrangements 9750 0.00 Other Commitments 9760 0.00 Assigned Other Assignments 9780 0.00
Unassigned/Unappropriated Reserve for Economic Uncertainties 9789 0.00 Unassigned/Unappropriated 9790 0.00

Monterey Peninsula UnifiedMonterey County
Unaudited ActualsComponents of Ending Fund Balance/Net Position 27 66092 0000000
Form CEFB:01:6300
California Dept of EducationSACS Financial Reporting Software - 2017.2.0File: cefb (REV 06/11/2013) Page 1 of 1 Printed: 9/6/2017 3:04 PM
Fund: 01 General FundResource: 6300 Lottery: Instructional Materials
Description Object2017-18Budget
Ending Fund Balance 979Z 7,083.12
Components of Ending Fund Balance Nonspendable Revolving Cash 9711 0.00 Stores 9712 0.00 Prepaid Expenditures 9713 0.00 All Others 9719 0.00
Restricted 9740 7,083.12
Committed Stabilization Arrangements 9750 0.00 Other Commitments 9760 0.00 Assigned Other Assignments 9780 0.00
Unassigned/Unappropriated Reserve for Economic Uncertainties 9789 0.00 Unassigned/Unappropriated 9790 0.00

Monterey Peninsula UnifiedMonterey County
Unaudited ActualsComponents of Ending Fund Balance/Net Position 27 66092 0000000
Form CEFB:01:6512
California Dept of EducationSACS Financial Reporting Software - 2017.2.0File: cefb (REV 06/11/2013) Page 1 of 1 Printed: 9/6/2017 3:04 PM
Fund: 01 General FundResource: 6512 Special Ed: Mental Health Services
Description Object2017-18Budget
Ending Fund Balance 979Z 191,969.07
Components of Ending Fund Balance Nonspendable Revolving Cash 9711 0.00 Stores 9712 0.00 Prepaid Expenditures 9713 0.00 All Others 9719 0.00
Restricted 9740 191,969.07
Committed Stabilization Arrangements 9750 0.00 Other Commitments 9760 0.00 Assigned Other Assignments 9780 0.00
Unassigned/Unappropriated Reserve for Economic Uncertainties 9789 0.00 Unassigned/Unappropriated 9790 0.00
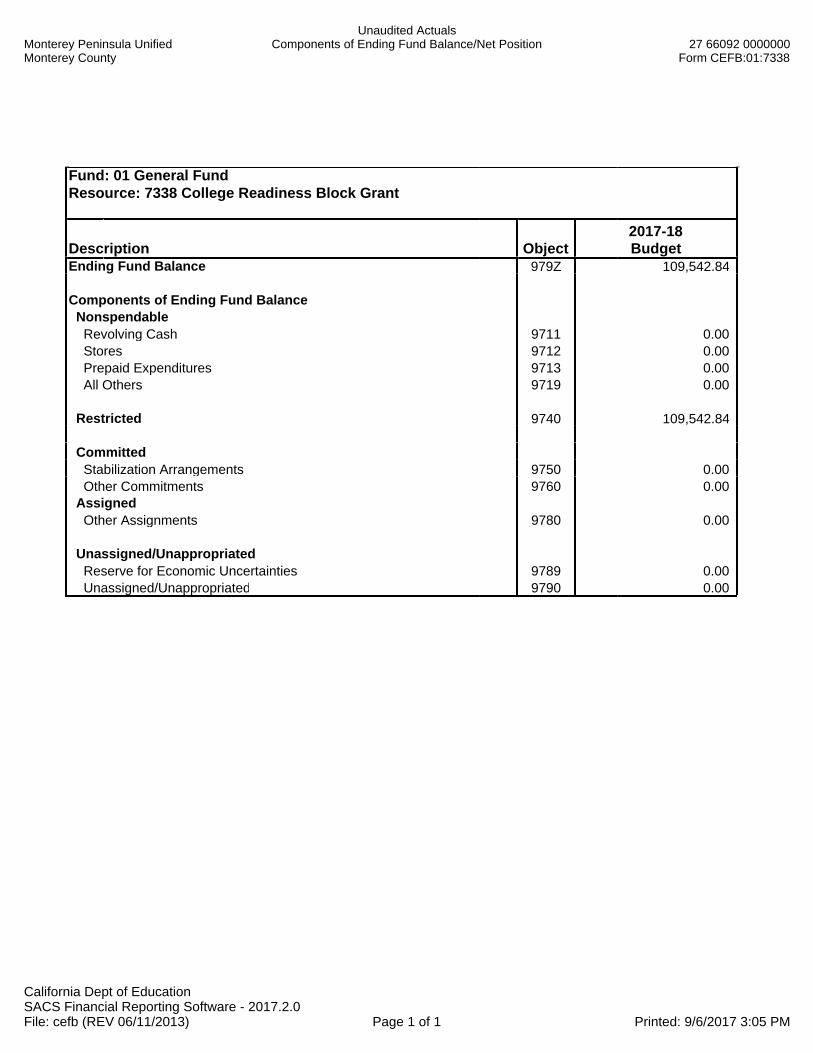
Monterey Peninsula UnifiedMonterey County
Unaudited ActualsComponents of Ending Fund Balance/Net Position 27 66092 0000000
Form CEFB:01:7338
California Dept of EducationSACS Financial Reporting Software - 2017.2.0File: cefb (REV 06/11/2013) Page 1 of 1 Printed: 9/6/2017 3:05 PM
Fund: 01 General FundResource: 7338 College Readiness Block Grant
Description Object2017-18Budget
Ending Fund Balance 979Z 109,542.84
Components of Ending Fund Balance Nonspendable Revolving Cash 9711 0.00 Stores 9712 0.00 Prepaid Expenditures 9713 0.00 All Others 9719 0.00
Restricted 9740 109,542.84
Committed Stabilization Arrangements 9750 0.00 Other Commitments 9760 0.00 Assigned Other Assignments 9780 0.00
Unassigned/Unappropriated Reserve for Economic Uncertainties 9789 0.00 Unassigned/Unappropriated 9790 0.00

Monterey Peninsula UnifiedMonterey County
Unaudited ActualsComponents of Ending Fund Balance/Net Position 27 66092 0000000
Form CEFB:01:9010
California Dept of EducationSACS Financial Reporting Software - 2017.2.0File: cefb (REV 06/11/2013) Page 1 of 1 Printed: 9/6/2017 3:05 PM
Fund: 01 General FundResource: 9010 Other Restricted Local
Description Object2017-18Budget
Ending Fund Balance 979Z 713,003.37
Components of Ending Fund Balance Nonspendable Revolving Cash 9711 0.00 Stores 9712 0.00 Prepaid Expenditures 9713 0.00 All Others 9719 0.00
Restricted 9740 713,003.37
Committed Stabilization Arrangements 9750 0.00 Other Commitments 9760 0.00 Assigned Other Assignments 9780 0.00
Unassigned/Unappropriated Reserve for Economic Uncertainties 9789 0.00 Unassigned/Unappropriated 9790 0.00

Monterey Peninsula UnifiedMonterey County
Unaudited ActualsComponents of Ending Fund Balance/Net Position 27 66092 0000000
Form CEFB:09:0000
California Dept of EducationSACS Financial Reporting Software - 2017.2.0File: cefb (REV 06/11/2013) Page 1 of 1 Printed: 9/6/2017 3:05 PM
Fund: 09 Charter Schools Special Revenue FundResource: 0000 Unrestricted
Description Object2017-18Budget
Ending Fund Balance 979Z 850,215.87
Components of Ending Fund Balance Nonspendable Revolving Cash 9711 0.00 Stores 9712 0.00 Prepaid Expenditures 9713 0.00 All Others 9719 0.00
Restricted 9740 0.00
Committed Stabilization Arrangements 9750 0.00 Other Commitments 9760 0.00 Assigned Other Assignments 9780 850,215.87
Unassigned/Unappropriated Reserve for Economic Uncertainties 9789 0.00 Unassigned/Unappropriated 9790 0.00

Monterey Peninsula UnifiedMonterey County
Unaudited ActualsComponents of Ending Fund Balance/Net Position 27 66092 0000000
Form CEFB:09:1100
California Dept of EducationSACS Financial Reporting Software - 2017.2.0File: cefb (REV 06/11/2013) Page 1 of 1 Printed: 9/6/2017 3:05 PM
Fund: 09 Charter Schools Special Revenue FundResource: 1100 Lottery: Unrestricted
Description Object2017-18Budget
Ending Fund Balance 979Z 234,486.84
Components of Ending Fund Balance Nonspendable Revolving Cash 9711 0.00 Stores 9712 0.00 Prepaid Expenditures 9713 0.00 All Others 9719 0.00
Restricted 9740 0.00
Committed Stabilization Arrangements 9750 0.00 Other Commitments 9760 0.00 Assigned Other Assignments 9780 234,486.84
Unassigned/Unappropriated Reserve for Economic Uncertainties 9789 0.00 Unassigned/Unappropriated 9790 0.00

Monterey Peninsula UnifiedMonterey County
Unaudited ActualsComponents of Ending Fund Balance/Net Position 27 66092 0000000
Form CEFB:09:6264
California Dept of EducationSACS Financial Reporting Software - 2017.2.0File: cefb (REV 06/11/2013) Page 1 of 1 Printed: 9/6/2017 3:06 PM
Fund: 09 Charter Schools Special Revenue FundResource: 6264 Educator Effectiveness (15-16)
Description Object2017-18Budget
Ending Fund Balance 979Z 6,974.13
Components of Ending Fund Balance Nonspendable Revolving Cash 9711 0.00 Stores 9712 0.00 Prepaid Expenditures 9713 0.00 All Others 9719 0.00
Restricted 9740 6,974.13
Committed Stabilization Arrangements 9750 0.00 Other Commitments 9760 0.00 Assigned Other Assignments 9780 0.00
Unassigned/Unappropriated Reserve for Economic Uncertainties 9789 0.00 Unassigned/Unappropriated 9790 0.00
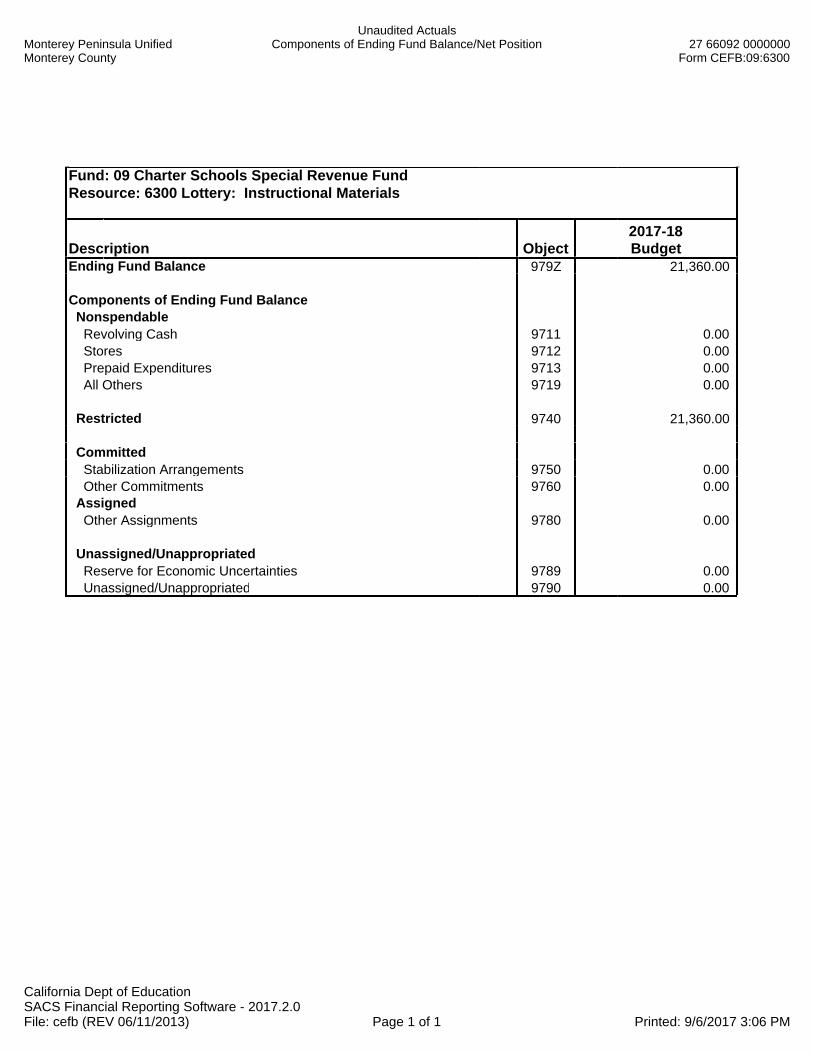
Monterey Peninsula UnifiedMonterey County
Unaudited ActualsComponents of Ending Fund Balance/Net Position 27 66092 0000000
Form CEFB:09:6300
California Dept of EducationSACS Financial Reporting Software - 2017.2.0File: cefb (REV 06/11/2013) Page 1 of 1 Printed: 9/6/2017 3:06 PM
Fund: 09 Charter Schools Special Revenue FundResource: 6300 Lottery: Instructional Materials
Description Object2017-18Budget
Ending Fund Balance 979Z 21,360.00
Components of Ending Fund Balance Nonspendable Revolving Cash 9711 0.00 Stores 9712 0.00 Prepaid Expenditures 9713 0.00 All Others 9719 0.00
Restricted 9740 21,360.00
Committed Stabilization Arrangements 9750 0.00 Other Commitments 9760 0.00 Assigned Other Assignments 9780 0.00
Unassigned/Unappropriated Reserve for Economic Uncertainties 9789 0.00 Unassigned/Unappropriated 9790 0.00

Monterey Peninsula UnifiedMonterey County
Unaudited ActualsComponents of Ending Fund Balance/Net Position 27 66092 0000000
Form CEFB:09:9010
California Dept of EducationSACS Financial Reporting Software - 2017.2.0File: cefb (REV 06/11/2013) Page 1 of 1 Printed: 9/6/2017 3:07 PM
Fund: 09 Charter Schools Special Revenue FundResource: 9010 Other Restricted Local
Description Object2017-18Budget
Ending Fund Balance 979Z 77,001.51
Components of Ending Fund Balance Nonspendable Revolving Cash 9711 0.00 Stores 9712 0.00 Prepaid Expenditures 9713 0.00 All Others 9719 0.00
Restricted 9740 77,001.51
Committed Stabilization Arrangements 9750 0.00 Other Commitments 9760 0.00 Assigned Other Assignments 9780 0.00
Unassigned/Unappropriated Reserve for Economic Uncertainties 9789 0.00 Unassigned/Unappropriated 9790 0.00

Monterey Peninsula UnifiedMonterey County
Unaudited ActualsComponents of Ending Fund Balance/Net Position 27 66092 0000000
Form CEFB:11:6391
California Dept of EducationSACS Financial Reporting Software - 2017.2.0File: cefb (REV 06/11/2013) Page 1 of 1 Printed: 9/6/2017 3:07 PM
Fund: 11 Adult Education FundResource: 6391 Adult Education Block Grant Program
Description Object2017-18Budget
Ending Fund Balance 979Z 250,963.34
Components of Ending Fund Balance Nonspendable Revolving Cash 9711 0.00 Stores 9712 0.00 Prepaid Expenditures 9713 0.00 All Others 9719 0.00
Restricted 9740 250,963.34
Committed Stabilization Arrangements 9750 0.00 Other Commitments 9760 0.00 Assigned Other Assignments 9780 0.00
Unassigned/Unappropriated Reserve for Economic Uncertainties 9789 0.00 Unassigned/Unappropriated 9790 0.00

Monterey Peninsula UnifiedMonterey County
Unaudited ActualsComponents of Ending Fund Balance/Net Position 27 66092 0000000
Form CEFB:11:6392
California Dept of EducationSACS Financial Reporting Software - 2017.2.0File: cefb (REV 06/11/2013) Page 1 of 1 Printed: 9/6/2017 3:08 PM
Fund: 11 Adult Education FundResource: 6392 Adult Education Block Grant Data and Accountability
Description Object2017-18Budget
Ending Fund Balance 979Z 31,364.00
Components of Ending Fund Balance Nonspendable Revolving Cash 9711 0.00 Stores 9712 0.00 Prepaid Expenditures 9713 0.00 All Others 9719 0.00
Restricted 9740 31,364.00
Committed Stabilization Arrangements 9750 0.00 Other Commitments 9760 0.00 Assigned Other Assignments 9780 0.00
Unassigned/Unappropriated Reserve for Economic Uncertainties 9789 0.00 Unassigned/Unappropriated 9790 0.00

Monterey Peninsula UnifiedMonterey County
Unaudited ActualsComponents of Ending Fund Balance/Net Position 27 66092 0000000
Form CEFB:11:9010
California Dept of EducationSACS Financial Reporting Software - 2017.2.0File: cefb (REV 06/11/2013) Page 1 of 1 Printed: 9/6/2017 3:08 PM
Fund: 11 Adult Education FundResource: 9010 Other Restricted Local
Description Object2017-18Budget
Ending Fund Balance 979Z 46,304.23
Components of Ending Fund Balance Nonspendable Revolving Cash 9711 0.00 Stores 9712 0.00 Prepaid Expenditures 9713 0.00 All Others 9719 0.00
Restricted 9740 46,304.23
Committed Stabilization Arrangements 9750 0.00 Other Commitments 9760 0.00 Assigned Other Assignments 9780 0.00
Unassigned/Unappropriated Reserve for Economic Uncertainties 9789 0.00 Unassigned/Unappropriated 9790 0.00
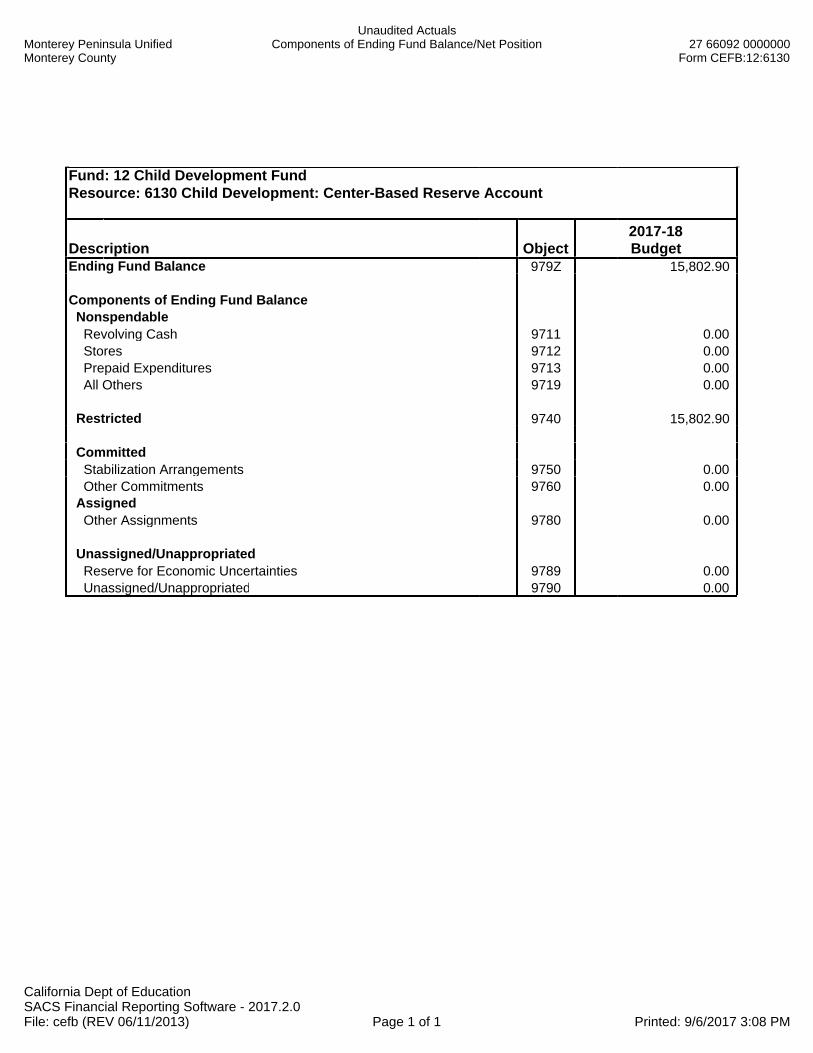
Monterey Peninsula UnifiedMonterey County
Unaudited ActualsComponents of Ending Fund Balance/Net Position 27 66092 0000000
Form CEFB:12:6130
California Dept of EducationSACS Financial Reporting Software - 2017.2.0File: cefb (REV 06/11/2013) Page 1 of 1 Printed: 9/6/2017 3:08 PM
Fund: 12 Child Development FundResource: 6130 Child Development: Center-Based Reserve Account
Description Object2017-18Budget
Ending Fund Balance 979Z 15,802.90
Components of Ending Fund Balance Nonspendable Revolving Cash 9711 0.00 Stores 9712 0.00 Prepaid Expenditures 9713 0.00 All Others 9719 0.00
Restricted 9740 15,802.90
Committed Stabilization Arrangements 9750 0.00 Other Commitments 9760 0.00 Assigned Other Assignments 9780 0.00
Unassigned/Unappropriated Reserve for Economic Uncertainties 9789 0.00 Unassigned/Unappropriated 9790 0.00

Monterey Peninsula UnifiedMonterey County
Unaudited ActualsComponents of Ending Fund Balance/Net Position 27 66092 0000000
Form CEFB:12:9010
California Dept of EducationSACS Financial Reporting Software - 2017.2.0File: cefb (REV 06/11/2013) Page 1 of 1 Printed: 9/6/2017 3:09 PM
Fund: 12 Child Development FundResource: 9010 Other Restricted Local
Description Object2017-18Budget
Ending Fund Balance 979Z 199.28
Components of Ending Fund Balance Nonspendable Revolving Cash 9711 0.00 Stores 9712 0.00 Prepaid Expenditures 9713 0.00 All Others 9719 0.00
Restricted 9740 199.28
Committed Stabilization Arrangements 9750 0.00 Other Commitments 9760 0.00 Assigned Other Assignments 9780 0.00
Unassigned/Unappropriated Reserve for Economic Uncertainties 9789 0.00 Unassigned/Unappropriated 9790 0.00

Monterey Peninsula UnifiedMonterey County
Unaudited ActualsComponents of Ending Fund Balance/Net Position 27 66092 0000000
Form CEFB:13:5310
California Dept of EducationSACS Financial Reporting Software - 2017.2.0File: cefb (REV 06/11/2013) Page 1 of 1 Printed: 9/6/2017 3:09 PM
Fund: 13 Cafeteria Special Revenue FundResource: 5310 Child Nutrition: School Programs (e.g., School Lunch, School Breakfast, Milk,Pr
Description Object2017-18Budget
Ending Fund Balance 979Z 1,025,005.83
Components of Ending Fund Balance Nonspendable Revolving Cash 9711 0.00 Stores 9712 0.00 Prepaid Expenditures 9713 0.00 All Others 9719 0.00
Restricted 9740 1,025,005.83
Committed Stabilization Arrangements 9750 0.00 Other Commitments 9760 0.00 Assigned Other Assignments 9780 0.00
Unassigned/Unappropriated Reserve for Economic Uncertainties 9789 0.00 Unassigned/Unappropriated 9790 0.00
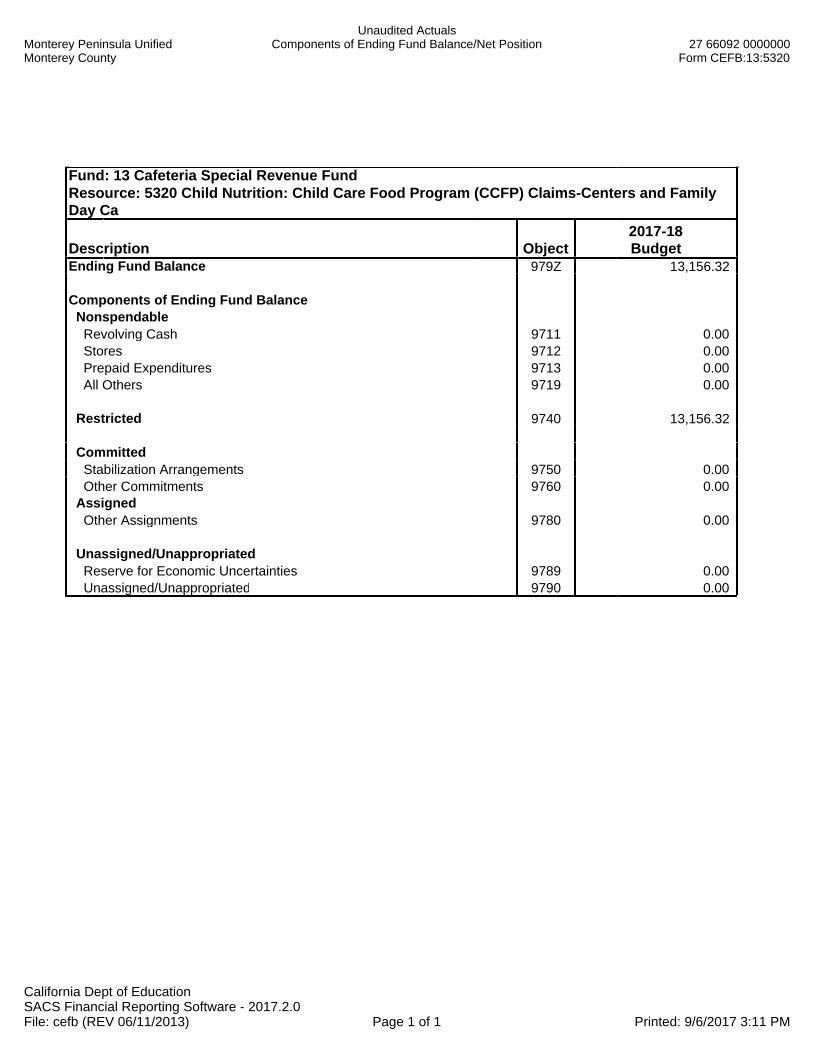
Monterey Peninsula UnifiedMonterey County
Unaudited ActualsComponents of Ending Fund Balance/Net Position 27 66092 0000000
Form CEFB:13:5320
California Dept of EducationSACS Financial Reporting Software - 2017.2.0File: cefb (REV 06/11/2013) Page 1 of 1 Printed: 9/6/2017 3:11 PM
Fund: 13 Cafeteria Special Revenue FundResource: 5320 Child Nutrition: Child Care Food Program (CCFP) Claims-Centers and FamilyDay Ca
Description Object2017-18Budget
Ending Fund Balance 979Z 13,156.32
Components of Ending Fund Balance Nonspendable Revolving Cash 9711 0.00 Stores 9712 0.00 Prepaid Expenditures 9713 0.00 All Others 9719 0.00
Restricted 9740 13,156.32
Committed Stabilization Arrangements 9750 0.00 Other Commitments 9760 0.00 Assigned Other Assignments 9780 0.00
Unassigned/Unappropriated Reserve for Economic Uncertainties 9789 0.00 Unassigned/Unappropriated 9790 0.00
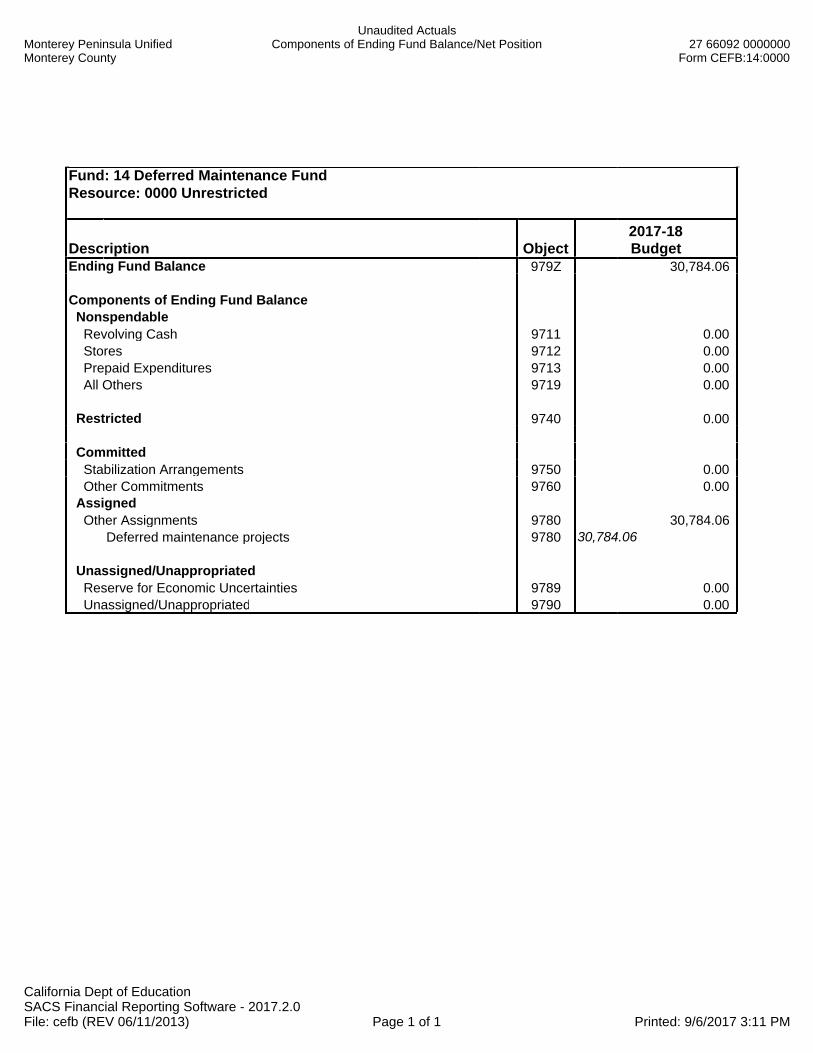
Monterey Peninsula UnifiedMonterey County
Unaudited ActualsComponents of Ending Fund Balance/Net Position 27 66092 0000000
Form CEFB:14:0000
California Dept of EducationSACS Financial Reporting Software - 2017.2.0File: cefb (REV 06/11/2013) Page 1 of 1 Printed: 9/6/2017 3:11 PM
Fund: 14 Deferred Maintenance FundResource: 0000 Unrestricted
Description Object2017-18Budget
Ending Fund Balance 979Z 30,784.06
Components of Ending Fund Balance Nonspendable Revolving Cash 9711 0.00 Stores 9712 0.00 Prepaid Expenditures 9713 0.00 All Others 9719 0.00
Restricted 9740 0.00
Committed Stabilization Arrangements 9750 0.00 Other Commitments 9760 0.00 Assigned Other Assignments 9780 30,784.06
Deferred maintenance projects 9780 30,784.06
Unassigned/Unappropriated Reserve for Economic Uncertainties 9789 0.00 Unassigned/Unappropriated 9790 0.00

Monterey Peninsula UnifiedMonterey County
Unaudited ActualsComponents of Ending Fund Balance/Net Position 27 66092 0000000
Form CEFB:21:9010
California Dept of EducationSACS Financial Reporting Software - 2017.2.0File: cefb (REV 06/11/2013) Page 1 of 1 Printed: 9/6/2017 3:11 PM
Fund: 21 Building FundResource: 9010 Other Restricted Local
Description Object2017-18Budget
Ending Fund Balance 979Z 22,667,633.79
Components of Ending Fund Balance Nonspendable Revolving Cash 9711 0.00 Stores 9712 0.00 Prepaid Expenditures 9713 0.00 All Others 9719 0.00
Restricted 9740 22,667,633.79
Committed Stabilization Arrangements 9750 0.00 Other Commitments 9760 0.00 Assigned Other Assignments 9780 0.00
Unassigned/Unappropriated Reserve for Economic Uncertainties 9789 0.00 Unassigned/Unappropriated 9790 0.00

Monterey Peninsula UnifiedMonterey County
Unaudited ActualsComponents of Ending Fund Balance/Net Position 27 66092 0000000
Form CEFB:25:0000
California Dept of EducationSACS Financial Reporting Software - 2017.2.0File: cefb (REV 06/11/2013) Page 1 of 1 Printed: 9/6/2017 3:12 PM
Fund: 25 Capital Facilities FundResource: 0000 Unrestricted
Description Object2017-18Budget
Ending Fund Balance 979Z 5,416,745.31
Components of Ending Fund Balance Nonspendable Revolving Cash 9711 0.00 Stores 9712 0.00 Prepaid Expenditures 9713 0.00 All Others 9719 0.00
Restricted 9740 0.00
Committed Stabilization Arrangements 9750 0.00 Other Commitments 9760 0.00 Assigned Other Assignments 9780 5,416,745.31
Unassigned/Unappropriated Reserve for Economic Uncertainties 9789 0.00 Unassigned/Unappropriated 9790 0.00

Monterey Peninsula UnifiedMonterey County
Unaudited ActualsComponents of Ending Fund Balance/Net Position 27 66092 0000000
Form CEFB:40:0000
California Dept of EducationSACS Financial Reporting Software - 2017.2.0File: cefb (REV 06/11/2013) Page 1 of 1 Printed: 9/6/2017 3:12 PM
Fund: 40 Special Reserve Fund for Capital Outlay ProjectsResource: 0000 Unrestricted
Description Object2017-18Budget
Ending Fund Balance 979Z 46,241.82
Components of Ending Fund Balance Nonspendable Revolving Cash 9711 0.00 Stores 9712 0.00 Prepaid Expenditures 9713 0.00 All Others 9719 0.00
Restricted 9740 0.00
Committed Stabilization Arrangements 9750 0.00 Other Commitments 9760 0.00 Assigned Other Assignments 9780 46,241.82
Unassigned/Unappropriated Reserve for Economic Uncertainties 9789 0.00 Unassigned/Unappropriated 9790 0.00
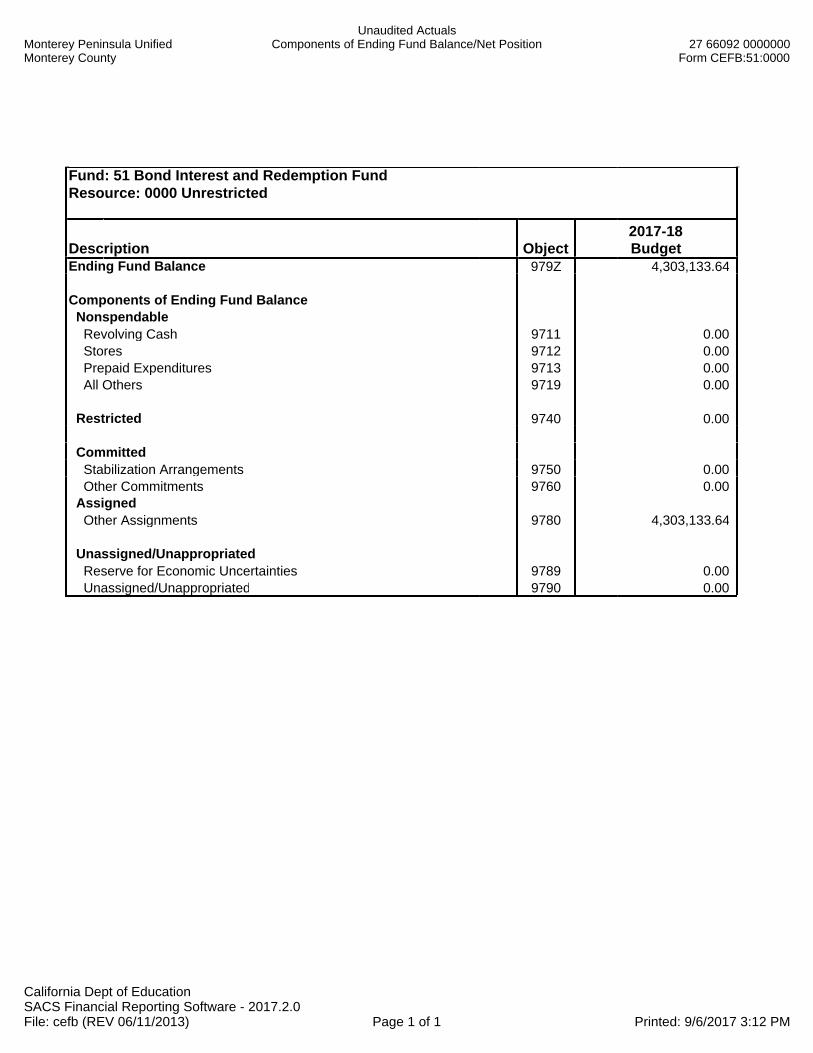
Monterey Peninsula UnifiedMonterey County
Unaudited ActualsComponents of Ending Fund Balance/Net Position 27 66092 0000000
Form CEFB:51:0000
California Dept of EducationSACS Financial Reporting Software - 2017.2.0File: cefb (REV 06/11/2013) Page 1 of 1 Printed: 9/6/2017 3:12 PM
Fund: 51 Bond Interest and Redemption FundResource: 0000 Unrestricted
Description Object2017-18Budget
Ending Fund Balance 979Z 4,303,133.64
Components of Ending Fund Balance Nonspendable Revolving Cash 9711 0.00 Stores 9712 0.00 Prepaid Expenditures 9713 0.00 All Others 9719 0.00
Restricted 9740 0.00
Committed Stabilization Arrangements 9750 0.00 Other Commitments 9760 0.00 Assigned Other Assignments 9780 4,303,133.64
Unassigned/Unappropriated Reserve for Economic Uncertainties 9789 0.00 Unassigned/Unappropriated 9790 0.00

Monterey Peninsula UnifiedMonterey County
Unaudited ActualsComponents of Ending Fund Balance/Net Position 27 66092 0000000
Form CEFB:67:0000
California Dept of EducationSACS Financial Reporting Software - 2017.2.0File: cefb (REV 06/11/2013) Page 1 of 1 Printed: 9/6/2017 3:12 PM
Fund: 67 Self-Insurance FundResource: 0000 Unrestricted
Description Object2017-18Budget
Ending Net Position 979Z 4,926,035.32
Components of Ending Net Position Net Investment in Capital Assets 9796 0.00 Restricted Net Position 9797 0.00 Unrestricted Net Position 9790 4,926,035.32
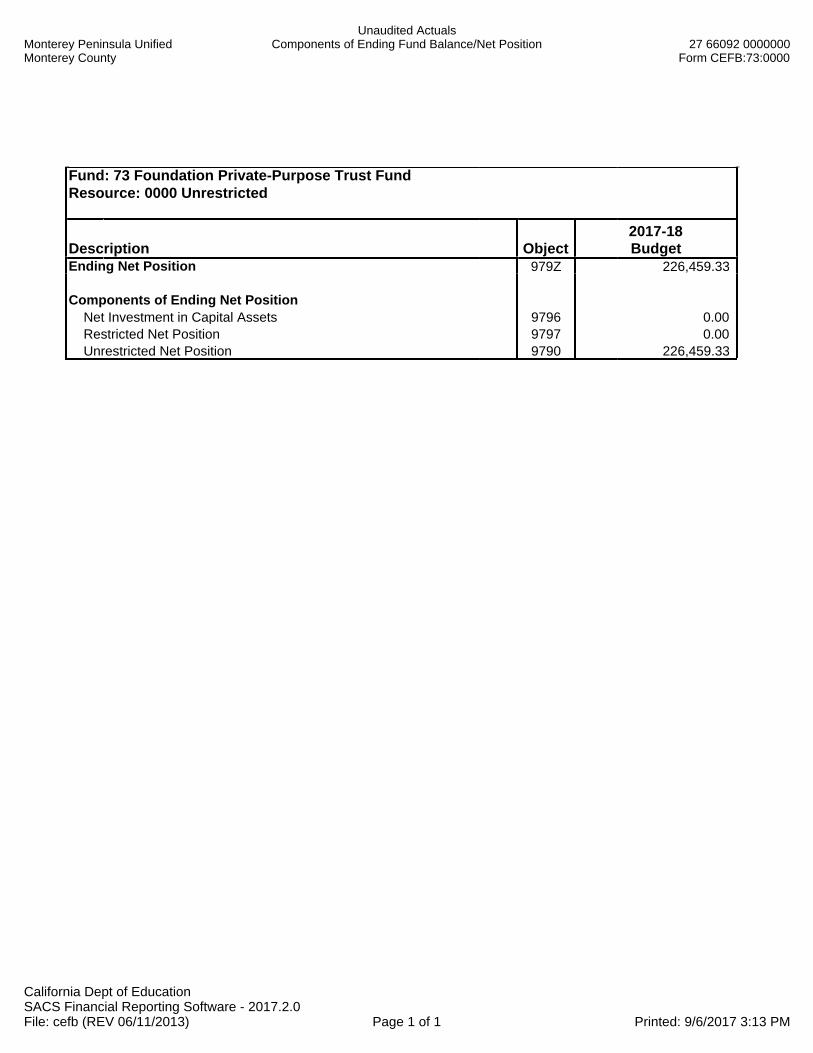
Monterey Peninsula UnifiedMonterey County
Unaudited ActualsComponents of Ending Fund Balance/Net Position 27 66092 0000000
Form CEFB:73:0000
California Dept of EducationSACS Financial Reporting Software - 2017.2.0File: cefb (REV 06/11/2013) Page 1 of 1 Printed: 9/6/2017 3:13 PM
Fund: 73 Foundation Private-Purpose Trust FundResource: 0000 Unrestricted
Description Object2017-18Budget
Ending Net Position 979Z 226,459.33
Components of Ending Net Position Net Investment in Capital Assets 9796 0.00 Restricted Net Position 9797 0.00 Unrestricted Net Position 9790 226,459.33


