1
THE ELDERLY IN ISRAEL: THE ELDERLY IN ISRAEL: SELECTED TRENDSSELECTED TRENDS
Jack HabibJack HabibDIRECTORDIRECTOR
MYERS-JDC BROOKDALE INSTITUTEMYERS-JDC BROOKDALE INSTITUTE
February, 2010
2
Presentation OutlineAGING OF ISRAELI SOCIETY
SOCIO-DEMOGRAPHIC CHARACTERISTICS
CRITICAL CHALLENGES
3
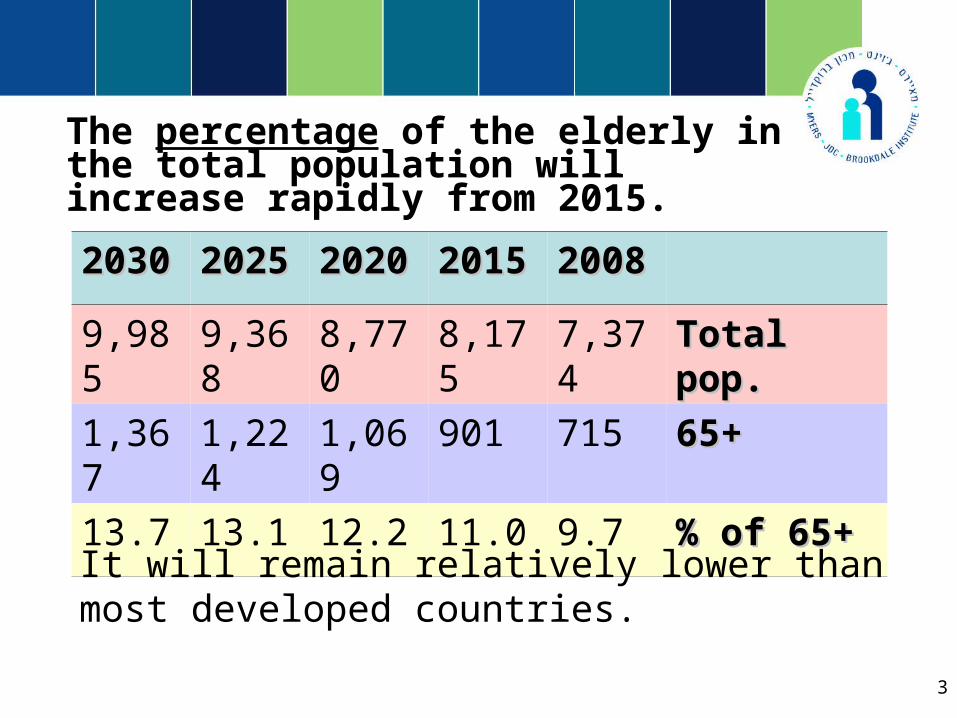
The percentage of the elderly in the total population will increase rapidly from 2015.
2008200820152015202020202025202520302030
Total pop. Total pop. 7,3748,1758,7709,3689,985
65+65+7159011,0691,2241,367
% of 65+% of 65+9.711.012.213.113.7
It will remain relatively lower than most developed countries.
4
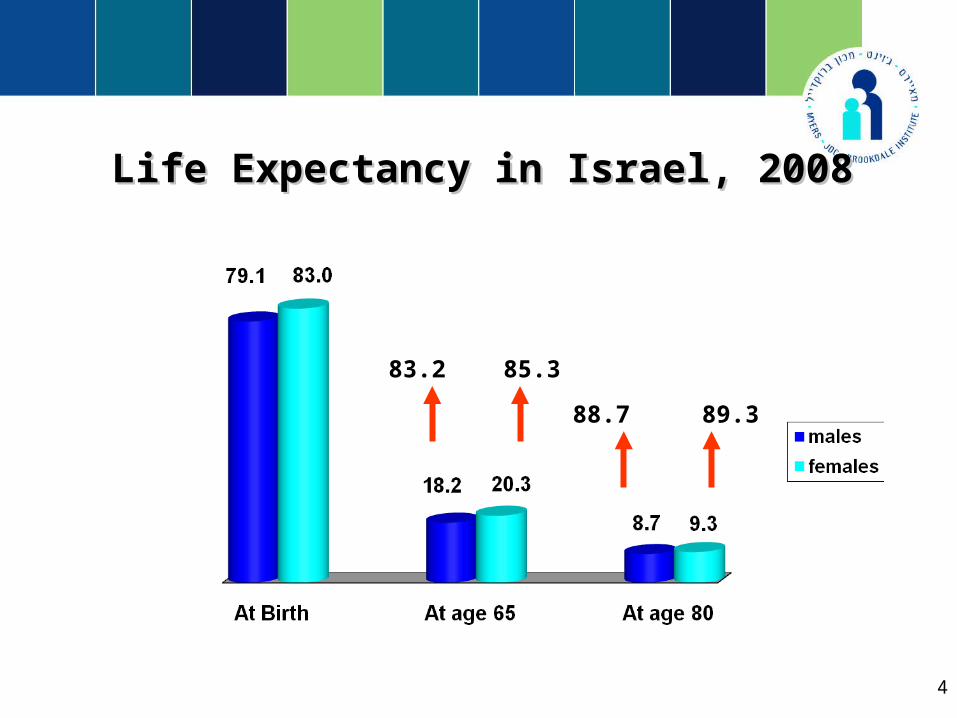
Life Expectancy in Israel, 2008Life Expectancy in Israel, 2008
83.2 85.3
88.7 89.3
5
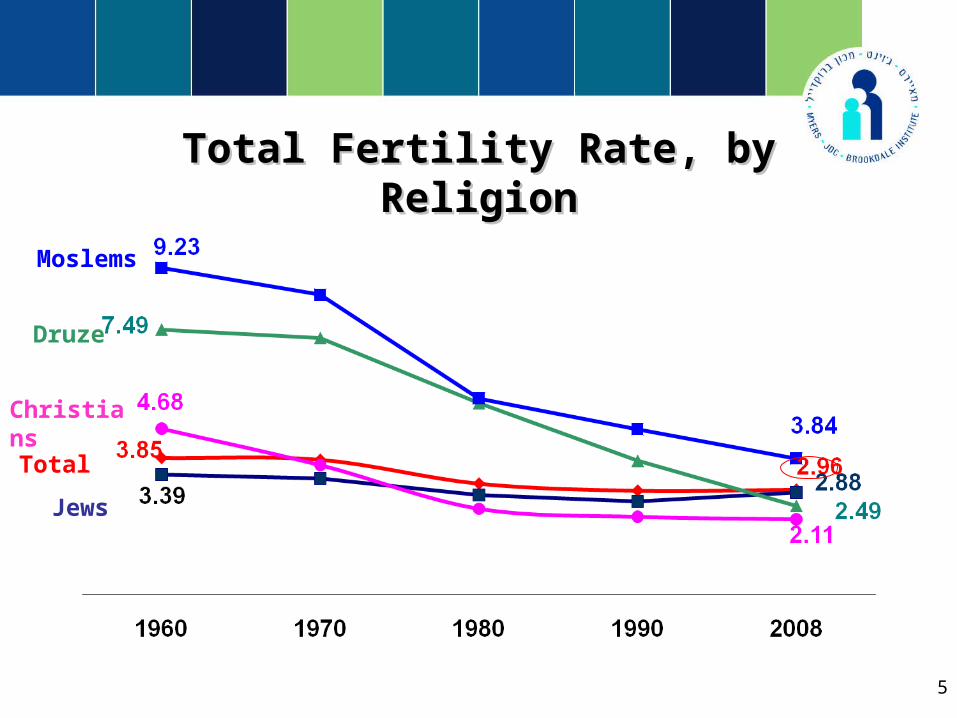
Total Fertility Rate, by ReligionTotal Fertility Rate, by Religion
Moslems
Druze
Christians
Total
Jews
6
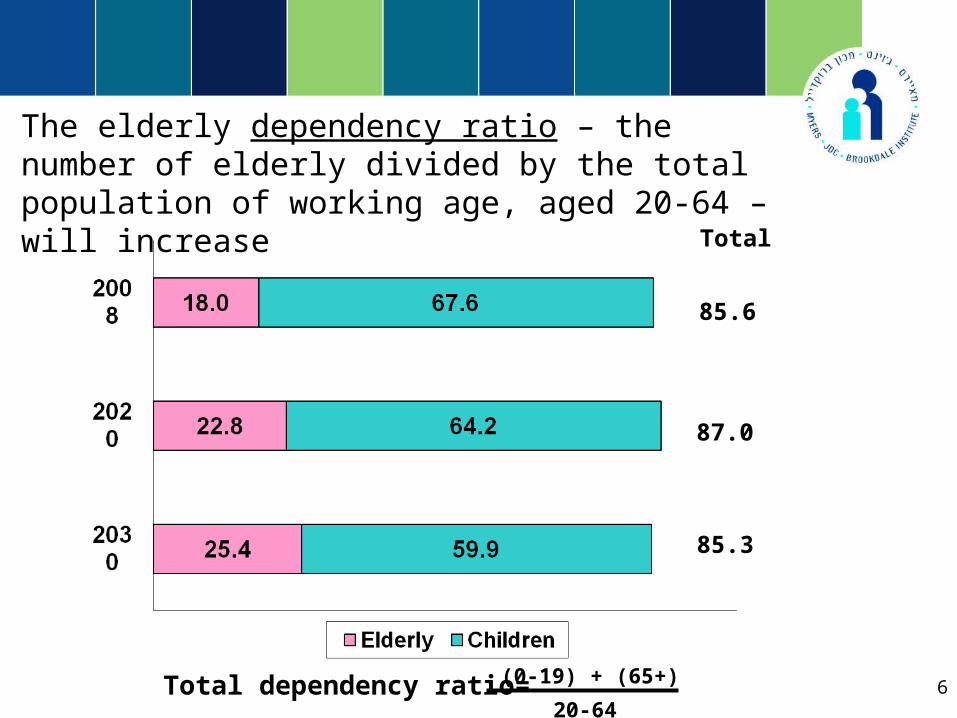
The elderly dependency ratio – the number of elderly divided by the total population of working age, aged 20-64 – will increase
85.6
85.3
(0-19) + (65+)
20-64Total dependency ratio=
87.0
Total
7
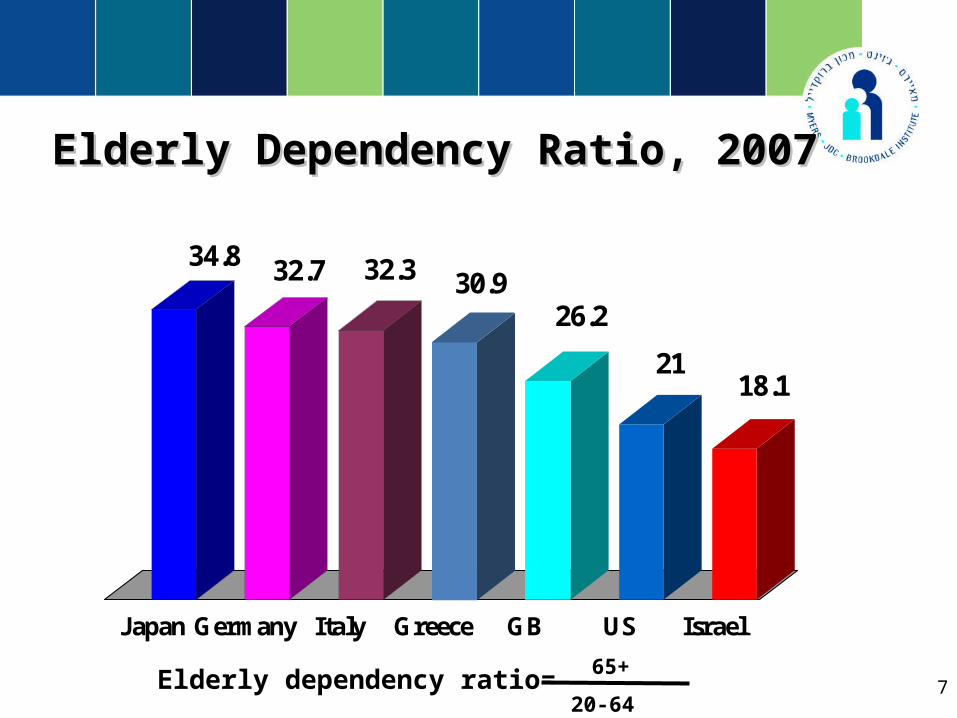
Elderly Dependency Ratio, 2007Elderly Dependency Ratio, 2007
34.8 32.7 32.3 30.926.2
2118.1
Japan Germany Italy Greece GB US Israel
65+
20-64Elderly dependency ratio=
8
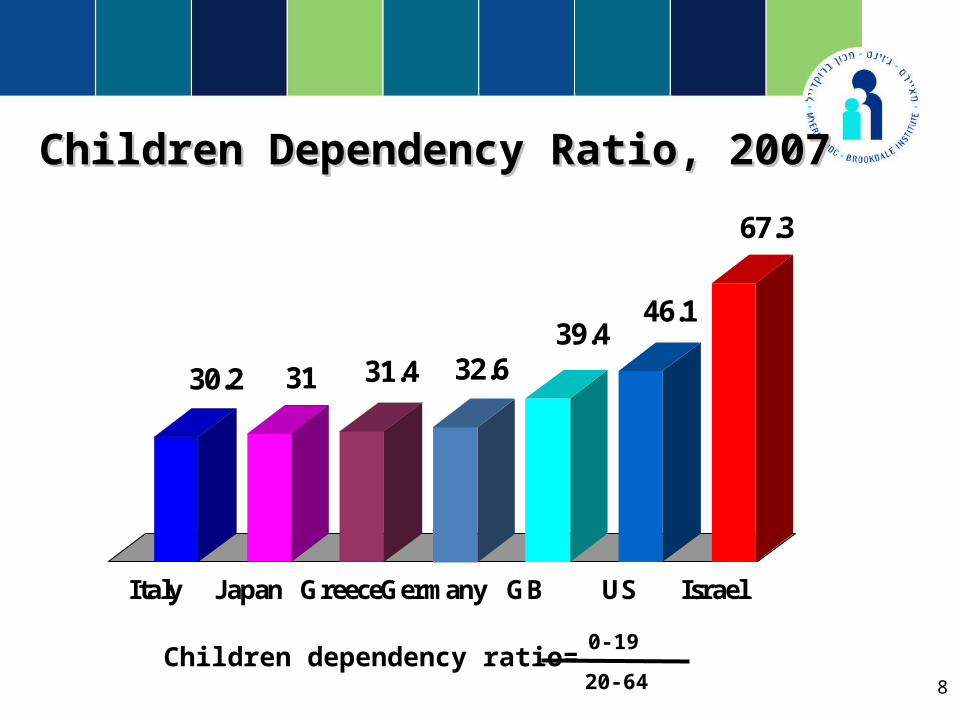
Children Dependency Ratio, 2007Children Dependency Ratio, 2007
30.2 31 31.4 32.639.4
46.1
67.3
Italy Japan GreeceGermany GB US Israel
0-19
20-64Children dependency ratio=
9
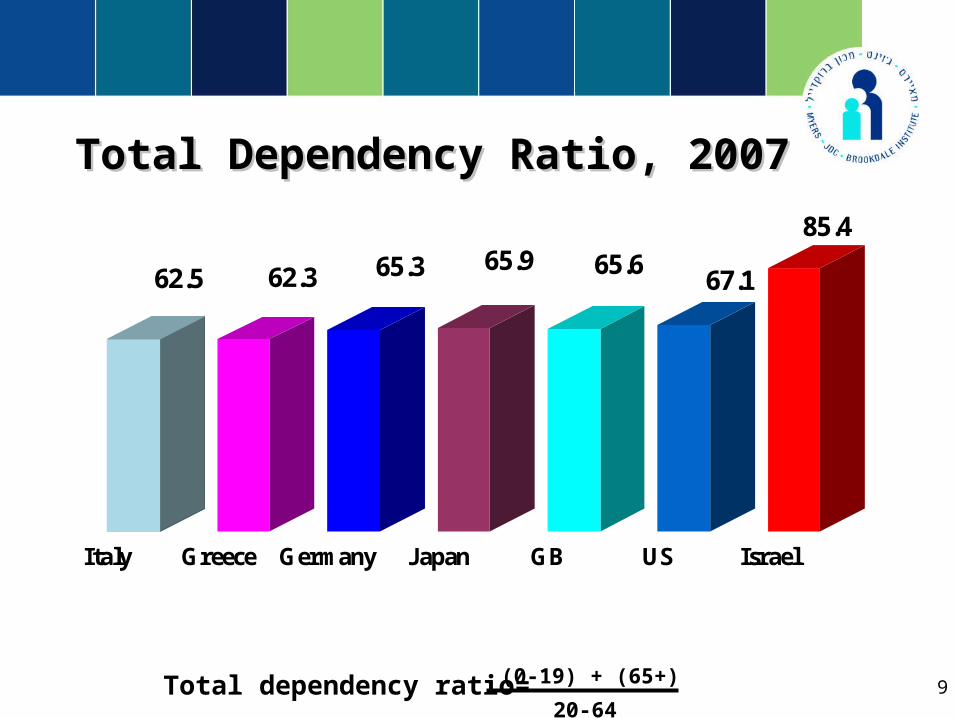
Total Dependency Ratio, 2007Total Dependency Ratio, 2007
62.5 62.3 65.3 65.9 65.667.1
85.4
Italy Greece Germany Japan GB US Israel
(0-19) + (65+)
20-64Total dependency ratio=
10
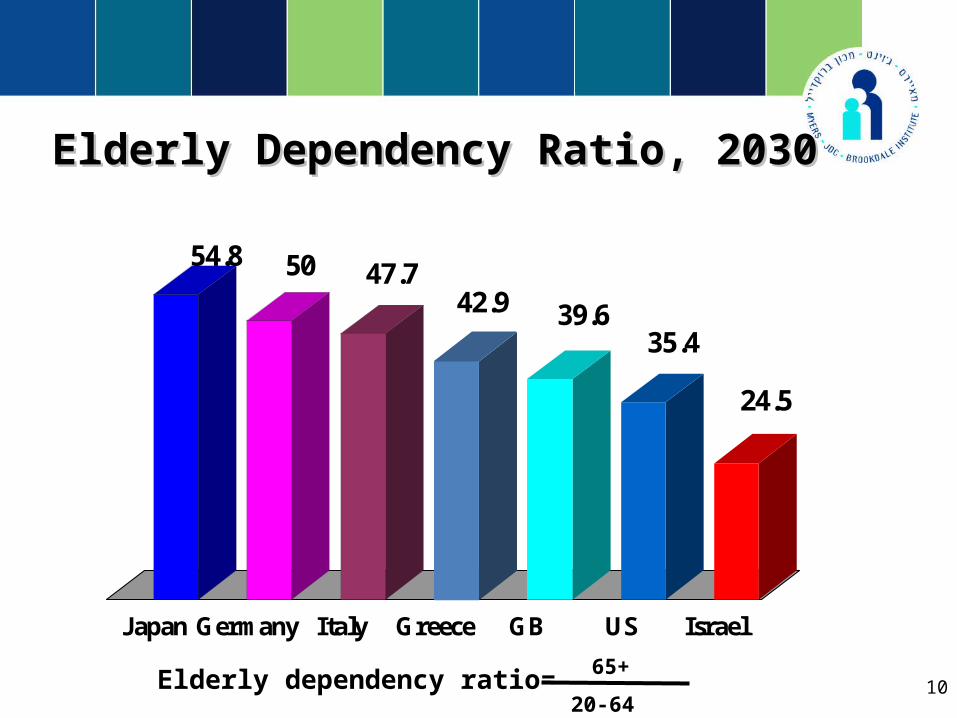
Elderly Dependency Ratio, 2030Elderly Dependency Ratio, 2030
54.8 50 47.742.9 39.6
35.4
24.5
Japan Germany Italy Greece GB US Israel
65+
20-64Elderly dependency ratio=
11
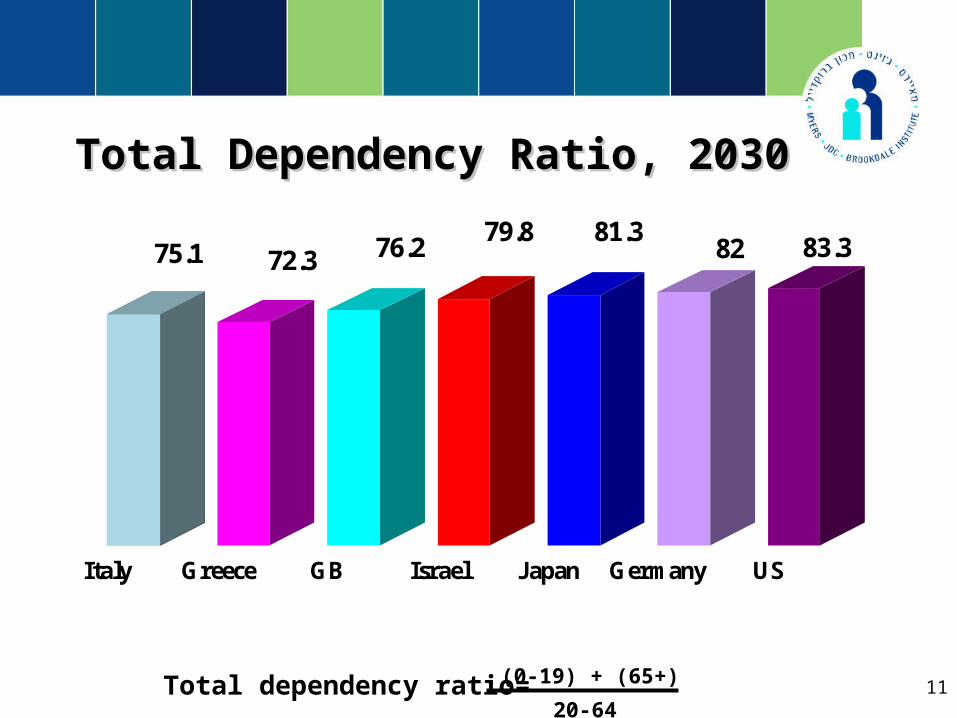
Total Dependency Ratio, 2030Total Dependency Ratio, 2030
75.1 72.3 76.279.8 81.3
82 83.3
Italy Greece GB Israel Japan Germany US
(0-19) + (65+)
20-64Total dependency ratio=
12
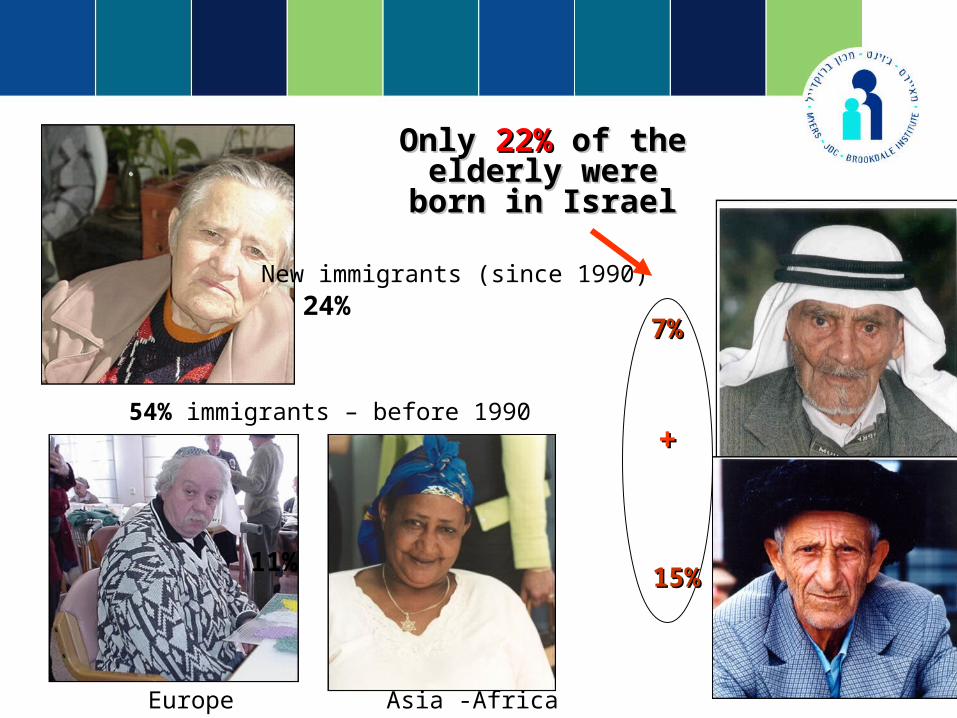
7%7%24%
11%
Only Only 22%22% of the of the elderly were born in elderly were born in
IsraelIsrael
New immigrants (since 1990)
Europe Asia -Africa
15%15%
++54% immigrants – before 1990
13
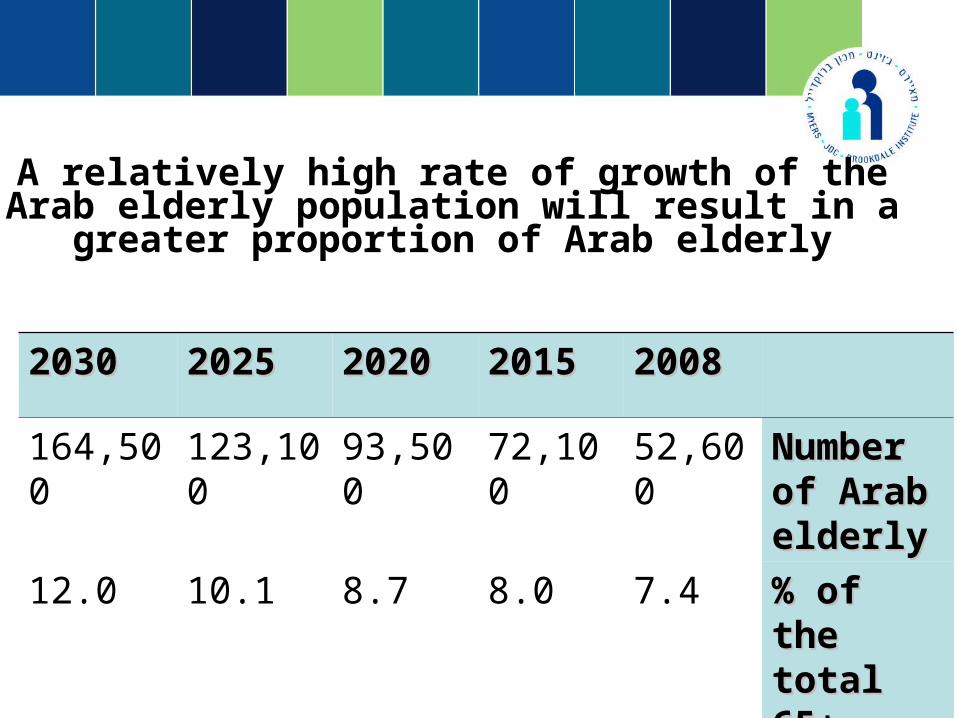
A relatively high rate of growth of the Arab elderly population will result in a greater
proportion of Arab elderly
2008200820152015202020202025202520302030
Number Number of Arab of Arab elderlyelderly
52,60072,10093,500123,100164,500
% of the % of the total 65+total 65+
7.48.08.710.112.0
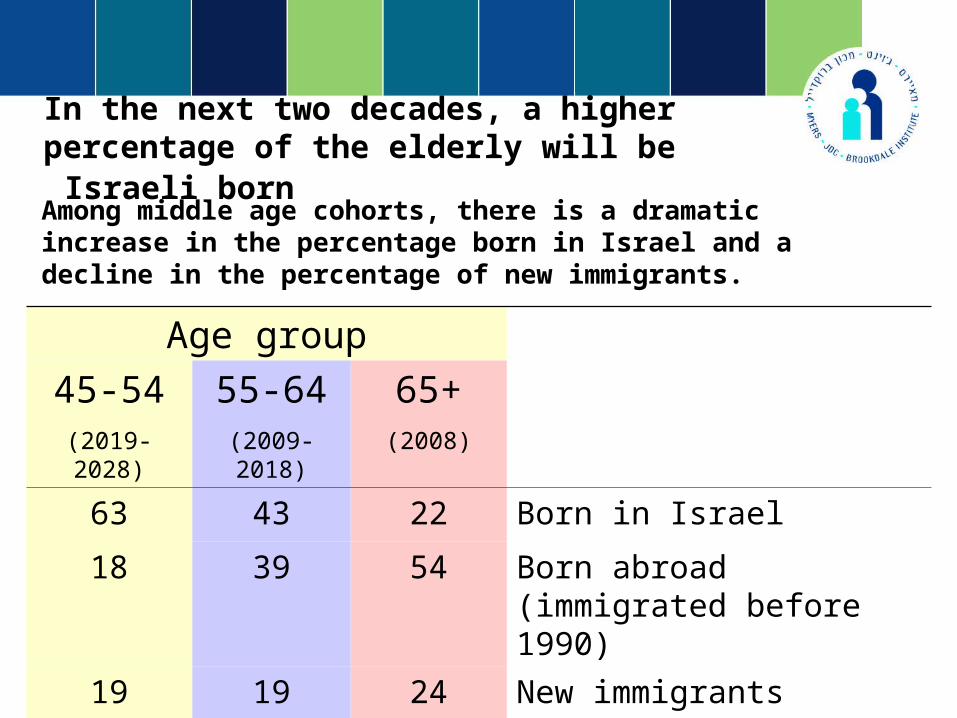
In the next two decades, a higher percentage of the elderly will be Israeli born
Among middle age cohorts, there is a dramatic increase in the percentage born in Israel and a decline in the percentage of new immigrants.
Age group
65+(2008)
55-64(2009-2018)
45-54(2019-2028)
Born in Israel224363
Born abroad (immigrated before 1990)
543918
New immigrants (1990+)241919
Total100100100
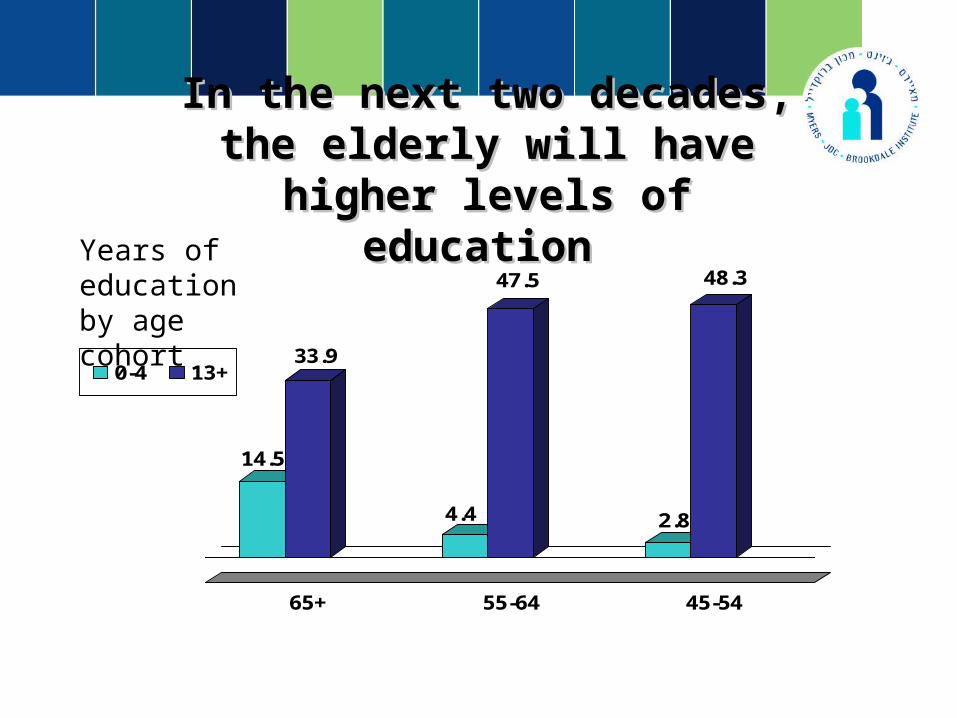
In the next two decades, In the next two decades, the elderly will have the elderly will have
higher levels of educationhigher levels of education Years of education by age cohort
14.5
33.9
4.4
47.5
2.8
48.3
65+ 55-64 45-54
0-4 13+
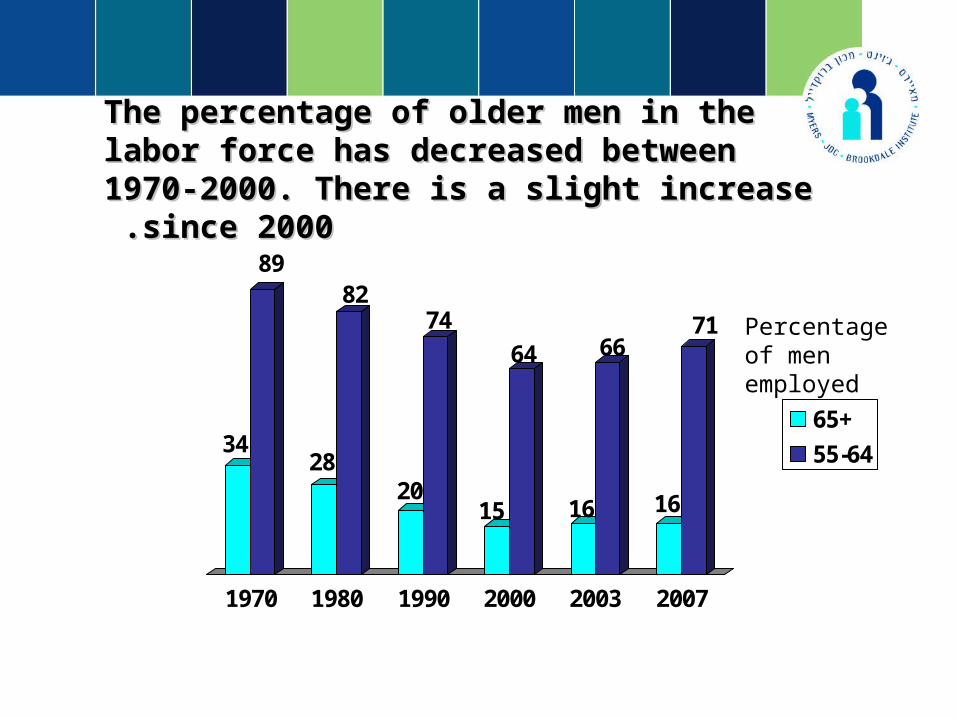
The percentage of older men in the The percentage of older men in the labor force has decreased between labor force has decreased between 1970-2000. There is a slight increase 1970-2000. There is a slight increase
since 2000since 2000 . .
34
89
28
82
20
74
15
64
16
66
16
71
1970 1980 1990 2000 2003 2007
65+
55-64
Percentage of men employed
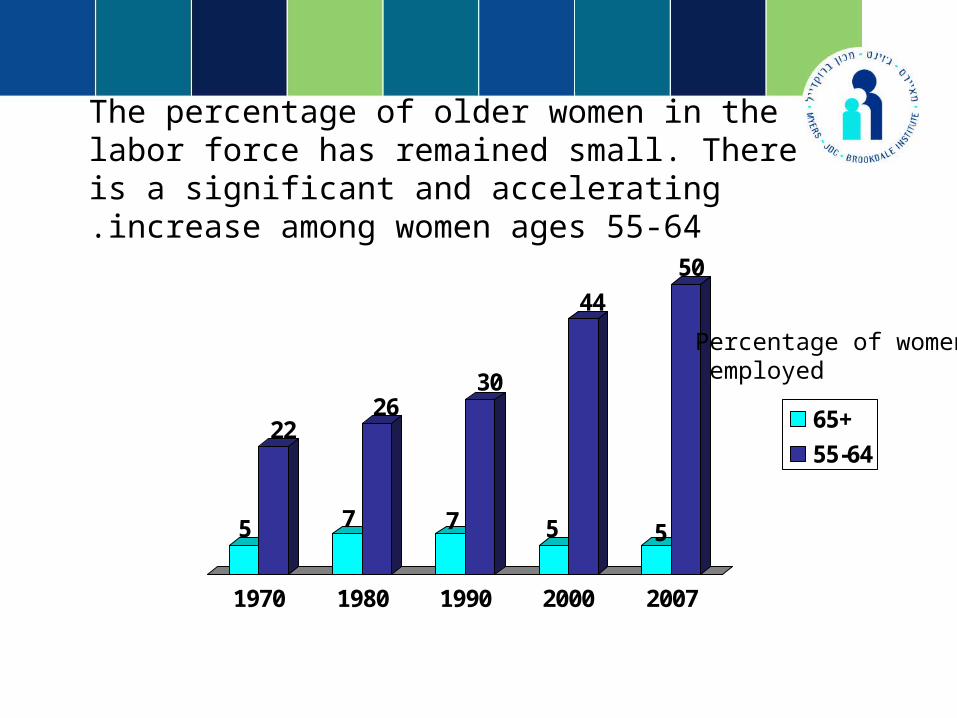
The percentage of older women in the labor force has remained small. There is a significant and accelerating increase among women ages 55-64.
5
22
7
26
7
30
5
44
5
50
1970 1980 1990 2000 2007
65+
55-64
Percentage of women employed
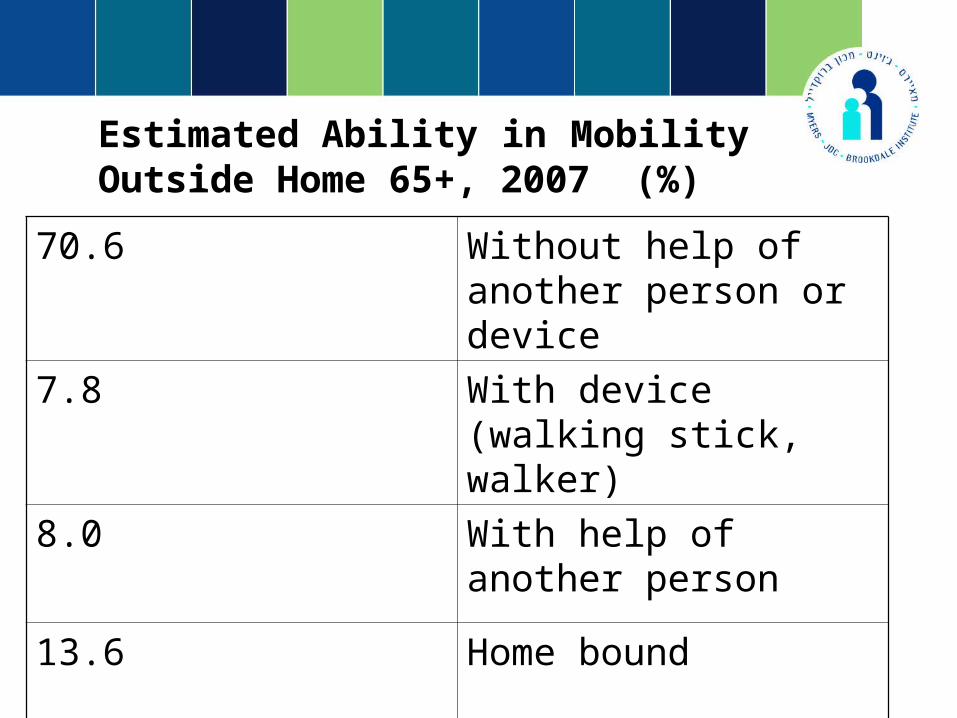
Estimated Ability in Mobility Outside Home 65+, 2007 (%)
Without help of another person or device
70.6
With device (walking stick, walker)
7.8
With help of another person
8.0
Home bound13.6
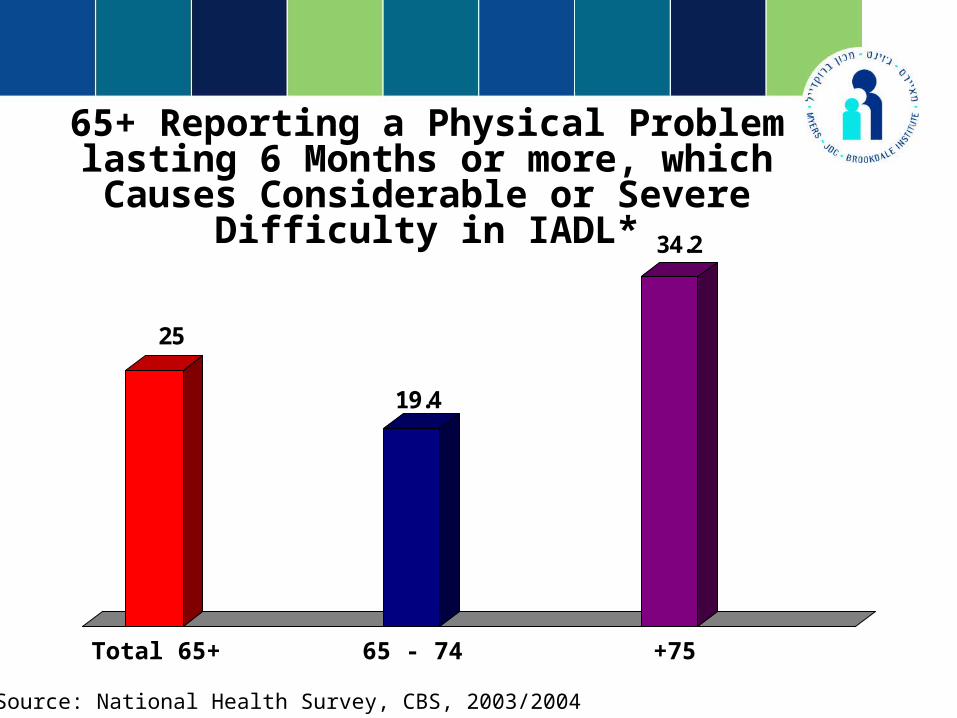
65+ Reporting a Physical Problem lasting 6 Months or more, which Causes Considerable
or Severe Difficulty in IADL*
25
19.4
34.2
* Source: National Health Survey, CBS, 2003/2004
Total 65+ 65 - 74 75+
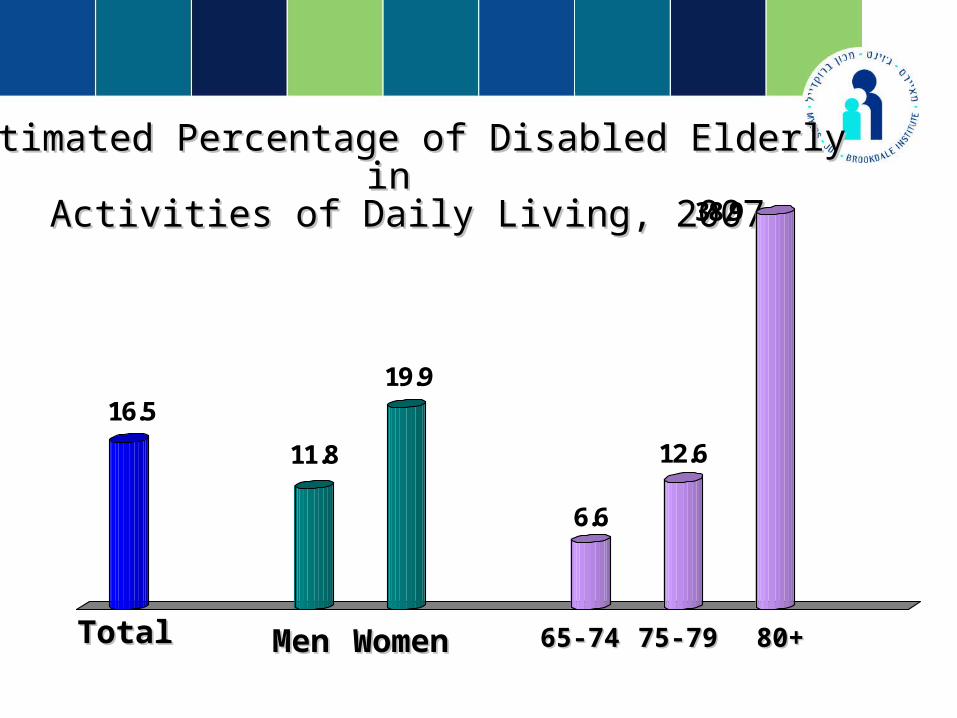
Estimated Percentage of Disabled Elderly in Estimated Percentage of Disabled Elderly in Activities of Daily Living, 2007Activities of Daily Living, 2007
16.5
11.8
19.9
6.6
12.6
38.9
TotalTotal MMenen WWomenomen 65-7465-74 75-7975-79 ++8080
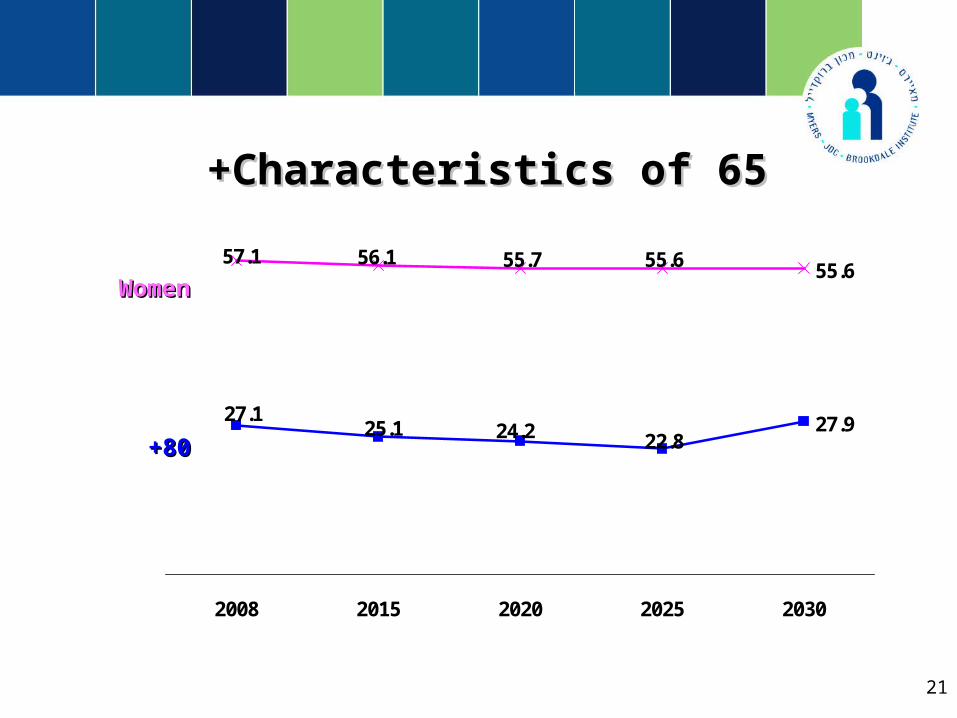
21
Characteristics of 65Characteristics of 65++
27.9
55.6
22.824.225.127.1
55.655.756.157.1
2008 2015 2020 2025 2030
WomenWomen
8080++
22
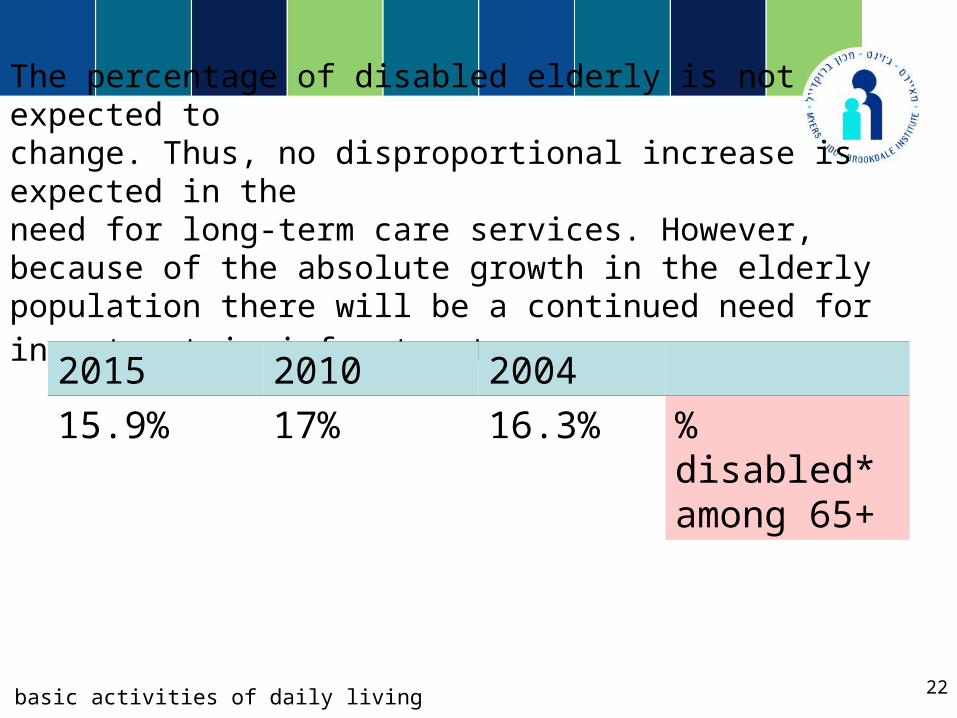
The percentage of disabled elderly is not expected to change. Thus, no disproportional increase is expected in theneed for long-term care services. However, because of the absolute growth in the elderly population there will be a continued need for investment in infrastructure.
200420102015
% disabled* among 65+
16.3%17%15.9%
* In basic activities of daily living
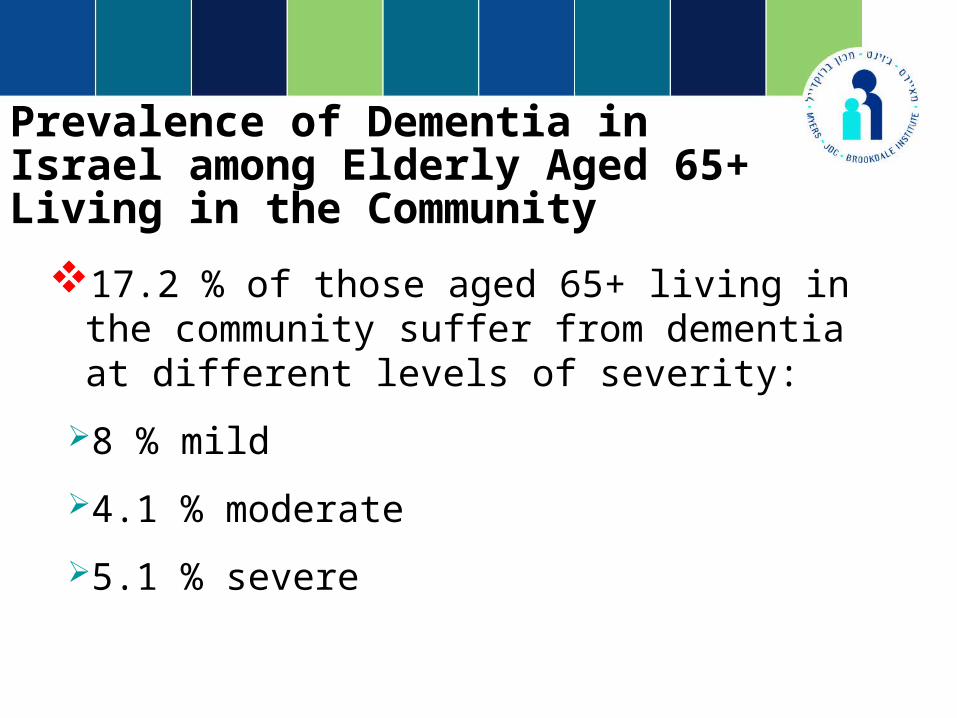
Prevalence of Dementia in Israel among Elderly Aged 65+ Living in the Community
17.2 % of those aged 65+ living in the community suffer from dementia at different levels of severity:
8 % mild
4.1 % moderate
5.1 % severe
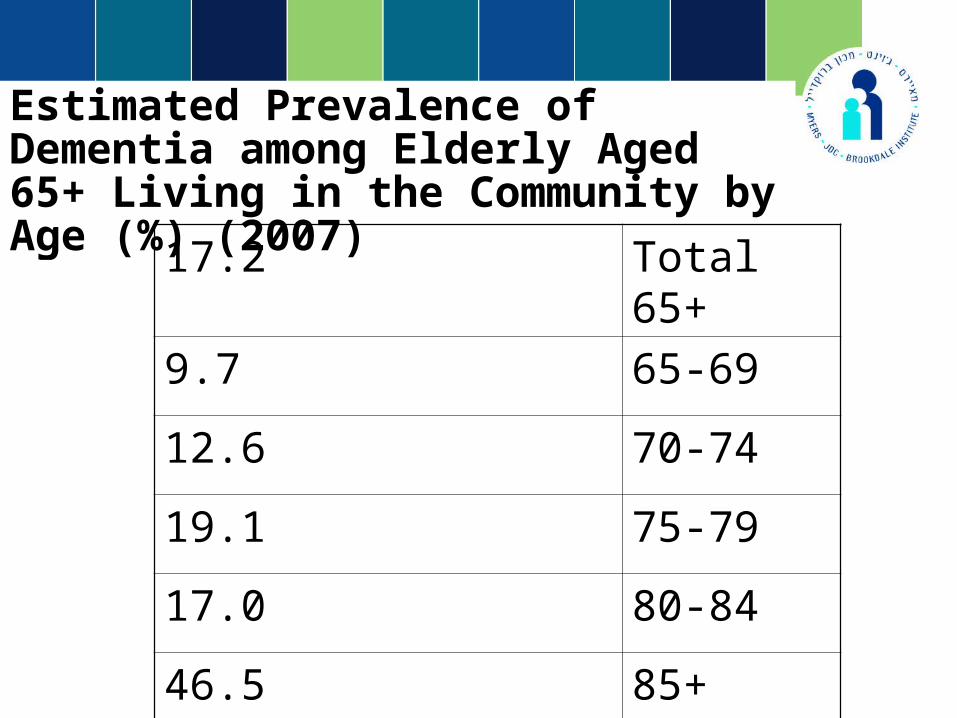
Estimated Prevalence of Dementia among Elderly Aged 65+ Living in the Community by Age (%) (2007)
Total 65+17.2
65-699.7
70-7412.6
75-7919.1
80-8417.0
85+46.5
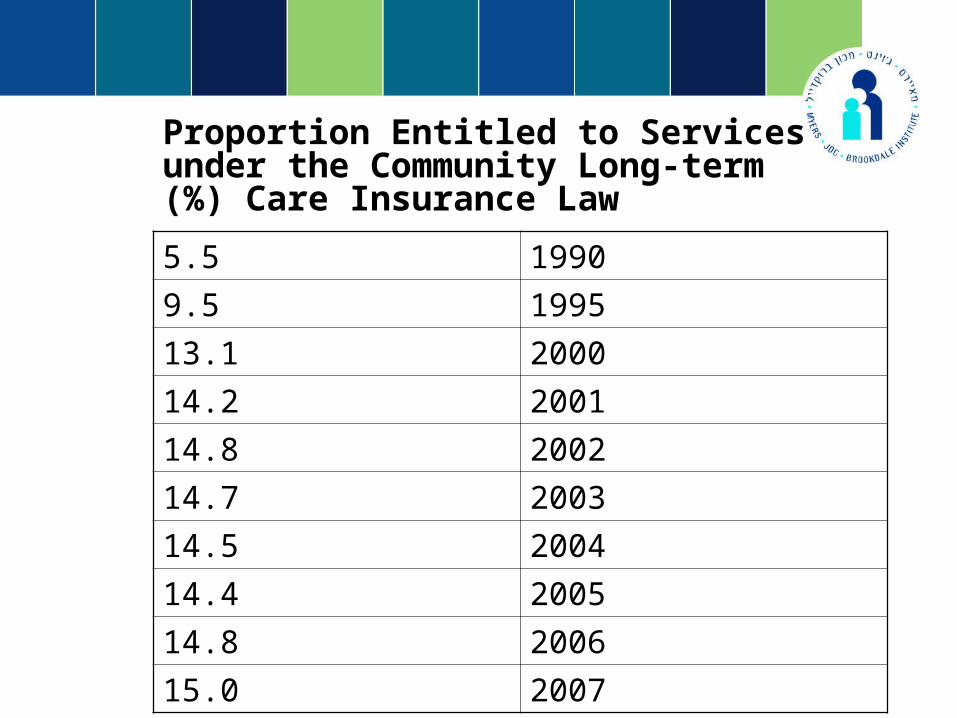
Proportion Entitled to Services under the Community Long-term Care
Insurance Law(%)
19905.5
19959.5
200013.1
200114.2
200214.8
200314.7
200414.5
200514.4
200614.8
200715.0
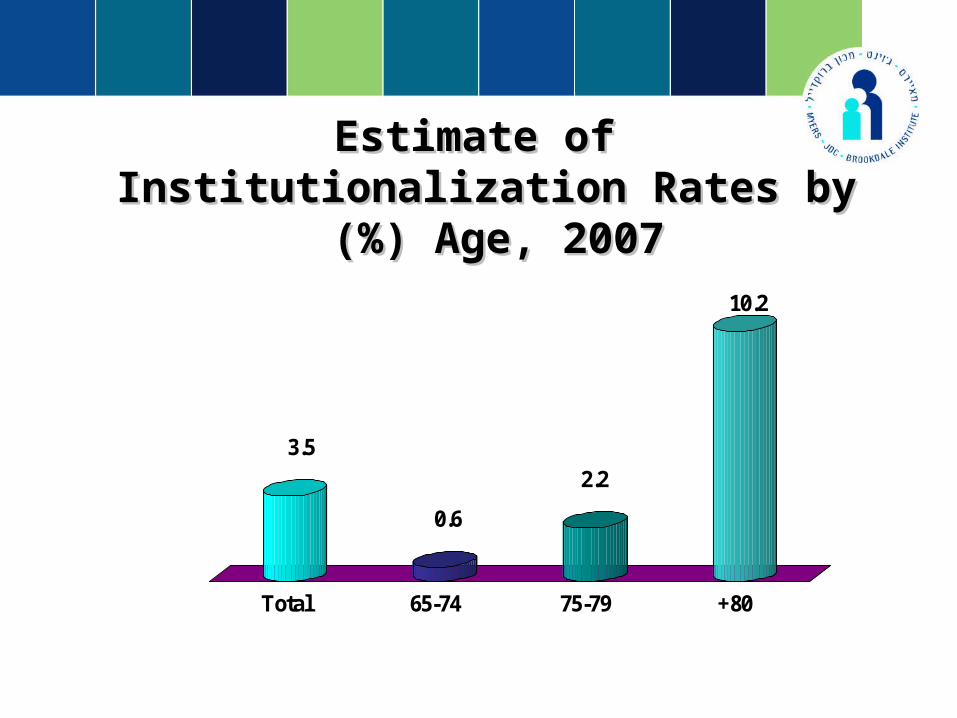
Estimate of Institutionalization Estimate of Institutionalization Rates by Age, 2007Rates by Age, 2007)%( )%(
3.5
0.6
2.2
10.2
Total 65-74 75-79 +80
27
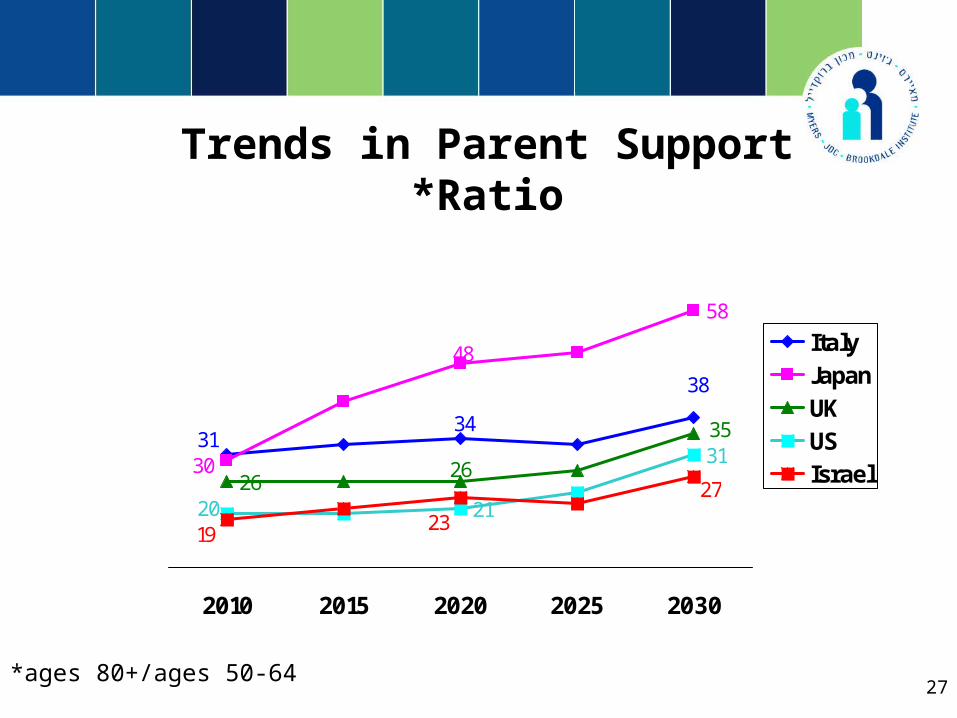
Trends in Parent Support Ratio*
58
2621
31
38
3134
30
48
35
26
2027
19 23
2010 2015 2020 2025 2030
ItalyJapanUKUSIsrael
ages 80+/ages 50-64*
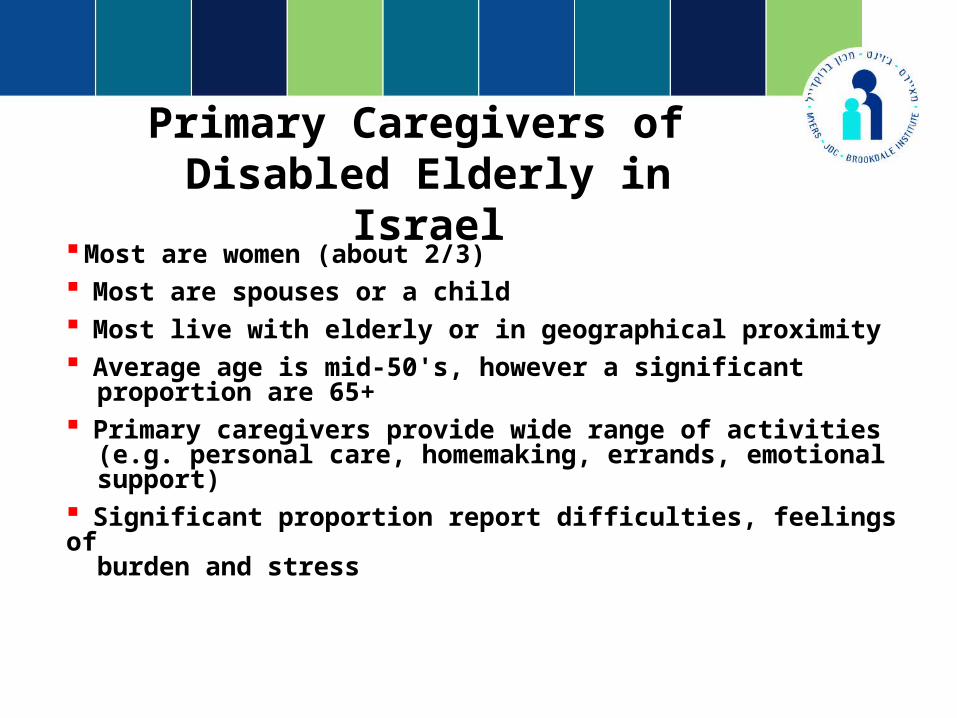
Primary Caregivers of Disabled Elderly in Israel
Most are women (about 2/3) Most are spouses or a child Most live with elderly or in geographical proximity Average age is mid-50's, however a significant proportion are 65+ Primary caregivers provide wide range of activities (e.g. personal care, homemaking, errands, emotional support) Significant proportion report difficulties, feelings of burden and stress
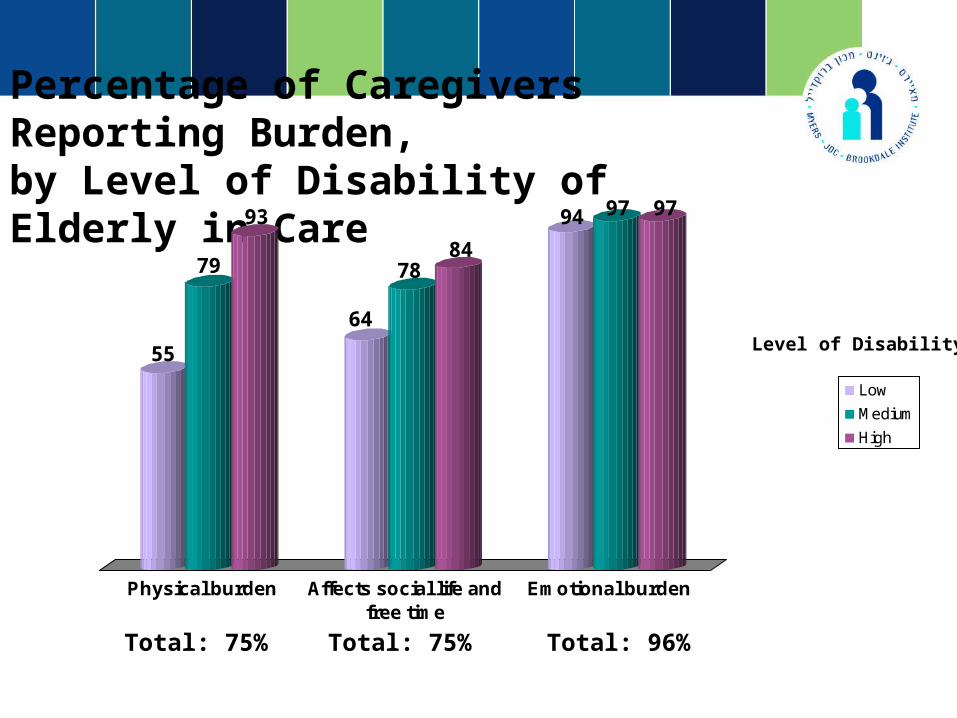
Percentage of Caregivers Reporting Burden, by Level of Disability of Elderly in Care
55
79
93
64
7884
94 97 97
Physical burden Affects social life andfree time
Emotional burden
Low
Medium
High
Level of Disability
Total: 75% Total: 75% Total: 96%
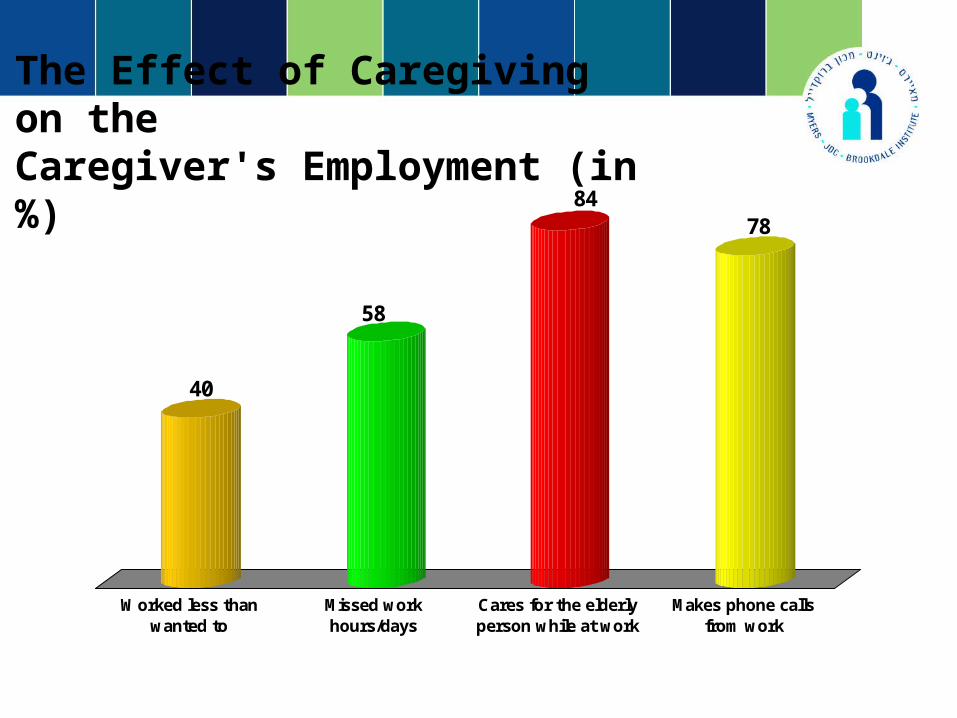
40
58
8478
Worked less thanwanted to
Missed workhours/days
Cares for the elderlyperson while at work
Makes phone callsfrom work
The Effect of Caregiving on the Caregiver's Employment )in %(
31
Key ChallengesDementia and depression – diagnosis and care
Supporting families (i.e. information, training and emotional support)
End of life care - is relatively at early stages of development
Prevention- more emphasis on health promotion and rehabilitation to prevent functional dependency or deterioration
The elderly as a resource


