
1
Flood Hazard Analysis
Session 1
Dr. Heiko Apel
Risk AnalysisFlood Hazard Assessment

2
Learning objectives
Risk AnalysisFlood Hazard Assessment
Learn
Terminology, definitions and key concepts of flood hazard analysis
Flood hazard mapping procedure
Understand
The hydrological cycle and the main causes of floods
The different types and characteristics of floods
The basics of flood modeling
The impacts of dike failures on flood hazard
The basics of climate change impacts on floods

Second most frequent natural disaster Floods are occurring more frequently resulting in
increasingly large losses
The total damage caused by minor and medium floods can be as high as the total damage caused by major floods
3
Why Care About Floods?
Risk AnalysisFlood Hazard Assessment

4
Basic hydrology
Generation of floods – Extremes in the hydrological cycle
Hydrology Describes the processes in the catchment Provides estimates of flood magnitudes by rainfall-
runoff modeling
Risk AnalysisFlood Hazard Assessment
Extraordinary rainfall
Excess of retention Capacity of
catchment Accelerated &
increased drainage Excess of drainage
capacity

5
Basic hydrology
Flood pathways and additional structural flood causes
Risk AnalysisFlood Hazard Assessment
Source: The Planning System and Flood Risk Management, Ministry of Environment, Heritage and Local Government, Ireland
Overland runoff and muddy
flooding due to intensive rainfall
Groundwater flooding due to
raised water table Surcharge
sewer causes basement flooding
Direct overland flow and
ponding in low pits (sinks)
Sewer exceedan
ce flooding
Flooding through the floodplains
Dike or dam breach
Impervious paved area
Urban growth: increased paving
Blockage or sewer collapse

6
Flood Types, Causes, and Characteristics
Short refers to less than one day; Medium refers to between one day and one week; Long refers to more than one week.Slow refers to less than 1 m/s; Medium refers to between 1 m/s and 2 m/s; fast refers to greater than 2 m/s.
Risk AnalysisFlood Hazard Assessment
Type Lead Time Duration Velocity
River
Flash Floods Short Short Fast
Flooding due to dam/dike failure
Short Short-Long Slow-Medium
Coastal
Storm Surges Medium-Long Short-Medium Medium
Tsunamis (seismic sea waves)
Short Short Fast
Urban
Drainage Problems Medium-Long Medium-Long Slow
High Groundwater Long Medium-Long Slow

7
Flood magnitude
Estimates of flood magnitude can be determined using one of two methods:
Rainfall-runoff modeling Frequency analysis
In principle: estimation of the probability of occurrence of a flood event of a given magnitude (maximum discharge)
Standard method: Extreme Value statistics Fitting a distribution function to a time series of discharges,
extrapolate from observations to extreme events (Caution: large uncertainties!)
Reach scale risk assessments: heterogeneity of flood probability
Different probabilities of occurrence for different reaches in the same event (regional flood frequency analysis)
Influence of dike breaches on downstream flood magnitude and probability (probabilistic & dynamic dike failure modeling)
Large scale risk assessments Correlation of floods in different basinsRisk Analysis
Flood Hazard Assessment
8
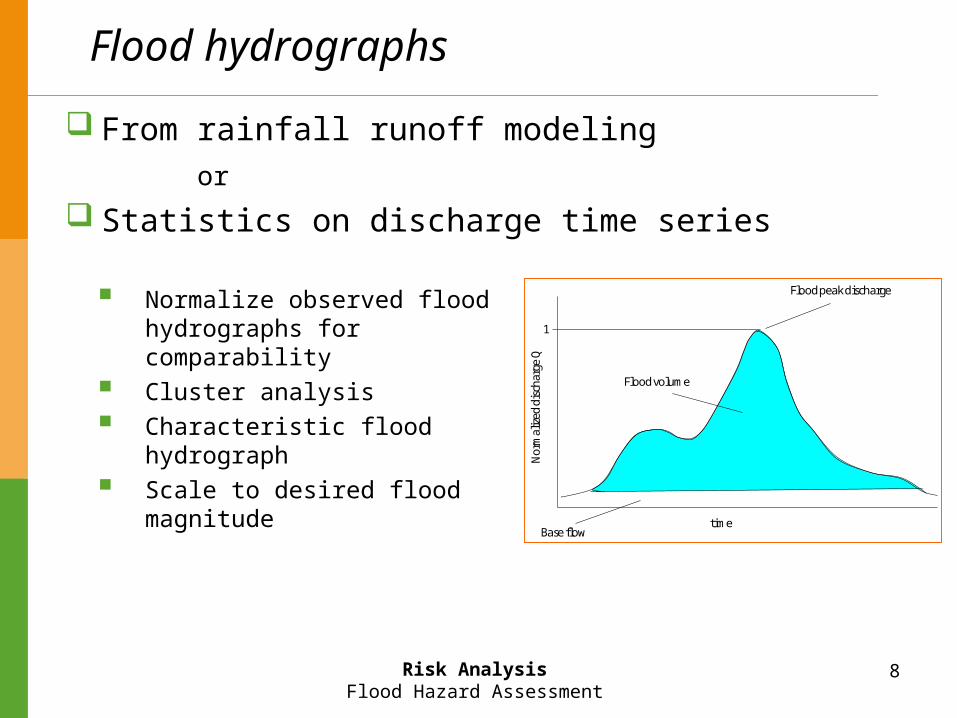
Flood hydrographs
From rainfall runoff modelingor
Statistics on discharge time series
Risk AnalysisFlood Hazard Assessment
Normalize observed flood hydrographs for comparability
Cluster analysis Characteristic flood
hydrograph Scale to desired flood
magnitude timeN
orm
aliz
ed d
isch
arge
Q
Flood peak discharge
Flood volume
Base flow
1
9
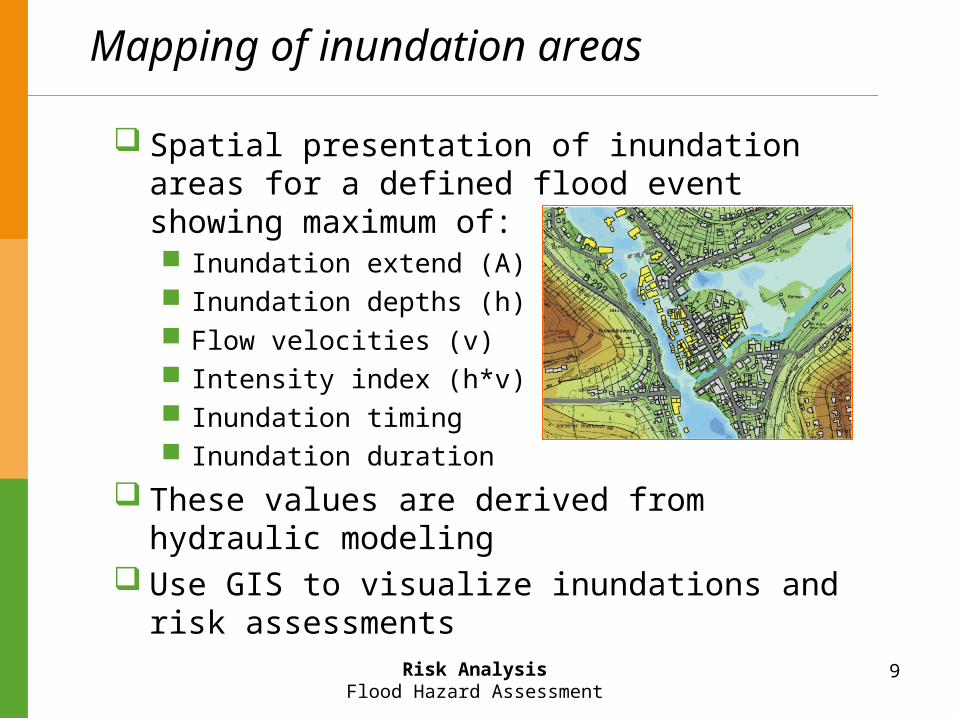
Mapping of inundation areas
Spatial presentation of inundation areas for a defined flood event showing maximum of: Inundation extend (A) Inundation depths (h) Flow velocities (v) Intensity index (h*v) Inundation timing Inundation duration
These values are derived from hydraulic modeling
Use GIS to visualize inundations and risk assessments
Risk AnalysisFlood Hazard Assessment

10
Flood simulation
Computational hydraulics approaches: 1D hydrostatic 1D hydrodynamic simplified (kinematic, diffusion wave) 1D full hydrodynamic 1D/2D simplified hydrodynamic 1D/2D full hydrodynamic 2D full hydrodynamic 3D full hydrodynamic
Complexity
simple
complex
model setup data requirements
computational demand
Application scale
large
small
Risk AnalysisFlood Hazard Assessment
11
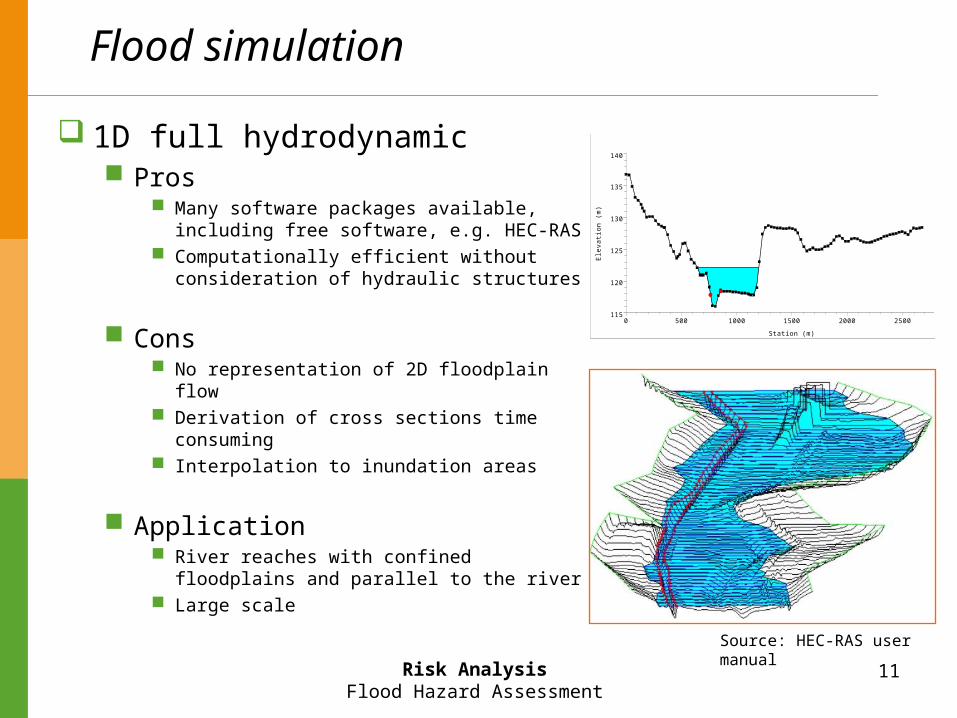
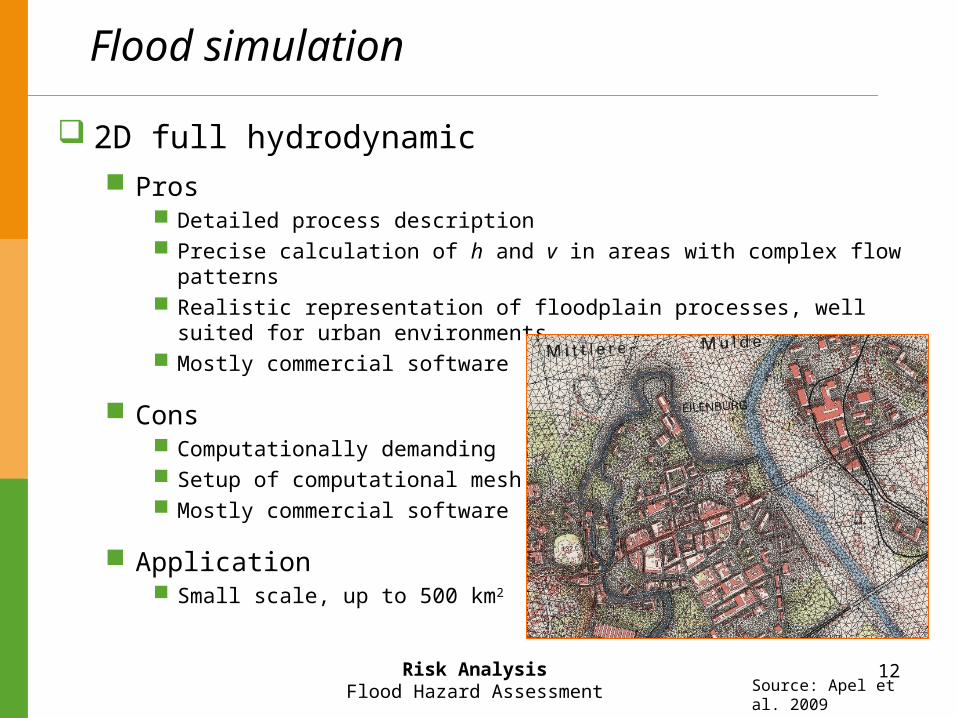
Flood simulation
1D full hydrodynamic Pros
Many software packages available, including free software, e.g. HEC-RAS
Computationally efficient without consideration of hydraulic structures
Cons No representation of 2D floodplain flow Derivation of cross sections time
consuming Interpolation to inundation areas
Application River reaches with confined floodplains and
parallel to the river Large scale
Source: HEC-RAS user manual
Risk AnalysisFlood Hazard Assessment
0 500 1000 1500 2000 2500 3000115
120
125
130
135
140
Mulde_Test1 Plan: Plan 02 08/08/2008
Station (m)
Ele
vatio
n (m
)
Legend
EG Max WS
WS Max WS
Ground
Bank Sta
.035 .11 .035
.11 .033 .035
Cross section over channel and floodplain
Interpolated cross sections
12
Flood simulation
2D full hydrodynamic Pros
Detailed process description Precise calculation of h and v in areas with complex flow patterns Realistic representation of floodplain processes, well suited for urban
environments Mostly commercial software
Cons Computationally demanding Setup of computational mesh Mostly commercial software
Application Small scale, up to 500 km2
Source: Apel et al. 2009
Risk AnalysisFlood Hazard Assessment
Failure of dikes
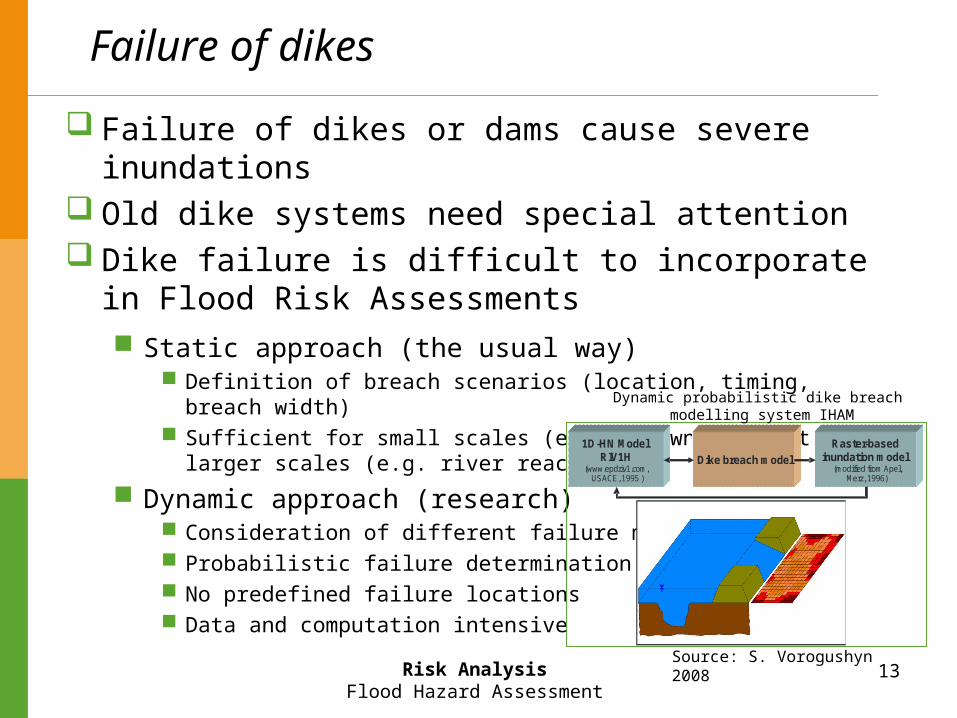
Failure of dikes or dams cause severe inundations
Old dike systems need special attention Dike failure is difficult to incorporate in Flood
Risk Assessments Static approach (the usual way)
Definition of breach scenarios (location, timing, breach width) Sufficient for small scales (e.g. a town) but not for larger scales
(e.g. river reaches)
Dynamic approach (research) Consideration of different failure modes Probabilistic failure determination No predefined failure locations Data and computation intensive
1D-HN Model RIV1H
(www.epdriv1.com,USACE, 1995 )
Dike breach model
Raster-based inundation model
(modified from Apel,Merz, 1996)
Source: S. Vorogushyn 2008
Dynamic probabilistic dike breach modelling system IHAM
13Risk AnalysisFlood Hazard Assessment

14
Failure of dikes (cont.)
Output of probabilistic dike breach and flood hazard assessment: Dike failure probabilities (global and per failure mode) Spatially differentiated inundation probabilities Spatially differentiated inundation depths, velocities,
duration, and intensity with uncertainty estimates
Source: S. Vorogushyn 2008
Median of maximum inundation depthMedian of maximum inundation depth
9090thth percentile map percentile map
Source: S. Vorogushyn 2008
Risk AnalysisFlood Hazard Assessment

15
Climate change and floods
Long term flood mitigation and management plans should take into account climate change and floods Temperature increase leads to intensification of hydrological
cycle Global increase in temperature of estimated 2.8 – 5.2 °C
leads to a global increase in evaporation and precipitation: 7 – 15%
Increasing probability of extreme events
Regional differences Large spatial and seasonal variation, high uncertainty
Differences have been observed in discharge time series (non-stationary approaches needed!)
Global climate change scenario simulations, downscaling procedures and hydrological models can estimate regional variation
But uncertainty for flood projections, especially magnitude, very large Risk Analysis
Flood Hazard Assessment


