
1
Commercial Banking
Banorte Investor Day
November 16, 2007
2
Contents
1. Commercial Overview
• Infrastructure
• Key Volume Indicators
• Key Performance Indicators
2. Competitive advantages
• Process improvements
• Commercial Alliances
3
Contents
1. Commercial Overview
• Infrastructure
• Key Volume Indicators
• Key Performance Indicators
2. Competitive advantages
• Process improvements
• Commercial Alliances
4
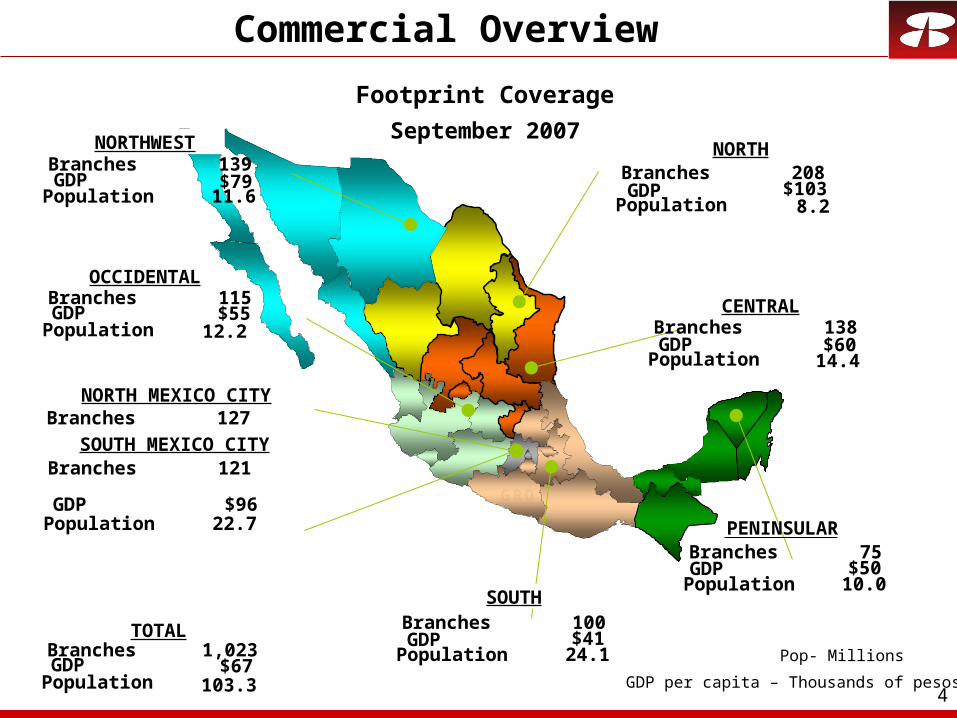
Footprint Coverage
September 2007
Commercial Overview
GROGRO
TOTAL SISTEMA
Branches 139$79
Population 11.6
NOROESTE
OCCIDENTE
MEXICO NORTE
SUR
PENINSULAR
CENTRO
NORTEBranches 208
$103Population
Branches 115$55
Population 12.2 Branches 138$60
Population 14.4
Branches 127
Branches 75$50
Population 10.0
Branches 100$41
Population 24.1
MEXICO SURBranches 121
Branches 1,023$67
Population 103.3
Pop- Millions
8.2
GDP per capita – Thousands of pesos
$96Population 22.7
GDPGDP
GDP
GDP
GDP
GDP
GDP
GDP
NORTHWEST NORTH
CENTRAL
OCCIDENTAL
NORTH MEXICO CITY
SOUTH MEXICO CITY
TOTAL
SOUTH
5
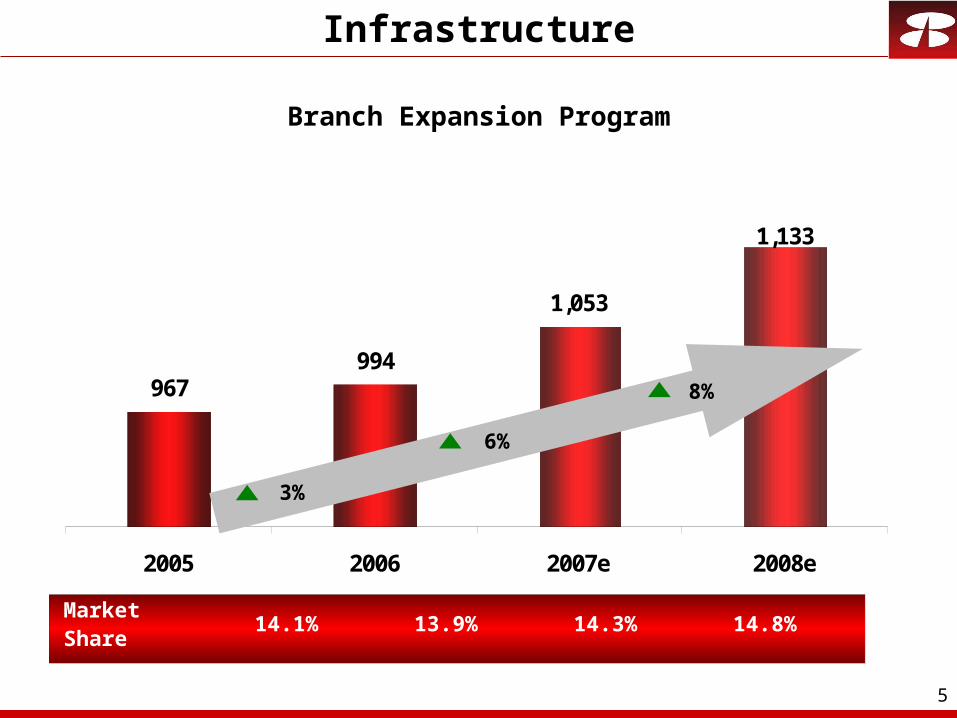
967994
1,053
1,133
2005 2006 2007e 2008e
3%
6%
8%
Infrastructure
Branch Expansion Program
14.1%Market Share
13.9% 14.3% 14.8%

6
2,7923,169
3,644
4,114
2005 2006 2007e 2008e
14%
15%
13%
Infrastructure
ATM Network
12.9%Market Share 13.1% 13.9% 14.5%
7
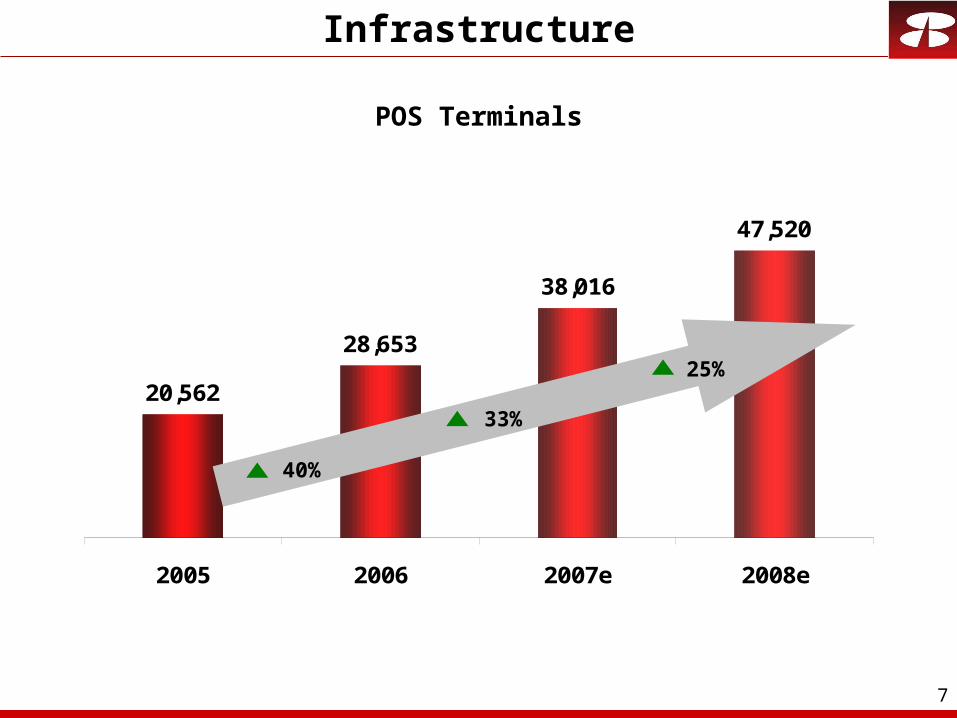
20,562
28,653
38,016
47,520
2005 2006 2007e 2008e
40%
33%
25%
Infrastructure
POS Terminals
8
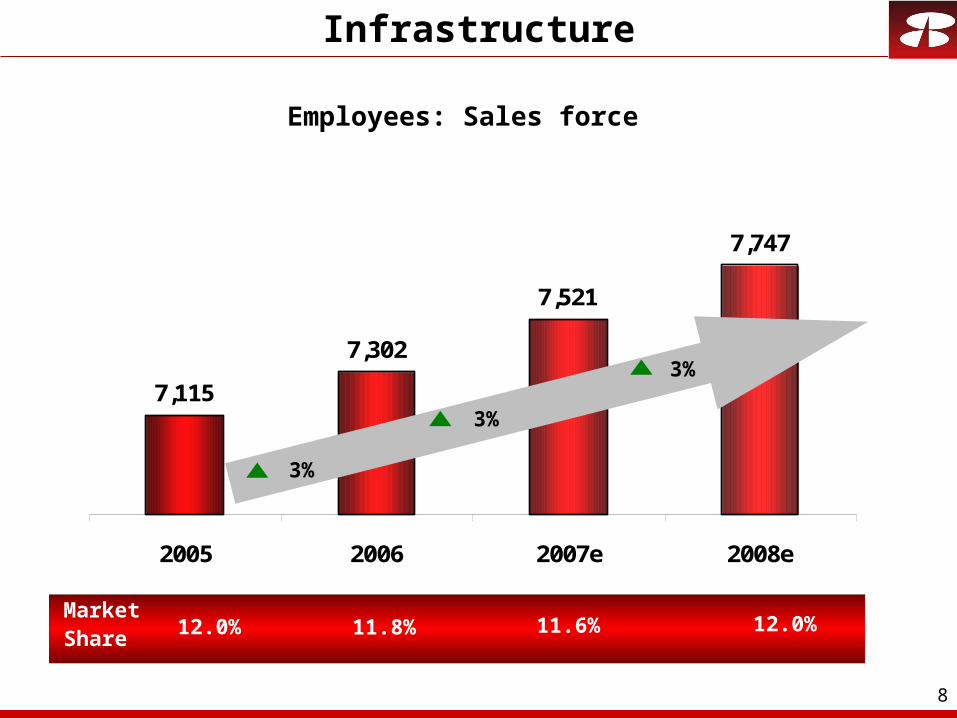
7,115
7,302
7,521
7,747
2005 2006 2007e 2008e
3%
3%
3%
Infrastructure
Employees: Sales force
12.0%Market Share 11.8% 11.6% 12.0%
9
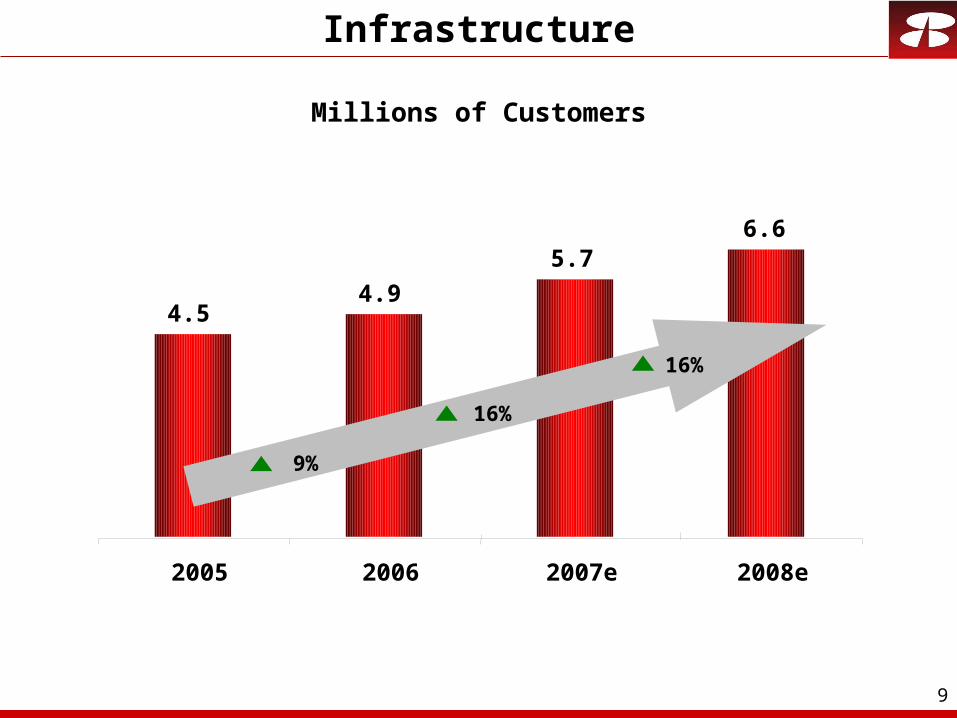
10%
16%
11%
Infrastructure
Millions of Customers
4.54.9
5.76.6
2005 2006 2007e 2008e
9%
16%
16%
10
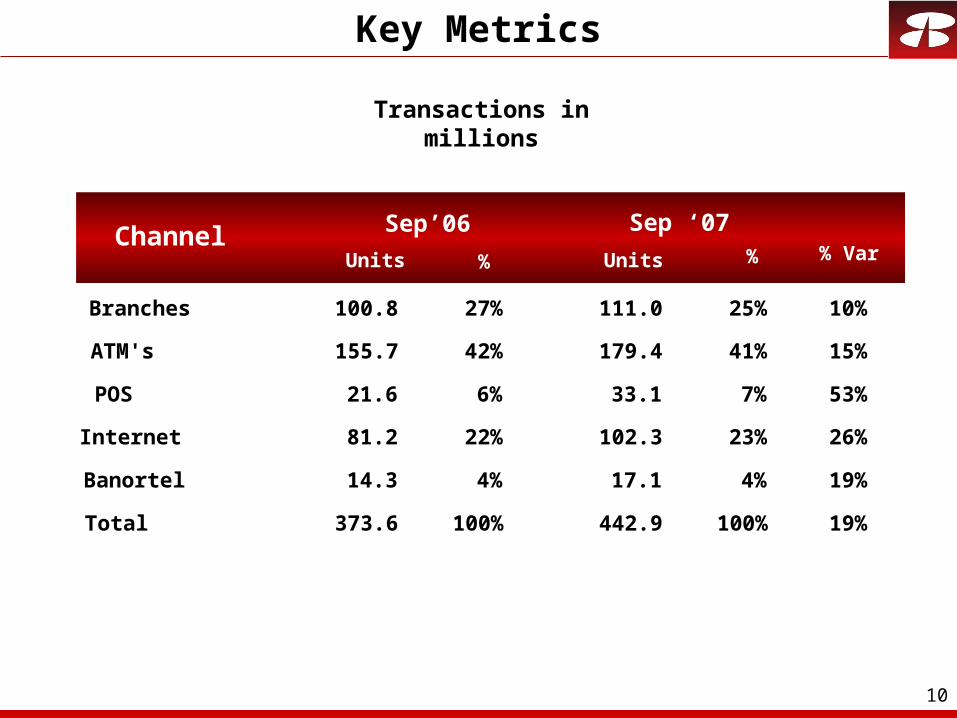
Key Metrics
Units % Units %
Branches 100.8 27% 111.0 25% 10%
ATM's 155.7 42% 179.4 41% 15%
POS 21.6 6% 33.1 7% 53%
Internet 81.2 22% 102.3 23% 26%
Banortel 14.3 4% 17.1 4% 19%
Total 373.6 100% 442.9 100% 19%
Sep’06 Sep ‘07% Var
Channel
# %
Transactions in millions
11
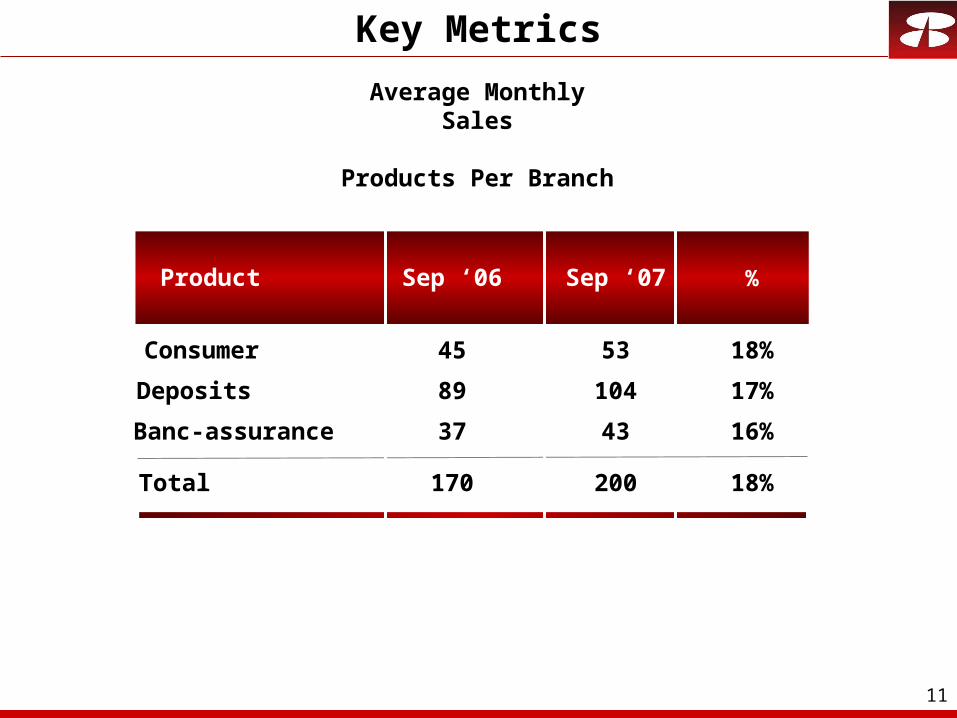
Average Monthly Sales
Products Per Branch
Key Metrics
Sep ‘06 Sep ‘07 %
Consumer 45 53 18%
Deposits 89 104 17%
Banc-assurance 37 43 16%
Total 170 200 18%
Product
12
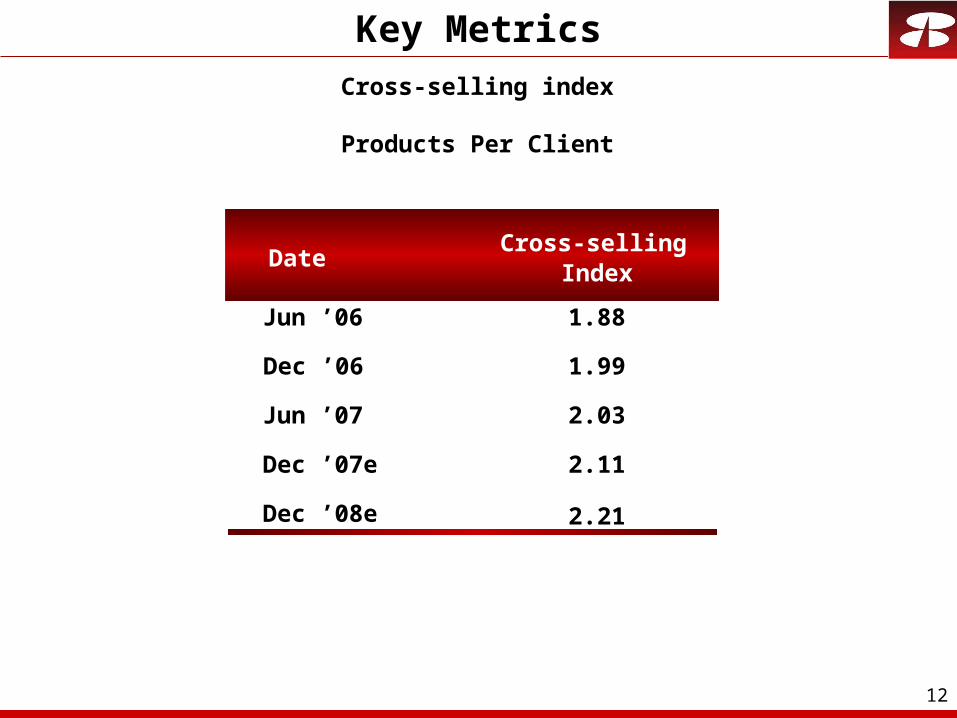
Key Metrics
DateCross-selling
Index
Jun ’06 1.88
Dec ’06 1.99
Jun ’07 2.03
Dec ’07e 2.11
Dec ’08e 2.21
Cross-selling index
Products Per Client
13
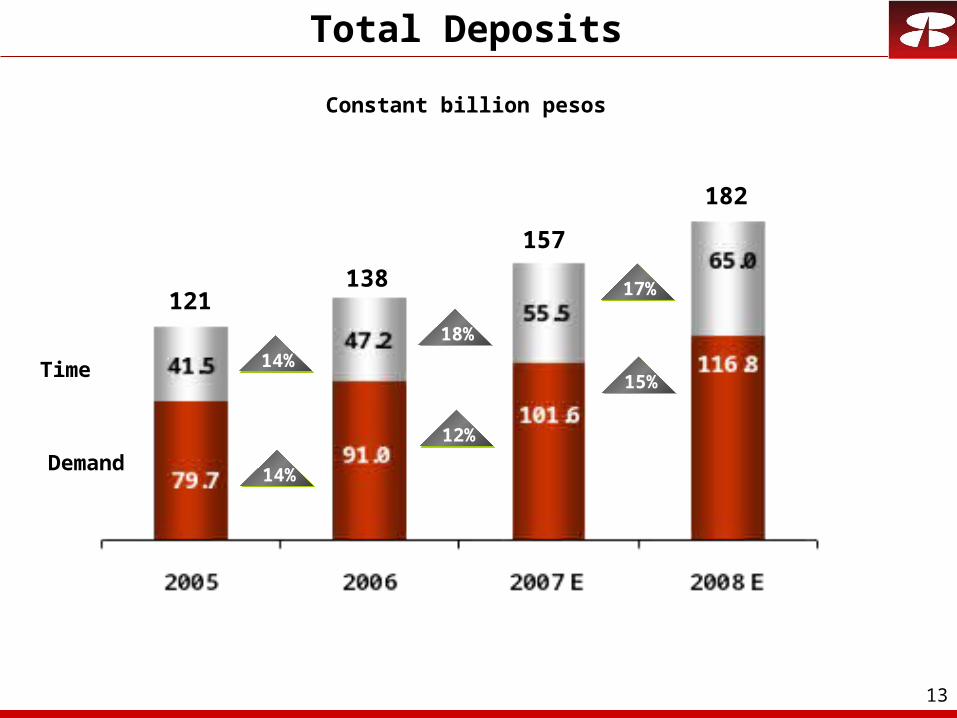
Constant billion pesos
Total Deposits
Demand
Time 14%
14%
17%
18%
12%
15%
121138
157
182
14
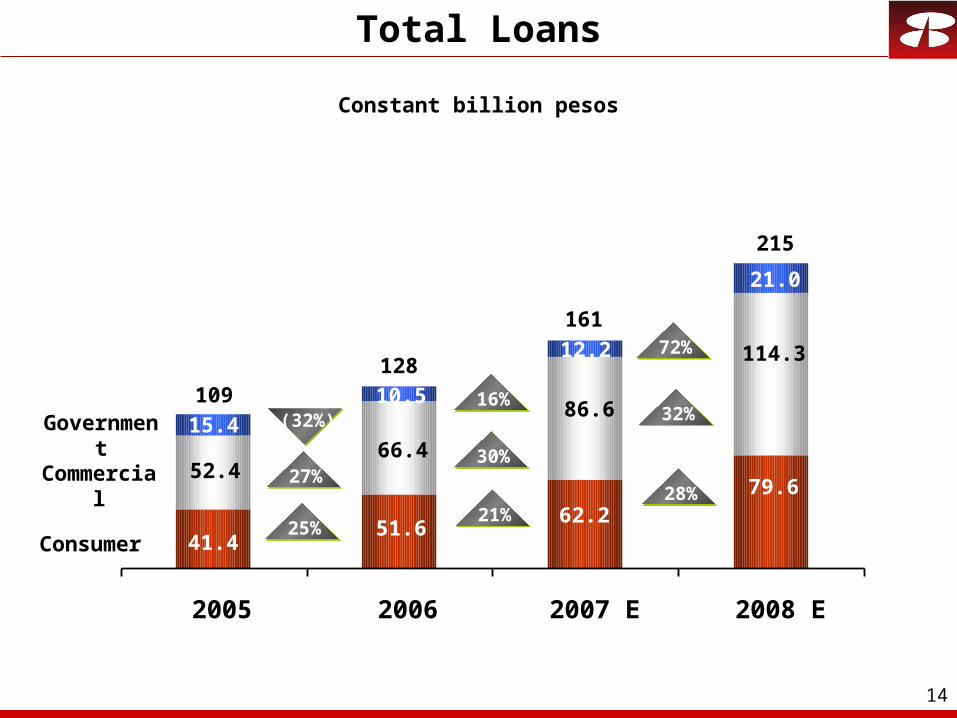
Total Loans
Constant billion pesos
Consumer
Commercial
Government
25%
27%
(32%)
41.451.6
62.279.6
52.466.4
86.6
114.3
15.410.5
12.2
21.0
2005 2006 2007 E 2008 E
21%
30%
16%
28%
32%
72%
109128
161
215
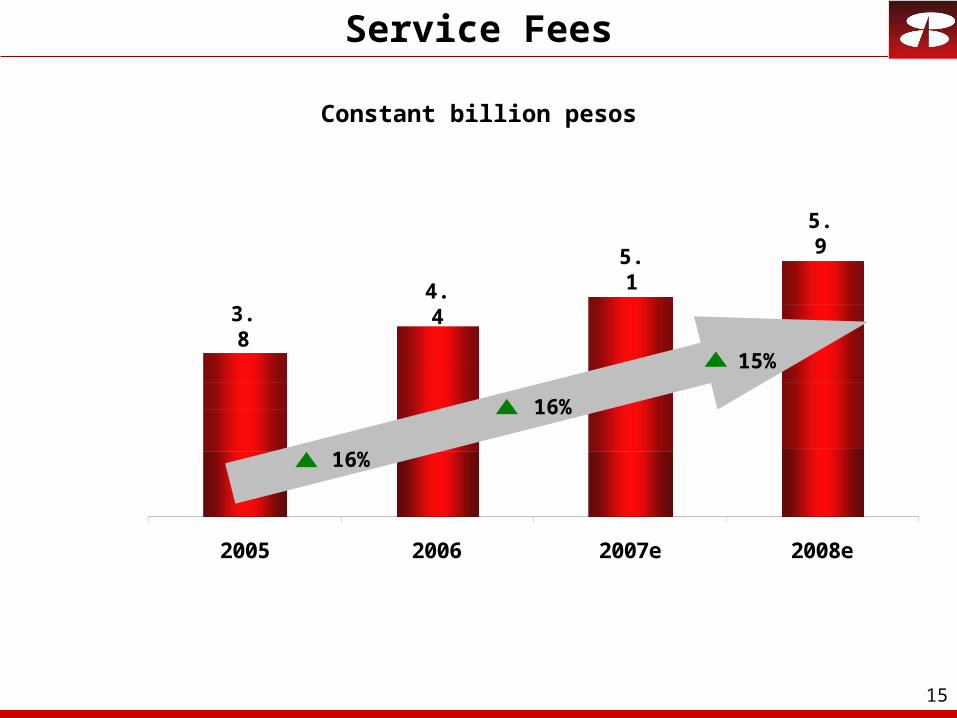
15
2005 2006 2007e 2008e
Service Fees
Constant billion pesos
3.84.4
5.1
5.9
16%
16%
15%
16
Contents
1. Commercial Overview
• Infrastructure
• Key Volume Indicators
• Key Performance Indicators
2. Competitive advantages
• Process improvements
• Commercial Alliances
17
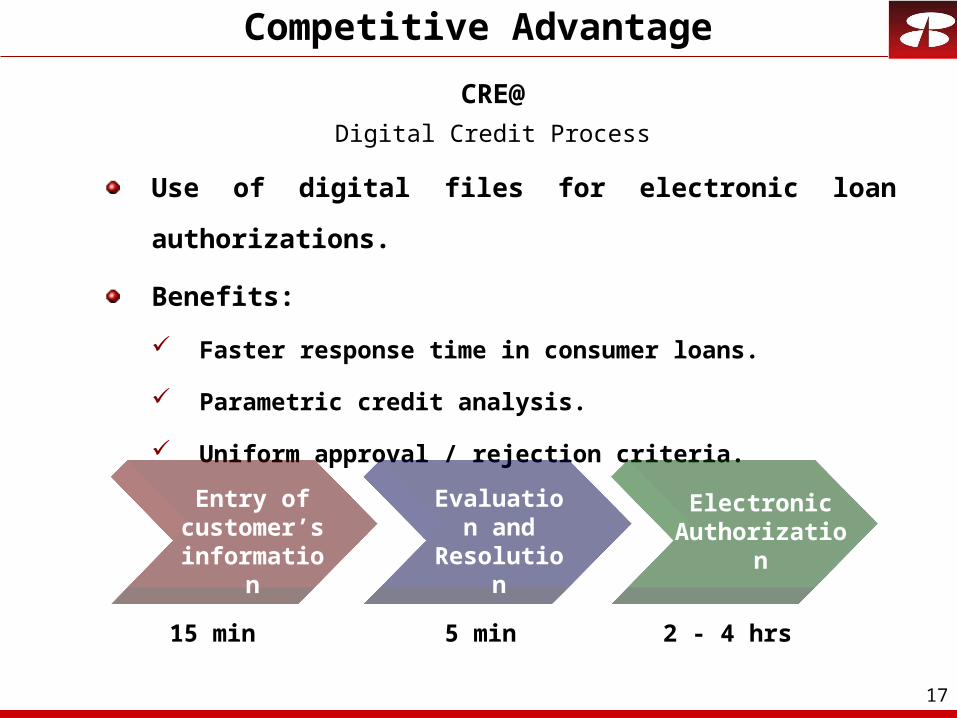
Use of digital files for electronic loan authorizations.
Benefits:
Faster response time in consumer loans.
Parametric credit analysis.
Uniform approval / rejection criteria.
Competitive Advantage
Evaluation and
Resolution
Entry ofcustomer’s information
15 min 5 min 2 - 4 hrs
Electronic Authorization
CRE@
Digital Credit Process
18
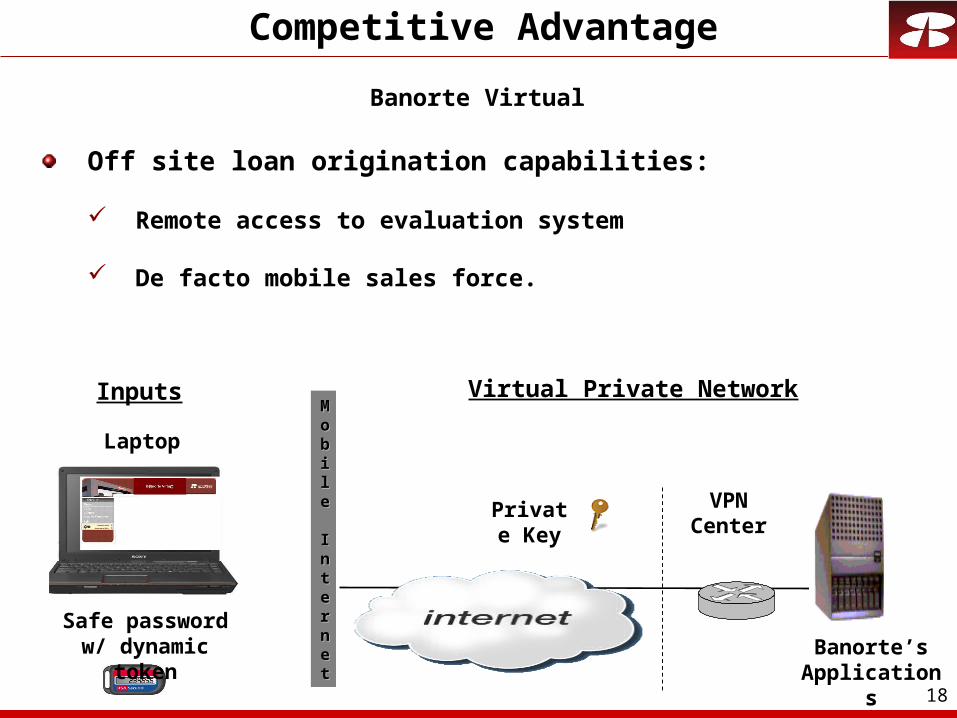
Off site loan origination capabilities:
Remote access to evaluation system
De facto mobile sales force.
Competitive Advantage
Banorte’s Applications
VPNCenter
Private Key
Virtual Private Network
Laptop
Banorte Virtual
Inputs
Safe password w/ dynamic token
MMoobbiillee IInntteerrnneett

19
Competitive Advantage
Tracking of sales’ force metrics.
Planning, development & client retention tool.
Cross-selling tool.
Incentive based compensation schemes.
SIVSSales Force Supervision
20
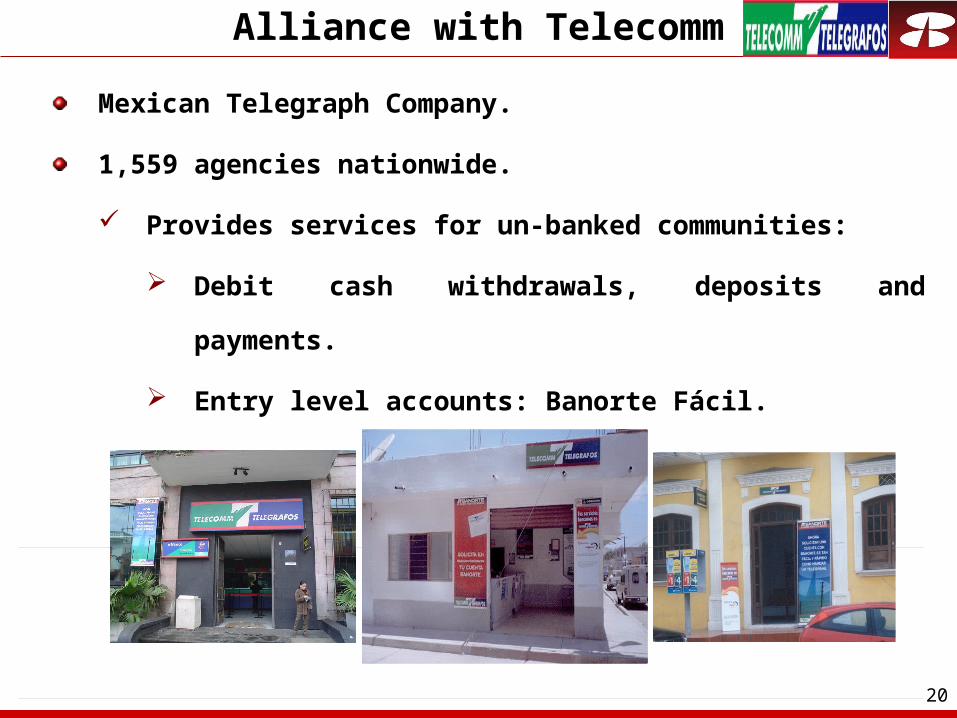
Alliance with Telecomm
Mexican Telegraph Company.
1,559 agencies nationwide.
Provides services for un-banked communities:
Debit cash withdrawals, deposits and payments.
Entry level accounts: Banorte Fácil.
21
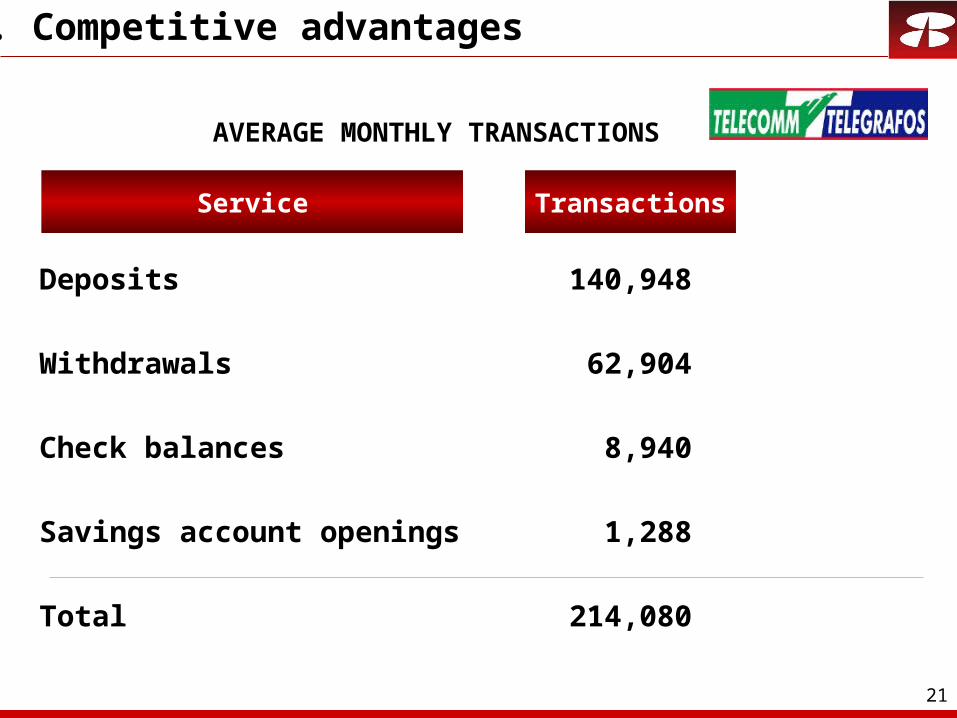
Deposits
Withdrawals
Check balances
Savings account openings
Total
AVERAGE MONTHLY TRANSACTIONS
Service Transactions
140,948
62,904
8,940
1,288
214,080
2. Competitive advantages

22
Certain statements in this document are
“forward-looking statements”. These
statements are based on management’s
current expectations and are subject to
uncertainty and changes in
circumstances. Actual results may differ
materially from those included in these
statements due to a variety of factors.

23
36
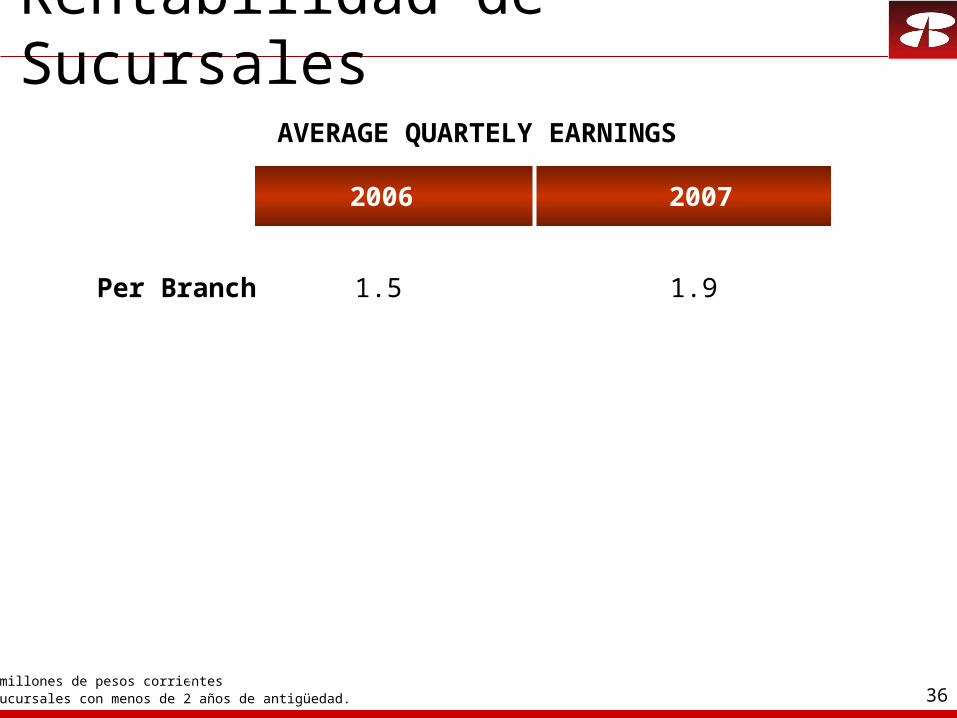
Rentabilidad de Sucursales
AVERAGE QUARTELY EARNINGS
$ millones de pesos corrientes* Sucursales con menos de 2 años de antigüedad.
2006 2007
Per Branch 1.5 1.9


