
07 September 2020 Initiating Coverage
Berger Paints
HSIE Research is also available on Bloomberg ERH HDF <GO> & Thomson Reuters
Catalysts missing for a performance encore Berger Paints (BRGR) has gone toe-to-toe with dominant leader APNT over
FY10-20 despite the former's higher industrial salience, implying that its
decorative biz has outpaced APNT’s. Growth has been smartly navigated
alongside improving profitability via aggressive product innovation/
premiumisation, efficient marketing and distribution expansion
(GM/EBITDAM differential has reduced from 856/924bp to 320/560bp over
FY10-20). While this narrative will continue, outperformance is unlikely to be
as steep over FY20-23, given that (1) BRGR will have to contend with APNT's
stepped-up aggression at the bottom of the pyramid and (2) margin levers
seem to be missing. We build in revenue/EBITDA/PAT CAGR of 8/9/10% over
FY20-23E (closely tracking APNT) and initiate coverage on the stock with a
Sell recommendation and a DCF-based target price of Rs. 460/sh (implying 55x
Sep-22 P/E) as there is nothing on the investor table at 66x Sept-22 P/E. RoICs
are likely to mean revert to 22% by FY22/23.
Outperformed market leader: BRGR’s 5/10 year growth rates of 8/13%
mirrors that of APNT’s despite the former's higher industrial salience (20%
of domestic sales), implying that BRGR's decorative biz has outpaced that of
APNT's. It has also narrowed its profitability gap vs APNT over FY10-20
(GM/EBITDAM differential has reduced from 856/924bp to 320/560bp over
FY10-20). Key underpinnings for this outperformance are (1) improvement
in product price ladder, (2) smart brand-building, (3) improving distribution
quality, and (4) strategic tie-ups with strong category partners.
Albeit, do not expect a performance encore: Growth narrative will
continue, albeit BRGR's decorative outperformance vs APNT is not likely to
be material, given the latter's stepped-up aggression in driving sales from
the bottom of the pyramid, thereby restricting BRGR's sales outperformance.
We model 11/12% and 8/9% volume CAGR for APNT/BRGR over FY20-23.
Margin levers absent over FY21-23: Benign RM costs are likely to keep GMs
elevated in FY21 at ~43% (up 170bp YoY) but are likely to mean revert over
FY21-23 as (1) RM costs firm up with demand recovery, (2) the momentum
in low-GM (lower-end) paints outweighs that of premiumisation, and (3)
down-trading gains steam amidst pressure on incomes. Cost of operations is
expected to remain elevated in FY21/22, due to (1) pandemic-led
unfavourable leverage and (2) unabsorbed costs hitting the P&L once the
Sandila Plant is commissioned in FY22. Hence, we build in a modest 60bp
EBITDAM expansion, mostly mimicking GM gains over FY21-23.
Valuation and outlook: While BRGR remains a credible No. 2 in paints; at
66x Sept-22 P/E (18% premium to APNT), risk-reward seems unfavorable.
We assign a DCF-based TP of Rs. 460/sh (implying 55x Sep-21 P/E). Implied
assumptions: (1) 10-year revenue CAGR: 12.6%, (2) FY20-30E/FY30-41E
FCFF CAGR: 20/13.5% resp. (3) WACC: 10.5%, and (4) terminal growth: 6%,
FCF/PAT conversion of ~70% over FY20-30E. Initiate with a Sell Reco.
Financial Summary (Rs mn) FY19 FY20 FY21E FY22E FY23E
Net Revenue 60,619 63,658 58,853 71,948 80,458
EBITDA 8,816 10,610 9,698 12,396 13,902
APAT 4,975 6,561 5,867 7,706 8,684
EPS (Rs) 5.1 6.8 6.0 7.9 8.9
P/E (x) 109.7 83.2 93.0 70.8 62.9
EV/EBITDA (x) 62.2 51.7 56.2 43.9 38.7
Core RoCE (%) 17.9 21.0 17.6 21.5 22.1
Source: Company, HSIE Research
SELL
CMP (as on 04 Sep 2020) Rs 552
Target Price Rs 460
NIFTY 11,334
KEY
CHANGES OLD NEW
Rating - SELL
Price Target - Rs 460
EPS % FY21E FY22E
- -
KEY STOCK DATA
Bloomberg code BRGR IN
No. of Shares (mn) 971
MCap (Rs bn) / ($ mn) 534/7,329
6m avg traded value (Rs mn) 862
52 Week high / low Rs 597/357
STOCK PERFORMANCE (%)
3M 6M 12M
Absolute (%) 9.5 2.0 53.3
Relative (%) (3.3) 2.2 48.9
SHAREHOLDING PATTERN (%)
Mar-20 June-20
Promoters 74.99 74.99
FIs & Local MFs 1.05 1.12
FPIs 11.8 4.02
Public & Others 12.16 19.87
Pledged Shares 0 0
Source : BSE
Jay Gandhi
+91-22-6171-7320
Varun Lohchab
+91-22-6171-7334

Page | 2
Berger Paints: Initiating Coverage
Focus Charts
Industry/organised paints revenue forecasts BRGR has held its own in the oligopolistic paint
industry (Top 4 relative market share, %)
Source: HSIE Research Source: HSIE Research
...and gone toe-to-toe with dominant market leader
APNT…
…with improving share in the sector's profitability
(Top 4 relative PAT share, %)
Source: Companies, HSIE Research Source: Companies, HSIE Research
…as product innovation/premiumisation helped BRGR reduce its profitability gap with the best in business (gross
margin and EBITDAM differential (bp) vs APNT reduced from 856/924bp to 320/560bp over FY10-20
Source: Companies, HSIE Research
17.
8
18.
0
17.
5
17.
7
17.
5
17.
7
17.
5
18.
0
18.
0
18.
4
18.
7
0%
20%
40%
60%
80%
100%
FY
10
FY
11
FY
12
FY
13
FY
14
FY
15
FY
16
FY
17
FY
18
FY
19
FY
20
Asian Paints Berger Paints
Kansai Nerolac Azko Nobel
9.7
11.
7
11.
4
12.
7
13.
4
13.
1
14.
4
13.
2
14.
2
14.
3
16.
5
0%
20%
40%
60%
80%
100%
FY
10
FY
11
FY
12
FY
13
FY
14
FY
15
FY
16
FY
17
FY
18
FY
19
FY
20
Asian Paints Berger Paints Kansai Nerolac Azko Nobel
30.0
35.0
40.0
45.0
50.0
FY
08
FY
09
FY
10
FY
11
FY
12
FY
13
FY
14
FY
15
FY
16
FY
17
FY
18
FY
19
FY
20
APNT (std) BRGR (std)
KNPL (std) Azko Nobel
320bp
856bp
5
10
15
20
25
FY
08
FY
09
FY
10
FY
11
FY
12
FY
13
FY
14
FY
15
FY
16
FY
17
FY
18
FY
19
FY
20
APNT (std) BRGR (std) KNPL (std) Azko Nobel
560bp
924bp
8.1 8.4
6.9
1.0
12.9 12.9
11.2 10.9
-
2.0
4.0
6.0
8.0
10.0
12.0
14.0
0 0 0 0
APNT (Std) BRGR (Std) KNPL (Std) Azko Nobel
5-yr CAGR 10-yr CAGR
0
9
-7
20
12 12 12 11
-10
-5
0
5
10
15
20
25
0
500
1,000
1,500
FY
19
E
FY
20
E
FY
21
E
FY
22
E
FY
23
E
FY
24
E
FY
25
E
FY
30
E
Total paints revenue
Organized paints revenue
Org. Paints revenue growth (%) - RHS
Rs bn
Page | 3
Berger Paints: Initiating Coverage
Has outpaced market leader…
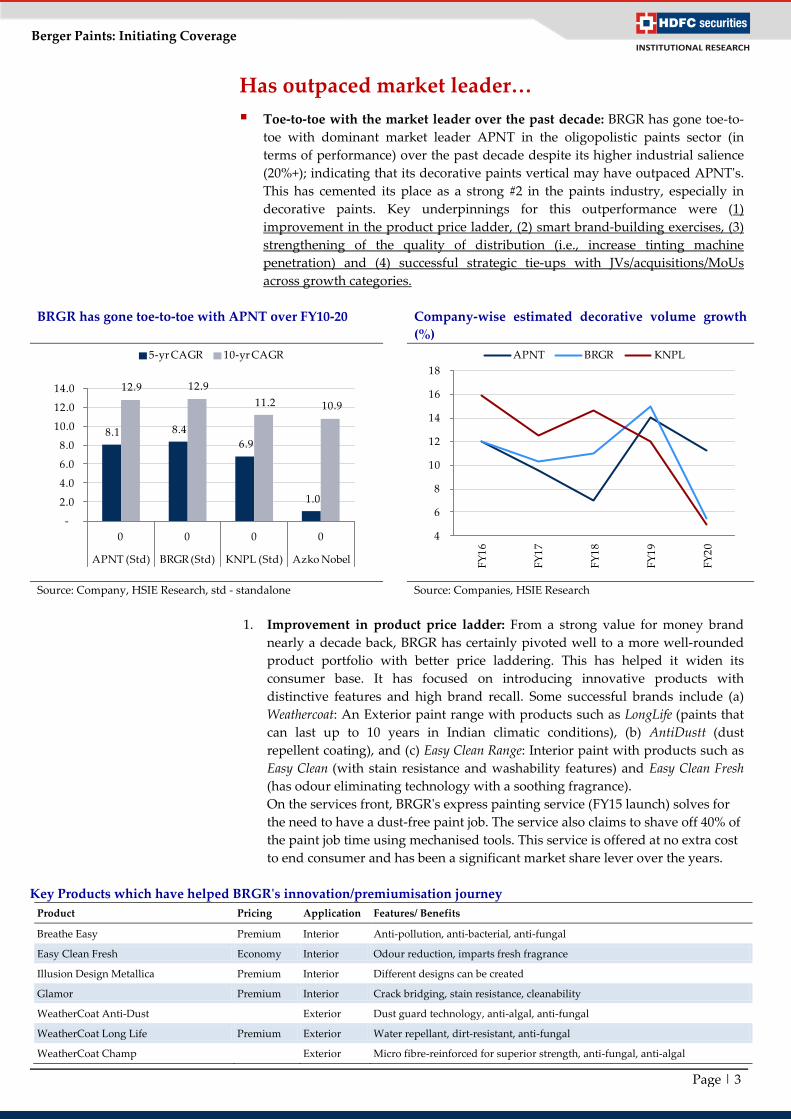
Toe-to-toe with the market leader over the past decade: BRGR has gone toe-to-
toe with dominant market leader APNT in the oligopolistic paints sector (in
terms of performance) over the past decade despite its higher industrial salience
(20%+); indicating that its decorative paints vertical may have outpaced APNT's.
This has cemented its place as a strong #2 in the paints industry, especially in
decorative paints. Key underpinnings for this outperformance were (1)
improvement in the product price ladder, (2) smart brand-building exercises, (3)
strengthening of the quality of distribution (i.e., increase tinting machine
penetration) and (4) successful strategic tie-ups with JVs/acquisitions/MoUs
across growth categories.
BRGR has gone toe-to-toe with APNT over FY10-20 Company-wise estimated decorative volume growth
(%)
Source: Company, HSIE Research, std - standalone Source: Companies, HSIE Research
1. Improvement in product price ladder: From a strong value for money brand
nearly a decade back, BRGR has certainly pivoted well to a more well-rounded
product portfolio with better price laddering. This has helped it widen its
consumer base. It has focused on introducing innovative products with
distinctive features and high brand recall. Some successful brands include (a)
Weathercoat: An Exterior paint range with products such as LongLife (paints that
can last up to 10 years in Indian climatic conditions), (b) AntiDustt (dust
repellent coating), and (c) Easy Clean Range: Interior paint with products such as
Easy Clean (with stain resistance and washability features) and Easy Clean Fresh
(has odour eliminating technology with a soothing fragrance).
On the services front, BRGR's express painting service (FY15 launch) solves for
the need to have a dust-free paint job. The service also claims to shave off 40% of
the paint job time using mechanised tools. This service is offered at no extra cost
to end consumer and has been a significant market share lever over the years.
Key Products which have helped BRGR's innovation/premiumisation journey
Product Pricing Application Features/ Benefits
Breathe Easy Premium Interior Anti-pollution, anti-bacterial, anti-fungal
Easy Clean Fresh Economy Interior Odour reduction, imparts fresh fragrance
Illusion Design Metallica Premium Interior Different designs can be created
Glamor Premium Interior Crack bridging, stain resistance, cleanability
WeatherCoat Anti-Dust Exterior Dust guard technology, anti-algal, anti-fungal
WeatherCoat Long Life Premium Exterior Water repellant, dirt-resistant, anti-fungal
WeatherCoat Champ Exterior Micro fibre-reinforced for superior strength, anti-fungal, anti-algal
8.1 8.4
6.9
1.0
12.9 12.9
11.2 10.9
-
2.0
4.0
6.0
8.0
10.0
12.0
14.0
0 0 0 0
APNT (Std) BRGR (Std) KNPL (Std) Azko Nobel
5-yr CAGR 10-yr CAGR
4
6
8
10
12
14
16
18
FY
16
FY
17
FY
18
FY
19
FY
20
APNT BRGR KNPL
Page | 4
Berger Paints: Initiating Coverage
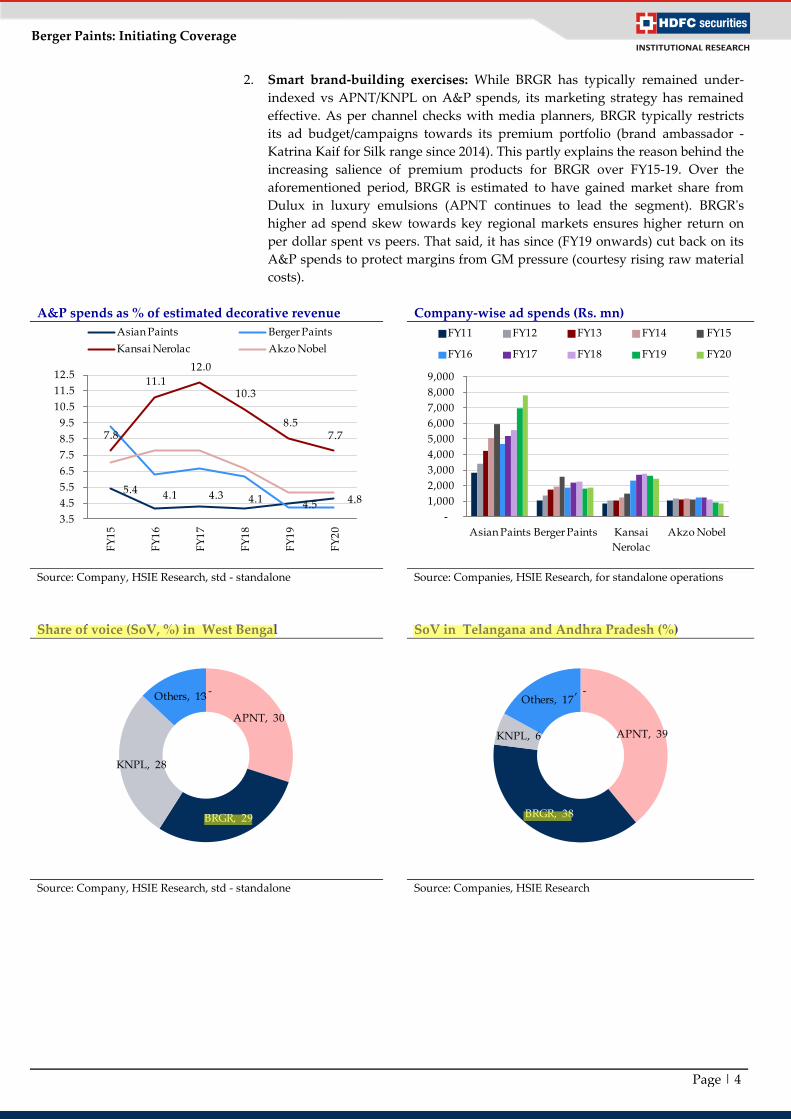
2. Smart brand-building exercises: While BRGR has typically remained under-
indexed vs APNT/KNPL on A&P spends, its marketing strategy has remained
effective. As per channel checks with media planners, BRGR typically restricts
its ad budget/campaigns towards its premium portfolio (brand ambassador -
Katrina Kaif for Silk range since 2014). This partly explains the reason behind the
increasing salience of premium products for BRGR over FY15-19. Over the
aforementioned period, BRGR is estimated to have gained market share from
Dulux in luxury emulsions (APNT continues to lead the segment). BRGR's
higher ad spend skew towards key regional markets ensures higher return on
per dollar spent vs peers. That said, it has since (FY19 onwards) cut back on its
A&P spends to protect margins from GM pressure (courtesy rising raw material
costs).
A&P spends as % of estimated decorative revenue Company-wise ad spends (Rs. mn)
Source: Company, HSIE Research, std - standalone Source: Companies, HSIE Research, for standalone operations
Share of voice (SoV, %) in West Bengal SoV in Telangana and Andhra Pradesh (%)
Source: Company, HSIE Research, std - standalone Source: Companies, HSIE Research
, -
APNT, 30
BRGR, 29
KNPL, 28
Others, 13 , -
APNT, 39
BRGR, 38
KNPL, 6
Others, 17
5.4 4.1 4.3 4.1 4.5 4.8
7.8
11.1
12.0
10.3
8.5 7.7
3.5
4.5
5.5
6.5
7.5
8.5
9.5
10.5
11.5
12.5
FY
15
FY
16
FY
17
FY
18
FY
19
FY
20
Asian Paints Berger Paints
Kansai Nerolac Akzo Nobel
-
1,000
2,000
3,000
4,000
5,000
6,000
7,000
8,000
9,000
Asian Paints Berger Paints Kansai
Nerolac
Akzo Nobel
FY11 FY12 FY13 FY14 FY15
FY16 FY17 FY18 FY19 FY20
Page | 5
Berger Paints: Initiating Coverage
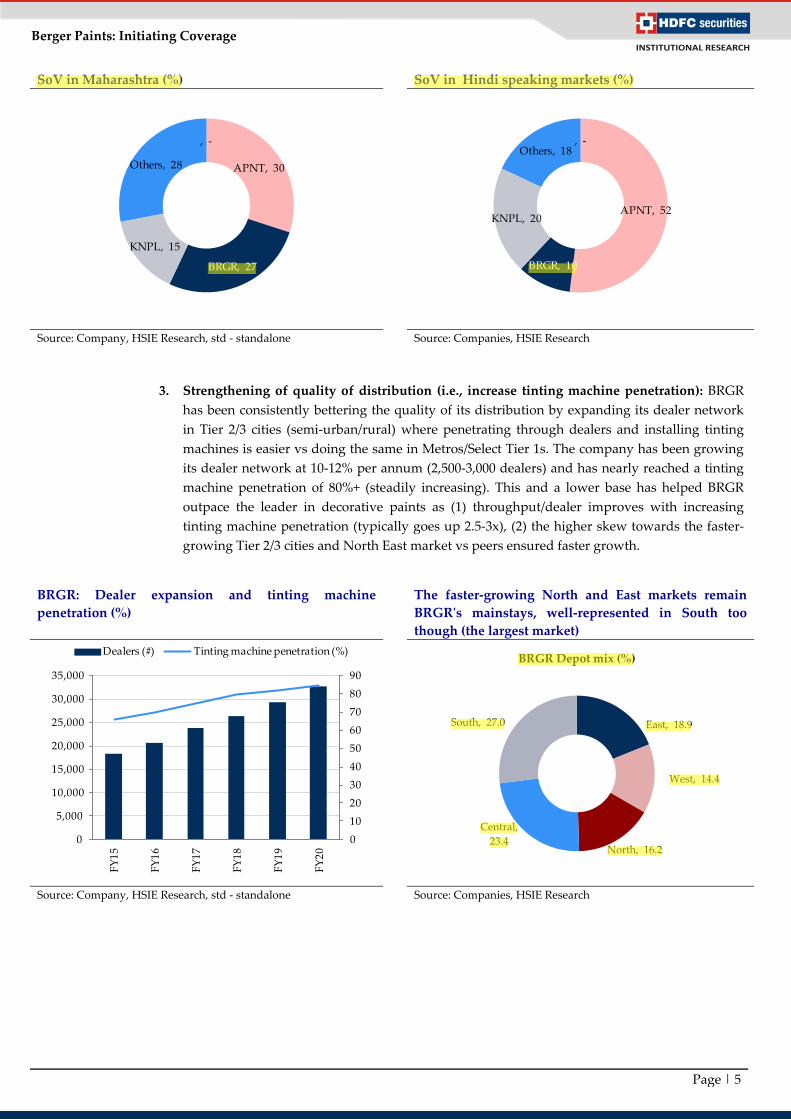
SoV in Maharashtra (%) SoV in Hindi speaking markets (%)
Source: Company, HSIE Research, std - standalone Source: Companies, HSIE Research
3. Strengthening of quality of distribution (i.e., increase tinting machine penetration): BRGR
has been consistently bettering the quality of its distribution by expanding its dealer network
in Tier 2/3 cities (semi-urban/rural) where penetrating through dealers and installing tinting
machines is easier vs doing the same in Metros/Select Tier 1s. The company has been growing
its dealer network at 10-12% per annum (2,500-3,000 dealers) and has nearly reached a tinting
machine penetration of 80%+ (steadily increasing). This and a lower base has helped BRGR
outpace the leader in decorative paints as (1) throughput/dealer improves with increasing
tinting machine penetration (typically goes up 2.5-3x), (2) the higher skew towards the faster-
growing Tier 2/3 cities and North East market vs peers ensured faster growth.
BRGR: Dealer expansion and tinting machine
penetration (%)
The faster-growing North and East markets remain
BRGR's mainstays, well-represented in South too
though (the largest market)
Source: Company, HSIE Research, std - standalone Source: Companies, HSIE Research
East, 18.9
West, 14.4
North, 16.2
Central,
23.4
South, 27.0
BRGR Depot mix (%)
, -
APNT, 30
BRGR, 27
KNPL, 15
Others, 28
, -
APNT, 52
BRGR, 10
KNPL, 20
Others, 18
0
10
20
30
40
50
60
70
80
90
0
5,000
10,000
15,000
20,000
25,000
30,000
35,000
FY
15
FY
16
FY
17
FY
18
FY
19
FY
20
Dealers (#) Tinting machine penetration (%)

Page | 6
Berger Paints: Initiating Coverage
Company-wise revenue per active dealer (Rs. mn) APNT's dealer multiple vs peers
Source: Companies, HSIE Research, NOTE: Revenue adjusted to
account for only decorative revenue. 90% of deco rev assigned to
active dealers
Source: Companies, HSIE Research, How to Read the chart: Eg:
APNT's dealer base has grown from 4.3x of Akzo Nobel in FY13 to
6.5x in FY20
2.9 2.9 2.9 3.0
2.9
1.8 1.8 1.9 2.0
1.8 1.5 1.5 1.5 1.5
1.3
-
0.5
1.0
1.5
2.0
2.5
3.0
3.5
FY16 FY17 FY18 FY19 FY20
Asian Paints Berger Paints Kansai Nerolac
2.0 2.0 1.9 1.9 1.9 2.0 2.0 2.1
2.4 2.4 2.3 2.4 2.5 2.5 2.5 2.5
4.3 4.2 4.0
4.4 4.6
5.2
5.8
6.5
1.5
2.5
3.5
4.5
5.5
6.5
FY13 FY14 FY15 FY16 FY17 FY18 FY19 FY20
Berger Paints Kansai Nerolac Akzo Nobel

Page | 7
Berger Paints: Initiating Coverage
...albeit, do not expect an encore
BRGR will have to contend with APNT's aggressive volume/low-end strategy
While BRGR has managed to outpace APNT in decorative paints, courtesy its
strengthening product portfolio, distribution quality and smart brand building over
14 out of the past 25 quarters, we do not expect the company's top-line
outperformance (divergence with APNT) to continue. APNT is likely to remain
aggressive on its volume strategy over FY20-23 by pushing low-end paint solutions
(low-end emulsions, distempers, primers, putty) as its predisposition would be to
increase its capacity utilisation and absorb as much production/other fixed costs as it
can. Note: APNT recently increased its capacity (over FY18-19) by >50%.
BRGR has outpaced APNT in 14 out of the past 25 quarters…we do not expect an encore
Source: Companies, HSIE Research, NOTE: Revenue adjusted to account for only decorative revenue. 90% of deco rev assigned to active dealers
GM's expansion likely to remain in check: BRGR significantly narrowed the GM
(from 856bp to 320bp) and EBITDAM gap (from 924bp to 560bp) with APNT over
the past decade, underpinned by (1) premiumisation/product innovation, (2)
smart brand-building exercises, (3) strengthening of the quality of distribution
(i.e., increase tinting machine penetration). However, at the margin, GM
expansion/mix improvement levers mostly seem missing as top players (incl.
BRGR) vie for demand (1) at the bottom-of-the-pyramid and sell low margin
products amidst the pandemic and beyond; (2) emanating from any down-
trading trends which play out due to stress on income levels during/in the
aftermath of the pandemic. While premiumisation may continue within the
portfolio, the momentum in lower-end paint solutions and down-trading is likely
to overshadow the positive impact of premiumisation, if any.
We build in a marginal 60bp GM improvement (42.1%) over FY20-23, primarily
stemming from benign RM prices. GM differential with APNT will continue to
gradually narrow though. Note GMs in FY20 improved by 250bp to 41.5%,
primarily led by (1) benign RM prices and (2) the increased skew of high-margin
decorative paints in revenue mix, (3) steady performance of subsidiaries which
typically enjoy higher GMs. Standalone GMs improved 270bp to 40.8% in FY20.
EBITDAM levers over FY20-23, too, remain modest: In FY20, higher cost of
operations negated most of the GM savings. LTL cost of operations increased
140bp to 25.8% (Pre-INDAS 116) as employee costs and SG&A expenses
remained elevated. We presume this might be due to unabsorbed costs of recent
capacities installed (Rishra, Jejuri – FY19). BRGR is likely to witness another
Capex round by FY22 (Sandila Plant – for decorative paints) as it spurs its
capacity to service the bottom of the pyramid. Related costs are likely to be better
absorbed over FY22-24. Hence, we build in a modest 60bp expansion largely
trickling down from GM savings.
(50)
(40)
(30)
(20)
(10)
-
10
20
30
40
1Q
FY
15
2Q
FY
15
3Q
FY
15
4Q
FY
15
1Q
FY
16
2Q
FY
16
3Q
FY
16
4Q
FY
16
1Q
FY
17
2Q
FY
17
3Q
FY
17
4Q
FY
17
1Q
FY
18
2Q
FY
18
3Q
FY
18
4Q
FY
18
1Q
FY
19
2Q
FY
19
3Q
FY
19
4Q
FY
19
1Q
FY
20
2Q
FY
20
3Q
FY
20
4Q
FY
20
1Q
FY
21
2Q
FY
21
3Q
FY
21
4Q
FY
21
BRGR (std) APNT (std)

Page | 8
Berger Paints: Initiating Coverage
Consistent improvement in pricing ladder, product
innovation, and premiumisation have helped BRGR
narrow down its GM differential with APNT…
…and it is ditto with EBITDAM differential (%)
Source: Companies, HSIE Research Source: Companies, HSIE Research
BRGR's manufacturing footprint
HOWRAH JEJURI
JAMMU ASSAM (NALBARI)*
SURAJPUR* PUDUCHERRY
HINDUPUR RISHRA
TALOJA HINDUPUR
SIKANDRABAD* ASSAM (NALTOLI)
GOA
Source: Companies, HSIE Research, * - manufacturing for British Paints Division
Company-wise estimated capacity (KL/pa) Estimated capacity utilisation (%)
Source: Companies, HSIE Research Source: Companies, HSIE Research
30.0
35.0
40.0
45.0
50.0
FY
08
FY
09
FY
10
FY
11
FY
12
FY
13
FY
14
FY
15
FY
16
FY
17
FY
18
FY
19
FY
20
APNT (std) BRGR (std)
KNPL (std) Azko Nobel
320bp
5
10
15
20
25
FY
08
FY
09
FY
10
FY
11
FY
12
FY
13
FY
14
FY
15
FY
16
FY
17
FY
18
FY
19
FY
20
APNT (std) BRGR (std) KNPL (std) Azko Nobel
560bp
0
200,000
400,000
600,000
800,000
1,000,000
1,200,000
1,400,000
1,600,000
1,800,000
2,000,000
FY17 FY18 FY19 FY20
APNT BRGR KNPL
-
10
20
30
40
50
60
70
80
90
FY17 FY18 FY19 FY20
APNT BRGR KNPL
Page | 9
Berger Paints: Initiating Coverage
Making inroads into promising niche segments
Berger has also been focusing on niche product segments in industrial paints
such as the fast-growing glass, wood and metal coatings play and in construction
chemicals too. While the contribution of India industrial paints' segment to sales
is ~20%, these niche segments serve a few purposes: (1) reduce the dependence
on the more cyclical Auto OEM segment, (2) offer better growth prospects,
superior margins vs Auto Industrials, (3) low competitive intensity to contend
with (at least in the near-to-medium term).
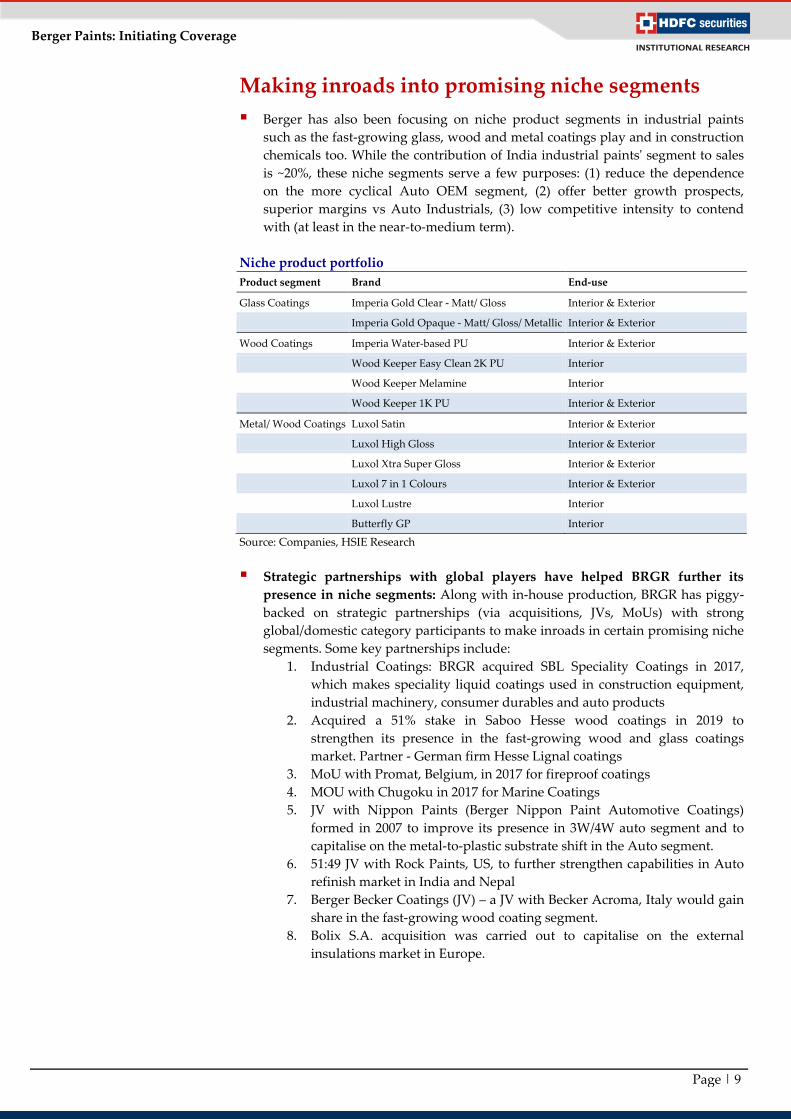
Niche product portfolio
Product segment Brand End-use
Glass Coatings Imperia Gold Clear - Matt/ Gloss Interior & Exterior
Imperia Gold Opaque - Matt/ Gloss/ Metallic Interior & Exterior
Wood Coatings Imperia Water-based PU Interior & Exterior
Wood Keeper Easy Clean 2K PU Interior
Wood Keeper Melamine Interior
Wood Keeper 1K PU Interior & Exterior
Metal/ Wood Coatings Luxol Satin Interior & Exterior
Luxol High Gloss Interior & Exterior
Luxol Xtra Super Gloss Interior & Exterior
Luxol 7 in 1 Colours Interior & Exterior
Luxol Lustre Interior
Butterfly GP Interior
Source: Companies, HSIE Research
Strategic partnerships with global players have helped BRGR further its
presence in niche segments: Along with in-house production, BRGR has piggy-
backed on strategic partnerships (via acquisitions, JVs, MoUs) with strong
global/domestic category participants to make inroads in certain promising niche
segments. Some key partnerships include:
1. Industrial Coatings: BRGR acquired SBL Speciality Coatings in 2017,
which makes speciality liquid coatings used in construction equipment,
industrial machinery, consumer durables and auto products
2. Acquired a 51% stake in Saboo Hesse wood coatings in 2019 to
strengthen its presence in the fast-growing wood and glass coatings
market. Partner - German firm Hesse Lignal coatings
3. MoU with Promat, Belgium, in 2017 for fireproof coatings
4. MOU with Chugoku in 2017 for Marine Coatings
5. JV with Nippon Paints (Berger Nippon Paint Automotive Coatings)
formed in 2007 to improve its presence in 3W/4W auto segment and to
capitalise on the metal-to-plastic substrate shift in the Auto segment.
6. 51:49 JV with Rock Paints, US, to further strengthen capabilities in Auto
refinish market in India and Nepal
7. Berger Becker Coatings (JV) – a JV with Becker Acroma, Italy would gain
share in the fast-growing wood coating segment.
8. Bolix S.A. acquisition was carried out to capitalise on the external
insulations market in Europe.

Page | 10
Berger Paints: Initiating Coverage
BRGR's inorganic journey
Partner Partnership Type Year Category serviced
STP Ltd Acquisition 2,020 Construction Chemicals
Rock Paints JV 2,018 Auto Refinish
Rock Paints MOUs 2,017 Auto Refinish
Promat MOUs 2,017 Fireproof
Chugoku MOUs 2,017 Marine Coatings
Saboo Coatings Acquisition 2,017 Industrial Coatings
Sherwin Williams (now Bepee Coatings) Acquisition 2,013 Decorative Coatings
Sherwin Williams MOUs 2,013 Wood Coatings
Bolix Acquisition 2,008 External insulation
Nippon JV 2,007 Automotive Paints
ICI Acquisition 2,006 Motor and Industry
Tigerwerke MOUs 2,004 Powder Coatings
Becker JV 1,997 Coil Coatings
Subsidiaries have inched up from 10% to 11.6% of sales, accounting for 8% of bottom-line of BRGR in FY20; the
profitability of key subsidiaries has improved as well
Rs. mn
Subsidiaries % stake
FY20 FY19 Growth (YoY, %) FY 20 Margin
(%) FY 19 Margin (%)
Revenue PBT PAT Revenue PBT PAT Revenue PBT PAT PBT PAT PBT PAT
BJN (Nepal) 100.0 2,145 577 485 1,972 535 403 8.8 8.0 20.2 26.9 22.6 27.1 20.5
Beepee Coatings 100.0 241 22 16 249 38 27 (3.0) (41.3) (41.8) 9.2 6.6 15.2 11.0
SBL Specialty
Coatings 100.0 1,053 213 157 1,063 132 93 (0.9) 61.0 68.8 20.2 14.9 12.4 8.8
Berger Paints
(Cyprus) 100.0 - (2) (2) - (2) (2)
(37.5) (37.5)
Lusako Trading
100.0 - (52) (52) - (38) (38)
37.2 37.2
Berger Paints Overseas 100.0 136 (52) (52) (98) (176) (176) (239.1) (70.7) (70.7) (37.9) (37.9) 180.0 180.0
Bolix S.A 100.0 2,573 207 174 2,479 105 88 3.8 98.3 98.6 8.1 6.8 4.2 3.5
Build Trade BIS 100.0 - (0) (0) - (0) (0)
- -
Bolix UKRAINA
OOO 100.0 31 6 6 27 4 4 15.9 64.9 64.9 19.4 19.4 13.7 13.7
Soltherm
External Insulations
100.0 254 4 3 224 4 2 13.6 19.4 64.7 1.7 1.1 1.6 0.8
Soltherm
Insolations
Thermique
Exterieure
SAS
100.0 24 1 1 16 0 0 53.5 100.0 100.0 3.3 2.5 2.5 1.9
Berger Hessee
Wood Coatings 51.0 97 (1) (1) 14 1 1 619.3 (230.0) (181.8) (1.3) (0.9) 7.4 8.1
Berger Rock
Paints 51.0 83 (35) (35) 15 (9) (9) 449.0 269.1 269.1 (41.9) (41.9) (62.3) (62.3)
STP
Ltd 95.5 778 34 15 - - -
4.3 1.9
Total
7,416 923 716 5,959 592 393 24.4 55.9 82.3 12.5 9.7 9.9 6.6
Joint Ventures % stake Revenue (Rs. mn) PAT (Rs. mn) Attributable PAT (Rs. mn)
Berger Becker Coatings 49.0 3,651 117 58
Berger Nippon Paint Automotive Coatings 49.0 1,566 (141) (69)
Surefire Management Services 75.0
2 2
Total
5,217 (21) (10)

Page | 11
Berger Paints: Initiating Coverage
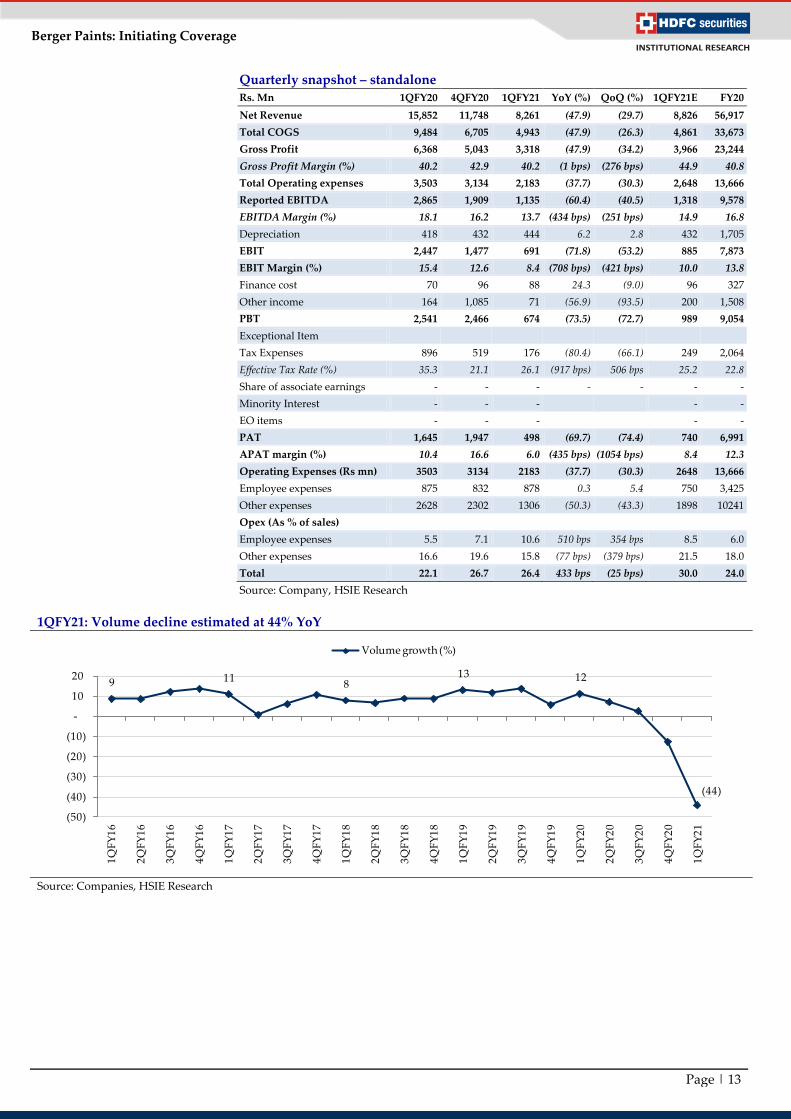
1QFY21: Relatively weak, GMs disappoint
Delivered a relatively weaker sales print: BRGR's 1QFY21 top-line declined
47.9% YoY (vs APNT's 44.1%) - a bit of a surprise, given (1) BRGR's lower
exposure to severely impacted metros/select Tier 1s) vs APNT, (2) lower base
(APNT does 3x the business). We reckon the sequential recovery trend would
have largely mimicked that of APNT (May/June APNT's volume growth trends
(80% of base/~14% YoY respectively), implying that the Paints category, counter-
intuitively, is showing spurts of recovery faster than other consumer
discretionary categories. Standalone volume decline is estimated at 44-45%.
While the recovery is encouraging, we remain circumspect of the real progression
in volume recovery as the May/June recovery is mostly a function of (1) pent-up
demand and (2) incentivised channel up-stocking.
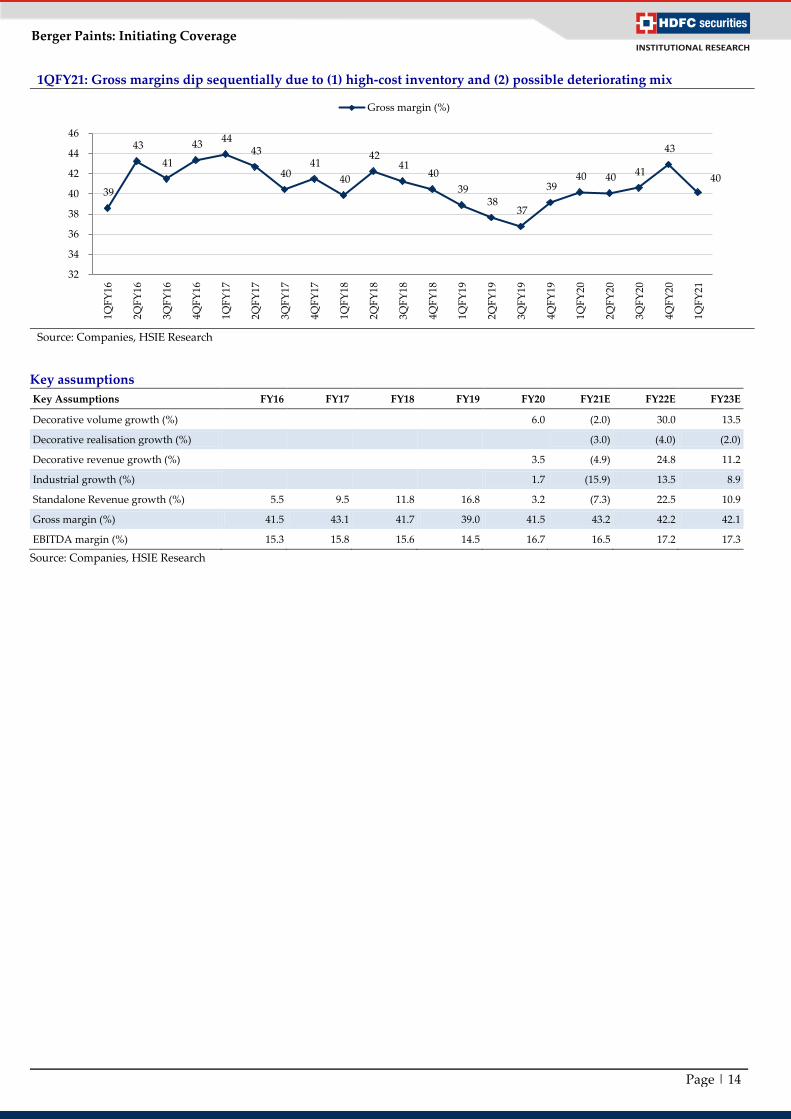
GMs were the bigger disappointment: BRGR's (standalone) GMs for 1Q
remained flat YoY/declined 276bp QoQ to 40.2% despite a benign RM
environment (crude is down 18-20%). Relatively too, BRGR lagged both APNT
(GMs expanded 154bp YoY/contracted 65bp QoQ) and KNPL GMs expanded
340/317bp YoY/QoQ respectively). One would have hoped BRGR would do
better in 1Q at least to the extent of the Decorative skew increasing in the mix (as
the decline in Industrial revenue is likely to have been steeper). Reasons
attributed to the GM disappointment was high-cost inventory consumption in
the ecosystem. However, we suspect such a divergence in BRGR's performance
with the #1/#3 players hints at some significant deterioration in the mix.
Subsidiaries stitched a better show: Subsidiaries clocked a relatively better
quarter. We suspect the STP acquisition (Oct-19) might have aided top-line
performance. The laggards in the portfolio were BJN Nepal as Nepal only had 10
working days in 1Q. BRGR's Polish subsidiary Bolix showed improvement both
in top-line as well as profitability as external insulation's (key product)
application on building sites entails less involvement with the end consumer, and
perceived to be safer than an interior paint job, hence was allowed during the
pandemic. EBITDA losses for subsidiaries stood at Rs. 214mn.
Cost Overheads shaved off by 37%: BRGR did an impressive job of cutting
down its op costs by 37% in 1Q to salvage profitability to the extent it could for
its standalone operations. SG&A expenses (standalone) halved in 1Q. On a
consolidated basis, opex costs declined 27% YoY vs a 47% decline in revenue;
hence, sub-par scale-led deleverage hit profitability. EBITDAM contracted
434/788bp YoY to 13.7%/7.8% for standalone/consolidated operations
respectively.
Other key takeaways:
1. Benign RM cost benefits are likely to be seen 2Q onwards, as (1) high-cost
inventory in the channel has normalised and (2) formulation-led RM savings
kick in. Management indicated that it has managed to re-negotiate better
deals with vendors for key RM.
2. Lower end paint products such as putty, primers, distempers and low-end
emulsions outpaced higher-end paint solutions this quarter. Justifiably so, as
the impact of the pandemic has been relatively less severe in Tier 2-4 markets
where low-end products sell more. Management did not discount the
possibility of down-trading in FY21, courtesy pandemic-led impact on
income levels.

Page | 12
Berger Paints: Initiating Coverage
3. Discounting and rebates to channel remained elevated as more solvent-based
products pushed in 1Q. Price decreases in the last 10 months preceding
COVID19 is ~2%
4. Like in 1Q, management indicated that they do not expect pricing
interventions by the industry anytime soon.
5. Protective coatings typically account for 9-9.5% of revenue and Powder
Coatings is a little less than 2%
6. Within the industrial segment, Auto continues to remain under severe
pressure; however, Protective coatings (9-9.5% of sales) and powder coatings
(~2% of sales) witnessed good recovery.
7. Dealer growth in FY20 was ~12.5%. However, in 1Q, BRGR, justifiably so
could only add dealers for 1.5/3 months. Run-rate is likely to progressively
normalize by end FY21.
Quarterly snapshot – consolidated
Rs. Mn 1QFY20 4QFY20 1QFY21 YoY (%) QoQ (%) 1QFY21 FY20 FY21
Net Revenue 17,165 13,548 9,308 (45.8) (31.3) 10,205 63,658 58,853
Total COGS 10,154 7,639 5,495 (45.9) (28.1) 5,619 37,258 33,441
Gross Profit 7,011 5,910 3,812 (45.6) (35.5) 4,586 26,400 25,412
Gross Profit Margin (%) 40.8 43.6 41.0 11 bps (266 bps) 44.9 41.5 43.2
Total Operating expenses 3,960 3,825 2,892 (27.0) (24.4) 3,258 15,790 15,714
Reported EBITDA 3,052 2,084 921 (69.8) (55.8) 1,328 10,610 9,698
EBITDA Margin (%) 17.8 15.4 9.9 (788 bps) (549 bps) 13.0 16.7 16.5
Depreciation 462 493 504 9.0 2.1 492 1,910 2,132
EBIT 2,590 1,591 417 (83.9) (73.8) 836 8,700 7,567
EBIT Margin (%) 15.1 11.7 4.5 (1060 bps) (726 bps) 8.2 13.7 12.9
Finance cost 99 141 124 24.6 (11.9) 141 470 566
Other income 219 167 78 (64.2) (53.0) 225 685 731
PBT 2,709 1,617 372 (86.3) (77.0) 920 8,915 7,732
Exceptional Item
Tax Expenses 944 560 176 (81.3) (68.6) 252 2,271 1,946
Effective Tax Rate (%) 34.8 34.7 47.4 1253 bps 1272 bps 27.4 25.5 25.2
Share of associate earnings (1) (25) (45) 3,625.0 81.0 (25) (83) (50)
Minority Interest - - -
- - -
EO items - - -
- - -
PAT 1,764 1,032 151 (91.4) (85.4) 643 6,561 5,736
APAT margin (%) 10.3 7.6 1.6 (866 bps) (599 bps) 6.3 10.3 9.7
Operating Expenses (Rs mn) 3960 3825 2892 (27.0) (24.4) 3258 15790 15714
Employee expenses 1117 1237 1162 4.1 (6.0) 1080 4525 4826
Other expenses 2843 2589 1729 (39.2) (33.2) 2178 11265 10888
Source: Company, HSIE Research
Page | 13
Berger Paints: Initiating Coverage
Quarterly snapshot – standalone
Rs. Mn 1QFY20 4QFY20 1QFY21 YoY (%) QoQ (%) 1QFY21E FY20
Net Revenue 15,852 11,748 8,261 (47.9) (29.7) 8,826 56,917
Total COGS 9,484 6,705 4,943 (47.9) (26.3) 4,861 33,673
Gross Profit 6,368 5,043 3,318 (47.9) (34.2) 3,966 23,244
Gross Profit Margin (%) 40.2 42.9 40.2 (1 bps) (276 bps) 44.9 40.8
Total Operating expenses 3,503 3,134 2,183 (37.7) (30.3) 2,648 13,666
Reported EBITDA 2,865 1,909 1,135 (60.4) (40.5) 1,318 9,578
EBITDA Margin (%) 18.1 16.2 13.7 (434 bps) (251 bps) 14.9 16.8
Depreciation 418 432 444 6.2 2.8 432 1,705
EBIT 2,447 1,477 691 (71.8) (53.2) 885 7,873
EBIT Margin (%) 15.4 12.6 8.4 (708 bps) (421 bps) 10.0 13.8
Finance cost 70 96 88 24.3 (9.0) 96 327
Other income 164 1,085 71 (56.9) (93.5) 200 1,508
PBT 2,541 2,466 674 (73.5) (72.7) 989 9,054
Exceptional Item
Tax Expenses 896 519 176 (80.4) (66.1) 249 2,064
Effective Tax Rate (%) 35.3 21.1 26.1 (917 bps) 506 bps 25.2 22.8
Share of associate earnings - - - - - - -
Minority Interest - - -
- -
EO items - - -
- -
PAT 1,645 1,947 498 (69.7) (74.4) 740 6,991
APAT margin (%) 10.4 16.6 6.0 (435 bps) (1054 bps) 8.4 12.3
Operating Expenses (Rs mn) 3503 3134 2183 (37.7) (30.3) 2648 13,666
Employee expenses 875 832 878 0.3 5.4 750 3,425
Other expenses 2628 2302 1306 (50.3) (43.3) 1898 10241
Opex (As % of sales)
Employee expenses 5.5 7.1 10.6 510 bps 354 bps 8.5 6.0
Other expenses 16.6 19.6 15.8 (77 bps) (379 bps) 21.5 18.0
Total 22.1 26.7 26.4 433 bps (25 bps) 30.0 24.0
Source: Company, HSIE Research
1QFY21: Volume decline estimated at 44% YoY
Source: Companies, HSIE Research
9 11 8
13 12
(44)
(50)
(40)
(30)
(20)
(10)
-
10
20
1Q
FY
16
2Q
FY
16
3Q
FY
16
4Q
FY
16
1Q
FY
17
2Q
FY
17
3Q
FY
17
4Q
FY
17
1Q
FY
18
2Q
FY
18
3Q
FY
18
4Q
FY
18
1Q
FY
19
2Q
FY
19
3Q
FY
19
4Q
FY
19
1Q
FY
20
2Q
FY
20
3Q
FY
20
4Q
FY
20
1Q
FY
21
Volume growth (%)
Page | 14
Berger Paints: Initiating Coverage
1QFY21: Gross margins dip sequentially due to (1) high-cost inventory and (2) possible deteriorating mix
Source: Companies, HSIE Research
Key assumptions
Key Assumptions FY16 FY17 FY18 FY19 FY20 FY21E FY22E FY23E
Decorative volume growth (%)
6.0 (2.0) 30.0 13.5
Decorative realisation growth (%)
(3.0) (4.0) (2.0)
Decorative revenue growth (%)
3.5 (4.9) 24.8 11.2
Industrial growth (%)
1.7 (15.9) 13.5 8.9
Standalone Revenue growth (%) 5.5 9.5 11.8 16.8 3.2 (7.3) 22.5 10.9
Gross margin (%) 41.5 43.1 41.7 39.0 41.5 43.2 42.2 42.1
EBITDA margin (%) 15.3 15.8 15.6 14.5 16.7 16.5 17.2 17.3
Source: Companies, HSIE Research
39
43
41
43 44
43
40 41
40
42 41
40
39 38
37
39 40 40 41
43
40
32
34
36
38
40
42
44
46
1QF
Y16
2QF
Y16
3QF
Y16
4QF
Y16
1QF
Y17
2QF
Y17
3QF
Y17
4QF
Y17
1QF
Y18
2QF
Y18
3QF
Y18
4QF
Y18
1QF
Y19
2QF
Y19
3QF
Y19
4QF
Y19
1QF
Y20
2QF
Y20
3QF
Y20
4QF
Y20
1QF
Y21
Gross margin (%)
Page | 15
Berger Paints: Initiating Coverage
Financial analysis
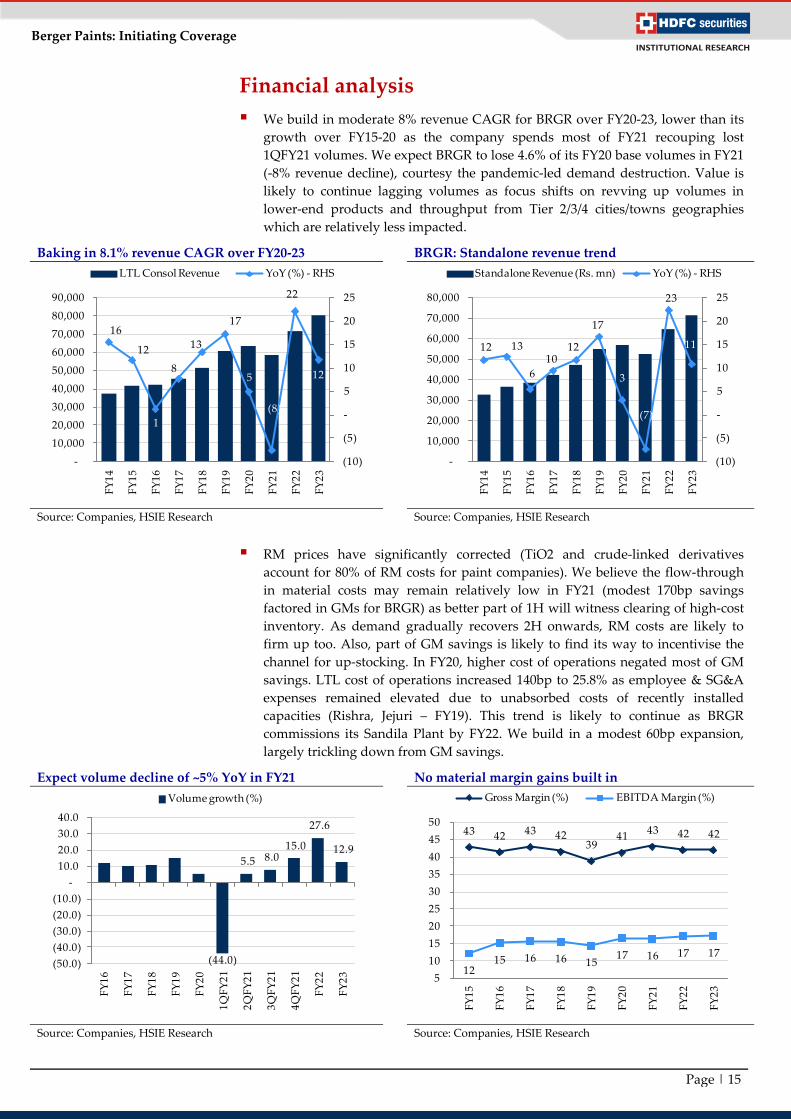
We build in moderate 8% revenue CAGR for BRGR over FY20-23, lower than its
growth over FY15-20 as the company spends most of FY21 recouping lost
1QFY21 volumes. We expect BRGR to lose 4.6% of its FY20 base volumes in FY21
(-8% revenue decline), courtesy the pandemic-led demand destruction. Value is
likely to continue lagging volumes as focus shifts on revving up volumes in
lower-end products and throughput from Tier 2/3/4 cities/towns geographies
which are relatively less impacted.
Baking in 8.1% revenue CAGR over FY20-23 BRGR: Standalone revenue trend
Source: Companies, HSIE Research Source: Companies, HSIE Research
RM prices have significantly corrected (TiO2 and crude-linked derivatives
account for 80% of RM costs for paint companies). We believe the flow-through
in material costs may remain relatively low in FY21 (modest 170bp savings
factored in GMs for BRGR) as better part of 1H will witness clearing of high-cost
inventory. As demand gradually recovers 2H onwards, RM costs are likely to
firm up too. Also, part of GM savings is likely to find its way to incentivise the
channel for up-stocking. In FY20, higher cost of operations negated most of GM
savings. LTL cost of operations increased 140bp to 25.8% as employee & SG&A
expenses remained elevated due to unabsorbed costs of recently installed
capacities (Rishra, Jejuri – FY19). This trend is likely to continue as BRGR
commissions its Sandila Plant by FY22. We build in a modest 60bp expansion,
largely trickling down from GM savings.
Expect volume decline of ~5% YoY in FY21 No material margin gains built in
Source: Companies, HSIE Research Source: Companies, HSIE Research
16
12
1
8
13
17
5
(8)
22
12
(10)
(5)
-
5
10
15
20
25
-
10,000
20,000
30,000
40,000
50,000
60,000
70,000
80,000
90,000
FY
14
FY
15
FY
16
FY
17
FY
18
FY
19
FY
20
FY
21
FY
22
FY
23
LTL Consol Revenue YoY (%) - RHS
12 13
6
10 12
17
3
(7)
23
11
(10)
(5)
-
5
10
15
20
25
-
10,000
20,000
30,000
40,000
50,000
60,000
70,000
80,000
FY
14
FY
15
FY
16
FY
17
FY
18
FY
19
FY
20
FY
21
FY
22
FY
23
Standalone Revenue (Rs. mn) YoY (%) - RHS
(44.0)
5.5 8.0 15.0
27.6
12.9
(50.0)
(40.0)
(30.0)
(20.0)
(10.0)
-
10.0
20.0
30.0
40.0
FY
16
FY
17
FY
18
FY
19
FY
20
1Q
FY
21
2Q
FY
21
3Q
FY
21
4Q
FY
21
FY
22
FY
23
Volume growth (%)
43 42 43 42 39
41 43 42 42
12 15 16 16 15
17 16 17 17
5
10
15
20
25
30
35
40
45
50
FY
15
FY
16
FY
17
FY
18
FY
19
FY
20
FY
21
FY
22
FY
23
Gross Margin (%) EBITDA Margin (%)
Page | 16
Berger Paints: Initiating Coverage
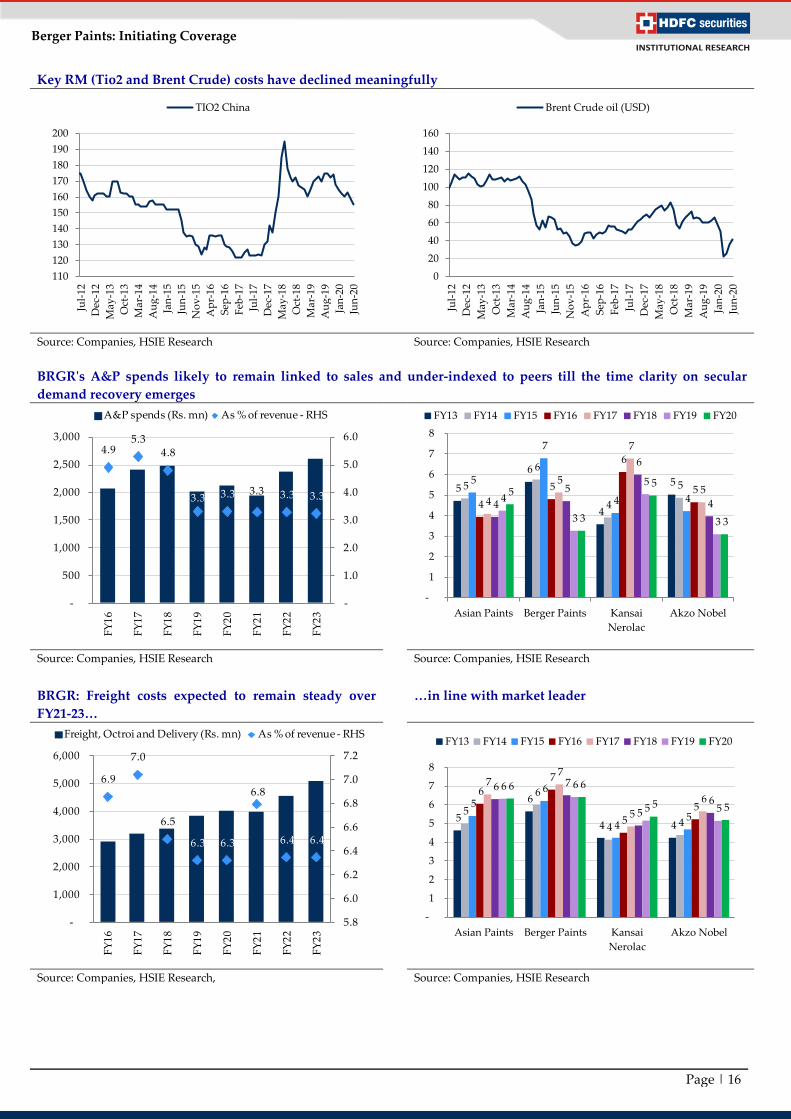
Key RM (Tio2 and Brent Crude) costs have declined meaningfully
Source: Companies, HSIE Research Source: Companies, HSIE Research
BRGR's A&P spends likely to remain linked to sales and under-indexed to peers till the time clarity on secular
demand recovery emerges
Source: Companies, HSIE Research Source: Companies, HSIE Research
BRGR: Freight costs expected to remain steady over
FY21-23…
…in line with market leader
Source: Companies, HSIE Research, Source: Companies, HSIE Research
110
120
130
140
150
160
170
180
190
200
Jul-
12
Dec
-12
May
-13
Oct
-13
Mar
-14
Au
g-1
4
Jan
-15
Jun
-15
No
v-1
5
Ap
r-16
Sep
-16
Feb
-17
Jul-
17
Dec
-17
May
-18
Oct
-18
Mar
-19
Au
g-1
9
Jan
-20
Jun
-20
TIO2 China
0
20
40
60
80
100
120
140
160
Jul-
12
Dec
-12
May
-13
Oct
-13
Mar
-14
Au
g-1
4
Jan
-15
Jun
-15
No
v-1
5
Ap
r-16
Sep
-16
Feb
-17
Jul-
17
Dec
-17
May
-18
Oct
-18
Mar
-19
Au
g-1
9
Jan
-20
Jun
-20
Brent Crude oil (USD)
5
6
4
5 5
6
4
5 5
7
4 4 4
5
6
5 4
5
7
5
4
5
6
4 4
3
5
3
5
3
5
3
-
1
2
3
4
5
6
7
8
Asian Paints Berger Paints Kansai
Nerolac
Akzo Nobel
FY13 FY14 FY15 FY16 FY17 FY18 FY19 FY20
5
6
4 4
5
6
4 4
5
6
4 5
6
7
5 5
7 7
5
6 6 7
5 6
6 6
5 5
6 6
5 5
-
1
2
3
4
5
6
7
8
Asian Paints Berger Paints Kansai
Nerolac
Akzo Nobel
FY13 FY14 FY15 FY16 FY17 FY18 FY19 FY20
4.9 5.3
4.8
3.3 3.3 3.3 3.3 3.3
-
1.0
2.0
3.0
4.0
5.0
6.0
-
500
1,000
1,500
2,000
2,500
3,000
FY
16
FY
17
FY
18
FY
19
FY
20
FY
21
FY
22
FY
23
A&P spends (Rs. mn) As % of revenue - RHS
6.9
7.0
6.5
6.3 6.3
6.8
6.4 6.4
5.8
6.0
6.2
6.4
6.6
6.8
7.0
7.2
-
1,000
2,000
3,000
4,000
5,000
6,000
FY
16
FY
17
FY
18
FY
19
FY
20
FY
21
FY
22
FY
23
Freight, Octroi and Delivery (Rs. mn) As % of revenue - RHS
Page | 17
Berger Paints: Initiating Coverage
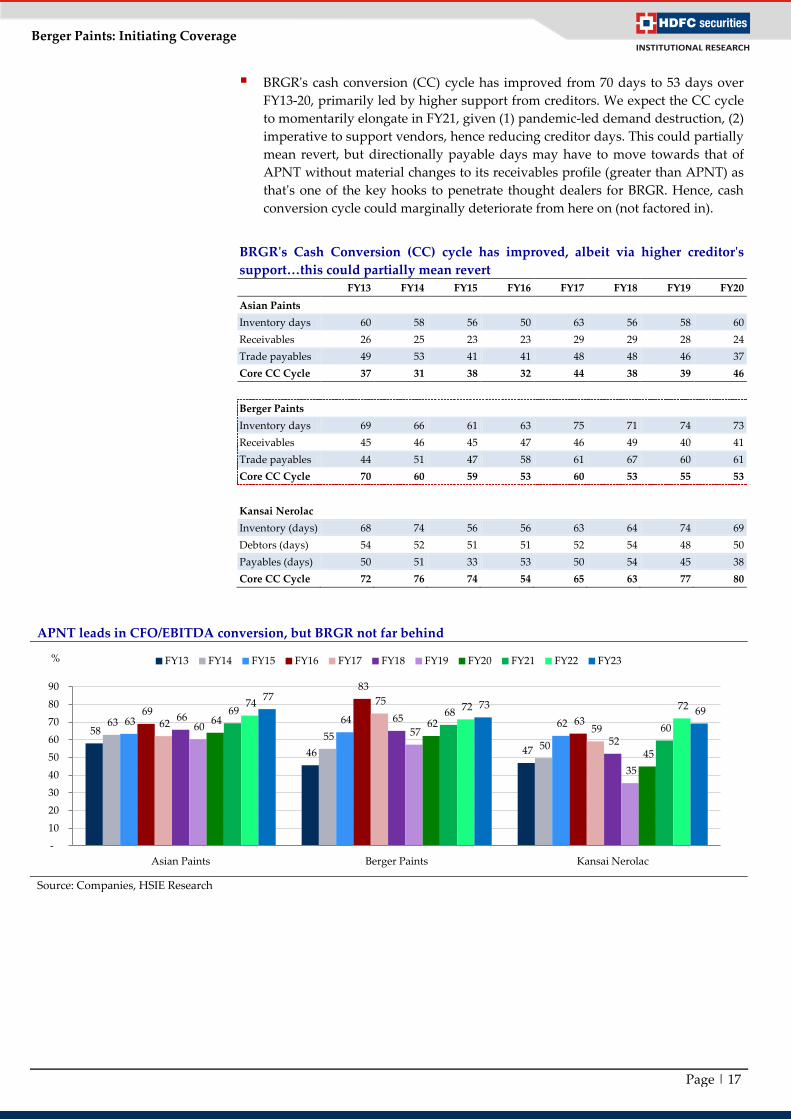
BRGR's cash conversion (CC) cycle has improved from 70 days to 53 days over
FY13-20, primarily led by higher support from creditors. We expect the CC cycle
to momentarily elongate in FY21, given (1) pandemic-led demand destruction, (2)
imperative to support vendors, hence reducing creditor days. This could partially
mean revert, but directionally payable days may have to move towards that of
APNT without material changes to its receivables profile (greater than APNT) as
that's one of the key hooks to penetrate thought dealers for BRGR. Hence, cash
conversion cycle could marginally deteriorate from here on (not factored in).
BRGR's Cash Conversion (CC) cycle has improved, albeit via higher creditor's
support…this could partially mean revert
FY13 FY14 FY15 FY16 FY17 FY18 FY19 FY20
Asian Paints
Inventory days 60 58 56 50 63 56 58 60
Receivables 26 25 23 23 29 29 28 24
Trade payables 49 53 41 41 48 48 46 37
Core CC Cycle 37 31 38 32 44 38 39 46
Berger Paints
Inventory days 69 66 61 63 75 71 74 73
Receivables 45 46 45 47 46 49 40 41
Trade payables 44 51 47 58 61 67 60 61
Core CC Cycle 70 60 59 53 60 53 55 53
Kansai Nerolac
Inventory (days) 68 74 56 56 63 64 74 69
Debtors (days) 54 52 51 51 52 54 48 50
Payables (days) 50 51 33 53 50 54 45 38
Core CC Cycle 72 76 74 54 65 63 77 80
APNT leads in CFO/EBITDA conversion, but BRGR not far behind
Source: Companies, HSIE Research
58
46 47
63
55 50
63 64 62 69
83
63 62
75
59 66 65
52
60 57
35
64 62
45
69 68
60
74 72 72 77
73 69
-
10
20
30
40
50
60
70
80
90
Asian Paints Berger Paints Kansai Nerolac
FY13 FY14 FY15 FY16 FY17 FY18 FY19 FY20 FY21 FY22 FY23 %

Page | 18
Berger Paints: Initiating Coverage
Capex intensity likely to be high given the capacity
addition imperative
Return profile to decline in the pandemic-stricken
FY21…expect a V-shaped recovery over FY20-23E
Source: Companies, HSIE Research Source: Companies, HSIE Research
BRGR's capital allocation over the years
Sources of funds (Rs bn) FY15 FY16 FY17 FY18 FY19 FY20 FY21E FY22E FY23E
Cash from Operations (excl WC change) 4,023 4,807 5,220 5,499 6,542 8,245 7,658 9,737 10,915
Other Income - - - - - - - - -
Total 4,023 4,807 5,220 5,499 6,542 8,245 7,658 9,737 10,915
Application of funds (Rs bn)
Working Capital (115) (1,138) 1,275 1,280 925 999 602 630 921
Capex 1,602 1,233 2,757 2,878 3,166 4,310 1,317 5,844 3,189
Investments 381 1,477 374 (1,622) 434 (886) - - -
Dividend 1,383 1,085 1,169 2,045 2,105 3,816 2,225 2,225 2,225
Borrowings 149 2,319 (507) (290) (619) (1,014) - - -
Others 303 155 116 824 795 801 (215) (334) (585)
Net change in cash 320 (323) 36 384 (265) 219 3,730 1,373 5,165
Total 4,023 4,807 5,220 5,499 6,542 8,245 7,658 9,737 10,915
3-yr rolling WC + Capex as % of
sources of funds 78 35 40 53 71 67 50 53 44
Source: Companies, HSIE Research
5.5
4.5 4.1 4.1
3.4 2.9 2.8 2.8
-
1.0
2.0
3.0
4.0
5.0
6.0
-
1,000
2,000
3,000
4,000
5,000
6,000
7,000
FY
16
FY
17
FY
18
FY
19
FY
20
FY
21
FY
22
FY
23
Capex (Rs. mn) Asset turnover (x) - Gross Rev/GFA - RHS
19
.7
18
.9
18
.6
17
.9
21
.0
17
.6 21
.5
22
.1
-
5.0
10.0
15.0
20.0
25.0
30.0
FY
16
FY
17
FY
18
FY
19
FY
20
FY
21
E
FY
22
E
FY
23
E
RoE (%) RoCE (%) RoIC (%)
Page | 19
Berger Paints: Initiating Coverage
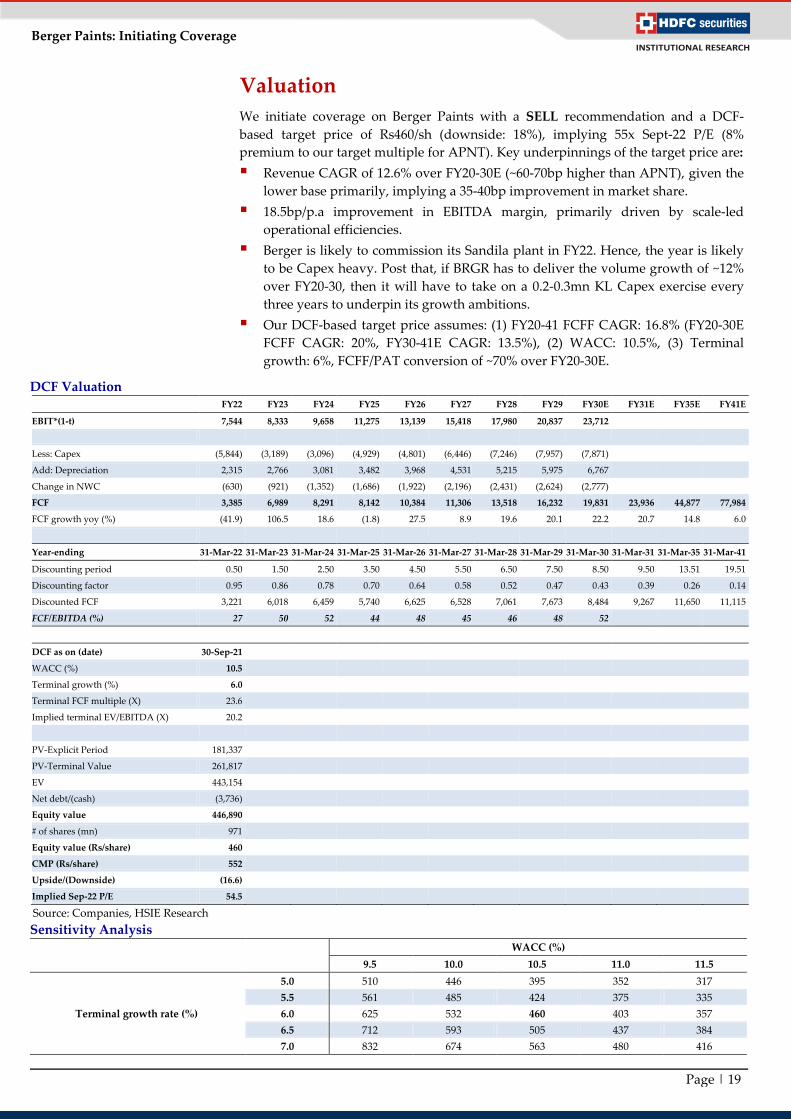
Valuation
We initiate coverage on Berger Paints with a SELL recommendation and a DCF-
based target price of Rs460/sh (downside: 18%), implying 55x Sept-22 P/E (8%
premium to our target multiple for APNT). Key underpinnings of the target price are:
Revenue CAGR of 12.6% over FY20-30E (~60-70bp higher than APNT), given the
lower base primarily, implying a 35-40bp improvement in market share.
18.5bp/p.a improvement in EBITDA margin, primarily driven by scale-led
operational efficiencies.
Berger is likely to commission its Sandila plant in FY22. Hence, the year is likely
to be Capex heavy. Post that, if BRGR has to deliver the volume growth of ~12%
over FY20-30, then it will have to take on a 0.2-0.3mn KL Capex exercise every
three years to underpin its growth ambitions.
Our DCF-based target price assumes: (1) FY20-41 FCFF CAGR: 16.8% (FY20-30E
FCFF CAGR: 20%, FY30-41E CAGR: 13.5%), (2) WACC: 10.5%, (3) Terminal
growth: 6%, FCFF/PAT conversion of ~70% over FY20-30E.
DCF Valuation FY22 FY23 FY24 FY25 FY26 FY27 FY28 FY29 FY30E FY31E FY35E FY41E
EBIT*(1-t) 7,544 8,333 9,658 11,275 13,139 15,418 17,980 20,837 23,712
Less: Capex (5,844) (3,189) (3,096) (4,929) (4,801) (6,446) (7,246) (7,957) (7,871)
Add: Depreciation 2,315 2,766 3,081 3,482 3,968 4,531 5,215 5,975 6,767
Change in NWC (630) (921) (1,352) (1,686) (1,922) (2,196) (2,431) (2,624) (2,777)
FCF 3,385 6,989 8,291 8,142 10,384 11,306 13,518 16,232 19,831 23,936 44,877 77,984
FCF growth yoy (%) (41.9) 106.5 18.6 (1.8) 27.5 8.9 19.6 20.1 22.2 20.7 14.8 6.0
Year-ending 31-Mar-22 31-Mar-23 31-Mar-24 31-Mar-25 31-Mar-26 31-Mar-27 31-Mar-28 31-Mar-29 31-Mar-30 31-Mar-31 31-Mar-35 31-Mar-41
Discounting period 0.50 1.50 2.50 3.50 4.50 5.50 6.50 7.50 8.50 9.50 13.51 19.51
Discounting factor 0.95 0.86 0.78 0.70 0.64 0.58 0.52 0.47 0.43 0.39 0.26 0.14
Discounted FCF 3,221 6,018 6,459 5,740 6,625 6,528 7,061 7,673 8,484 9,267 11,650 11,115
FCF/EBITDA (%) 27 50 52 44 48 45 46 48 52
DCF as on (date) 30-Sep-21
WACC (%) 10.5
Terminal growth (%) 6.0
Terminal FCF multiple (X) 23.6
Implied terminal EV/EBITDA (X) 20.2
PV-Explicit Period 181,337
PV-Terminal Value 261,817
EV 443,154
Net debt/(cash) (3,736)
Equity value 446,890
# of shares (mn) 971
Equity value (Rs/share) 460
CMP (Rs/share) 552
Upside/(Downside) (16.6)
Implied Sep-22 P/E 54.5
Source: Companies, HSIE Research
Sensitivity Analysis
WACC (%)
9.5 10.0 10.5 11.0 11.5
Terminal growth rate (%)
5.0 510 446 395 352 317
5.5 561 485 424 375 335
6.0 625 532 460 403 357
6.5 712 593 505 437 384
7.0 832 674 563 480 416

Page | 20
Berger Paints: Initiating Coverage
Company profile
With modest beginnings in India in 1923, today, Berger Paints India Limited is the
second-largest paint company in the country with a consistent track record of being
one of the fastest-growing, quarter on quarter, for the past few years. It has a
presence in decorative paints, industrial coatings, and construction chemicals
(primarily waterproofing). Berger Paints India is headquartered in Kolkata, with 16
strategically located manufacturing units across India (including subsidiaries), two in
Nepal, one each in Poland and Russia and about 162 stock points. The company also
has an international presence in four countries: Nepal, Bangladesh, Poland, and
Russia. It has 610,000 MT capacity. Berger has the second-largest distribution
network with ~27,000 dealers and a tinting machine penetration of ~80%.
The decorative segment makes up nearly 75%+ of Berger's revenue. Traditionally
having a strong foothold in the economy segment, over the past few years, Berger has
gained market share in the premium segment. Through strategic tie-ups/JVs with
global firms, the company has tried to strengthen capabilities in niche areas such as
auto refinishes and glass, wood, marine and fireproof coatings. In the Auto segment
(2W, 3W, CVs), its key customers include Hero, Royal Enfield, Yamaha, TVS, Honda,
Bajaj, Tata Motors, and Ashok Leyland.
The Dhingra family, promoters of Berger Paints, has been in the paints business for
four generations. The family acquired the controlling stake of the company from Mr
Vijay Mallya in 1991. The promoter family continues to have executive powers but is
not involved in day-to-day operations. The company is run by professionals.
Key Personnel
Name Designation Description
Mr. Kuldip Singh Dhingra Chairman
Mr Dhingra is the Chairman of the Board of Directors. He has been a Director of the
company since 1991. He is a Science Graduate from Hindu College, Delhi University.
He is the promoter of the company and an industrialist with a long-standing
experience in paints and related industries. He is the fourth generation of his family
that has been continuously in the paints business since 1898.
Mr. Gurbachan Singh
Dhingra Vice-Chairman
Mr Dhingra is the Vice-Chairman of the Board of Directors. He has been a Director of
the company since 1993. He is a graduate, an industrialist, the promoter and has
considerable experience in the paint industry, especially in its technical aspects. He is
the fourth generation of his family, which has been continuously in the paints business
since 1898.
Mr. Abhijit Roy MD & CEO
Mr Roy graduated in Mechanical Engineering from Jadavpur University, Kolkata and
completed his post-graduation in Business Administration from the Indian Institute of
Management, Bangalore. He started his career with Asian Paints Limited and before
joining Berger was associated with L'Oreal. He was appointed as the Managing
Director & CEO with effect from 1st July 2012.
Mr. Srijit Dasgupta CFO
Mr Dasgupta is a B.Sc (Hons) from Calcutta University, AICWA from Institute of Cost
& Works Accountants of India & Company Secretary from Institute of Company
Secretaries of India having over 29 years of work experience. He started his career with
Machinery Manufacturers Corporation Limited and before joining Berger was
associated with the same organisation.
Mr. Arunito Ganguly
Vice President &
Company
Secretary
Mr Ganguly is a B.Com (Hons.) from St. Xaviers College Kolkata. He is a fellow
Member of the Institute of Company Secretaries of India and has passed LL.B. from the
University of Burdwan. He has 16 years' experience in handling secretarial and legal
matters, including 14 years' experience as Company Secretary/Deputy Company
Secretary in large listed companies.
Source: Company, HSIE Research

Page | 21
Berger Paints: Initiating Coverage
Key Risks
Name Description
Correlation of sales with the
economy
While the three top paint companies have shown resilience in terms
of volume growth over the past few quarters even during the extant
economic slowdown, the sustenance of the slowdown could pose a
downside risk to our estimates.
The sharp rise in input costs
There are several raw materials which are directly driven by crude
oil. Approximately 70% of the input costs can be accounted for by
crude derivations. The remaining ~30% of the input costs arise from
non-crude (TiO2) forms. Therefore, any sharp increase in input costs
could adversely impact the business
Finance risks originating out of
currency fluctuations
The USD-INR exchange is an important component of the input
costs. Hence, a depreciation of INR vis-à-vis the USD could affect
the company's bottom line directly by way of gross margins.
Disruption in the supply chain
In a year of high uncertainty in the macro-environment and
geopolitical scenarios, disruptions in the supply chain are an
important risk to monitor. The unavailability of raw materials could
impact the estimates negatively.
Source: Company, HSIE Research

Page | 22
Berger Paints: Initiating Coverage
Financials Income Statement Year End (March) FY16 FY17 FY18 FY19 FY20P FY21E FY22E FY23E
Net Revenues 42,231 45,523 51,657 60,619 63,658 58,853 71,948 80,458
Growth (%) (2.3) 7.8 13.5 17.3 5.0 (7.5) 22.3 11.8
COGS 24,702 25,923 30,100 36,996 37,258 33,441 41,601 46,602
Employee Expense 2,735 3,067 3,566 4,085 4,525 4,826 5,180 5,753
A&P Expense 2,078 2,413 2,487 2,018 2,119 1,942 2,374 2,615
Freight and handling charges 2,898 3,209 3,360 3,834 4,026 4,002 4,569 5,109
Rent Expense 404 473 530 584 - - - -
Other Expenses 2,967 3,252 3,544 4,286 5,120 4,944 5,828 6,477
EBITDA 6,447 7,186 8,070 8,816 10,610 9,698 12,396 13,902
EBITDA Growth (%) 26.2 11.4 12.3 9.2 20.4 (8.6) 27.8 12.2
EBITDA Margin (%) 15.3 15.8 15.6 14.5 16.7 16.5 17.2 17.3
Depreciation 987 1,081 1,242 1,378 1,910 1,957 2,315 2,766
EBIT 5,461 6,105 6,828 7,438 8,700 7,742 10,081 11,136
Other Income (Including EO Items) 347 545 459 600 685 731 850 1,101
Interest 273 162 246 323 470 566 566 566
PBT 5,535 6,488 7,041 7,715 8,915 7,907 10,365 11,671
Total Tax 1,886 2,294 2,439 2,732 2,271 1,990 2,609 2,938
RPAT before associate earnings 3,649 4,194 4,602 4,984 6,644 5,917 7,756 8,734
Share of Associate earnings 57 101 6 (9) (83) (50) (50) (50)
Minority Interest - - - - - - - -
RPAT 3,706 4,295 4,608 4,975 6,561 5,867 7,706 8,684
Exceptional Gain/(loss) - 442 - - - - - -
Adjusted PAT 3,706 3,853 4,608 4,975 6,561 5,867 7,706 8,684
APAT Growth (%) 40.0 4.0 19.6 7.9 31.9 (10.6) 31.4 12.7
Adjusted EPS (Rs) 3.8 4.0 4.7 5.1 6.8 6.0 7.9 8.9
EPS Growth (%) (0.0) 4.0 19.6 7.9 31.9 (10.6) 31.4 12.7
Source: Company, HSIE Research
Balance Sheet Year End (March) FY16 FY17 FY18 FY19E FY20E FY21E FY22E FY23E
SOURCES OF FUNDS
Share Capital - Equity 694 971 971 971 971 971 971 971
Reserves 14,927 18,045 20,974 23,756 25,630 29,272 34,754 41,213
Total Shareholders Funds 15,621 19,016 21,945 24,727 26,601 30,243 35,725 42,184
Minority Interest - - - 35 71 121 171 221
Long Term Debt 2,108 2,621 2,495 2,389 2,073 2,073 2,073 2,073
Short Term Debt 1,437 1,441 1,727 2,811 3,286 3,286 3,286 3,286
Total Debt 3,544 4,062 4,222 5,201 5,359 5,359 5,359 5,359
Net Deferred Taxes 678 807 825 871 483 483 483 483
Other Non-current Liabilities & Provns 60 68 90 198 2,662 2,662 2,662 2,662
TOTAL SOURCES OF FUNDS 19,903 23,953 27,081 31,031 35,175 38,868 44,399 50,908
APPLICATION OF FUNDS
Net Block 7,765 9,571 10,026 11,029 13,288 12,649 16,178 16,601
CWIP 511 622 972 1,699 1,785 1,785 1,785 1,785
Goodwill 1,865 1,789 2,646 2,693 2,790 2,790 2,790 2,790
Other Non-current Assets 577 611 905 493 3,355 3,355 3,355 3,355
Total Non-current Assets 10,717 12,593 14,548 15,913 21,217 20,578 24,107 24,530
Investments 3,475 4,721 3,331 3,949 3,152 3,152 3,152 3,152
Inventories 7,332 9,355 10,073 12,335 12,785 12,416 14,390 15,981
Debtors 5,454 5,781 6,924 6,715 7,141 7,095 8,082 8,972
Other Current Assets 736 921 2,500 2,323 2,501 2,312 2,728 2,941
Cash & Equivalents 1,053 1,025 2,050 2,385 2,199 5,929 7,302 12,467
Total Current Assets 18,051 21,803 24,878 27,707 27,778 30,903 35,653 43,512
Creditors 6,699 7,612 9,553 9,990 10,658 9,674 11,768 13,094
Other Current Liabilities & Provns 2,166 2,831 2,793 2,599 3,162 2,939 3,593 4,040
Total Current Liabilities 8,865 10,443 12,345 12,589 13,820 12,613 15,361 17,134
Net Current Assets 9,186 11,360 12,533 15,118 13,958 18,289 20,292 26,378
TOTAL APPLICATION OF FUNDS 19,903 23,953 27,081 31,031 35,175 38,868 44,399 50,908
Source: Company, HSIE Research
Page | 23
Berger Paints: Initiating Coverage
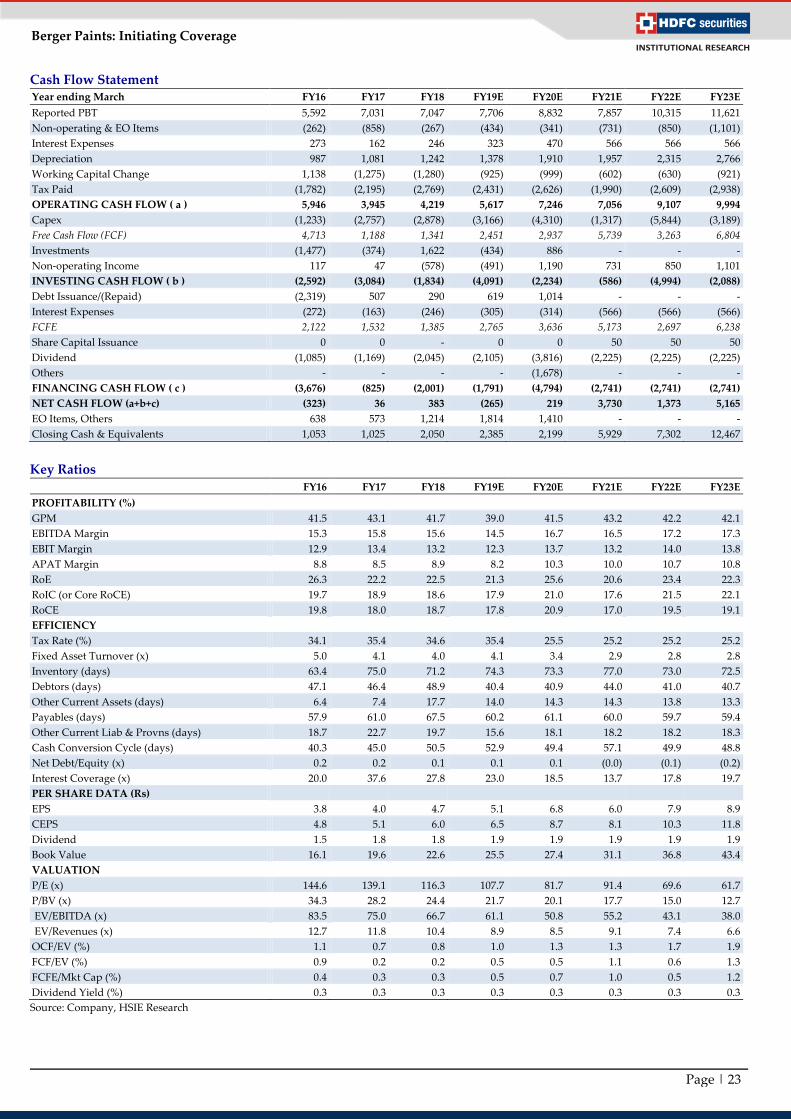
Cash Flow Statement Year ending March FY16 FY17 FY18 FY19E FY20E FY21E FY22E FY23E
Reported PBT 5,592 7,031 7,047 7,706 8,832 7,857 10,315 11,621
Non-operating & EO Items (262) (858) (267) (434) (341) (731) (850) (1,101)
Interest Expenses 273 162 246 323 470 566 566 566
Depreciation 987 1,081 1,242 1,378 1,910 1,957 2,315 2,766
Working Capital Change 1,138 (1,275) (1,280) (925) (999) (602) (630) (921)
Tax Paid (1,782) (2,195) (2,769) (2,431) (2,626) (1,990) (2,609) (2,938)
OPERATING CASH FLOW ( a ) 5,946 3,945 4,219 5,617 7,246 7,056 9,107 9,994
Capex (1,233) (2,757) (2,878) (3,166) (4,310) (1,317) (5,844) (3,189)
Free Cash Flow (FCF) 4,713 1,188 1,341 2,451 2,937 5,739 3,263 6,804
Investments (1,477) (374) 1,622 (434) 886 - - -
Non-operating Income 117 47 (578) (491) 1,190 731 850 1,101
INVESTING CASH FLOW ( b ) (2,592) (3,084) (1,834) (4,091) (2,234) (586) (4,994) (2,088)
Debt Issuance/(Repaid) (2,319) 507 290 619 1,014 - - -
Interest Expenses (272) (163) (246) (305) (314) (566) (566) (566)
FCFE 2,122 1,532 1,385 2,765 3,636 5,173 2,697 6,238
Share Capital Issuance 0 0 - 0 0 50 50 50
Dividend (1,085) (1,169) (2,045) (2,105) (3,816) (2,225) (2,225) (2,225)
Others - - - - (1,678) - - -
FINANCING CASH FLOW ( c ) (3,676) (825) (2,001) (1,791) (4,794) (2,741) (2,741) (2,741)
NET CASH FLOW (a+b+c) (323) 36 383 (265) 219 3,730 1,373 5,165
EO Items, Others 638 573 1,214 1,814 1,410 - - -
Closing Cash & Equivalents 1,053 1,025 2,050 2,385 2,199 5,929 7,302 12,467
Key Ratios FY16 FY17 FY18 FY19E FY20E FY21E FY22E FY23E
PROFITABILITY (%)
GPM 41.5 43.1 41.7 39.0 41.5 43.2 42.2 42.1
EBITDA Margin 15.3 15.8 15.6 14.5 16.7 16.5 17.2 17.3
EBIT Margin 12.9 13.4 13.2 12.3 13.7 13.2 14.0 13.8
APAT Margin 8.8 8.5 8.9 8.2 10.3 10.0 10.7 10.8
RoE 26.3 22.2 22.5 21.3 25.6 20.6 23.4 22.3
RoIC (or Core RoCE) 19.7 18.9 18.6 17.9 21.0 17.6 21.5 22.1
RoCE 19.8 18.0 18.7 17.8 20.9 17.0 19.5 19.1
EFFICIENCY
Tax Rate (%) 34.1 35.4 34.6 35.4 25.5 25.2 25.2 25.2
Fixed Asset Turnover (x) 5.0 4.1 4.0 4.1 3.4 2.9 2.8 2.8
Inventory (days) 63.4 75.0 71.2 74.3 73.3 77.0 73.0 72.5
Debtors (days) 47.1 46.4 48.9 40.4 40.9 44.0 41.0 40.7
Other Current Assets (days) 6.4 7.4 17.7 14.0 14.3 14.3 13.8 13.3
Payables (days) 57.9 61.0 67.5 60.2 61.1 60.0 59.7 59.4
Other Current Liab & Provns (days) 18.7 22.7 19.7 15.6 18.1 18.2 18.2 18.3
Cash Conversion Cycle (days) 40.3 45.0 50.5 52.9 49.4 57.1 49.9 48.8
Net Debt/Equity (x) 0.2 0.2 0.1 0.1 0.1 (0.0) (0.1) (0.2)
Interest Coverage (x) 20.0 37.6 27.8 23.0 18.5 13.7 17.8 19.7
PER SHARE DATA (Rs)
EPS 3.8 4.0 4.7 5.1 6.8 6.0 7.9 8.9
CEPS 4.8 5.1 6.0 6.5 8.7 8.1 10.3 11.8
Dividend 1.5 1.8 1.8 1.9 1.9 1.9 1.9 1.9
Book Value 16.1 19.6 22.6 25.5 27.4 31.1 36.8 43.4
VALUATION
P/E (x) 144.6 139.1 116.3 107.7 81.7 91.4 69.6 61.7
P/BV (x) 34.3 28.2 24.4 21.7 20.1 17.7 15.0 12.7
EV/EBITDA (x) 83.5 75.0 66.7 61.1 50.8 55.2 43.1 38.0
EV/Revenues (x) 12.7 11.8 10.4 8.9 8.5 9.1 7.4 6.6
OCF/EV (%) 1.1 0.7 0.8 1.0 1.3 1.3 1.7 1.9
FCF/EV (%) 0.9 0.2 0.2 0.5 0.5 1.1 0.6 1.3
FCFE/Mkt Cap (%) 0.4 0.3 0.3 0.5 0.7 1.0 0.5 1.2
Dividend Yield (%) 0.3 0.3 0.3 0.3 0.3 0.3 0.3 0.3
Source: Company, HSIE Research
Page | 24
Berger Paints: Initiating Coverage
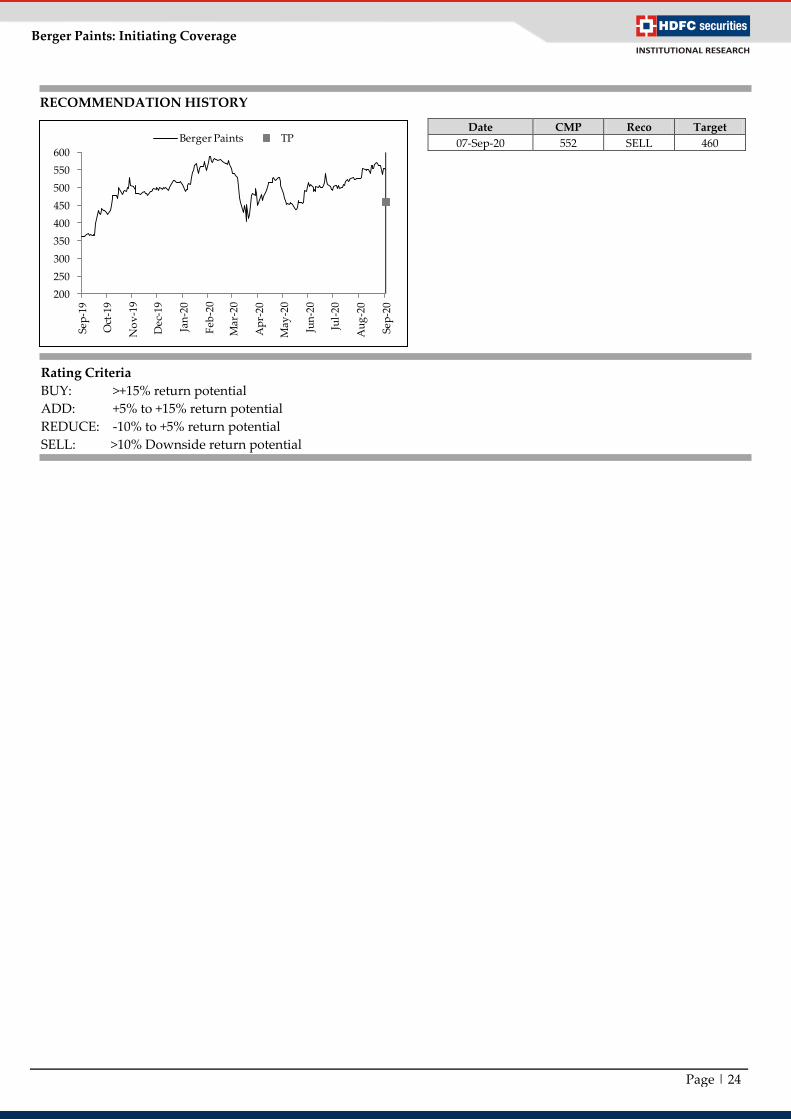
RECOMMENDATION HISTORY
200
250
300
350
400
450
500
550
600
Sep
-19
Oct
-19
No
v-1
9
Dec
-19
Jan
-20
Feb
-20
Mar
-20
Ap
r-20
May
-20
Jun
-20
Jul-
20
Au
g-2
0
Sep
-20
Berger Paints TPDate CMP Reco Target
07-Sep-20 552 SELL 460
Rating Criteria
BUY: >+15% return potential
ADD: +5% to +15% return potential
REDUCE: -10% to +5% return potential
SELL: >10% Downside return potential

Page | 25
Berger Paints: Initiating Coverage
Disclosure:
We, Jay Gandhi, MBA & Varun Lohchab, PGDM, authors and the names subscribed to this report, hereby certify that all of the views expressed in this
research report accurately reflect our views about the subject issuer(s) or securities. HSL has no material adverse disciplinary history as on the date of
publication of this report. We also certify that no part of our compensation was, is, or will be directly or indirectly related to the specific recommendation(s) or
view(s) in this report.
Research Analyst or his/her relative or HDFC Securities Ltd. does not have any financial interest in the subject company. Also, Research Analyst or his relative
or HDFC Securities Ltd. or its Associate may have beneficial ownership of 1% or more in the subject company at the end of the month immediately preceding
the date of publication of the Research Report. Further Research Analyst or his relative or HDFC Securities Ltd. or its associate does not have any material
conflict of interest.
Any holding in stock –No
HDFC Securities Limited (HSL) is a SEBI Registered Research Analyst having registration no. INH000002475.
Disclaimer:
This report has been prepared by HDFC Securities Ltd and is solely for information of the recipient only. The report must not be used as a singular basis of any
investment decision. The views herein are of a general nature and do not consider the risk appetite or the particular circumstances of an individual investor;
readers are requested to take professional advice before investing. Nothing in this document should be construed as investment advice. Each recipient of this
document should make such investigations as they deem necessary to arrive at an independent evaluation of an investment in securities of the companies
referred to in this document (including merits and risks) and should consult their own advisors to determine merits and risks of such investment. The
information and opinions contained herein have been compiled or arrived at, based upon information obtained in good faith from sources believed to be
reliable. Such information has not been independently verified and no guaranty, representation of warranty, express or implied, is made as to its accuracy,
completeness or correctness. All such information and opinions are subject to change without notice. Descriptions of any company or companies or their
securities mentioned herein are not intended to be complete. HSL is not obliged to update this report for such changes. HSL has the right to make changes and
modifications at any time.
This report is not directed to, or intended for display, downloading, printing, reproducing or for distribution to or use by, any person or entity who is a citizen
or resident or located in any locality, state, country or other jurisdiction where such distribution, publication, reproduction, availability or use would be
contrary to law or regulation or what would subject HSL or its affiliates to any registration or licensing requirement within such jurisdiction.
If this report is inadvertently sent or has reached any person in such country, especially, United States of America, the same should be ignored and brought to
the attention of the sender. This document may not be reproduced, distributed or published in whole or in part, directly or indirectly, for any purposes or in
any manner.
Foreign currencies denominated securities, wherever mentioned, are subject to exchange rate fluctuations, which could have an adverse effect on their value or
price, or the income derived from them. In addition, investors in securities such as ADRs, the values of which are influenced by foreign currencies effectively
assume currency risk. It should not be considered to be taken as an offer to sell or a solicitation to buy any security.
This document is not, and should not, be construed as an offer or solicitation of an offer, to buy or sell any securities or other financial instruments. This report
should not be construed as an invitation or solicitation to do business with HSL. HSL may from time to time solicit from, or perform broking, or other services
for, any company mentioned in this mail and/or its attachments.
HSL and its affiliated company(ies), their directors and employees may; (a) from time to time, have a long or short position in, and buy or sell the securities of
the company(ies) mentioned herein or (b) be engaged in any other transaction involving such securities and earn brokerage or other compensation or act as a
market maker in the financial instruments of the company(ies) discussed herein or act as an advisor or lender/borrower to such company(ies) or may have any
other potential conflict of interests with respect to any recommendation and other related information and opinions.
HSL, its directors, analysts or employees do not take any responsibility, financial or otherwise, of the losses or the damages sustained due to the investments
made or any action taken on basis of this report, including but not restricted to, fluctuation in the prices of shares and bonds, changes in the currency rates,
diminution in the NAVs, reduction in the dividend or income, etc.
HSL and other group companies, its directors, associates, employees may have various positions in any of the stocks, securities and financial instruments dealt
in the report, or may make sell or purchase or other deals in these securities from time to time or may deal in other securities of the companies / organizations
described in this report.
HSL or its associates might have managed or co-managed public offering of securities for the subject company or might have been mandated by the subject
company for any other assignment in the past twelve months.
HSL or its associates might have received any compensation from the companies mentioned in the report during the period preceding twelve months from the
date of this report for services in respect of managing or co-managing public offerings, corporate finance, investment banking or merchant banking, brokerage
services or other advisory service in a merger or specific transaction in the normal course of business.
HSL or its analysts did not receive any compensation or other benefits from the companies mentioned in the report or third party in connection with
preparation of the research report. Accordingly, neither HSL nor Research Analysts have any material conflict of interest at the time of publication of this
report. Compensation of our Research Analysts is not based on any specific merchant banking, investment banking or brokerage service transactions. HSL may
have issued other reports that are inconsistent with and reach different conclusion from the information presented in this report.
Research entity has not been engaged in market making activity for the subject company. Research analyst has not served as an officer, director or employee of
the subject company. We have not received any compensation/benefits from the subject company or third party in connection with the Research Report.
HDFC securities Limited, I Think Techno Campus, Building - B, "Alpha", Office Floor 8, Near Kanjurmarg Station, Opp. Crompton Greaves, Kanjurmarg
(East), Mumbai 400 042 Phone: (022) 3075 3400 Fax: (022) 2496 5066 Compliance Officer: Binkle R. Oza Email: [email protected] Phone: (022)
3045 3600
HDFC Securities Limited, SEBI Reg. No.: NSE, BSE, MSEI, MCX: INZ000186937; AMFI Reg. No. ARN: 13549; PFRDA Reg. No. POP: 11092018; IRDA
Corporate Agent License No.: CA0062; SEBI Research Analyst Reg. No.: INH000002475; SEBI Investment Adviser Reg. No.: INA000011538; CIN -
U67120MH2000PLC152193
HDFC securities
Institutional Equities
Unit No. 1602, 16th Floor, Tower A, Peninsula Business Park,
Senapati Bapat Marg, Lower Parel, Mumbai - 400 013
Board: +91-22-6171-7330 www.hdfcsec.com


