Averages
Averages–Objectives
I can work out the Mode.
I can work out the Range.
I can make up data sets with a particular mode and range.
Different Averages
Key words
Mode
Range
Data Set

Mode
I don’t want to brag,
I don’t want to boast,
I am the MODE,I am the most.
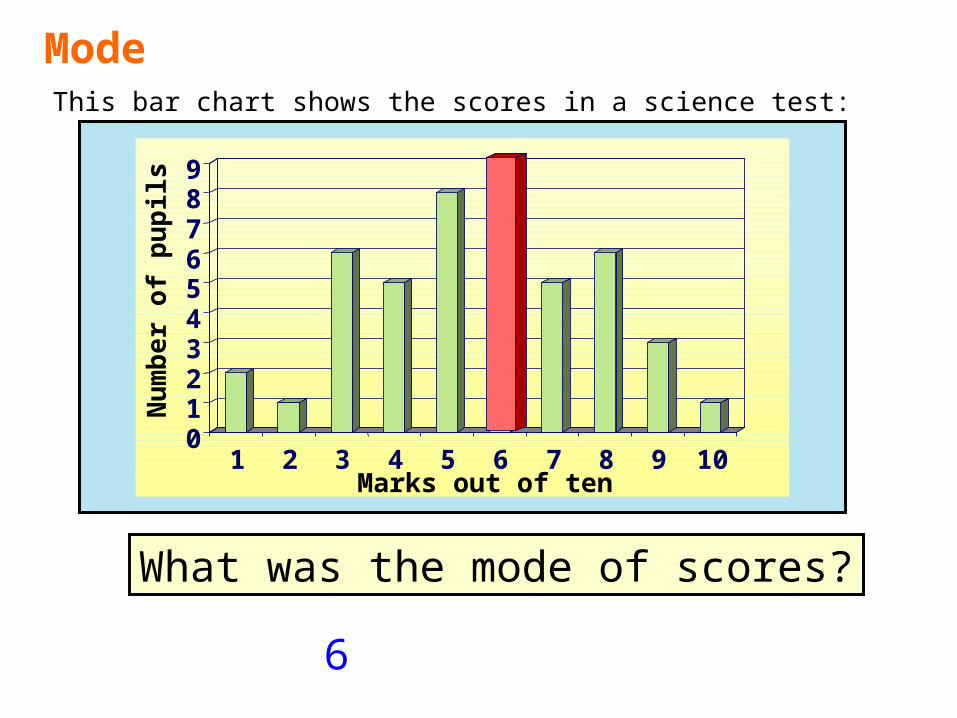
ModeThis bar chart shows the scores in a science test:
What was the mode of scores?
6
0123456789
1 2 3 4 5 6 7 8 9 10
Nu
mb
er
of
pu
pils
Marks out of ten
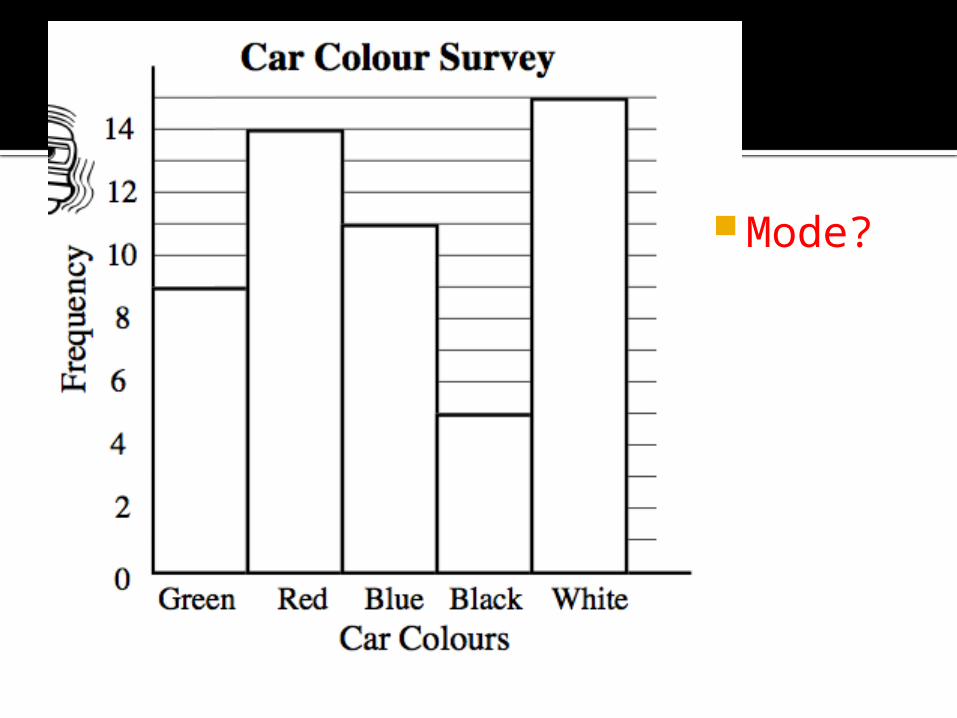
Mode?

Finding the mode
A dice was thrown ten times. These are the results:
What was the modal score?
3 is the modal score because it appears most often.

Mode
What is the modal method of travel?
Method of travel Frequency
Bicycle 6
On foot 8
Car 2
Bus 6
Train 3
8Most children travel on foot.
Travelling on foot is therefore the modal method of travel.
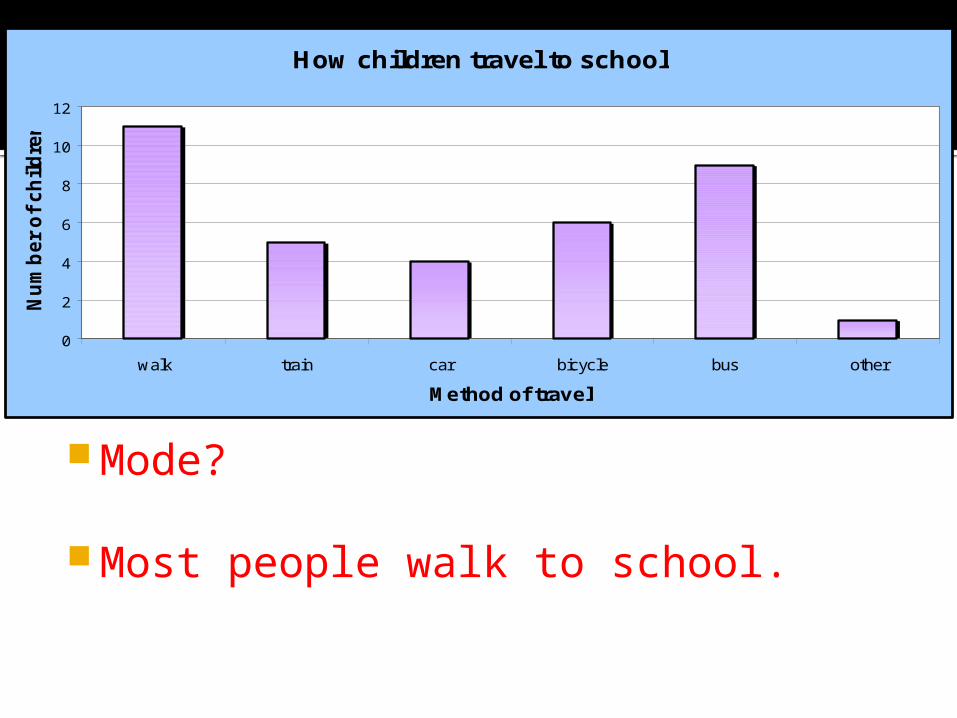
Mode?
Most people walk to school.
How children travel to school
0
2
4
6
8
10
12
walk train car bicycle bus other
Method of travel
Nu
mb
er
of
ch
ild
ren
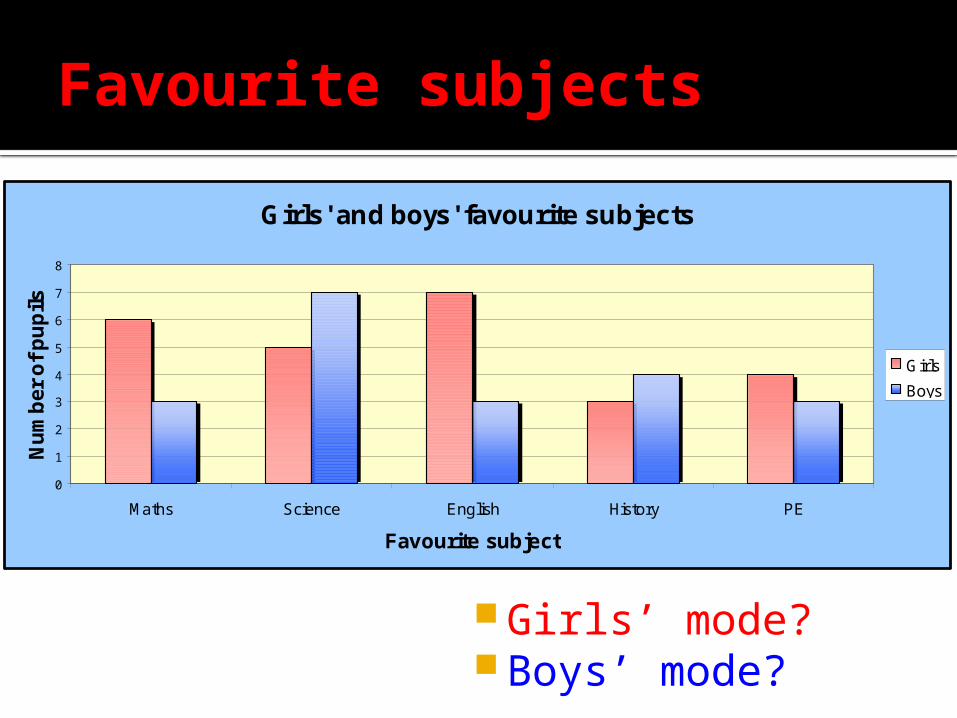
Girls’ mode? Boys’ mode?
Favourite subjects
Girls' and boys' favourite subjects
0
1
2
3
4
5
6
7
8
Maths Science English History PE
Favourite subject
Nu
mb
er
of
pu
pils
Girls
Boys
02468
101214161820
Sprin
t
Long
dist
ance
runn
ing
Hurdl
es
High
jum
p
Long
jum
p
Trip
le ju
mp
Shot
Discus
Jave
lin
Freq
uen
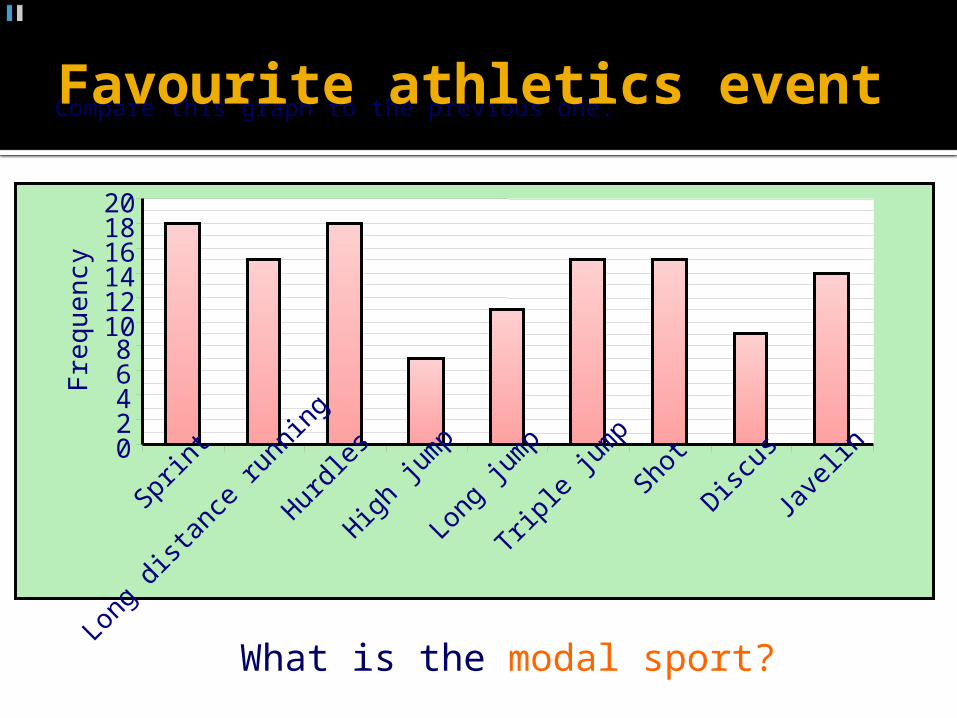
cyCompare this graph to the previous one. Favourite athletics event
What is the modal sport?
Averages–Objectives
I can work out the Mode.
I can work out the Range.
I can make up data sets with a particular mode and range.
Range
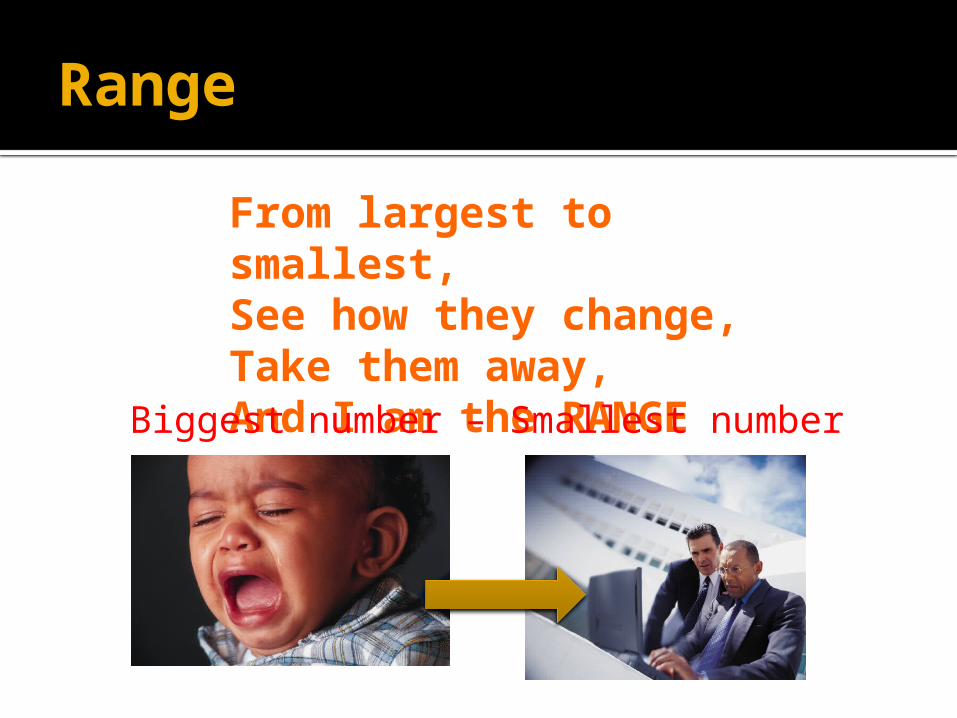
From largest to smallest, See how they change,Take them away,And I am the RANGEBiggest number – Smallest number
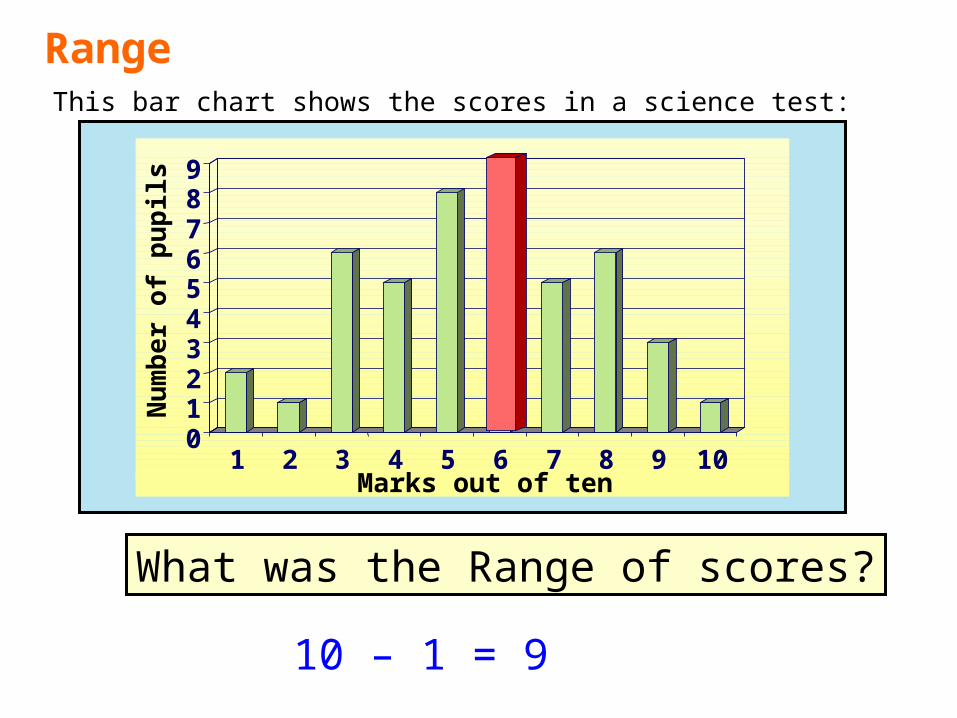
RangeThis bar chart shows the scores in a science test:
What was the Range of scores?
10 – 1 = 9
0123456789
1 2 3 4 5 6 7 8 9 10
Nu
mb
er
of
pu
pils
Marks out of ten
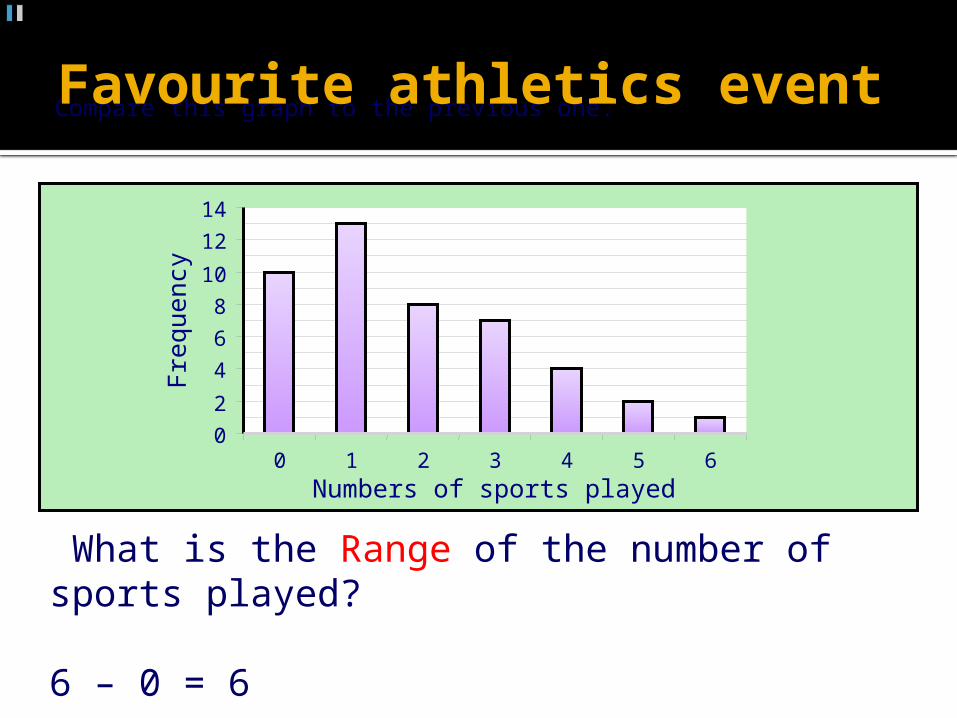
Compare this graph to the previous one. Favourite athletics event
0
2
4
6
8
10
12
14
0 1 2 3 4 5 6Numbers of sports played
Frequency
What is the Range of the number of sports played?
6 – 0 = 6
Averages–Objectives
I can work out the Mode.
I can work out the Range.
I can make up data sets with a particular mode and range.
Key points?
Mode Most
Range Biggest number – Smallest number
Page 200. Q2, 3Extension Q4

What I Learnt Today
1.
2.
What I am unsure about…. 1.


