© 2008 by Educational Research Service
Answering the Critics of
School Administration:
What Are the Facts?
Second Edition
Presenting and Analyzing Important Educational Issues
The public perception of school administration is that it is a large bureaucracy diverting critical resources from instruction. But can this perception be backed up with facts?
© 2008 by Educational Research Service
Educational Research Service1001 North Fairfax Street, Suite 500Alexandria, VA 22314www.ers.org

Educational Research Service1001 North Fairfax Street, Suite 500Alexandria, Virginia 22314www.ers.org
“All too often in recent months, [I listened to] erroneous claims by legislators and others who have made exaggerated statements about the number of school administrators and administrative costs . . . As I heard time after time the repetition of information, I wanted to jump up and yell, ‘Just the facts, PLEASE!’” (Bozza, 2008).
© 2008 by Educational Research Service
Educational Research Service1001 North Fairfax Street, Suite 500Alexandria, Virginia 22314www.ers.org
© 2008 by Educational Research Service
An Overview of the Perceptions
1. Administration is an unnecessaryburden on schools and should be curtailed.
2. There are too many administrators.
3. The number of school administrators is growing rapidly and at the expense of instruction.
4. School administrators are paid too much.
5. Increasing amounts of school budgets are goingto administration.
6. A lot of money is going to administration thatcould be better spent for other purposes.

Educational Research Service1001 North Fairfax Street, Suite 500Alexandria, Virginia 22314www.ers.org
© 2008 by Educational Research Service
Administration is an unnecessary burden on schools and should be curtailed.
The Perception:
Educational Research Service1001 North Fairfax Street, Suite 500Alexandria, Virginia 22314www.ers.org
© 2008 by Educational Research Service
Leadership and Student Learning
Academics, practitioners, and reviewers from every field of study have concluded that leadership is a central variable in the equation that defines organizational success…. Looking specifically at education, we have parallel evidence that leadership is a central ingredient —and often the keystone element—in school and district success as defined in terms of student achievement.
Source: Restructuring Through Learning Focused Leadership in Handbook on Restructuring and Substantial School Improvement (Murphy, 2007).
Educational Research Service1001 North Fairfax Street, Suite 500Alexandria, Virginia 22314www.ers.org
© 2008 by Educational Research Service
Successful leadership can play a highly significant and frequently underestimated role in improving student learning.
Source: Review of Research: How Leadership Influences Student Learning (Leithwood, Louis, Anderson, & Wahlstrom, 2004).
Educational Research Service1001 North Fairfax Street, Suite 500Alexandria, Virginia 22314www.ers.org
© 2008 by Educational Research Service
Leadership is second only to classroom instruction among all school-related factors that contribute to what students learn at school.
Leadership effects are usually largest where and when they are needed most.
Source: Review of Research: How Leadership Influences Student Learning (Leithwood, Louis, Anderson, & Wahlstrom, 2004).
Educational Research Service1001 North Fairfax Street, Suite 500Alexandria, Virginia 22314www.ers.org
© 2008 by Educational Research Service
Repeatedly, case studies confirm that districts can “‘matter’ in powerfully positive ways for student learning in large numbers of schools and for students of all backgrounds.”
District-Level Leadership
Source: Review of Research: How Leadership Influences Student Learning (Leithwood, Louis, Anderson, & Wahlstrom, 2004).

Educational Research Service1001 North Fairfax Street, Suite 500Alexandria, Virginia 22314www.ers.org
© 2008 by Educational Research Service
Central-Office Staff Leadership
Educators in highly successful schools “attribute part of their success to the district [and] describe district personnel as providing vision and direction of the reform efforts. . . These district people are credited with setting the expectations, and then with providing the resources, mentoring, and expertise necessary for the schools to achieve the learning goals.”
SOURCE: A Decade of Reform: A Summary of Research Findings on Classroom, School, and District Effectiveness in Washington State (Fouts, 2003).

Educational Research Service1001 North Fairfax Street, Suite 500Alexandria, Virginia 22314www.ers.org
© 2008 by Educational Research Service
Superintendent LeadershipThe correlation between an effective superin-tendent and student learning equates to almost 10 percentile points on standardized assessments.
This finding stands in sharp contrast to the notion that district administration is a part of what former Secretary of Education William Bennett characterized as an amorphous “blob” that soaks up valuable resources without adding value to a district’s instructional program.
SOURCE: School District Leadership that Works: The Effect of Superintendent Leadership on Student Achievement. ERS Spectrum (Waters & Marzano, 2007).

Educational Research Service1001 North Fairfax Street, Suite 500Alexandria, Virginia 22314www.ers.org
© 2008 by Educational Research Service
The “What” of Learning-Focused Leadership
Develop and steward vision Hire, allocate, and support quality staff Maximize content coverage in an aligned curriculum Actively monitor student progress Establish positive expectations for academic learning Maintain high visibility and involvement by spending time in
classrooms Are knowledgeable about and involved in the instructional
program of the school Promote student and teacher incentives through personal
interest as well as private and public acknowledgement Promote professional development and practice Develop a supportive work environment Forge home-school linksSource: Restructuring Through Learning Focused Leadership in Handbook on Restructuring and Substantial School Improvement (Murphy, 2007).
Educational Research Service1001 North Fairfax Street, Suite 500Alexandria, Virginia 22314www.ers.org
© 2008 by Educational Research Service
Behaviors of Turnaround Leaders Understood the importance of achieving a few tangible wins quickly Had a driving commitment to obtaining results for their organizations
and supported this by requiring all staff to change, rather than making it optional
Were willing to implement practices they felt were necessary to achieve goals even when they deviated from norms
Ensured that organization performance data was collected and analyzed
Made their action plans based on data Funneled time and money into successful tactics while halting
unsuccessful tactics “Acted in relentless pursuit of goals, rather than touting progress as
ultimate success”
Source: School Turnarounds: A Review of the Cross-Sector Evidence on Dramatic Organizational Improvement (Rhim, Kowal, Hassel, & Hassel, 2007).

Educational Research Service1001 North Fairfax Street, Suite 500Alexandria, Virginia 22314www.ers.org
© 2008 by Educational Research Service
What do the facts show?
Good school management is recognized as essential for the development and operation of effective schools.
Research has identified a link between effective leadership and student learning.
District-level administrative and professional staff members provide critically needed support for school-level programs.
Leadership is especially important when rapid “turnaround” is needed for low-performing schools or districts.

Educational Research Service1001 North Fairfax Street, Suite 500Alexandria, Virginia 22314www.ers.org
© 2008 by Educational Research Service
There are too many administrators.
The Perception:

Educational Research Service1001 North Fairfax Street, Suite 500Alexandria, Virginia 22314www.ers.org
© 2008 by Educational Research Service
Personnel Employed in Public School Districts,School Year 2005-06
Teachers 51.2%
SOURCE: Public Elementary and Secondary School Enrollment, High School Completions, and Staff from the Common Core of Data: School Year 2005-06 (Sable & Garofano, 2007).
School districtadministrators
1.1%
Principals and assistant principals 2.8%
Librarians, counselors, and instructional coordinators 3.3%
Instructional aides 11.4%
Student and other support staff(library aides, bus drivers, cafeteria workers, etc.) 30.2%
Educational Research Service1001 North Fairfax Street, Suite 500Alexandria, Virginia 22314www.ers.org
© 2008 by Educational Research Service
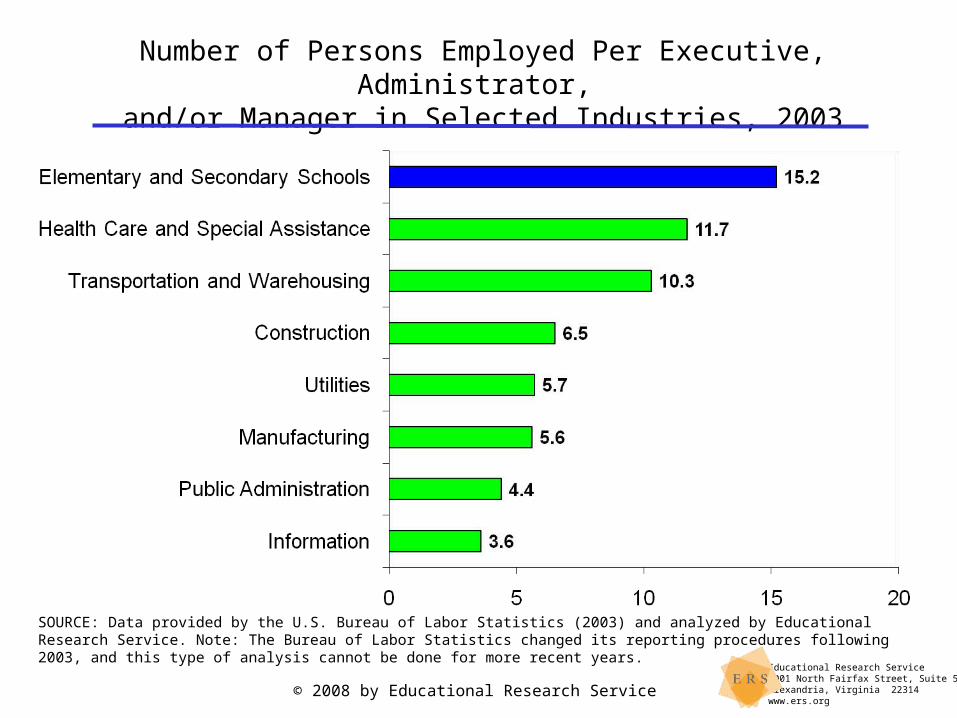
Number of Persons Employed Per Executive, Administrator, and/or Manager in Selected Industries, 2003
SOURCE: Data provided by the U.S. Bureau of Labor Statistics (2003) and analyzed by Educational Research Service. Note: The Bureau of Labor Statistics changed its reporting procedures following 2003, and this type of analysis cannot be done for more recent years.

Educational Research Service1001 North Fairfax Street, Suite 500Alexandria, Virginia 22314www.ers.org
© 2008 by Educational Research Service
Serves about 3,500 students
Employs over 400 staff members
Has a budget of about $32 million
May be one of the largest employers in the community
The “Typical” School District

Educational Research Service1001 North Fairfax Street, Suite 500Alexandria, Virginia 22314www.ers.org
© 2008 by Educational Research Service
What do the facts show?
Local school districts are major institutions performing important public functions with substantially fewer management personnel than found in business and industry.

Educational Research Service1001 North Fairfax Street, Suite 500Alexandria, Virginia 22314www.ers.org
© 2008 by Educational Research Service
The number of school administrators is growing rapidly and at the expense of instruction.
The Perception:
Educational Research Service1001 North Fairfax Street, Suite 500Alexandria, Virginia 22314www.ers.org
© 2008 by Educational Research Service
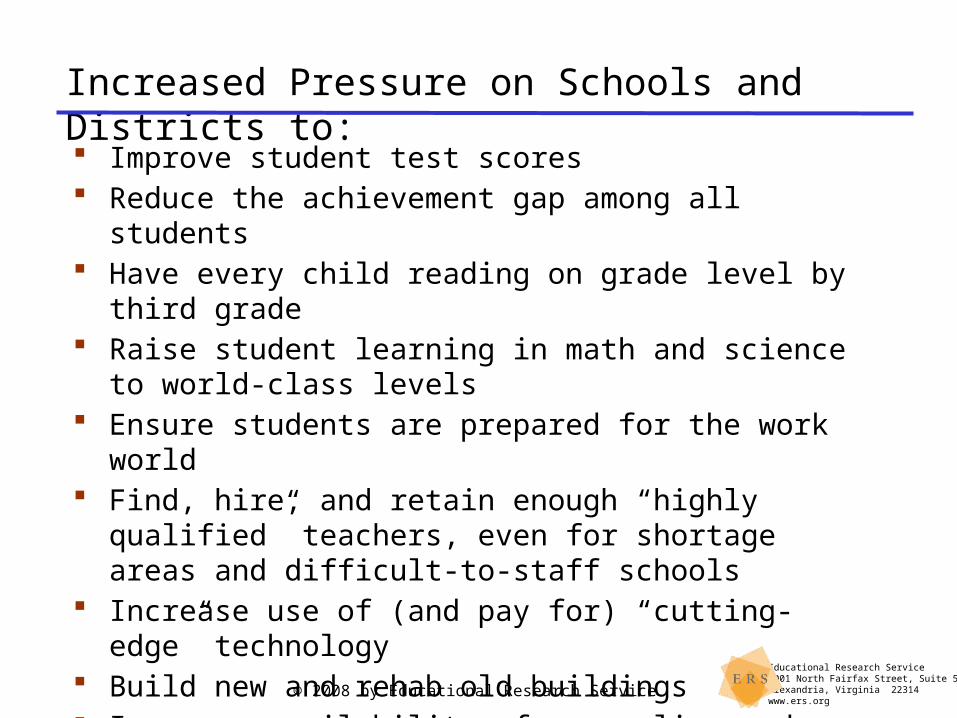
Increased Pressure on Schools and Districts to:
Improve student test scores Reduce the achievement gap among all students Have every child reading on grade level by third grade Raise student learning in math and science to world-class levels Ensure students are prepared for the work world Find, hire, and retain enough “highly qualified” teachers, even
for shortage areas and difficult-to-staff schools Increase use of (and pay for) “cutting-edge” technology Build new and rehab old buildings Increase availability of counseling and similar services Improve staff development programs Increase family involvement
Educational Research Service1001 North Fairfax Street, Suite 500Alexandria, Virginia 22314www.ers.org
© 2008 by Educational Research Service
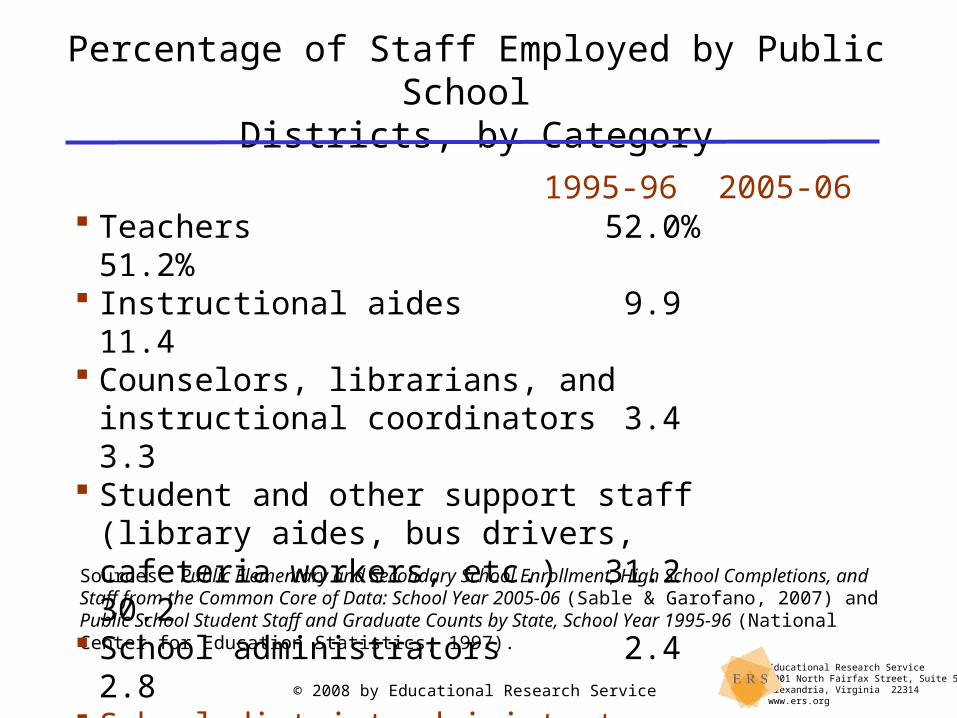
Percentage of Staff Employed by Public School Districts, by Category
Sources: Public Elementary and Secondary School Enrollment, High School Completions, and Staff from the Common Core of Data: School Year 2005-06 (Sable & Garofano, 2007) and Public School Student Staff and Graduate Counts by State, School Year 1995-96 (National Center for Education Statistics, 1997).
1995-96 2005-06 Teachers 52.0%
51.2% Instructional aides 9.9 11.4 Counselors, librarians, and
instructional coordinators 3.4 3.3 Student and other support staff
(library aides, bus drivers, cafeteria workers, etc.) 31.2 30.2
School administrators 2.4 2.8 School district administrators 1.0 1.1

Educational Research Service1001 North Fairfax Street, Suite 500Alexandria, Virginia 22314www.ers.org
© 2008 by Educational Research Service
Changes in Pupil-Staff Ratios, 2002-03 to 2007-08
4.3% decline nationally in average pupil/teacher ratio, to 15.5 pupils per teacher in 2007-2008
4.0% decline in average pupil/central office administrator ratios, to 501 pupils per central office administrator
Source: Staffing Patterns in Public School Systems: Current Status and Trends, Update 2008 (Educational Research Service, 2008).

Educational Research Service1001 North Fairfax Street, Suite 500Alexandria, Virginia 22314www.ers.org
© 2008 by Educational Research Service
What do the facts show?
Significant new and expanded responsibilities, many of which must be performed by central-office staff, have been assigned to school districts in recent years.
There has been no increase in central administration at the expense of instruction over a 10-year period.
While the ratio of students to district central-office staff has declined slightly over the last decade, the percentage decrease is almost the same as the decline in the number of students per teacher.

Educational Research Service1001 North Fairfax Street, Suite 500Alexandria, Virginia 22314www.ers.org
© 2008 by Educational Research Service
School administrators are paid too much.
The Perception:

Educational Research Service1001 North Fairfax Street, Suite 500Alexandria, Virginia 22314www.ers.org
© 2008 by Educational Research Service
Comparing 2007 Annual Median Salaries for Various Occupations
School Teachers $50,936Education Administrators, Elem. & Secondary 82,120 1.61
Registered Nurses 62,480Internists, General 167,270 2.68
Paralegals and Legal Assistants 47,600Lawyers 118,280 2.48
Accountants and Auditors 63,180Chief Executives 151,370 2.40
Flight Attendants 62,880Airline Pilots, Copilots, and Flight Engineers 148,810 2.37
Median Salary Comparison Ratio
SOURCE: National employment and wage by occupation data from the Occupational Employment Statistics survey (Bureau of Labor Statistics, 2007) and analyzed by ERS.

Educational Research Service1001 North Fairfax Street, Suite 500Alexandria, Virginia 22314www.ers.org
© 2008 by Educational Research Service
Comparing Annual Salaries and Daily Pay Rates, 2007-2008
AverageSalary
Days onDuty
DailyRates
Teachers $49,195 186 $264 1.00Elementary Principals 81,935 224 366 1.39Junior High/Middle
School Principals 88,079 227 388 1.47Senior High Principals 90,964 231 394 1.49Assistant Superintendents 112,587 237 475 1.80Superintendents 125,096 241 519 1.97
SOURCE: Salaries and Wages Paid Professional and Support Personnel in Public Schools 2007-2008. Data weighted to generate nationally representative averages (Educational Research Service, 2008a).
Comparison with Teacher
Salary
Educational Research Service1001 North Fairfax Street, Suite 500Alexandria, Virginia 22314www.ers.org
© 2008 by Educational Research Service
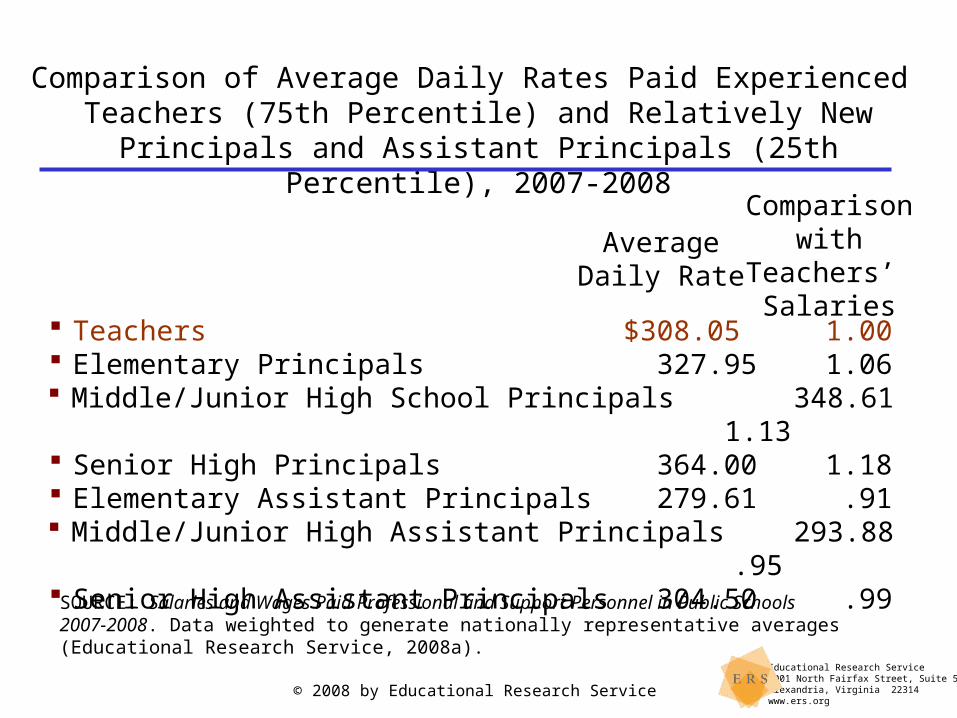
Comparison of Average Daily Rates Paid Experienced Teachers (75th Percentile) and Relatively New Principals and Assistant
Principals (25th Percentile), 2007-2008
AverageDaily Rate
Comparisonwith Teachers’
Salaries
Teachers $308.05 1.00 Elementary Principals 327.95 1.06 Middle/Junior High School Principals 348.61 1.13 Senior High Principals 364.00 1.18 Elementary Assistant Principals 279.61 .91 Middle/Junior High Assistant Principals 293.88 .95 Senior High Assistant Principals 304.50 .99
SOURCE: Salaries and Wages Paid Professional and Support Personnel in Public Schools 2007-2008. Data weighted to generate nationally representative averages (Educational Research Service, 2008a).
Educational Research Service1001 North Fairfax Street, Suite 500Alexandria, Virginia 22314www.ers.org
© 2008 by Educational Research Service
What do the facts show?
Administrator salaries have not been gaining at the expense of teacher salaries, which are generally considered to be low.
Current differences between teacher and administrator salaries, when viewed from the standpoint of length of work year, level of education, and experience, are relatively narrow.

Educational Research Service1001 North Fairfax Street, Suite 500Alexandria, Virginia 22314www.ers.org
© 2008 by Educational Research Service
Increasing amounts of school budgets are going to administration.
The Perception:
Educational Research Service1001 North Fairfax Street, Suite 500Alexandria, Virginia 22314www.ers.org
© 2008 by Educational Research Service
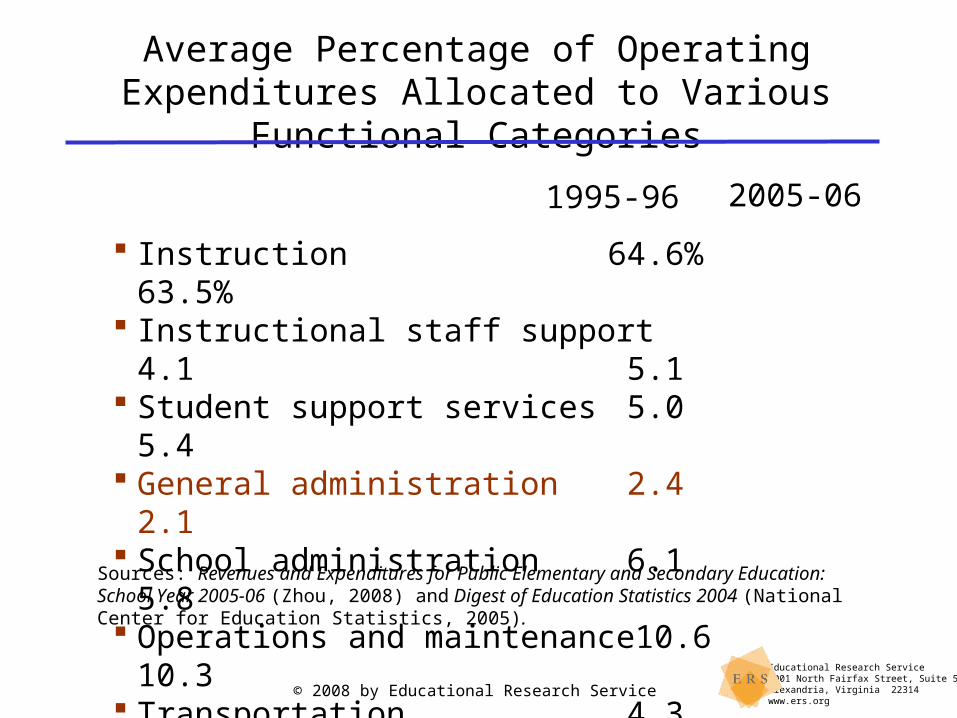
Average Percentage of Operating Expenditures Allocated to Various Functional Categories
Sources: Revenues and Expenditures for Public Elementary and Secondary Education: School Year 2005-06 (Zhou, 2008) and Digest of Education Statistics 2004 (National Center for Education Statistics, 2005).
1995-96 2005-06
Instruction 64.6%63.5%
Instructional staff support 4.1 5.1 Student support services 5.0 5.4 General administration 2.4 2.1 School administration 6.1 5.8 Operations and maintenance 10.6 10.3 Transportation 4.3 4.4 Other support services 2.9 3.3

Educational Research Service1001 North Fairfax Street, Suite 500Alexandria, Virginia 22314www.ers.org
© 2008 by Educational Research Service
What do the facts show?
• The share of school budgets going to administration has not increased at the expense of instruction.
• The share of school budgets going to administration and instruction has been relatively stable.
Educational Research Service1001 North Fairfax Street, Suite 500Alexandria, Virginia 22314www.ers.org
© 2008 by Educational Research Service
A lot of money is going toadministration that could bebetter spent for other purposes.
The Perception:

Educational Research Service1001 North Fairfax Street, Suite 500Alexandria, Virginia 22314www.ers.org
© 2008 by Educational Research Service
School District Operating Expenditures, 2005-2006
Other Support Services 3.3%
School Administration 5.8%
Operations & Maintenance 10.3%
General Administration 2.1%
SOURCE: Revenues and Expenditures for Public Elementary and Secondary Education: School Year 2005-06 (Zhou, 2008).
Instruction63.5%
Instructional Staff Support 5.1%
Student Support Services 5.4%
Transportation 4.4%
Educational Research Service1001 North Fairfax Street, Suite 500Alexandria, Virginia 22314www.ers.org
© 2008 by Educational Research Service
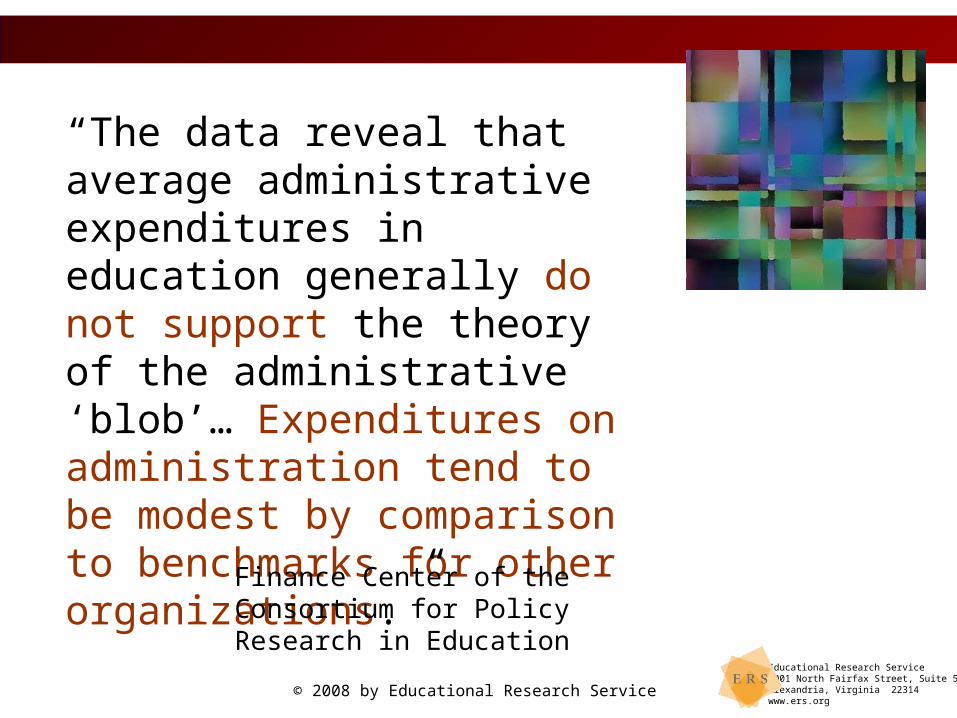
“The data reveal that average administrative expenditures in education generally do not support the theory of the administrative ‘blob’… Expenditures on administration tend to be modest by comparison to benchmarks for other organizations.”
Finance Center of the Consortium for Policy Research in Education
Educational Research Service1001 North Fairfax Street, Suite 500Alexandria, Virginia 22314www.ers.org
© 2008 by Educational Research Service
“Standard & Poor’s analysis of district-level spending and student achievement data in the states that are currently considering a 65 Percent Solution reveals that higher instructional spending allocations are not consistently linked to higher achievement levels.”
Standard & Poor’s, 2005
Educational Research Service1001 North Fairfax Street, Suite 500Alexandria, Virginia 22314www.ers.org
© 2008 by Educational Research Service
What do the facts show?
In the typical school district’s budget, there is little money presently going to administration that could be reallocated to improve other functions or programs.
Elimination of all funds currently directed toward administration would not eliminate the necessity to perform many of the functions currently assigned to the central office.
Educational Research Service1001 North Fairfax Street, Suite 500Alexandria, Virginia 22314www.ers.org
© 2008 by Educational Research Service
What can school leaders do?
Ensure that district and school resources are allocated and used in ways that best support student learning
Address misperceptions about administration so attention is focused on the real problems education is facing

Educational Research Service1001 North Fairfax Street, Suite 500Alexandria, Virginia 22314www.ers.org
© 2008 by Educational Research Service
For More Information ...
1. ERS Concerns in Education: Answering the Critics of School Administration, Second Edition
2. ERS Salaries and Wages Paid Professional and Support Personnel in Public Schools, 2007-08
3. ERS Staffing Patterns in Public School Systems: Current Status and Trends, Update 2008
4. ERS Budgeted Revenues and Expenditures in Public School Systems: Current Status and Trends, Update 2007
Also visit the ERS e-Knowledge Portal at http://portal.ers.org

Educational Research Service1001 North Fairfax Street, Suite 500Alexandria, Virginia 22314www.ers.org
© 2008 by Educational Research Service
Educational Research Service
1001 North Fairfax StreetSuite 500Alexandria, VA [email protected]


