© 2002 Prentice-Hall, Inc. Chap 1-1
Statistics for Managersusing Microsoft Excel
3rd Edition
Chapter 1Introduction and Data Collection
Statistics for Managers using Excel, 3e © 2002 Prentice-Hall, Inc.
Chap 1-2
Chapter Topics
Why a manager needs to know about statistics
The growth and development of modern statistics
Key definitions Descriptive versus inferential statistics

Statistics for Managers using Excel, 3e © 2002 Prentice-Hall, Inc.
Chap 1-3
Chapter Topics
Why data are needed Types of data and their sources Design of survey research Types of sampling methods Types of survey errors
(continued)
Statistics for Managers using Excel, 3e © 2002 Prentice-Hall, Inc.
Chap 1-4
Why a Manager Needs to Know about Statistics
To know how to properly present information
To know how to draw conclusions about populations based on sample information
To know how to improve processes To know how to obtain reliable
forecasts

Statistics for Managers using Excel, 3e © 2002 Prentice-Hall, Inc.
Chap 1-5
The Growth and Development
of Modern StatisticsNeeds of government to collect data on its citizens
The development of the mathematics of probability theory
The advent of the computer
Statistics for Managers using Excel, 3e © 2002 Prentice-Hall, Inc.
Chap 1-6
Key Definitions A population (universe) is the collection of
things under consideration A sample is a portion of the population
selected for analysis A parameter is a summary measure computed
to describe a characteristic of the population A statistic is a summary measure computed to
describe a characteristic of the sample

Statistics for Managers using Excel, 3e © 2002 Prentice-Hall, Inc.
Chap 1-7
Population and Sample
Population Sample
Use parameters to summarize features
Use statistics to summarize features
Inference on the population from the sample
Statistics for Managers using Excel, 3e © 2002 Prentice-Hall, Inc.
Chap 1-8
Statistical Methods
Descriptive statistics Collecting and describing data
Inferential statistics Drawing conclusions and/or making
decisions concerning a population based only on sample data
Statistics for Managers using Excel, 3e © 2002 Prentice-Hall, Inc.
Chap 1-9
Descriptive Statistics
Collect data e.g. Survey
Present data e.g. Tables and graphs
Characterize data e.g. Sample mean =
iX
n
Statistics for Managers using Excel, 3e © 2002 Prentice-Hall, Inc.
Chap 1-10
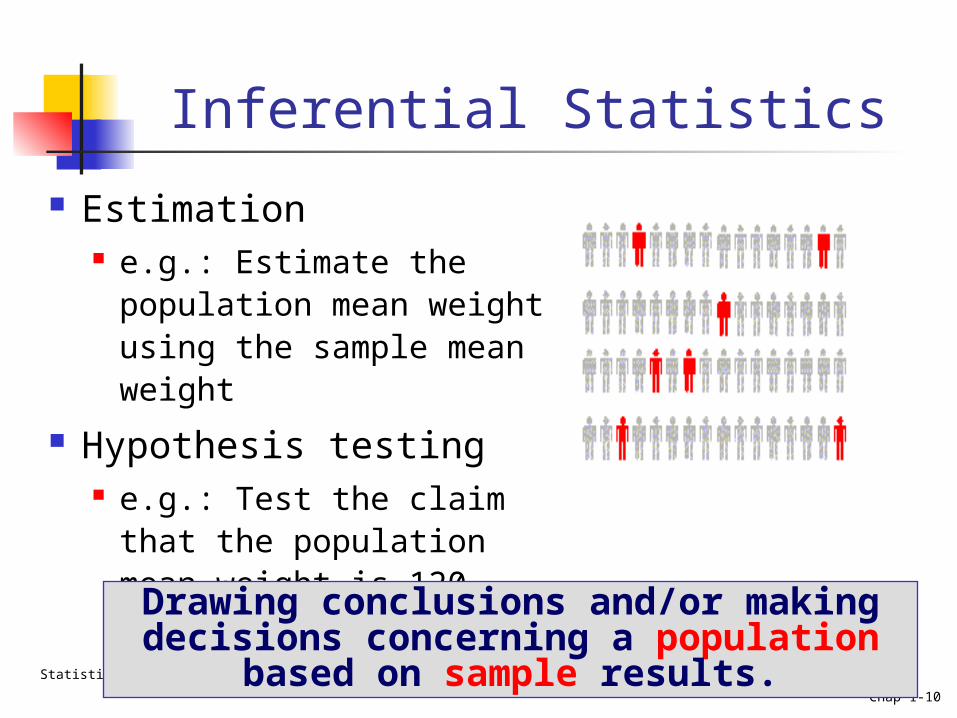
Inferential Statistics
Estimation e.g.: Estimate the
population mean weight using the sample mean weight
Hypothesis testing e.g.: Test the claim that
the population mean weight is 120 poundsDrawing conclusions and/or making decisions concerning a population based on sample results.
Statistics for Managers using Excel, 3e © 2002 Prentice-Hall, Inc.
Chap 1-11
Why We Need Data
To provide input to survey To provide input to study To measure performance of service or
production process To evaluate conformance to standards To assist in formulating alternative
courses of action To satisfy curiosity
Statistics for Managers using Excel, 3e © 2002 Prentice-Hall, Inc.
Chap 1-12
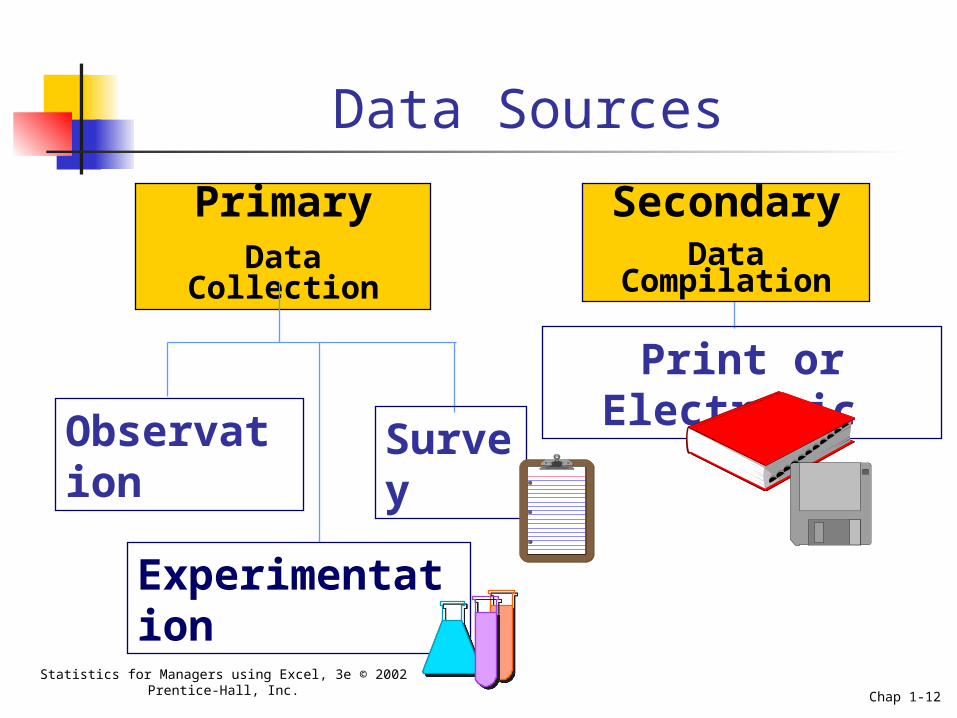
Data Sources
PrimaryData Collection
SecondaryData Compilation
Observation
Experimentation
Survey
Print or Electronic
Statistics for Managers using Excel, 3e © 2002 Prentice-Hall, Inc.
Chap 1-13
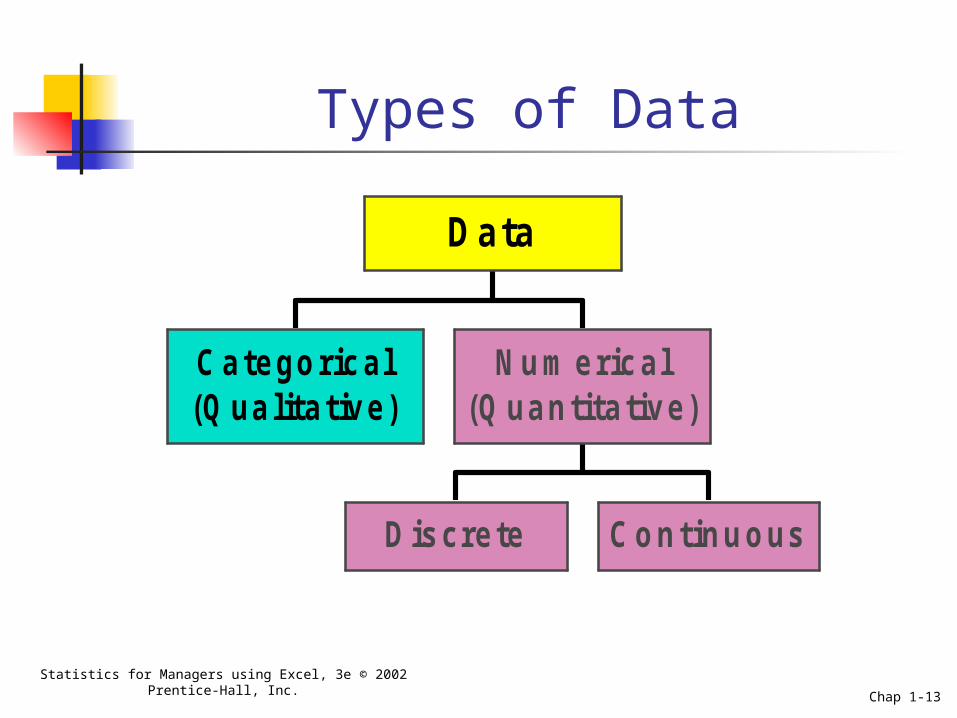
Types of Data
Categorical(Qualitative)
Discrete Continuous
Numerical(Quantitative)
Data
Statistics for Managers using Excel, 3e © 2002 Prentice-Hall, Inc.
Chap 1-14
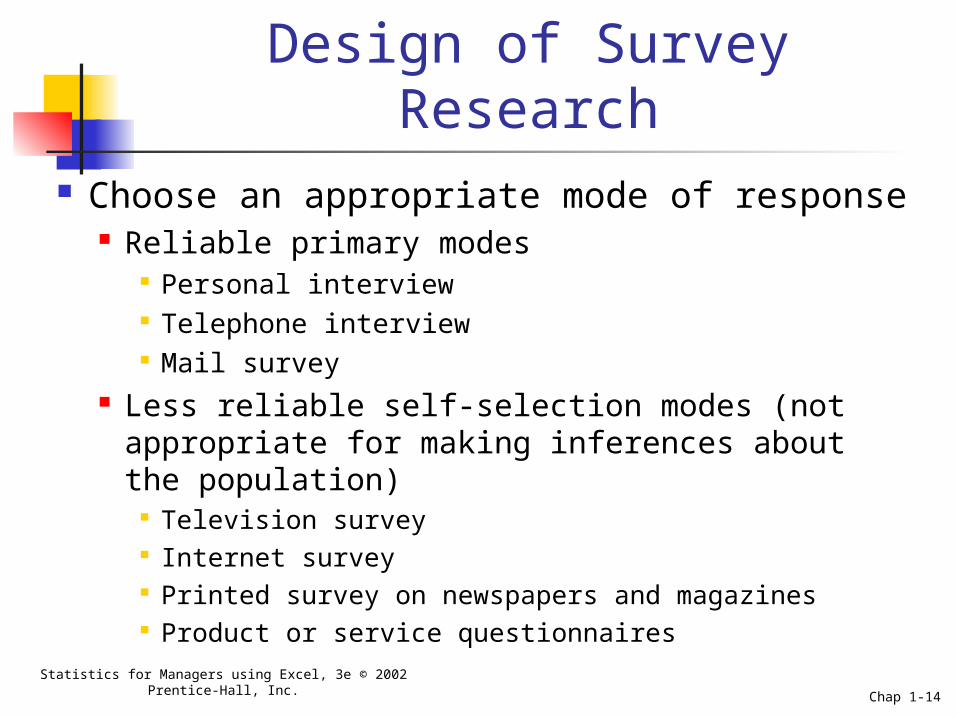
Design of Survey Research Choose an appropriate mode of response
Reliable primary modes Personal interview Telephone interview Mail survey
Less reliable self-selection modes (not appropriate for making inferences about the population)
Television survey Internet survey Printed survey on newspapers and magazines Product or service questionnaires

Statistics for Managers using Excel, 3e © 2002 Prentice-Hall, Inc.
Chap 1-15
Design of Survey Research
Identify broad categories List complete and non-overlapping
categories that reflect the theme Formulate accurate questions
Make questions clear and unambiguous. Use universally-accepted definitions
Test the survey Pilot test the survey on a small group of
participants to assess clarity and length
(continued)
Statistics for Managers using Excel, 3e © 2002 Prentice-Hall, Inc.
Chap 1-16
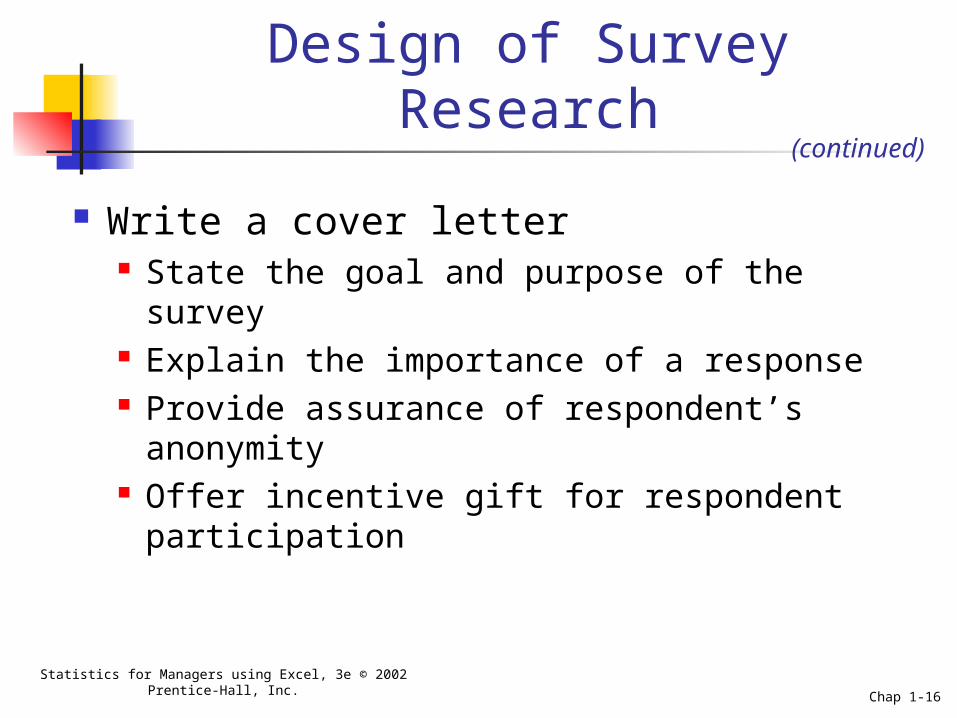
Design of Survey Research
Write a cover letter State the goal and purpose of the survey Explain the importance of a response Provide assurance of respondent’s
anonymity Offer incentive gift for respondent
participation
(continued)

Statistics for Managers using Excel, 3e © 2002 Prentice-Hall, Inc.
Chap 1-17
Reasons for Drawing a Sample
Less time consuming than a census Less costly to administer than a
census Less cumbersome and more
practical to administer than a census of the targeted population
Statistics for Managers using Excel, 3e © 2002 Prentice-Hall, Inc.
Chap 1-18
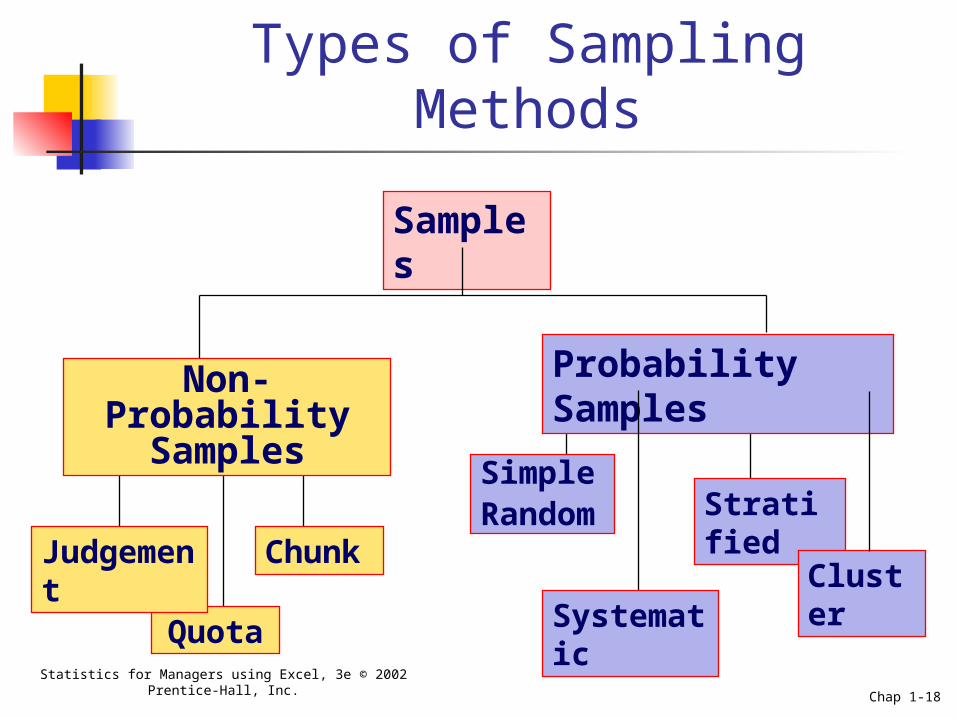
Types of Sampling Methods
Quota
Samples
Non-Probability Samples
Judgement Chunk
Probability Samples
Simple Random
Systematic
Stratified
Cluster
Statistics for Managers using Excel, 3e © 2002 Prentice-Hall, Inc.
Chap 1-19
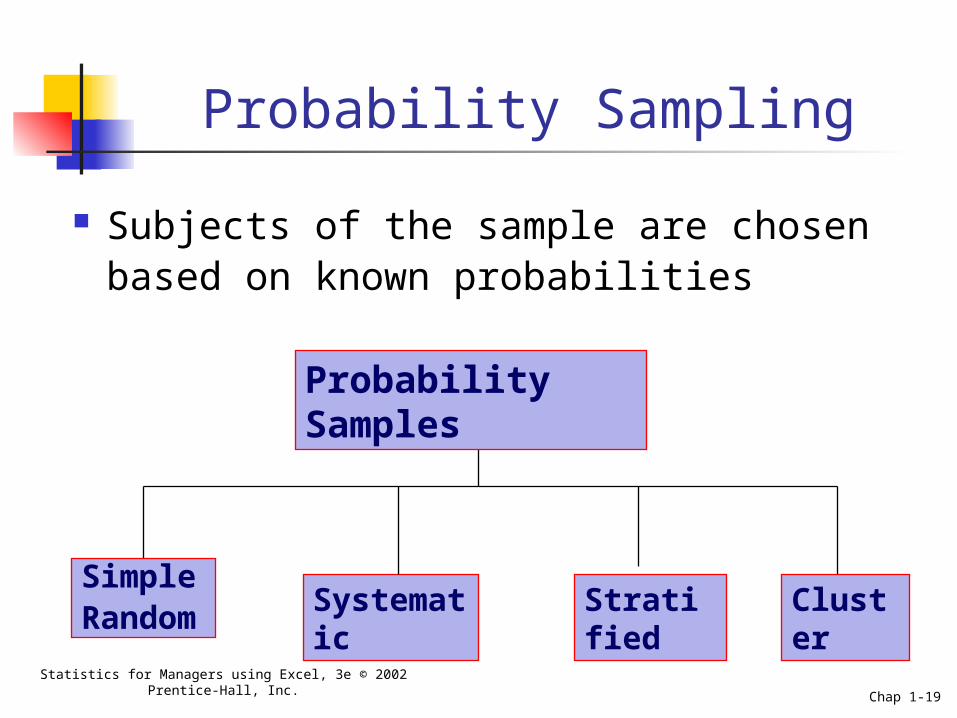
Probability Sampling
Subjects of the sample are chosen based on known probabilities
Probability Samples
Simple Random
Systematic Stratified Cluster

Statistics for Managers using Excel, 3e © 2002 Prentice-Hall, Inc.
Chap 1-20
Simple Random Samples
Every individual or item from the frame has an equal chance of being selected
Selection may be with replacement or without replacement
Samples obtained from table of random numbers or computer random number generators
Statistics for Managers using Excel, 3e © 2002 Prentice-Hall, Inc.
Chap 1-21
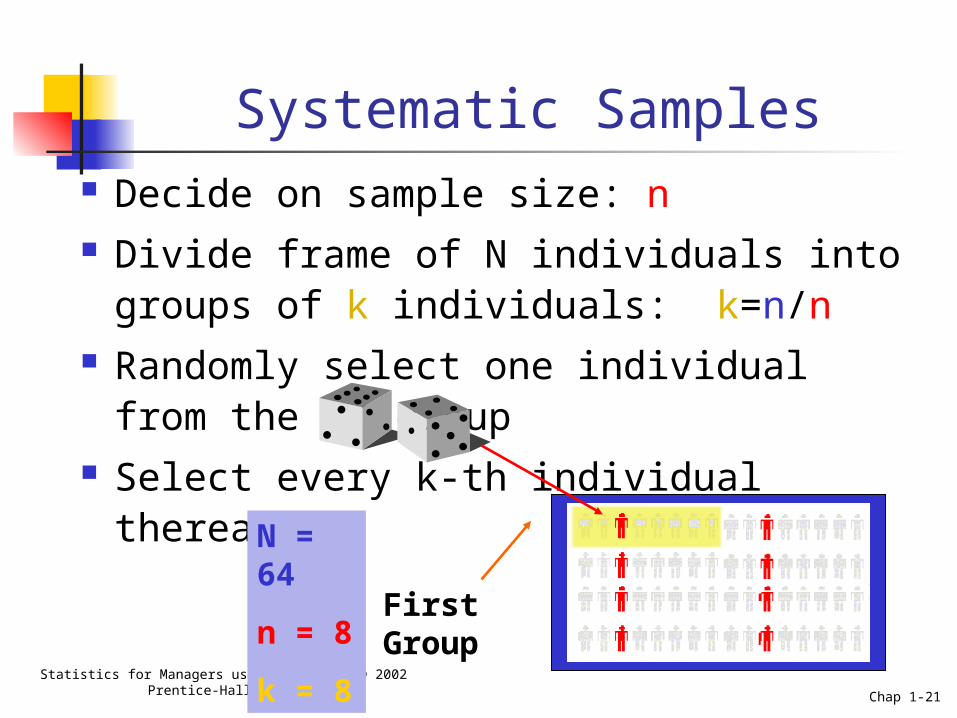
Decide on sample size: n Divide frame of N individuals into groups
of k individuals: k=n/n Randomly select one individual from the
1st group Select every k-th individual thereafter
Systematic Samples
N = 64
n = 8
k = 8
First Group
Statistics for Managers using Excel, 3e © 2002 Prentice-Hall, Inc.
Chap 1-22
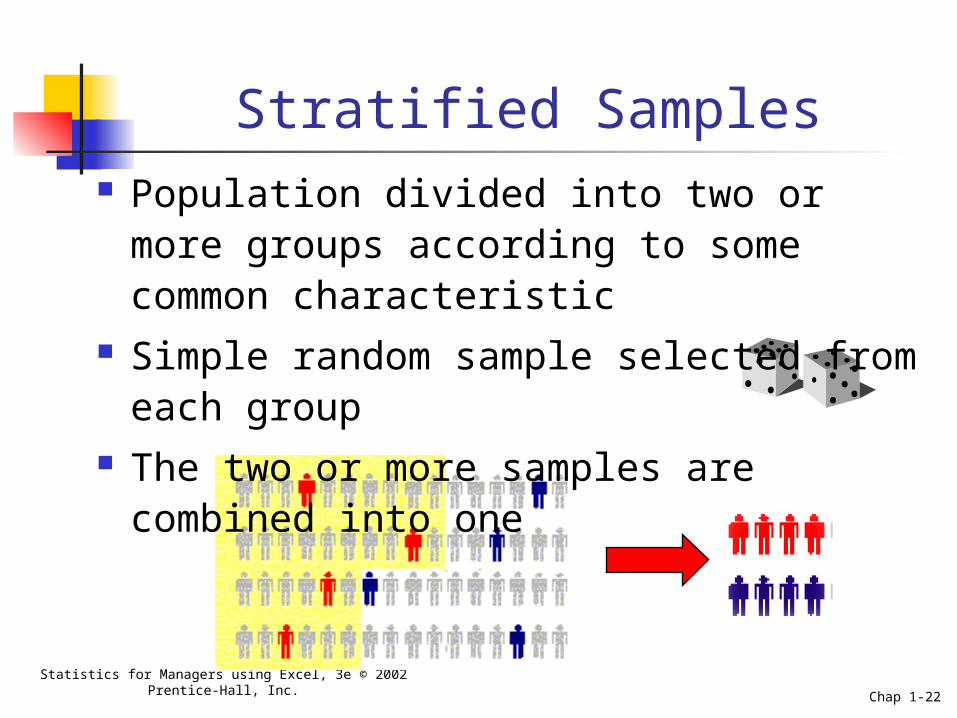
Stratified Samples Population divided into two or more
groups according to some common characteristic
Simple random sample selected from each group
The two or more samples are combined into one
Statistics for Managers using Excel, 3e © 2002 Prentice-Hall, Inc.
Chap 1-23
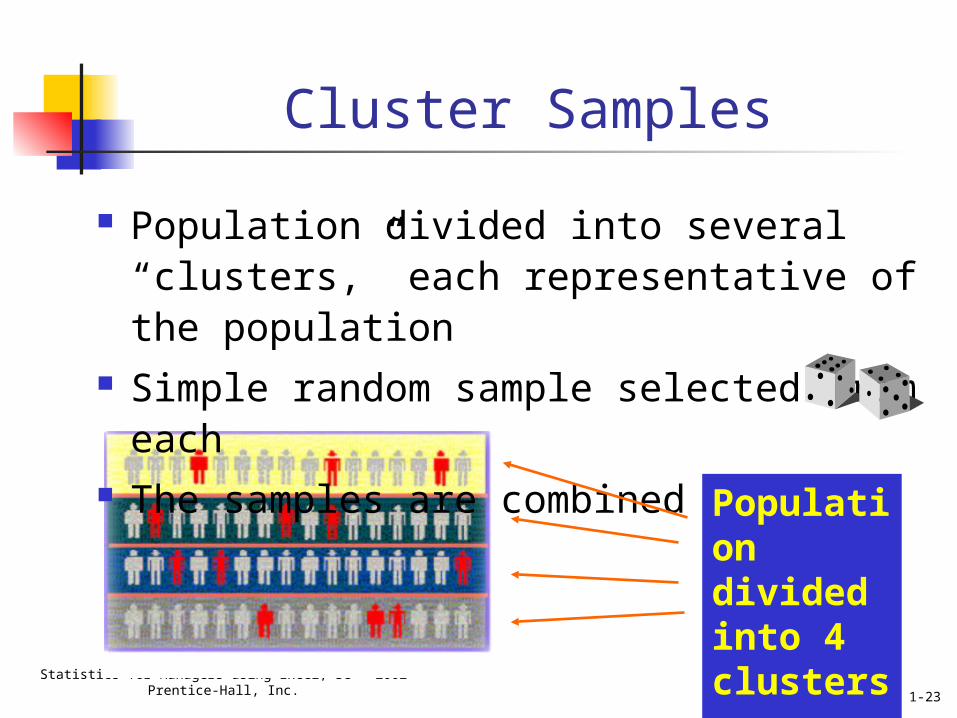
Cluster Samples
Population divided into several “clusters,” each representative of the population
Simple random sample selected from each
The samples are combined into onePopulation divided into 4 clusters.
Statistics for Managers using Excel, 3e © 2002 Prentice-Hall, Inc.
Chap 1-24
Advantages and Disadvantages
Simple random sample and systematic sample Simple to use May not be a good representation of the
population’s underlying characteristics Stratified sample
Ensures representation of individuals across the entire population
Cluster sample More cost effective Less efficient (need larger sample to acquire
the same level of precision)
Statistics for Managers using Excel, 3e © 2002 Prentice-Hall, Inc.
Chap 1-25
Evaluating Survey Worthiness
What is the purpose of the survey? Is the survey based on a probability
sample? Coverage error – appropriate frame Nonresponse error – follow up Measurement error – good questions
elicit good responses Sampling error – always exists

Statistics for Managers using Excel, 3e © 2002 Prentice-Hall, Inc.
Chap 1-26
Types of Survey Errors
Coverage error
Non response error
Sampling error
Measurement error
Excluded from frame.
Follow up on non responses.
Chance differences from sample to sample.
Bad Question!
Statistics for Managers using Excel, 3e © 2002 Prentice-Hall, Inc.
Chap 1-27
Chapter Summary Addressed why a manager needs to
know about statistics Discussed the growth and development
of modern statistics Addressed the notion of descriptive
versus inferential statistics Discussed the importance of data

Statistics for Managers using Excel, 3e © 2002 Prentice-Hall, Inc.
Chap 1-28
Chapter Summary
Defined and described the different types of data and sources
Discussed the design of survey Discussed types of sampling methods Described different types of survey
errors
(continued)


