download the slides for this event
TRANSCRIPT

<#>
© 2010 Morningstar, Inc. All rights reserved.
Portfolios of Everything
× Paul D. Kaplan, Ph.D., CFAQuantitative Research DirectorMorningstar Europe
Sam Savage, Ph.D.Consulting Professor, Management Science & EngineeringStanford University

The History and Economics of Stock Market Crashes
× Chapter in Insights into the Global Financial Crisis, Laurence B. Siegel, ed., CFA Institute, 2009.
× Authors× Paul D. Kaplan, Morningstar Europe× Thomas Idzorek, Ibbotson Associates× Michele Gambera, UBS Global Asset Management× Katusanari Yamaguchi, Ibbotson Associates Japan× James Xiong, Ibbotson Associates× David M. Blanchett, MBA Candidate, Chicago Booth School

“Black Sunday,” 14 September 2008

The Black Swan
× An event that is inconsistent with past data but that happens anyway

Gray Swans
× “Events of considerable nature which are far too big for the bell curve, which are predictable, and for which one can take precautions”Benoit Mandelbrot (inventor of fractal geometry)

“We seem to have a once-in-a-lifetimecrisis every three or four years.”
Leslie RahlFounder of Capital Market Risk Advisors
Source: Christopher Wright, “Tail Tales,” CFA Institute Magazine, March/April 2007

The Black Turkey
× “An event that is entirely consistent with past data but that no one thought would happen” Larry Siegel
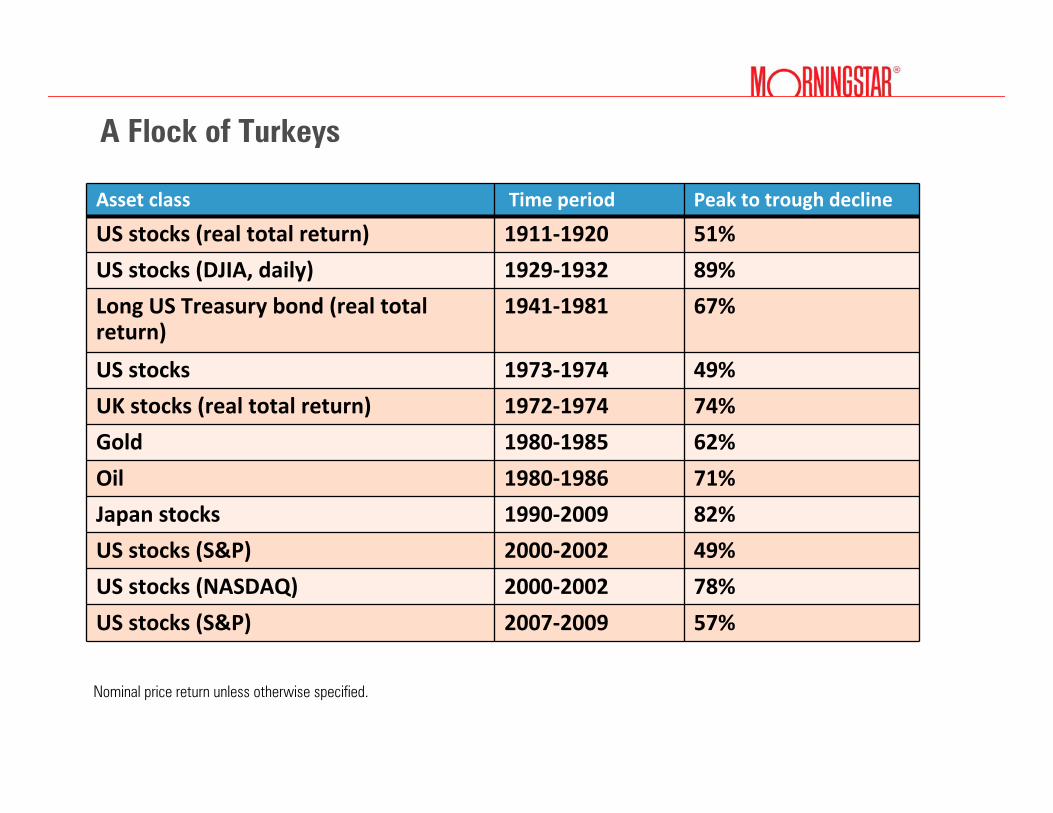
A Flock of Turkeys
Asset class Time period Peak to trough decline
US stocks (real total return) 1911‐1920 51%
US stocks (DJIA, daily) 1929‐1932 89%
Long US Treasury bond (real total return)
1941‐1981 67%
US stocks 1973‐1974 49%
UK stocks (real total return) 1972‐1974 74%
Gold 1980‐1985 62%
Oil 1980‐1986 71%
Japan stocks 1990‐2009 82%
US stocks (S&P) 2000‐2002 49%
US stocks (NASDAQ) 2000‐2002 78%
US stocks (S&P) 2007‐2009 57%
Nominal price return unless otherwise specified.

U.K. Stock Market History, 1900-2009

Largest Declines in U.K. Stock Market History, 1900-2009Real Total Returns
Post-World War II correction195421.3019521946
First part of Great Depression193330.5719311928
“Black Monday,” 19 Oct 1987Nov 199234.07Nov 1987Sep 1987
Speculation in currencies; Bretton Woods
Apr 197235.80May 19701968
Crash of 2007−2009; global financial crisis
TBD40.99Feb 2009Oct 2007
Second part of Great Depression; World War II
194643.7119401936
Information technology bubble and collapse
Apr 200744.91Jan 2003Dec 1999
World War I192245.8519201913
Oil shockJan 198473.81%Nov 1974Apr 1972
Event(s)RecoveryDeclineTroughPeak

October 1987 Stock Market Total Return (% U.S. Dollars)

Largest Peak-to-Trough Declines in 8 Countries Since 1969Month-end results as of May 2009 in inflation-adjusted local currency
Country Peak Trough Decline Recovery
Spain April 1973 April 1980 85.36% December 1996Italy January 1970 December 1977 82.58% March 1986U.K. April 1972 November 1974 73.81% January 1984Japan December 1989 April 2003 70.33% To Be Determined
Germany February 2000 March 2003 69.44% To Be DeterminedFrance August 2000 March 2003 60.52% To Be DeterminedCanada February 1980 June 1982 51.38% March 1986U.S. December 1999 February 2009 54.84% To Be Determined
Source: Morningstar EnCorr,, MSCI Barra, International Monetary Fund

Drawdowns Around the World, January 1988-June 2009

Bases on monthly inflation-adjusted returns on the MSCI UK Gross Return index : January 1926 −May 2009Source: Morningstar EnCorr, MSCI Barra, and International Monetary Fund
Cracks in the Bell Curve: The UK
-28% -18% -8% 2% 12% 22% 32% 42% 52%
Monthly Return
Lognormal Historical
1
24
8
1632
64128Historical Frequency (Months)
Jan-75

Covariation of Returns: Linear or Nonlinear?S&P 500 vs. EAFE, Monthly Total Returns: Jan. 1970 – Oct. 2009

Investment Horizon: One Period or Longer?
Payout from $1 investment for 3 choices

Meet the Choices
A B C
Source: William Poundstone, Fortune’s Formula, Hill and Wang 2005, p. 198.

Meet the Choices
A B C

Meet the Choices
A B C
Kelly Criterion:Rank Alternatives by Geometric Mean

Why the Kelly Criterion WorksCumulative Probability Distribution after Reinvesting 12 Times

Building A Better Optimizer
Conditional Value at RiskStandard DeviationRisk Measure
Multiperiod (Kelly Criterion)Geometric Mean
Single PeriodArithmetic Mean
Investment Horizon
Scenarios+SmoothingNonlinear (e.g. options)
Correlation MatrixLinear
Return Covariation
Scenarios+Smoothing(Fat tails possible)
Mean-Variance Framework(No fat tails)
Return Distributions
Markowitz 2.0Markowitz 1.0Issue

Scenario Approach to Modeling Return Distributions
3%
-2%
11%
4%
Real Estate Return
3.9%0%6%High Inflation, High Growth
4
-9.8%-8%-12%High Inflation, Low Growth
3
11.9%6%15%Low Inflation, High Growth
2
4.6%4%5%Low Inflation, Low Growth
1
60/30/10Mix
Bond Market Return
Stock Market Return
Economic Conditions
Scenario #
In practice, 1,000 or more scenarios typical so that fat tails and nonlinear covariations adequately modeled

Smoothing
× Each scenario return a randomly chosen mean of a normal distribution
× Normal components maintain correlation structure of scenario model
× Resulting distributions smooth curves× Richer set of outcomes than
scenario returns alone× Desirable mathematical
properties

Risk Measurement
× Value at Risk (VaR) describes the tail in terms of how much capital can be lost over a given period of time
× A 5% VaR answers a question of the form× Having invested 10,000 euros, there is a 5% chance of losing
X euros in T months. What is X?× Conditional Value at Risk (CVaR) is the expected loss of capital should
VaR be breached× CVaR>VaR× VaR & CVaR depend on the investment horizon

Worst 5th Percentile95% of all returns are better5% of all returns are worse
∞ Worst 1st Percentile99% of all returns are better1% of all returns are worse
VaR identifies the return at a specific point (e.g. 1st or 5th percentile)
Value-at-Risk (VaR)

Conditional Value-at-Risk (CVaR)
Worst 5th Percentile95% of all returns are better5% of all returns are worse
∞
CVaR identifies the probability weighted return of the entire tail

CVaR vs. VaR
∞
Notice that different return distributions can have the same VaRs, but different CVaRs
Worst 5th Percentile95% of all returns are better5% of all returns are worse

Minimizing Conditional Value at Risk

The Markowitz 2.0 Efficient Frontier

Scenario Libraries for Asset Allocation
3%0%6%High Inflation, High Growth
4
-2%-8%-12%High Inflation, Low Growth
3
11%6%15%Low Inflation, High Growth
2
4%4%5%Low Inflation, Low Growth
1
Real Estate Return
Bond Market Return
Stock Market Return
Economic Conditions
Scenario #
Stock Expert
BondExpert
R.E. Expert
Coherent Scenario Library
