downhole measurements of shear- and compression … redpath geophysics and ut had acquired...
TRANSCRIPT

PNNL-16559
Downhole Measurements of Shear- and Compression-Wave Velocities in Boreholes C4993, C4996, C4997 and C4998 at the Waste Treatment Plant DOE Hanford Site B. B. Redpath April 2007 Prepared by Redpath Geophysics for the Pacific Northwest National Laboratory Under Contract DE-AC05-76RL01830 With the U.S. Department of Energy

Downhole Measurements
of
Shear- and Compression-Wave Velocities
in
Boreholes C4993, C4996, C4997 and C4998
at the
Waste Treatment Plant
DOE Hanford Site
April 2007
by
Bruce B. Redpath
Redpath Geophysics
P.O. Box 540 Murphys, California 95247
209-728-3705 [email protected]

iii
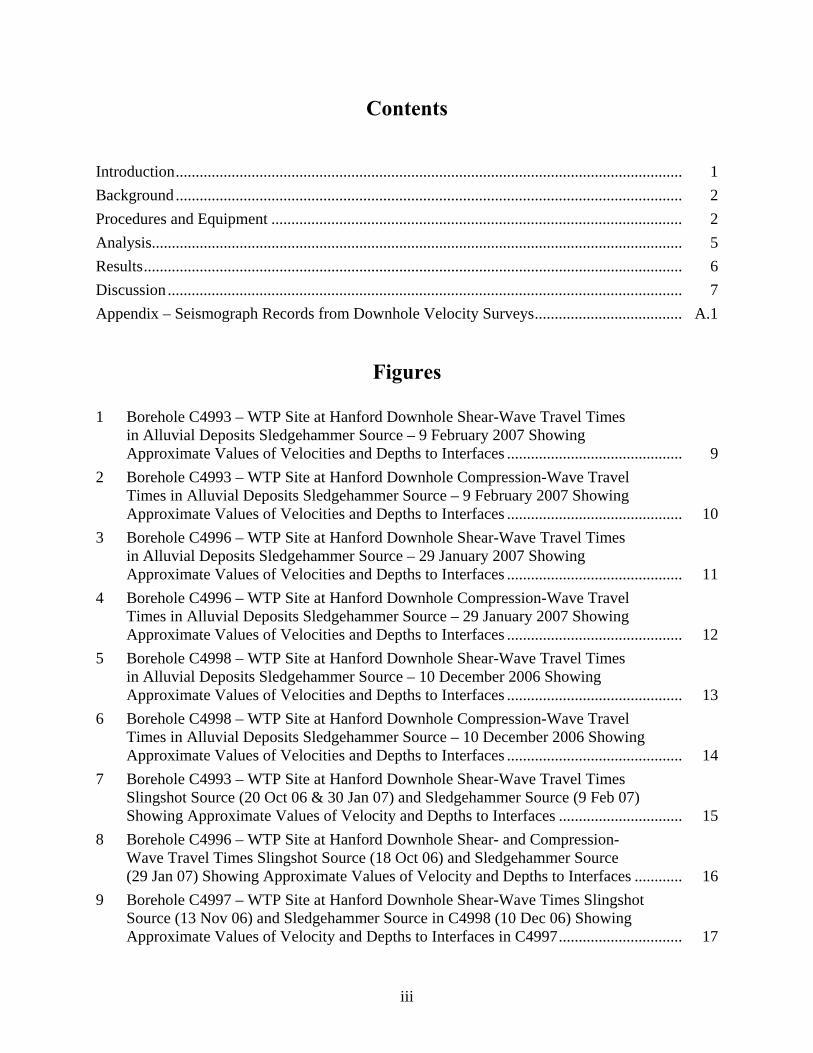
Contents Introduction............................................................................................................................... 1 Background............................................................................................................................... 2 Procedures and Equipment ....................................................................................................... 2 Analysis..................................................................................................................................... 5 Results....................................................................................................................................... 6 Discussion................................................................................................................................. 7 Appendix – Seismograph Records from Downhole Velocity Surveys..................................... A.1
Figures 1 Borehole C4993 – WTP Site at Hanford Downhole Shear-Wave Travel Times
in Alluvial Deposits Sledgehammer Source – 9 February 2007 Showing Approximate Values of Velocities and Depths to Interfaces ............................................ 9
2 Borehole C4993 – WTP Site at Hanford Downhole Compression-Wave Travel Times in Alluvial Deposits Sledgehammer Source – 9 February 2007 Showing Approximate Values of Velocities and Depths to Interfaces ............................................ 10
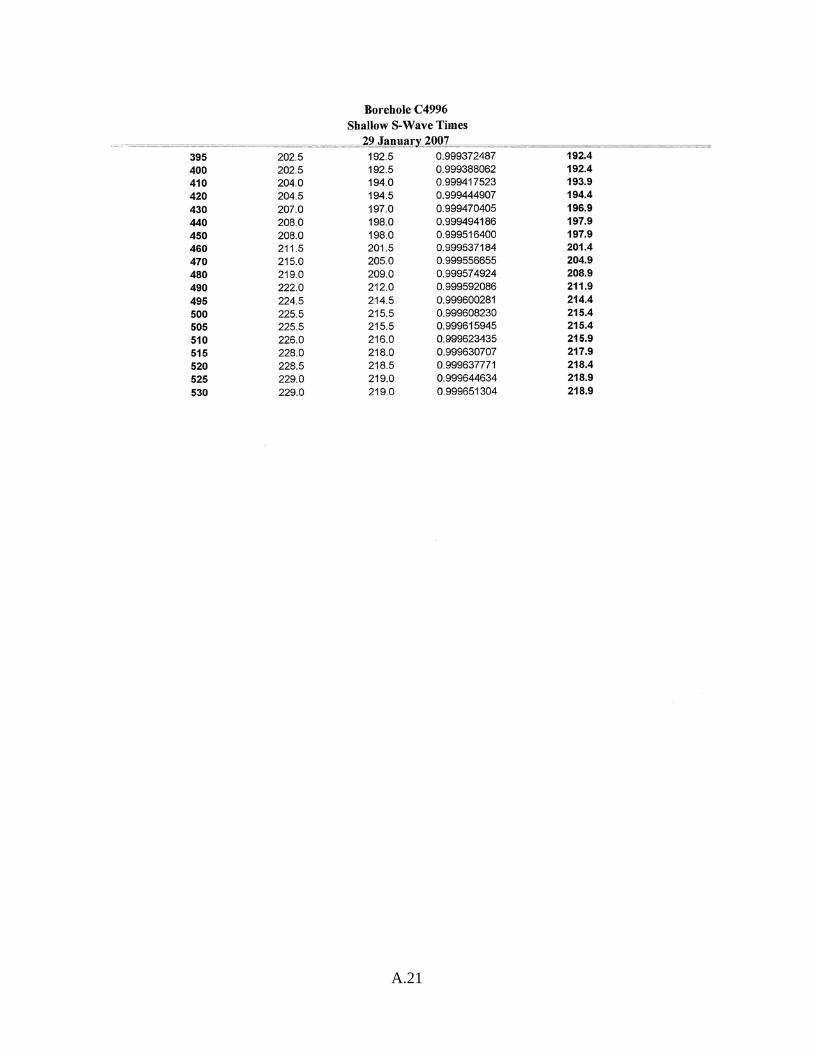
3 Borehole C4996 – WTP Site at Hanford Downhole Shear-Wave Travel Times in Alluvial Deposits Sledgehammer Source – 29 January 2007 Showing Approximate Values of Velocities and Depths to Interfaces ............................................ 11
4 Borehole C4996 – WTP Site at Hanford Downhole Compression-Wave Travel Times in Alluvial Deposits Sledgehammer Source – 29 January 2007 Showing Approximate Values of Velocities and Depths to Interfaces ............................................ 12
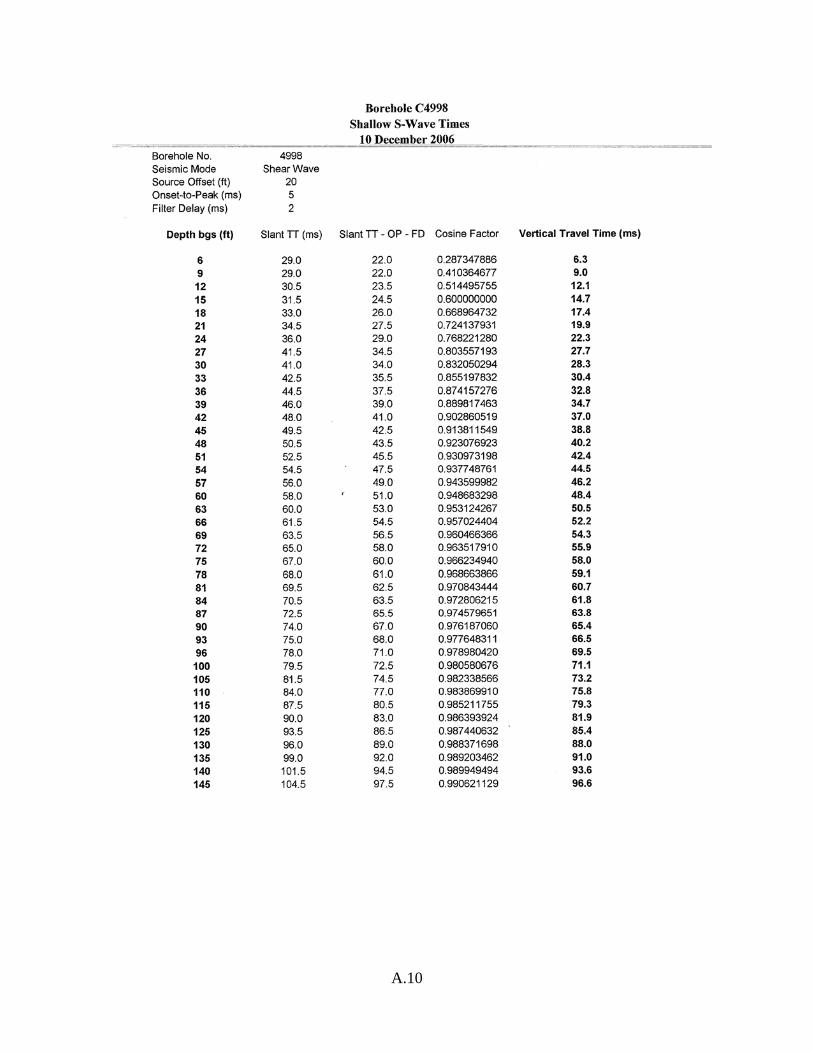
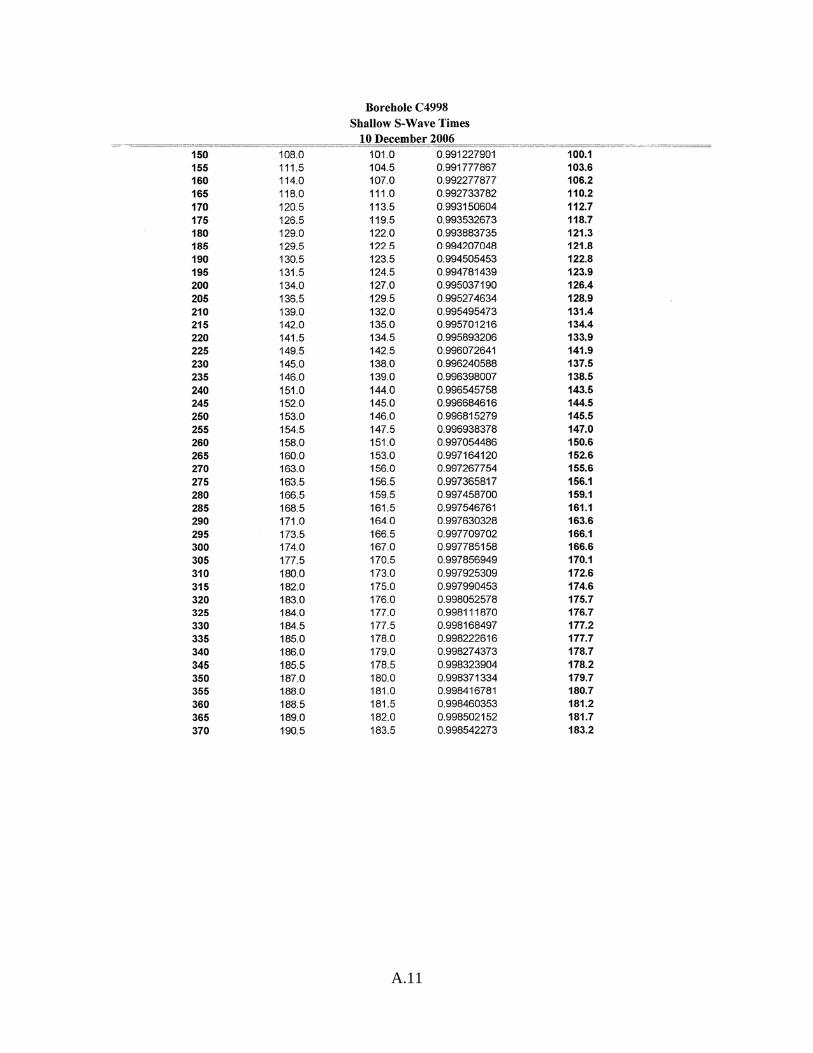
5 Borehole C4998 – WTP Site at Hanford Downhole Shear-Wave Travel Times in Alluvial Deposits Sledgehammer Source – 10 December 2006 Showing Approximate Values of Velocities and Depths to Interfaces ............................................ 13
6 Borehole C4998 – WTP Site at Hanford Downhole Compression-Wave Travel Times in Alluvial Deposits Sledgehammer Source – 10 December 2006 Showing Approximate Values of Velocities and Depths to Interfaces ............................................ 14
7 Borehole C4993 – WTP Site at Hanford Downhole Shear-Wave Travel Times Slingshot Source (20 Oct 06 & 30 Jan 07) and Sledgehammer Source (9 Feb 07) Showing Approximate Values of Velocity and Depths to Interfaces ............................... 15
8 Borehole C4996 – WTP Site at Hanford Downhole Shear- and Compression- Wave Travel Times Slingshot Source (18 Oct 06) and Sledgehammer Source (29 Jan 07) Showing Approximate Values of Velocity and Depths to Interfaces ............ 16
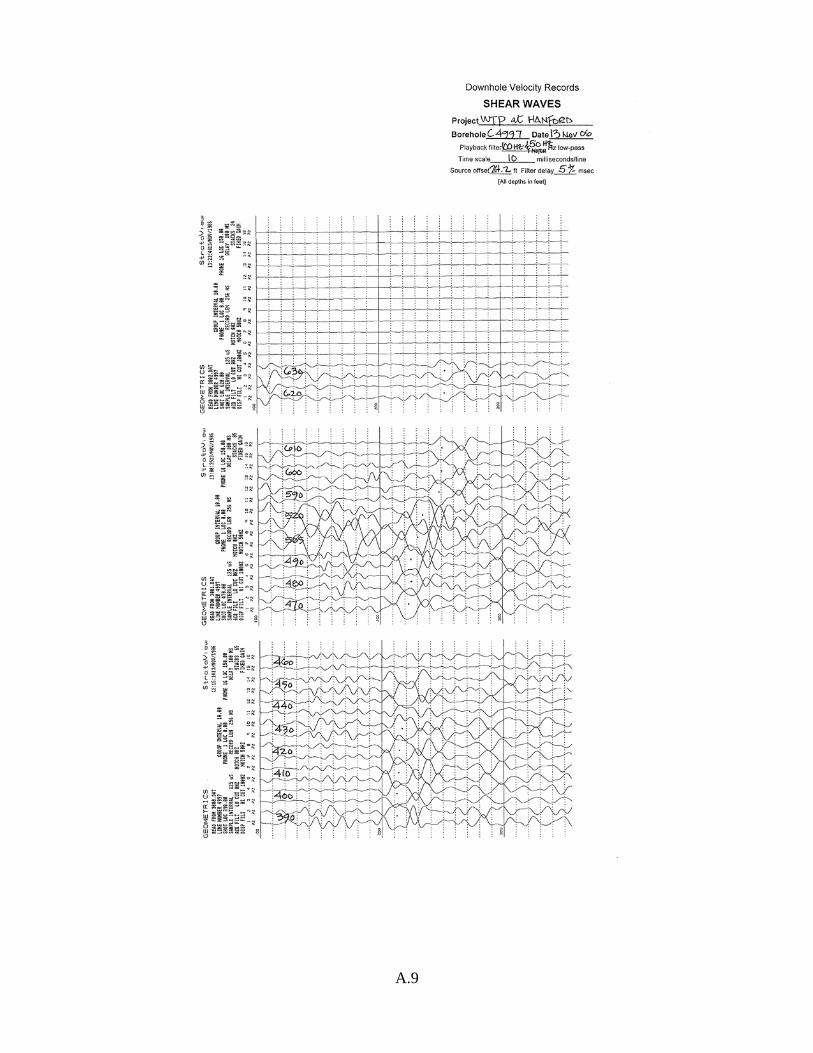
9 Borehole C4997 – WTP Site at Hanford Downhole Shear-Wave Times Slingshot Source (13 Nov 06) and Sledgehammer Source in C4998 (10 Dec 06) Showing Approximate Values of Velocity and Depths to Interfaces in C4997............................... 17

iv
10 Overlay of Shallow Shear-Wave Downhole Times in C4998, C4996 & C4993 C4998 Times Plotted as Measured C4996 Times Reduced by 6 msec & C4993 Times Reduced by 12 msec Showing Approximate Values of Velocities........................ 18
11 Overlay of Shallow Compression-Wave Downhole Times in C4998, C4996 & C4993 C4998 Times Plotted as Measured C4996 Times Reduced by 2 msec & C4993 Times Reduced by 4 msec Showing Approximate Values of Velocities .............. 19
12 Boreholes C4993, C4996 & C4998 – WTP Site at Hanford Shallow Downhole Shear-Wave Velocities Sledgehammer Source................................................................. 20
13 Boreholes C4993, C4996 & C4998 – WTP Site at Hanford Shallow Downhole Compression-Wave Velocities Sledgehammer Source..................................................... 21
14 Boreholes C4993, C4996 & C4998 – WTP Site at Hanford Individual and Average Shallow Downhole Shear-Wave Velocities Sledgehammer Source .................. 22
15 Boreholes C4993, C4996 & C4998 – WTP Site at Hanford Individual and Average Shallow Downhole Compression-Wave Velocities Sledgehammer Source ...... 23
Tables 1 Downhole Measurements Made in Seismic Boreholes..................................................... 1 2 Summary of Velocities Measured in Downhole Surveys at the WTP Site....................... 8

1
Downhole Measurements of
Shear- and Compression-Wave Velocities in
Boreholes C4993, C4996, C4997 and C4998 at the
Waste Treatment Plant DOE Hanford Site
April 2007
Introduction
This report describes the procedures and the results of a series of downhole measurements of shear- and compression-wave velocities performed as part of the Seismic Boreholes Project at the site of the Waste Treatment Plant (WTP). The measurements were made in several stages from October 2006 through early February 2007. Although some fieldwork was carried out in conjunction with the University of Texas at Austin (UT), all data acquired by UT personnel are reported separately by that organization. The UT measurements were made using the university’s large, electrohydraulic, triaxial vibrator (‘T-Rex’) as the energy source for both shear and compression waves. The measurements presented in this report were made using a sledgehammer or an accelerated-weight impact source (the ‘Slingshot’ source). The equipment and resulting data are described and discussed in this report. The scope of work is shown in chronological order in Table 1. A full description of all procedures, equipment calibration, experimental setups, and seismograph files, together with some results, are contained in a separate Scientific Notebook that was compiled as the fieldwork progressed.
Table 1. Downhole Measurements Made in Seismic Boreholes
Borehole
Casing
Depth Range (ft)
Survey Mode
Source
Date
C4996 Uncased 355 to 650 Shear Slingshot 18 Oct 06 C4993 Uncased 350 to 570 Shear Slingshot 20 Oct 06 C4997 Uncased 390 to 610 Shear Slingshot 13 Nov 06
C4998 PVC 3 to 370 Shear and Compression Sledgehammer 10 Dec 06
C4996 PVC 3 to 530 Shear and Compression Sledgehammer 29 Jan 07
C4993 Stainless 340 to 742 Shear Slingshot 30 Jan 07
C4993 Stainless 3 to 400 Shear and Compression Sledgehammer 9 Feb 07

2
Background This work was part of a comprehensive measurement program intended to define the dynamic characteristics of the rocks and soils beneath the WTP site, which, in turn, were to be used in developing a reliable estimate of the site’s earthquake response. Although the existence of soft interbeds between basalt flows was well known, there was virtually no information about the properties of these interbeds. The program was based on drilling three large-diameter holes and one core hole to a depth of approximately 1400 ft. The site is underlain by approximately 350 ft of alluvial deposits, below which is the sequence of basalts and interbeds. Carbon-steel casing was installed to the top of the first basalt (Elephant Mountain) in the three large-diameter holes, and the presence of this casing precluded using a constant-azimuth geophone, with its internal electronic compass, to obtain meaningful velocity measurements in the alluvium. After Redpath Geophysics and UT had acquired measurements in the uncased portion of the holes below the alluvium, the carbon-steel casing was pulled and replaced with grouted-in-place PVC casing in one of the large holes (C4996) and in the corehole (C4998); UT made no measurements in the corehole. Nonmagnetic stainless steel casing was installed in a second large-diameter hole (C4993). Excellent downhole velocity data were eventually acquired in the alluvium in these three holes. Earlier attempts had been made in June 2006 to collect velocity information in the interbeds by entering two existing steel-cased boreholes (DB4 and DB14) located several miles from the WTP site. These efforts were not successful, but they did provide extremely important information about the characteristics and operation of new, untested geophysical equipment. This information was crucial to the success of the downhole velocity measurements at the WTP site. Procedures and Equipment The standard procedure for a downhole velocity survey is to measure the travel times of signals from an impulsive source of energy at the surface to a sequence of measurement points in the borehole. The corresponding plot of travel time versus depth is then converted to velocity versus depth by computing slopes of the interpreted major straight-line segments of the plotted data. We used two types of shear-wave sources. In every survey, the shear-wave sources were oriented magnetic north-south. This was done to simplify alignment of the fluxgate compass inside the downhole transducers. The first type of source was a 16-lb sledgehammer striking the ends of a 6-in. × 6-in. wood beam, 7 ft long, with steel ends caps and cleats on the bottom. The front wheels of a vehicle, typically a pickup truck, were driven up onto the beam to hold it in firm contact with the ground. The sledgehammer has an impact sensor attached to its handle near the head that generates a zero-time signal for the seismograph. This source was used for all surveys in the alluvial deposits and gave excellent signals to a depth of 530 ft in C4996. The second source, called the Slingshot source, was simply a larger, heftier version of the sledgehammer-and-beam source. The larger beam consists of five 4-in. × 6-in. wood beams bolted together for a total width of 18 in. and a length of 7.5 ft. Both ends of the beam are capped by thick steel plates, and the underside of the beam has 12 evenly spaced cleats bolted to

3
it. The total weight of the beam is about 350 lb.; the front wheels of a heavy vehicle were driven up on to the beam. Each end of the beam was impacted by an accelerated-weight mechanism obtained from GeoSurvey Systems (Houston, Texas). The weights are 3.5-in.-diameter, 36-in.-long, 100-lb steel rods that slide in a guide and are driven by pre-tensioned 0.5-in. × 3-in. elastic bands. The elastic bands are stretched, and the weight is ‘cocked,’ by a double-acting hydraulic cylinder with a stroke of 16 in. At the end of the stroke, the weight is released and is accelerated by the elastic band to impact the end of the beam. A Slingshot source is positioned at each end of the beam, and an impact sensor is attached at the center of the beam. In tests conducted prior to the attempted surveys in the DB boreholes in June 2006, the velocity of the accelerated weight was measured at 20 ft/sec, so that the kinetic energy is approximately 20,000 ft-lb., which is about 6 times greater than that of a 16-lb sledgehammer swung with moderate force. For the surveys in the alluvial deposits, compression waves were generated by vertical sledgehammer blows to a metal plate on the ground surface. The downhole sensor was a Model BHG-3 geophone manufactured by Geostuff (Grass Valley, California). The sensor package contains an orthogonal array of three 10-Hz geophones, mounted on a gearhead-motor assembly, and a fluxgate compass. A servo circuit links the compass to the motor so that the horizontal geophones can be aligned to a constant, pre-determined azimuth at each measurement point. This allows one of the two horizontal geophone elements to stay aligned with the shear-wave source on the ground surface as the sensor package is raised or lowered in the borehole. This capability ensures that the detected shear-wave signal is always the optimum. Magnetometer/gyroscope surveys in the three large boreholes showed that the magnetic declination in the basalts did not vary by more than about 15º from that at the ground surface. Compression waves are detected by the vertical geophone element. In the large-diameter (8-in. nominal) uncased holes, the BHG-3 was mechanically locked to the borehole wall with a rigid arm that was extended by an electric motor inside the BHG-3. The arm can be extended and retracted by operating the control box for the transducer. The motor current is monitored with an analog meter to determine whether the arm is encountering mechanical resistance. Operation of the arm in the uncased holes, especially in the soft interbeds that were frequently washed out to a larger diameter, was problematical, and on two occasions the arm was severely damaged for reasons that are not entirely clear. When acquiring downhole signals in the smaller-diameter cased holes, the rigid arm on the BHG-3 is replaced with a bow-spring that runs along the length of the transducer; the bow-spring is extended and retracted by the same motor that actuates the rigid arm. The motor current is monitored to gauge the clamping force of the spring. When working in shallow holes, generally 500 ft or less, the rubber-jacketed transducer cable can be raised and lowered by hand. Our normal procedure when working in shallow cased holes is to lower the BHG-3 to a depth of 400 ft, extend the spring until it will hold the transducer from sliding down the hole when the cable is slackened, and then work upward by simply dragging the BHG-3 to the desired measurement point. This expedites the flow of data collection and reduces wear and tear on the clamping mechanism. Because the weight of the manhandled transducer cable becomes a hindrance below 400 ft, we operate in a measure-release-lower-clamp-slacken-
4
measure sequence at depths greater than 400 ft. This system and procedure, which requires only a 12-V automobile battery for power, was used with success in all of the shallow cased holes in alluvium. For the deeper surveys, and for all the surveys in the uncased holes, a Model WW1500 geophysical logging winch (Aries Industries, Fresno, California) was used to operate the BHG-3 transducer. The winch drum contains 1500 ft of 5/16-in., 7-conductor armored cable (Rochester Dataline™ 7-H-314A; The Rochester Corporation). The winch motor operates on 110 V AC, as does a dual DC-power system that provides 60 V DC for the clamping motor in the BHG-3 and 30 V DC to operate the fluxgate compass and its associated servo motor. Higher voltages are needed to operate the BHG-3 over the wireline cable because its electrical resistance is higher than that of the rubber-jacketed cable. A 2000-W Honda EU2000i portable generator furnished the overall system power. At the request of UT, we fabricated a relay module that allowed us to operate two BHG-3 downhole sensors using only the 7 conductors in the winch cable and its armored sheath. Two BHG-3s could be suspended at the end of the winch cable at a fixed interval, say 50 ft, and their respective clamping motors and compasses could be operated independently. Simultaneous signals from two longitudinal geophones (i.e., the ones aligned with the shear-wave source) or from the two vertical geophones could be recorded. This dual-sensor system was used only in the early stages of the program, after which it was decided that it was not needed. All subsequent measurements using the winch were made using only a single BHG-3 geophone. Careful attention is given to the polarity of the shear-wave signals when using the BHG-3 transducer. The system is configured so that at each measurement point, the first blow to the beam produces a shear wave for which the initial deflection (the first peak) of the seismograph trace is always upward (i.e., toward the top of the paper record). At each successive measurement point, the same end of the beam (the north end) is always struck first and the resulting signals recorded on an odd-numbered channel. The signals from blows to the other end of the beam (the south end) are then recorded on the adjacent even-numbered channel. Ideally, the signals from the north and south ends are nearly mirror images of one another and, when viewed as adjacent channels, help in identifying and tracking the shear wave with changing depth. When applicable, compression-wave signals from hammer blows to the steel plate are detected while at the same depth and recorded on an appropriate channel on the seismograph. All signals were recorded with a Geometrics Model R24 Strataview™ digital seismograph (Geometrics, Inc., San Jose, California) configured to record as many as 24 channels of data. During the initial surveys in the uncased holes using the Slingshot source, each channel consisted of 2048 samples collected at a rate of 125 microseconds per sample with a 100-millisecond delay between the zero time and the start of recording. For the alluvium surveys, each channel consisted of 1024 samples collected at a rate of 250 microseconds with no delay. The R24 has the capability of ‘stacking’ or adding the signals from multiple hammer blows to increase the signal-to-noise ratio of the downhole recordings. In the worst case, as many as eight hammer blows of the Slingshot source would be stacked, but more typically only two to four were required. A switchbox was used that allowed the geophone signals from an impact to one end of the shear-wave beam to be routed to odd-numbered channels, and signals generated by blows to the other

5
end to be routed to the adjacent even-numbered channels. For the surveys in the alluvium, the shear waves were routed sequentially to channels 1 through 16, and the compression waves were routed to channels 17 through 24. In general, the data are collected channel-by-channel until all of the active channels have been recorded or until the survey is complete, at which time the signals are transferred to a hard disk drive and printed on the R24’s internal printer for field examination. Signals are also displayed on the seismograph LCD screen as they are acquired.
Analysis
The raw, unfiltered signals acquired in a velocity survey are transferred directly to the hard disk drive on the seismograph; any filtering is applied only during playback. In general, filters are employed to suppress noise or interference that may be superimposed on a shear- or compression-wave signal. The sources of interference are not always apparent but may include mechanical noise from nearby traffic or structures, multiple travel paths of the downward traveling pulse, reverberations and reflections due to changes in acoustic impedance at the stratigraphic boundaries, and questionable coupling of the casing to the surrounding material. The frequency range of a typical shear wave is approximately 30 Hz to 70 Hz. As the pass band of a filter becomes more restrictive, it also diminishes the amplitude of the signal along with that of the interference. It is often a matter of judgment how much filtering to apply to the raw signals, and this judgment is guided by inspection of the raw recorded signals. As a general rule, the less filtering, the better. Filtering was accomplished by using the digital filters built into the operating system of the R24 seismograph. A 100-Hz low-pass was used for the deeper surveys in the uncased holes and the stainless-cased lower part of C4993; a 200-Hz low-pass was applied to all of the shear-wave signals in the shallower, alluvium surveys; and a 400-Hz low-pass was used for all compression-wave surveys. The R24 filters are not zero-phase and introduce a small time shift in the signals but, as explained below, this shift is accounted for in the analysis. Copies of complete sets of the filtered downhole signals are provided in the appendix to this report. Although both shear- and compression-wave signals are recorded on the same seismograph record, they have been played back and presented as separate paper records. They have been reduced in size and shown in a ‘waterfall’ format so that the signals can be visually followed down the hole. The horizontal offset of the source from the borehole collar and the frequency of the filter and its corresponding time delay are shown on each set of records. The values of travel times used for the velocity analyses were obtained from full-size copies of these records with expanded time scales. The time of the onset or ‘first break’ of the shear wave was not used as the travel time. The onset of a shear-wave pulse may be reasonably clear at the shallowest depths but rapidly becomes vague and indistinct with increasing depth. For this reason, the time of either the first peak or of the maximum peak, and of the corresponding trough from the reverse-polarity signals, is chosen as the travel time of the shear wave. The selected shear-wave travel times are indicated on the records by small dots that represent the average time of the peak and of its companion trough from the reverse-polarity blow to the source. The times of the peaks of the compression waves were selected as the travel times. A transparent plastic scale is overlaid on the seismograph traces to determine the travel times, and times to within 0.5 millisecond were attempted.

6
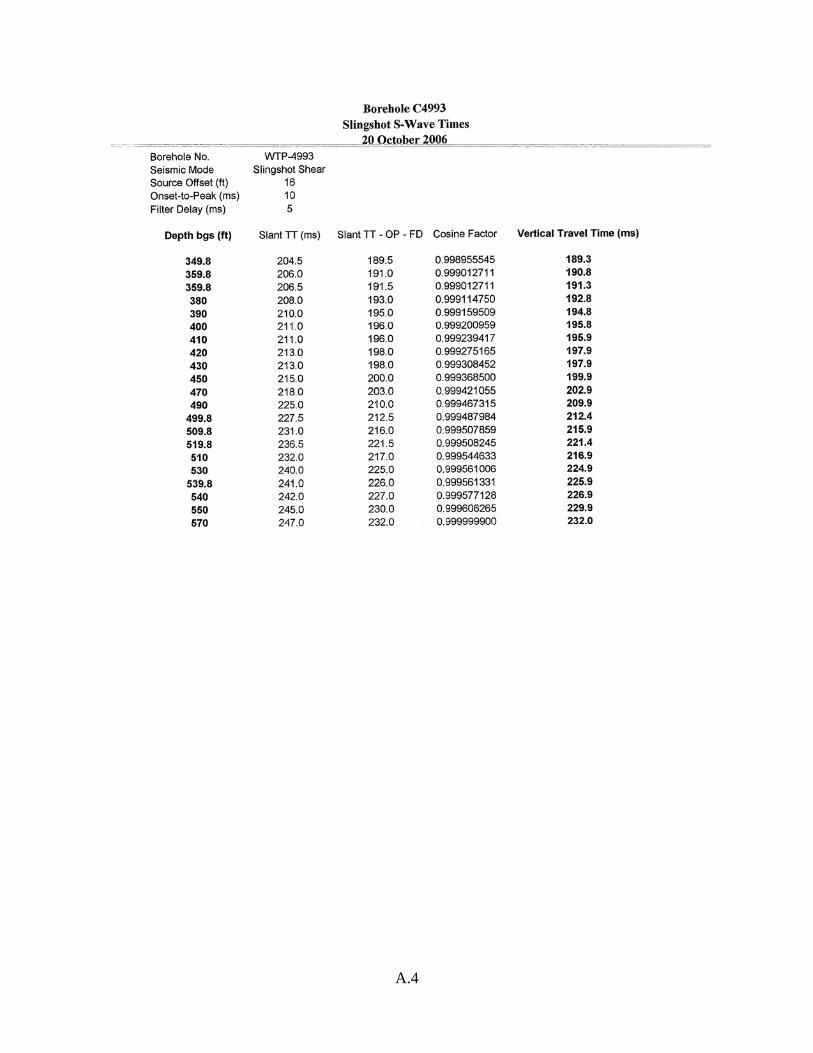
Because the signal source is offset from the collar of the hole, it is necessary to correct travel times for this offset. The correction converts the actual travel time along the slant path from source to receiver to the equivalent time required to travel vertically from the ground surface down to the receiver. In essence, the correction amounts to multiplying the travel time by the cosine of the angle between the slant path and vertical. However, a simple cosine correction is valid only if the time of the onset of the signal is used. If this simple cosine correction is applied to a later portion of the waveform, such as the first peak or the maximum peak, then the times will be overcorrected and the computed near-surface velocities will be too low. The proper method of correcting for the source offset is as follows:
tvertical = (tpeak – Δto – Δtf) x cosΘ
where tvertical is the time plotted against the depth to the measurement point; tpeak is the time of the selected peak; Δto is the time difference between the onset of the signal and the selected peak (and its corresponding trough) for signals recorded at shallow depth; Δtf is the time shift (i.e., time delay) caused by filtering the signal; and Θ is the angle between the slant path and vertical. The value of Δtf is easily measured by comparing the times of common points on the waveforms of filtered and unfiltered records. In practice, the value of cosΘ is computed from the source offset, s, and the depth to the transducer, d, so that the above equation becomes
tvertical = (tpeak – Δto – Δtf) x [d/(d2 + s2)1/2]
The travel times are tabulated manually on forms designed for that purpose and then entered into a simple Excel™ program that calculates the vertical travel time using the above equation. The times and their corresponding depths are plotted using Grapher™ 6 (Golden Software, Golden, Colorado). Results
The results are presented graphically in Figures 1 through 15. Figures 1 through 6 illustrate the results obtained in the upper 400 ft of boreholes C4993, C4996, and C4998, i.e., in the alluvium that overlies the basalt. Shear- and compression-wave plots are presented in sequence for each hole. Figures 7, 8, and 9 combine the information from the shallow alluvial surveys with the data acquired during the deeper surveys in the same uncased or stainless-cased holes. Note that the downhole shear-wave times observed in C4998 have been plotted together with the relatively sparse set of times acquired in C4997; hole C4998 was located about 75 ft from C4997. Also note that Figure 8 includes the entire set of compression-wave times measured in C4996 because the times for depths greater than 400 ft could not be plotted in Figure 4. The shallow downhole travel times observed in C4993, C4996, and C4998 for shear and compression waves have been overlaid in Figures 10 and 11, respectively. The travel times for C4998 are plotted as measured, whereas the times for the other holes were adjusted by the small amounts of time indicated on the figures. The times were adjusted so that the plotted times were

7
nearly coincident at a depth of approximately 400 ft. Lines representing visual best fits through the aggregate plots have been drawn, and the corresponding velocities are shown on the figures. These plots are intended to give a large-scale overview of the velocity structure in the alluvium beneath the WTP site. Figures 12 and 13 shows superimposed shear- and compression-wave velocities, respectively, as a function of depth in the upper 400 ft in boreholes C4993, C4996, and C4998. Figures 14 and 15 present the same information as Figures 12 and 13 with the addition of average values of velocity and of the velocities in Figures 10 and 11 that are based on the superimposed plots of the travel times. The values of average velocity were simply calculated for each depth interval in each hole. The downhole velocities measured in this program are presented in Table 2. Discussion
It is clear from a cursory inspection of the travel-time versus depth plots that, in general, the data are characterized by some degree of scatter, with relatively more scatter associated with the compression-wave data. The scatter can be attributed to small-scale heterogeneities, variations in the coupling of the casing to the surrounding material, and reflected signals near stratigraphic interfaces. Nevertheless, the scatter is generally less than a few milliseconds for the shear signals and 5 milliseconds or less for the compression signals. The compression data may appear slightly more scattered, but some of this is due to the expanded time scale of these plots. In the upper 50 ft of borehole C4996 (see Figure 4), it appears that the compression wave propagated down the grout in the annulus around the casing. It is often difficult to precisely define the depth of an interface, and judgment is frequently necessary when partitioning the subsurface into discrete velocity layers. This is especially so when there is scatter in the travel-time data, or if the velocity contrast between adjacent layers is not large. It should be emphasized that all lines fitting the data points were drawn using considerable judgment and that the slopes of these lines on which the velocity values are based were determined graphically. No least-squares values of slopes and, therefore, of the corresponding velocities, were used for the final set of values, although least-squares were calculated as check values. The slopes were determined simply by measuring the intercepts of the visual best-fit lines on the axes of the graphs. For this reason, the values of velocity have generally been rounded to the nearest 10 ft/sec when warranted, and to even larger rounding limits at the higher values. To not do so would imply a false sense of accuracy. All available information, particularly the drilling logs, was evaluated when determining layer boundaries.

8
Table 2. Summary of Velocities Measured in Downhole Surveys at the WTP Site
Borehole Number Depth Range (ft) Shear-Wave Velocity (ft/sec)
Compression-Wave Velocity (ft/sec)
0 – 15 780 1100 15 – 30 780 1850 30 – 100 1600 2900 100 – 170 1760 2900 170 – 236 2300 3900 236 – 280 1950 3900 280 – 300 1950 11,000 300 – 358 7150 11,000 358 – 400 8000 11,000 400 – 474 8000 N/A 474 – 532 2800 N/A 532 – 725 8500 N/A
C4993
725 – 742 3750 N/A 0 – 15 670 1050
15 – 160 1620 2900 160 – 175 2040 2900 175 – 255 2040 3850 255 – 275 2170 3850 275 – 304 2170 13,000 304 – 349 7300 13,000 349 – 447 8500 13,000 447 – 495 3300 7200 495 – 520 5000 10,000
C4996
520 – 650 8400 N/A 383 – 495 8000 N/A 495 – 537 3150 N/A 537 – 585 5000 N/A C4997
585 – 610 8000 N/A 0 – 18 1100 1700
18 – 30 1100 2700 30 – 70 1530 2700 70 – 120 1880 2700 120 – 190 1640 2700 190 – 250 2650 5000 250 – 322 2270 6700
C4998
322 – 360 7000 10,000 Calculating the higher values of compression-wave velocities presented the most uncertainty. As a specific example, the compression-wave velocity from a depth of 280 ft to 400 ft in C4993 is reported as 11,000 ft/sec in Figure 2. The least-squares value over this same interval is 11,515 ft/sec. The bottom two points in Figure 2 were judged questionable; therefore, the value of velocity determined graphically is slightly less. Further, the total transit time of a compression-wave pulse over the 120 ft from 280 to 400 ft is less than 11 milliseconds at a velocity of 11,000 ft/sec. Consequently, a 1-millisecond uncertainty in the total travel time is equivalent to an uncertainty of about 10% in the velocity over this interval. In general, ‘true’ velocity values are believed to be within 5% of the reported values, although the uncertainty may be somewhat higher for some of the compression-wave values.

9
0 40 80 120 160 200
Vertical Travel Time - milliseconds
400
350
300
250
200
150
100
50
0
Dep
th -
feet
Fig. 1Borehole C4993 - WTP Site at Hanford
Downhole Shear-Wave Travel Times in Alluvial DepositsSledgehammer Source - 9 February 2007
Showing Approximate Values of Velocities and Depths to Interfaces
30
100
170
236
300
358Elephant Mountain
Basalt
RingoldFormation
Reworked
Unit A
HanfordFormation
780 ft/sec
1600 ft/sec
1760 ft/sec
2300 ft/sec
1950 ft/sec
7150 ft/sec
8000 ft/sec
SHEAR

10
0 20 40 60 80 100 120
Vertical Travel Time - milliseconds
400
350
300
250
200
150
100
50
0
Dep
th -
feet
Fig. 2Borehole C4993 - WTP Site at Hanford
Downhole Compression-Wave Travel Times in Alluvial DepositsSledgehammer Source - 9 February 2007
Showing Approximate Values of Velocities and Depths to Interfaces
1100 ft/sec
1850 ft/sec
2900 ft/sec
3900 ft/sec
11,000 ft/sec
15
30
170
280
COMPRESSION

11
0 40 80 120 160 200
Vertical Travel Time - milliseconds
400
350
300
250
200
150
100
50
0
Dep
th -
feet
Fig. 3Borehole C4996 - WTP Site at Hanford
Downhole Shear-Wave Travel Times in Alluvial DepositsSledgehammer Source - 29 January 2007
Showing Approximate Values of Velocities and Depths to Interfaces
670 ft/sec
1620 ft/sec
15
160
255
304
349
2040 ft/sec
2170 ft/sec
HanfordFormation
RingoldFormation
Reworked
Unit A7300 ft/sec
8500 ft/secElephant MountainBasalt
2080 ft/secaverage
SHEAR

12
0 20 40 60 80 100 120
Vertical Travel Time - milliseconds
400
350
300
250
200
150
100
50
0
Dep
th -
feet
Fig. 4Borehole C4996 - WTP Site at Hanford
Downhole Compression-Wave Travel Times in Alluvial DepositsSledgehammer Source - 29 January 2007
Showing Approximate Values of Velocities and Depths to Interfaces
1050 ft/sec
175
3850 ft/sec
13,000 ft/sec
2900 ft/sec
COMPRESSION
15
275

13
0 40 80 120 160 200
Vertical Travel Time - milliseconds
400
350
300
250
200
150
100
50
0
Dep
th -
feet
Fig. 5Borehole C4998 - WTP Site at Hanford
Downhole Shear-Wave Travel Times in Alluvial DepositsSledgehammer Source - 10 December 2006
Showing Approximate Values of Velocities and Depths to Interfaces
30
70
120
250
322
382
1100 ft/sec
1530 ft/sec
1880 ft/sec
1640 ft/sec1750 ft/sec
average
2650 ft/sec
2270 ft/sec
HanfordFormation
RingoldFormation
Reworked
Unit A
Elephant Mountain Basalt
7000 ft/sec
2470 ft/secaverage
SHEAR
190

14
0 20 40 60 80 100 120
Vertical Travel Time- milliseconds
400
350
300
250
200
150
100
50
0
Dep
th -
feet
Fig. 6Borehole C4998 - WTP Site at Hanford
Downhole Compression-Wave Travel Times in Alluvial DepositsSledgehammer Source - 10 December 2006
Showing Approximate Values of Velocities and Depths to Interfaces
18
190
250
320
1700 ft/sec
2700 ft/sec
5000 ft/sec
6700 ft/sec
10,000 ft/sec
COMPRESSION
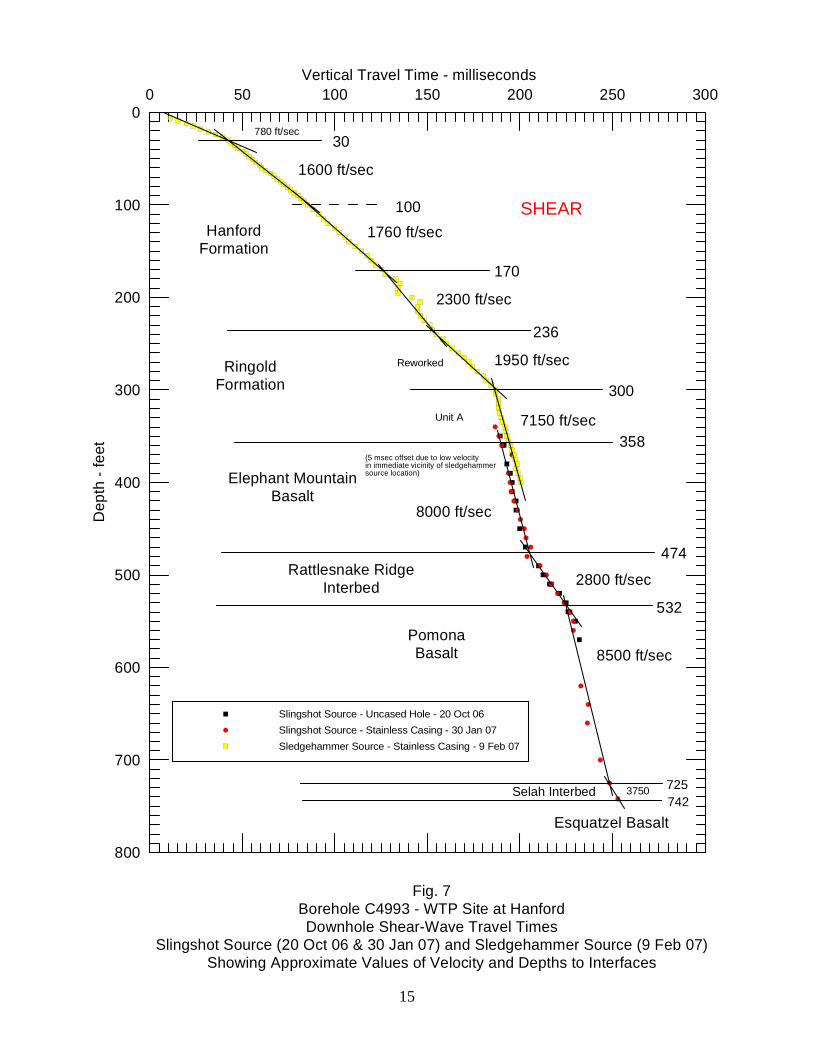
15
800
700
600
500
400
300
200
100
0D
epth
- fe
et0 50 100 150 200 250 300
Vertical Travel Time - milliseconds
Slingshot Source - Uncased Hole - 20 Oct 06Slingshot Source - Stainless Casing - 30 Jan 07Sledgehammer Source - Stainless Casing - 9 Feb 07
Fig. 7Borehole C4993 - WTP Site at HanfordDownhole Shear-Wave Travel Times
Slingshot Source (20 Oct 06 & 30 Jan 07) and Sledgehammer Source (9 Feb 07)Showing Approximate Values of Velocity and Depths to Interfaces
1600 ft/sec
1760 ft/sec
2300 ft/sec
7150 ft/sec
8000 ft/sec
2800 ft/sec
8500 ft/sec
3750
HanfordFormation
RingoldFormation
Elephant MountainBasalt
Reworked
Unit A
Rattlesnake RidgeInterbed
PomonaBasalt
Selah Interbed
Esquatzel Basalt
(5 msec offset due to low velocityin immediate vicinity of sledgehammersource location)
30780 ft/sec
100
170
236
300
358
532
474
1950 ft/sec
725742
SHEAR

16
800
700
600
500
400
300
200
100
0D
epth
- fe
et0 50 100 150 200 250 300
Vertical Travel Time - milliseconds
Sledgehammer Source Shear - PVC Cased - 29 Jan 07Slingshot Source Shear - Uncased Hole - 18 Oct 06Sledgehammer Source Compression - 29 Jan 07
Fig. 8Borehole C4996 - WTP Site at Hanford
Downhole Shear- and Compression-Wave Travel TimesSlingshot Source (18 Oct 06) and Sledgehammer Source (29 Jan 07)
Showing Approximate Values of Velocity and Depths to Interfaces
Vs = 670 ft/sec
15
160
255
304
349
447
495520
1620 ft/sec
HanfordFormation
RingoldFormation
Reworked
Unit A
Elephant MountainBasalt
Rattlesnake RidgeInterbed
PomonaBasalt
2040 ft/sec
2170 ft/sec
7300 ft/sec
8500 ft/sec
3300 ft/sec
8400 ft/sec
5000 ft/sec
2080 ft/secaverage
175
275
2900 ft/sec
3850 ft/sec
13,000 ft/sec
520
SHEAR&
COMPRESSION
7200 ft/sec
10,000 ft/sec
Note: The complete set of compression-wave times is includedto show the information below 400 ft that could not be plotted in Fig. 4.

17
800
700
600
500
400
300
200
100
0D
epth
- fe
et0 50 100 150 200 250 300
Vertical Travel Time - milliseconds
Slingshot Source - Uncased Hole - 13 Nov 06Sledgehammer Source in C4998 - 10 Dec 06
Fig. 9Borehole C4997 - WTP Site at Hanford
Downhole Shear-Wave TimesSlingshot Source (13 Nov 06) and Sledgehammer Source in C4998 (10 Dec 06)
Showing Approximate Values of Velocity and Depths to Interfaces in C4997
250
322
383
495
537
HanfordFormation
RingoldFormation
Reworked
Unit A
Elephant MountainBasalt
Rattlesnake Ridge Interbed
PomonaBasalt
Selah Interbed
8000 ft/sec
3150 ft/sec
5000 ft/sec
8000 ft/sec585
Note: Shear-wave arrival times measured in the alluvium in the adjacent hole, C4998, are shown simply for the sake of completeness.
SHEAR

18
0 40 80 120 160 200
Vertical Travel Time - milliseconds
400
350
300
250
200
150
100
50
0D
epth
- fe
et
C4998 as measuredC4996 less 6 msecC4993 less 12 msec
Fig. 10Overlay of Shallow Shear-Wave Downhole Times in C4998, C4996 & C4993
C4998 Times Plotted as MeasuredC4996 Times Reduced by 6 msec & C4993 Times Reduced by 12 msec
Showing Approximate Values of Velocities
310
301000 ft/sec
1700 ft/sec
2200 ft/sec
7000 ft/sec
180
SHEAR

19
0 20 40 60 80 100 120
Vertical Travel Time - milliseconds
400
350
300
250
200
150
100
50
0
Dep
th -
feet
C4998 as measuredC4996 less 2 msecC4993 less 4 msec
Fig. 11Overlay of Shallow Compression-Wave Downhole Times in C4998, C4996 & C4993
C4998 Times Plotted as MeasuredC4996 Times Reduced by 2 msec & C4993 Times Reduced by 4 msec
Showing Approximate Values of Velocities
1800 ft/sec30
2800 ft/sec
180
4200 ft/sec
12,000 ft/sec
285
COMPRESSION

20
0 1000 2000 3000 4000 5000 6000 7000 8000 9000 10000400
350
300
250
200
150
100
50
0
Dep
th -
feet
0 1000 2000 3000 4000 5000 6000 7000 8000 9000 10000
Shear Wave Velocity - feet/second
C4993C4996C4998
Fig. 12Boreholes C4993, C4996 & C4998 - WTP Site at Hanford
Shallow Downhole Shear-Wave VelocitiesSledgehammer Source
SHEAR

21
0 2000 4000 6000 8000 10000 12000 14000 16000400
350
300
250
200
150
100
50
0
Dep
th -
feet
0 2000 4000 6000 8000 10000 12000 14000 16000
Compression Wave Velocity - feet/second
C4993C4996C4998
Fig. 13Boreholes C4993, C4996 & C4998 - WTP Site at Hanford
Shallow Downhole Compression-Wave VelocitiesSledgehammer Source
COMPRESSION

22
0 1000 2000 3000 4000 5000 6000 7000 8000 9000 10000400
350
300
250
200
150
100
50
0
Dep
th -
feet
0 1000 2000 3000 4000 5000 6000 7000 8000 9000 10000
Shear Wave Velocity - feet/second
C4993C4996Average ValuesValues from Overlayof Downhole TimesC4998
Fig. 14Boreholes C4993, C4996 & C4998 - WTP Site at Hanford
Individual and Average Shallow Downhole Shear-Wave VelocitiesSledgehammer Source
SHEAR

23
0 2000 4000 6000 8000 10000 12000 14000 16000400
350
300
250
200
150
100
50
0
Dep
th -
feet
0 2000 4000 6000 8000 10000 12000 14000 16000
Compression Wave Velocity - feet/second
C4993C4996C4998Average ValuesValues from Overlayof Downhole Times
Fig. 15Boreholes C4993, C4996 & C4998 - WTP Site at Hanford
Individual and Average Shallow Downhole Compression-Wave VelocitiesSledgehammer Source
COMPRESSION

Appendix
Seismograph Records from Downhole Velocity Surveys

A.1
Appendix
Seismograph Records from Downhole Velocity Surveys
Page A.2 A.4 A.7 A.10 A.15 A.19 A.26 A.33 A.36 A.42

A.2

A.3
A.4

A.5

A.6

A.7

A.8
A.9
A.10
A.11

A.12

A.13

A.14

A.15

A.16

A.17

A.18

A.19

A.20
A.21
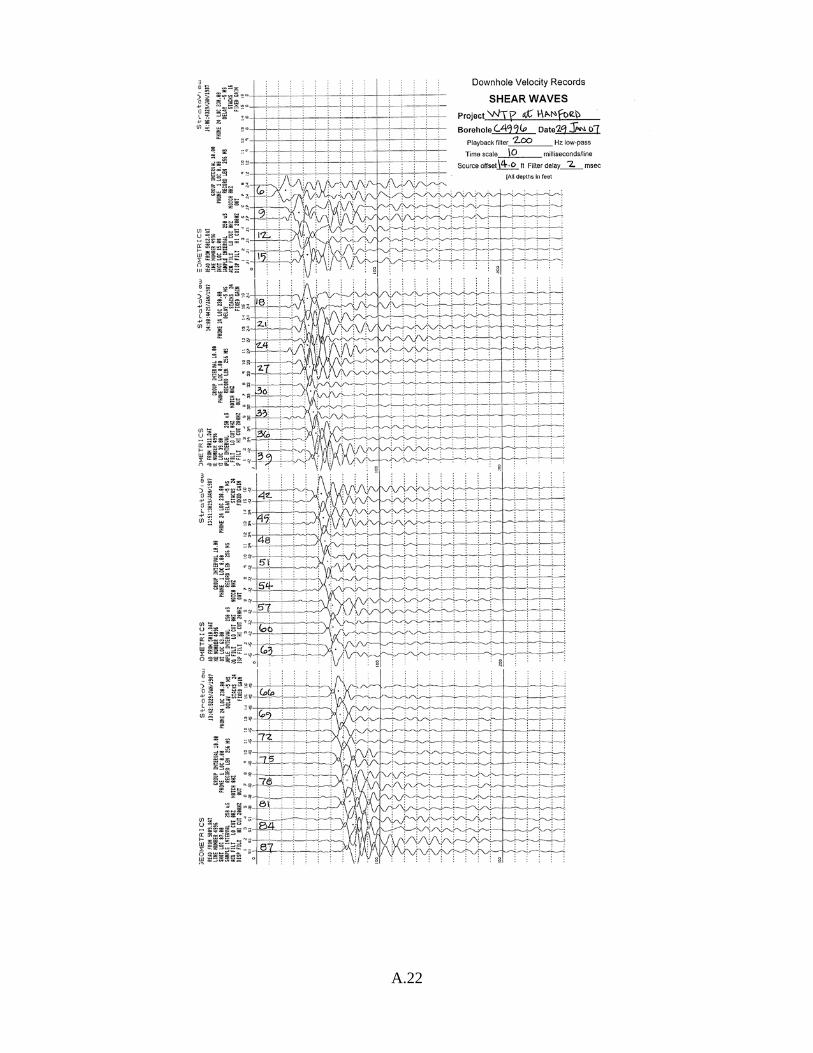
A.22

A.23

A.24

A.25

A.26

A.27

A.28

A.29

A.30
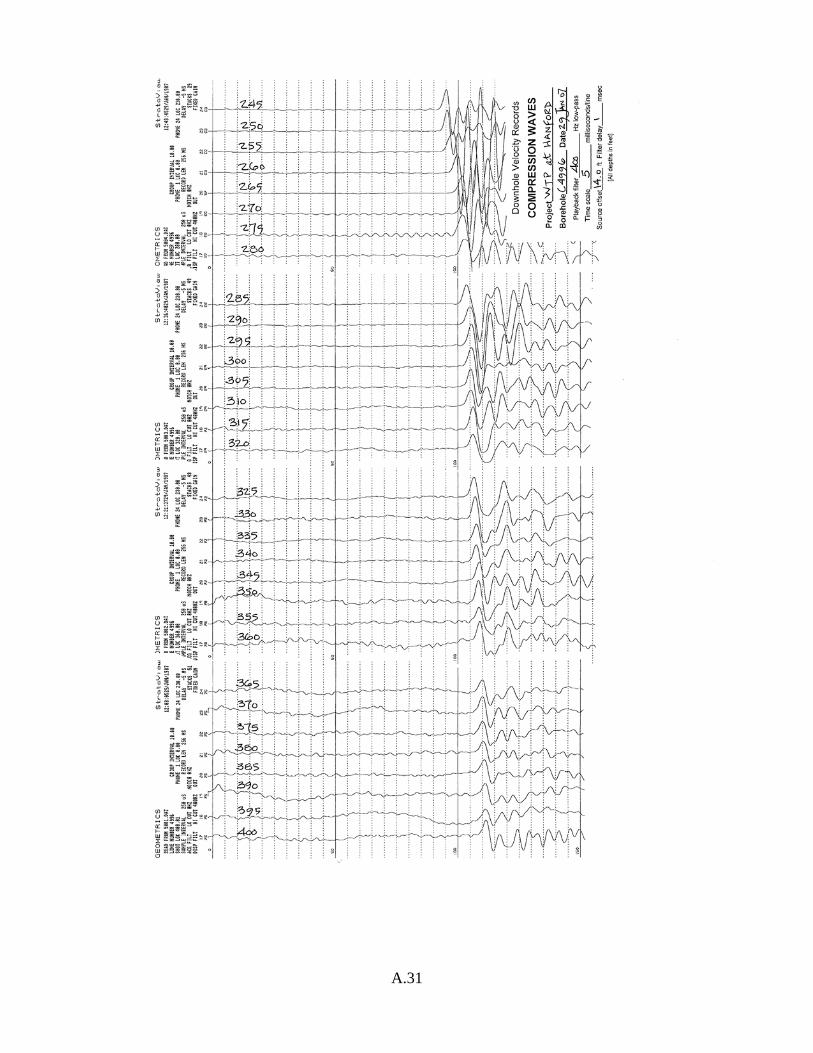
A.31

A.32

A.33

A.34

A.35

A.36

A.37

A.38

A.39

A.40

A.41

A.42

A.43

A.44

A.45

A.46

A.47