dow jones indexes monthly report: asia pacific edition
DESCRIPTION
Dow Jones Indexes Monthly Report: Asia Pacific EditionTRANSCRIPT
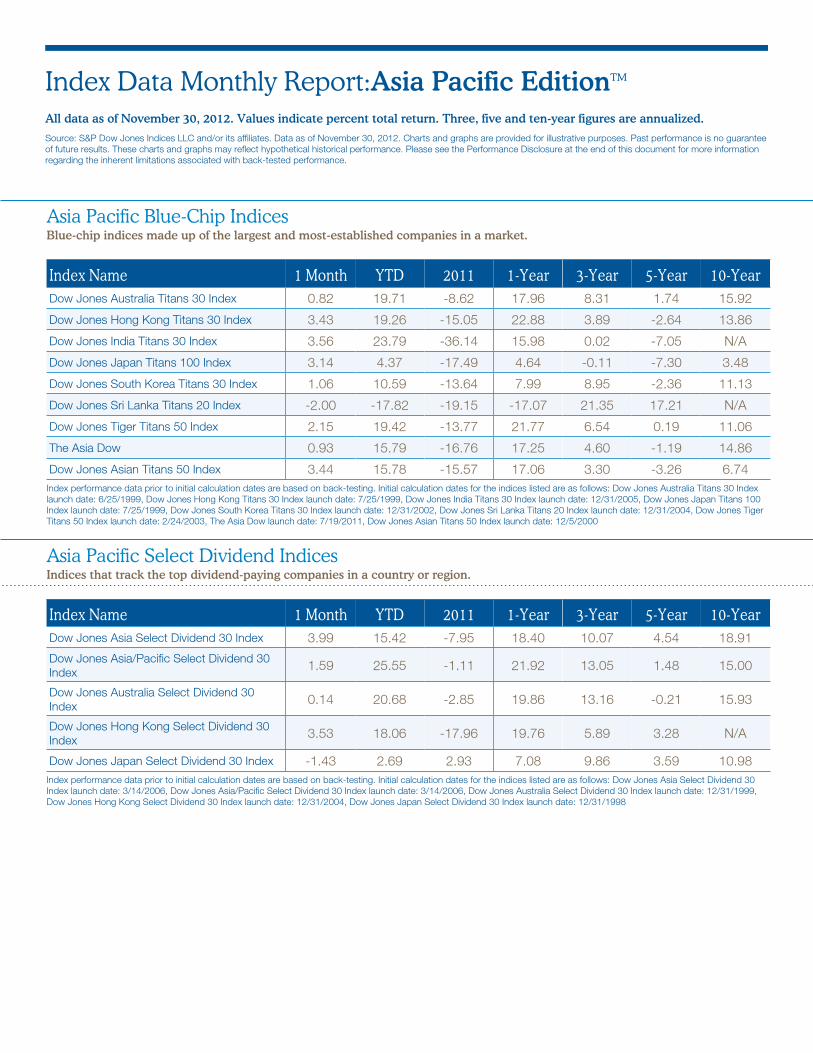
Index Data Monthly Report:Asia Pacific EditionTM
All data as of November 30, 2012. Values indicate percent total return. Three, five and ten-year figures are annualized.Source: S&P Dow Jones Indices LLC and/or its affiliates. Data as of November 30, 2012. Charts and graphs are provided for illustrative purposes. Past performance is no guaranteeof future results. These charts and graphs may reflect hypothetical historical performance. Please see the Performance Disclosure at the end of this document for more informationregarding the inherent limitations associated with back-tested performance.
Asia Pacific Blue-Chip IndicesBlue-chip indices made up of the largest and most-established companies in a market.
Index Name 1 Month YTD 2011 1-Year 3-Year 5-Year 10-YearDow Jones Australia Titans 30 Index 0.82 19.71 -8.62 17.96 8.31 1.74 15.92
Dow Jones Hong Kong Titans 30 Index 3.43 19.26 -15.05 22.88 3.89 -2.64 13.86
Dow Jones India Titans 30 Index 3.56 23.79 -36.14 15.98 0.02 -7.05 N/A
Dow Jones Japan Titans 100 Index 3.14 4.37 -17.49 4.64 -0.11 -7.30 3.48
Dow Jones South Korea Titans 30 Index 1.06 10.59 -13.64 7.99 8.95 -2.36 11.13
Dow Jones Sri Lanka Titans 20 Index -2.00 -17.82 -19.15 -17.07 21.35 17.21 N/A
Dow Jones Tiger Titans 50 Index 2.15 19.42 -13.77 21.77 6.54 0.19 11.06
The Asia Dow 0.93 15.79 -16.76 17.25 4.60 -1.19 14.86
Dow Jones Asian Titans 50 Index 3.44 15.78 -15.57 17.06 3.30 -3.26 6.74Index performance data prior to initial calculation dates are based on back-testing. Initial calculation dates for the indices listed are as follows: Dow Jones Australia Titans 30 Indexlaunch date: 6/25/1999, Dow Jones Hong Kong Titans 30 Index launch date: 7/25/1999, Dow Jones India Titans 30 Index launch date: 12/31/2005, Dow Jones Japan Titans 100Index launch date: 7/25/1999, Dow Jones South Korea Titans 30 Index launch date: 12/31/2002, Dow Jones Sri Lanka Titans 20 Index launch date: 12/31/2004, Dow Jones TigerTitans 50 Index launch date: 2/24/2003, The Asia Dow launch date: 7/19/2011, Dow Jones Asian Titans 50 Index launch date: 12/5/2000
Asia Pacific Select Dividend IndicesIndices that track the top dividend-paying companies in a country or region.
Index Name 1 Month YTD 2011 1-Year 3-Year 5-Year 10-YearDow Jones Asia Select Dividend 30 Index 3.99 15.42 -7.95 18.40 10.07 4.54 18.91
Dow Jones Asia/Pacific Select Dividend 30Index 1.59 25.55 -1.11 21.92 13.05 1.48 15.00
Dow Jones Australia Select Dividend 30Index 0.14 20.68 -2.85 19.86 13.16 -0.21 15.93
Dow Jones Hong Kong Select Dividend 30Index 3.53 18.06 -17.96 19.76 5.89 3.28 N/A
Dow Jones Japan Select Dividend 30 Index -1.43 2.69 2.93 7.08 9.86 3.59 10.98Index performance data prior to initial calculation dates are based on back-testing. Initial calculation dates for the indices listed are as follows: Dow Jones Asia Select Dividend 30Index launch date: 3/14/2006, Dow Jones Asia/Pacific Select Dividend 30 Index launch date: 3/14/2006, Dow Jones Australia Select Dividend 30 Index launch date: 12/31/1999,Dow Jones Hong Kong Select Dividend 30 Index launch date: 12/31/2004, Dow Jones Japan Select Dividend 30 Index launch date: 12/31/1998

Asia Pacific Islamic IndicesBenchmark, blue-chip and specialty indices that have passed screens for Shari'ah compliance.
Index Name 1 Month YTD 2011 1-Year 3-Year 5-Year 10-YearDow Jones Islamic Market ASEAN Index * -1.51 14.03 -6.33 16.61 11.69 0.54 11.96
Dow Jones Islamic Market Asia/Pacific Titans25 Index * 3.58 11.91 -12.13 12.22 6.66 -0.98 6.69
Dow Jones Islamic Market China OffshoreHong Kong Index * 1.07 10.47 -21.09 10.02 1.00 -6.58 N/A
Dow Jones Islamic Market China/Hong KongTitans Index * 1.73 16.25 -15.84 16.76 3.72 -5.08 N/A
Dow Jones Islamic Market Greater ChinaIndex * 2.50 12.19 -18.78 12.02 3.13 -3.52 N/A
Dow Jones Islamic Market India Index * 0.60 14.65 -36.63 7.42 -4.51 -9.27 N/A
Dow Jones Islamic Market Japan Index * 1.88 0.02 -10.14 1.27 1.91 -4.91 2.06
Dow Jones Islamic Market Malaysia Titans25 Index * -5.34 10.10 1.41 15.72 11.69 2.11 N/A
Dow Jones Islamic Market Singapore Index * 1.54 18.29 -15.08 17.24 10.35 -2.35 9.73Index performance data prior to initial calculation dates are based on back-testing. Initial calculation dates for the indices listed are as follows: Dow Jones Islamic Market ASEANIndex launch date: 10/31/2008, Dow Jones Islamic Market Asia/Pacific Titans 25 Index launch date: 5/24/1999, Dow Jones Islamic Market China Offshore Hong Kong Index launchdate: 5/9/2008, Dow Jones Islamic Market China/Hong Kong Titans Index launch date: 12/31/2005, Dow Jones Islamic Market Greater China Index launch date: 8/28/2009, DowJones Islamic Market India Index launch date: 5/18/2007, Dow Jones Islamic Market Japan Index launch date: 5/24/1999, Dow Jones Islamic Market Malaysia Titans 25 Indexlaunch date: 12/30/1995, Dow Jones Islamic Market Singapore Index launch date: 12/30/2005* Price Return
Other Featured IndicesSelect indices of interest from our equity, fixed income, alternative index families.
Index Name 1 Month YTD 2011 1-Year 3-Year 5-Year 10-YearDow Jones BRIC 50 Index 0.36 5.71 -22.13 3.05 -2.28 -5.55 N/A
Dow Jones Sukuk Index 0.00 1.98 5.47 2.80 5.73 4.07 N/A
Dow Jones FXCM Dollar Index 0.86 0.42 -0.49 1.58 0.16 0.16 -2.30
Dow Jones Industrial Average -0.12 9.38 8.38 11.10 10.93 2.32 6.57
Dow Jones Islamic Market BRIC EqualWeighted Index * -0.51 0.06 -27.50 -7.06 -6.00 -8.18 N/A
Dow Jones Islamic Market GCC Index * -2.53 6.23 -5.28 10.48 2.35 -6.48 N/A
Dow Jones Islamic Market Global SelectDividend Index * -0.10 10.48 -7.34 10.09 8.33 2.44 N/A
Dow Jones Islamic Market InternationalTitans 100 Index * 1.40 6.44 -13.69 4.46 0.58 -5.75 5.57
Dow Jones Islamic Market MENA Index * -0.68 2.48 -13.60 4.19 -0.15 N/A N/A
Dow Jones Islamic Market SustainabilityIndex * 1.23 7.78 -5.85 6.37 2.72 -3.29 4.73
Dow Jones U.S. Select Dividend Index -0.24 10.62 12.42 13.53 15.05 1.79 7.31
Dow Jones-UBS Commodity Index TotalReturn 0.05 1.59 -13.32 -2.22 1.61 -3.81 4.87
The Dow 10 -1.47 10.51 14.95 15.83 16.44 1.28 6.36
The Global Dow 1.33 10.19 -11.70 9.07 2.22 -5.06 11.15Index performance data prior to initial calculation dates are based on back-testing. Initial calculation dates for the indices listed are as follows: Dow Jones BRIC 50 Index launchdate: 6/7/2006, Dow Jones Sukuk Index launch date: 10/1/2005, Dow Jones FXCM Dollar Index launch date: 3/23/2011, Dow Jones Industrial Average launch date: 9/30/1987,Dow Jones Islamic Market BRIC Equal Weighted Index launch date: 12/5/2006, Dow Jones Islamic Market GCC Index launch date: 12/31/2003, Dow Jones Islamic Market GlobalSelect Dividend Index launch date: 8/29/2011, Dow Jones Islamic Market International Titans 100 Index launch date: 1/9/2009, Dow Jones Islamic Market MENA Index launch date:10/9/2009, Dow Jones Islamic Market Sustainability Index launch date: 1/23/2006, Dow Jones U.S. Select Dividend Index launch date: 11/3/2003, Dow Jones-UBS CommodityIndex Total Return launch date: 7/14/1998, The Dow 10 launch date: 12/17/2001, The Global Dow launch date: 11/9/2008
* Price Return
About S&P Dow Jones IndicesS&P Dow Jones Indices LLC, a subsidiary of The McGraw-Hill Companies is the world's largest, global resource for index-based concepts,data and research. Home to iconic financial market indicators, such as the S&P 500® and the Dow Jones Industrial AverageTM, S&P DowJones Indices LLC has over 115 years of experience constructing innovative and transparent solutions that fulfill the needs of institutionaland retail investors. More assets are invested in products based upon our indices than any other provider in the world. With over830,000 indices covering a wide range of assets classes across the globe, S&P Dow Jones Indices LLC defines the way investors measureand trade the markets. To learn more about our company, please visit www.spdji.com.
Contact Information
General Inquiries:
Tel: [email protected]
www.djindexes.com
PERFORMANCE DISCLOSUREThe indices in this report first calculated on the dates indicated at the market close. All information presented prior to these dates are back-tested. Back-tested performance is notactual performance, but is hypothetical. The back-test calculations are based on the same methodology that was in effect when the index was officially launched. Complete indexmethodology details are available at www.spindices.com.
Past performance of the indices are not an indication of future results. Prospective application of the methodology used to construct the indices may not result in performancecommensurate with the back-test returns shown. The back-test periods do not necessarily correspond to the entire available history of the indices. Please refer to the methodologypapers for the indices, available at www.spdji.com or www.spindices.com for more details about the indices, including the manners in which they are rebalanced, the timing ofsuch rebalancing, criteria for additions and deletions, as well as all index calculations. It is not possible to invest directly in an Index.
Another limitation of back-tested hypothetical information is that generally the back-tested calculation is prepared with the benefit of hindsight. Back-tested data reflect theapplication of the index methodology and selection of index constituents in hindsight. No hypothetical record can completely account for the impact of financial risk in actual trading.For example, there are numerous factors related to the equities (or fixed income, or commodities) markets in general which cannot be, and have not been accounted for in thepreparation of the index information set forth, all of which can affect actual performance.
The Index returns shown do not represent the results of actual trading of investible assets/securities. S&P Dow Jones Indices LLC maintains the indices and calculates the indexlevels and performance shown or discussed, but does not manage actual assets. Index returns do not reflect payment of any sales charges or fees an investor may pay to purchasethe securities underlying the indices investment funds that are intended to track the performance of the indices. The imposition of these fees and charges would cause actual andback-tested performance of the securities/fund to be lower than the index performances shown. As a simple example, if an index returned 10% on a US $100,000 investment for a12-month period (or US$ 10,000) and an actual asset-based fee of 1.5% was imposed at the end of the period on the investment plus accrued interest (or US$ 1,650), the netreturn would be 8.35% (or US$ 8,350) for the year. Over 3 years, an annual 1.5% fee taken at year end with an assumed 10% return per year would result in a cumulative grossreturn of 33.10%, a total fee of US$ 5,375, and a cumulative net return of 27.2% (or US$ 27,200).
DISCLAIMERCopyright © 2012 by S&P Dow Jones Indices LLC, a subsidiary of The McGraw-Hill Companies, Inc., and/or its affiliates. All rights reserved. Standard & Poor’s, and S&P areregistered trademarks of Standard & Poor’s Financial Services LLC (“S&P”), a subsidiary of The McGraw-Hill Companies, Inc. Dow Jones is a registered trademark of Dow JonesTrademark Holdings LLC (“Dow Jones”). Trademarks have been licensed to S&P Dow Jones Indices LLC. Redistribution, reproduction and/or photocopying in whole or in part areprohibited without written permission. This document does not constitute an offer of services in jurisdictions where S&P Dow Jones Indices LLC, Dow Jones, S&P or their respectiveaffiliates (collectively “S&P Dow Jones Indices”) do not have the necessary licenses. All information provided by S&P Dow Jones Indices is impersonal and not tailored to the needsof any person, entity or group of persons. S&P Dow Jones Indices receives compensation in connection with licensing its indices to third parties. Past performance of an index isnot a guarantee of future results.
It is not possible to invest directly in an index. Exposure to an asset class represented by an index is available through investable instruments based on that index. S&P Dow JonesIndices does not sponsor, endorse, sell, promote or manage any investment fund or other investment vehicle that is offered by third parties and that seeks to provide an investmentreturn based on the performance of any index. S&P Dow Jones Indices makes no assurance that investment products based on the index will accurately track index performance orprovide positive investment returns. S&P Dow Jones Indices LLC is not an investment advisor, and S&P Dow Jones Indices makes no representation regarding the advisability ofinvesting in any such investment fund or other investment vehicle. A decision to invest in any such investment fund or other investment vehicle should not be made in reliance onany of the statements set forth in this document. Prospective investors are advised to make an investment in any such fund or other vehicle only after carefully considering the risksassociated with investing in such funds, as detailed in an offering memorandum or similar document that is prepared by or on behalf of the issuer of the investment fund or othervehicle. Inclusion of a security within an index is not a recommendation by S&P Dow Jones Indices to buy, sell, or hold such security, nor is it considered to be investment advice.
These materials have been prepared solely for informational purposes based upon information generally available to the public from sources believed to be reliable. No contentcontained in these materials (including index data, ratings, credit-related analyses and data, model, software or other application or output there from) or any part thereof (Content)may be modified, reverse-engineered, reproduced or distributed in any form by any means, or stored in a database or retrieval system, without the prior written permission of S&PDow Jones Indices. The Content shall not be used for any unlawful or unauthorized purposes. S&P Dow Jones Indices and its third-party data providers and licensors (collectively“S&P Dow Jones Indices Parties”) do not guarantee the accuracy, completeness, timeliness or availability of the Content. S&P Dow Jones Indices Parties are not responsible for anyerrors or omissions, regardless of the cause, for the results obtained from the use of the Content. THE CONTENT IS PROVIDED ON AN “AS IS” BASIS. S&P DOW JONES INDICESPARTIES DISCLAIM ANY AND ALL EXPRESS OR IMPLIED WARRANTIES, INCLUDING, BUT NOT LIMITED TO, ANY WARRANTIES OF MERCHANTABILITY OR FITNESS FOR APARTICULAR PURPOSE OR USE, FREEDOM FROM BUGS, SOFTWARE ERRORS OR DEFECTS, THAT THE CONTENT’S FUNCTIONING WILL BE UNINTERRUPTED OR THATTHE CONTENT WILL OPERATE WITH ANY SOFTWARE OR HARDWARE CONFIGURATION. In no event shall S&P Dow Jones Indices Parties be liable to any party for any direct,indirect, incidental, exemplary, compensatory, punitive, special or consequential damages, costs, expenses, legal fees, or losses (including, without limitation, lost income or lostprofits and opportunity costs) in connection with any use of the Content even if advised of the possibility of such damages.
S&P Dow Jones Indices keeps certain activities of its business units separate from each other in order to preserve the independence and objectivity of their respective activities. Asa result, certain business units of S&P Dow Jones Indices may have information that is not available to other business units. S&P Dow Jones Indices has established policies andprocedures to maintain the confidentiality of certain non-public information received in connection with each analytical process.
In addition, S&P Dow Jones Indices provides a wide range of services to, or relating to, many organizations, including issuers of securities, investment advisers, broker-dealers,investment banks, other financial institutions and financial intermediaries, and accordingly may receive fees or other economic benefits from those organizations, includingorganizations whose securities or services they may recommend, rate, include in model portfolios, evaluate or otherwise address.

Ed 12-03-12, Index Data Monthly-272-272-113012