double blind calculation results for iaea icsp€¦ · · 2012-10-16blind calculation results for...
TRANSCRIPT

Blind Calculation Results for IAEA ICSP on Natural Circulation
March 28, 2012 Ju Yeop Park ([email protected])
Korea Institute Nuclear Safety

Contents
• Code and tool • Simulation of SP2 experiment
– Loss of feed water transient
• Simulation of SP3 experiment – Normal operation with different power level
• Conclusions
IAEA ICSP 3rd Workshop, March 27-30, 2012, Daejeon, Korea 2 2012-03-28

Code and tool • Code was changed from RELAP5Mod3.3p3 to MARS-KS • MARS(Multi-dimensional Analysis of Reactor Safety)
code(KS-002 version) was used – Based on RELAP5Mod3.2 and COBRA-TF – Developed by KAERI(1997~2006) and maintained by
KINS(2007~) – Helical coil geometry specific wall-to-fluid HT models was
implemented • Mori-Nakayama HT model for tube side (1φ) • Modification of dry-out criteria (Xs>0.8) for tube side • Zukauskas HT model for bundle side (1φ)
• US NRC SNAP(2.0.7 version) was used for developing input deck of blind calculation
IAEA ICSP 3rd Workshop, March 27-30, 2012, Daejeon, Korea 3 2012-03-28
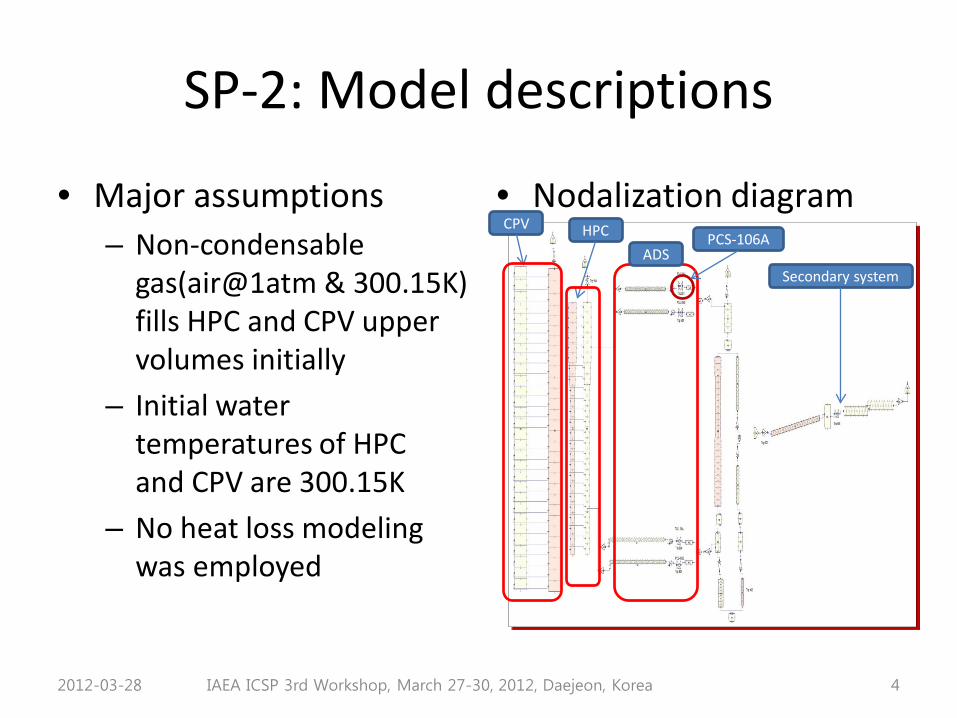
SP-2: Model descriptions
• Major assumptions – Non-condensable
gas(air@1atm & 300.15K) fills HPC and CPV upper volumes initially
– Initial water temperatures of HPC and CPV are 300.15K
– No heat loss modeling was employed
• Nodalization diagram
2012-03-28 IAEA ICSP 3rd Workshop, March 27-30, 2012, Daejeon, Korea 4
Secondary system
CPV HPC ADS
PCS-106A

SP-2: Model descriptions(cont.) • Junction losses coefficients were
tuned to MASLWR OSU-003A#10 experiment
• Surface roughness 3.0E-5(m) was uniformly applied
• Henry-Fauske choked flow model with discharge coefficient of 0.85 for PCS-106A v/v was used
• Steam line modeling was modified compared to double blind phase
• Level tracking option of MARS code was turned off for volumes of HPC and CPV due to convergence problem(transient) – Similar convergence problem was
observed for RELAP5Mod3.3p3 code, too
2012-03-28 IAEA ICSP 3rd Workshop, March 27-30, 2012, Daejeon, Korea 5
• Volume and junction data
Change from double blind calc. to blind calc.
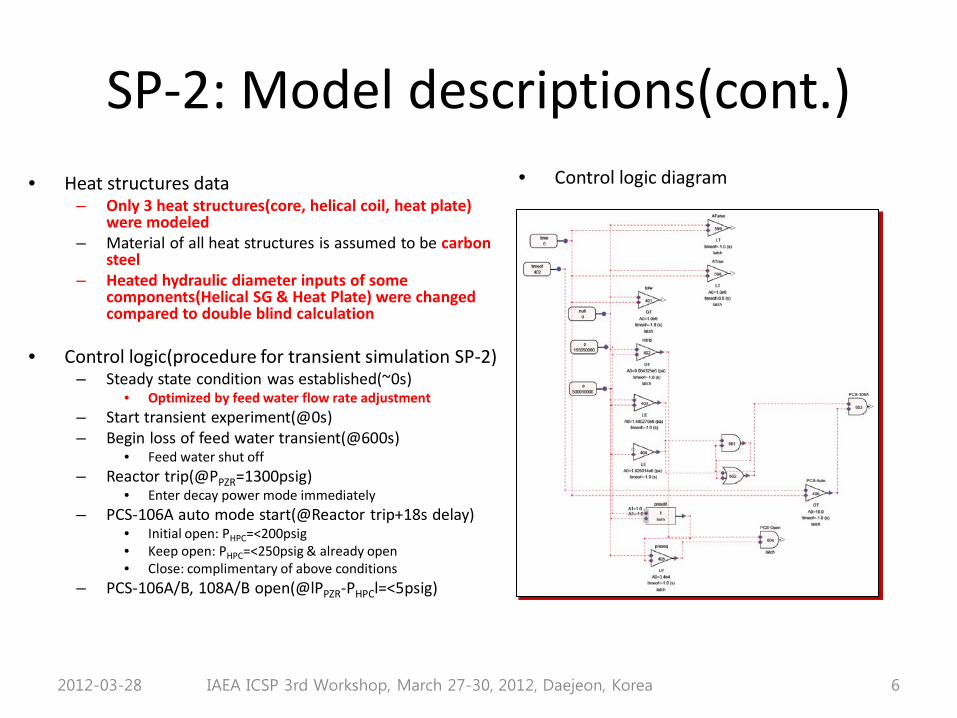
SP-2: Model descriptions(cont.) • Heat structures data
– Only 3 heat structures(core, helical coil, heat plate) were modeled
– Material of all heat structures is assumed to be carbon steel
– Heated hydraulic diameter inputs of some components(Helical SG & Heat Plate) were changed compared to double blind calculation
• Control logic(procedure for transient simulation SP-2) – Steady state condition was established(~0s)
• Optimized by feed water flow rate adjustment – Start transient experiment(@0s) – Begin loss of feed water transient(@600s)
• Feed water shut off – Reactor trip(@PPZR=1300psig)
• Enter decay power mode immediately – PCS-106A auto mode start(@Reactor trip+18s delay)
• Initial open: PHPC=<200psig • Keep open: PHPC=<250psig & already open • Close: complimentary of above conditions
– PCS-106A/B, 108A/B open(@lPPZR-PHPCl=<5psig)
• Control logic diagram
2012-03-28 IAEA ICSP 3rd Workshop, March 27-30, 2012, Daejeon, Korea 6

SP-2: Model descriptions(cont.) • Initial and boundary conditions
– Primary PZR pressure: 8.72Mpa(a) – Secondary feed water inlet temperature: 294.54K – Secondary feed water inlet mass flow rate:
0.10936kg/s • Optimized to experimental initial conditions
– Steam outlet pressure: 1.411MPa – Core power: 299kW from steady state until
600s(transient) and power level is decayed according to experimental data
• Steady state results for SP-2
2012-03-28 IAEA ICSP 3rd Workshop, March 27-30, 2012, Daejeon, Korea 7
Parameter MASLWR Unit Experimental Value
Steady-State Value from Code
Pressurizer pressure PT-301 MPa(a) 8.720325 8.720325(BC) Pressurizer level LDP-301 m 0.3607 0.3998 Power to core heater rods KW-101/102 kW 299 299(BC)
Power of PZR heater kW N/A(no PZR heater modeling)
Feedwater temperature TF-501 ºC 21.39 21.39(BC) Steam outlet temperature FVM-602-T ºC 205.38 205.089 Steam pressure FVM-602-P MPa(a) 1.411 1.411(BC) Ambient air temperature ºC N/A HPC pressure PT-801 MPa(a) 0.126825 0.127665 HPC water temperature TF-811 ºC 26.72 27.67 HPC water level LDP-801 m 2.82 2.81 Primary flow at core outlet FDP-131 kg/s N/A 1.8458
Primary coolant temperature at core inlet
TF-121/122/ 123/124
ºC 215.34/214.82 214.42/215.11
215.71
Primary coolant temperature at core outlet TF-106 ºC 251.52 250.5
Feedwater flow FMM-501 kg/s N/A 0.10936 Steam flow FVM-602-M kg/s N/A 0.10936 Primary coolant subcooling at core outlet ºC 50.78
Total heat loss through primary system kW
N/A(no heat loss modeling)
Heat transfer through SG kW 299(BC) Maximum surface temperature of core heater rods ºC 290
Location from the SG secondary inlet to reach - saturation - superheat
m 1.815m(saturation) 5.445m(superheat)

SP-2: Transient simulation results
2012-03-28 IAEA ICSP 3rd Workshop, March 27-30, 2012, Daejeon, Korea 8
Feedwater & Steam Mass Flowrate
PZR Levels
Primary System Mass Flowrate
HPC Levels
Modeling error?

SP-2: Transient simulation results(cont.)
2012-03-28 IAEA ICSP 3rd Workshop, March 27-30, 2012, Daejeon, Korea 9
HPC Pressures PZR Pressures PZR-HPC Pressures
CPV Pressures HPC Pressures above water Lvl. Steam Pressures(BC)
1407sec

SP-2: Transient simulation results(cont.)
2012-03-28 IAEA ICSP 3rd Workshop, March 27-30, 2012, Daejeon, Korea 10
DP-101
DP-102 DP-103
DP-104
DP-105
DP-106
Total System Mass(SP-2) Pressure Differences

SP-2: Transient simulation results(cont.)
2012-03-28 IAEA ICSP 3rd Workshop, March 27-30, 2012, Daejeon, Korea 11
ADS Flows ADS Flows(enlarged)
Cumulative ADS Flows

SP-2: Transient simulation results(cont.)
2012-03-28 IAEA ICSP 3rd Workshop, March 27-30, 2012, Daejeon, Korea 12
PZR & Primary Temperatures
SG outlet
Temperatures at various locations
Liquid
fraction
Liquid Fractions
UP & SG inlet

SP-2: Transient simulation results(cont.)
2012-03-28 IAEA ICSP 3rd Workshop, March 27-30, 2012, Daejeon, Korea 13
CPV Temperatures
Increasing height
HPV Temperatures
Core Rod Temperature
Increasing height
Increasing height Increasing height
HP(near CPV) Temperatures HP(near HPC) Temperatures

SP-2: Transient simulation results(cont.)
2012-03-28 IAEA ICSP 3rd Workshop, March 27-30, 2012, Daejeon, Korea 14
• Overall prediction result of transient simulation of SP-2 experiment seemed to be reasonable
• Calculated time to reach the opening of PCS-106A valve was estimated to be very close to experimental date
• However, calculated starting time of long-term cooling showed large discrepancy compared to experimental data(1407 vs. 4624)
• Code calculation showed much faster depressurization and pressure equilibrium between RPV and HPC than experimental data
– Sensitive on HPC & CPV modeling(ICSP 3rd workshop)
• SP-2 Time Sequence of Events
Event Time (s) Calculation Experiment
Start of simulation – steady state (start of data collection) 0 0 Stop MFP Close HPC vent valve SV-800 600.0 600 PZR pressure (PT-301) reaches 9.064 MPa(a) (1300 psig) Enter decay power mode
629.6 N/A PZR pressure (PT-301) reaches 9.409 MPa(a) (1350 psig) De-energize PZR heaters Open ADS vent valve (PCS-106A)
647.6 648
Record opening and closing times for PCS-106A 647.6-666(open) 680-751(open) 763-793(open) 814-829(open) 847-861(open) 892-901(open) 928-934(open) 970-979(open) 1018-1027(open) 1069-1075(open) 1120-1129(open) 1165-1174(open) 1222-1231(open) 1261-1270(open) 1303-18000(open)
648-731(open) 765-775(open) 822-831(open) Etc.
Record opening and closing times for SV-800 Not open Not open Start long-term cooling when pressure difference between primary system and HPC (PT-301 minus PT-801) becomes less than 5 psi (0.034 MPa) Open and remain open of PCS-106A and PCS-106B Open and remain open of PCS-108A and PCS-108B
1407 4624(PCS-106A) 4711(PCS-106B) 4716(PCS-108A) 4717(PCS-108B)
End of test when one of the following conditions is reached: - PZR pressure ≤ 0.135 MPa(a) (5 psig) - Primary coolant temperature (TF-132) ≤ 35 ºC - (95 ºF) - 24 hours have elapsed
N/A N/A

SP-3: Model descriptions • Major assumptions
– Heat loss from RPV to surrounding atmosphere was modeled(except PZR region)
• External HTC value was determined by steady state experimental data and it was applied to transient simulation of SP-3
• Constant atmospheric temperature was assumed(i.e.295.15K)
– Pressurizer heater was modeled(on/off type)
• modeled by 3 cylinders with diameter 0.0159m, length of 0.2032m and power of 4kW each
• Nodalization diagram
2012-03-28 IAEA ICSP 3rd Workshop, March 27-30, 2012, Daejeon, Korea 15
Secondary system
Primary system

SP-3: Model descriptions(cont.) • Heat structures data
– In addition to 3 heat structures(core, helical coil, heat plate) modeled in SP-2 simulation, pressurizer heater and RPV components adjacent to surroundings were considered additional heat structures(for considering heat losses)
• Except pressurizer region of RPV – Heat structures of RPV were assumed
to be cylindrical shells with thickness of 0.03175m, inner diameter of 0.2921m and outer diameter of 0.3556m
– Insulations for RPV were not modeled. Instead, an external heat transfer coefficient for RPV outer surface was adjusted to match the initial steady state conditions given by the SP-3 experiment specification
• h=13.2538W/m2-K • Tair=295.15K(22oC)
• Control logic(transient simulation of SP-3)
– Steady state conditions was established(~0s)
– Start power level transient(@0s) – Modulations of key input parameters
according to experimental data specification of SP-3 during simulation period(~ 6500s)
• Core power level • Secondary feed water temperature • Secondary feed water mass flow rate • Secondary steam outlet pressure
– Pressurizer heater was modeled by on/off control
• Operating when PZR pressure became less than 1250psi(g)
2012-03-28 IAEA ICSP 3rd Workshop, March 27-30, 2012, Daejeon, Korea 16

SP-3: Model descriptions(cont.) • Initial and boundary conditions
– Secondary feed water inlet temperature (304.64K@0s) was set according to experimental data specification
– Secondary feed water inlet mass flow rate (0.01018kg/s@0s) was set according to experimental data specification
• Initial and boundary conditions(cont.) – Steam outlet pressure(1.446Mpa@0s) was set
according to experimental data specification
– Core power (40kW@0s) was set according to experimental data specification
2012-03-28 IAEA ICSP 3rd Workshop, March 27-30, 2012, Daejeon, Korea 17

SP-3: Model descriptions(cont.) • Steady-state results for SP-3
2012-03-28 IAEA ICSP 3rd Workshop, March 27-30, 2012, Daejeon, Korea 18
Parameter MASLWR Unit Experimental Value Steady-State Value from Code Pressurizer pressure PT-301 MPa(a) 8.719325 8.719325(BC) Pressurizer level LDP-301 m 0.3574 0.3826 Power to core heater rods KW-101/102 kW 21.11/21.00 40(BC) Feedwater temperature TF-501 ºC 31.49 31.49(BC) Steam outlet temperature FVM-602-T ºC 205.44 205.35 Steam pressure FVM-602-P MPa(a) 1.446 1.446(BC) Ambient air temperature ºC 20-24 22(BC) Primary flow at core outlet FDP-131 kg/s N/A 0.87531 Primary coolant temperature at core inlet
TF-121/122/ 123/124 ºC
250.11/250.69 250.21/N/A 250.42
Primary coolant temperature at core outlet TF-106 ºC 262.76 259.82 Feedwater flow FMM-501 kg/s 0.010212678 0.0101758 Steam flow FVM-602-M kg/s N/A 0.0101758 Primary coolant subcooling at core outlet ºC N/A 41.437 Total heat loss through primary system kW 12.6 11.4 Heat transfer through SG kW 29.51 28.60 Maximum surface temperature of core heater rods ºC N/A 269.3
Location from the SG secondary inlet to reach - saturation - superheat m N/A
0(saturation) 0.9075(superheat)

SP-3: Transient simulation results
2012-03-28 IAEA ICSP 3rd Workshop, March 27-30, 2012, Daejeon, Korea 19
Primary Mass Flowrate Pressure Differences
Pressures of PZR & Steam outlet Secondary Mass Flowrate
BC

SP-3: Transient simulation results(cont.)
2012-03-28 IAEA ICSP 3rd Workshop, March 27-30, 2012, Daejeon, Korea 20
Core inlet
Core outlet
PZR
Primary temperature Secondary temperatures
Saturation begins
Liquid Fractions Core Rods Temperature
Liquid
Fraction

SP-3: Transient simulation results(cont.)
2012-03-28 IAEA ICSP 3rd Workshop, March 27-30, 2012, Daejeon, Korea 21
PZR Level Total System Mass
Heat Balances

SP-3: Transient simulation results(cont.)
2012-03-28 IAEA ICSP 3rd Workshop, March 27-30, 2012, Daejeon, Korea 22
• Overall prediction results of transient simulation of SP-3 experiment seemed to be reasonable
• Large heat loss of SP-3 experiment could affect simulation results – Steady state heat loss
estimated by experiment was 12.6kW. Otherwise 11.4kW was calculated by simulation
• PZR heater control was not elaborate enough
• Variation of surrounding air temperature also can affect the simulation results
• SP-3 Time Sequence of Events
Event Time (s)
Start of simulation – steady state (start of data collection) 0
Initiate core power increase to 80 kW 27
Initiate core power increase to 120 kW 908
Initiate core power increase to 160 kW 1690
Initiate core power increase to 200 kW 2221
Initiate core power increase to 240 kW 4030
Initiate core power increase to 280 kW 4527
Initiate core power increase to 320 kW 5136

Conclusions • Helical coil geometry specific wall-to-fluid heat transfer models of MARS-
KS code seems to give reasonable predictions – Exact area code multiplier value was used for heat structure of the lumped
helical tubes – Steady states comparisons of SP-2 and SP-3 between experiments and
simulations showed reasonable agreements • Heat losses modeling seems to be very important for accurate simulations
of SP-2 and SP-3 experiments – Code calculation of SP-2 experiment without heat loss modeling of ADS line
showed much faster depressurization and pressure equilibrium between RPV and HPC
– Modeling strategy of HPC & CPV is very important for SP-2(3rd workshop) – SP-3 experiment showed a large heat loss
• Level tracking option of MARS and RELAP codes were not robust when non-condensable gas was involved – Convergence problem was observed when level tracking option was turned on
for volumes of HPC and CPV
IAEA ICSP 3rd Workshop, March 27-30, 2012, Daejeon, Korea 23 2012-03-28
Thank you for your attention!
IAEA ICSP 3rd Workshop, March 27-30, 2012, Daejeon, Korea 24 2012-03-28