dot/faa/ar-97/65 stabilized base courses for advanced ... · dot/faa/ar-97/65 office of aviation...
TRANSCRIPT

DOT/FAA/AR-97/65
Office of Aviation Research Washington, D.C. 20591
Stabilized Base Courses for Advanced Pavement Design Report 1: Literature Review and Field Performance Data
September 1999
Final Report
This document is available to the U.S. public through the National Technical Information Service (NTIS), Springfield, Virginia 22161.
U.S. Department of Transportation Federal Aviation Administration

NOTICE
This document is disseminated under the sponsorship of the U.S. Department of Transportation in the interest of information exchange. The United States Government assumes no liability for the contents or use thereof. The United States Government does not endorse products or manufacturers. Trade or manufacturer's names appear herein solely because they are considered essential to the objective of this report. This document does not constitute FAA certification policy. Consult your local FAA aircraft certification office as to its use.
This report is available at the Federal Aviation Administration William J. Hughes Technical Center's Full-Text Technical Reports page: www.tc.faa.gov/its/act141/reportpage.html in Adobe Acrobat portable document format (PDF).

Technical Report Documentation Page
1.
DOT/FAA/AR-97/65
2. Government Accession No. 3. alog No.
4. itle and Subtitle
STABILIZED BASE COURSES FOR ADVANCED PAVEMENT DESIGN
5.
September 1999
REPORT 1: LITERATURE REVIEW AND FIELD PERFORMANCE DATA 6. ming Organization Code
7. Author(s)
William P. Grogan, Charles A. Weiss, Jr., and Raymond S. Rollings
8. ming Organization Report No.
9. ming Organization Name and Address
U. S. Army Engineer Waterways Experiment Station 3909 Halls Ferry Road
10. (TRAIS)
Vicksburg, MS 39180-6199 11. Grant No.
DTFA03-94-X-00010 12. Agency Name and Address
U.S. Department of Transportation Federal Aviation Administration
13. rt and Period Covered
Final Report
Office of Aviation Research Washington, DC 20591
14. Agency Code
AAS-200
Report No. Recipient's Cat
T Report Date
Perfor
Perfor
Perfor Work Unit No.
Contract or
Sponsoring Type of Repo
Sponsoring
15. mentary Notes
FAA William J. Hughes Technical Center COTR: gong Lee
16. Abstract
The Federal Aviation Administration requires the use of stabilized bases for all pavements that will be required to support aircraft weighing 45,350 kg (100,000 lbs) or more. literature review was performed to determine the current state of the art in terms of understanding stabilization mechanisms, design procedures, and considerations. were collected to provide a review of the performance of many pavements at high-volume airports that support heavy aircraft loads. Field data collected included structural data in the form of nondestructive testing (NDT) performed with a falling weight deflectometer, visual condition survey using the pavement condition index (PCI) procedure, and construction and maintenance history data. The NDT was evaluated to determine modulus values for the various pavement layers. he PCI data were compared to historic PCI data to determine trends in performance. he construction and maintenance history records were reviewed to determine rehabilitation efforts required to maintain the pavements at appropriate levels.
17. y Words
Stabilization, Base course, ndestructive testing (NDT), Pavement condition index (PCI)
18. Statement
This document is available to the public through the National Technical Information Service (NTIS), Springfield, Virginia 22161.
19. y Classif. (of this report)
Unclassified
20. y Classif. (of this page)
Unclassified
21.
55
22.
N/A
Supple
Dr. Xiao
AField data
TT
Ke
No
Distribution
Securit Securit No. of Pages Price
Form DOT F1700.7 (8-72) Reproduction of completed page authorized

PREFACE
The research reported herein was sponsored by the U.S. Department of Transportation, Federal Aviation Administration (FAA), Airport Technology Branch, under Interagency Agreement DTFA03-94-X-00010 by the Airfields and Pavements Division (APD), Geotechnical Laboratory (GL), U.S. Army Engineer Waterways Experiment Station (WES), Vicksburg, MS. Dr. Xiaogong Lee, Airport Technolgy Branch, FAA was the technical monitor. Dr. Satish Agrawal is the Manager, Airport Technology Branch, FAA.
This study was conducted under the direct supervision of Mr. T.W. Vollor, Chief, Materials Analysis Branch (MAB), APD, and under the general supervision of Dr. W.F. Marcuson III, Director GL. The project principal investigator (PI) was Mr. William P. Grogan, MAB. The authors of this report were Mr. William P. Grogan and Drs. Charles A. Weiss, Jr. and Raymond S. Rollings.
At the time of preparation of this report, the Director of WES was Dr. Robert W. Whalin, the Commander was Colonel Bruce K. Howard, EN.
iii/iv

TABLE OF CONTENTS
Page
EXECUTIVE SUMMARY vii
LITERATURE REVIEW 1
Introduction 1Stabilization Mechanisms 1Design Procedures 3
Mix Designs 3Thickness Design 4
Considerations 4
FIELD PERFORMANCE DATA 5
Introduction 5
Background 5Purpose 5Scope 6
Approach 6Site Selection 6Data Selection 7Field Testing Procedures 7
Pavement Condition Survey 7Nondestructive Testing 9Laboratory Testing Procedures 9
SUMMARY OF DATA 9
Atlanta International Airport 10Dallas/Fort Worth International Airport 10John F. Kennedy International Airport 11Phoenix Sky Harbor International Airport 11Stapleton International Airport 11
DISCUSSION OF DATA 12
Atlanta International Airport 12Dallas/Fort Worth International Airport 13
v

John F. Kennedy International Airport Phoenix Sky Harbor International Airport Stapleton International Airport
FIELD OBSERVATIONS
Atlanta International AirportDallas/Fort Worth International AirportJohn F. Kennedy International AirportPhoenix Sky Harbor International AirportStapleton International Airport
CONCLUSIONS
REFERENCES
APPENDICES
ABibliography
15 15 16
17
17 18 19 19 19
20
21
BPetrographic Analysis of Specimens from Dallas/Fort Worth International AirportCFiguresDTables
LIST OF FIGURES
Figure Page
1 Pavement Condition Index Numerical Value Versus Condition Rating 8
LIST OF TABLES
Table Page
1 Distress Types and Their Associated Distress Mechanism 8
2 Average PCI and SCI for all Pavements Surveyed at Dallas/Fort Worth International Airport 13
3 Summary of Results of Laboratory Testing, Dallas/Fort Worth International Airport 14
4 Average PCI and SCI Values for all Pavements Surveyed, Phoenix Sky Harbor International Airport 16
vi

EXECUTIVE SUMMARY
The Federal Aviation Administration (FAA) requires the use of stabilized base courses for all pavements that will support aircraft weighing 45,350 kg (100,000 lbs) or more. This report documents the effort sponsored by the FAA to examine the performance of pavements with stabilized base courses.
This report contains a literature review which examines the current state of the art in terms of understanding stabilization mechanisms, design procedures, and considerations. This report also documents field data which were collected to provide a review of the performance of pavements with stabilized base courses. Airports included in this study had been studied in the mid 1980s in an effort sponsored by the FAA. The same airports, all high-volume airports supporting large aircraft operations, were selected to allow for the analysis of pavement performance over time.
The field data collected included pavement condition index (PCI) data and nondestructive data (NDT) obtained with falling weight deflectometers. The PCI data provides a means of visually assessing the performance of the pavements. The NDT data provides input to structural evaluations by allowing for the backcalculation of layer modulus values for the various layers in the pavement systems. Construction and maintenance history data were also collected to determine the effort required to maintain the pavements at an acceptable level of performance. Samples were collected at one site to allow for an in-depth examination of the performance of the stabilized layer material.
The PCI data indicated most pavement sections with stabilized bases were performing adequately. The NDT data indicated that it is difficult to differentiate between a surface layer and a like stabilized supporting layer. The maintenance and construction records indicated that routine maintenance has been adequate to maintain most pavement sections at an adequate level of serviceability. The most interesting result of the in-depth material study was that the stabilized base course was the apparent source of material being pumped to the surface. This indicated that the stabilized base course was being eroded.
The overall results of this study indicate that Portland cement concrete pavements with cement stabilized layers are performing well and are supporting aircraft at a level of performance at or above the design level for the life of the pavements. The data concerning asphalt stabilized layers were limited. The majority of pavements with asphalt stabilized layers required major rehabilitation or reconstruction of the hot mix asphalt surface course. The required work may have been due to inappropriate surface course mix design or poor construction. However, the limited number of pavement sections with asphalt stabilized layers makes it difficult to draw definitive conclusions.
vii/viii
LITERATURE REVIEW
The results of this review revealed considerable references to published information on the design, construction, chemical and mechanical mechanisms, and performance of stabilized base course materials for use in pavements. The majority of the work in stabilized materials was done in or before the 1970s. During the 1980s and 1990s, very little effort was expended on advancing the understanding or applications of base course stabilization. Particularly in terms of traditional stabilization techniques such as lime, cement, and asphalt.
A total of 51 different reports, periodicals, books, standards, and technical papers were reviewed and all are listed as a bibliography in appendix A.
INTRODUCTION.
When a site is selected for constructing a new pavement or rehabilitating an old pavement, the in-place materials may be used as they naturally occur. The materials may also be removed and replaced with higher quality materials, or they may be modified in some manner to provide qualities that are appropriate. When the soils are modified, it is referred to as stabilization. The reasons for stabilizing soils include improving properties such as volume stability, strength, durability, and permeability. [1] Either all or some of these properties may be sought to be improved. The most suitable stabilizing procedure will usually be dictated by the particular property or properties that are desired and the type of material in place. It is most common to stabilize materials such as high-plasticity clays to reduce their susceptibility to moisture. However, the Federal Aviation Administration (FAA) requires the use of stabilized layers directly beneath the surface course for airport pavements that will support large aircraft. This requirement usually results in the stabilization of materials that are of a relatively high quality initially, particularly when compared to high-plasticity clays. The amount of literature available on stabilization of relatively high-quality materials is limited. For the most part, these high-quality stabilized materials can be classified as low-quality surface materials. Guidance on these materials is similar or identical to the guidance for surface materials such as Portland cement concrete (PCC) or hot-mix asphalt concrete (HMAC).
STABILIZATION MECHANISMS.
The mechanisms of stabilization can be divided into two broad areas, mechanical and chemical. Mechanical stabilization includes compaction, blending of aggregates to improve gradation, and addition of asphalt cement. Asphalt cement does not react chemically with the materials being stabilized but coats the particles and imparts adhesion and helps waterproofing. Chemical stabilization includes the addition of materials such as lime, cement, or fly ash in combination or alone. These materials either react chemically with the material being stabilized (i.e., lime reacts with clays) or react on their own to form cementing compounds (i.e., Portland cement).
Compaction, the earliest form of stabilization, improves strength and reduces permeability. Another form of mechanical stabilization involves blending of aggregates with the natural soil. By changing the gradation of the in-place material with additional material, improvements can be gained in the ability to compact the soil to appropriate levels. Also a reduction in the
1

susceptibility of the material to moisture can be realized and improved strength and performance can result.
The addition of asphalt concrete (AC) or some form of bitumen to a material is considered mechanical stabilization. The AC coats the aggregates and imparts strength through adhesion. However, AC is a thermally sensitive visco-elastic material and therefore the strength is dependent on temperature and the time rate of loading. AC also helps to waterproof the material being stabilized by filling the voids. Fine-grained materials are generally not appropriate for stabilization with AC because of the difficulty in coating the individual particles.
Lime is probably the most common stabilizing agent used. Lime is particularly useful for stabilizing high-plasticity clays or fine-grained soils. Lime reacts chemically with the fine-grained material through a process termed cation exchange. The lime creates a surplus of Ca++
cations which tend to replace monovalent cations. [2] This cation exchange process results in the clay soil becoming much less susceptible to moisture (i.e., more stable in terms of volume change). In addition to the cation exchange, a flocculation-agglomeration phenomenon occurs. This can be described as a change in texture through the clumping together of smaller particles to create apparent larger particles. This also results in an apparent change in gradation, making the clay more friable and sand like in its behavior. [2] The first two reactions, cation exchange and flocculation-agglomeration, occur very quickly. A third, long-term, pozzolanic type reaction can also occur. This reaction depends on the clay mineralogy and the amount of calcium still available after the initial reactions have taken place. The pozzolanic reaction results in a long-term strength gain. This strength gain process can continue for years. A process known as autogenous healing is also a result of the pozzolanic reaction and results in strength regain after strength loss during such times as thaw weakening. Not all clay or fine-grained materials will react with lime and result in the improvements discussed previously. There are many factors that affect the reactivity of lime with a material and they include the soil pH, organic carbon content, natural drainage, excess quantities of exchangeable Na, clay mineralogy, degree of weathering, presence of carbonates, extractable iron, silica-sesquioxide ratio, and silica-alumina ratio. [2] Therefore if the soil is not reactive, it is not appropriate to be stabilized with lime.
Unlike lime stabilization, the reaction that occurs with cement stabilization is not dependent on the type of material being stabilized. Cement stabilization is a chemical reaction that occurs when cement hydrates. The cement reaction is independent of the material with which it is in contact. Also, unlike lime-stabilized material, cement-stabilized material does not autogenously heal.
Fly ash, an industrial by-product resulting form the burning of ground or powdered coal, is a pozzolanic material. Fly ash needs to be mixed with an activator to form cementitous compounds. The required activator will depend on the source and chemical composition of the fly ash and the material with which it is mixed. Some materials will activate the fly ash; lime or cement may be used to act as an activator by providing the required calcium hydroxide. [3] There are naturally occurring pozzolans and pozzolans from industrial sources. An example of a natural pozzolan is the sandy volcanic ash from near Vesuvius that the Romans mixed with lime, water, and aggregate to make a waterproof concrete. Blast furnace slag from the production of
2
iron can be ground and mixed with water and a source of calcium hydroxide to form a cementitous material. [3]
There are also a number of specialized stabilizers for which there is little technical information or test data. These stabilizers are sold under trade names. ASTM D 4609 [4], American Society for Testing and Materials, provides guidance in evaluating these products in terms of unconfined compressive strength, Atterberg limits, particle size, moisture density relationship, and volume change before and after treatment. These products are primarily useful in stabilizing fine-grained soils and are generally not applicable for use in stabilizing the base course directly beneath the surface course for airport pavements supporting heavy aircraft loads. For a listing of these materials by category and potential uses, see reference 3.
The following sections will focus on the primary types of stabilizing agents (lime, cement, and AC) used for stabilizing base course materials in heavy-duty pavements.
DESIGN PROCEDURES.
MIX DESIGNS. The mix design for stabilized-material layers is driven by the property or properties that are desired. Some stabilization projects are required simply to provide a construction platform and are not intended to provide additional long-term strength or a reduction in pavement layer thicknesses. When this is the case, the minimum additive percentage is determined that will result in the required performance, for example the reduction in plasticity for clay soils, and it is not necessary to test for strength or durability requirements.
In general the mix design for lime- or cement-stabilized materials is similar, particularly when designing for a structural pavement layer. The mix design procedures consist of testing for strength, then testing for durability. The durability test to be conducted, either freeze-thaw or wet-dry, depends on the anticipated conditions. The exact methods for determining the initial additive content and the ways for conducting the tests vary slightly, but the results are the same. Minimum values must be met in order to consider the acceptable material. The Corps of Engineers requires that stabilized materials reach a minimum of 750 psi and 250 psi unconfined compressive strength to be used as a base or subbase course respectively for flexible pavements. The Corps requires that the unconfined compressive strength of the material reach 500 psi for the base course and 200 psi for the subbase course when used in rigid pavements. [5] The ASTM publishes standards for fabricating and testing stabilized specimens. The ASTM procedures include tests for strength, density, and durability are contained in references 6 through 16. FAA standards for cement-stabilized bases [17] call for laboratory specimens to be tested in accordance with ASTM D 558 [6]. In addition, in-place field density is determined by ASTM D 1556 [8] or ASTM D 2167 [13]. The same testing requirements also apply to lime-treated subgrade layers.
The asphalt-stabilized layer mix design procedures include procedures similar to the standard asphalt mix design procedures such as the Marshall or Hveem. Some agencies use procedures such as triaxial tests, repeated load triaxial, or various penetration tests. There is no consensus for stabilizing with bituminous materials. [3] Coarse-grained materials are better candidates for stabilization with AC. Fine-grained materials are difficult to mix with AC and coverage of individual particles is virtually impossible. Some fine-grained soils have been successfully
3

stabilized with bitumen. The AC does not coat all the individual particles but coats agglomerations of particles.
THICKNESS DESIGN. Virtually any design procedure can be modified to include stabilized layers within the pavement section. The difficulty in including the stabilized layer is determining appropriate performance or failure criteria. The particular criteria used will dictate the material properties required to be determined. For example, if a fatigue criteria based on flexural strength is used for designing the stabilized layer, it will be necessary to measure the flexural strength of the stabilized layer.
The Corps of Engineers procedure for the design of rigid airfield pavements allows for a reduction in thickness of the PCC if the stabilized layer meets strength, gradation, and thickness requirements specified. [18] The Corps flexible airfield pavement design procedure using the California Bearing Ratio (CBR) method requires that a conventional pavement be designed and that then provides equivalency factors for stabilized materials. [19]
Similarly, the FAA design procedure for rigid pavements allows a reduction in PCC thickness for stabilized subbases meeting FAA requirements. This reduction is achieved by increasing the value of the subgrade modulus (k-value) used for design, reflecting the effect of the stabilized subbase. Similar to the Corps procedure, the FAA flexible pavement design procedure provides equivalency factors for stabilized layers that have the effect of reducing the total design thickness [20].
For roads, streets, and highways, the American Association of State Highway and Transportation Officials (AASHTO) design procedure requires the use of the resilient modulus along with either the unconfined compressive strength (for cement-treated bases) or the marshall stability (for bituminous-treated bases) for determining the layer coefficient used in the design of the pavement section. [21]
Layered elastic design procedures such as the FAA standard LEDFAA [22] allow for a modulus value to be input. Based on the moduli and some other material properties, stresses can be determined at various points in the pavement system. Critical stress points, such as at the bottom of the stabilized layer, are determined. These critical stresses are compared to allowable stresses based on fatigue relationships and strength tests performed on the stabilized material. Short comings of the layered elastic approach include the idealization of the stabilized layer as a homogeneous, isotropic, continuous layer.
Although design procedures can be modified to include stabilized layers, the modeling and applicable criteria may be difficult to accurately perform and apply.
CONSIDERATIONS.
With each type of stabilizing material, there are advantages and disadvantages and areas for consideration that are potential problems. One disadvantage with cement stabilization is the tendency for the stabilized layer to crack when the percent cement is above 4 to 5. This shrinkage cracking can reflect through the surface course, particularly for flexible pavements, and provide an avenue for moisture to invade the pavement and weaken the underlying layers.
4

Other items for consideration with cement-stabilized layers include admixtures, freeze-thaw protection (strength, durability), sulfate attack, pumping, acid sandy soils, and carbonation. In regards to admixtures, there are many products on the market intended to enhance particular aspects of the cement-stabilized layer. The long-term effects as well as the cost-effectiveness of these products needs to be determined prior to use. Freeze-thaw protection is usually assumed to be provided if the stabilized layer has sufficient strength. Durability tests are correlated to strength in an attempt to ensure that freeze-thaw protection is provided. There is some concern as to the applicability of the durability tests, whether or not they accurately or adequately predict the durability of the cement-stabilized material in the field (see references 23, 24, 25). Sulfate attack is a localized problem that causes the stabilized layer to expand and thereby destroy the useability of the pavement through differential heave. Some cement-stabilized layers have pumped eroding and thereby reduce the support to the overlying pavement structure. Acid sandy soils are soils that will prevent the cement from hydrating and therefore no strength gain is realized. Carbonation, a potential durability problem for cement-stabilized materials, is the reaction of the calcium hydroxide with carbon dioxide to form calcium carbonate. Carbonation has not been identified as a problem in the U.S. However, it is not known if it has not occurred or if it has not been recognized. More work is required in this area. [3]
Concerns for lime-stabilized soils are similar to those for cement-stabilized soils. In addition, concerns of moisture effects and leaching are unique to lime-stabilized materials. The strength of lime-stabilized materials is more sensitive to moisture content. Also, leaching of the lime from the soil can occur, causing the stabilized soil to revert back to the chemical composition before stabilization and therefore the undesirable properties return.
Concerns for bituminous-stabilized soils are related to guidance and stripping. Guidance on materials that are appropriate and can be expected to perform adequately are limited. Stripping is also a potential problem where the asphalt binder is stripped from the stabilized material and no longer provides the positive properties for which it was included, i.e., adhesion and waterproofing.
FIELD PERFORMANCE DATA
INTRODUCTION.
BACKGROUND. The FAA requires the use of stabilized base courses for all pavements that will support aircraft weighing 45,350 kg (100,000 pounds) or more. This requirement is delineated in Advisory Circular 150/5320-6D. [20] The FAA’s decision to require stabilized bases was based on the performance observed in pavements with stabilized bases in accelerated load tests conducted by the Corps of Engineers. [26]
Because pavements are subjected to a complex interaction of loadings from aircraft and the environment, the design process involves many variables which are difficult to quantify. Although a great deal of pavement research has been conducted through the years, a direct mathematical solution capable of determining required pavement layer thicknesses and material types has not been achieved. For this reason, pavement design procedures contain assumptions and simplifications that allow the engineer to design a pavement with reasonable confidence that it will perform adequately for its design life. Pavement design is based on theory, laboratory
5

study, and the results of field performance studies. Field investigations are necessary to determine how the existing technology has performed and where deficiencies might exist. The theory, design, and construction practices need to be periodically reviewed and modified as necessary to correct deficiencies that are identified in field performance studies.
PURPOSE. The purpose of the field investigation portion of this study is to investigate the in-service performance of pavements that contain stabilized bases. This report documents the findings of field surveys and nondestructive testing performed on pavement sections at Atlanta International Airport (ATL), Atlanta, Georgia; Dallas/Fort Worth International Airport (DFW), Dallas, Texas; John F. Kennedy International Airport (JFK), New York, New York; Sky Harbor International Airport (PHX), Phoenix, Arizona; and Stapleton International Airport, Denver, Colorado.
SCOPE. This study includes the determination of the present surface, the structural condition of select pavements, and an analysis of the condition of some of the pavements over many years. A review of performance over time was possible because some of the pavement sections evaluated for this investigation were also evaluated in 1983 for the FAA sponsored study reported in “Evaluation of the FAA Design Procedure for High Traffic Volume Pavements.” [27]
It was intended that the stabilized-base study be limited to flexible and rigid pavements with stabilized base courses that had not received overlays. However, only one flexible pavement section that was included in the 1983 high-volume study [27] has not received an overlay or major rehabilitation. Therefore, some flexible pavements that have been overlayed or received major rehabilitation have been included in this study. Specimen testing was conducted on cores obtained from pavement sections being reconstructed at DFW.
APPROACH.
The basic approach for the field evaluation portion of this study was as follows:
1. Selection of airports to be included in the study
2. Selection of the data to be collected at each site
3. Data analysis
4. Compilation of the data and assessment of the performance of pavements with a stabilized base
SITE SELECTION.
Several of the airports that were chosen for this study were evaluated in 1983 for the FAA sponsored high-volume study. [27] These airports were included in this study so that the performance history of pavements with stabilized bases could be evaluated. The airports included in both the high-volume study and this study were ATL, DFW, JFK, and PHX. Because ATL and JFK have been evaluated periodically by private engineering firms, it was decided by the FAA that data from these engineering firms should be used so that more effort
6

could be concentrated on the other airports. Data for ATL were provided by Law Engineering, Inc., Atlanta, Georgia. Data for JFK were provided by the Port Authority of New York and New Jersey. The data collected for DFW, PHX, and Stapleton International Airport were collected by a team from the Waterways Experiment Station (WES). Pavements at Stapleton International Airport were evaluated because of the unique opportunity provided by the airport being closed. Stapleton International Airport is closed to all aircraft because it is located in the flight path of the recently opened Denver International Airport.
DATA SELECTION.
The type of data selected to be gathered for this study was defined under the Interagency Agreement. The requirements in the agreement were to gather available construction and air traffic data, perform pavement evaluations to calculate pavement condition index (PCI) and structural condition index (SCI) values, and conduct falling weight deflectometer (FWD) tests to determine elastic dynamic responses of the stabilized pavement systems being studied. Because some pavements at DFW were being replaced after approximately 21 years of service, a unique opportunity was provided for gathering samples. The FAA directed that several specimens of the PCC surface course and the cement-stabilized base course be obtained and brought to WES for laboratory testing and study.
FIELD TESTING PROCEDURES.
The field testing procedures conducted at each site included pavement condition surveys and nondestructive testing. Laboratory testing was conducted on specimens collected at DFW.
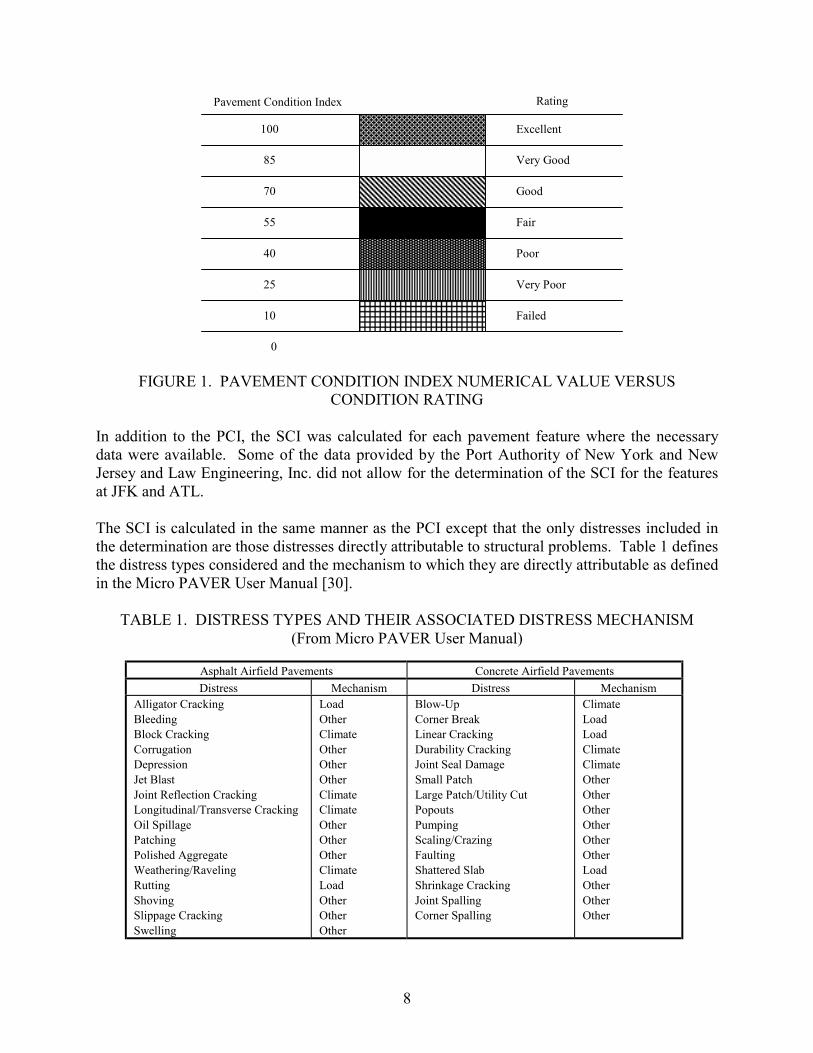
PAVEMENT CONDITION SURVEY. A pavement condition survey is a visual inspection procedure for determining the present surface condition. The condition survey consists of inspecting a portion of the pavement surface for the various types of distresses, determining the severity of each distress, and measuring the quantity of each distress. The condition survey provides estimated quantities of each distress type and severity from which the PCI can be determined. The PCI is a numerical indicator based on a scale of 0 to 100 and is determined by measuring pavement surface distress that reflects the surface condition of the pavement. Pavement condition ratings (from excellent to failed) are assigned to different levels of numerical PCI values. These ratings and their respective PCI value definitions are shown in figure 1. The distress types, distress severities, methods of survey, and PCI calculations are described in references 28 and 29.
The PCI procedure involves dividing a pavement into features which are defined as areas of pavement of like cross section subjected to similar traffic. A feature is divided into sample units to facilitate the inspection process. Sample units for AC pavements are approximately 465 sq. m (5,000 sq. ft), and the sample units for PCC pavements contain approximately 20 slabs. A statistical sampling technique is often used to determine the required number of sample units to be surveyed to provide a specified confidence level in the results of the survey. For this project, as many sample units as possible were surveyed, generally 100 percent. After the sample units are inspected, the mean PCI of all the sample units within a feature is calculated and the feature is rated as to its condition: excellent, very good, good, fair, poor, very poor, and failed.
7
Pavement Condition Index Rating
100 Excellent
85 Very Good
70 Good
55 Fair
40 Poor
25 Very Poor
10 Failed
0
FIGURE 1. PAVEMENT CONDITION INDEX NUMERICAL VALUE VERSUS CONDITION RATING
In addition to the PCI, the SCI was calculated for each pavement feature where the necessary data were available. Some of the data provided by the Port Authority of New York and New Jersey and Law Engineering, Inc. did not allow for the determination of the SCI for the features at JFK and ATL.
The SCI is calculated in the same manner as the PCI except that the only distresses included in the determination are those distresses directly attributable to structural problems. Table 1 defines the distress types considered and the mechanism to which they are directly attributable as defined in the Micro PAVER User Manual [30].
TABLE 1. DISTRESS TYPES AND THEIR ASSOCIATED DISTRESS MECHANISM (From Micro PAVER User Manual)
Asphalt Airfield Pavements Concrete Airfield Pavements
Distress Mechanism Distress Mechanism Alligator Cracking Bleeding Block Cracking Corrugation Depression Jet Blast Joint Reflection Cracking Longitudinal/Transverse Cracking Oil Spillage Patching Polished Aggregate Weathering/Raveling Rutting Shoving Slippage Cracking Swelling
Load Other Climate Other Other Other Climate Climate Other Other Other Climate Load Other Other Other
Blow-Up Corner Break Linear Cracking Durability Cracking Joint Seal Damage Small Patch Large Patch/Utility Cut Popouts Pumping Scaling/Crazing Faulting Shattered Slab Shrinkage Cracking Joint Spalling Corner Spalling
Climate Load Load Climate Climate Other Other Other Other Other Other Load Other Other Other
8

NONDESTRUCTIVE TESTING. Nondestructive tests were performed on the pavements with the Dynatest heavy falling weight deflectometer (HWD) or model 8000 falling weight deflectometer (FWD). Both the HWD and the FWD operate similarly, however the HWD is capable of applying a maximum force of approximately 224 kN (50,000 lbs) while the FWD is capable of applying a maximum force of approximately 112 kN (25,000 lbs). The nondestructive testing (NDT) equipment are impact load devices that apply a single-impulse transient load of approximately 25-30 millisecond duration. With these trailer mounted devices, a dynamic force is applied to the pavement surface by dropping a weight onto a set of rubber cushions which results in an impulse loading on an underlying circular plate 30 cm (11.8 in.) in diameter that is in contact with the pavement. The applied force and the pavement deflections are respectively measured with load cells and velocity transducers. The drop height of the weights can be varied from 0 to 39.9 cm (15.7 in.) to produce a force from 0 to the approximate maximum force the device is capable of producing.
Seven seismic velocity transducers are used to measure the pavement deflections under the applied loads by the circular load plate. The first of the seven sensors is located at the center of the load plate, D0. The other six sensors are labeled as D1 through D6 and located at the distances of 30 cm (12 in.), 61 cm (24 in.), 91 cm (36 in.), 122 cm (48 in.), 152 cm (60 in.), and 183 cm (72 in.), respectively, from the D0. The systems are controlled by a microcomputer that also records the deflection basin measurements computed from velocities from the seven sensors.
The analysis of the NDT data to obtain modulus values for the various layers of the pavement systems was accomplished in accordance with the method described in the Department of the Air Force Technical Manual. [31] The calculation procedure involves the input of the measured deflection basins, layer thicknesses, and layer types into a layered elastic multilayered backcalculation program to determine the surface, bases, and subgrade modulus values. The program determines a set of modulus values which provide the best fit between a measured deflection basin (NDT) and a computed (theoretical) deflection basin.
LABORATORY TESTING PROCEDURES. Laboratory tests were conducted on the samples obtained from DFW and brought back to WES. The engineering testing consisted of compressive strength, tensile strength, and the determination of the modulus of elasticity. The compressive strength tests were accomplished in accordance with ASTM C 39-93. [32] The splitting tensile strength testing was performed in accordance with ASTM C 496-90. [33] The modulus of elasticity tests were performed in accordance with ASTM 469-94. [34]
In addition to the strength and modulus testing, petrographic analysis was conducted on the samples obtained from DFW. The petrographic investigations included x-ray diffraction (XRD), scanning electron microscope (SEM), and energy-dispersive x-ray (EDX) analysis. The procedures and results of this testing are presented in appendix B.
SUMMARY OF DATA
This section of the report presents a summary of the data collected at each airport. The physical property data for each airport summarizes the material properties for each pavement layer. For the airports included in the high-volume study, [27] the basic physical property data were obtained from that report. The thicknesses shown for the various pavement layers are the
9

nominal design thicknesses. The other physical property data shown are based on design or planning documents. Results of tests performed on cores obtained for this study are reported in separate tables.
All of the pavement sections evaluated in this report were primary taxiway pavements. No runway pavements were included in this study because none were included in the high traffic volume study. [27] The reason for not including runways in the high traffic volume study was because of the time requirement for closing the pavement to conduct NDT and the PCI visual survey.
All of the runway and taxiway pavements at PHX were AC in 1983. Several sections that had been included in the high-volume study at Phoenix were not included in this study because they have been completely reconstructed using PCC. The sections at Phoenix that were not reconstructed with concrete were rehabilitated by having the top layer of AC milled off and replaced with a new HMAC layer.
ATLANTA INTERNATIONAL AIRPORT.
The pavement data collected at ATL that was used for this report were obtained from two studies conducted by Law Engineering, Inc., Atlanta, Ga., in 1991 and 1995. The unprocessed NDT data collected by Law Engineering, Inc. and reported in their 1995 report were analyzed using the procedures detailed in reference 31.
The pavements evaluated at ATL were constructed in 1979 and were in service for 16 years at the time of this study. The pavements were designed for a 20-year design life. All the pavements evaluated at ATL are rigid pavements with approximately 0.06 percent temperature steel. The slabs in the pavements evaluated were a nominal 41 cm (16 in.) thick with transverse joint spacings of 7.5 m (25 ft). The longitudinal joints were keyed. It should be noted that a conclusion of the high traffic volume study indicated that keyed joints in highly channelized areas subjected to high traffic volumes should be limited, even when placed on strong subgrades.
The locations of the pavements examined for this study are shown in figure C-1 in appendix C. Table D-1, appendix D, summarizes the physical property characteristics of each pavement section studied. Tables D-2 and D-3 summarize the historic and recently collected PCI data. Table D-4 presents the results of the NDT data analysis.
DALLAS/FORT WORTH INTERNATIONAL AIRPORT.
Dallas/Fort Worth (DFW) was opened to aircraft traffic in 1974. Therefore, at the time of this study the pavements were approximately 21 years old, 1 year older than their design life. The pavements are all rigid, designed as jointed reinforced-concrete slabs. The original design called for doweled joints spaced at 15-m (50-ft) intervals. After construction commenced, the design was changed due to regular cracking being observed at approximately 7.5-m (25-ft) spacings (mid-slab). The remaining pavements were constructed with doweled joints at 15-m (50-ft) spacings and contraction joints were sawed at 7.5-m (25-ft) spacings. The longitudinal joints were drilled and epoxy doweled. The slabs contained approximately 0.07 percent temperature
10

steel. Slab thicknesses ranged from 38 to 46 cm (15 to 18 in.), and all were resting on a 23-cm (9-in.) cement-stabilized base over a 23-cm (9-in.) lime-stabilized subgrade.
The locations of the pavements tested at DFW for this study are shown in figure C-2. Table D-5 summarizes the physical property characteristics of each pavement section studied. Table D-6 summarizes the historic and recently collected PCI data. Table D-7 presents the results of the NDT data analysis. Table D-8 shows the traffic data reported by the Airport Development Department at DFW.
JOHN F. KENNEDY INTERNATIONAL AIRPORT.
The data used for evaluating the pavements at JFK were provided by the Port Authority of New York and New Jersey. The Port Authority has personnel on staff that conduct periodic condition surveys. The Port Authority contracts NDT data collection and analysis. The Port Authority provided the most recently collected NDT data. The unprocessed NDT data were evaluated using the procedure in reference 22.
The location of the pavements evaluated at JFK are shown in figure C-3. The physical property characteristics of the pavement sections are summarized in table D-9. The PCI data and results of the NDT analysis are shown in tables D-10 and D-11 respectively. Table D-12 summarizes the traffic data provided by the Port Authority.
PHOENIX SKY HARBOR INTERNATIONAL AIRPORT.
The pavements that were evaluated for the high-volume study [20] at Phoenix were all flexible pavements. Only four of the original eight sections evaluated in the high-volume study were still conventional flexible pavements at the time of this study. The other four sections have been reconstructed and are now PCC. Half of two of the remaining four flexible sections have also been reconstructed with PCC. All of the remaining flexible pavement sections had approximately 2 in. of AC milled off and replaced with a new HMAC surface course in 1991. The ages of the pavements tested for this report were 14 to 28 years.
The locations of the pavements tested at Phoenix for this study are shown in figure C-4. Table D-13 summarizes the physical property characteristics of each pavement section studied. Table D-14 summarizes the historic and recently collected PCI data. Table D-15 presents the results of the NDT data analysis. The traffic data provided by the City of Phoenix Aviation Department are shown in table D-16.
STAPLETON INTERNATIONAL AIRPORT.
Only one pavement feature was evaluated at Stapleton International Airport. Taxiway Z was chosen for evaluation because it met the requirements of having been in use for approximately 20 years without any major rehabilitation or repair work and contained a stabilized base layer.
The summary of physical property data for taxiway Z is shown in table D-17. The results of the PCI data collected for taxiway Z is shown in table D-18. Table D-19 shows the results of the analysis on the NDT data collected at Stapleton International Airport.
11

DISCUSSION OF DATA
The results of the data collected for the pavements being evaluated are discussed in the following section.
ATLANTA INTERNATIONAL AIRPORT.
Current PCI data for those sections evaluated in the past (1983, 1986) were not available since the airport does not require a PCI survey of its taxiways. In order to determine a trend, the PCI data collected for the runways were included as shown in table D-3.
If the taxiway pavements had continued to deteriorate at the rate which would have been anticipated based on the 1983 and 1986 surveys, they would be in total failure by the time of the 1995 survey. The average PCI of the sections surveyed in 1983 was 82 with a standard deviation of 4. The average PCI for these sections in 1986 was 69 with a standard deviation of 6. This indicates a rate of drop in PCI of 4 per year. Using a linear extrapolation from 1986 to 1995, the PCI would be expected to be 33 in 1995. However, from discussions with personnel of Law Engineering, Inc., Atlanta, Ga., it is apparent that these pavements are in much better condition than would have been predicted. Most of these pavements were constructed with keyed longitudinal joints. The taxiways were 23 m (75 ft) wide with 7.5-m (25-ft) joint spacings. This resulted in a keyed longitudinal joint in the wheel path. One of the conclusions of the high-volume study [20] was that keyed joints should not be used in highly channelized traffic areas, even when strong subgrades are anticipated. The early failure of many of these keys caused the PCI of these sections to drop significantly. Diligent repair of the failed keys in the mid to late 1980s proved successful, allowing these pavements to continue to provide a quality pavement for supporting aircraft. The personnel at Law Engineering, Inc. indicated that the performance of the taxiways has been very similar to the performance of the runways with the exception of the longitudinal key problem.
The SCI of the taxiway pavements at ATL remained at virtually 100 for the 1983 and 1986 surveys. The key failures were recorded as joint spalling and therefore were not defined as a structural problem. The Micro PAVER program attributes spalling to the mechanism of “other.” The mechanism “other” indicates the distress could be caused by the environment, loads, construction deficiencies, or any combination of these three items. The SCI of the runway pavements must be high since the PCI is high as shown in table D-3.
The results of the analysis of the NDT data shown in table D-4 indicate that it is difficult to differentiate between the PCC surface layer and the cement-stabilized base. One possible reason for the difficulty in differentiating the layers with NDT analysis is the similarity in magnitude of the strength of the layers. From strength tests [35], the mean splitting tensile strength for the PCC samples tested for the 1994 report was 614 psi with a standard deviation of 121 psi. The results of compressive strength tests on the cement-treated base averaged 3,571 psi with a standard deviation of 1,552 psi. [36] The compressive strength of 3,571 psi can be related to a tensile splitting strength value of approximately 425 psi. [37] Although samples that have similar strengths cannot be assumed to have similar stiffnesses, the fact that the specimens are like materials (PCC and cement treated base (CTB)) suggests that the trends in strength and stiffness would be similar.
12

---
---
In order to quantify the difficulty in obtaining reasonable modulus values for the different layers of the pavements, the average percent error can be examined. The average percent error indicates the error between the measured deflection basin and the theoretical deflection basin which was calculated based on the modulus values determined for each layer. The mean average percent error for all sections evaluated at ATL was 2.7 with a standard deviation of 1.7, when the PCC and CTB were treated as separate layers. The mean average percent error for those sections when the PCC and CTB were treated as one composite layer was 0.9 with a standard deviation of 0.4.
In terms of traffic operating on the pavements, the airport does not keep records of the number of operations for each feature. The method used by Law Engineering, Inc. for determining the number of operations for evaluation purposes is to divide the total operations by two to obtain departures, then divide this number by four to obtain departures for each of the four runways. This method probably comes within an order of magnitude of actual departures. The number used by Law Engineering, Inc. for total operations is approximately 800,000, which is near the peak seen in the late 1980s. The total number of operations for 1994 was 715,920.
DALLAS/FORT WORTH INTERNATIONAL AIRPORT.
Table 2 shows the average PCI and SCI for all the pavement features evaluated for the years 1983, 1986, 1990, and 1995. A real trend is difficult to determine from table 2 because the averages drop from 1983 to 1986, rise from 1986 to 1990, and then drop again from 1990 to 1995. According to maintenance personnel at DFW, no major rehabilitation or reconstruction was performed between 1986 and 1990. One possible reason for the unusual pattern in PCI is that the crews that surveyed the pavements in 1983 and 1986 defined some cracking as longitudinal/transverse cracking. In the 1995 survey, much of this same cracking was defined as shrinkage cracking.
TABLE 2. AVERAGE PCI AND SCI FOR ALL THE PAVEMENTS SURVEYED AT DALLAS/FORT WORTH INTERNATIONAL AIRPORT
Year 1983 1986 1990 1995
Mean PCI 82 63 85 79
Standard Deviation
10 25 8 8
Mean SCI 84 84 98
Standard Deviation
17 17 3
Observing the SCI performance history indicates no significant structural problems. If the 1983 and 1986 surveys are considered separately from the 1990 and 1995 surveys, the SCI appears to remain constant for each period. Although the SCI was not available for the 1990 survey because the actual survey data were not available, the mean SCI would have been expected to be between 98 and 100 based on the 1995 survey.
13
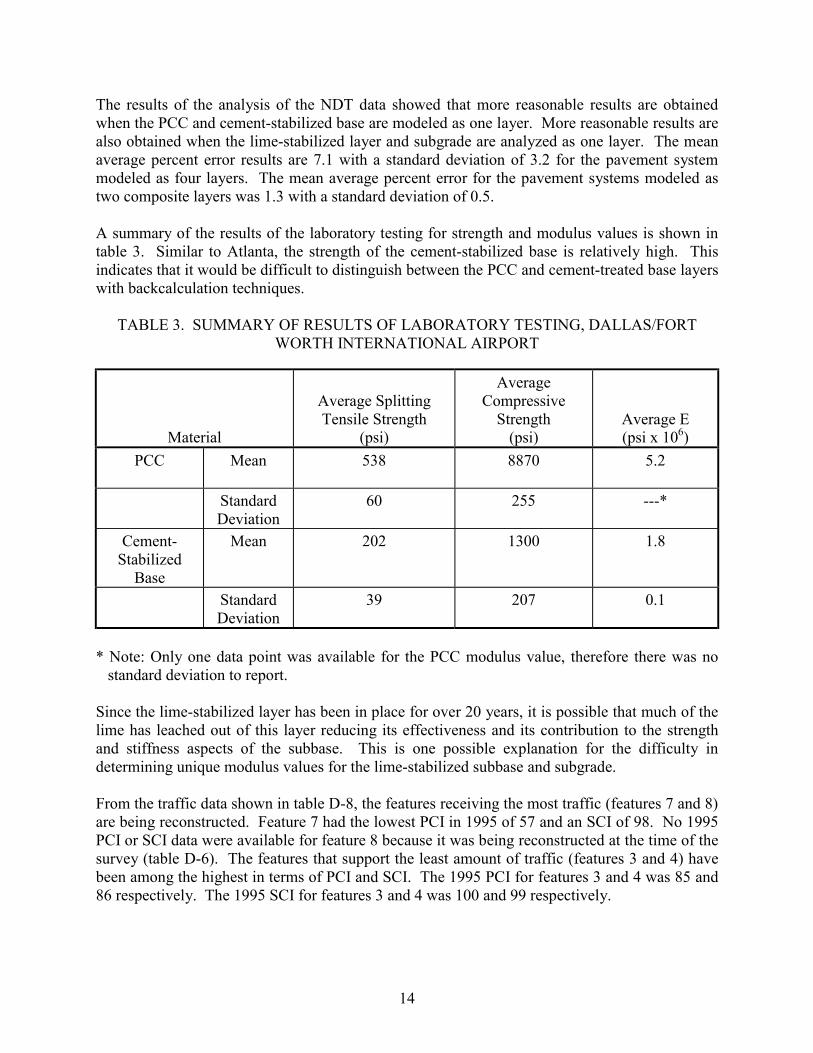
The results of the analysis of the NDT data showed that more reasonable results are obtained when the PCC and cement-stabilized base are modeled as one layer. More reasonable results are also obtained when the lime-stabilized layer and subgrade are analyzed as one layer. The mean average percent error results are 7.1 with a standard deviation of 3.2 for the pavement system modeled as four layers. The mean average percent error for the pavement systems modeled as two composite layers was 1.3 with a standard deviation of 0.5.
A summary of the results of the laboratory testing for strength and modulus values is shown in table 3. Similar to Atlanta, the strength of the cement-stabilized base is relatively high. This indicates that it would be difficult to distinguish between the PCC and cement-treated base layers with backcalculation techniques.
TABLE 3. SUMMARY OF RESULTS OF LABORATORY TESTING, DALLAS/FORT WORTH INTERNATIONAL AIRPORT
Material
Average Splitting Tensile Strength
(psi)
Average Compressive
Strength (psi)
Average E (psi x 106)
PCC Mean 538 8870 5.2
Standard Deviation
60 255 ---*
Cement-Stabilized
Base
Mean 202 1300 1.8
Standard Deviation
39 207 0.1
* Note: Only one data point was available for the PCC modulus value, therefore there was no standard deviation to report.
Since the lime-stabilized layer has been in place for over 20 years, it is possible that much of the lime has leached out of this layer reducing its effectiveness and its contribution to the strength and stiffness aspects of the subbase. This is one possible explanation for the difficulty in determining unique modulus values for the lime-stabilized subbase and subgrade.
From the traffic data shown in table D-8, the features receiving the most traffic (features 7 and 8) are being reconstructed. Feature 7 had the lowest PCI in 1995 of 57 and an SCI of 98. No 1995 PCI or SCI data were available for feature 8 because it was being reconstructed at the time of the survey (table D-6). The features that support the least amount of traffic (features 3 and 4) have been among the highest in terms of PCI and SCI. The 1995 PCI for features 3 and 4 was 85 and 86 respectively. The 1995 SCI for features 3 and 4 was 100 and 99 respectively.
14

JOHN F. KENNEDY INTERNATIONAL AIRPORT.
Of the four pavement sections included in the original 1983 study, only one has not been reconstructed or overlayed since 1983 according to records provided by the Port Authority of New York and New Jersey. The feature (feature 1) that has not been reconstructed or overlayed had a PCI of 92 in 1983 and a PCI of 60 in 1993. The SCI in 1983 was 95. The SCI was not available for 1993. Feature 1 at JFK is the only flexible pavement evaluated for this study (including those at Phoenix) that did not receive an overlay or major rehabilitation since the 1983 evaluation.
The evaluation of the NDT data provided by the Port Authority showed that the most reasonable results, for the flexible pavement feature with a bituminous-stabilized base course, were obtained when the HMAC surface course and bituminous-stabilized base course were modeled as a composite layer. The average percent error for feature 1 was 0.7 when the surface and base were modeled as one layer and it was 5.9 when the pavement system was analyzed with separate base and surface course layers. When the base was not bituminous stabilized, it was distinguishable from the surface course in terms of being able to back calculate modulus values for the different layers.
According to the traffic data provided by the Port Authority, the annual equivalent 747-200B departures for feature 1 was approximately 31,100 annually for the years 1975-1995. According to the high-volume study [27] the equivalent annual B-747 departures was 34,983 for this feature. Therefore, the total equivalent annual departures has remained fairly constant over the past 20 years.
PHOENIX SKY HARBOR INTERNATIONAL AIRPORT.
All of the pavements at PHX have had at a minimum the top course of AC milled off and replaced. Several of the pavements that were included in the high-volume study [27] have been reconstructed with PCC. The pavements that were reconstructed with PCC were not evaluated for this study. Since all of the pavements that were included in this study received major rehabilitation, examining the PCI trends indicates when major rehabilitation was considered necessary. Looking at the PCI trends shows that major rehabilitation was required for all the flexible pavements and that the rehabilitation technique of grinding off the surface course and replacing it drastically increased the PCI. How long this rehabilitation technique will provide a functional pavement is not known. Most of the rehabilitation was done in 1991, therefore it has been performing well for approximately 4 years. The types of distresses observed at PHX and the types of distresses that required the major rehabilitation projects were rutting and bleeding. These types of distresses would indicate possible problems with the mix design. It appeared that the distresses were limited to surface courses and that the base was performing adequately.
Table 4 shows the average PCI for all sections surveyed in 1983, 1986, and 1995. The average drop in PCI from 1983 to 1986 was 12 points, an average loss rate of 4 PCI points per year. The average drop in SCI from 1983 to 1986 was 13 points.
15

TABLE 4. AVERAGE PCI AND SCI VALUES FOR ALL PAVEMENTS SURVEYED,PHOENIX SKY HARBOR INTERNATIONAL AIRPORT
Year 1983 1986 1995
Mean PCI 55 43 87
Standard Deviation 20 14 14
Mean SCI 78 65 92
Standard Deviation 19 15 10
Only one of the four pavement sections at PHX had a stabilized base course; it is bituminous stabilized. The other three pavement sections had a crushed-stone base. The analysis of the NDT data indicated that the pavement section with the bituminous base course gave more reasonable backcalculated modulus values when the surface and base course were treated as one layer. The average percent error was 14.3 when the stabilized layer was analyzed as a separate layer and it was 4.2 when it was analyzed as a composite layer with the surface course. The other three pavement sections provided more reasonable results when the base course modulus was calculated separately from the surface course. The mean average percent error was 2.6 with a standard deviation of 1.8 for the crushed-stone base pavement systems analyzed with separate base and surface course layers. The mean average percent error for the pavement systems with the crushed-stone bases was 4.3 with a standard deviation of 1.1 when the surface and base course were modeled as one layer. Although these differences may not be significantly different (the sample size is not sufficiently large to run a proper statistical analysis), it is apparent that the trend is reversed from the trend observed when the base is stabilized with a material like the surface course.
STAPLETON INTERNATIONAL AIRPORT.
There were no previous PCI data to compare to the results of the 1995 PCI survey. However, the pavement could be considered at the end of its design life since it had performed for approximately 20 years before Stapleton was closed. The 1995 PCI of the taxiway was 50 with an SCI of 77. When reviewing the PCI data, a distinct trend was noticed. The average PCI of the first 19 sample units (of which only one was above 50) was 35 with a standard deviation of 8. The average PCI of the last 16 sample units surveyed (of which none were below 50) was 68 with a standard deviation of 9. The average SCI for the first 19 sample units surveyed was 67 with a standard deviation of 9. The average SCI for the last 16 sample units surveyed was 97 with a standard deviation of 4. It was noted that because of the way the airport is configured, the southern half (the area represented by the first 19 sample units) of the taxiway supported many more aircraft operations than the northern half.
Since taxiway Z was so long, over 3,962 m (13,000 ft), the NDT data was divided into five sections for evaluation. The method used for determining how to divide the feature into sections was to view a plot of the impulse stiffness modulus (ISM) versus station. The ISM is defined as the load divided by the deflection at the first sensor. The ISM gives a relative stiffness of that point in the pavement for comparison to other points in the pavement. The pavement section of taxiway Z consisted of PCC over a cement-treated base over a cement-treated sand subbase resting on the subgrade. The most reasonable results were obtained when the cement-treated
16

base and the cement-treated sand subbase were analyzed as one composite layer. However, the difference between the evaluation with the base and subbase as a composite layer and the analysis with the base and subbase as separate layers was very small. The mean average percent error for the pavement system modeled as four layers was 1.2 with a standard deviation of 0.6. The mean average error for the pavement system modeled with a surface layer and composite base layer was 0.8 with a standard deviation of 0.2.
FIELD OBSERVATIONS
Discussions with personnel in the field revealed some interesting information, as did observations at the time of evaluation for each of the airfields. The following section details many of these observations.
ATLANTA INTERNATIONAL AIRPORT.
Discussions with personnel at Law Engineering, Inc., Atlanta, Ga., revealed that the pavements are performing very well. Other than the problem with the keyed joints in the taxiway (discussed previously) no major problems exist at ATL.
The only problem they are experiencing at ATL is some alkali-silica reaction occurring in the PCC. Based on photos taken over several years at the same location, the surface damage does not seem to be increasing; however, the areal extent observed on the pavement surface is increasing. Most of the pavements that are experiencing this problem are over 20 years old and therefore have performed for their design life. However, if not for this problem, it is unknown how long these pavements could perform if properly maintained. It is also not known how detrimental this problem will eventually become. In 1987, ATL began specifying low-alkali cement in an attempt to prevent this problem from occurring in the future. This problem first began to manifest itself to the point where it was visibly noticeable in the mid 1980s.
Observations concerning the cement-treated base course are very limited because few slabs have been completely replaced. Some of the observations that have been noted include that very little distress in the CTB has been observed in areas where the CTB has been exposed. The CTB has very high strength, as discussed in the previous section. The CTB is supported by a layer of soil cement. The soil cement contains 8-9 percent cement by dry weight. A 7-day compressive strength requirement of 400 psi is normally achieved with no difficulty. The CTB has a 7-day compressive strength requirement of 750 psi. Both the soil cement and CTB easily pass wet/dry and freeze/thaw durability test requirements.
In 1987 a taxiway keel section was removed due to excessive corner breaking. The taxiway was 23 m (75 ft) wide consisting of three 7.5-m (25-ft) slabs. The corner breaking was apparently due to slab curling. Personnel from Law Engineering, Inc. observed corner deflections with the unaided eye one cold February. A DC-8 was operating on the taxiway, and as it taxied, an unbroken corner of a slab could be seen deflecting and rebounding.
When investigating the corner deflections, Law Engineering, Inc. obtained a 66-cm (26-in.) -diameter core at a joint. A gravity flow grout was allowed to flow into the joint to hold the core
17

together for removal. Observations of the removed core indicated that the crack in the CTB matched the crack in the PCC.
Law Engineering, Inc. personnel also observed that the CTB sometimes adheres to the PCC and sometimes it does not. Generally an emulsion is placed as a bond breaker; Law Engineering, Inc. personnel felt that if the PCC was placed quickly enough the bond breaker worked. If the PCC was not placed quickly enough and the emulsion was allowed to weather, the effectiveness of the bond breaker seemed to be greatly reduced.
One additional observation concerning the CTB was that if left exposed during the winter, it tended to scale. Law Engineering, Inc. personnel felt that this was probably not detrimental to the performance of the pavement.
The taxiway and runway pavements at ATL have a built-in drainage structure. Underdrains spaced every 15 m (50 ft) at a 45o angle are approximately 0.3 m (1 ft) wide and 0.6 m (2 ft) deep. The drains are filled with stone meeting the standard gradation of ASTM 595. [38] Personnel from Law Engineering, Inc. felt that although unquantifiable, the drainage layer has had a definite positive impact on the performance of the pavements at ATL.
DALLAS/FORT WORTH INTERNATIONAL AIRPORT.
The reconstruction of part of a taxiway at DFW provided an opportunity to examine the stabilized base course. During construction the contractor was required to remove any cement-treated base (CTB) deemed bad. For construction purposes, good CTB was defined as areas where there was a single transverse crack at doweled joints and no crack at the dummy joints. The dummy joints were those sawed joints between the doweled joints. Some of the dummy joints were not sawed, but were mid-slab cracks. Bad CTB was defined as areas with multiple cracks under the doweled joint and a single crack under the dummy joint. Bad CTB also may have contained mid-slab longitudinal cracking. Discussions with personnel involved in the reconstruction of the taxiway sections revealed the following:
1. There were what appeared to be some small shrinkage cracks in the CTB. However, it was impossible to differentiate the shrinkage cracks from structural cracks.
2. Anywhere from 5% to a maximum of 40% of the areas reconstructed were found to have bad CTB.
3. The east side of the CTB appeared to be more distressed than the west side. The slope of the taxiway is from west to east. On the east side is a grass infield with heavy clay soils (that does not drain easily). From the condition survey, it was noticed that pumping was found to be more predominant on the east side of the taxiway. The data from the condition survey was examined to determine if the perceived poorer performance of the CTB on the east side manifested itself in terms of poorer performance of the east side of the PCC surface course. The PCI data collected for feature 7 was divided into east and west side sample units. The results of this analysis showed the east side to have an average PCI of 59 and SCI of 91. The average PCI of the west side was 61 with an SCI of 88.
18
4. The original pavement construction procedures required that an AC emulsion bond breaker be placed on the CTB before the PCC was placed. In some areas it worked to break the bond, and in some areas it appeared to act as a super glue. Most of the slabs removed had some CTB adhering to the bottom.
5. In one particular area, there was an island of good CTB and PCC surrounded by an area of bad CTB and PCC. The good area had a bond breaker of what appeared to be a woven fiberglass mat either impregnated or tacked with AC emulsion.
6. The contractor found it difficult to work with an emulsion used as a bond breaker. It was not used for the reconstruction.
7. The majority of both the longitudinal and transverse cracking occurring in the cement-stabilized base was found to occur under the joints in the PCC surface course.
JOHN F. KENNEDY INTERNATIONAL AIRPORT.
From discussion with personnel at the Port Authority, they questioned the validity of some of the analyses that had been done on their pavements. The Port Authority does maintain in-house personnel that survey the pavements. However, they contract out NDT work and analysis. In the past, contractors have presented some questionable data, in terms of the backcalculated modulus values, for those pavements containing stabilized base courses. One contractor noted the unusual numbers but did not provide an explanation. Another contractor evaluated the pavements with the unusual backcalculated modulus values, but did not question the validity of the modulus values or the resulting evaluation.
PHOENIX SKY HARBOR INTERNATIONAL AIRPORT.
All of the taxiway and runway pavements at PHX were AC until the early 1990s. Currently, an ongoing program is underway to replace many of the AC pavements with PCC. Problems encountered with the AC pavements have included rutting and excessive bleeding.
All of the pavements that were included in the high-volume study [27] have either been reconstructed with PCC or received some kind of major rehabilitation. The major rehabilitation consisted of milling off the surface course and replacing with a like thickness, or thicker, course of HMAC. Table D-13 provides the details of the thicknesses milled off and the thicknesses of the overlays. Because the problems noted have been related to bleeding and rutting and have been corrected by milling off the surface course, they are probably related to a deficiency in the mix design.
STAPLETON INTERNATIONAL AIRPORT.
Taxiway Z, the only pavement feature evaluated at Stapleton International Airport, has performed well for its design life. If the airport had not been closed, taxiway Z would have been scheduled for a major rehabilitation or reconstruction project.
19

Near the north end of taxiway Z, part of the cement-treated base was exposed because a road was being constructed through the airport at the time of this evaluation. Observations of the CTB indicated that it appeared to be in excellent condition. There was very tight cracking. It had rained just previous to the visual inspection of the CTB, making the cracking visible. Longitudinal cracking followed down the line of the longitudinal joints and the transverse cracking was regularly spaced at the same interval as the transverse joint spacing of the PCC. This indicated that the cracking of the CTB was directly under the joints of the PCC.
CONCLUSIONS
From the observations made and tests conducted at each of the airports, the following general conclusions can be drawn:
1. The strength and stiffness of the cement-stabilized bases at the airports studied are very high. This makes it very difficult to differentiate the stabilized layer, in terms of modulus values, when conducting a nondestructive evaluation based on data collected with an FWD or HWD device. This also indicates that the PCC layer may be behaving, in terms of the performance during NDT, more as a bonded overlay on the stabilized layer rather than a PCC layer resting on a separate stabilized layer
2. When evaluating a pavement based on NDT data collected with a FWD or HWD, differentiating between base layers stabilized with materials like the surface layer is difficult. This is true for both PCC surface courses over cement-stabilized layers and AC surface courses over AC-stabilized bases.
3. From the reconstruction at DFW and maintenance work at other airfields, it appears that current methods of constructing a bond breaker, to prevent a bond from forming between the PCC and the underlying stabilized layer, do not perform adequately. In general the stabilized layer is bonded to the PCC and a slippage plane or horizontal crack develops below the PCC-stabilized layer interface.
4. The cracking pattern observed in all of the cement-treated bases at a minimum followed the cracking/joint pattern in the overlying PCC layer. Other cracking was present in some of the cement-treated bases. This cracking could have been shrinkage cracking that formed at the time of construction.
5. In general, the results of the condition survey data from DFW did not indicate a difference in the PCC surface condition in areas where the CTB was in poorer condition.
6. From the materials collected at DFW, it appears that the material being pumped from the pavement is from the cement-stabilized layer. This indicates that erosion is occurring in the cement-treated base. This suggests that it would be appropriate to provide a drainage layer directly underneath the PCC layer.
7. The overall performance of cement-stabilized bases can be considered good. All of the pavements containing cement-stabilized bases have, at a minimum, performed for their design life. Some of the more heavily used pavements have required replacement after
20

more than 20 years in service. However, these pavements have likely supported a great deal more traffic than they were originally designed for. The good performance of these pavements, even with the probable large increase in operations over original design, indicates that the pavements were over designed, that the stabilized base helps provide good performance, or that, as is known, the loads are more critical than the actual number of operations and that as long as the load magnitude designed for is accurate, the number of operations only needs to be within an order of magnitude. Usually the pavements are designed to carry the maximum gross weight of the design aircraft and most aircraft rarely if ever reach their maximum gross allowable weight during normal daily operations.
8. The amount of data available for determining the performance of AC-stabilized bases was limited. All of the pavements included in the study that had AC-stabilized bases had an AC surface course. All of the pavements except one had major rehabilitation or reconstruction in the past 10 years. However, most of the rehabilitation work was limited to the surface course, such as grinding off and replacing with a like or greater thickness of HMAC. This would indicate that the AC-stabilized base courses are performing adequately since total reconstruction was not required for any of the pavements with AC-stabilized bases. The types of distresses seen in the AC surface courses, bleeding and rutting, indicate possible HMAC mix design problems. At PHX, a review of the condition survey data indicates that the one section with an AC-stabilized base course out-performed the three sections with granular base courses. However, a definitive conclusion cannot be reached based on this one data point since accurate traffic data for each feature were not available. It is not known if these four features supported similar traffic volumes and weights.
REFERENCES
1. Ingles, O.G. and Metcalf, J.B., “Soil Stabilization Principles and Practice,” Halstead, New York, 1973.
2. Little, D.N., “Fundamentals of the Stabilization of Soil with Lime,” National Lime Association, Arlington, VA, 1987.
3. Rollings, M.P. and Rollings, R.S., “Geotechnical Materials in Construction,” McGraw Hill, New York, 1996.
4. American Society for Testing and Materials, 1994. “Standard Guide for Evaluating Effectiveness of Chemicals for Soil Stabilization,” Designation D 4609-94, Annual Book of Standards, Vol. 04.08, West Conshohocken, PA.
5. Headquarters, Department of the Army, 1983. “Soil Stabilization for Pavements,” Technical Manual, TM 5-822-4.
6. American Society for Testing and Materials, 1996. “Standard Test Methods for Moisture-Density Relations of Soil-Cement Mixtures,” Designation D 558-96, Annual Book of Standards, Vol. 04.08, West Conshohocken, PA.
21
7. American Society for Testing and Materials, 1998. “Specification for Coal Fly Ash and Raw or Calcined Natural Pozzolan for Use as a Mineral Admixture in Concrete,” Designation C 618-98, Annual Book of Standards, Vol. 04.02, West Conshohocken, PA.
8. American Society for Testing and Materials, 1996. “Standard Test Method for Density and Unit Weight of Soil in Place by the Sand Cone Method,” Designation D 1556-96, Annual Book of Standards, Vol. 04.08, West Conshohocken, PA.
9. American Society for Testing and Materials, 1998. “Test Method for Laboratory Compaction Characteristics of Soil Using Modified Effort (56,000 ft-lbf/ft3 (2,700 kN-m/m3)),” Designation D 1557-91 (reapproved 1998), Annual Book of Standards, Vol. 04.08, West Conshohocken, PA.
10. American Society for Testing and Materials, 1996. “Standard Practice for Making and Curing Soil-Cement Compression and Flexure Test Specimens in the Laboratory,” Designation D 1632-96, Annual Book of Standards, Vol. 04.08, West Conshohocken, PA.
11. American Society for Testing and Materials, 1996. “Standard Test Method for Compressive Strength of Molded Soil-Cement Cylinders,” Designation D 1633-96, Annual Book of Standards, Vol. 04.08, West Conshohocken, PA.
12. American Society for Testing and Materials, 1995. “Standard Test Method for Flexural Strength of Soil-Cement Using Simple Beam with Third Point Loading,” Designation D 1635-95, Annual Book of Standards, Vol. 04.08, West Conshohocken, PA.
13. American Society for Testing and Materials, 1994. “Standard Test Method for Density and Unit Weight of Soil in Place by the Rubber Balloon Method,” Designation D 2167-94, Annual Book of Standards, Vol. 04.08, West Conshohocken, PA.
14. American Society for Testing and Materials, 1996. “Standard Test Method for Density of Soil and Soil-Aggregate in Place by Nuclear Methods (Shallow Method),” Designation D 2922-96, Annual Book of Standards, Vol. 04.08, West Conshohocken, PA.
15. American Society for Testing and Materials, 1996. “Standard Test Method for Water Content of Soil and Rock in Place by Nuclear Methods (Shallow Depth),” Designation D 3017-96, Annual Book of Standards, Vol. 04.08, West Conshohocken, PA.
16. American Society for Testing and Materials, 1998. “Standard Test Method for Liquid Limit, Plastic Limit, and Plasticity Index of Soils,” Designation D 4318-98, Annual Book of Standards, Vol. 04.08, West Conshohocken, PA.
17. Federal Aviation Administration, 1989. “Standards for Specifying Construction of Airports,” Advisory Circular 150/5370-10k, Federal Aviation Administration, Washington, DC.
22

18. Headquarters, Departments of the Air Force and the Army, 1988. “Rigid Pavements for Airfields,” Technical Manual, Army, TM 5-825-3; Air Force, AFM 88-6; Chap. 3.
19. Headquarters, Departments of the Navy, the Army, and the Air Force, “Flexible Pavement Design for Airfields,” Navy, DM 21.3; Army, TM 5-825-2; Air Force, AFM 88-6; Chapter 2; 1978.
20. Federal Aviation Administration, 1995. “Airport Pavement Design and Evaluation,” Advisory Circular 150/5320-6D, Federal Aviation Administration, Washington, DC.
21. American Association of State Highway and Transportation Officials, “AASHTO Guide for Design of Pavement Structures,” Washington, DC, 1996.
22. Federal Aviation Administration, 1995. “Airport Pavement Design for the Boeing 777 Airplane,” Advisory Circular 150/5320-16, Federal Aviation Administration, Washington, DC.
23. Rollings, M.P. and Rollings, R.S., “Geotechnical Materials in Construction, “ McGraw-Hill, New York, 1996.
24. American Concrete Institute, 1987. Concrete Durability--Katharine and Bryant Mather International Conference, John M. Scanlon, ed., special publication SP-100.
25. American Society for Testing and Materials, Significance of Tests and Properties of Concrete and Concrete-Making Materials, Paul Klieger and Joseph F. Lamonde, eds., ASTM STP 169C, 1994.
26. Ahlvin, R.G., Ulery H.H., Hutchinson, and R.L., Rice, J.L., “Multiple-Wheel Heavy Gear Load Pavement Tests,” Technical Report S-71-17, U.S. Army Engineer Waterways Experiment Station, Vicksburg, MS, 1971.
27. Kohn, Starr, “Evaluation of the FAA Design Procedure for High Traffic Volume Pavements,” DOT/FAA/PM-84/14, Federal Aviation Administration, National Technical Information Service, Springfield, VA, 1985.
28. Headquarters, Departments of the Army and the Air Force, 1989. “Procedures for U.S. Army and U.S. Air Force Airfield Pavement Condition Surveys,” Technical Manual TM 5-826-6/AFR 93-5, Washington, DC.
29. American Society for Testing and Materials, 1998. “Standard Test Method for Airport Pavement Condition Index Surveys,” Designation D 5340-98, Annual Book of ASTM Standards, Vol. 04.08, West Conshohocken, PA.
30. U.S. Army Corps of Engineers, 1998. Micro PAVER Version 4.1 User Manual, Shahin, M.Y., Principal Investigator.
23

31. Headquarters, Departments of the Army and the Air Force, 1993. “Nondestructive Procedures for Airfield Pavement Evaluations,” Technical Manual TM 5-826-5/ AFP 88-24, Chap. 5, Washington, DC.
32. American Society for Testing and Materials, 1993. “Standard Test Method for Compressive Strength of Cylindrical Concrete Specimens,” Designation C 39-93, Annual Book of Standards, Vol. 04.02, West Conshohocken, PA.
33. American Society for Testing and Materials, 1990. “Standard Test Method for Splitting Tensile Strength of Cylindrical Concrete Specimens,” Designation C 496-90, Annual Book of Standards, Vol. 04.02, West Conshohocken, PA.
34. American Society for Testing and Materials, 1994. “Standard Test Method for Static Modulus of Elasticity and Poisson’s Ratio of Concrete in Compression,” Designation D 469-94, Annual Book of Standards, Vol. 04.02, West Conshohocken, PA.
35. Law/R&D, A Team, 1994. “Report of 1994 Pavement Evaluation for Atlanta Hartsfield International Airport,” Law Engineering, Inc., Atlanta, GA.
36. Law/R&D, 1991. “Report of Pavement Evaluation, Atlanta International Airport,” Law Engineering Inc., Atlanta, GA.
37. Mindess, Sidney and Young, J. Francis, Concrete, Prentice Hall, Inc., Englewood Cliffs, NJ, 1981.
38. American Society for Testing and Materials, 1992. “Specification for Blended Hydraulic Cements,” Designation C 595-89, Annual Book of Standards, Vol. 04.01, 04.02, West Conshohocken, PA.
24
APPENDIX ABIBLIOGRAPHY
ACI Manual of Concrete Practice Part 1-1993, American Concrete Institute, Detroit, MI.
Ahlvin, R.G., Ulery, H.H., Hutchinson, R.L., and Rice, J.L., “Multiple-Wheel Heavy Gear Load Pavement Tests, Volume I, Basic Report,” Technical Report S-71-17, U.S. Army Engineer Waterways Experiment Station, Vicksburg, MS, November 1971.
Allen, J.J., Currin, D.D., and Little, D.N. Jr., “Mix Design, Durability, and Strength Requirements for Lime Stabilized Layers in Airfield Pavements,” TRR 641, pp. 34-40, Transportation Research Board, Washington, DC, 1977.
American Association of State Highway and Transportation Officials, “AASHTO Guide for Design of Pavement Structures 1986,” Washington, DC, 1986.
American Society for Testing and Materials, 1994. “Standard Guide for Evaluating Effectiveness of Chemicals for Soil Stabilization,” Designation D 4609-94, Annual Book of Standards, Vol. 04.08, West Conshohocken, PA.
American Society for Testing and Materials, 1996. “Standard Practice for Making and Curing Soil-Cement Compression and Flexure Test Specimens in the Laboratory,” Designation D 1632-96, Annual Book of Standards, Vol. 04.08, West Conshohocken, PA.
American Society for Testing and Materials, 1998. “Standard Specification for Coal Fly Ash and Raw or Calcined Natural Pozzolan for Use as a Mineral Admixture in Concrete,” Designation C 618-98, Annual Book of Standards, Vol. 04.02, West Conshohocken, PA.
American Society for Testing and Materials, 1998. “Standard Specification for Blended Hydraulic Cements,” Designation C 595-98, Annual Book of Standards, Vol. 04.01,04.02, West Conshohocken, PA.
American Society for Testing and Materials, 1996. “Standard Test Method for Density and Unit Weight of Soil in Place by the Sand Cone Method,” Designation D 1556-90 (1996), Annual Book of Standards, Vol. 04.08, West Conshohocken, PA.
American Society for Testing and Materials, 1998. “Test Method for Laboratory Compaction Characteristics of Soil Using Modified Effort (56,000 ft-lbf/ft3 (2,700 kN-m/m3)),” Designation D 1557-91 (reapproved 1998), Annual Book of Standards, Vol. 04.08, West Conshohocken, PA.
American Society for Testing and Materials, 1996. “Standard Test Method for Compressive Strength of Molded Soil-Cement Cylinders,” Designation D 1633-96, Annual Book of Standards, Vol. 04.08, West Conshohocken, PA.
American Society for Testing and Materials, 1995. “Standard Test Method for Flexural Strength of Soil-Cement Using Simple Beam with Third-Point Loading,” Designation D 1635-95, Annual Book of Standards, Vol. 04.08, West Conshohocken, PA.
A-1

American Society for Testing and Materials, 1996. “Standard Test Methods for Density of Soil and Soil-Aggregate in Place by Nuclear Methods (Shallow Depth),” Designation D 2922-96, Annual Book of Standards, Vol. 04.08, West Conshohocken, PA.
American Society for Testing and Materials, 1996. “Standard Test Method for Water Content of Soil and Rock in Place by Nuclear Methods (Shallow Depth),” Designation D 3017-96, Annual Book of Standards, Vol. 04.08, West Conshohocken, PA.
American Society for Testing and Materials, 1998. “Standard Test Method for Liquid Limit, Plastic Limit, and Plasticity Index of Soils,” Designation D 4318-98, Annual Book of Standards, Vol. 04.08, West Conshohocken, PA.
Barker, W.R. and Frazier, P. Jr., “Multiple-Wheel Heavy Gear Load Pavement Tests, Volume IV, Analysis of Insulating Layers in Pavement Test Sections,” Technical Report S-74-8, U.S. Army Engineer Waterways Experiment Station, Vicksburg, MS, January 1977.
Bell, J.R., “Compaction Energy Relationships of Cohesive Soils,” TRR 641, pp. 29-33, Transportation Research Board, Washington, DC, 1977.
Ingles, O.G. and Metcalf, J.B., “Soil Stabilization Principles and Practice,” Halstead, New York, 1973.
Federal Aviation Administration, “Standards for Specifying Construction of Airports” FAA Advisory Circular 150/5370-10, Department of Transportation, FAA, Washington, DC, 1974.
Grim, R.E., “Clay Mineralogy,” McGraw-Hill, New York, 1968.
Hammitt, G.M. II, Hutchinson, R.L., Rice, J.O., Thompson, O.O., and Brown, D.N., “Multiple-Wheel Heavy Gear Load Pavement Tests, Volume IV, Analysis of Behavior Under Traffic,” Technical Report S-71-17, U.S. Army Engineer Waterways Experiment Station, Vicksburg, MS, November 1971.
Headquarters, Department of the Army, “Soil Stabilization for Pavements,” Technical Manual, TM 5-822-4, 1983.
Headquarters, Departments of the Air Force and the Army, “Rigid Pavements for Airfields,” Technical Manual, Army, TM 5-825-3; Air Force, AFM 88-6; Chap. 3; 1988.
Headquarters, Departments of the Navy, the Army, and the Air Force, “Flexible Pavement Design for Airfields,” Navy, DM 21.3; Army, TM 5-825-2; Air Force, AFM 88-6; Chapter 2; 1978.
Johnston-Clarke, J.R. and Sharp, K.G., “Data Report on Testing of Three Cement-Treated Crushed Rock Pavements: Mulgrave ALF Trial,” Australian Road Research Board, Research Report ARR 215, Victoria, Australia, 1991.
A-2

Johnston-Clarke, J.R., Vertessey, N.J., and Sharp, K.G., “Data Report on Testing of Four Cement-Treated Crushed Rock Pavements: Mulgrave ALF Trial,” Australian Road Research Board, Research Report ARR 194, Victoria, Australia, 1990.
Jones, M.P. and Witczak, M.W., “Subgrade Modulus on the San Diego Test Road,” TRR 641, pp. 1-6, Transportation Research Board, Washington, DC, 1977.
Ledbetter, R.H., Rice, J.L., Ulery, H.H., Kearney, F.W., and Gambill, J.B., “Multiple-Wheel Heavy Gear Load Pavement Tests, Volume IIIA, Presentation and Initial Analysis of Stress-Strain-Deflection and Vibratory Measurements; Instrumentation,” Technical Report S-71-17, U.S. Army Engineer Waterways Experiment Station, Vicksburg, MS, November 1971.
Ledbetter, R.H., Rice, J.L., Ulery, H.H., Kearney, F.W., Gambill, J.B., and Hall, J.W. Jr., “Multiple-Wheel Heavy Gear Load Pavement Tests, Volume IIIB, Presentation and Initial Analysis of Stress-Strain-Deflection and Vibratory Measurements; Data and Analysis,” Technical Report S-71-17, U.S. Army Engineer Waterways Experiment Station, Vicksburg, MS, November 1971.
Little, D. N., “Fundamentals of the Stabilization of Soil With Lime,” National Lime Association, Arlington, VA., 1987.
Little, D.N., Thompson, M.R., Terrell, R.L., Epps, J.A., and Barenberg, E.J., “Soil Stabilization for Roadways and Airfields” ESL-TR-86-19, Engineering and Services Laboratory, Air Force Engineering Services Center, Tyndall Air Force Base, FL, 1986.
Machan, G., Diamond, S., and Leo, E., “Laboratory Study of the Effectiveness of Cement and of Lime Stabilization for Erosion Control,” TRR 641, pp. 24-28, Transportation Research Board, Washington, DC, 1977.
Marais, C.P. and Freeme, C.R, “Performance Study of Asphalt Road Pavement with Bituminous-Stabilized-Sand Bases,” TRR 641, pp. 52-60, Transportation Research Board, Washington, DC, 1977.
McDonald, E.B., “Stabilization of Expansive Clay by Moisture-Density Control,” TRR 641, pp. 11-16, Transportation Research Board, Washington, DC, 1977.
Mitchell, J.K., Shen, C., and Monismith, C.L., “Behavior of Stabilized Soils Under Repeated Loads, Report 1,” Contract Report No. 3-145, U.S. Army Engineer Waterways Experiment Station, Vicksburg, MS, December 1965.
Mitchell, J.K. and Monismith, C.L., “Behavior of Stabilized Soils Under Repeated Loads, Report 2,” Contract Report No. 3-145, U.S. Army Engineer Waterways Experiment Station, Vicksburg, MS, September 1966.
Mitchell, J.K., Fossberg, P.E., and Monismith, C.L., “Behavior of Stabilized Soils Under Repeated Loads, Report 3,” Contract Report No. 3-145, U.S. Army Engineer Waterways Experiment Station, Vicksburg, MS, May 1969.
A-3

Mitchell, J.K., Ueng, T-S., and Monismith, C.L., “Behavior of Stabilized Soils Under Repeated Loads, Report 5,” Contract Report No. 3-145, U.S. Army Engineer Waterways Experiment Station, Vicksburg, MS, August 1972.
Mitchell, J.K., Dzwilewski, P., and Monismith, C.L., “Behavior of Stabilized Soils Under Repeated Loads, Report 6,” Contract Report No. 3-145, U.S. Army Engineer Waterways Experiment Station, Vicksburg, MS, October 1974.
Ozier, J.M. and Moore, R.K., “Factors Affecting Unconfined Compressive Strength of Salt-Lime-Treated Soils,” TRR 641, pp. 17-23, Transportation Research Board, Washington, DC, 1977.
Portland Cement Association, 1979. “Soil-Cement Construction Handbook,” Engineering Bulletin, PCA.
Raad, L., C.L. Monismith, and Mitchell, J.K., “Fatigue Behavior of Cement-Treated Materials,” TRR 641, pp. 7-10, Transportation Research Board, Washington, DC, 1977.
Raad, L., Monismith, C.L., and Mitchell, J.K., “Tensile-Strength Determinations of Cement-Treated Materials,” TRR 641, pp. 48-51, Transportation Research Board, Washington, DC, 1977.
Rollings, M.P. and Rollings, R.S., “Geotechnical Materials in Construction,” McGraw Hill, New York, 1996.
Steinberg, M.L., “Ponding on Expansive Clay Cut: Evaluations and Zones of Activity,” TRR 641, pp. 61-66, Transportation Research Board, Washington, DC, 1977.
Stocker, P.T., “Diffusion and Diffuse Cementation in Lime and Cement Stabilized Clayey Soils,” Australian Road Research Board, Special Report No. 8, Victoria, Australia, 1972.
Transportation Research Board, 1987. “State of the Art Report 5, Lime Stabilization, Reactions, Properties, Design, and Construction,” National Research Council, Washington, DC.
U.S. Department of Transportation, July 1992. “Non-Standard Stabilizers,” Federal Highway Administration, FHWA-FLP-92-011, National Technical Information Service, Springfield, VA.
U.S. Department of Transportation, 1979. “Soil Stabilization in Pavement Structures, A User’s Manual,” FHWA-IP-80-2, Volume 1 Pavement Design and Construction Considerations, Washington, DC.
U.S. Department of Transportation, 1979. “Soil Stabilization in Pavement Structures, A User’s Manual,” FHWA-IP-80-2, Volume 2 Mixture Design Considerations, Washington, DC.
Wang, M.C., Mitchell, J.K., and Monismith, C.L., “Behavior of Stabilized Soils Under Repeated Loads, Report 4,” Contract Report No. 3-145, U.S. Army Engineer Waterways Experiment Station, Vicksburg, MS, October 1970.
A-4

APPENDIX BPETROGRAPHIC ANALYSIS OF SPECIMENS FROM DALLAS/FORT WORTH INTERNATIONAL AIRPORT
Eight PCC and eight cement-treated base core samples were obtained from Dallas/Fort Worth and returned to Waterways Experiment Station (WES) for testing. In addition to the core samples, material pumped from the pavements was also brought back to WES. Four of the PCC and four of the cement-treated base samples were obtained from feature seven. The remaining four PCC and cement treated cores were obtained from feature eight.
The purpose of the petrographic analysis was to determine, if possible, the source of the pumped material.
PROCEDURE.
PETROGRAPHY AND CHECK-IN. Each of the 16 cores was examined and assigned identification numbers to be used by the structures laboratory for inclusion in their database. The initial examination consisted of inspecting the cores for any degradation or cracks, examining the paste and aggregate for any obvious discoloration or other evidence of reaction, and measuring the length of each core.
XRD. A small sample of subbase was removed from the bottom of one of the base course cores. The material was passed through a 45-µm (No. 325) sieve and examined as a tightly packed powder by XRD. A slurry of water and soil was prepared on a glass slide, dried in air at ambient temperature, and examined by XRD. The slurry was then saturated with glycerol and after 24 hours was reexamined by XRD. This procedure was used to characterize the clay minerals in the subbase soil.
A piece of cement-treated base from the same core the subbase sample was obtained from was placed in a mortar and kneaded with a gloved hand. This material was sieved through a No. 325 sieve and a portion of the material finer than 45 µm was collected and examined as a random powder mount by XRD. This sample was dispersed in water and sedimented onto a glass slide, dried in air at ambient temperature, and examined by XRD.
SEM. The SEM and EDX analysis were used on samples of three cement-treated bases and the subbase soil obtained from the same core as the material used for the XRD. A fresh fracture surface was prepared for each sample and then coated with a thin (~ 15-nm) layer of gold.
RESULTS AND DISCUSSION.
Examination of all the cores revealed no evidence of any deterioration or cracking. The concrete cores were all grayish colored, and the cement-treated base samples were brownish-tan. The aggregate in the concrete and base course was limestone. Seven of the concrete cores consisted of two pieces. The cores had apparently broken during the coring operation at the location of the steel reinforcement as each of the pieces showed impressions of the reinforcement bar. The lone unbroken concrete core showed no reinforcement. Each of the cement-treated base samples consisted of a single piece. On the bottom of one of the cement-treated base samples was a small
B-1

amount of material interpreted to be the lime-stabilized subbase material. No sample of the subgrade material was available.
The in-place lime-stabilized subbase sample was primarily composed of calcite with quartz, kaolinite, illite, and expandable smectite clay as accessory minerals. The cement-treated base sample contained the same phases as the subbase but did not have any of the expandable clay phases.
The presence of calcareous material in the lime-stabilized subbase is due to calcareous microscopic fossils in the limestones used as aggregate.
The material pumped out of the joints was composed of the minerals quartz, calcite, and kaolinite. Because no expandable clay was found in this sample, the subbase material is probably not the source of the pumped material. Furthermore, since the mineralogy of the pumped material is similar to that of the base, the base is apparently the source of the ejected material. SEM analysis revealed no whole coccoliths or forminifera in the sample of the pumped material. This result agrees with the idea that the source of the pumped material is not the lime-stabilized subbase. Inherent in this hypothesis is the assumption that the sample of the pumped material retrieved here was taken from an area which had a mineralogy similar to the area where the cores were taken.
CONCLUSION.
The lack of an expandable clay component indicates that the source of the pumped material was not the lime-stabilized subbase. The mineralogy of the pumped material resembled that of the cement-treated base and could be the source of the material. Because no sample of the subgrade was obtained, no conclusions can be drawn about the mineralogy of physical properties. However, the lime-stabilized subbase was in-place material stabilized. Therefore it would not be surprising for the subgrade to have a mineralogy similar to that of the lime-stabilized subbase.
B-2
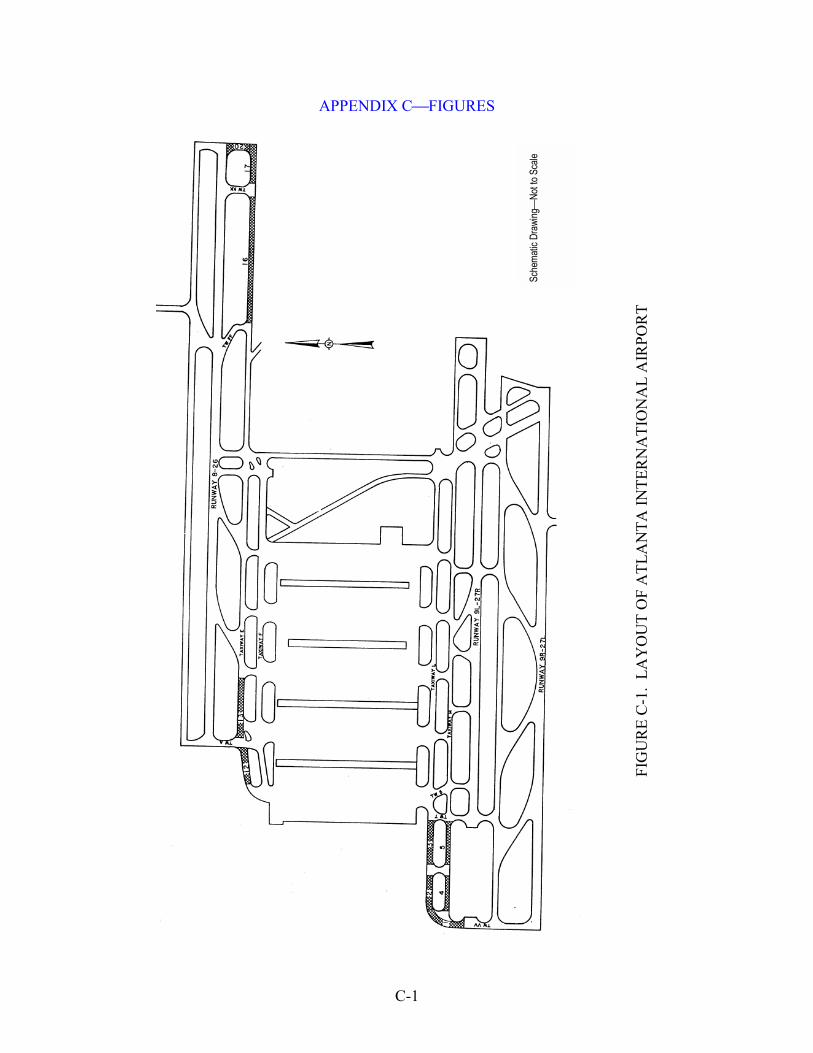
APPENDIX CFIGURES
Sche
mat
ic D
raw
ing
Not
to S
cale
FIG
UR
E C
-1.
LA
YO
UT
OF
AT
LA
NT
A I
NT
ER
NA
TIO
NA
L A
IRP
OR
T
C-1

Sche
mat
ic D
rawi
ng
Not
to S
cale
FIG
UR
E C
-2.
LA
YO
UT
OF
DA
LL
AS
/FO
RT
WO
RT
H I
NT
ER
NA
TIO
NA
L A
IRP
OR
T
C-2

FIG
UR
E C
-3.
LA
YO
UT
OF
JO
HN
F. K
EN
NE
DY
IN
TE
RN
AT
ION
AL
AIR
PO
RT
Sche
mat
ic D
rawi
ng
Not
to S
cale
C-3

Sche
mat
ic D
rawi
ng
Not
to S
cale
FIG
UR
E C
-4.
LA
YO
UT
OF
PH
OE
NIX
SK
Y H
AR
BO
R I
NT
ER
NA
TIO
NA
L A
IRP
OR
T
C-4

APPENDIX DTABLES
TA
BL
E D
-1.
SU
MM
AR
Y O
F P
HY
SIC
AL
PR
OP
ER
TY
DA
TA
, AT
LA
NT
A I
NT
ER
NA
TIO
NA
L A
IRP
OR
T
k M
N/m
3
(psi
/in.)
27 (1
00)
27 (1
00)
27 (1
00)
27 (1
00)
27 (1
00)
27 (1
00)
27 (1
00)
27 (1
00)
27 (1
00)
27 (1
00)
Des
crip
tion
Sand
y si
lt Si
lty s
and
Sand
y si
lt Si
lty s
and
Sand
y si
lt Si
lty s
and
Sand
y si
lt Si
lty s
and
Sand
y si
lt Si
lty s
and
Sand
y si
lt Si
lty s
and
Sand
y si
lt Si
lty s
and
Sand
y si
lt Si
lty s
and
Sand
y si
lt Si
lty s
and
Sand
y si
lt Si
lty s
and
SUBB
ASE
SUBG
RAD
E CBR
CBR
100
100
100
100
100
100
100
100
100
100
Des
crip
tion
Soil-
Cem
ent
Subg
rade
Soil-
Cem
ent
Subg
rade
Soil-
Cem
ent
Subg
rade
Soil-
Cem
ent
Subg
rade
Soil-
Cem
ent
Subg
rade
Soil-
Cem
ent
Subg
rade
Soil-
Cem
ent
Subg
rade
Soil-
Cem
ent
Subg
rade
Soil-
Cem
ent
Subg
rade
Soil-
Cem
ent
Subg
rade
Thic
knes
s m
m
(in.)
15
(6)
15
(6)
15
(6)
15
(6)
15
(6)
15
(6)
15
(6)
15
(6)
15
(6)
15
(6)
BASE
k M
N/m
3
(psi
/in.)
135
(500
)
135
(500
)
135
(500
)
135
(500
)
135
(500
)
135
(500
)
135
(500
)
135
(500
)
135
(500
)
135
(500
)
CBR
Des
crip
tion
Cem
ent-T
reat
ed
Base
Cem
ent-T
reat
ed
Base
Cem
ent-T
reat
ed
Base
Cem
ent-T
reat
ed
Base
Cem
ent-T
reat
ed
Base
Cem
ent-T
reat
ed
Base
Cem
ent-T
reat
ed
Base
Cem
ent-T
reat
ed
Base
Cem
ent-T
reat
ed
Base
Cem
ent-T
reat
ed
Base
Thic
knes
s cm
(in
.)
15
(6)
15
(6)
15
(6)
15
(6)
15
(6)
15
(6)
15
(6)
15
(6)
15
(6)
15
(6)
PAVE
MEN
T
Flex
. St
r. M
Pa
(psi
)
4.8 (715
)
4.8 (715
)
4.8
(715
)
4.8
(715
)
4.8 (715
)
4.8 (715
)
4.8 (715
)
4.8 (715
)
4.8
(715
)
4.8
(715
)
Des
crip
tion
PCC
PCC
PCC
PCC
PCC
PCC
PCC
PCC
PCC
PCC
Thic
knes
s cm
(in
.)
41
(16)
41
(16)
41
(16)
41
(16)
41
(16)
41
(16)
41
(16)
41
(16)
41
(16)
41
(16)
OVE
RLA
Y PA
VEM
ENT
Flex
. St
r. M
Pa
(psi
)D
escr
iptio
n
Thic
knes
s cm
(in
.)
FAC
ILIT
Y
Wid
th
m
(ft)
30
(100
)
30
(100
)
30
(100
)
23
(75)
23
(75)
30
(100
)
30
(100
)
23
(75)
23
(75)
30
(100
)
Leng
th
m
(ft)
229
(750
)
152
(500
)
152
(500
)
160
(525
)
w e
e n
160
(525
)
152
(500
)
305
(100
0)
556
(182
5)
160
(525
)
76
(250
)
Iden
tific
atio
n
TW V
V be
twee
n R
W-9
L an
d TW
L
TWL
betw
een
VV a
nd V
TW L
bet
wee
n V
and
T
TW M
bet
wee
n VV
and
V
T W
M
b
e t
V an
d T
TW E
from
TW
A-1
52 m
wes
t
TW E
from
TW
A-3
05 m
eas
t
TW E
bet
wee
n FF
and
KK
TW E
bet
wee
n KK
and
K
TW K
bet
wee
n E
and
26
Feat
ure
1 2 3 4 5 12
13
16
17
20
D-1

TABLE D-2. SUMMARY OF PCI/SCI DATA FOR ATLANTA INTERNATIONALAIRPORT
Number of Sample Units (S.U.) and Calculated Pavement Condition Index (PCI) and Structural Condition Index (SCI)
Feature* 1983 1986
S.U. PCI SCI S.U. PCI SCI
1 3 88 100
2 2 80 100 2 67 100
3 3 76 100 3 70 100
4 3 84 100 3 73 100
5 3 82 100 3 73 100
12 2 83 100 2 74 100
13 4 85 100 4 76 100
16 6 77 100 6 67 100
17 3 81 89 3 69 100
20 1 80 100 1 55 100
* All of the features evaluated at ATL are 16 years old; they were constructed in 1979.
TABLE D-3. SUMMARY OF RUNWAY PCI DATA,* ATLANTA INTERNATIONAL AIRPORT
Feature Year of Construction 1990 PCI 1994 PCI
Runway 8L-26R 1984 91 93
Runway 8R-26L 1969 83 64
Runway 9L-27R 1974 95 80
Runway 9R-27L 1985 98 93
* Courtesy of Law Engineering, Inc., Atlanta, Ga.
D-2

TABLE D-4. SUMMARY OF RESULTS FROM NDT DATA ANALYSIS, ATLANTAINTERNATIONAL AIRPORT
Feature Procedure*
PCC Modulus
ksi
Cement-Treated
Base ksi
Soil-Cement
Subgrade ksi
Subgrade ksi
Average Error
%
2 C1C2C3C4 7,000 150 150 41 2.7
C12C34 4,434 38 1.8
3 C1C2C3C4 5,600 500 1,000 37 1.2
C12C34 3,676 40 0.9
4 C1C2C3C4 7,000 150 150 23 1.9
C12C3C4 4,302 1 101 0.9
5 C1C2C3C4 7,000 150 150 22 4.8
C12C3C4 5,688 1 40 0.9
12 C1C2C3C4 10,000 2,500 1,000 18 5.4
C12C3C4 7,000 150 14 0.7
13 C1C2C3C4 10,000 500 1,000 18 3.0
C12C34 6,405 18 0.5
16 C1C2C3C4 7,000 150 150 17 3.8
C12C3C4 5,223 1 23 0.8
17 C1C2C3C4 4,909 500 102 24 0.6
C1C2C34 4,909 500 27 0.6
20 C1C2C3C4 10,000 500 784 14 0.8
C12C34 5,366 15 0.9
* Procedure C1C2C3C4 calculated each layer individually. Procedures noted with two numbers following a “C” indicate that those two layers were combined and a composite modulus was calculated. The last modulus value reported in each row is in psi.
D-3

TA
BL
E D
-5.
SU
MM
AR
Y O
F P
HY
SIC
AL
PR
OP
ER
TY
DA
LL
AS
/FO
RT
WO
RT
H I
NT
ER
NA
TIO
NA
L A
IRP
OR
T
SUBG
RAD
E CBR
k
MN
/m 3
(psi
/in.)
34 (1
27)
34 (1
27)
34 (1
27)
34 (1
27)
34 (1
27)
34 (1
27)
34 (1
27)
34 (1
27)
34 (1
27)
34 (1
27)
34 (1
27)
34 (1
27)
34 (1
27)
34 (1
27)
Des
crip
tion
Cla
y (C
L-C
H)
Cla
y (C
L-C
H)
Cla
y (C
L-C
H)
Cla
y (C
L-C
H)
Cla
y (C
L-C
H)
Cla
y (C
L-C
H)
Cla
y (C
L-C
H)
Cla
y (C
L-C
H)
Cla
y (C
L-C
H)
Cla
y (C
L-C
H)
Cla
y (C
L-C
H)
Cla
y (C
L-C
H)
Cla
y (C
L-C
H)
Cla
y (C
L-C
H)
SUBB
ASE
CBR
100
100
100
100
100
100
100
100
100
100
100
100
100
100
Des
crip
tion
Lim
e-St
abiliz
ed
Soil
Lim
e-St
abiliz
ed
Soil
Lim
e-St
abiliz
ed
Soil
Lim
e-St
abiliz
ed
Soil
Lim
e-St
abiliz
ed
Soil
Lim
e-St
abiliz
ed
Soil
Lim
e-St
abiliz
ed
Soil
Lim
e-St
abiliz
ed
Soil
Lim
e-St
abiliz
ed
Soil
Lim
e-St
abiliz
ed
Soil
Lim
e-St
abiliz
ed
Soil
Lim
e-St
abiliz
ed
Soil
Lim
e-St
abiliz
ed
Soil
Lim
e-St
abiliz
ed
Soil
Thic
knes
s m
m
(in.)
23
(9)
23
(9)
23
(9)
23
(9)
23
(9)
23
(9)
23
(9)
23
(9)
23
(9)
23
(9)
23
(9)
23
(9)
23
(9)
23
(9)
BASE
CBR
k
MN
/m 3
(psi
/in.)
97 (3
60)
97 (3
60)
97 (3
60)
97 (3
60)
97 (3
60)
97 (3
60)
97 (3
60)
97 (3
60)
97 (3
60)
97 (3
60)
97 (3
60)
97 (3
60)
97 (3
60)
97 (3
60)
Des
crip
tion
Cem
ent-
Trea
ted
Base
Cem
ent-
Trea
ted
Base
Cem
ent-
Trea
ted
Base
Cem
ent-
Trea
ted
Base
Cem
ent-
Trea
ted
Base
Cem
ent-
Trea
ted
Base
Cem
ent-
Trea
ted
Base
Cem
ent-
Trea
ted
Base
Cem
ent-
Trea
ted
Base
Cem
ent-
Trea
ted
Base
Cem
ent-
Trea
ted
Base
Cem
ent-
Trea
ted
Base
Cem
ent-
Trea
ted
Base
Cem
ent-
Trea
ted
Base
Thic
knes
s cm
(in
.)
23
(9)
23
(9)
23
(9)
23
(9)
23
(9)
23
(9)
23
(9)
23
(9)
23
(9)
23
(9)
23
(9)
23
(9)
23
(9)
23
(9)
PAVE
MEN
T
Flex
. St
r. M
Pa
(psi
)
4.6
(680
)
4.6
(680
)
4.6
(680
)
4.6
(680
)
4.6
(680
)
4.6
(680
)
4.6
(680
)
4.6
(680
)
4.6
(680
)
4.6
(680
)
4.6
(680
)
4.6
(680
)
4.6
(680
)
4.6
(680
)
Des
crip
tion
PCC
PCC
PCC
PCC
PCC
PCC
PCC
PCC
PCC
PCC
PCC
PCC
PCC
PCC
Thic
knes
s cm
(in
.)
38
(15)
38
(15)
41
(16)
41
(16)
43
(17)
43
(17)
43
(17)
43
(17)
38
(15)
38
(15)
41
(16)
41
(16)
43
(17)
43
(17)
OVE
RLA
Y PA
VEM
ENT Fl
ex.
Str.
MPa
(p
si)
Des
crip
tion
Thic
knes
s cm
(in
.)
FAC
ILIT
Y
Wid
th
m
(ft)
30
(100
)
30
(100
)
30
(100
)
30
(100
)
30
(100
)
30
(100
)
30
(100
)
30
(100
)
30
(100
)
30
(100
)
30
(100
)
30
(100
)
30
(100
)
30
(100
)
Leng
th
m
(ft)
305
(100
0)
152
(500
)
533
(175
0)
145
(475
)
305
(100
0)
152
(500
)
305
(100
0)
152
(500
)
305
(100
0)
152
(500
)
533
(175
0)
145
(475
)
305
(100
0)
305
(100
0)
Iden
tific
atio
n
TW F
bet
wee
n W
J an
d Z
TW F
bet
wee
n VV
J an
d Z
TW F
bet
wee
n W
R a
nd A
TW F
bet
wee
n W
R a
nd A
TW G
bet
wee
n W
J an
d Z
TW G
bet
wee
n W
J an
d Z
TW K
bet
wee
n K5
and
Z
TW K
bet
wee
n K5
and
EJ
TW L
bet
wee
n K5
and
Z
TW L
bet
wee
n K5
and
EJ
TW L
bet
wee
n A
and
ER
TW L
bet
wee
n A
and
ER
TW Z
bet
wee
n JY
and
Spi
ne
Roa
d Br
idge
TW B
bet
wee
n H
A an
d Sp
ine
Roa
d Br
idge
Feat
ure
1 2 3 4 5 6 7 8 9 10
11
12
13
14
D-4

--- --- ---
TABLE D-6. SUMMARY OF PCI/SCI DATA FOR DALLAS/FORT WORTHINTERNATIONAL AIRPORT
Number of Sample Units (S.U.) and Calculated Pavement Condition Index (PCI) and Structural Condition Index (SCI)
Feature* 1983 1986 1990 1995
S.U. PCI SCI S.U. PCI SCI S.U. PCI S.U. PCI SCI
1 4 88 100 4 87 100 8 90 8 85 100
2 2 92 98 2 80 98 3 90 4 88 100
3 7 96 100 7 91 100 12 77 15 85 100
4 2 97 100 2 88 100 3 98 2 86 99
5 4 90 96 4 84 96 8 89 8 84 100
6 2 89 100 2 82 100 3 73 3 87 100
7 4 73 64 4 46 64 5 78 8 57 98
8 2 73 60 2 37 60 3 84
9 4 70 61 4 46 61 8 91 8 75 92
10 2 66 64 2 50 64 3 70 4 72 95
11 7 73 71 7 59 71 13 90 9 81 100
12 2 85 94 2 76 94 4 93 4 77 99
13 4 79 87 4 69 87 10 88 10 77 96
14 4 72 76 4 60 76 10 76 11 77 94
* All of the features evaluated at DFW were 21 years old; they were constructed in 1974.
D-5

TABLE D-7. SUMMARY OF RESULTS FROM NDT DATA ANALYSIS, DALLAS/FORTWORTH INTERNATIONAL AIRPORT
Feature Procedure*
PCC Modulus
ksi
Cement-Stabilized
Base Modulus
ksi
Lime-Stabilized Subbase Modulus
ksi
Subgrade Modulus
ksi
Average Error
%
1 A 7,000 150 150 40 11.7
B 7,000 23 0.8
2 A 7,000 150 1,000 50 12.3
B 6,152 36 1.1
3 A 7,000 150 150 36 8.4
B 5,754 24 0.6
4 A 7,000 150 150 33 9.8
B 7,000 18 1.1
5 A 7,000 150 150 35 11.2
B 7,000 20 2.2
6 A 7,000 150 150 47 7.9
B 5,307 34 0.9
7 A 7,000 150 150 50 6.4
B 4,874 40 2.0
9 A 7,000 150 150 40 4.1
B 3,727 34 1.4
10 A 7,000 150 150 28 2.9
B 3,486 25 2.1
11 A 7,000 150 150 30 4.6
B 4,307,987 24 1.5
12 A 7,000 150 150 27 4.0
B 4,132 22 1.4
13 A 7,000 150 150 30 4.6
B 4,449 23 1.2
14 A 7,000 150 150 31 5.0
B 4,667 24 1.3
* “A” procedure allowed each layer to be calculated individually. “B” procedure combined the PCC and cement-stabilized layer as one layer for calculation and lime-stabilized subbase and subgrade as one layer.
D-6

1
2
3
4
5
6
7
8
9
10
11
12
TABLE D-8. SUMMARY OF EQUIVALENT MD-11 DEPARTURES, *DALLAS/FORT WORTH INTERNATIONAL AIRPORT
Feature Equivalent Annual MD-11 Departures,
Projected for 1991-2010 Cumulative Equivalent MD-11
Departures Through 1990
26,451 570,252
26,451 570,252
1,134 24,491
1,134 24,491
11,818 255,221
11,818 255,221
109,065 2,355,513
109,065 2,355,513
62,991 1,359,376
84,412 1,823,157
1,487 32,225
1,487 32,225
* Source for data, DFW Airport Development Department.
D-7

TA
BL
E D
-9.
SU
MM
AR
Y O
F P
HY
SIC
AL
PR
OP
ER
TY
DA
TA
, JO
HN
F. K
EN
NE
DY
IN
TE
RN
AT
ION
AL
AIR
PO
RT
FAC
ILIT
Y O
VER
LAY
PAVE
MEN
T PA
VEM
ENT
BASE
SU
BBAS
E SU
BGR
ADE
CBR
C
BR
Feat
ure
Iden
tific
atio
n
Leng
th
m
(ft)
Wid
th
m
(ft)
Thic
knes
s cm
(in
.) D
escr
iptio
n
Flex
. St
r. M
Pa
(psi
)
Thic
knes
s cm
(in
.) D
escr
iptio
n
Flex
. St
r. M
Pa
(psi
)
Thic
knes
s cm
(in
.) D
escr
iptio
n
k M
N/m
3
(psi
/in.)
Thic
knes
s m
m
(in.)
Des
crip
tion
CBR
D
escr
iptio
n
k M
N/m
3
(psi
/in.)
100
1 TW
J b
etw
een
TW Z
and
4L2
2R
610
(200
0)
23
(75)
23
(9
) AC
ove
rlay
in 1
985
20
(8
AC
43
(17)
) P.
M. M
acad
am
33
(10)
D
ense
Gra
ded
Aggr
egat
e 80
M
ediu
m-
dens
ity s
and
25
80
2 TW
K b
etw
een
13R
31L
and
4L22
R
1036
(3
400)
23
(7
5)
13
(5)
AC o
verla
y in
198
8 13
(5
) AC
28
(1
1)
Pene
trate
d St
one
Cou
rse
10
(4)
Ston
e Sc
reen
ings
80
M
ediu
m-
dens
ity s
and
25
100
3 TW
O b
etw
een
TW A
and
TW
B
396
(130
0)
23
(75)
20
(8
) AC
ove
rlay
in 1
984
10
(4)
AC
76
(30)
Li
me
Cem
ent,
and
Fly
Ash
Med
ium
-de
nsity
san
d 25
4 TW
P b
etw
een
TW P
C a
nd T
W
PD
244
(800
) 23
(7
5)
8 (3)
AC o
verla
y in
199
1 33
(1
3)
PCC
4.
4 (6
40)
15
(6)
Ston
e Sc
reen
ings
81
(300
)
Med
ium
-de
nsity
san
d 81
(300
)
D-8

--- --- ---
--- --- ---
--- --- ---
--- ---
TABLE D-10. SUMMARY OF PCI/SCI DATA, JOHN F. KENNEDYINTERNATIONAL AIRPORT
Number of Sample Units (S.U.) and Calculated Pavement Condition Index (PCI) and Structural Condition Index (SCI)
Feature Pavement
Age (years) 1983 1986 1993* 1995*
S.U. PCI SCI PCI SCI PCI PCI
1 17 11 92 95 60
2 22 25 50 65 35
3 25 12 76 100 70
4** 35 8 36 98 90 100
* Data provided by the Port Authority of New York and New Jersey. ** This feature was PCC in 1983; it was overlaid with AC in 1984 and 1991.
TABLE D-11. SUMMARY OF RESULTS FROM NDT ANALYSIS, JOHN F. KENNEDY INTERNATIONAL AIRPORT
Feature Procedure*
Surface Modulus
ksi
Base Modulus
ksi
Base Modulus
ksi
Subgrade Modulus
ksi
Average Error
%
1 C1C2C3C4 3,123 150 150 28 5.9
C12C34 823 13 30 0.7
2 C1C2C3C4 707 148 149 26 0.7
C1C23C4 822 135 26 0.3
3 C1C2C3 762 102 21 1.7
C1C23 1,854 37 7.2
4 C1C2C3C4 4,310 150 13 14 1.1
C1C23C4 4,500 81 14 1.1
* Procedures C1C2C3C4 and C1C2C3 identify that moduli were calculated for each layer. C12C3C4 indicates that the first two layers were combined and a composite modulus was calculated for the first two layers. C1C2C3C4 indicates that a composite modulus was calculated for the second and third layer.
D-9

TABLE D-12. SUMMARY OF EQUIVALENT ANNUAL B-747-200B OPERATIONS,*JOHN F. KENNEDY INTERNATIONAL AIRPORT
Feature Years Annual Arrival
Volume Annual Departure
Volume
1 1975-1985 9,000 31,100
1985-1995 9,000 31,100
2 1965-1975 1,080 18,720
1975-1985 750 13,000
1985-1995 750 13,000
3 1970-1975 52,560 943
1975-1985 36,500 655
1985-1995 36,500 655
4** 1965-1975 0 0
1975-1985 0 0
1985-1995 0 0
* Source for Data, Port Authority of New York and New Jersey.
** This traffic estimate reported by the Port Authority is for the area of ramp P (which experiences little traffic) as defined by the Port Authority. Ramp P is an apron through which this taxiway passes. According to reference 20 the equivalent annual B-747 departures for this feature in the early 1980s was 10,582.
D-10

--
TA
BL
E D
-13.
SU
MM
AR
Y O
F P
HY
SIC
AL
PR
OP
ER
TY
DA
TA
, PH
OE
NIX
SK
Y H
AR
BO
R I
NT
ER
NA
TIO
NA
L A
IRP
OR
T
FAC
ILIT
Y O
VER
LAY
PAVE
MEN
T PA
VEM
ENT
BASE
SU
BBAS
E SU
BGR
ADE
CBR
C
BR
Feat
ure
Iden
tific
atio
n
Leng
th
m
(ft)
Wid
th
m
(ft)
Thic
knes
s cm
(in
.) D
escr
iptio
n
Flex
. St
r. M
Pa
(psi
)
Thic
knes
s cm
(in
.) D
escr
iptio
n
Flex
. St
r. M
Pa
(psi
)
Thic
knes
s cm
(in
.) D
escr
iptio
n
k M
N/m
3
(psi
/in.)
Thic
knes
s m
m
(in.)
Des
crip
tion
CBR
D
escr
iptio
n
k M
N/m
3
(psi
/in.)
1 *
TW C
from
C
6-C
5
2 *
TW C
from
C
6-C
5
100
15
3 *
TW C
from
C
6-C
5 51
8 (1
700)
23
(7
5)
8 cm
mille
d of
f an
d re
plac
ed
in 1
991
15
(6)
AC
25
(10)
C
rush
ed S
tone
Si
lty s
and
som
e gr
avel
4 *
TW C
from
C
6-C
5
100
40
5 W
C
fro
m
C6-
C5
244
(800
) 23
(7
5)
3 (1)
3 cm
mille
d of
f an
d re
plac
ed
with
6-c
m
HM
AC in
199
1
15
(6)
AC
23
(10.
5))
Cru
shed
Sto
ne
61
(24)
Se
lect
rive
r run
80
R
iver
run
6 *
TW C
from
C
6-C
5
40
7 W
C
fro
m
C6-
C5
396
(130
0)
23
(75)
8
cm m
illed
off
and
repl
aced
in
199
1
13
(5)
AC
20
(8)
Bitu
min
ous
Base
R
iver
run
T T
100
40
8 W
C
fro
m
C6-
C5
244
(800
) 23
(7
5)
8 cm
mille
d of
f an
d re
plac
ed
in 1
991
10
(4)
AC
23
(9.5
) C
rush
ed S
tone
15
(6
) Se
lect
rive
r run
R
iver
run
T
* T
hese
fea
ture
s ha
ve b
een
com
plet
ely
reco
nstr
ucte
d us
ing
Por
tland
cem
ent c
oncr
ete.
D-11

TABLE D-14. SUMMARY OF PCI/SCI DATA FOR PHOENIX SKY HARBORINTERNATIONAL AIRPORT
Number of Sample Units (S.U.) and Calculated Pavement Condition Index (PCI) and Structural Condition Index (SCI)
Feature
Pavement Age
(years) 1983 1986 1995
S.U. PCI SCI S.U. PCI SCI S.U. PCI SCI
1 15 16 29 61 8 75 80 Reconstructed as PCC 2 28 17 54 67 8 39 50 Reconstructed as PCC
3 14 19 65 84 8 35 67 17 97 100
4 26 13 94 96 5 38 64 Reconstructed as PCC
5 16 17 43 86 8 42 77 8 82 88
6 16 8 48 100 4 39 73 Reconstructed as PCC
7 17 9 70 84 5 49 74 7 100 100
8 27 19 40 45 10 26 36 7 70 80
TABLE D-15. SUMMARY OF RESULTS FROM NDT DATA ANALYSIS, PHOENIXSKY HARBOR INTERNATIONAL AIRPORT
Feature Procedure*
Asphalt Cement Modulus
ksi Base Modulus
ksi
Subgrade Modulus
ksi Average Error
%
3 (part 1, Station 1-4)
A 423 182 36 4.8
B 271 36 5.5
3 (part 2, Station 5-14)
A 570 163 42 3.3
B 292 41 4.7
5 A 1,641 224 36 0.9
B 540 36 4.0
7 A 669 9,000 40 14.3
B 1,418 51 4.2
8 A 1,697 224 37 1.5
B 436 37 2.9
* “A” procedure allowed each layer modulus to be calculated individually. “B” procedure combined the AC and base layer for calculation of a composite modulus.
TABLE D-16. SUMMARY OF AIRCRAFT OPERATIONS,* PHOENIX SKY HARBOR INTERNATIONAL AIRPORT
Aircraft Category December 1993 Operations December 1994 Operations
Air Carrier 31,845 34,426
General Aviation 7,362 6,668
Military 611 586
Calendar Total 479,493 490,015
* Data courtesy of the City of Phoenix Aviation Department.
D-12
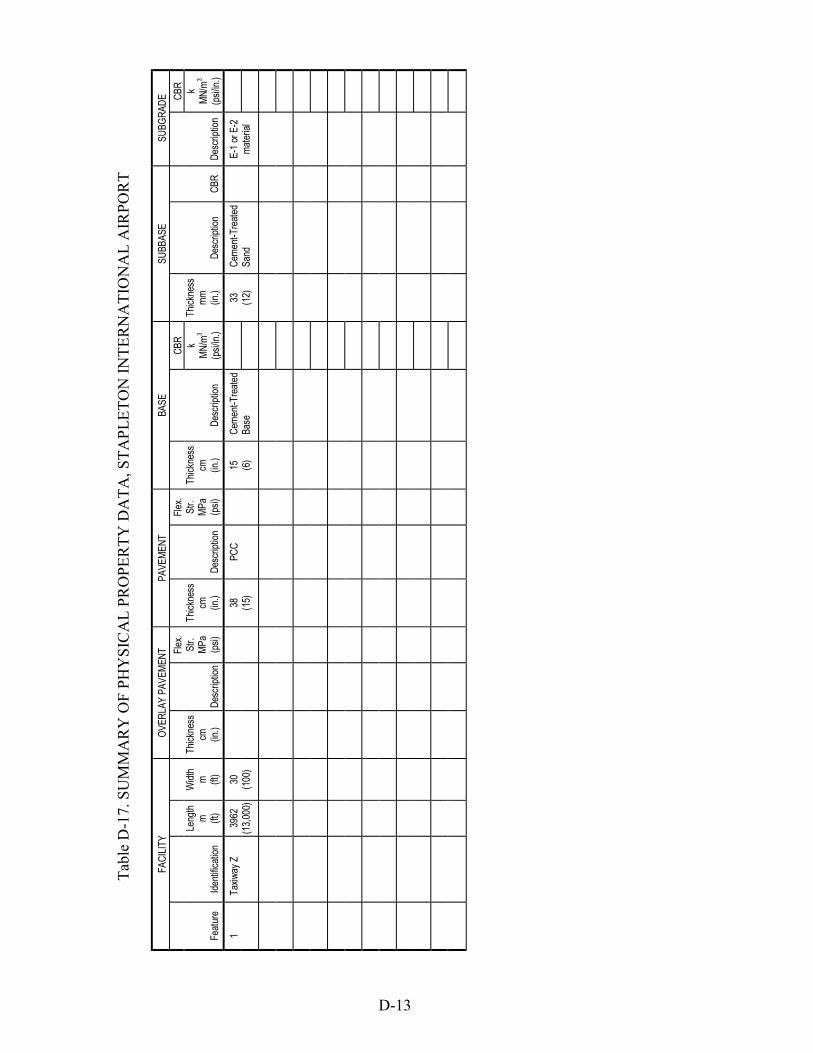
Tab
le D
-17.
SU
MM
AR
Y O
F P
HY
SIC
AL
PR
OP
ER
TY
DA
TA
, ST
AP
LE
TO
N I
NT
ER
NA
TIO
NA
L A
IRP
OR
T
SUBG
RAD
E CBR
k
MN
/m 3
(psi
/in.)
Des
crip
tion
E-1
or E
-2
mat
eria
l
SUBB
ASE
CBR
Des
crip
tion
Cem
ent-T
reat
ed
Sand
Thic
knes
s m
m
(in.)
33
(12)
BASE
CBR
k
MN
/m 3
(psi
/in.)
Des
crip
tion
Cem
ent-T
reat
ed
Base
Thic
knes
s cm
(in
.)
15
(6)
PAVE
MEN
T
Flex
. St
r. M
Pa
(psi
)D
escr
iptio
n
PCC
Thic
knes
s cm
(in
.)
38
(15)
OVE
RLA
Y PA
VEM
ENT Fl
ex.
Str.
MPa
(p
si)
Des
crip
tion
Thic
knes
s cm
(in
.)
FAC
ILIT
Y
Wid
th
m
(ft)
30
(100
)
Leng
th
m
(ft)
3962
(1
3,00
0)
Iden
tific
atio
n
Taxi
way
Z
Feat
ure
1
D-13

TABLE D-18. SUMMARY OF PCI/SCI DATA FOR TAXIWAY Z, STAPLETONINTERNATIONAL AIRPORT
Number of Sample Units (S.U.) and Calculated Pavement Condition Index (PCI) and Structural Condition Index (SCI)
Year of Construction
Number of Sample Units Surveyed PCI SCI
1974 35 50 77
TABLE D-19. SUMMARY OF RESULTS FROM NDT ANALYSIS, STAPLETONINTERNATIONAL AIRPORT
Feature Procedure*
PCC Modulus
ksi
Cement-Treated
Base ksi
Cement-Treated
Sand ksi
Subgrade ksi
Average Error
%
1 (Station 0-30)
C1C2C3C4 4,486 500 100 29 1.0
C1C23C4 5,448 37,455 33 0.8
2 (Station 30-58)
C1C2C3C4 5,624 150 4 50 0.8
C1C23C4 5,900 4,126 150 0.8
3 (Station 58-101)
C1C2C3C4 3,691 2,500 100 16 1.7
C1C234 5,610 21 1.1
4 (Station 101-118)
C1C2C3C4 5,610 500 159 15 0.5
C1C234 6,857 19 0.5
5 (Station 119-130)
C1C2C3C4 2,805 500 100 12 1.9
C1C2C34 4,054 1 38
* Procedure C1C2C3C4 identifies that moduli were calculated for each layer. C1C23C4 indicates that a single composite modulus was calculated for layers 2 and 3. C1C234 indicates that a composite modulus was calculated for the last three layers of the pavement system. C1C2C34 indicates that a composite modulus was calculated for the last two layers of the pavement system.
D-14