don't play in the street: unless you know which direction your stock is traveling
TRANSCRIPT

This publication is designed to provide accurate and authoritative information in re-gard to the subject matter covered. It is sold with the understanding that the publisheris not engaged in rendering legal, accounting, or other professional service. If legal ad-vice or other expert assistance is required, the services of a competent professionalshould be sought.
Vice President and Publisher: Cynthia A. ZigmundAcquisitions Editor: Mary B. GoodSenior Project Editor: Trey ThoelckeInterior Design: Lucy JenkinsCover Design: Megan MonaghanTypesetting: the dotted i
© 2003 by GlobalTec Solutions LLP
Published by Dearborn Trade Publishing, a Kaplan Professional Company
All rights reserved. The text of this publication, or any part thereof, may not be reproduced in any manner whatsoever without written permission from the publisher.
Printed in the United States of America
03 04 05 10 9 8 7 6 5 4 3 2 1
Library of Congress Cataloging-in-Publication Data
Thompson, George, 1965–Don’t play in the street : unless you know which direction your stock is traveling /
George Thompsonp. cm.
Includes index.ISBN 0-7931-7926-21. Stocks. 2. Investments. I. Title.
HG4521.T467 2003332.63′22—dc21
2003009722
Dearborn Trade books are available at special quantity discounts to use for sales pro-motions, employee premiums, or educational purposes. Please contact our specialsales department, to order or for more information, at [email protected] or 800-621-9621, ext. 4404, or write to Dearborn Financial Publishing, 30 South Wacker Drive,Suite 2500, Chicago, IL 60606-7481.

DEDICATION
I dedicate this book to every individual investor who is willing to take ad-vantage of the financial opportunities that the heritage of our great nationhas provided. My greatest reward is to help the individual investor financiallysucceed in a marketplace where major institutions have historically domi-nated. Technology has made it possible for each of you to have the propertrading tools to succeed in any market environment.


C o n t e n t s
v
ACKNOWLEDGMENTS vii
INTRODUCTION ix
1. WALL STREET SCANDALS Same as It Ever Was 1
2. MEDIA DARLINGS But Not Your Darlin’, Clementine 21
3. WHAM, SCAM, NO THANK YOU, MA’AM 27
4. KNOWLEDGE IS POWER 47
5. MIRROR, MIRROR Taking Stock of Yourself 77
6. PICKING A BROKER WHO WON’T MAKE YOU BROKER 81
7. THE GENESIS OF WIZETRADE™ New Approaches in a New World of Investing 99
8. LET’S GET PERSONAL Applying Foundations to Your Trading Strategy 123
9. TIPS AND PITFALLS 139
10. ADVANCED STRATEGY Short Orders 155
11. EVALUATING 35,000 STOCKS IN SECONDS 167
PHOTO GALLERY 181
APPENDIX 187
GLOSSARY 192
INDEX 207


A c k n o w l e d g m e n t s
vii
After years of research and development alongtime dream of mine was fulfilled in 1999. I released the first version of theWizetrade™ software. My deepest appreciation goes out to my good friend andpartner, Marc A. Sparks, for helping me fulfil my personal dream of creatinga system and an organization that allow individuals to create their own finan-cial independence. Marc’s vision and leadership have been the driving forcebehind the success of the Wizetrade™ program and the assembly of the finestgroup of individuals to create the company that exists today. Without Marc,this book would not exist, and neither would Wizetrade™, 4X Made Easy, orOptions Made Easy. Here’s to you Marc and that little ad you ran in the Dal-las Morning News on December 5, 1999, that brought us together.
As a company, Wizetrade™ has come a very long way since we opened ourdoors. Now called GlobalTec Solutions, LLP, the company produces sevensoftware products—Wizetrade™, Wizefinder™, Options Made Easy, OptionHunter, 4X Made Easy, LiquidTrader, Command Trade—and has developedtraining programs to help the average American participate in the financial
Need Capital?
Investment firm is seeking dynamic D/FW companies in need ofcapital. Owners must remain; companies must be at least oneyear old. (No restaurants.) Prefer e-commerce, high-tech busi-ness, and manufacturing, but will consider retail. Equity partici-pating funds provides capital, management and marketingassistance where needed. Fax outline of capital needs, businesssummary and financials to Mr. Gwinn at 972-387-4830.

opportunities provided by our capitalist system. I am very proud to be sur-rounded by the individuals that have made GlobalTec the company it is today.
Writing Don’t Play in the Street was an interesting project and a bigger chal-lenge than I initially expected. This book would have never been completedwithout the dedication of many friends and colleagues.
I am forever grateful to my partner, Marc Sparks, for his tremendousfocus and dedication and to Marc’s brother, Scott Sparks, for his insight intothe art of fine writing. Their encouragement kept me motivated to stay withthe project until the book came to fruition. Many times they would make melaugh and say just the right thing to create a spark that would lead to the com-pletion of yet another chapter. Scott’s uncanny ability to grasp this industryand add humor to this story made him a joy to work with.
Many other people have made major contributions and donated theirprecious time to creating this book as well. Claude deGuchi’s outlook on theinvestment industry added valuable insight to the book and his editorial ef-forts are sincerely appreciated. A special thanks goes to Trish Coulman forkeeping everyone involved, organized (just like she does with all of our proj-ects), and focused on the task at hand. Thanks also to Megan Monaghan, themost talented graphic artist I know, who is one of the most dedicated peoplewith whom I have had the opportunity to work. Megan and Marc Sparks workmagic together. Finally, thanks to Susan Dufour who came to this organizationwith a background in the investment and software industries. Her dedicationand knowledge of these two industries have provided powerful perspectivesand insights for my book.
Thank you all and congratulations on a job very well done.
viii Acknowledgments

I n t r o d u c t i o n
ix
MISSION IMPOSSIBLE?
Heck no! You can make money on Wall Street by yourself and you caneven thrive in these turbulent times. Forget about what brokers and analysts andthe media tell you. After all, look where they led millions of Americans dur-ing the tough times—down a primrose path of misinformation if not outrightlies. Throw out their old rules and start thinking like a professional trader.Open your mind and consider how you can take total control of your finan-cial destiny.
My mission in writing this book is to level the playing field for individualsin the stock market against all those brokerage firms, market makers, analysts,and Wall Street crooks who let their self-interests and greed outweigh the eth-ical issues of helping their customers succeed.
I want you to beat the experts. You can. For me, satisfaction is watchingthe little guy beat the big guy, like David versus Goliath. It’s not that I want tosee the big guys fail, I just want the underdog to win. As an entrepreneur, I re-late to the underdog because, by nature, entrepreneurs are underdogs—theyblaze their own trails. It shouldn’t surprise you that I have vivid and fondmemories of enjoying The Bad News Bears as a young kid, cheering on society’srejects as they beat the best in the world.
DON’T PLAY IN THE STREETUnless You Know Which Direction
Your Stock Is Traveling

My mission in this book is to prepare you to be an independent and em-powered stock investor. I appreciate and understand that education is the keyto accomplishing this mission. Once you are educated, you can confidentlytake charge of your finances. Therefore, you need to:
• Understand the institutions that are inherent players in the stock mar-ket and identify the pitfalls in dealing with those players due to theirconflicts of interest
• Understand the ABCs of investing and trading • Learn about the criteria and tools at your disposal to confidently choose
your own investments
STOCKING UP
Let’s be clear from the get go: This book is geared towards trading stocksfor personal growth. Though I address the important topics of overall portfo-lio management as well as your risk tolerance and diversification strategies,this book is not intended to cover in depth any other kinds of investment,such as bonds, insurance, retirement accounts, and real estate. Only you candetermine how much and what percentage of your money you can or want toinvest in stocks.
Why stocks? Stocks have outperformed any other form of investmentmechanism over the long term. This is because the U.S. market has enjoyed acontinuous upward trend for well over a hundred years. Even through slumpsand bear markets, you can thrive and make money—not just protect your cur-rent portfolio.
There are lucrative and sound investments out there during both bullmarkets and bear markets. Utilizing the right tools, stocks are by far the bestinvestment in which to grow your money.
There is always an element of uncertainty with stocks no matter howwisely and safely you play it. That is why you need to devise a solid plan. To dothis you need to follow some objectives so you know what you’re striving forand can strategize a plan to reach your goals.
x Introduction

OBJECTIVES: TAKING STOCK
In general:
• Take control of your financial destiny• Establish financial freedom and independence• Build and control wealth
Regarding outside influences:
• Ignore most of the old rules—learn which ones you don’t need to know!• Disregard market gurus, full-service stockbrokers, and newsletters• Cut out all the special interests of indifferent industrial entities• Avoid the common mistakes and fallacies of investing
Regarding stocks in particular:
• Take the guesswork out of trading stocks• Grasp what really drives stocks up and down• Know what criteria to identify great opportunities• Make trading choices simply, quickly, and reliably• Pinpoint entry and exit signals (when to buy and sell) for your trading
style• Increase your profits and stop your losses• Establish a method of trading that yields consistent positive results• Manage your stock portfolio in minutes per day• Make money in bull and bear markets
On a personal note:
• Identify your trading style and strategy• Become proficient in your trading style• Invest within your comfort level so you sleep well at night• Devote only the time you need for your trading style• Remove the emotions of fear and greed when trading by following your
plan of action• Get rid of shaky stocks in your portfolio now!• Boost your personal trading confidence dramatically
Introduction xi

Finally, invest only in “the best of the best”—not merely in stocks whichare going up, but in those which have the most demand and meet all yourgood investing criteria.
Much of the material in this book seems simple (because it is), but I urgeyou to take your time to fully grasp it. As Abraham Lincoln once said, “Giveme six hours to chop down a tree and I will spend the first four sharpeningthe axe.” I suggest you keep a highlighter and pen or pencil handy as you gothrough the rest of the book. Underline, circle, highlight, write down yourown notes, or do all of the above. This will keep you actively involved as yougo through this guide and will give you quick reference later to the points ofparticular interest or concern to you.
The time you spend now preparing yourself to be a successful trader willpay off huge dividends and won’t leave you with an axe to grind later.
Ready? I know you are. With basic education and some tools at your dis-posal to help you make sound investments in well-chosen stocks, I have fullfaith that you can succeed beyond whatever doubts you may have—and re-gardless of the whims of the stock market as a whole.
The goal is for you not only to be self-reliant but to assure your success.
xii Introduction

C h a p t e r
1
1
WALL STREET SCANDALSSame as It Ever Was
W h a t Y e a r W a s I t ?
Okay, let’s play a little game. Guess theyear of the following storyline and headline.Hint:They were both published in the Wall StreetJournal in the same year within two months ofeach other.
STORYLINE
“In a story like this, every story is a posi-tive one. Any news is good news. It’s prettymuch taken for granted now that the market is going to go up.”
HEADLINE
“Stocks Plunge 508 Amid Panicky Selling; Percentage Decline Is Far Steeperthan in 1929”
The answer can be found later in this chapter.
Source: The Collection of the Museumof American Financial History

Let’s open with a little story that may sound all too familiar.A speculator creates a new company, financed with huge sums of money
from banks and rich friends. This company quickly evolves into a financialempire and the the original speculator becomes fabulously wealthy. Suspect-ing insider chicanery, the government orders the company’s books be audited.Outrageous amounts of money are found missing. The government sues thecompany’s president and carts him off to jail.
In the wake of the scandal, the company’s empire collapses, bankruptingmany creditors, bankers, and brokers and causing a financial panic on WallStreet. The Secretary of the Treasury meets with prominent brokers to setrules to regulate trading. He proclaims that “there should be a separation be-tween honest men and knaves . . . between respectable stockbrokers . . . andmere unprincipled gamblers.”
This story is true. At the time, it was an outrage and a scandal, and it in-troduced a time-honored American tradition.
It is the story of what’s been dubbed Wall Street’s first scandal—in 1792.The “knave” was William Duer who used his insider knowledge (he was onceAssistant Secretary of the U.S. Treasury) to speculate in and manipulate bankstocks. The amount found missing was $238,000—a heap of cash in 1792. Andthe Secretary of the Treasury who’s quoted here was none other than Alexan-der Hamilton. You may have noticed his picture on the ten-dollar bill.
FLASH FORWARD TO THE YEAR 2002
Today, most economic historians and analysts aren’t surprised by the rev-elations of all the shenanigans that have surfaced since Enron filed for bank-ruptcy in December 2001. Hindsight helps, because only a couple of thempredicted our present predicament just a few years ago in the late 1990s.
Much of America’s grand and glorious financial history has been markedby cycles of Wall Street scandals. Typically, the cycle goes like this:
• There’s a period of unparalleled prosperity like the one we enjoyedthrough the late 1990s. Everyone’s making money so everyone’s happy.Don’t fix it if it ain’t broke.
• The bubble finally bursts and countless hordes lose their shirts.• Hard questions are asked that should have been asked throughout the
prosperous period.
2 D O N ’ T P L AY I N T H E S T R E E T

• Probes lead to unpleasant answers, revelations of books being cooked,forced resignations, lawsuits, and criminal investigations.
• The Securities and Exchange Commission, prosecutors, Congress, andthe president all condemn the scoundrels and float ideas for new reg-ulations to prevent future scandals.
• Insulted but contrite, Wall Street promises to clean up its act and vowsit can self-regulate with no more new laws or restrictions.
• Wall Street returns to business as usual.
A line from a Peggy Lee song comes to mind: “If that’s all there is, myfriend, then let’s keep dancing.”
The most recent corporate audacity and misbehavior are mind-blowing.The trillions of dollars that went down the tubes is breathtaking and there’splenty of blame to spread around.
A Washington Post article on June 28, 2002, quotes the dean of Yale Uni-versity’s School of Management, Jeffrey E. Garten.
I think it’s fair to say that there was nobody in the business community whois not implicated in this in some way. Not the executives who were under theexcruciating pressure of having to meet quarterly earnings targets, no mat-ter what. Not the lawyers and the accountants and bankers who were forcedto compete furiously to get and keep clients. Not the regulators who becameso intimidated by all the exuberance in the air. Certainly not the under-writers or the analysts or the credit-rating agencies or you in the press. . . .Even those of us at business schools are implicated. It’s not like the edu-cational establishment sounded any warning. We were cheerleaders, too.
But don’t kid yourself that this is something new. Sure, there’s been ameltdown of dot-com and telecom companies that didn’t exist in days of yore.But the scandals and allegations of law-breaking and insider trading at com-panies like Enron, WorldCom, Merrill Lynch, and Tyco only earns them a spotin the rogue’s gallery that we might dub the Wall Street Hall of Shame.They’re far from being the original inductees.
To quote Robert Reich, former labor secretary:
Really, there is no limit to the cons and swindles that have been seen overthe years. The human mind is capable of inventing very innovative prod-ucts and services—and also extraordinarily innovative swindles.
Wall Street Scandals: Same as It Ever Was 3

The corporate chicanery uncovered in recent scandals has been an inte-gral part of every burst bubble since the 17th century Dutch tulip mania. (Moreabout bubbles later.)
Some great names in American history made their fortunes throughshameless swindling—Vanderbilt, Morgan, Rockefeller, and Kennedy to namea few. Do you only relate these names with their philanthropy? Perhaps theirconsciences finally got the better of them when mortality stared them down.
Financial crooks tend to be respectable folks who demonstrate their pa-triotism by giving vast sums of money to America’s politicians, asking nothingin return except maybe a tweak in the tax code, in the smallest print possible,benefiting their industry.
In the election year of 2002, Republicans and Democrats alike were jock-eying for sound bites to pronounce that their side had taken and will continueto take the high road. Each side was biting at the bit to blame the other sidefor letting this mess unfold. Yet candidates from both parties had receivedcampaign contributions from Enron, WorldCom, and Arthur Andersen.These companies contributed millions of dollars to our lawmakers.
Okay, let’s take a moment to enjoy another true story. This one is from the1800s. Washington Post staff writer Peter Carlson’s February 10, 2002, articlecontributed the details of these scams of yore.
CIVIL WAR AND THE LIVING IS EASY
Many of the Civil War–era’s robber barons dodged the draft by payingsomeone $300 to fight in their place. We’re talking J.P. Morgan, John D. Rock-efeller, Andrew Carnegie, and Jay Gould. Their small investments gave themthe opportunity to avoid getting shot, thereby leaving them free to get richduring the war.
During the war, Morgan arranged a deal to buy 5,000 rifles from a UnionArmy arsenal in New York for $3.50 apiece. He turned around and sold the ri-fles to the Union Army in Virginia for $22 each. A judge ruled the deal waslegal, even though the rifles were defective causing soldiers to shoot theirthumbs off.
Some on Wall Street speculated in gold. The gold rose in price, risingagainst the dollar, with each defeat of the Union Army. Getting wind of this,President Lincoln made it clear that he hoped that every gold speculator “hadhis devilish head shot off.”
4 D O N ’ T P L AY I N T H E S T R E E T

After the war, the railroad business provided these entrepreneurs witheasily their biggest payoff. According to Mr. Carlson’s account of this episode:
In the 1860s, the federal government subsidized the building of atranscontinental railroad by granting millions of acres of free land to tworailroad companies, the Union Pacific and the Southern Pacific. Eager toline their pockets at the expense of their stockholders, Union Pacificmanagement formed a dummy construction company with an impressive-sounding French name, Credit Mobilier, and hired Rep. Oakes Ames aspresident. Credit Mobilier charged Union Pacific about $100 million tobuild the railroad—nearly twice what the job actually cost. The rest of themoney went to Credit Mobilier’s stockholders, a group that includedmany of Ames’s congressional cronies and Vice President Schuyler Col-fax, who had been bribed with cheap stock to look the other way.
Congressional hearings were held and there were angry editorials and afederal lawsuit. Ultimately, the Credit Mobilier scammers went their merryway, far richer for their modest efforts. Viva America! And Credit Mobilier!
One more side note from this era: President Ulysses S. Grant was scammedby a Wall Street crook and lost his fortune.
BUBBLE, BUBBLE, BOIL AND TROUBLE
A speculative bubble is a period when stock prices rise to unsustainablelevels, driven primarily by investor optimism when they speculate—that is,when they guess or rely on gut instinct or emotions—that one or more stocksor industries will skyrocket. Speculators engage in risky business transactionson the chance of making quick and vast profits. Optimism is contagious so thebubble grows as others join the frenzy. Who wants to miss out on what seemsto be a sure bet?
But when the bubble bursts—the speculators’ “crik” comes up emptywhere gold nuggets were expected—investors jump ship and sell their stocksthat are dramatically losing value every moment. Stocks sometimes lose overhalf their value in no time flat, and those stocks hardest hit may remain de-pressed for years. Some never recover. The companies either go out of busi-ness or they’re absorbed by stronger companies. The market becomes survivalof the fittest.
Wall Street Scandals: Same as It Ever Was 5

The late 1990s was an example of a speculative bubble. (Ain’t hindsightgreat?) During this period, the Nasdaq Composite Index, representing manyof technology’s “red hot” dot-com and telecom stocks, rose sharply, peakingat 5,048 in March 2000. Eighteen months later, the Nasdaq fell to 1,423. Thedot-com and telecom stocks that flooded the market accounted for most ofthe rapid growth and even more rapid depreciation of the Nasdaq.
Today, many of those companies are floundering or no longer exist. Thespeculators in those stocks lost trillions of dollars, devastating many retire-ment funds and leaving hundreds of thousands of employees scrambling fornew jobs. Was there any forewarning? Did history provide any lessons that weshould have heeded? After all, we know that history has a habit of repeatingitself.
Perhaps present-day speculators should have taken a gander at past bub-bles that burst, namely:
• The late 1920s just before the 1929 crash• The period between 1970 and 1972• The period between 1982 and 1987
In each case, you can recognize the cycle of scandals and scams repeating itself.Let’s take a closer look at the 1929 crash as it relates to our current bubble-
and-burst scenario.
1929: THE NIGHTMARE ON WALL STREET
In the early 1920s, the climate for great business was super. The presidentproclaimed “the business of America is business.” Between 1926 and Septem-ber of 1929, U.S. stocks soared to euphoric heights. The market was pumpedup by corporate profits, the government’s probusiness policies, and deals al-lowing stock to be purchased for only 10 percent down.
Near the peak, some prominent economists and bankers debated aboutwhether the market would sustain a boom or succumb to a bust. Those whopredicted a crash were criticized and scorned into silence as party poopers.The rabid speculators who were caught up in stock mania favored the “ex-perts” who were predicting that the market reached a plateau of new heightsthat would sustain itself forever more. The feeling was the market would nevergo lower.
6 D O N ’ T P L AY I N T H E S T R E E T

In September 1929, the limits of demand and available capital for invest-ing were sorely tested. The market drifted slightly lower, and then selling builtinto a deluge. Panic ensued. During two October days, more than $9 billionof the market value of American business was erased, leaving prices 25 per-cent lower. That was the infamous crash of the stock market.
Far more devastating to the country and the entire world was the depres-sion that followed. Stock prices bottomed 90 percent below their 1929 highsin the aftermath of what is probably the most far-reaching and widely felt spec-ulative bubble in economic history.
Let’s look at the numbers.
Year Date News
1929 September 3 Dow Jones peaks at 381October 28 Dow Jones, 260October 29 Dow Jones, 230
1930 April 17 Dow Jones, 294 (a rise, what’s the deal?)1932 July 8 Dow Jones falls to 41! (a 90 percent decline from its
peak on September 3, 1929)
After the stock market crashed in 1929, Congress investigated and uncov-ered countless instances of skullduggery, chicanery, and unadulterated fraud.
In one notable example, Ivar Krueger, a Swedish entrepreneur known asthe “match king,” acquired monopolies to control two-thirds of the world’skitchen match industry. He controlled his companies through an illegal pyramid-based holding company. When the pyramid collapsed during theGreat Depression, Krueger shot himself.
In 1934, five years after the crash, the federal government finally createdthe Securities and Exchange Commission to regulate and police the stockmarket, which had always enjoyed the privilege of regulating itself. Incensed,Richard Whitney, president of the New York Stock Exchange, told Congressthat the stock exchange didn’t need an overseer and that they could policethemselves without bureaucratic interference, thank you very much.
In 1937, Whitney was caught stealing $150,200 worth of bonds belongingto the New York Yacht Club and $667,000 from the Stock Exchange GratuityFund which had been set up to aid the widows and orphans of brokers. He de-manded that the stock exchange cover up his crimes because, in his words, tomillions of people “I mean the stock market.” Instead, he was sentenced to fiveto ten years in Sing Sing.
Wall Street Scandals: Same as It Ever Was 7

THEN AND NOW
Far more than any other precedent, present-day historians, economists,and columnists are comparing the bubble and burst we’re experiencing todayto that of 1929 and the period that followed. Few predict that we’re now fac-ing a depression like that of 70 years ago, but any comparison of our presentpredicament to the “worst of times” is sobering, considering its consequencesin the past.
The 1920s stock market investor knew little about the stocks he bought orsold. Investors moved in herds in and out of stocks based on news events, hottips, or the actions of the ticker tape. Even as their stocks plummeted, theyhated to sell them because everyone told them not to.
Today, we no longer have the cumbersome ticker tape, but our increasedaccess to moment-by-moment stock market fluctuations becomes more dan-gerous because today’s investor is generally not any more savvy to what reallymoves the market and is prone to making even quicker knee-jerk decisions onhis holdings. Investments still are based too much on emotions—namelygreed and fear. And misplaced loyalty still leads investors to hold onto a los-ing proposition. We wouldn’t want to disappoint our broker, would we?
Also, the technology of the 1920s runs strikingly parallel to the tech boomof the 1990s. For example, at its peak, the auto industry was comprised of closeto 2,000 carmakers. It was an exciting and heady days for investors. Today theauto industry is dominated by only a handful of companies, only two of whichare wholly American.
In the 1990s, it seemed, there were hundreds of Internet companies onthe stock exchange and investors poured huge sums of money into companiesthat had yet to earn a penny, had no business plans other than to do “some-thing” on the Internet, and were run by cocky twenty-somethings. Again, his-tory was repeating itself. Like the auto industry, the vast majority of Internetcompanies from the late 1990s have either tanked and died or consolidatedwith the few survivors. That’s the way it works. Always has, always will.
In both scenarios, devoted investors who worshipped at the temple of thetech market went from rags to riches to rags again, and somehow we’reshocked? During both decades, unscrupulous corporations, accountants, andbrokers were more than willing to string us along and prey on our gullibilitybecause they made money every time a stock was sold. They smugly used in-sider information (and, more recently, computer projections programmed ata level that no human brain can digest) to pull the plug on their own invest-
8 D O N ’ T P L AY I N T H E S T R E E T

ments when the bubble began to burst. And who’s left to hold the empty bag?Not them. I guess that leaves us.
None of what went on in the 1920s or the 1990s would have been possi-ble without the cooperation of the investing public. Human emotion and pub-lic euphoria led to speculation and set the stage for both bubbles—and busts.
What is different today is that stock ownership is no longer the sole do-main of the rich, the daredevils, and the fools. The middle class became fullyvested, and therefore vulnerable, even if their only involvement was throughtheir 401(k)s at work. Now, when corporations, accountants, and the brokershave conflicts of interests that favor the “big boys” instead of the “little” inves-tors, we are all prone to suffer the consequences.
Are you up for one more episode? This one’s from the 1980s just so wedon’t make the mistake of only relegating scandals to the distant past.
GREED IS GOOD
Taxpayers lost hundreds of billions of dollars in depositor bailouts duringthe savings-and-loan crisis of the 1980s. Though fraud played a role, the prob-lem resulted mainly from incredible mismanagement.
But what do we remember most leading up to the crash in 1987? Okay, I’llpersonalize it—what do I remember most? On “Black Monday” in October1987, I had capitalized a brokerage firm (but was not a broker myself, my twobrothers were licensed brokers in my company). I vividly remember that bro-kers all across America took their phones off the hook so that they could selltheir own positions first before helping their bigwig clients bail out. The in-dividual investors got a busy signal until after the institutional investors weretaken care of. I couldn’t get through to my own broker during that crash! (Toensure that this doesn’t happen again, the Small Order Executive System(SOES) was created to execute agency orders in Nasdaq stocks (1,000 sharesor less) to bypass the bias of brokers toward their biggest customers.)
What led up to this stock market loss of 508 points—20 percent—in a sin-gle day, exceeding the percentage decline of the crash of 1929? (If you’re pay-ing attention, I just answered the trivia question at the beginning of thischapter.) The loss largely was based on a huge decline in investor confidencedue to scandals. Surprise.
You may remember the “greed is good” speech delivered by MichaelDouglas in the 1987 movie Wall Street. He played a slick but chilling character
Wall Street Scandals: Same as It Ever Was 9

named Gordon Gekko. But did you know that his speech was based almostword for word on a speech given by Ivan Boesky to some business students in1985? Boesky told the students, “Greed is all right, by the way—I want you toknow that. I think greed is healthy. You can be greedy and still feel good aboutyourself.”
Boesky didn’t just talk the talk, he walked the walk. After making hun-dreds of millions of dollars on stocks and bonds, he wanted more. Muchmore. He admitted fantasizing about climbing atop a huge pile of silver dol-lars because it would be an “aphrodisiac experience.” Boesky then paid mil-lions of dollars to an investment banker named Dennis Levine with DrexelBurnham Lambert for insider information on corporate takeovers. Boeskymade millions more on insider trading.
The SEC caught Levine who ratted on Boesky. Boesky then ratted onmany other wheeler-dealers, including Michael Milken, Drexel’s legendary“junk bond king.” Boesky acquired incriminating evidence on Milken by lur-ing him into a hotel room and recording their conversation about their elab-orate insider trading network.
Boesky served 18 months in prison and paid a $100 million fine. Milkenserved three years and paid $200 million. Drexel Burnham Lambert wentbankrupt. A fellow named Rudolph Giuliani made his mark prosecuting all ofthese guys.
Unlike its delayed reaction after the 1929 crash, when it took the govern-ment five years to intervene in a significant way by creating the SEC, the gov-ernment stepped in immediately after the 1987 crash. The Federal Reserveguaranteed the credit of market makers the day after the crash and a reces-sion was averted. But it gave investors the faulty impression that the govern-ment’s intervention could solve every pesky tumble off the cliff.
THE WRITING WAS ON THE WALL
Okay, let’s look at a timeline of the most recent movement of the marketfrom 1998 to mid-2002, including the intrusion of scandals as the bubbleburst. With your newly heightened insight into the cycle of scandals, I’ll re-frain from interpreting the events for you and present just the facts, ma’am.(See Figure 1.1.)
10 D O N ’ T P L AY I N T H E S T R E E T
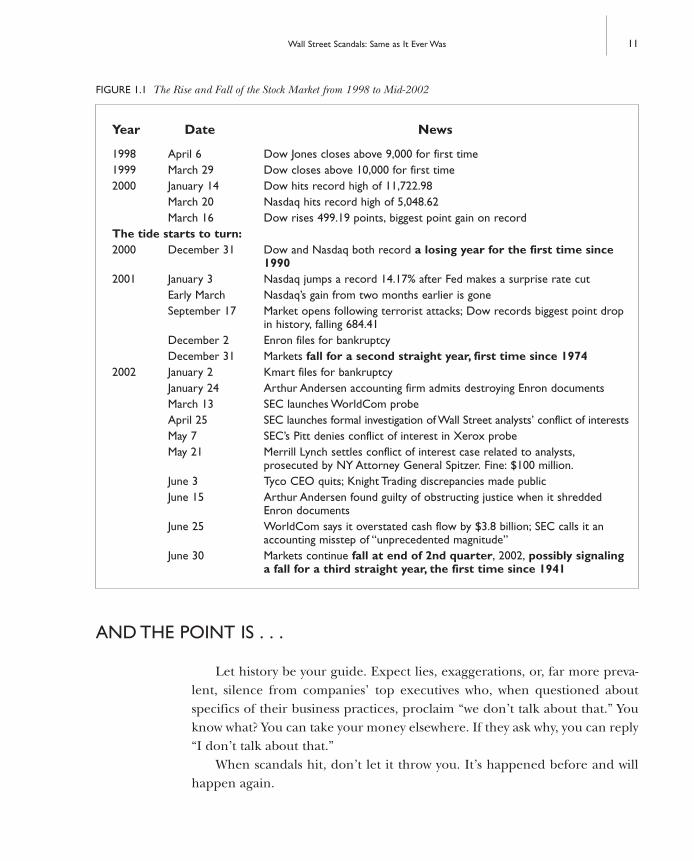
AND THE POINT IS . . .
Let history be your guide. Expect lies, exaggerations, or, far more preva-lent, silence from companies’ top executives who, when questioned aboutspecifics of their business practices, proclaim “we don’t talk about that.” Youknow what? You can take your money elsewhere. If they ask why, you can reply“I don’t talk about that.”
When scandals hit, don’t let it throw you. It’s happened before and willhappen again.
Wall Street Scandals: Same as It Ever Was 11
FIGURE 1.1 The Rise and Fall of the Stock Market from 1998 to Mid-2002
Year Date News
1998 April 6 Dow Jones closes above 9,000 for first time1999 March 29 Dow closes above 10,000 for first time2000 January 14 Dow hits record high of 11,722.98
March 20 Nasdaq hits record high of 5,048.62March 16 Dow rises 499.19 points, biggest point gain on record
The tide starts to turn:2000 December 31 Dow and Nasdaq both record a losing year for the first time since
19902001 January 3 Nasdaq jumps a record 14.17% after Fed makes a surprise rate cut
Early March Nasdaq’s gain from two months earlier is goneSeptember 17 Market opens following terrorist attacks; Dow records biggest point drop
in history, falling 684.41December 2 Enron files for bankruptcyDecember 31 Markets fall for a second straight year, first time since 1974
2002 January 2 Kmart files for bankruptcyJanuary 24 Arthur Andersen accounting firm admits destroying Enron documentsMarch 13 SEC launches WorldCom probeApril 25 SEC launches formal investigation of Wall Street analysts’ conflict of interestsMay 7 SEC’s Pitt denies conflict of interest in Xerox probeMay 21 Merrill Lynch settles conflict of interest case related to analysts,
prosecuted by NY Attorney General Spitzer. Fine: $100 million.June 3 Tyco CEO quits; Knight Trading discrepancies made publicJune 15 Arthur Andersen found guilty of obstructing justice when it shredded
Enron documentsJune 25 WorldCom says it overstated cash flow by $3.8 billion; SEC calls it an
accounting misstep of “unprecedented magnitude”June 30 Markets continue fall at end of 2nd quarter, 2002, possibly signaling
a fall for a third straight year, the first time since 1941

Remember, the stock market exists to bring together those with a surplusof money (investors) and those who need money to finance enterprise (com-panies). If you have any hint that the company that needs investment moneyis not to be trusted, don’t give it your money. And never give money to a com-pany that has a “cool concept” but has yet to earn a dollar. In either case, sayadios and don’t look back.
A healthy dose of cynicism will serve you well. Trust it. Caveat emptor.Buyer beware.
Don’t expect to get rich overnight. But know that there are lucrative andsound investments out there—during both bull markets and bear markets.
We—meaning you and I—can do far better if we know the score. Trustyourself. I’ll do my damnedest to give you the knowledge and tools you needto do that. That’s what this book is all about.
QUOTE UNQUOTE
I find these two quotes very interesting:
1. “Those who cannot remember the past are condemned to repeat it.”(George Santayana)
2. “If past history was all there was to the game, the richest people wouldbe librarians.” (Warren Buffett, legendary investor)
I’d rather be rich than a librarian.Now let’s shine a light behind the curtain to expose the major players on
Wall Street. As you’ll see, the conflicts of interest inherent in every importantinstitution that drives Wall Street stack the deck in their favor and purpose-fully leave you in the dark. Will any of these conflicts be resolved in the up-roar over the current scandals and crises of confidence? I’m following thestory just like you.
But it’s very important for you to understand how Wall Street works, evenif it isn’t pretty. You’ll quickly recognize that most of their BS is irrelevant toyou as a successful investor if you don’t buy into their games. With that said,let me introduce the cast of characters.
12 D O N ’ T P L AY I N T H E S T R E E T
LIARS AND TRICKSTERS AND BROKERS, OH MY!
Ninety-nine percent of brokerage analysts are giving the remaining 1 percent a bad reputation.
JON D. MARKMAN, managing editor, MSN MoneyCentral, May 31, 2002
In preparing this book, I came across a study that astounded even me.For the year 2000 (when the bubble burst on Wall Street), researchers at
the University of California and Stanford reviewed almost 40,000 stock rec-ommendations from 213 brokerages. The brokerages’ most highly ratedstocks (those with “buy” or “strong buy” recommendations) had a negative 31percent return compared to the rest of the stock market. The stocks rated as“sells” by these same brokerage firms—that is, the lowest rated stocks—out-performed the stock market by a positive 49 percent.
Let’s be clear: Compared to the rest of the stock market in 2000, the highestrecommendations from brokerages plunged 31 percent and sell recommen-dations gained by 49 percent. The dogs outperformed the winners by 80 per-cent! You would have made a bundle investing in the opposite of Wall Street’sanalysts recommendations.
Wall Street Scandals: Same as It Ever Was 13
W h a t Y e a r W a s I t ?
Here’s the answer to the trivia question at the top of this chapter: The yearwas 1987.
STORYLINE
“In a story like this, every story is a positive one. Any news is good news. It’spretty much taken for granted now that the market is going to go up.”
Wall Street Journal, August 26, 1987, the day after the 1987 market peak.
HEADLINE
“Stocks Plunge 508 Amid Panicky Selling; Percentage Decline Is Far Steeperthan in 1929”
Wall Street Journal, October 20, 1987, the day after the crash—just eightweeks after the peak.

BUY, HOLD, SELL
The three basic recommendations given by brokers are to buy a stock,hold a stock, and sell a stock. You’d expect them to be equally weighted, es-pecially in a bear market, but think again. Thomson Financial/First Call, a
14 D O N ’ T P L AY I N T H E S T R E E T
T u l i p o m a n i a
The tulip was a non-Western flower (originally from Turkey) that came intoa boom market in the early 17th Century when an Austrian botanist who culti-vated them in Western Europe fled to Holland to escape religious persecution.The flowers thrived in the Dutch climate and, soon, they became the rage amongall classes of people. Those with money bought the flowers and planted them inlavish gardens to signify their wealth and power. The common man admired theflowers from afar. The national demand for this springtime flower soon becamefrenzied, and Tulipomania was born.
One of the largest factors contributing to the craze was the shift from thesale of tulips by the bulb to their sale by weight. The rarer the flower, the moreit cost. The demand soon outgrew the supply, and people began trading on whatwas basically a nonexistent commodity—that is, the flower was being traded butwhat the buyer got was a bulb that, in essence, had the potential to become aflower. Soon, the speculative nature of the trade began to draw criticism and evenridicule, and the term wind trade was devised to show the whimsical and emptynature of the trades (determining prices out of thin air). Regardless, the trade wasdriven by the greed of the individuals participating in it, and even the governmentcould do little to stop the momentum of the beast that was Tulipomania.
At a certain point, the demand (that is, the price) of the bulbs became soridiculous that the market could no longer sustain it. It’s said that Tulipomaniaended in 1637 when a group of sellers came to the market and no one could af-ford to buy from them anymore. News spread and people started ditching theirinvestment in droves, driving down the price faster than the Titanic sank. Most ofthose who stayed in the market to the bitter end were left with nothing excepthuge debts that they couldn’t pay off.
What can we learn from this story? Greed spawns money-making schemes.Hindsight is 20/20. And always find a fool to pay a higher price or get the hell outof the market before you are left with nothing.

global research network, as reported in Fortune magazine’s February 5, 2001,issue, kept a tally of the buy and strong buy recommendations as well as thesell recommendations of the ten largest investment banks. Here are the results.
Merrill Lynch 940 buys / 7 sellsSalomon Smith Barney 865 buys / 4 sellsCredit Suisse First Boston 791 buys / 9 sellsGoldman Sachs 780 buys / 4 sellsUBS Walburg 696 buys / 8 sellsMorgan Stanley Dean Witter 670 buys / 0 sellsLehman Brothers 705 buys / 8 sellsBank of America Securities 557 buys / 6 sellsDeutsche Banc Alex. Brown 513 buys / 9 sellsBear Stearns 525 buys / 2 sellsTotal: 7,033 buys / 57 sells
These are incredibly influential firms who issued buy or strong buy rec-ommendations over 99 percent of the time compared to recommendations tosell (less than 1 percent). Is it any wonder that the “buy” mentality created bythese firms, especially when steered to invest in their institutional clients’stocks, performed so poorly?
Seasoned investors know that Wall Street analysts refrain from issuing sellrecommendations until the stock has neared bottom. Why? Because they facetremendous conflicts of interest within their firms to placate the most prof-itable end of their business—their institutional clients. The brokerages makea very small percentage of their money in commissions from individual in-vestors’ compared to the massive investment banking and consulting fees theycan charge companies, especially those with an initial public offering (IPO).And the brokerages themselves have invested millions of dollars in loans toprop up these companies; why undercut the money flow by issuing a less thanstellar rating?
Of course, these same brokerages and their preferred clients, possessingthe inside knowledge of a company’s poor performance, will sell their stockin droves while you and I are encouraged to keep buying, thus retaining thestock’s value while they bail out. These firms count on us to be the lemmingswho unwittingly fall off the cliff while they set sail to prosperity in their yachts.
In my estimation, this is a massive breach of trust between these firms andthe general investing public.
Wall Street Scandals: Same as It Ever Was 15

WHEN THE TIDE TURNED
Prior to May 1975, price competition for commissions on investmenttransactions were illegal. Commission prices were fixed. Imagine, competitionwas not allowed on Wall Street, the ultimate symbol of capitalism.
The fat cats in this big gentlemen’s club raked in big bucks every timesomeone invested in the market. You probably would have paid your stock-broker hundreds of dollars in commissions to invest $10,000 in stocks. Butthen, analysts also had the incentive to make profitable stock picks in order toretain their clients and keep them from going down the street and paying thesame price for better advice.
On May 1, 1975 (known as “May Day” in the industry), the SEC deregu-lated set prices for commissions and allowed negotiation. May Day spelled theend of Wall Street’s guaranteed good times; brokerage houses predicteddoom and gloom at the time. When a small handful of brokers like CharlesSchwab offered discount prices for transactions, breaking up the old gentle-men’s club, the old-school Wall Street denizens had to scramble to find otherways to make money.
The deregulation of pricey commissions opened the market beyond therealm of the wealthy, the gamblers, and the fools. The middle class could nowafford to play the game. But . . . be careful what you wish for.
Analysts and brokers turned to investment banking to rake in new rev-enue. The big bucks now came from juicy underwriting deals to provide ini-tial public offerings of stock for new companies. The hunger for tradingcommissions dwindled until it was only a small piece of the pie.
During this transition, the analysts’ incentive shifted dramatically fromproviding profitable stock tips for the powerful good old boys to supportingtheir firm’s dealmakers in marketing the stock of their deep-pocketed clients.Analysts’ objectivity gave way to promoting a product. An analyst’s objectivityis obviously hampered if his firm’s client pays outlandish fees to offer suspi-cious stock to the public. What to do? If he rocks the boat by giving his hon-est opinion of the stock’s value, he would most likely lose his job.
Here’s something to remember: Investors should always view a researchreport from a brokerage house as a sales product. A savvy investor can stillglean some nuggets of truth in a good analyst’s research report, just as you canstudy a car dealer’s brochure to learn about the features of a new car. But forPete’s sake, ignore the recommendation to buy, hold, or sell. Like the cardealer, you know the broker wants you to buy what he’s pitching, but maybe
16 D O N ’ T P L AY I N T H E S T R E E T
there’s something else on his lot that’s better for you. Or maybe nothing hehas suits you. The choice to buy or pass is yours and yours alone.
I found a very good analogy provided in an interview on TheStreet.comwith Benjamin Mark Cole, author of The Pied Pipers of Wall Street: How AnalystsSell You Down the River. He stated:
I would say there are no impartial analysts, and no, there are no analystswho work for brokerages that I admire. Their job has become that oflawyers. They are not the judge in the courtroom, they are the lawyers inthe courtroom. And the lawyers’ job is to put forward the best case on be-half of their client. Whenever you hear an analyst speak, consider him alawyer on behalf of his client. They may be telling the truth, but it may notbe the whole truth.
Need an example? In 1999, Wall Street firms grossed $1 billion for bring-ing 214 Internet companies public. Investors paid over $16 billion for theseIPOs. Today, the remaining companies may be worth $4 billion. Who paid forthe investment bankers’ profits? Investors who lost their shirts.
But this is America. Can’t the government step in to resolve this conflictof interest mess by separating a brokerage firm’s banking department from itsinvestment department on which investors rely for “unbiased” advice? Afterall, the very foundation of a financial system must be built on the integrity ofits information. The government has tried before, but it only resulted in“Chinese walls.”
CHINESE WALLS
After the crash of 1929 that set the Great Depression in motion, the fed-eral government needed to put in place some sense of accountability in in-vestment banking practices that routinely crossed lines and created conflictsof interest. While the government could not physically separate brokeragefirms from investment banks in large financial conglomerates, they passed theGlass-Steagall Act of 1933 that, in essence, placed barriers (or walls) betweena company’s banking and securities practices.
At a basic level, the relevant sections of Glass-Steagall state that a bankthat is a member of the Federal Reserve cannot purchase securities for its ownaccount. The rationale here is that if a bank is both buying stocks for itself and
Wall Street Scandals: Same as It Ever Was 17

selling them to customers, it would have a conflicting interest in promotingand selling those stocks to the public in order to secure their own wealth,whether they were a good buy or not.
The result of this act is what is known as a Chinese wall (yes, the name wasborrowed from the Great Wall of China). In the case of a large financial firmthat offers both investment banking and securities services, the departmentsthat deal with each area are supposed to be either physically or “ethically” sep-arated from each other. This sounds like a great idea. The problem is thatwithin the context of a company, the wall that exists between one departmentand another is flimsy at best.
If physicians freely discuss their patients with each other in a hospital set-ting, you can bet that bankers and analysts talk at the water cooler, too, butwith much less discretion about ethical conduct.
While the idea of a Chinese wall is sound in theory, in reality, it doesn’twork. The two parties on either side of the wall have too much to gain (suchas millions, if not billions, of dollars) by commiserating with each other. ThePandora’s box that’s opened when the wall is traversed will always benefit thebig clients, not the individual investors.
In 1999, under heavy lobbying pressure from investment banking firms,Congress actually struck down Glass-Steagall because investment bankers as-sured Congress that they could monitor themselves without it. In just threeshort years, the Chinese walls vanished and the departments on both sidesjoined together like Siamese twins.
That was the beginning of the end of the dot-com era. Investment bank-ers financed hundreds of fledgling companies that had “cool concepts” buthad yet to earn a penny in revenue, and that was good enough for bullish op-timism in the late 1990s. The bankers pressured their analysts—draggingthem over the Chinese wall not with force but with the promise of making mil-lions of dollars—to sell stocks to the gullible public during the bull marketsupporting these pie-in-the-sky dot-com companies. We would have been bet-ter off if they had thrown pies in our faces.
Fast-forward to 2002. The government is once again cracking down on conflicts of interest at
the major investment banking firms, whose analysts touted failing stocks dur-ing the last couple of years that cost the American public trillions of dollars inlost investments.
Gee, that didn’t take long, now did it?
18 D O N ’ T P L AY I N T H E S T R E E T

NOT SO FAST, MERRILL LYNCH
Only a few years ago, analysts lauded technology and telecommunicationsstocks that soared during the Internet bubble. After the crash that wiped outbillions of dollars in paper wealth, regulators finally emerged from the shad-ows to investigate the relationship between investment banking and researchon Wall Street that many had long said was riddled with conflicts of interest.(During the boom, there was little incentive to regulate or fix what wasn’tbroke until the consequences of neglect came to roost.)
In April 2002, state’s attorney general Eliot Spitzer led a probe into thecredibility of analysts’ advice that triggered an uproar. He released e-mails thathe obtained by subpoena, which showed that Merrill Lynch analysts in 2000and 2001 often referred to an Internet stock as “a piece of crap” while issuingbuy ratings for that same stock.
In the settlement, Merrill agreed to pay $100 million in fines. Individualinvestors got nothing. Zero. Instead, $48 million went to New York State and$52 million to other states.
To be fair to Merrill, they were not the only firm investigated by Eliot. Therecords of other major Wall Street firms also were subpoenaed, includingthose of Morgan Stanley Dean Witter & Co., Credit Suisse First Boston, the Sa-lomon Smith Barney, Inc. unit of Citigroup, Inc., Lehman Brothers, Inc., Bear,Stearns & Co., UBS Warburg, and J.P. Morgan Chase & Co.
What changed after this settlement? Critics say very little. The settlementallows analysts to continue to work alongside investment bankers in some sit-uations but is supposed to eliminate any investment banking incentives in set-ting analyst compensation. As part of the settlement, Merrill has agreed to
Wall Street Scandals: Same as It Ever Was 19
C h i n e s e W a l l
In a broader sense, Chinese wall is a term that also applies to the lines otherthan those drawn between investment banks and their analyst employees. It canrefer to any relationship between entities where a line should be drawn—like be-tween companies and independent accounting firms—but where that line can beeasily crossed due to conflicts of interest. Unfortunately, a Chinese wall is only aconcept, not an architectural barrier.

base analysts’ pay on stock-picking ability rather than investment bankingwork. However, as Jon D Markman pointed out on MSN MoneyCentral, “Bro-kerages have more elaborate systems for tracking how many phone calls theanalysts make to clients pitching their research than they do for trackingwhether the research makes sense.”
Merrill and a couple other firms now under investigation have an-nounced that they’re adopting stricter standards of behavior, (if for no otherreason than to regain some lost investors’ confidence). But even as they an-nounce plans for better behavior, brokerages still insist that their analysts al-ways operated independently from their investment banking departments.
On BusinessWeek.com, Amey Stone cites a response from Barbara Roper,director of investor protection at the Consumer Federation of America: “I’mnot convinced that bolstering investor confidence in Wall Street research re-ally ought to be our goal. Perhaps bolstering a healthy skepticism about WallStreet research is a better goal, and Mr. Spitzer has certainly accomplishedthat.”
ARE YOU READY FOR YOUR CLOSE-UP,MR. PITT? (HARVEY, NOT BRAD)
The Securities and Exchange Commission lists the potential conflicts ofinterests in surprisingly accessible language, covering bases I might havemissed. For that I should thank Harvey Pitt, head of the SEC.
CONCLUSION
You can make far better sound investment choices—on your own—byeliminating inherent conflicts of interest in Wall Street’s institutions. Second-guess your broker, not yourself. By pulling back the curtain to reveal the realWizard of Oz, and realizing that he only has the power we give him, then youbecome the master of your own destiny.
The latter two-thirds of this book have been prepared to empower you totake control of your financial well being so you will not be at the mercy of out-side powers beyond your control. With a little education and a few tools atyour disposal to help take the guesswork out of sound investing in the stockmarket, I am confident that you can succeed.
20 D O N ’ T P L AY I N T H E S T R E E T

C h a p t e r
21
2
They say that a hero will save us. I’m not going to stand hereand wait.
From the song “Hero,” from the motion picture Spider-Man
As a whole, Americans have an umbilical cordconnected to the television. More than any other nation in the world, TV inAmerica is big business and entertainment. So it’s no stretch of the imagina-tion to realize that many Americans tune into their favorite daily investmentnews show before making investment decisions. Hey, if someone says it’s so onTV, it must be true.
TV’s financial shows typically feature a cast of characters who sit around,make predictions, and sound smooth and confident. The high-profile analystson these shows are very similar to politicians. Like politicians, their task is to puton their best face and gain our trust. Because they’re on TV, they become starsin our psyche. Just like in politics, the media darlings of the investment worldare often willing to bend the truth or outright lie to you to convince you thatthey have your best interests at heart while selling you a bill of goods.
Star analysts for top rated firms (e.g., Henry Blodget of Merrill Lynch andJack Grubman of Salomon Smith Barney) make upwards of $12 million in
MEDIA DARLINGSBut Not Your Darlin’, Clementine
salary and bonuses per year, not because their opinions are worth being com-pensated at that level (then again, whose are?), but because their recommen-dations coax people into buying volatile stocks that directly benefit them andtheir firms’ investment banking deals—not us, the individual investors.
Basically, stock market pundits use TV to generate buzz for their firms andto inflate their egos, and we buy into their marketing strategies becausethey’re on TV and they must know what the hell they’re talking about or theywouldn’t be on TV. But, surprise, their analysis has as much to do with realityas reality TV. It’s manipulated. (Sorry to burst the bubbles of fans of Survivor,Big Brother, and Temptation Island.) On TV, conflict—even if manipulated dur-ing editing—equals ratings. In the stock market, excitement—even if in-vented by analysts—equals sales. Hollywood meets Wall Street. It’s the samegame. We all love drama, even if it’s fictional. In fact, we like it better if it’s fic-tional. When was the last time you drove to a theater to catch a documentary?
But your investments must be based on trust, reliability, and real life. Thisisn’t mindless entertainment and you don’t want conflict. This is your hard-earned money that you want to grow, not dissipate from gambling on bogusadvice.
That is why New York State’s Attorney General Eliot Spitzer has been scru-tinizing practices of large investment firms with incredible conflicts of inter-est issues. Due to his investigation, Merrill Lynch was fined $100 million fortying its analysts’ compensation to deals that enhance its corporate clients’cash flow while encouraging individual investors to buy that corporation’sstock as its value dropped like water cascading over Niagara Falls.
Although Merrill Lynch did not admit any wrongdoing (while paying its$100 million fine), it vowed to change its policies by promising that it will nolonger tie its investment banking deals to the compensation of its analysts.(These analysts now presumably will have no incentive to push iffy stocks onunsuspecting investors that will benefit their firm’s investing side of the busi-ness down the hall.)
In the aftermath of this lawsuit, almost all other major investment firmsare vowing to make the same changes, not because they’ve suddenly discov-ered ethics or found religion but because they don’t want to pay that peskyfine that was levied on Merrill.
Let’s hope this bodes well for all us “little folks,” so we now can get unbi-ased recommendations from the big brokerage firms. But don’t count on it.If regulators and prosecutors trust the large brokerage firms’ promise to dothe right thing from now on, the brokerage firms will still be regulating them-
22 D O N ’ T P L AY I N T H E S T R E E T

selves. Beware. The temptation of huge profits again will lure them to peekover the Chinese walls—especially if they haven’t been punished for past in-discretions. (The reason we ground our kids is so they’ll think twice aboutdoing it again.)
While putting this book together during the summer of 2002, a new SECregulation was issued that makes it mandatory for analysts and anyone elsepublicly commenting on stocks to fully disclose any conflicts of interest theyhave. The regulation specifically targets conflicted recommendations madeover the phone, by e-mail, and also in the media—including TV, radio, andthe Internet, which seems to have been invented to help Wall Street marketits securities without the expense of direct mail.
After the implementation of this regulation, I would hope that informedinvestors would be more skeptical of an analyst’s vested interest in a stock per-formance. Still, I doubt that this new requirement will change things. Giventhe vast sums of money involved, Wall Street’s marketing gurus will surely de-vise ways to get around the regulations, such as burying the disclosure in thefine print of their documents or whispering the disclosure in their radio orTV commercials.
If you get nothing else from this book, understand this: The Wall Streethype found in the media—TV, radio, the Internet, magazines, and newspa-pers—is exactly that, hype. The hype is designed to entertain you and providePR that will help sell lousy stocks as good investments. Think of it as bubble-vision. The bullish information encouraging you to buy, not sell, helps WallStreet sell more stocks to you. They want your money and they don’t care awhit about your financial well being. They’re salesmen; that’s their job. If youwant to build wealth based on sensible and reliable advice, tune them out.
Like car dealers or insurance salesmen, it’s their job to sell you their prod-ucts, not those of their competitor down the road that may be far better suitedfor you. If you walk into a showroom or watch TV, you should expect: “Trustus, buy it, then please disappear . . . unless you wanna come back to buy somemore.” They want you to trust them, buy what they’re selling, and then goaway until you’re ready to buy some more. Don’t expect anything more.
Have you ever bought a car or an insurance policy based on the sales-men’s pitch and charisma and later sensed that he was only following thismantra: trust me, buy it, then please disappear? I have (only once, of course).You need to keep this in mind the next time you consider buying stocks froma media pitchman. Remember, these media darlings are not the independent,unbiased analysts they would like you to think they are.
Media Darlings—But Not Your Darlin’, Clementine 23

Still trust the media darlings?The truth sets you free. Use your own sound judgment to make your in-
vestment decisions, not some media star’s slick sales pitch veiled as an inde-pendent analyst’s tip. The latter leads you down a path paved with fool’s gold.
The National Enquirer tabloid showcases stars and their foibles. It’s amus-ing to browse its pages while in line to buy groceries (no one ever admits tobuying a copy but somehow it’s the most successful rag in America), but wedon’t really trust the validity of any of its stories. The stars continually claimthe information is crap and most of it probably is, but there are usuallyenough seeds of truth in the stories to dodge legal action.
People magazine, on the other hand, is slicker and we aren’t embarrassedto have it out on the coffee table when visitors drop by. We put more stock inits stories, yet the stars’ publicists control most of People’s photos and the in-formation that’s reported. If People wants future access to those stars, theydon’t rock the boat.
Both of these publications contain a degree of spin and hype and bothare hell-bent on selling us as many copies as possible. So which one is morereliable? (I prefer People, but neither one presents the truth, the whole truth,and nothing but the truth.) Caveat emptor. Buyer beware. You need to rockthe boat if you want the truth.
The point is: Wall Street analysts, like magazine publishers and politi-cians, are more than willing to feed you stories and misinformation so you’llbuy into their spin. The media’s 24-hours-a-day financial noise and dribbledrown out the big picture and most of the facts.
Are you still looking for a hero? Look in the mirror. That person’s realand you can count on that person to be concerned about your best interestsand welfare throughout your life.
If you grasp the basics about Wall Street and what really drives stocks upand down—supply and demand, tracking buyers versus sellers—then I havefull faith that you can outshine the media darlings. Let’s continue on thatpath.
TONIGHT’S NEWS IS HISTORY
The time of maximum pessimism is the best time to buy and thetime of maximum optimism is the best time to sell.
JOHN TEMPLETON, founder of the Templeton Group
24 D O N ’ T P L AY I N T H E S T R E E T
Okay, we’ve shot down the reliability of stock predictions from the mediadarlings who have inherent conflicts of interest (especially if their employersare prestigious investment banks that count on them to generate big bucks fortheir clients). Until they change and become more objective, don’t ever let themoff the hook for giving sell ratings at a measly 1 percent rate compared to theirrecommendations of buy or strong buy—even during a recession.
But should you trust unbiased financial news reported through legitimatenew outlets—for example, when your local news anchor reports that Com-pany A bought Company B, Company C won a lucrative contract, or CompanyD’s CEO was fired in the midst of a scandal. After all, this information is com-ing from a news anchor, not a salesman. Don’t make this rookie mistake. In-variably, the big institutional investors heard rumors of this news weeks beforeit actually played out. By the time you hear about it, the big players have al-ready made their moves. These news programs provide a “lagging indicator.”It’s like getting an invitation that arrives too late for us to attend the party.
Another dark secret about the news industry is that reporters are fed asteady stream of stories by public relations agents; often, they don’t researchtheir own stories. The news media is showered with press releases, briefings,and BS by public relations agents hired to make their clients rich and power-ful. A lazy reporter may change a few sentences provided to him by a WallStreet PR department and turn around and present it as hard-core, reliablenews. (The same is true of the “inside scoops” reported in entertainment news.)
Often “breaking news” about the release of a company’s financial reportis out of date. Companies report on their performance during the previousquarter so it’s intrinsically old news the moment it’s published. While, the re-port may influence some individual investors to buy or sell their stocks thenext day, the vast majority of the stock market looks ahead six months ormore, not back to past performance. For this reason, most of the time, you’dbe better off not looking backward either (unless the report exposes highlysuspect or criminal behavior; then bail out!).
While you can’t predict tomorrow’s market (who can?), you can surelykeep track of what’s happening right now—most importantly, if there aremore buyers or sellers for your stock. That’s all that ultimately matters. Morebuyers move a stock up, more sellers move it down. Pay attention to recenttrends when the stock is either moving up or down.
Remember this: Trends are your friends.In another scenario, an investor might hear news that’s seemingly unre-
lated to the market but he or she second-guesses what the market will do
Media Darlings—But Not Your Darlin’, Clementine 25

based on an inspired hunch. Consider the media hoopla that surrounded therelease of the movie Spider-Man. When Joe Investor sees this Spider-Man pro-motion, a light bulb goes off. “Hey, Marvel Comics owns the rights to Spider-Man so its stock must be a great buy right now! Ye-haw, what a great stock tobuy first thing tomorrow. The movie’s gonna make a bundle, so Marvel willtoo!”
The movie was a blockbuster, but unbeknownst to Joe Investor, Marvel waspaid in advance for the rights to make the movie. As a result, Marvel’s stockrose before shooting for the movie ever began. Then it started falling monthsbefore the movie was released.
Bad news for Joe Investor who assumed Marvel would reap rewards fromthe movie’s success. Again, consider news a lagging indicator when making in-vestment decisions because, odds are, it is old news.
This wisdom from WealthEffect.com applies here.
Don’t get caught up in the investment advice overload that is more likelyto leave you confused than brilliant. . . . One adage of the market is that“What’s obvious is obviously wrong.” A little knowledge will have you chas-ing the herd, riding the fears and greed of the moment rather than prof-iting from them. Like freshmen psychology students and white belts inkarate, a partially informed investor is a menace to himself and his lovedones.
To sum up, you really can’t rely on the media for investment tips. Thepundits are pushing stocks to benefit their investments banks and the legiti-mate news (given in 10-to-15 second sound bites) is too late to be of any useto an investor. It’s all part of the hype machine—either to get you to buy stocksor to lure you to tune in tomorrow for more “breaking news.”
You are far better off looking elsewhere for trustworthy indicators abouta stock you’re exploring or one you already own. Find out if there are morebuyers or sellers during the last few days, weeks, or months, and whetherthere’s a clear positive or negative trend during those periods.
26 D O N ’ T P L AY I N T H E S T R E E T
C h a p t e r
27
3
They could sell bubble gum to the lockjaw unit at Bellevue.
From the motion picture Boiler Room
No introduction to Wall Street and the worldof investing would be complete without exposing the outright illegal scamsand bottom-feeding perpetrators of fraud looking for easy prey.
Investing requires an element of risk. (Hey, crossing the street requires anelement of risk.) But too many of us are prone to gambling fever, thinking wecan make a quick fortune playing the stock market. If my neighbor Joe gotinto Yahoo! stock early and made a quick fortune, why can’t I? This is preciselythe emotion on which cunning scam artists are counting. They prey on ourdreams and fantasies that one day we can be fabulously rich from an invest-ment made on an insider’s tip.
Consider this: Some fraudulent operations gross over a million bucks amonth. The North American Securities Administration Association estimatesthat investors lose $10 billion a year—roughly $1 million an hour—to invest-ment fraud promoted over the telephone leading to financial devastation andshattered hopes.
WHAM, SCAM,NO THANK YOU, MA’AM
Let’s start with traditional scams. Despite the fact that online trading hasrecently empowered individual investors more over the past few years, the scamsfound online are more-or-less the same as those that operated before. Let’s notforget the insidious boiler room operations in which salespeople often sit to-gether in a single room and pose as members of a legitimate brokerage firm.Their sole purpose is make cold calls to deceive and defraud investors, using high-pressure sales tactics to induce sales of dubious stocks and other investments.
COLD CALL SCAMS
For your sake, always presume that a stock salesman making a cold call toyou is perpetrating a scam. He’ll call you up, promise you a deal that’s toogood to pass up, and assure you that this stock will provide amazing returnson your investment. Often, the stock that the salesman on the phone is sell-ing does perform well for a very short period because his operation or his co-conspirators are buying it to make sure it bumps up like a “one-day wonder.”Then unbeknownst to you, they sell it off, and the stock crashes and burns.
Of course, the scam artist feeds you whatever lies and misinformation arenecessary to get you to bite, then disappears once he has made his money,leaving you holding a very empty bag.
Here are some lines you might hear from a scam broker that should raisea red flag.
• “I’ve got a deal for you that’s too good to pass up.”• “I have a friend who works for this company and, boy, let me tell you,
they’re going to be the next Microsoft in their industry.”• “You’re using a telephone, right? Well, the product these guys are mak-
ing is going to be as necessary to life as the phone you and I are talkingon right now.”
• “You’d have to be brain dead not to say yes to a deal that’s this good.”• “I expect the stock to triple in value for you over the next couple years.”• “I’ve got an insider tip that this stock is going to go sky high.”• “Even Brad Pitt and Jennifer Aniston (or any other celebrity or couple
du jour) invested a substantial amount in this.”• “This deal’s so good, I’m going to put my kids through college with
what I personally make.” • “You have to act now. A deal this good won’t last until tomorrow.”
28 D O N ’ T P L AY I N T H E S T R E E T

They will try to entice you with every tactic available to sell you the stockthey’re hyping. They are even trained to become impatient and even irate ifyou question them too much or if you seem like you’re not making up yourmind quickly enough. They’re counting on you to become defensive (“Yes, Ido have the courage to invest my money”), apologetic (“I’m sorry, it’s soundspretty good, I didn’t mean to be rude”), and hesitant to question their hon-esty and integrity anymore. They get excited when they get this kind of feed-back from you. You’ve passed their slippery slope and become their sucker.Note that they have played on your emotions, not on your common sense.Checkmate.
By hyping a small company that either exists only on paper or is grosslymisrepresented, they create demand for the stock in the market. The value ofthe stock skyrockets and the scam artist then dumps his own stock at its peak.The individual investors are told to hold on to their stock while the dumpingcontinues and the value of the stock deflates until it’s practically nonexistent.Pardon my French, but merde!
In most cases, scams of this type use microcap companies to achieve theirends. The term microcap means that the company has very few public sharesavailable to be traded on the open stock market because the vast majority ofthe shares are held by company insiders (including our clever, despicablescam artists). The reason microcap companies are particularly well-suited ve-hicles for this scam is that they do not have to file annual reports or earningsstatements with the SEC because they are too small. They also provide op-portunities for insiders to profit when they dump their overvalued shares ontothe market.
I’m not implying that all investments in microcap companies are scams.Actually, many are legitimate businesses that are trying to get into the marketand deliver legitimate products and services. However, because of their vola-tile nature, buying into such companies can be riskier than normal becausethey’re easy for con artists to set up.
Often, boiler room operatives give the companies that they’re using asfronts for their schemes impressive sounding names and prominent businessaddresses in order to “legitimize” them. Be aware that the address on Wall Streetmay be nothing more than a mail drop for a potentially shady company. Also,telephone forwarding makes it very easy for the scam artists to hide their actuallocation. There have been cases where a single boiler room operation usedmultiple phone numbers, all coming into the same location to serve as the ref-erences you’d check (the company’s bank, other investors, etc.). In doing this,
Wham, Scam, No Thank You, Ma’am 29

scam artists can dupe skeptical investors into believing that the company actually exists and all the promises that the broker made are true. They mayeven go to the extent of incorporating taped background recordings to cre-ate the illusion of a hectic office. The moral of the story is that if it sounds toogood to be true, it’s too good to be true.
WEB SCAMS
So what about investing online? With the growing number of discountbrokers operating online, more individuals are putting money into the mar-ket. The reason you get a cheap rate from a discount broker is because you’re,in essence, doing it yourself. That is, you don’t get advice and other perks thata traditional broker would give you, and you’re buying and selling based onyour own research and judgment. That being said, you’re also not being pres-sured to buy a stock that a brokerage has an interest in selling, or so you’reled to believe. Again, the bottom line is buyer beware.
Scam artists are everywhere and, in some ways, may be even more prevalenton the Web than elsewhere. The inherent anonymity of the Web perpetuatesopportunities for scams, especially due to the relative low cost to distributemisinformation online. Whereas boiler room operations tend to require a lotof cash flow to set up and maintain, establishing a Web presence and promo-tion campaign is cheap and quick. The SEC’s Web site gives a great outline onInternet investment scams at <www.sec.gov/investor/pubs/cyberfraud.htm>.In this overview, the SEC describes three tactics that scam artists use to per-petrate online scams: online investment newsletters, bulletin boards, and un-solicited e-mails commonly known as spam.
The use of online investment newsletters is an easy way to dupe the un-suspecting public into buying bogus stock. There are literally hundreds ofsites that offer a “stock pick of the week” or other such recommendations.While some of these sites are legitimate, others only exist to be used as pro-motion for a stock on behalf of a scam artist.
If you look at a well-respected online journal such as theStreet.com, youcan see that it looks well established and that the information is timely and rel-evant to those interested in investing. Scam artists realize that a lot of peopleheed the recommendations given by a site like this based on the fact that it lookslegitimate. So you can bet that when they create their sites they will try to em-ulate the same look and feel of other respected sites, even down to the name.
30 D O N ’ T P L AY I N T H E S T R E E T

Without getting too technical, creating a Web site that looks like anotheris relatively easy. You can download images from the original site as easily assaving a file to your hard drive. With a little ingenuity, you could slightly mod-ify the files and pass them off as your own. In terms of content, there areplenty of sites that offer timely information on a variety of topics for a fee. Allyou have to do is embed them into your site. No one needs to know that thedata is being “fed” from another source.
A glowing report for a stock posted on a site created to look legitimatecould influence potentially thousands of would-be investors into buying it.Once there is enough demand, stock prices climb and those in on the scamdump their shares and run away with the profit, leaving individual investorswith nothing more than rapidly failing stock.
Here again, you can see conflicts of interest coming into play. Misleadingreports that make a company sound like the best thing since sliced bread arecreated either by the company itself or a paid promoter who has a personalinterest in seeing the stock succeed. Promoters are mandated by the SEC todisclose information (such as a report that they received payment in eitherfunds or shares, but many either bury the information deep into their site orfail to disclose it altogether).
BULLETIN BOARDS
The conflict of interest game is furthered through the use of bulletinboards on the Internet. Bulletin boards are places where people interact withone another by submitting and replying to posts that are visible in a publicforum. Many people who are in the market on their own use bulletin boardsto chat and commiserate with others like themselves so they can learn moreabout “the game.” Unfortunately, because anyone can submit an anonymouspost on a bulletin board, a stock insider could pose as a fellow investor andhype a stock. A post from such a source may look something like this:
Guys, SEXI is going through the roof! BUY NOW BUY NOW BUY NOW!!!!
So how do you know if someone recommending a stock on a bulletinboard is a paid promoter or insider? Unfortunately, the short answer is youdon’t. As the saying goes there is no such thing as free advice. Either you payfor the advice up front or you pay for it later when you lose your shirt. The
Wham, Scam, No Thank You, Ma’am 31

SEC’s site warns against investing in stocks solely based on information yougather on the Web from newsletters and bulletin board posts—especially ifthe company is small and thinly traded.
SPAM
Spam is unsolicited e-mail (not spiced ham) sent to you to solicit every-thing from pornography to stocks. Often spam e-mails involving investmentscams are made to look like they’re coming from a legitimate source. Becauseanyone can set up an e-mail account that is almost impossible to trace or evenhighjack a legitimate company’s server resources, the perpetrators of a spamcampaign can be difficult to track.
According to Jupiter Media Metrix, Internet users received about 570pieces of unsolicited commercial e-mail in 2001. Expect that number to tripleby 2006. (Unfortunately, if you ask to be removed from a mailing list, you’reconfirming for the spammer that the message has reached an active e-mail ac-count. You can likely expect even more unwanted messages when they sellyour e-mail address to other like-minded spammers.)
Investment spam sells the same “low risk, get in on the ground floor, getrich quick” message that most investment scams do. Through a spam e-mail,scam artists will try to get you to invest in very risky stocks using all the tacticspreviously mentioned: a slick Web presence, a nifty ad campaign, glowing re-ports from investment newsletters, and posts on investment-related bulletinboards. While most people are aware of the exaggerated claims in spam e-mails,others are investing millions of dollars in these scams because they appear legitimate.
TELLTALE SIGNS OF ONLINE INVESTMENT FRAUD
The U.S. Securities and Exchange Commission offers these guidelines foronline investing.
• Be wary of promises of quick profits, offers to share “inside” information,and pressure to invest before you have an opportunity to investigate.
32 D O N ’ T P L AY I N T H E S T R E E T
• Be careful of promoters who use aliases. Pseudonyms are common on-line and some salespeople try to hide their true identity. Look for otherpromotions from the same person.
• Words like guarantee, high return, limited offer, or as safe as a CD may bered flags. No financial investment is risk free and a high rate of returnis usually accompanied by greater risk.
• Watch out for offshore scams and investment opportunities in other coun-tries. If something goes wrong when you send your money abroad, it’smore difficult to locate your money and find out what happened.
• Check out the broker and the firm. Always verify whether any broker offering to buy or sell securities is properly licensed to do business in your state, province, or country. If the person claims to work with aU.S. brokerage firm, call NASD’s Public Disclosure Program hotline at800-289-9999 or visit the NASD’s Web site at <www.nasd.com> to checkout the background of both the individual broker and the firm. Be sure to confirm whether the firm actually exists and is current in its registration, and ask whether the broker or the firm has a history ofcomplaints.
• Remember, if it sounds too good to be true, it probably is!
“BOY, HE’S GOOD!”
You get a cold call. You want to hang up but the caller is friendly and as-sures you that he doesn’t want a cent from you. You chat a bit and the callersays he only wants to demonstrate his company’s research success to you bysharing its forecast of a particular stock that is going to experience a price in-crease. As he predicted, the following day the price of that stock goes up.
He calls a day or two later and again assures you that he’s not solicitingyou to invest. He just wants to inform you that his firm predicts that the priceof a different stock is hitting the skids. “Our forecasts will help you decidewhether you might want to invest with us some day,” he says.
As he predicted, the price of the second stock declines. “Boy, he’s good,”you think. You’re impressed. He correctly predicted that one stock would goup and one would go down.
When he calls the third time, you’re anxious to make up for the oppor-tunities you missed by not following his initial advice, and you want to investwith his firm. He seems hesitant, proclaiming he doesn’t want you to make a
Wham, Scam, No Thank You, Ma’am 33

hasty investment, but you insist on getting in on the action with his firm. Youare now a full-fledged and enthusiastic client.
Now let’s uncover his scam:Our cold caller begins by contacting 200 people (including you). He tells
100 people that his firm predicts that the price of a stock will go up; he tellsthe other 100 that it will go down. Obviously, his prediction will be 50 percentcorrect.
If the stock does go up, he makes a second call to the 100 people whowere given the correct prediction (he forgets about the 100 people who re-ceived the incorrect prediction). Of the 100 he calls back, he tells 50 of themthat his second stock pick will go down; he tells the other 50 that it will go up.
No matter what happens to the price of the second stock, he has 50 peo-ple who now have confidence in him because he’s “predicted” two stock fluc-tuations in a row. These 50 people are eager to invest.
Remember, he started with 200 calls and has reeled in 50 potential cus-tomers because they that believe in him after two correct predictions in avolatile market. Not bad (for him). Our friendly scammer is in a position tocollect huge commissions from the 50 unlucky people he has duped.
TIPS FOR AVOIDING STOCK SCAMS ON THE INTERNET
One of the most common Internet frauds involves the classic “pump anddump” scheme. Here’s how it works: A company’s Web site feature’s a glowingpress release about its financial health or some new product or innovation.Newsletters that purport to offer unbiased recommendations suddenly toutthe company as the latest hot stock. Messages in chat rooms and bulletinboard postings urge you to buy the stock quickly. You may even hear the com-pany mentioned by a radio or TV analyst.
Unwitting investors then purchase the stock in droves, creating high de-mand and pumping up the price. The con artsists behind the scheme thensell their shares at the peak and stop hyping the stock, the price plummets,and investors lose their money. Scam artists frequently use this ploy with small,thinly traded companies because it’s easier to manipulate a stock when there’slittle or no information available about the company. To steer clear of thesescams, always investigate before you invest.
34 D O N ’ T P L AY I N T H E S T R E E T

Consider the Source
When you see an offer on the Internet, assume it is a scam until you canprove through your own research that it is legitimate. Always remember thatthe people touting the stock may well be company insiders or paid promoterswho stand to profit handsomely if you trade.
Find Out Where the Stock Trades
Many of the smallest and most thinly traded stocks cannot meet the list-ing requirements of the Nasdaq stock market or a national exchange, such asthe New York Stock Exchange. Instead, they trade in the over-the-countermarket and are quoted on OTC systems, such as the OTC Bulletin Board orthe Pink Sheets. Stocks that trade in the OTC market are generally among themost risky and most susceptible to manipulation.
Independently Verify Claims
It’s easy for a company or its promoters to make grandiose claims aboutnew product developments, lucrative contracts, or the company’s financialhealth. Before you invest, make sure you’ve independently verified thoseclaims.
Research the Opportunity
Always ask for—and carefully read—the prospectus or current financialstatements. Check the SEC’s EDGAR database to see whether the investmentis registered. Some smaller companies don’t have to register their securitiesofferings with the SEC, so also check with your state’s securities regulator.
Watch Out for High-Pressure Pitches
Beware of promoters who pressure you to buy before you have a chanceto think about and fully investigate the so-called opportunity. Don’t fall for theline that you’ll lose out on a once-in-a-lifetime chance to make big money ifyou don’t act quickly.
Wham, Scam, No Thank You, Ma’am 35

Always Be Skeptical
Whenever someone you don’t know offers you a hot stock tip, ask your-self: Why me? Why is this stranger giving me this tip? How might he or shebenefit if I trade?
“Pump and dump” schemes are not necessarily organized by the companythat issued the underlying stock. Frequently, the company’s management iscompletely unaware of the reason that their previously stable stock is risingfrom the launching pad and into the stratosphere until they get a call from aninvestor trying to verify the inflated expectations publicized by the promoter.
While the majority of investment opportunities are not scams like theones I’ve covered here, Wall Street’s game is still stacked heavily against theindividual investors like you and me. Like in Vegas, betting against the houseisn’t the best way to go.
HIDDEN ALLIANCES: PARTING THE CURTAIN
Why do they bury Enron senior executives at least 20 feetunder ground? Deep down they are really good people.
From The Totally Unauthorized Enron Joke Book, by Tim Barry
The American economy is built on trust. Investing is an act of faith andfaith is earned by integrity. Eighty million Americans currently own stock.While a lot of us own stocks as part of 401(k) plans, pension plans, and mu-tual funds, many also ventured into the stock market within the past half-dozen years to buy individual stocks. While we should all be aware of risksinvolved, we also should have faith that the market is trustworthy enough toabide by the rules—to play fair.
In previous chapters, however, we have learned that a little trust can be adangerous thing. Trusting corporations to steer clear of fraud and scandaland trusting analysts and brokers for advice can have disastrous conse-quences. Conflicts of interest abound. But surely there must be some groupslooking out for the interests of individual investors. There are, but before weget to them let’s discuss one more problem.
We have developed a short-term culture in American business where ex-ecutives have become obsessed with the selling price of their stock. This ob-session gravitates to short-term earnings and short-term results, and our stock
36 D O N ’ T P L AY I N T H E S T R E E T

markets reflect that obsession. A drop in earnings of one or two pennies perquarter that varies from expectations can result in a 30 percent decline in theprice of a stock overnight.
Especially during the booms, executives are under increasing and enor-mous pressure from stockholders to not only hit a home run with every suc-ceeding quarterly report but to set a distance record each time that will dazzlethe public—namely, investors. The lure of heady profits during the late 1990sspawned abuses and excesses. A lot of money was made, but too often stan-dards were tossed aside. The promise of rapid profits allowed the seeds ofscandal to spring up.
During 2002, it seemed that every week brought a revelation of yet morefraud—problems that were long in the making but only recently brought tolight. Beyond the pervasive conflicts of interest we’ve explored among bro-kers, analysts, and investment banks, most scandals stemmed largely from ac-counting hocus-pocus to “manage the earnings.” These scandals are driven byunrealistic expectations and the pressure to pretend that the course of busi-ness is smooth and healthy when in reality it is not.
There are, however, two independent systems in place to protect investorsfrom financial fraud.
1. Auditors. Independent accounting firms provide accurate, audited state-ments of public companies. Their mission, as mandated by the Securi-ties and Exchange Commission in the 1930s, is to protect the publicinvestor from financial fraud.
2. The board of directors. This collective group of individuals is elected byshareholders of a corporation to provide oversight of the managementof the corporation. Its mission is to be accountable to shareholders forcorporate performance and the actions of the corporation.
Unfortunately, these two “independent” entities have their own conflictsof interest as they straddle the line between corporations and the trustingpublic. Each also has hidden alliances with corporations that present obviousconflicts of interest.
In the past, independent auditor firms were increasingly conflicted be-cause the often served simultaneously as consulting firms to the corporationsthey were auditing (raising troubling questions about the footnotes listed inearnings reports, such as executives’ stock options which were not included asexpenses). The conflicts on boards of directors arose because these boards
Wham, Scam, No Thank You, Ma’am 37

were too often filled with old pals and cronies who rubber-stamped anythingpresented to them by management.
LAW AND ORDER
Lawmakers were well aware of these conflicts of interest but had neitherthe will nor the incentive during boom times to stop them—especially whilethe Internal Revenue Service was raking in its share of profits to fill the gov-ernment’s coffers. Why fix what ain’t broke?
Push came to shove in 2002 when Congress recognized that the investingpublic had had enough. Early in the year, bills were introduced during theheight of the Enron scandal to mainly strengthen other controls already beingput in place by agencies like the SEC and mandate harsher penalties for cor-porate fraud and crime (increasing the prison time for errant CEOs from fiveyears to ten). What kicked legislation into high gear was an investigation ofWorldCom that found almost $3.8 billion in disguised expenses—the largestcase of accounting fraud ever. The restatement was particularly galling be-cause the misrepresentations were not only huge but relatively simple to detect.They should have been caught. After this disclosure, 17,000 WorldCom em-ployees were laid off.
Congress then passed the most sweeping corporate reform bill in 70years—the Sarbanes-Oxley Act of 2002. President Bush signed it into law at aceremony in New York City on July 30, 2002.
Instead of beating a dead horse here (and rehashing dozens of scandalsinvolving outrageous accounting tricks that we’ve all heard about ad nauseumover the last year or so), I will explore these conflicts of interest as they wereaddressed within the context of this bill now made into law. This reform actclearly pointed out what was broken and badly needed to be fixed, namely thecozy and unethical relationships that corporations enjoyed with their auditingfirms and boards of directors.
There is an overlap in the responsibilities of the boards and the auditors,so while the text here seems weighted towards the boards of directors, muchof it applies to auditors as well. For example, a board of directors’ audit com-mittee is now the direct liaison with the auditors to improve their interaction.
38 D O N ’ T P L AY I N T H E S T R E E T
BOARD GAMES
Recognizing negligence or failure of boards of directors to act independ-ently to protect the interests of stockholders, the Sarbanes-Oxley Act of 2002provides the following key provisions for boards of directors:
• Personal loans to officers and directors are banned• The responsibilities and composition of a board’s audit committee is
regulated• Whistleblowers are protected and given access to audit committees
Remember that personal loans to executives always had to be approved byboards, and some of these loans still reached outrageous amounts, for exam-ple, the $174 million in personal loans to the powerful Rigas family grantedby Adelphia (a company which this family treated as their very own piggy bank).Fortunately, this new law bans such personal loans.
A board’s compensation committee also approves salaries and bonus pack-ages for top management. If you’ve been outraged by the compensation pro-vided to CEOs while their company goes into bankruptcy, now you know whoapproved it. In one shocking example, Gary Winnick, founder and chairmanof Global Crossing, cashed in $735 million of stock over a four-year periodwhile receiving $10 million in salary and bonuses, consulting fees, and aircraftownership interest. After his company filed for Chapter 11 bankruptcy (andonce he finished cashing in), he pledged to give $25 million to help employ-ees who lost money in the company’s 401(k) retirement plan, proclaiming,“You can’t take the money with you. The only legacy I’m going to leave thisplanet with is my name.” I wonder how well that name resonates with ex–Global Crossing employees, retirees, and investors who suffered bankruptciesafter the company collapsed.
President Bush stated at the bill signing:
Responsible leaders do not collect huge bonus packages when the valueof their company dramatically declines. Responsible leaders do not takehome tens of millions of dollars in compensation as their companies pre-pare to file for bankruptcy, devastating the holdings of their investors. . . .The pay package sends a clear signal whether a business leader is com-mitted to teamwork or personal enrichment . . . whether his principal
Wham, Scam, No Thank You, Ma’am 39

goal is the creation of wealth for shareholders, or the accumulation ofwealth for himself.
As Bush noted, the SEC (not the current bill) requires the annual disclo-sure of a CEO’s compensation, but that information is often buried in ponder-ous, confusing proxy statements seldom seen by shareholders. He challengedevery CEO in America to describe prominently and in plain English the detailsof his or her compensation package in the company’s annual report.
Bush continued by urging board members to “check the quality of theircompany’s financial statements; to ask tough questions about accounting meth-ods; to demand that audit firms are not beholden to the CEO; and to make surethe compensation for senior executives squares with reality and common sense.”
Beyond the provisions of this bill, the SEC and Nasdaq have also proposedguidelines to improve corporate conduct and transparency, including require-ments that independent directors compose a majority of a company’s board;that all members of audit, nominating, and compensation committees be in-dependent; and that all stock option plans be approved by the shareholders.
Note also that the new law promises protection for whistleblowers whocan now report directly to the board’s audit committee to assist investigationsinstead of having to report to management which may be a party to the prob-lem being reported. Some critics complain that the bill is not specific enoughregarding the protection of whistleblowers. They feel that whistleblowers arestill too vulnerable when they come forward. No doubt there will be somecases in the near future that test this promised protection for those comingforward with potentially damaging information.
Other critics of the new law point out that Enron’s board of directors wasindependent (only 2 of its 17 members were insiders—Kenneth Lay and Jef-frey Skilling) and had extensive expertise as CEOs, lawyers, academics, andformer regulators. Looking deeper, however, Enron’s directors had conflictsof interest because each was receiving about $300,000 annually and many hadfinancial ties to Enron. By contrast, board directors of most companies arepaid no more than $50,000 per year.
Beyond independence and expertise, a good board requires commitmentand a willingness to dig beneath the CEO’s presentations at board meetingsso they become opportunities for the board to take a hard look at the com-pany’s actual status rather than pep rallies. The board’s job is to monitor theorganization, not to just nod approval. But frankly, I’m not sure how you reg-ulate commitment.
40 D O N ’ T P L AY I N T H E S T R E E T

THE BOARD’S AUDIT COMMITTEE
The audit committee arguably oversees one of the board’s three most im-portant spheres of responsibility, the others being the committees overseeingcompensation and board nominations. Under the new law, the board’s auditcommittee must be directly responsible for the appointment, compensation,and oversight of the work of any registered public accounting firm employedby the company, and each registered public accounting firm must report directly to the board’s audit committee. The intention of this provision is tobreak up the often-cozy relationship between auditors and corporate man-agers by putting the audit committee squarely in between the two.
The law also states that each member of the audit committee must be amember of the board of directors, must be independent, and must not acceptany additional consulting, advisory, or other fees from the company. The auditcommittee is also responsible for preapproving all nonaudit services providedby a firm’s auditors. Which brings us to our next group.
THE AUDITORS
Theoretically, independent auditors should represent and protect the pub-lic’s interest. Their job should be to dig deeper than the financial reports pro-vided by the company and to find out what’s really going on. However, youcould make the point that, by virtue of the fact that the auditors are paid bythe company, no audit is totally independent or unbiased. (Remember ArthurAndersen?)
Arthur Levitt, an SEC chairman during the 1990s, put it into perspectivein an interview on PBS.
It’s one thing for a company to pay their auditor. But that auditor has itsreputation at stake in every audit that it does. The payment for the auditis an anticipated fee in the same way that paying a lawyer for his legalcharges, in the same way that any service is paid for. It’s when the auditorgoes beyond, that and it is paid vast sums of money for consulting that Ibelieve the audit becomes [conflicted and] compromised.
Beside putting the board’s audit committee in place as a buffer betweena company’s management and its auditors, the new bill’s authors (Senator
Wham, Scam, No Thank You, Ma’am 41

Paul Sarbanes, D-Maryland, and Representative Michael Oxley, R-Ohio) rec-ognized that auditors were increasingly offering and handsomely profitingfrom nonauditing services provided to the companies they were auditing. Thispractice raises the issue of conflicts of interest because an auditor would beless inclined to question creative accounting if he or she would lose businessin other areas as a result of rocking the boat.
As mentioned previously, the board’s audit committee must preapprovenonaudit services provided by auditors. The new law further identifies severalservices that auditors will no longer be allowed to provide for the clients theyare auditing:
• Bookkeeping appraisal and actuarial services• Financial information systems (IT) design and services • Appraisal or valuation services, fairness opinions, or contribution-in-
kind reports • Internal audit outsourcing services • Management functions or human resources • Broker or dealer, investment adviser, or investment banking services • Legal services• Expert services, other than tax work, unrelated to auditing
All of these services that are now prohibited presented clear conflicts ofinterest for auditors in the past. In 2001, for example, PriceWaterhouseCoop-ers received $80 million in advisory fees from Raytheon—an amount 20 timesmore than what it received for auditing.
The board’s audit committee, of course, has the discretion to prohibit anyother service not explicitly listed in the act. You might have noticed in the listabove that tax services are excluded from the group of prohibited services.That’s noteworthy because tax services probably represent the largest sourceof nonaudit revenue for accounting firms. However, to be on the safe side,some companies are already choosing to farm out their audit and tax work todifferent firms to avoid any conflicts.
CEO REWARDS AND STOCK OPTIONS
In the 1990s, enormous financial rewards were reaped by powerful exec-utives, making them increasingly disconnected from the rest of their compa-
42 D O N ’ T P L AY I N T H E S T R E E T

nies’ employees and small investors. According to a front-page article in theNew York Times in June 2002, the pay for CEOs rose 866 percent over the past15 years to an average of more than $10 million, while pay for other employ-ees rose only 63 percent during the same period.
Over the last decade, options to purchase company shares were given totop managers as bonuses or rewards and as a way to align these executives’own financial interests with those of the shareholders. Naturally, this share op-tion is only valuable as long as the price of the common shares is rising. If aCEO had stock options for a quarter million shares, you can understand whymanagement had such an overriding interest in causing the share price to riseby hook or by crook (pun intended).
Massive stock option grants played a major role in the breakdown of ac-counting practices as executives sought to use whatever means necessary, in-cluding those detrimental to the long-term position of their companies, tomeet earnings and keep stock prices inflated. Stock option grants to execu-tives were at historical highs in the late 1990s. Risky capital allocations and ac-counting trickery were at historical highs in the late 1990s as well. I contendthat this is no coincidence.
OTHER KEY PROVISIONS OF THE SARBANES-OXLEY ACT OF 2002
The Sarbanes-Oxley Act of 2002 also doubled the maximum prison termof those convicted of financial fraud from five to ten years, as was proposedwhen the bill was in its early draft stages. As the president noted, “Defraudinginvestors is a serious offense, and the punishment must be as serious as thecrime.”
The same day he signed the bill, Bush also announced the creation of anew corporate fraud task force, headed by the deputy attorney general, whichthe president claimed “will target major accounting fraud and other criminalactivity in corporate finance.” He went on to say, “The task force will functionas a financial crimes SWAT team overseeing the investigation of corporateabusers and bringing them to account.”
According to the new law, CEOs and CFOs are now on the hot seat andare liable if they certify a report knowing that it does not comport with the re-quirements of the law. The punishment for fraud? Up to $1 million in fines,
Wham, Scam, No Thank You, Ma’am 43

and up to ten years in prison, or both. Willful certifications of fraud can resultin a fine of up to $5 million, imprisonment up to 20 years, or both.
The new law also accelerates the reporting of transactions (buying andselling their company’s shares) by officers, directors, and 10-percent owners(shareholders) to two business days after the transaction.
In the president’s speech, he took special aim at high levels of manage-ment who violate public trust.
Corporate officers who benefit from false accounting statements shouldforfeit all money gained by their fraud. An executive whose compensationis tied to his company’s performance makes more money when his com-pany does well—that’s fine, and that’s fair when the accounting is above-board. Yet when a company uses deceptive accounting to hide reality,executives should lose all their compensation gained by deceit.
THE SECURITIES AND EXCHANGE COMMISSION
Before this bill was signed into law, the SEC, considered the enforcementagency for overseeing corporate compliance and ferreting out fraud, was un-derstaffed and underfunded. The budget has been increased from $567 mil-lion to $776 million but has not been disbursed yet. The L.A. Times quotesBrian Gross, SEC spokesman: “It’s really the worst of all worlds. The publicthinks the agency has all the resources it needs. The reality is that not only dowe not have that, but we’re at last year’s resource levels.”
Like years past, the new law continues to put a heavy burden on the SECto audit statements of public companies. About 130 accountants are respon-sible for examining tens of thousands of filings by more than 17,000 compa-nies each year. With its current staff, the SEC cannot examine all corporateannual reports once every three years as the new federal law now requires.(These figures are taken from a report by the Senate Committee on Govern-mental Affairs, October 2002.)
For its enforcement division, operating in the SEC’s headquarters inWashington, D.C., as well as regional offices, the SEC employs 75 accountants.According to Lynn Turner, the SEC’s former chief accountant, it is not un-common for the enforcement division to have 200 to 250 cases open at a time.
44 D O N ’ T P L AY I N T H E S T R E E T

Major accounting firms assign three or four accountants full time to one fraudcase, but the SEC’s resources allow for only one accountant per three cases.
The bill also created the Public Company Accounting Oversight Board,comprised of five members under the auspices of the SEC whose responsibil-ities include investigating and sanctioning accountants. In October 2002, witha typical bureaucratic misstep, SEC chairman Harvey Pitt championed Wil-liam Webster (former CIA and FBI head) to head this board. Pitt failed to in-form the commission that Webster, was also a director at NextWave Telecom,a company in bankruptcy protection, as well as a member of the board of U.S.Technologies, whose stock closed at 1 cent per share as recently as October25, 2002. Webster’s 83,333 shares in U.S. Technologies, according to SEC fil-ings, are worth $833.33 as of this writing.
Webster is now out and Harvey Pitt resigned on the nation’s election dayin November 2002, presumably not to influence voters who proceeded to de-liver both houses of Congress to his then-boss President Bush.
THE VERDICT
As you might surmise, the Sarbanes-Oxley Act of 2002 was one major billthat was enacted to correct multiple sins of omission and neglect in one fellswoop. But does it lack teeth? Well, the agency in charge of enforcing the newlaw, the SEC, is still underfunded and understaffed.
Stay tuned to future events to see if a balance will eventually be met be-tween these important new rules and the resources to enforce them. Or willCongress revert to relaxing regulations by loosening the reins allowing busi-nesses to regulate themselves once again because they’ve “earned it.” That isthe typical end of the scandal cycle we explored in the first chapter . . . untila new cycle begins.
CONGRATULATIONS!
You have just emerged from Wall Street’s Land of Oz. If you have passedthrough this field of land mines placed by Wall Street’s major players (withconflicts of interest out the wazoo) and you aren’t scared off yet—it’s proba-bly best if you are a little scared—then you are not only ready but you have anincentive to move on to the next step.
Wham, Scam, No Thank You, Ma’am 45

You get a lot of conflicting information from Wall Street. They want youto be confused so you’re dependent on them to make decisions for you. Youcan drive a car without knowing what makes it run, but if it breaks downyou’re dependent on the repair shop to fix it. The same is true in the stockmarket. If you invest without understanding the basics, you may at some pointhave to rely on the expertise of the Wall Street players you’ve come to mis-trust. And like at a repair shop, the less you know, the more vulnerable youare to those who want to take advantage of you.
But don’t worry. All the basics you need to know are covered in the nextfour chapters. Take time to read and understand them. You won’t be sorry.
Even you seasoned investors may find a nugget of helpful information inthe next few chapters. Consider it a refresher course, if you will. (Don’t benervous. I won’t tell anybody you read it.)
The last four chapters of this book lay out the criteria to help you identifygreat investment candidates. You will also be introduced to all the easy-to-comprehend tools you need to enable you to be a totally independent in-vestor. You can boost your personal trading confidence dramatically with a little education and the proper tools at your disposal.
You have the power to successfully guide your own financial destiny. Youcan do this! I wouldn’t have bothered to write this book unless I believed that.
46 D O N ’ T P L AY I N T H E S T R E E T
C h a p t e r
47
4
In most cases, knowing something is better thanknowing nothing. In the stock market, however, a little knowledge gained atthe water cooler can get investors into big trouble if they’ll fall prey to theirown primal emotions of greed and fear instead of relying on sound judgment.
Basic finance is not a required course in high schools or colleges (thoughit should be). Somehow, it is assumed that we will pick the subject up naturally.
It is crucial for individual investors to learn the basics of the stock marketso they’ll have a clear understanding of what happens to their investments.Education is key. Only then can they confidently take charge of their finances.
If your goal is to be in charge, you need to have a sound understandingof the fundamentals of the stock market. With this knowledge and a few toolsthat are easily accessible to you, you can succeed in the market on your own.
So what are we waiting for? Let’s get crackin’ by starting at the beginning.
WHAT ARE STOCKS?
A stock is a share in the ownership of a company. This means, if there area 1,000 shares in a company, owning one share means you own 1/1,000 of the
KNOWLEDGE IS POWER

company. The more stocks you own, the greater the stake you have in theownership of the company.
Why does a company offer shares in their business to complete strangers?It is a way for the company to raise capital. If the company borrows moneyfrom a financial institution, they have to pay back not only the loan amountbut interest as well. Selling shares in the ownership of the company ratherthan borrowing allows the company to raise money without having to pay in-terest on it.
Here’s an example.
Your uncle and aunt own a hardware store. Things are going so well thatthey need a larger store but it’s too expensive for their means. To raisemoney for the move as well as for additional inventory, they decide to sellstock—partial ownership—in their company. You decide to invest in yourrelatives’ business, not because you’re fond of your aunt and uncle but be-cause you think it would be a good investment because they’ve been suc-cessful so far. In exchange for your cash, you now own a percentage oftheir business’s assets. You didn’t loan them money (making family gath-erings awkward); you bought a portion of their business.
To put it simply, this means if a company in which you own stocks grows,the value of the company grows as well. This benefits you as an investor be-cause the value of your stocks increases correspondingly.
If you buy into a company whose stock is valued at $20 per share and it in-creases in value, your investment can be sold on the market at a higher price.Of course, you must remember that there is no guarantee that the companyin which you buy stock will do well and provide a decent return on your in-vestment. If the company falters or goes bankrupt, your investment becomesless valuable or is lost altogether. That being said, if you buy stock in a com-pany that thrives, you have a chance to get more return on your investmentthan you would with other investments such as bonds.
What’s the difference between a stock and a bond? There is an inherentsimilarity between the two. With both, you secure a stake in the company inwhich you’re investing. That is why stocks and bonds are both referred to assecurities. However, the similarities end there.
The biggest difference between stocks and bonds is that with stocks youget an ownership stake in a company. You don’t own anything when you buya bond. Rather, a bond is the equivalent of a loan you give to a company.
48 D O N ’ T P L AY I N T H E S T R E E T

When you buy a bond, in essence, you get a promissory note from the com-pany to which you’re lending money stating the interest rate they promise topay you on a set date when the company settles its debt to you. You don’t getan ownership stake in the company because you merely loaned money to it,instead of investing money in the company.
By its nature, a bond is less risky than an investment like a stock, but, inturn, it doesn’t have the potential increase in value with the success of thecompany like stocks. Instead, you receive a set, agreed-upon amount of moneywhen the bond is repaid.
While this book is geared primarily toward trading stocks for personalprofit, buying bonds is a safer investment if you have a low level of risk toler-ance. However, safe investments like bonds forego the potential for thegreater benefits stockholders can reap if the company they’ve invested in be-comes more valuable.
This is an important concept to understand. An individual stock doesn’tnecessarily reflect the market. A good stock may go up even when the marketis going down, while a rotten stock can lose value even when the market isbooming. The daily trend of the market may have little to do with how yourparticular stock did that same day.
WHAT OWNING STOCKS REALLY MEANS
When you buy stocks, you own a percentage of the company whose stockyou’ve bought. But what exactly does that mean? Does it mean that if you ownstock in Ford, you can walk over to your local Ford dealer and demand a newcar for yourself? Of course not. If you own stock in Apple Computers, do youhave the right to call up Steve Jobs to tell him you don’t like the way he’s run-ning the company? Well, you could try, I guess.
The shares you own in a company give you equity (i.e., part ownership).That means that while you technically own a percentage of all the company’sassets and are technically the management team’s boss, in practice, you reallydon’t get a say in the way the company conducts its business. Well, not unlessyou’re fabulously rich and own a large percentage of shares. What your equitydoes get you (proportional to your number of shares) is a small say in whoruns the company by being able to vote on who sits on the board of directors.These selections are important because the board of directors of a companyis responsible for making the most money possible for the stockholders.
Knowledge Is Power 49
If you don’t like the way your company is being run, you can, theoretically,vote people off the board or elect new members who can change the way thingsare done. As I said before, though, the average investor doesn’t own enoughshares in a company to make a dramatic impact come voting time. The largestblocks of share ownership, and those that come with a far greater say in thecompany’s operation are usually held by the top management of the companythrough stock options and by other very rich investors.
More important than voting rights, however, is the right to a portion ofthe company’s earnings. This is where a stock’s value comes into play. Thereare two ways in which you actually realize these profits.
The first way is by selling your shares after they have increased in value.When you own stock in a company that performs well in the stock market, theactual value of the company increases; your stock increases in value accord-ingly. If you bought into a company when its stock was trading at a $1.00 andit’s value has grown to $1.50, you’re effectively richer by 50 cents per share.This increase is only on paper though until you cash in your shares.
The second way in which stocks benefit you financially is through divi-dends. Dividends are paid out on an annual basis to the stockholders in orderto allow them to share in the company’s net income. The board of directorsof a company will announce profits from which they’ll pay out dividends. Thestockholders’ portion of this money is based on the number of shares theyown, as well as the price at which they bought the stock. While dividends areusually paid out in cash, they can also take the form of more stock or even prop-erty. Most large, established companies offer dividends. The major exceptionto this is a high-growth company, which typically does not pay dividends. Tocontinue its growth, the company reinvests its profits in itself to cover the costsof its growth.
Another important point about stock ownership is that while you have astake in the assets of the company, you are shielded from its liability. Thatmeans that if a company goes under, you are not personally responsible forpaying back the company’s debt. This is different from a business partnershipagreement, for example, where each one of the partners is liable if the part-nership firm declares bankruptcy. By investing in a stock, the most you canlose is the amount of your investment.
One drawback: If a company in which you own stocks goes under or liquidates, your claim to its assets comes after most others’ claims have beentaken care of. You go to the back of the line and hope for the best becausecreditors, including banks and bond holders, get their money first. Stock-
50 D O N ’ T P L AY I N T H E S T R E E T

holders get a portion of whatever assets are left after all the debts have beenpaid back.
TYPES OF STOCKS
Go for a business that any idiot can run—because sooner orlater, any idiot probably is going to run it.
PETER LYNCH
While you now have a basic understanding of what a stock is and the risksinvolved, let’s look at the differences not only between kinds of stocks but alsotheir sizes.
Common versus Preferred
There is a big difference between common stock and preferred stock—not only in definition but in terms of how they’re handled. What we’ve talkedabout up until now mostly applies to common stock.
• Common stock. There are no restrictions on who can buy a common stock.It is so-named because it is traded on the open market for all to buy orsell. Owning a share means owning part of the company’s assets andgetting a shareholder vote for each share you own. Dividends are notguaranteed, but may be paid out if the board of directors decides it’sthe right thing to do. However, while common stocks represent the high-est potential for rewards in the market, they also are the most fraughtwith risk. If a company goes bankrupt and liquidates, common stock-holders are paid last if there is any cash left over after paying back debts.
• Preferred stock. There may be a restriction on who can buy preferredstock. Unlike common stock, preferred stock usually doesn’t come withvoting rights, yet your investment is usually guaranteed by a fixed divi-dend for the duration of time that you own the stock. Whereas dividendpayments are not guaranteed with common stock, they are with pre-ferred stock. In addition, you’re more likely to get a higher dividendthan that of a common stock. Another more attractive feature of pre-ferred stock is that you are given a higher priority than holders of com-
Knowledge Is Power 51

mon stock in the event that the company liquidates. You are guaranteedto be paid with any leftover assets before the common stockholders are.Also, due to its nature, preferred stock tends to not react as much to thegrowth of the company because it is sold with a fixed dividend payout.
Differences in Stocks Based on Company Size
There are also differences in stocks based on the size of the company.This is where the term cap comes into play. Cap refers to market capitalization.In essence, it’s the total value of the company calculated by multiplying thenumber of shares a company has by the cost per share. For example, the capof a company that has 1.5 million shares of stock at $5 a share is $7.5 million.This would make it a nano cap company (see the list below).
In the past, companies with larger caps were more stable and offered thehighest level of payouts. However, with this stability came the tradeoff of notbeing able to rely on a rapid growth in value. Those traditional ideas of sta-bility have lost their value when companies like AT&T and Enron showed usthat even the “big boys” can fall.
While the delineations of cap sizes are not set in stone, the following listoutlines the current standard for cap sizes:
• Mega cap: Over $100 billion• Large (big) cap: $10 to $100 billion• Mid cap: $2 to $10 billion• Small cap: $300 million to $2 billion• Micro cap: $50 to $300 million• Nano cap: under $50 million
The large caps are the ones Wall Street tends to pay the most attention tobecause they are the ones over which the biggest investment banking deals aremade. In general, the Dow index represents only large cap and mega capcompanies. “Blue chip” stocks refer to the biggest cap stocks. Wall Street fol-lows these companies because they have enormous market influence and stay-ing power.
Here are the five most commonly used categories of stocks:
1. Blue chip stocks. These are stocks of a high-quality, financially soundcompany. While they offer no guarantee of investor safety, blue chip
52 D O N ’ T P L AY I N T H E S T R E E T

companies tend to have long and relatively consistent histories of goodearnings performance and dividend payments—in recessions as well asin booms.
2. Growth stocks. These are stocks of firms that usually pay relatively lowcurrent dividends because earnings are reinvested back into the growthof the companies. They are considered attractive because of their long-term prospects. Growth companies typically suffer fewer setbacks andrecover more quickly from a recession than average companies.
3. Income stocks. These stocks pay higher dividends in relation to theirmarket price. These companies must have steady and reliable sourcesof revenue in order to pay such dividends. Utilities are good examplesof income stocks.
4. Cyclical stocks. These stocks can generate high earnings when the com-pany is good or is improving, but suffer most during a downturn. Theirstock prices therefore tend to be volatile. Automobile, steel, cement,and construction equipment companies are examples of cyclical stocks.
5. Defensive stocks. These stocks tend to generate higher-than-average earn-ings and dividends during a downturn. At such a time, investors oftenexhibit a heightened interest in such recession-resistant and highly sta-ble stocks. Stocks of many utilities can be regarded as defensive be-cause their growth rates tend to hold up in a recession.
Now that I’ve given you a quick tour of the various kinds of stocks outthere, let’s look at the different markets where these stocks are traded.
TO MARKET, TO MARKET—HOW STOCKS TRADE
Wall Street is the only place that people ride to in a Rolls Royceto get advice from those who take the subway.
WARREN BUFFETT, chairman, Berkshire Hathaway
There are two major securities exchanges in the United States, each work-ing in different ways and representing different companies. I’d like to takeyou on a tour of each so you understand what actually happens when you buyor sell a stock (or bond) in one of these markets.
Securities markets deal primarily with stocks and bonds. The primary pur-pose of a securities market is for businesses to acquire capital from investors.
Knowledge Is Power 53

In other words, it’s a marketplace—like at a mall—where buyers and sellers“meet” to carry out transactions.
One exchange is a physical location with a trading floor; the other is a vir-tual one (not a physical place), composed of a network of computers wheretrades are made electronically.
The New York Stock Exchange (NYSE)
The NYSE is what most people think of when they conjure up images ofthe stock market. All of those vivid scenes from TV and the movies where yousee a gaggle of people yelling at each other and gesticulating wildly take placeon the floor at the NYSE (or a soundstage that replicates it).
The NYSE was established over 200 years ago and is still located on WallStreet in New York City. The exchange itself does not buy, sell, own, or set theprices of the stocks traded on the floor. Using the mall analogy again, the mar-ketplace is not itself in the retail business but instead provides and maintainsthe trading floor where business takes place. Like the mall management thatserves as the “landlord” to the stores on its premises, the NYSE sets stringentguidelines regarding what companies are accepted (get “listed”) and howthese companies conduct business on their premises.
The NYSE is what is known as a listed market. That is, specialists overseethe trades on the NYSE listings between buyers and sellers for each and everystock.
The prices for the stocks are determined in an auction format, meaningthat there are no set prices. It is often assumed that the closing price for theprevious day is the starting price for a stock on the next day, but dependingon the demand for the stock, this value constantly changes during the courseof a trading day. The value of the stocks on the NYSE rises and falls depend-ing on the amount of demand there is for each stock. When the demand ishigh, buyers bid higher prices in order to make sellers want to sell. Conversely,when demand is low, sellers have to lower their prices to find buyers.
The NYSE has stringent guidelines to determine which companies getlisted. Only the largest and most financially sound corporations qualify for list-ing on the NYSE. Many of these companies are blue chip stock companies, butnot all are. You even might be surprised to learn that some foreign companiesare listed on the NYSE.
It is said that 80 percent of all the money traded in stocks in the UnitedStates is traded on the NYSE.
54 D O N ’ T P L AY I N T H E S T R E E T

To give you a better understanding of how the NYSE works, let’s go backto the role played by the specialist. Trades of any given stock go through a spe-cialist in that stock (each listed stock is assigned to a single post where the spe-cialist manages the auction process for that stock). Because all trading of aparticular stock physically happens around the specialist, they have becomeknown as “trading posts.” Buyers and sellers are represented by floor traderswho flock around the specialist and vie to place their bids. A trade happenswhen buyer and seller bids match up.
The specialist is also responsible for keeping track of the prices of thestock, and making sure that buyers and sellers are available. An equilibriumprice is reached during this balancing act. An equilibrium price means thatthe supply and demand for the stock is very close—a few pennies’ differencebetween the bid (or buy) and the ask (or sell) price. The difference betweenthe bid and ask price is called a spread.
If you want to buy or sell a stock that is traded on the NYSE, you contacta broker who, in turn, contacts a floor trader with your request. If your buybid matches up with a sell bid, the trade is made and each side reports backto his or her office with the details. Your broker then contacts you with a con-firmation once he or she hears from the floor trader.
The Over-the-Counter Markets (OTC) / Nasdaq
Most companies issuing stocks in the United States are small and aretraded “over the counter” through an electronic marketplace. Unlike theNYSE, the OTC is not a physical place. It is comprised of 11,500 computer ter-minals that make up the National Association of Securities Dealers AutomatedQuotation (Nasdaq) system. Until recently, the American Stock Exchange(AMEX) was a physical floor-based market (and the second largest in theUnited States), but it was bought by the Nasdaq’s parent organization, the Na-tional Association of Securities Dealers (NASD), and is now part of Nasdaq.
There are three main markets that comprise the OTC: the Nasdaq stockmarket, the OTC Bulletin Board, and the Nasdaq SmallCAP. Of these three,the Nasdaq stock market is the most popular and widely reported.
Again, the OTC—including Nasdaq—is a virtual market comprised ofthousands of computers on a network. Brokers use these terminals to get infor-mation about prices and then buy and sell securities by telephone with otherbrokers. Generally, the OTC securities are much smaller and have a lower trad-ing volume than stocks listed on the NYSE. OTC is where small-cap stocks with
Knowledge Is Power 55

greater growth potential can be found. That doesn’t mean that all the stockson OTC are those of small or unknown companies. Well-known companiessuch as Intel, Dell, and CISCO are some of the giant corporations that arecontent with being traded on the OTC.
Given that the Nasdaq is a giant computer network, how does tradingwork? OTC stocks are usually traded through a brokerage firm, which acts asa market maker. A market maker generally keeps a hoard of shares in a com-pany on its own, and tends not to match up buyers and sellers with each otherdirectly but conducts business as a middleman. In order for the system towork, the market makers continuously set bid and ask prices and, with thestocks they hold on their own, ensure that there is always a buyer and sellerfor each stock.
That being said, I’m not particularly fond of market makers (sometimesreferred to as “Ax”). They have been known to play games with your stocksand hard-earned money.
One thing that a market maker can do to make more money for itself isto make profits on the spread—the difference between the bid and ask prices.Here’s how it transpires: Once the market maker has entered a price, it is ob-ligated to either buy or sell at least 100 securities at that advertised price.Once the market maker has either bought or sold these shares, it may then“leave the market” and enter a new bid or ask price to make a profit (“makethe spread”) on its previous trade.
While the market maker’s profit might not seem great for each individualtrade, in the course of a day, the $10 or $20 it’s making per trade add up. Notonly that, its making commissions on the trades from its own clients on top ofits profit. Because of this, market makers are obligated by law to disclose two-sided quotes; that is, to show both their bid and ask prices.
ANATOMY OF A TRADE: THE PLAY-BY-PLAY
The chart in figure 4.1 gives a detailed explanation of how a stock is traded.It illustrates how one transaction looks from three different perspectives—those of the buyer, the seller, and the stock market professionals who executethe trade.
56 D O N ’ T P L AY I N T H E S T R E E T

Knowledge Is Power 57
FIGURE 4.1 How a Stock Is Bought and Sold on the NYSE
1. Roger Smith of Des Moines, Iowa, decides to invest in the stock market.
1a. Diane Whitford of Hartford, Connecticut, decides to sell 100 shares of NIKE, Inc. (NKE) stock tohelp pay for a new car.
2. Roger discusses various investment strategies with an NYSE member broker and asks for a quoteon NIKE stock.
2a. Diane asks her NYSE member broker for a quote on NIKE stock.
3. Both brokers obtain quotes on NIKE from the NYSE trading floor via an electronic data-marketsystem.
4. Roger instructs his broker to buy 100 shares of NIKE at the current market price.
4a. Diane instructs her broker to sell 100 shares of NIKE at the current market price.
5. The two brokers send their orders to the Trading Floor using either the Broker Booth SupportSystem (BBSS) or SuperDot.
6. At the post, the specialist who handles NIKE makes sure the transactions are executed fairly andin an orderly manner.
7. The two floor brokers compete with other brokers on the trading floor to get the best price fortheir customers. The brokers representing Roger and Diane agree on a price.
8. After the trades are executed, the specialist’s workstation sends notice to the brokerage firms andthe consolidated tape.
9. The transaction is reported by computer and appears within seconds on the consolidated tapedisplays across the country and around the world.
10. Within three days both Roger and Diane are sent confirmations of their trades from their broker-age firms.
11. Roger settles his account within three business days by submitting payment to his brokerage firm.
11a. Diane’s trade is also settled in three business days. Her account will be credited with the pro-ceeds of the sale of stock, minus any applicable commissions.
(Source: The NYSE Web site <www.nyse.com>.)

HOW NOW, DOWN DOW? MARKET INDICATORS
Definition of statistics: The science of providing unreliablefacts from reliable figures.
EVAN ESAR, Esar’s Comic Dictionary
“How’d the stock market do today?” If you watch the news, you can answerthat question by repeating how the Dow did today (or the Nasdaq or the S&P500). But these are indexes—indices or indications—representing a relativelysmall percentage of the market as a whole. A stock market index is simply astatistical indicator of how a particular group of stocks is performing (not thewhole market).
The oldest and most influential stock index is the Dow Jones IndustrialAverage. When it is reported that the market is up or down, the reference isusually to how the Dow did that day. But the Dow represents only 30 stocks (al-beit 30 of the largest blue chip American companies) and there are thousandsof stocks out there that aren’t represented on the Dow.
Beyond the small number of stocks it tracks, the Dow can be further mis-leading because it is “price-weighted,” meaning that the highest-priced stocksexert a disproportionate influence on how the Dow does in general. For ex-ample, if the three highest-priced Dow stocks had a spectacularly great day butthe remaining 27 had lackluster or drooping returns, the price-weighted for-mula might still report that the Dow had a good day. In this case, because theDow is the main index we rely upon, we’re led to believe that “the market”had a good day even though the majority of stocks actually floundered.
This example is not an exaggeration. In the late 1990s, a few giant stocksin the Dow had blockbuster showings week after week, overshadowing the restof the bunch that were simultaneously struggling and declining but didn’tcarry as much weight in the Dow formula. The Dow kept going up, giving thepublic a false impression that all was fine and dandy on the market (becausewe equate the Dow with the whole market), thus prolonging the bubble andencouraging individual investors to throw even more money hand-over-fist atWall Street.
In an article in Financial Sense Online titled “Why Not Dow 1,000,000?” (de-bunking the popular premises of best-seller titles in the late 1990s predictingthe Dow would reach 30,000 or more) on November 27, 1999 (a few monthsbefore the bubble burst), James J. Puplava wrote the following prophetic obser-
58 D O N ’ T P L AY I N T H E S T R E E T
vations about the undue influence of the “giants outshining the dwarfs” inboth the S&P 500 and Nasdaq:
[For the S&P:] This index has 500 companies—yet 10 companies occupyover 20% of its entire value. Since a small group represents a major por-tion of the index’s value, these small handful of giants tend to move theentire index. . . . For the first three-quarters of [1999], just 11 stocks fromthe S&P 500 account for all its performance.
For the Nasdaq, the picture is even more distorted. . . . A little morethan 1% listed within the index account for 99% of its gains. Four stocks—Microsoft, Intel, Cisco, and WorldCom—comprise 25.6% of its value.
Did you notice two of those influential stocks were Cisco and WorldCom?These two were driving the boom?! I think you’ll agree, it’s a bit chilling inhindsight. Here’s more from Puplava:
This proportion of distortion—whereby you have the vast majority ofstocks declining while the indexes are advancing—has existed only a fewtimes this century . . . during the ’20s before the Crash, in the early ’70sbefore the last bear market, and for a short period before the OctoberCrash of 1987.
If you own a particular set of stocks instead of funds based on indexes, asI wholeheartedly suggest later in this book, then you can essentially ignorewhat the market is doing and never be confused by its lopsided indications be-cause you will not be invested in “the market.” You should be invested in yourown group of wisely chosen stocks and that should be the only “index” youneed to track.
Again, here are the big three indexes that we hear about every day,though there are dozens if not hundreds of others.
1. Dow Jones Industrial Average (aka the Dow or DJIA). This is comprised of30 blue chip (large-cap) U.S. stocks of industrial companies (exclud-ing transportation and utility companies).
2. S&P 500 (aka Standard and Poors 500 Index). This is comprised of 500stocks chosen for market size, liquidity, and industry group represen-tation. They are market-weighted so the largest stocks have more im-pact on this index level than smaller ones.
Knowledge Is Power 59

3. Nasdaq composite. This index tracks approximately 4,000 mostly technology-oriented stocks and, like the S&P 500, is market-weightedso the largest stocks impact the index more than smaller ones.
Let’s look at each index in depth with a more objective eye, having al-ready established that each one is a sampling.
Dow Jones Industrial Average (DJIA)
The Dow Jones Industrial Average is an index of 30 blue chip stocks ofU.S. industrial companies. The Dow includes substantial industrial companieswith a history of successful growth and wide investor interest. The Dow in-cludes a wide range of companies—from financial services companies to com-
60 D O N ’ T P L AY I N T H E S T R E E T
T h e 3 0 S t o c k s i n t h e D o w J o n e sI n d u s t r i a l A v e r a g e
(As of this writing; with each stock’s symbol in parentheses.)*
3M (MMM) Honeywell (HON)Alcoa, Inc. (AA) Intel (INTC)American Express (AXP) IBM (IBM)AT&T (T) International Paper (IP)Boeing (BA) Johnson & Johnson (JNJ)Caterpillar (CAT) McDonald’s (MCD)Citigroup (C) Merck (MRK)Coca-Cola (KO) Microsoft (MSFT)DuPont (E.I.) de Nemours (DD) J.P. Morgan (JPM)Eastman Kodak (EK) Philip Morris (MO)Exxon Mobil (XOM) Procter & Gamble (PG)General Electric (GE) SBC Communications (SBC)General Motors (GM) United Technologies (UTX)Hewlett Packard (HWQ) Wal-Mart Stores (WMT)Home Depot (HD) Walt Disney Co. (DIS)
*All Dow Jones stocks are listed on the NYSE except Intel and Microsoft whichare listed on Nasdaq.

puter companies to retail companies—but does not include any transportationor utility companies which are included in separate indices. The stocks in-cluded in the DJIA are not changed often, but when they are, it’s at the dis-cretion of a committee from the Wall Street Journal. Unlike many other indexes,the DJIA is a price-weighted, not market-weighted, index (that is, this indexdoes not take market capitalization into account).
S&P 500
The S&P 500 Composite Stock Price Index is a capitalization-weightedindex of 500 stocks intended to be a representative sample of leading compa-nies in leading industries within the U.S. economy. Stocks in the index arechosen for market size (large cap), liquidity, and industry group representa-tion. The S&P 500 is considered one of the best benchmarks for large-capstocks and accounts for about 70 percent of the U.S. market. The S&P 500’sperformance is considered one of the best overall indicators of market per-formance and the mark which mutual fund managers try to beat. Unfortunately,the top 45 companies comprise more than 50 percent of the index’s value.
Nasdaq Composite
The Nasdaq Composite Index measures all Nasdaq domestic and non–U.S.-based common stocks listed on the Nasdaq stock market. This index isweighted on market value. This means that each company’s security affectsthe index in proportion to its market value. Because it is so broad-based (with4,000 to 5,000 mostly technology-oriented companies), it is one of the mostwidely followed and quoted major market indexes.
Reiteration
I want to reiterate that indexes are comprised of particular groups ofstocks chosen to answer the routine question “How’d the stock market dotoday?” Remember, these indexes tend to be overweighted (distorted) towardthe performance of the “giants” in each index, so take index performanceswith a huge grain of salt.
Knowledge Is Power 61

If you are invested in particular stocks of your own choosing, you are notinvested in “the market” as a whole. All that should matter to you is how yourstocks are performing.
BEARS AND BULLS: DOIN’ WHAT COMES NATURALLY
Ask five economists and you’ll get five different answers. (Sixif one went to Harvard.)
EDGAR R. FIEDLER
Mark Twain was once asked if he thought it would ever stop raining. Hereplied, “Always has.” The same is true with declining stocks. The slide ends,or at least it always has—and usually with a bang. After the market fell a totalof 37 percent in the period between 1973 and 1974, it jumped a remarkable42 percent in the first six months of 1975. Which brings us to the extendedups and downs known as da bulls and da bears (that’s for you Chicago fans).
Simply put, a bull market is a sustained period during which stock pricesare generally rising. A bear market is a sustained period during which stockprices are generally falling. What gauge do we use to determine ups, downs,and volatility in the stock market as a whole? We rely on the indicators we justcovered—the Dow, Nasdaq, and S&P 500.
To qualify as a bull or bear market, a market must have been moving inits current direction for a sustained period. Small, short-term up or downmovements lasting days do not qualify; these trends may only indicate correc-tions or short-lived movements. Bull and bear markets signify longer move-ments (sustained for several months to a few years) with an approximatechange of 20 percent or more in the stock market’s value as a whole.
Both bull and bear markets are fueled by investors’ perceptions of wherethe economy and the market are going. If investors believe they are in themidst of a bull market, or that one seems likely, they feel confident that pricesare going up. Their own confidence helps to keep stock prices rising. (Opti-mism is contagious.) During a bear market, investors believe stock prices willfall. They hesitate to invest in stocks, and their own concerns help to keepstock prices down. (Pessimism is contagious, too.) And pessimism can shift todownright gloom when there are as many scandals in the corporate world asthere were in 2002.
62 D O N ’ T P L AY I N T H E S T R E E T

Of course, the best-known bear market in American history was the GreatDepression. The Dow lost roughly 90 percent of its value during the first threeyears of that period. More recent bear markets include those between theyears 1973 and 1974, 1981 and 1982, and the one we’re experiencing now(2000 through who knows when). There have been 24 bear markets in thepast 100 years, as the chart in Figure 4.2 illustrates.
The longest bull market in U.S. history was the one that began in 1991and ended in the Spring of 2000. Other major bull markets occurred in the1920s, the late 1960s, and the mid-1980s. All of these ended in recessions ormarket crashes. Sound familiar?
No one said that making money in the stock market was easy. In tryingtimes, it just takes more effort. You earn your keep through discipline, wis-dom, moderation, and patience.
Investors turn to theories and complex calculations to try to figure out inadvance when to expect sustained bull and bear markets—and to predict
Knowledge Is Power 63
FIGURE 4.2 Bear Markets of the Past 100 Years
Beginning Date Ending Date DJIA
SEP 1899 SEP 1900 78 to 53 −32%JUN 1901 NOV 1903 78 to 42 −46JAN 1906 NOV 1907 103 to 53 −49NOV 1909 SEP 1911 101 to 73 −27SEP 1912 JUL 1914 94 to 71 −24NOV 1916 DEC 1917 110 to 66 −40NOV 1919 AUG 1921 120 to 64 −47SEP 1929 JUL 1932 381 to 41 −89MAR 1937 MAR 1938 194 to 99 −49NOV 1938 APR 1939 158 to 121 −23SEP 1939 APR 1942 156 to 93 −40MAY 1946 JUN 1949 213 to 162 −24APR 1956 OCT 1957 521 to 420 −19JAN 1960 OCT 1960 685 to 566 −17DEC 1961 JUN 1962 735 to 536 −27FEB 1966 OCT 1966 995 to 744 −25DEC 1968 MAY 1970 985 to 631 −36JAN 1973 DEC 1974 1052 to 578 −45SEP 1976 FEB 1978 1015 to 742 −27APR 1981 AUG 1982 1024 to 777 −24AUG 1987 OCT 1987 2722 to 1739 −36JUL 1990 OCT 1990 3000 to 2365 −21JUL 1998 SEP 1998 9250 to 7800 −16JAN 2000 ? 11850 to ? ?

when each tide will turn. In reality, no perfect indicator has been found andI suspect it’s an exercise in futility. Yet, as the graph in Figure 4.3 shows, bearmarkets seem to have occurred like clockwork over the last 100 years. It is sucha constant that it seems like a natural phenomenon—almost as predictable asthe seasons of the year.
Now look at the graph a little differently. From 1899 to 2002, what hasbeen the overriding trend: up or down? Obviously, from this illustration, youcan see that the pull has always eventually been upward.
While we’re waiting for the current bear market to finish its business, Ihope this 100-year “trend” showing the stock market rising over the course oftime is some comfort to those who wonder if it will ever stop “raining.” AsMark Twain observed, it always has. And when the sun comes out to shineagain, there’s no reason to suspect that the stock market won’t continue torise over the long term.
As I stated before, you are far better served focusing on individual com-panies and their business than the market as a whole. After all, you are not in-vesting in “the market” but in individual stocks. While there obviously aremore opportunities during bull or bubble markets, there are many opportu-
64 D O N ’ T P L AY I N T H E S T R E E T
FIGURE 4.3 Bear Markets over the Last 100 Years

nities with individual stocks during bear markets as well. With some wisdomand the right tools to help you recognize the winners—regardless of what themarket is doing as a whole—you can reap rewards whether a bull or bear com-mands the stage at any point in time.
RISKY BUSINESS?
People who don’t take risks generally make about two big mis-takes a year. People who do take risks generally make about two big mistakes a year.
PETER F. DRUCKER
No talk of investing in stocks would be complete without addressing its inherent risks.
There is no guarantee that you will make money on a stock investment.As a matter of fact, because securities aren’t federally insured, you could con-ceivably lose all of your investment if you don’t choose wisely.
Obviously, none of us wants to lose money. Yet, there is a saying that with-out risk, there’s no gain. That definitely rings true in this case. Not investingyour money will get you nothing in return. Conversely, the higher the returnsyou’re seeking, the more risk you’ll have to incur. Okay, let me pause here fora moment. I don’t want to scare you out of investing your money in stocks be-cause I believe stocks are the best investments you can make. But you must as-sess the risk of investing in each individual stock, or in investing in anythingelse for that matter.
Inflation, You Dirty Dawg
A key issue when looking at the risk/gain ratio is inflation. Basically, in-flation is the rate at which your money loses buying power. As you know, $1today is worth less than it was worth ten years ago, and it will be worth evenless in another ten years. In the United States, the inflation rate has histori-cally been about 3.2 percent per year. What this means is that even if you putyour money in a safe federally insured interest-bearing savings account, youcould end up losing money (not in the amount that accrues but in its buyingpower) if the interest rate from your bank doesn’t keep up with the inflationrate. So while you might think that you won’t lose anything if you don’t invest
Knowledge Is Power 65

money in the stock market (other than the opportunity to reap greater rewards),your cash is losing value constantly due to inflation—even while you’re read-ing this paragraph.
Just as there are different levels of risk from mild to the mildly insane,there are levels of safety that slide all the way down to too safe.
But Time Is on Your Side
While the inherent risks in stock investments are higher than putting yourmoney into a savings account, compared to any other form of savings or in-vestments, stocks have historically offered the highest rate of annual returnsover time. (If you invested $1 in stocks in 1900, you would have over $10,000today.) So, while you might hear news of a bad day on the stock market, if youkeep your money in stocks for the long term, odds are you will find that mar-ket trends that seem volatile day-to-day are not going to impact you in the longrun as much as you might think. Patience usually pays off. That being said, ifyou put all your money into a company that goes bankrupt, you may be totallyout of luck. (Okay, we got that messy bit of business out of the way.)
Here’s the most important point: Stocks have outperformed any otherform of investment mechanism in the long run. This is because the U.S. mar-ket has continuously had an upward trend (remember the graph in Figure4.3?). Even through slumps and bear markets, the market continues its up-ward swing.
In the long term, stocks generally yield around a 10 percent to 11 percentannual return. Compare this to bonds, which are safer but usually give youonly a 5 percent return. While you might think that the rate of return forbonds is attractive because it’s more of a sure thing, the rate at which yourmoney grows isn’t only based on the rate of return of your investment. Infla-tion weighs in heavily here.
Growing money without inflation:
• Let’s say you invest $100 in a stock that is performing at 10.5 percentannual return. It would take about seven years to double it to $200.
• If you invest the same $100 in a bond with a 5 percent interest rate,math dictates that it’d take little over 14 years to double the value to $200.
When you factor inflation at about 3.2 percent per year in the equation:
66 D O N ’ T P L AY I N T H E S T R E E T

• Your stock investment would take nearly ten years for the actual value ofyour money to double (instead of seven years).
• Your bond investment would not double the actual value of your moneyfor 40 years!
I think you can clearly see the difference in the performance betweenstocks and bonds from this example. If you choose an even “safer” investmentthat earns less than the 5 percent you get from bonds, then it would take evenlonger for your funds to grow. It’s not hard to understand why stocks are byfar the best choice for your investment to grow, as long as you take the timeto research your investment and make wise choices.
But Why All the Daily Ups and Downs?
There are many reasons why stock prices fluctuate. Whether it be a gen-eral trend, a major move by large financial institutions in and out of stocks, orgood old supply and demand, no one can accurately predict how a stock willperform from moment to moment. There is one area, however, that we canpoint to as the single most influential reason why a stock’s value goes up ordown: the number of stocks being bought versus the number being sold.
Buyers versus Sellers, Supply and Demand
I can’t stress enough that supply and demand—buyers versus sellers—isthe most important reason why a stock’s price goes up or down. While thereare other influences that come into play from day to day, the bottom line isthat if there are more sellers than buyers, the stock price goes down; if thereare more buyers than sellers, the stock price goes up. Plain and simple. (Thissubject will be covered in depth later when we discover how to find goodstocks to buy and how to recognize which ones to avoid.)
So if the value of a stock is not based solely on the number of buyers ver-sus sellers, then what kinds of other influences might affect it? Let’s start withtwo big ones.
1. Institutional movements. When “insiders” or large corporations buy andsell vast sums of shares all at once or when mutual fund managers withthousands of clients move in or out of a stock, they dramatically move
Knowledge Is Power 67

the market with them. Each stock has a typical daily volume of buyingand selling, but a major movement can be recognized as a “spike” inthe volume for that day. The buying and selling by institutions occurson a big scale and their power, by virtue of the sheer number of stocksthey represent, can instantly affect a stock’s value. You should also payattention when the “big guys” jump in or out of a stock—chances arethey know something that you don’t. Ride the wave with them if youcan but if you miss the boat, don’t jump in.
2. Earnings. A publicly traded company is required by law to publish itsearnings reports four times a year (once each quarter). Stocks rise andfall around reporting time when investors react to whether the com-pany exceeds target expectations or fails to do so. While earnings af-fect the company’s value, we saw during the dot-com bubble that somecompanies that never made a dollar can be represented by paper wealththat is worth billions. But when the reality set in that these companieshad no earnings, their value disappeared.
Still want more? Here are some events—both external and company-related news—that tend to move stocks up and down. These tendencies areworth following on your radar screen but their effect is far from a guaranteeof a certain result.
External events (not related to a particular company).Prices tend to move up:
• Before a presidential election• Before New Year’s Day • When oil prices decline• When the rate of inflation declines• When interest rates decrease• When GNP reports show growth• When raw material prices decline• With international tensions
Prices tend to move down:
• After a presidential election• After New Years Day
68 D O N ’ T P L AY I N T H E S T R E E T

• When oil prices increase• When the rate of inflation escalates• When interest rates rise• When GNP reports show sluggishness• When raw material prices increase• With the sudden illness/death of a president
News related to an individial company.Prices tend to move up:
• When companies announce dividend increases• When projections of future earnings increase• When restructuring occurs to reduce current debt• When an earnings increase exceeds expectations• With rumor of a takeover attempt• When a lengthy strike is settled• When a company succeeds in increasing prices• When a company is awarded a large contract• When a company appoints a new chief executive officer (CEO)• When cash flow improves
Prices tend to move down:
• When a company issues new shares to finance a takeover, diluting pershare value
• When dividend pay-outs are skipped or reduced• When acquisition rumors are disproved• When an acquisition plan fails• When an earnings decrease is projected or rumored• When earnings decline• With unexpected losses• When a company is involved in price-cutting or a price war• With labor unrest or when a major strike begins• When a company loses a big contract• When a popular CEO dies or resigns • When a company’s announced stock split is rescinded
Prices of stocks fluctuate but tend to follow a trend over time. They maytake two steps up, one step down, three steps up, one step down, and so forth.
Knowledge Is Power 69

While making its way from point A to point Z (whether it’s upward or down-ward), a stock price oscillates constantly. It’s natural. The important thing toremember is that when you focus on the longer term, the natural tendency ofa stock is to flow one direction or another.
We’ve now seen many factors that can influence the direction and amountthat a stock moves. The bottom line, though, is that no one really knows forsure why stock prices constantly fluctuate the way they do. They just do.
Even with all their sophisticated tools, the sharks of Wall Street can’t tell youfor sure why or how a stock will move. Without access to these tools, it’s evenharder for us—the “little people” —to accurately predict what’s going to happen(though computers and software have definitely leveled the playing field).
No matter how wisely and safely you play it, there will always be an ele-ment of uncertainty with stocks. The best you can do is to have a solid strategyand be prepared to deal with whatever contingencies may arise. But before weget into developing that strategy, let’s finish covering the basics.
PLACING ORDERS
Until the year 2001, stock prices had been quoted in fractionsfor two centuries, based on a system descended from Spanish pieces of eight. Each dol-lar was cut into eight bits worth 12.5 cents each. (Quarter = 2 bits.)
CHARLES A. JAFFE
On Your Mark . . .
Simply put, the price of a stock is determined by supply and demand,where
• the supply of stock is based on the number of shares a company has issued, and
• the demand is created by people who want to buy those shares from theowners.
The more that people want a stock, the more they are willing to pay for it.Now here’s the dynamic that drives the prices of the stocks up or down:
The supply of shares of any stock is limited. Investors can only buy shares of
70 D O N ’ T P L AY I N T H E S T R E E T

stock that are already owned (or held) by someone else. So if one personwants to buy, then somebody else has to sell, and vice versa. If a lot of peoplewant to buy at the current price but few people want to sell at that price, thenthe price goes up until more people are willing to sell. When the price gets sohigh that buyers are no longer interested in buying the stock, then the pricestarts to drop.
Ready . . .
When you’re ready to buy or sell, you need to understand the two pricesyou’re dealing with—the bid and ask prices.
• Bid (or bid price). The highest price at which someone is willing to buy a stock.
• Ask (or ask price). The lowest price at which someone is willing to sell a stock.
The difference between the bid and ask prices is called the spread. If thebid price is $15.00 and the ask price is $15.05, the bid-ask spread is 5 cents.
So why is there a spread? Why aren’t the bid and ask prices the same? Thebid and ask prices are determined by the middlemen (dealers, also known asspecialists and market makers) who match sellers with buyers; the spread istheir profit for providing their services. An analogy might be that the mid-dlemen are like pawnbrokers. They buy from a seller (at a lower bid price)and resell to a buyer (at a higher ask price). The pawnbroker pockets theprofit (the spread).
If you want to buy, the ask price tells you how much the stock will cost youto own it. If you want to sell, the bid price tells you how much buyers are will-ing to pay you for your stock.
Set . . .
When you’re buying stock, you also must indicate how you’re paying forit: cash or margin.
The cash option is simple. Most of the time, whether you set up an ac-count with a broker or establish one online, you provided money up front asa deposit. The costs of buying a stock (the price of the stock plus fees to make
Knowledge Is Power 71
the transaction) are drawn from the cash you’ve already provided. No fuss, no muss.
When buying on margin, it gets much more complicated. When you choosethis option, you borrow money from your broker to buy stock. Some investorschoose to buy stocks on margin (with the broker providing up to 50 percentof the costs) because they can buy up to twice as many shares and thus dou-ble their possible gains. On the other hand, they risk doubling their losses.
Whether the stock goes up or down, the broker collects interest on the loanand holds on to the purchased stock as collateral. If the investment doesn’toutperform the accruing interest on the loan, the investor is in a hole—evenwith a growing stock.
“Let me order, already!”
Once you have decided how to pay for your transaction, you need tochoose the kind of order you want fulfilled. Here’s a short description of thevarious types of orders that you have at your disposal when making a tradewith a broker or online.
• Market order. This is an order to immediately buy or sell at the best pricecurrently available on the trading floor.
• Limit order. This is an order to act when and if a stock reaches a speci-fied price (the limit) or better—either an order to buy at the specifiedlimit price or lower, or an order to sell at the specified limit or higher.
• Stop-loss order. This is an order to buy or sell when a certain point isreached. It is designed to limit the extent of an investor’s loss (or tolock in a profit).
• Stop-limit order. This is an order to buy or sell at a specified price or bet-ter after a given stop price has been reached or passed. Put anotherway, it is a stop order that becomes a limit order after the specified pricehas been reached.
The following options come into play after a limit or stop order has beenchosen:
• Good ’till cancelled (GTC) order. This is an order to buy or sell that remainsin effect until the customer cancels the order.
72 D O N ’ T P L AY I N T H E S T R E E T

• Day order. This is an order to buy or sell that expires at the end of thebusiness day if an order has not been placed by then.
Now let’s look at each of these orders more closely. Market orders are those that are executed at the best possible price when
your order is received by the trading desk. You place a buy or sell order for astock and your broker fulfills the order as quickly as possible. Your buy or sellorder is presented to the market and is fulfilled at the “next available price”which may have changed from the time you placed the order until the timeyour order is processed. For example, if you put in a buy order for a stock that’strading at $3.51 at the time you placed the order but the price rises to $3.57by the time your trade reaches the market, then $3.57 is the price you’regoing to pay. (If you’re fortunate, the price will fall before your trade is exe-cuted and you will pay less than your original order.) The same type of fluc-tuations may occur when you’re selling your stock.
When you place a market order, your broker is obligated to move on thetrade as quickly as possible to meet your intended buying or selling price tolimit unpleasant surprises in price fluctuations for clients.
Market orders are the least expensive trades that you can make in termsof your broker’s fees or commissions because these orders require no specialattention on the broker’s part. With discount and online brokerage firms, thelowest available cost per trade refers to the placement of market orders.
You will undoubtedly incur extra broker fees for all other types of ordersbecause you’re exercising more control on how the order is placed.
Limit orders are those that are executed only if the price you’ve specifiedis reached. This could mean a more advantageous price for you than that ofthe current market price (that is, a lower price if you’re buying, higher ifyou’re selling) should the market move in your favor before your limit orderis processed. You are assured that your price won’t get worse because you’ve setyour limit; however, this limitation may prevent your order from being filled.
A variation on this is a limit order—all or none. This type of order specifies“my way or the highway,” meaning the order has to be filled completely at theprice you specify or not at all.
Stop-loss orders are those that are executed when a certain price is reached.The two types of stop-loss orders are:
1. Stop order 2. Stop-limit order
Knowledge Is Power 73

A stop order is entered with a price on it. When the stock reaches that price,the order then becomes a market order and is filled at the market price. For ex-ample, a stop order would be written like this:
Sell 200 XYZ at 50 stop
When the stock reaches 50, it triggers the order, which is then executed at thenext available price, regardless if it is above or below 50.
A stop-limit order is entered with two prices on the ticket—the first price isthe stop price and the second price is the limit price. The stop price must bereached first, then the order becomes a limit order and that limit price mustthen be reached for the order to be executed. For example, a stop-limit orderwould be written like this:
Sell 100 Shares IBM 70 stop 70.25 limit
This means that when the stock hits 70, it triggers the stop side of the order,then the stock must hit 70.25 for the order to be executed.
Some people use stops regularly and love them because they feel it’s asafety measure that helps them avoid big losses when they’re not paying at-tention. Other traders don’t like them because the price may drop suddenlydue to a temporary blip (like an “afternoon suck down”) and the stock is au-tomatically sold before the price has a chance to pop back up to where it wasbefore.
As for cost of a stop-loss order, you are charged the regular commission(like a market order) and only pay extra if the stop-loss price is reached andthe stock must be sold.
Two options are available after you’ve chosen a limit or stop order:
1. Good ’till cancelled (GTC) order2. Day order
With a good ’till cancelled order, the trade will take place at the limit or stopprice regardless of how long it takes for the price to move to that point (youpurposefully make it an open-ended proposition). If you want to buy a stockat a specified price but the stock is moving slowly to get there, your GTC ordermeans that your order is valid until you cancel it. In some cases, your brokermay have an automatic shut-off limit on the length of time that an order can
74 D O N ’ T P L AY I N T H E S T R E E T

remain open (say 30 or 60 days), so if your GTC order hasn’t been placed bythe broker’s expiration date, the order is automatically cancelled.
With a day order, you’ve expressed that you want your order cancelled au-tomatically at the end of the day if it hasn’t been executed by then.
Finally, these terms are also useful to know when you are placing an order.
1. Round lot. This specifies that your order is one in which you wish to buyor sell in multiples of 100 shares.
2. Odd lot. This specifies that your order to buy or sell involves less than100 shares.
CONCLUSION
Now all you need is a method of choosing and trading stocks that consis-tently yields positive results. Let’s move on!
Knowledge Is Power 75


C h a p t e r
77
5
If one does not know to which port one is sailing, no wind is favorable.
LUCIUS ANNAEUS SENECA
For the time being, let’s brush aside all thatWall Street stuff. It’s now time for you to take center stage.
In order for you to develop a financial game plan, you first need to take stockof who you are and what you want. That is, where are you coming from finan-cially and where do you want to go? To become a fully informed investor, it isvital that you assess the “big picture” before you dive into the investment pool.Be as specific as possible in assessing the answers to the questions in Figure 5.1.
Once you have a firm handle on all of the questions in Figure 5.1, you areready to move on to your goals.
DEFINE YOUR GOALS
Don’t forget why you are investing: To enhance your financial well-beingand to attain your goals. What are your goals exactly? Which of your goals are
MIRROR, MIRRORTaking Stock of Yourself

more immediate and which ones are projected further down the line? Onceyou know what you want, when you want it, and how much it costs, you canfigure out how to save or invest for more immediate needs and how to investin greater growth opportunities to meet your bigger and longer-term goals.
Answer the following questions to determine what’s most important to you.
78 D O N ’ T P L AY I N T H E S T R E E T
FIGURE 5.1 Taking Stock of Yourself
Your Present Financial Situation (Income, Budget,Assets, Debts)
• Is your income/job stable?• Do you have other sources of income?• Do you have outrageous credit card debt? If so, should you concentrate on elimi-
nating it so you’re not paying all that interest?• Do you owe money on your car? If so, can you refinance it to lower your interest
rate?• What are your day-to-day and monthly expenses? Again, be specific.• Do you have a 401(k)? Will you be receiving a pension?• Have you already invested in stocks, mutual funds, or CDs?• Do you have retirement benefits on which you can rely?
Your Future Financial Responsibilities
• Are you responsible for supporting children, a spouse, or your parents—now orin the future?
• Do you own a home? Do you owe a mortgage on it? Do you often have expensesthat crop up to maintain your home and lawn?
• Are you carrying adequate life, disability, property, and liability insurance?• Do you have short-term savings that are liquid (accessible) to cover emergencies
like the loss of your primary source of income or whatever other major bump inthe road that the fickle finger of fate has in store for you?
• Do you have three to six months of living expenses saved or easily accessible ifyou lose your source of income (you’ll obviously need more if you have familymembers who are dependent on you through thick or thin)?
• Do you have enough savings readily available so that you don’t have to suddenlycash in your stocks in the case of an emergency?
The Amount of Money You Have to Invest
• Have you determined how much money you want to be liquid (easily accessible)? • Have you determined how much money you want to allocate to longer-term in-
vestments where the money can be tied up for awhile?
Your Level of Risk Tolerance
• Have you considered the risks involved with each of your investment options? • Have you assessed what level of risk is acceptable for you?

• If you don’t own a home, do you want to buy one? How much of a downpayment will you need? If you own a home, do you want to own a sec-ond one?
• If you have kids, will you be paying for all or part of their college tu-ition? Do you fancy going back to school yourself?
• Do you have your eye on a big ticket item like a new car? How about aboat?
• Do you need to support your aging parents?• Would you like to take a dream vacation?• Do you intend to live in the lap of luxury?• Do you plan on having a comfortable retirement?
To state the obvious, it costs a lot of money to achieve these goals. Tomake sure that you will have enough money to finance them, I suggest you fol-low these two steps:
1. Make a list of your goals. Study the list and determine which ones aremost important to you. Also determine which goals are short term (say,within five years) and which ones are long term.
2. For each goal, decide how much time you have to meet that goal.When you save or invest, you need to devise a plan that fits the timeframe for financing each goal.
Once you have determined your goals and prioritized them, you will findit easier to choose the right types of investments that will help you to meetyour goals “on time.”
YOUR RISK TOLERANCE
Decide how much risk you are comfortable taking with your money. Areyou a conservative investor, concerned above all about the safety and stabilityof your assets? Are you an aggressive investor, prepared to take higher risks forthe possibility of greater returns? Or are you a moderate risk taker, falling some-where in-between?
Everyone handles risk differently. Some people can live with—or afford totake—more risk than others. Other factors that shape a person’s risk toler-ance include their age, personality, lifestyle, time available, and inclination to
Mirror, Mirror: Taking Stock of Yourself 79

oversee their own investments, and responsibilities that override any financialconsideration (shocking, but there are probably some examples out there).Oh, and let’s not forget the income factor, especially if there is a lack thereof.
Investing money should not be an experience that’s overwrought withanxiety. If investors get anxious and lose sleep while their stocks experiencenatural up and down fluctuations, then they should adjust their allocation tobe more compatible with their comfort level.
Determine how much risk you are comfortable with and choose your in-vestments accordingly. I suggest you keep an open mind about stretching yourown sense of risk tolerance slightly so you can possibly reap greater rewards.
Don’t forget that while stocks may present a higher risk than other in-vestments, they have demonstrated throughout history that they outperformall other investments across the board. Consider instead that the biggest riskfor you may be not investing at all in well-chosen individual stocks.
CONCLUSION
I suggest that you seriously address all of the issues in this chapter, be-cause they will help you reach a much clearer picture of your financial situa-tion, your investment goals, and how much risk you are willing to assume.Knowing yourself and your situation sets the foundation for the next step: ex-ploring investment strategies to find the ones that are right for you.
80 D O N ’ T P L AY I N T H E S T R E E T
C h a p t e r
81
6
It is not enough to do your best. You must know what to doand then do your best.
W. EDWARDS DEMING
One of the most important investment choicesthat you will make is picking a broker that meets your goals and needs. Youhave a right—no, an obligation—to choose the right broker. Never forget thatit’s your money. If you feel the least bit uncomfortable in establishing a rela-tionship with a particular broker, look elsewhere.
In the beginning of this book, we explored the great Wall Street melo-dramas with a cast of characters so caught up in their conflicts that theywound up disregarding the individual investors. In our story, that’s you.
I think it’s abundantly clear that you’re better off controlling your owndestiny rather than constantly sidestepping all the land mines of confusionand misinformation planted by the big boys in the financial world. To controlyour own financial destiny, you only need to be armed with the knowledgeand tools to make sound investment decisions on your own.
PICKING A BROKER WHO WON’T
MAKE YOU BROKER

However, even with the proper street smarts, the system is set up so thatthere’s one entity we must all deal with. If you want to invest in stocks orbonds, you have to go through an intermediary. There’s no getting around it.You cannot execute trades on your own (unless you happen to be a licensedbroker).
WHAT EXACTLY IS A BROKER?
If you want to buy or sell stocks, you need to use a licensed broker. Theterm broker can refer to an individual or the brokerage firm as a whole. In ei-ther case, each one provides the essential service of linking individual in-vestors with the financial markets.
As an individual, a broker (also known as a stockbroker) works for a bro-kerage firm. He or she serves as the sales agent who recommends investmentsand executes investors’ orders. Brokers serve as intermediaries between thosewho want to buy and those who want to sell. In addition to their salary, theymake their living from commissions or fees for the sales and deals they make.
Let’s be very clear. Brokers are salespeople. Never forget that. Caveatemptor. Buyer beware. I am not knocking brokers just because they are in sales;some of my best friends are salespeople (hey, I was one myself for Motorola).Deep down, most stockbrokers are decent people, but just like car salespeo-ple, real estate agents, and insurance agents, they make their living by makingsales—by taking people’s money when they sell a product or service—not bysending you home empty-handed.
Brokers have little incentive to teach us to become self-sufficient becausethey lose commissions if we don’t follow their advice. They count on cus-tomers to be blissfully ignorant. That way, it gives them a lot more leeway toscrew up if we’re too clueless to know better. Our naiveté gives the less scrupu-lous brokers the power to manipulate us into making unwise investments. (Re-member, the Wizard of Oz was a heckuva lot more powerful before Totopulled back the curtain to expose him as the scam artist he really was.)
The moral of this story is the more you understand about the market andits products (whether it be stocks or cars or insurance), the more the powershifts from the salesperson back to you. Instead of allowing the broker to sec-ond guess you, you can second-guess the broker’s recommendations, and youshould—every single time. Especially because a broker’s mantra is often “buy,buy, buy” and seldom “sell.”
82 D O N ’ T P L AY I N T H E S T R E E T

RULES OF ENGAGEMENT
A stockbroker in the United States must pass two licensing examinationsgiven by the National Association of Securities Dealers (NASD). These exams(called Series 7 and Series 63) certify that a broker understands everythingabout what he or she is selling to you as well as all the pertinent regulationsand laws in the securities industry. After passing these exams, a broker is li-censed to advise you on investment choices, solicit business from you, and ex-ecute transactions on your behalf. (Brokers may do some research on theirown but officially they are not research analysts.)
By law, all licensed brokers—individuals and firms—are members ofNASD and must abide by its rules and regulations. As of June 2002, there wereabout 5,500 member firms registered with the NASD, along with 91,100branch offices, and 678,600 registered representatives. If you ever want tocheck liscensure of a prospective or current broker, you can go to NASD’sWeb site <www.nasd.com> and check the database as part of its public disclo-sure program.
All brokerage firms must adhere to the Securities and Exchange Com-mission (SEC) rules as well as the exchange and over-the-counter rules. Onlyexchange members (e.g., New York Stock Exchange members) are permittedto execute orders on the floor of an exchange. To become a member of an ex-change, a brokerage must buy a “seat.” The recent going rate for a seat isabout $500,000 (depending on supply and demand, of course). Firms notowning seats are called nonmembers. Their orders for exchange-listed stocksmust be processed through a member firm. Without that connection, theycan only execute orders in over-the-counter markets.
SIMPLY SPEAKING
Before we move on, let’s review the basic ABCs of how a client opens anaccount with a broker and places an order. Placing an order online is a littledifferent, but the process is virtually the same (pun intended).
• The first step is choosing a broker.• Once you have selected a broker, you open an account by signing an
agreement and depositing money with your broker which you will useto buy securities in the future.
Picking a Broker Who Won’t Make You Broker 83

• When you decide to buy stock, you contact your broker and place anorder. The broker provides you with the current trading price of thestock you want. You confirm how many shares you wish to purchase. Tobe certain, your broker asks if you’re ready to execute the order (on-line, you get a prompt on your computer asking you to confirm). If yourespond in the affirmative, your order is executed.
• Your account is then debited for the price of the stock at the time of thetransaction multiplied by the number of shares you bought, plus thebroker’s commission. If you don’t have enough cash in your account tocover the full cost, the broker sends you a bill that you must pay withinthree business days.
Before shopping around for a broker, you will be far better prepared tochoose one if you have already determined your financial goals and objectivesand prepared a personal financial profile including your income and assets,your debts and obligations, and your risk tolerance. (These issues were ex-plored in Chapter 5.)
The spectrum of firms available to you is vast. Some firms have huge re-search departments, others specialize in particular types of companies, andothers essentially serve as order takers. Generally, the more guidance youneed from a broker, the higher the broker’s fee.
Later in this chapter, we’ll compare the major types of brokerage firmsfrom which you can choose and explore the relatively new phenomenon ofonline trading. But first, let’s finish covering the basics that pertain to all bro-kerage firms.
COSTS
Trading fees aren’t the only costs associated with brokerage firms. Youneed to explore the following before being able to make a fully informed de-cision about the cost of doing business at any firm (every brokerage has dif-ferent terms and conditions for opening an account):
• What is the minimum deposit or balance needed to open the account?(This ranges from thousands of dollars to nothing.)
• What other costs are involved in opening an account? Are transfer feesapplicable if you already have a broker?
84 D O N ’ T P L AY I N T H E S T R E E T

• What are the maintenance fees associated with the account and howoften will they be assessed?
• Is the commission truly a flat rate or are there different rates depend-ing on whether the trade is a market order or a limit order? (See Chap-ter 4 for an explanation of the different trading options available toyou.)
• Are there extra costs associated with high-volume trades?• Are discounts available for active traders?• Are there fees for inactivity or penalties for not maintaining a mini-
mum balance?
FOLLOW-UP QUESTIONS
Once you’ve narrowed down your selection to a few brokers, you shouldtalk with each broker in person or on the phone (unless the brokerage isstrictly online). Make sure you get along with the financial professional. Also,make sure that he or she understands your goals and risk tolerance.
The SEC suggests you ask the following questions before hiring an invest-ment professional. (If you are not comfortable asking all of these questions,you can verify most of this information online; see the sidebar about the SECand NASD Web sites for more information.)
• What experience do you have, especially with people in my circumstances? • Where did you go to school? • What is your recent employment history? • What licenses do you hold? Are you registered with the SEC, the NASD,
or any individual states? • What products and services do you offer? • Can you only recommend a limited number of products or services to
me? If so, why? • How are you paid for your services? What is your usual hourly rate, flat
fee, or commission? • Have you ever been disciplined by any government regulator for un-
ethical or improper conduct? • Have you been sued by a client who was not happy with the work you did? • For registered investment advisers: Will you send me a copy of both
parts of your Form ADV? (Part 1 of the ADV has information about the
Picking a Broker Who Won’t Make You Broker 85

advisor’s business and whether they’ve had problems with regulators orclients. Part 2 outlines the advisor’s services, fees, and strategies.)
BEFORE SIGNING ON THE DOTTED LINE
Three critical decisions must be made and spelled out in the applicationagreement before you sign it:
1. Who will control decision making regarding your account? (It shouldbe you unless you give discretionary authority to the sales rep.)
2. How will you pay for your investment? (Will you maintain a cash ac-count or will you open a margin account?)
3. How much risk will you assume? (You specify your overall investmentobjective in terms of risk.)
When establishing an account online, the broker may need you to mailcompleted application form with your signature.
Here’s an important alert from NASD: When opening a new account, thebrokerage firm may ask you to sign a legally binding contract to arbitrate anyfuture dispute that you may have with your broker, meaning you cannot suethem. However, federal securities laws do not require that you sign such anagreement. If you don’t sign the agreement, you still may opt for an arbitra-tion process to settle a dispute for damages; but signing such an agreement
86 D O N ’ T P L AY I N T H E S T R E E T
F o r M o r e I n f o r m a t i o n
For additional information about checking out brokers and advisors, visit theSEC Web site at <www.sec.gov/investor/brokers.htm>. Also, you may investigateyour prospective or current broker at the National Association of SecuritiesDealers (NASD) Web site at <www.nasd.com>. Virtually every broker/dealer inthe United States that conducts a securities business with the public is requiredby law to be a member of NASD. If you have problems or complaints relating toa broker, contact NASD’s dispute resolution forum either online or by phone toll-free at 800-289-9999.
The NASD Web site also lists prohibited conduct by brokers.

means that you give up the right to sue your broker and the firm in court. Re-member, you have the right to refuse to sign this agreement.
THE NITTY GRITTY
An economist is an expert who will know tomorrow why thethings he predicted yesterday didn’t happen today.
LAURENCE J. PETER, author of The Peter Principle
Now let’s get down to the nitty gritty of how to choose a broker that’s rightfor you. Then we’ll explore the relatively new phenomenon of online trading.
Two Major Brokerage Types
To narrow the field, let’s look at the two major types of brokers fromwhich you can choose:
1. Full-service broker. This type of broker costs much more, justified by theiradvice based on the firm’s research and analyst reports, claims to offerclients greater access to initial public offerings (IPOs) because theirfirm has investment and underwriting branches, solicits business, andis paid mostly by commission—meaning they’re compensated not ac-cording to how well your portfolio performs but how often you trade.(Examples: Merrill Lynch, Morgan Stanley Dean Witter, SalomonSmith Barney.)
2. Discount broker. This type of broker charges quite a bit less because youtypically research and choose investments by yourself, though dis-counters now offer more research online and personalized attentionthan in the past. Discount brokers usually don’t solicit business, chargeclients fees instead of commissions, and makes money by doing busi-ness in volume, counting on their lower prices and reliability to gen-erate more trades. (Examples: Fidelity, Charles Schwab, WaterhouseSecurities.) A subset is the deep discount broker for large-volume transac-tions; these offer rock-bottom rates with no customer support.
Online firms also come in two varieties: firms with offices enabling face-to-face or phone interaction, and virtual firms with no physical presence. I’ll
Picking a Broker Who Won’t Make You Broker 87

address investing online later, but first, let’s continue with the two main kindsof brokers—full-service and discount.
The most obvious differences between a full-service and a discount bro-ker are:
• The level of customer service and personalized advice (more is offeredby full-service brokers but discount brokers often have better and moreintuitive Web sites)
• Whether the price per trade is based on commissions or fees
Okay, let’s look deeper into these brokerages and their differences.
Full-Service Brokers
Full-service brokerage firms charge much higher commissions that theyjustify with the benefits they provide, such as a responsive customer service de-partment, account management options (e.g., providing credit cards andmoney market funds that you can use as a checking account), and insider ad-vice on stocks from their brokers based on research reports prepared by theirin-house analysts.
Large firms have vast resources to hire “star” analysts who research thepast performances and assess the future prospects of companies (especiallyones that are clients of their firm’s investment banking department). Theirbrokers pass the golden tidbits from these reports on to their individual cus-tomers. In essence, you pay a higher commission for the expertise that comesfrom their advice. Of course, if the advice is sound and free of conflicts of in-terest, the higher fees may be worth it. After all, the advice you’re getting fromyour broker is based directly on that of analysts who have diplomas boastingMBA degrees from prestigious business schools.
Notice that I emphasized if they could guarantee that their advice issound and free of conflicts of interest. But this is rarely the case in a large bro-kerage house because the broker’s advice is based on the assessments of theirin-house analyst who’s under duress to please corporate clients with buy rec-ommendations. Earlier, we explored why analysts’ advice is so tainted. Whenthe Chinese walls were in place, departments were supposed to be disciplinedenough not to “cross the line” into each other’s business, but we discoveredthat those walls came tumbling down, so we know their research is biased. The
88 D O N ’ T P L AY I N T H E S T R E E T

ones channeling the analysts’ recommendations are the firm’s brokers whoserve as the individual investors’ lifeline to the firm.
If an analyst’s job is now akin to that of a lawyer—an advocate for hisclient—then the broker can be likened to a car salesperson. To carry the anal-ogy further, it’s the broker’s job to smooth-talk you into buying a car off thelot. If you buy any car on the lot, the broker and the dealership get a com-mission, but if you can be steered instead to buy the car manufactured by theirmost influential client, then all the parties on their side benefit. Ultimately, it’sof little concern to the firm that you wind up with the best car for your needs,as long as they’ve dazzled you enough to make the purchase they wanted youto make. Insert “stock” instead of “car” in this paragraph and you get the idea.
The reason why the recent Merrill Lynch scandal erupted is not becauseanalysts gave favorable recommendations to stocks that they acknowledged ine-mails as “pieces of crap,” but because their brokers relayed those glowingrecommendations to their trusting customers. Subsequently, individual in-vestors lost billions of dollars with bogus stocks while the firm got rich offhuge commissions from their investment banking clients. Given that full-service firms invariably have an investment-banking branch, it’s impossible forfull-service brokers to avoid this conflict of interest because it’s built into theirsystem.
Let’s look at another “plus” that a full-service brokerage offers to individ-ual investors. Because these firms have investment banking branches, theirbrokers are much more aware of IPOs because their firm’s are often the onesinitiating them. In theory, this means that you have an advantage as a cus-tomer because you’re in a position to get tipped off when one of the firm’scorporate clients goes public and its stock is initially offered at a very lowprice. Early-bird buyers get in on potentially great investments before theprice skyrockets. But do you really have an advantage? Well, if you get first dibslike their preferred customers do, you can make a killing along with the firmsthemselves. But do you think you’ll get the same heads-up call about an IPOas a powerful deep-pocketed institutional investor who can buy hundreds ofthousands of shares? Let me put it this way: No.
Remember that table in Chapter 1 that listed the buy and sell recom-mendations of analysts at the major firms (7,033 buy to 57 sell recommenda-tions). Because of conflicts of interest between their departments, it is in theirinterest for you to buy stocks after the IPO ship has sailed and for you to holdon to those stocks even as the company tanks to keep their corporate clients
Picking a Broker Who Won’t Make You Broker 89

happy to the bitter end. If brokers ever told you and the masses to sell, theywould offend the corporate clients and lose their business. They can’t affordto lose business from their corporate clients, but they can afford to lose yours.
Through salaries and bonuses, the firm makes it clear that an analyst whopleases corporate clients rather than alienates them will go much further thana straight shooter. This brings us back to the broker whose job it is to relay theanalyst’s recommendations to you. Like analysts, brokers in a full-service firmmake their money through commissions and bonuses for selling you “prime”stock (prime to them), or convincing you to sell some of your best stocks soyou’ll have cash available to buy something more to their liking. By doing this,they are scratching a client’s back while raking in another commission onyour new buy. While brokers at any firm have incentives to boost their sales,the recommendations of those in the full-service firms carry more weight be-cause their firms are thought to offer “insider” information from their re-search reports and the opportunities to get in early on IPOs. Yet thesepromises don’t always pan out.
Let’s not forget the effect these higher commissions you pay to full-servicebrokers will have on your investments. If you pay $150 commission on a$1,000 stock purchase, your investment will have to earn 15 percent just tocover the commission you paid.
In order to compete with the popularity of discount brokers, full-servicebrokers now offer wrap accounts in which a broker manages an investor’s port-folio in exchange for a flat quarterly or annual fee (about 11/2 percent of theaccount’s value). This fee covers management expenses and commissions foran unlimited number of trades—as many trades as you and your broker wantto make. If you have an especially active account, a wrap account can bringthe cost down on a per trade basis closer to that of the discount firms. Thewrap also eliminates a broker’s incentive to rack up commission fees becauseall trades are paid for up front; therefore, the broker only trades when it is ad-vantageous to you. (A wrap account often requires an initial investment of atleast $50,000 to $100,000—hey, the brokerages have to make sure that yourthe 11/2 percent fee based on the value of your account isn’t chickenfeed.)
If you go the full-service route, you might also ask about another type ofaccount that they may offer where their fee is based upon the value of your ac-count—therefore, it is directly tied to how well your account is performing.With this kind of account, the broker’s incentive is to increase your account’svalue because that’s how they make money.
90 D O N ’ T P L AY I N T H E S T R E E T

Discount Brokers
Discount brokerage firms function on a different business principle thantheir full-service counterparts. Instead of commissions, discount brokers usu-ally charge flat-rate fees with trades costing anywhere from a third to a fifth ofwhat a full-service firm charges. For example, Fidelity’s fee on a per-trade basisstarts as low as $14.95. Due to a discount firm’s lower costs per trade and loweraccount maintenance fees, you get fewer perks, little or no financial advice,and far less customer service than with the full-service firms.
Another big difference is that discount brokers do not have investmentbanking branches and few, if any, corporate clients, each of which dominatesthe full-service firms’ conflicted interests. Also, individual brokers at the dis-counters are often paid a flat salary for their work (with bonuses more oftenbased on results of offering good stock tips that benefit their core clients—in-dividual investors), and therefore do not have the incentive to push somestocks over others. In other words, there’s less bias involved.
Based on these two facts alone—lower fees and less likelihood of conflictsof interest—discount brokers should be more attractive to you than the full-service variety.
There is a subclass of discount brokerages known as deep discount brokers.Basically, these firms offer the lowest prices per trade with even fewer frills. Adeep discount broker might be a good choice for those making a high num-ber of trades per month (i.e., for day-traders as opposed to investors), how-ever, if you make a moderate number of trades per year, then the cost pertrade should only be one of your considerations. A discount broker is often abetter choice because they offer some degree of customer service should youneed to call about a problem or occasionally want to meet face to face at abranch office (and they’re more likely to be well-established than some deepdiscounters might be).
Deep discounters conduct their business exclusively online to keep theiroverhead down.
The point of this book is to empower you as an investor (with an obviousemphasis on stocks) so you can take charge of your financial destiny. I wantyou to establish a comfort level to make most, if not all, of your investment de-cisions. Therefore, you don’t need a full-service broker if you are capable ofmaking your own choices.
When shopping for a broker, you’re likely to hear disparaging and con-descending remarks about discount brokers from the big full-service guys.
Picking a Broker Who Won’t Make You Broker 91
While it is true that you’ll get a lot more hand-holding from a full-service firm,I don’t think that it’s worth the cost or the risks of being led down a primrosepath.
Eeeny Meeny Miney Mo: Full-Service or Discount?
For investors who have a solid understanding of the market, feel confi-dent that they can conduct their own research, have the tools available to rec-ognize solid stock choices, and have a few hours each month to devote tocontrolling their financial destiny, I strongly suggest that they bypass the bigcommission and conflicted advice from a full-service broker.
If this profile describes you (and it should with the aid of this book), thenthe discount broker model was built for you: You can trade online and stillhave customer service at your disposal when you need it. Remember, a dis-count broker’s customer service people do not pick stocks for you. They arethere to answer questions and solve problems that may arise.
Trading Online
Trading online refers to the method of placing orders via the Internet tobuy and sell securities, including stock, instead of placing orders by commu-nicating directly with a broker by telephone or in person.
Though most full-service brokerages now have online capabilities, theircosts for trades are invariably higher than those of discount brokerages becausediscounters generally only charge for services that you use. From now on,when talking about online investing I will be referring to discount brokers be-cause they offer lower cost per trade and less reliance on recommendationsand customer services.
Before we discuss online trading, I must warn you about the temptationto “overtrade” by trading too frequently or impulsively without considering in-vestment goals or risk tolerance. Overtrading can affect investment perform-ance, raise trading costs, and complicate your tax situation. It’s empoweringto have the ball totally in your court but be aware that with freedom comes responsibility.
Many online brokerages offer research tools. Some larger ones even havetheir own analysts and researchers who post reports about companies or mar-ket sectors. Because discount firms theoretically have no corporate clients to
92 D O N ’ T P L AY I N T H E S T R E E T

impress, there’s a higher likelihood that their recommendations are less bi-ased. That being said, any report posted by online brokers should not be usedas the sole determining factor in your investment decision. But if tools aremade available online, you may as well utilize them and take their recom-mendations with a grain of salt.
If you’re a highly active trader, you should explore if there are discountsavailable to you, or if there are account options offering you a better deal.Some accounts charge a monthly fee instead of a per-trade rate.
Also, remember that the lowest per-trade cost advertised is almost alwaysfor market orders (see Chapter 5). If you want to place a stop or limit order,expect the price to be higher. The reason for this is simple: orders other thanmarket orders require more attention from a broker, and therefore higherprices are charged.
When shopping around for an online broker, you’ll come across many dif-ferent deals and packages available, as well as varying initial deposit amountsrequired. You should take the time to look at various options and choose theone that suits your needs.
I won’t recommend any particular online brokers in this book (I havepreferences but my objectives and needs are different from yours). Also, Iwant to assure you that I have no ulterior or financial motive to recommendone online broker over another. Instead, I’ll refer you to three independentWeb sites that are either affiliated with the government (SEC and NASAA) orobligated not to show preferential treatment because it represents all broker-age firms (NASD). These Web sites not only offer great articles and tips aboutonline trading, but they also provide links to other sites that offer independ-ent ratings and rankings of online brokerage firms.
• SEC (Securities and Exchange Commission): <www.sec.org>• NASAA (North American Securities Administration Association):
<www.nasaa.org>• NASD (National Association of Securities Dealers): <www.nasd.com>
Some of the links on these sites will take you to other sites that offer com-parisons of different firms’ testimonials and user reviews. While I would neverrely on the validity of a company or broker purely based on user reviews (re-member online message boards can be manipulated and corrupted), the ser-vices that offer these comparisons can be valuable tools to use when shoppingfor a broker. For example, one site rates brokers based on a dozen objective
Picking a Broker Who Won’t Make You Broker 93

criteria such as ease of use, customer service options, track record, and coststo the consumer.
Before signing up for an online brokerage account, you need to makesure you understand exactly what customer service options are available toyou. Can you call up the brokerage and ask an actual person questions ontechnical or trading issues? How responsive was that person? Does the firmoffer you a way of placing trades over the telephone as well as online in caseits network goes down or you don’t have access to a computer? (If you needto sell stocks ASAP for whatever reason, the last thing you need is a computerglitch or not have access to a computer when the trade is urgent.)
Once you’ve chosen an online broker, you’ll need to sign up for an ac-count. While some brokers seem to offer immediate access online, most re-quire that you send financial information with a signature and a check for theinitial deposit amount before you can actually begin trading. This process cantake a little time, so be aware that, in most cases, you can’t just sign up andbegin trading the same day.
The process of making a trade is fairly straightforward. Once you have anaccount, you use funds within your account to buy stocks of your choice (orhave funds added to your account when you sell stocks). All you have to do isselect the stock you want to buy or sell, the number of shares, and the type oforder (e.g., market or limit).
After you’ve submitted your trade, wait to receive a confirmation. If youdo not receive one immediately, do not resubmit the order. It is possible thatthere’s just a delay in the server giving you a response. If you inadvertentlyplace a duplicate order, you might end up buying twice the number of stocksyou wanted. The same applies to waiting a sufficient amount of time to ensurethat a cancellation was submitted; give it a chance to go through.
When trading online, you need to be especially vigilant when buying orselling highly volatile stocks. Because online trading isn’t automatically pro-cessed (contrary to many people’s beliefs), by the time the order gets routedto the floor of the NYSE or through the order processing network of one ofthe other markets, the price that was quoted at the time of your order may bedifferent from the current price. Unless you place a limit order, the price isnot guaranteed. While the broker is under an obligation to perform “due dili-gence” in processing your order as quickly as possible, there is no guaranteeyou will be granted the price rate that you saw quoted online.
Also be aware of the hours during which the firm will actually execute orders for you. While you can submit orders through most online brokerage
94 D O N ’ T P L AY I N T H E S T R E E T

firms 24 hours a day, if the market is closed at the time, your order will not beplaced until the next business day. For example, orders can only be processedat the NYSE between 9:30 AM and 4:30 PM Eastern time. However, markets of-fering “after hours” trading (often referred to as “futures”) such as Nasdaqand OTC (over the counter), your trade can go through a couple hours beforeand after traditional NYSE hours.
Behind the Scenes of Your Online Stock Trade
Online trades are not handled automatically at the bat of an eyelash. Re-member earlier in this chapter when I told you that one has be a licensed se-curities trader to place an order? While it seems like you’re placing an orderdirectly with the market itself when you’re trading online, the order still hasto go through a broker (a real human and his or her computer). Figure 6.1gives you a play-by-play example of what happens when you place an order on-line. As you can see, the trade doesn’t happen instantaneously.
Another thing to look out for when shopping for a trading firm is how itconfirms your order. Make sure the firm’s notification policy is understand-able and serves your needs. Depending on how your online broker works, youmay not get a clear indication that your order has gone through. If you goahead and resubmit the order, you may actually be placing multiple orders. AsI stated earlier, you may end up multiplying your order if you resubmit.
Picking a Broker Who Won’t Make You Broker 95
FIGURE 6.1 How an Online Order Is Placed
You submit an order for shares of Coca-Cola stock.↓
The order is received by the brokerage firm and routed to your representative.↓
Your broker takes the order and places it electronically, as soon as possible,with the NYSE.
↓The brokerage firm’s representative on the floor receives the order
and places the order with the specialist handling Coca-Cola.↓
The trade is made and your firm’s representative sends a message back to your broker.↓
You get confirmation from the brokerage firm that the trade was successful (or notice of a problem) along with the details of the trade
(shares traded, time of execution of the trade, cost to you, etc.).
You need to remember that when you’re trading stocks that are volatileand moving quickly, the prices might be dramatically different in the marketby the time your order has been routed there. As long as you understand thisand you make effective use of limit and stop orders when needed, your onlinetrading can be executed as you intended.
As I suggested earlier, if you need outside help when the stakes are highor you want to make sure you’re putting together a well-rounded portfolio,then by all means seek guidance. But instead of paying an expensive full-service broker year-round to be available if and when you might have ques-tions, you can hire an independent analyst or financial planner and pay themon an hourly basis to gain their unbiased advice on any particular problemsyou’re having. You can pay the advisor a one-time fee (hopefully he or she wasvery helpful) and that’s the end of it.
OVERVIEW AND OBJECTIVES
Risk comes from not knowing what you’re doing.
WARREN BUFFETT, chairman, Berkshire Hathaway
In this book’s introduction, I listed the objectives that any individual in-vestor should embrace to become an independent and successful trader. Sofar, I have covered two major areas and their intrinsic objectives:
1. Identifying institutions that are inherent players in the stock marketand the pitfalls in dealing with those players due to their conflicts ofinterest
2. Understanding the ABCs of investing and trading
Though these two areas will be revisited, we’re now ready to focus on thenext topic: Learning about the criteria and tools to confidently choose yourown investments—namely, stocks.
In the last portion of this book, I will concentrate on the following objec-tives that pertain to identifying stocks to buy, sell, or put on your radar screenfor future consideration.
• Taking the guesswork out of trading stocks• Grasping what really drives stocks up and down
96 D O N ’ T P L AY I N T H E S T R E E T

• Knowing what criteria to look for to identify great opportunities• Making trading choices simply, quickly, and reliably• Pinpointing entry and exit signals (when to buy and sell) for your trad-
ing style• Increasing your profits and stopping your losses• Establishing a method of trading that yields consistent positive results• Managing your stock portfolio in minutes per day• Making money in bull and bear markets
Let’s go for it.
Picking a Broker Who Won’t Make You Broker 97


C h a p t e r
99
7
Learning is about more than simply acquiring new knowledgeand insights; it is also crucial to unlearn old knowledge that has outlived its rele-vance. Thus, forgetting is probably at least as important as learning.
GARY RYAN BLAIR, president, GoalsGuy Learning Systems
In the mid-1980s, I worked in sales for Mo-torola where my father was a manager. I vividly remember my father tellingme, “If you take care of the customer, the customer will take care of you.” Atthe time, I was young and just trying to make rent, and, frankly, I was moreconcerned about taking care of myself than my customers. Fortunately for thecustomer, I was selling quality Motorola products. I was out for myself first andforemost, so I never paid much attention to my father’s advice.
However, when I became an entrepreneur—owning a brokerage firm andnow running an investment software company specializing in service after thesale—my father’s advice not only made sense but resonated with me. Satisfiedcustomers do take care of you and help you succeed. They not only provideyou with business but they refer their friends to you as well. My father’s advice
THE GENESIS OFWIZETRADE™
New Approaches in a New World of Investing

was so basic and ingrained in me now that I’m continuously amazed that somany companies just don’t get it.
The investment software I created is Wizetrade™. For the rest of the book,I will be using the easy-to-read charts from Wizetrade™ for examples andillustrations. After all, I personally developed Wizetrade™ with all of the ob-jectives for successful trading by individuals in mind that I listed in the previ-ous chapter.
I want it to be clear that by using Wizetrade™ for illustrative purposes inthis book I am not trying to sell software to you. My goal is to empower you toinvest and trade on your own, regardless of what tools you use. After all, youbought this book—not the software—so I’m trying my best to offer great ser-vice to you, the “customer,” in that capacity. This book is meant to be of greatvalue to you whether or not you have the Wizetrade™ software. This book willpave the way for you to confidently make successful investments.
The old methods of investing don’t work anymore. They had their placebefore the information and computer age, but today investing is actually moresimplified: It’s about buyers versus sellers. Knowing this everything else fallsinto place. Wizetrade™’s charts simply help me to illustrate this point andshow you how you can achieve all the other objectives for successful tradingthat I have laid out.
If you take from this book the theory and belief of supply and demandalong with the knowledge that will allow you to be a confident and inde-pendent investor, then my mission has been successful.
When I owned my brokerage firm, I was very frustrated watching my cus-tomers lose money. It was agonizing to see individual traders—my clients—getting devastated in the marketplace with little reliable guidance frombrokers and analysts. (These customers were hardly in the mood to “take careof me.”) I wanted to provide far better service than that. However, my Wize-trade™ software didn’t just magically pop up one day in a box.
HOW WIZETRADE™ WAS DEVELOPED
Before I ever owned a business, my early investing experience involvedlosing about half of my own portfolio with a broker. So I wasn’t too excitedwhen my two brothers who are brokers approached me to capitalize a bro-kerage firm. My brothers tried to persuade me with this argument: Let’s get
100 D O N ’ T P L AY I N T H E S T R E E T

on the other side of the table—own the casino so to speak—so we’ll makemoney whether the customer wins or loses. I decided it would be better to ownthe casino than be the one sitting slumped at a slot machine with a bucket ofnickels, so I capitalized a large brokerage firm in Dallas.
I continued to actively trade full time. I bought and sold just like the text-books said using the so-called “conventional wisdom” and employing themethods I learned at very expensive seminars. I made money at times but Ilost a whole lot too.
Most important, I never felt comfortable with what I was doing. I watchedCNBC, Market Watch, Moneyline, and every financial show I could tune into. Iread trading books, newsletters, and stock charts until I was blurry-eyed. I feltlike a deer caught in the high beams of an eighteen-wheeler. I kept trying tofigure out why most people lose money trading while the big boys on WallStreet just keep on chalking up their profits.
Then a phenomenon occurred while I owned that firm that changedeverything in the world of stock trading—the Internet.
As recently as the late 1980s, the information superhighway was not avail-able to individual investors. Instead, we relied on reading the business sectionsburied in Newsweek or other weekly magazines. There was really no reason tokeep more abreast than that because, in the 1980s and the decades before,the market went up only 10 or 15 points on a good day; on a bad day, it wentdown 10 or 15 points. Back then, it was usually a slow steady climb all day ora slow steady drop all day.
But with the sudden availability of the Internet to millions of people inthe 1990s, any individual with a PC had access to a superhighway of instant“real-time” financial news and information and the added maneuverability oftrading online at the slightest whim.
Early in this new era, a new breed of individual investors known as day-traders started to emerge. These individuals fed on the constant stream of in-formation to make several trades a day; sometimes, several trades an hour.Initially, many were successful. They were like jet skiers zooming around acruise ship (the old-school market makers), and day-traders were making a lotof money without many waves.
Then the media started to shine a light on these unusual blurry-eyed trad-ing creatures who seemed to sweat caffeine and feed intravenously off multi-ple computer screens. When the word got out about the success of the earlyday-traders, the rush was on. It seemed everyone and his brother started day-
The Genesis of Wizetrade™: New Approaches in a New World of Investing 101
trading. The vast influx of individual traders jumping on the online tradingbandwagon fed by instant information available on the Internet was one ofthe contributing factors that led to the volatility of the market today.
Unlike a few years earlier, when the market would typically go up or downonly 10 to 15 points a day, just the Dow can now jump up or down hundredsof points every day. It doesn’t much matter if there’s a negative or positiveopening because the market can go up and down up to 50 times a day.
Toward the end of my involvement with the brokerage firm (and beforethe late 1990s bubble/bull market), the market was so volatile that 85 percentof my customers were losing money. We would have 30 people a month wholost so much money that they would drop out of the market. They would bereplaced with 30 more “innocents.” It was a revolving door of customers andI hated it. It seemed unethical to bring customers on board knowing that thevast majority of them were going to lose money while we profited from thecommission on their trades.
I became increasingly frustrated and finally overwhelmed watching peo-ple investing their hard-earned money in the stock market only to lose theirsavings that was meant for their retirement. But at the time I wasn’t sure howI could better serve these investors.
Then a year before I left my brokerage company, a computer program-mer who was a customer came into the office. He had designed an investmentprogram for a major brokerage firm. His program used summation formulasand algorithms.
His computer program was really just a numbers game. Though very in-terested in its capacity, I saw lots of inconsistencies and erroneous summationformulas plugged into it. I suggested some changes that could better the pro-gram, but those changes were rejected.
But I wanted to do far better for individual investors, especially those I sawbeing devastated in the marketplace. I also envisioned making this tool acces-sible to investors directly so they could benefit without going through a bro-ker. The broker already had the advantage. I wanted to “take care of thecustomer.”
I started developing my own summation formulas and algorithms using50 technical indicators (there are literally hundreds of them but each one has its strengths and weaknesses so I selected only the best). Over the next few years, I spent hundreds of thousands of dollars building a successful trad-ing platform. I hired the best and the brightest software engineers in the
102 D O N ’ T P L AY I N T H E S T R E E T

country to take incredibly complex algorithms and create a simple but effec-tive program that would help people make money investing in the stock market.
Eventually, we chose seven key data factors for two summation formulasto determine the buying and selling dynamics for every stock. (I will be morespecific about these formulas in the next chapters.)
Like the computerized programs used by the big boys on Wall Street, I applied hard unemotional information about supply, demand, volume, andnumerous algorithmic indicators to create an intricate mathematical for-mula that could be applied to any stock, any time, in any market. To keep up with the big boys, it was vital that the program run thousands of simulta-neous calculations applying a precise mathematical formula to help inves-tors take emotion out of the investing process. This technical, computerizedapproach is known as “program trading” and it operates at a level that nohuman brain can process. (Program trading is explored much more in thenext chapters.)
Technology leveled the playing field for individual investors, but it was intimidating when it first became available because it was too complex andoverwhelming. I realized that I needed a simple way for individuals to easilyunderstand the output of the complex calculation technology. I decided touse red and green lights to signal entry and exit opportunities, and Wize-trade™ was born.
Now I’m fulfilling my mission to take care of the customer. Again, youdon’t need Wizetrade™ to be successful, but its charts in this book will help meshow you what works—and why—in the wonderful and sometimes wild worldof investing in stocks. I promise this insight will serve you well.
Thanks for the advice, Dad.
BUYERS AND SELLERS/SUPPLY AND DEMAND
What is the most influential reason for a stock’s value to go up or down?It is the number of stocks being bought versus the number being sold.
The value of a stock rises and falls based on the amount of demand for it.When the demand for a stock is high, buyers bid higher prices to entice sell-ers to sell it to them. Conversely, when demand is low, sellers have to lowertheir prices to attract willing buyers.
The Genesis of Wizetrade™: New Approaches in a New World of Investing 103

The simple dynamic of supply and demand—buyers versus sellers—is themost important reason a stock’s price goes up or down. Here is the bottom line:
• If there are more buyers than sellers, a stock’s price goes up.• If there are more sellers than buyers, a stock’s price goes down.
Plain and simple.Like any market, the stock market depends on buying and selling inven-
tory. Its inventory is stocks.The simple matter of buyers versus sellers (supply versus demand) has been
a constant since the beginning of mankind when one cavemen indicated “Iwant what you have” and another one responded “How much do you want it?”
But how do you track the buyers and sellers to your advantage?
PROGRAM TRADING
Have you ever felt that the big boys on Wall Street knew something youdidn’t? That there was a secret to what works on Wall Street and what doesn’t?That a simple method exists that instantly tells them when to buy or sell astock regardless of how the rest of the market is performing?
I’m going to break the code of silence and let you in on the secret here.In short, I’ll show you how they take the guesswork out of trading. There re-ally is a secret to trading on Wall Street—a secret used by big institutions andWall Street brokerage firms every day. It’s called program trading. Major insti-tutional investors know that to be really successful trading stocks, you must becompletely programmed at a level no human brain can process.
How did the big boys solve the problem? They program their computersto make the decisions for them. They use hard unemotional information aboutsupply, demand, volume, and numerous algorithmic indicators to come upwith an intricate mathematical formula that can be applied to any stock, at anytime, in any market. Then they let their computers run thousands of simulta-neous calculations to buy or sell stocks. They literally take the emotion out ofbuying and selling and base their trading decisions on number-crunching for-mulas. Every day, big institutions let their computers buy, sell, and trade basedon what their programs are saying.
Computers triggered the stock market crash in 1987 when computerizedprograms all said “sell” at the same time. The big boys got out and left all the
104 D O N ’ T P L AY I N T H E S T R E E T

little investors like you and me holding the bag. To avoid another crash likethis, regulators placed trading curbs on institutions that force them to turn offtheir program trading software once the market moves too fast in one direction.However, regulators didn’t curb individual investors like you and me becausethey never thought we would have access to this type of sophisticated software.Fortunately, times have changed. Technology has leveled the playing field andaccess to these software programs has allowed us all to reap the rewards.
Why then do some Wall Street firms do better than others when makingtrading decisions? The reason is because a computerized program is only asgood as the data that’s fed into it and the formula each firm has developed tocrunch its numbers. Different firms choose different criteria depending ontheir theories on what moves the market. Because many firms depend on whatI strongly consider to be misleading figures (e.g., fundamental analysis, PE ratios, or superfluous technical data), I contend that you can do better thanthe vast majority of “experts” if you focus on the most reliable criteria for stockanalysis.
TECHNICAL ANALYSIS
Let’s make a distinction between technical analysis and fundamental analysisup front, and let me state that I am a strong proponent of technical analysis.
Fundamental analysis relies on sales, earnings, and growth. No doubt youhave heard horror stories about companies that report great sales, earnings,and growth, yet the price of their stock still goes down. Could it have some-thing to do it with the public’s distrust that the fundamentals are absolutelyaccurate because these figures are reported by the companies?
Technical analysis is a method of evaluating stocks by relying on indisputablemarket data such as price, volume, and buying and selling interest. The priceof a stock is subject to the market pressures of supply and demand—the bot-tom line for technical analysts to buy, hold, or sell. Technical analysis has beenused by major institutions and top Wall Street analysts for years as a key indi-cator of when to buy and sell stocks. Using technical analysis keeps you fromletting your emotions rule how you invest your hard-earned money. Wize-trade™ utilizes carefully chosen technical analysis criteria.
The psychology of the investing crowd constantly seesaws between emo-tions of fear and overconfidence. In a volatile market, panic overrides duringthe bad times while greed is foremost during the good. The charts of a tech-
The Genesis of Wizetrade™: New Approaches in a New World of Investing 105
nical analysis program reflect this wavering psychology and the flow of cash inand out of each stock. Fundamental analysis disregards this psychology be-cause it is based only on sales, earnings, and growth whether investors are ac-tually buying or selling a company’s stocks.
In the past couple of years, more and more individuals have taken advan-tage of the benefits of investing based upon technical analysis. The advancesin technology have allowed the software and investment industry the ability tocreate software programs that are easy to learn and use, effectively taking theguesswork out of investing.
When used according to the rules, technical analysis can become the bestthing to ever happen to your financial future.
Can Individual Traders Master Technical Analysis?
To be successful, individual investors need a technical analysis programthat is easy to use so, in a short amount of time, they can understand and con-fidently use it effectively to increase their potential net worth.
Wizetrade™ was created to present technical analysis in a simplified chart-ing system, incorporating green and red light indicators much like the onesyou find at street intersections. This system takes into account seven criticaldata factors to determine point of entry, point of exit, and trend analysis.
For the record, here is how Wizetrade™ works.
• Wizetrade™ begins by gathering the first four of the seven critical datafactors—the open, high, low, and close of each of eight time intervals.(These eight time intervals are different for each trading strategy, rang-ing from long term to day trading. Three time intervals that are constantsare month, week, and day; the five remaining shorter-term incrementsdiffer with trading strategies.)
• Then it compiles the next two of the seven critical data factors—the uptick and down tick for each of the eight time intervals.
• Then it gets the last, and most important, of the seven critical data factors—the historic data, which is exponentially weighted to volumebecause of the intrinsic price properties relating to the stock’s priceperformance.
• Wizetrade™ then takes these seven critical data factors and integratesthem into two proprietary summation formulas—the X + Y (represented
106 D O N ’ T P L AY I N T H E S T R E E T

by the green lines and lights) and the X − Y (represented by the redlines and lights).
• Both summation formulas are then calculated by an algorithm, whichis then displayed by either a red or green light indicator.
I realize that for most of you this mumbo jumbo tech talk starts to soundlike the trumpeting “bwah bwah bwah” of the adults in a Peanuts cartoon. Yetthe red light/green light indicators in Wizetrade™ could not be any simplerto interpret. Does the average investor really care about all of the details ofthe algorithms that go into arriving at these simple indicators? No. Investorsshould be aware that the program is sound in logic and assessment, but whatreally matters is that the program actually works and is simple enough to un-derstand and use.
The Wizetrade™ algorithms work for any type of trader. Whether thetrader is looking at holding a position for months, weeks, days, or minutes,the exact same key indicators are used.
The long-term/monthly chart in Figure 7.1 is a classic example of the ac-curacy and simplicity of the Wizetrade™ system. (In the following figures, thered lines in Wizetrade™ charts appear as black lines, and the green lines ap-pear as gray.)
In the chart in Figure 7.1, Wizetrade™’s trend of ImClone reflects twotrading opportunities for the long-term investor (in this case, long-term refersto months, not years).
• In March of 2001, a buy signal was given at $31.63. The sell signal wasgiven in June 2001 at $54.30.
• Another buy signal occurred in July 2001 at $42.61, and with the sellsignal in December 2001 at $71.98.
The per-share profit on these two trades equates to $52.04. If the individ-ual trader bought as few as 100 shares, the profit equates to $5,204 or a 70 per-cent return on just two trades. The investor had a signal to get out of ImClonebefore it fell sharply, thus avoiding the loss felt by other investors who held onto it during its major drop.
At it’s height in November 2001 (as of this writing), ImClone stock wasworth $75.45 per share. Based on Wizetrade™’s technical analysis, there was along-term signal to sell ImClone (the red/sellers line overtook the green/buyersline). If someone had ImClone stock in their retirement account in Novem-
The Genesis of Wizetrade™: New Approaches in a New World of Investing 107

ber 2001, they could have protected their nest egg by utilizing Wizetrade™’sindicators and getting out of the stock, keeping roughly $67 per share morethan what they would have gotten for it six months later in May 2002.
Here’s a thought: The latest data shows that individual investors make up39 percent of the market. If the majority of these investors were able to mas-ter the art of technical analysis and not let their emotions rule them, we maysee a more stable market.
ENTRY AND EXIT SIGNALS
For simplicity, there are three visual factors to easily identify entry andexit signals, as shown in the ImClone chart in Figure 7.1:
108 D O N ’ T P L AY I N T H E S T R E E T
FIGURE 7.1 Sample Wizetrade™ Chart

1. A fresh cross of red and green lines within one time frame (each verti-cal line on the chart equals one time frame)
2. A good angle of momentum (between 12:00 and 2:00 on a clock face forgoing long and between 4:00 and 6:00 for going short)
3. A strong separation representing stability between the buying and sellingpressure
These three factors are simple to identify and understand and you canquickly adopt this type of technical analysis.
There will be much more about these factors—called FAST™ (using ini-tials from fresh cross, good angle, strong separation, and the timing of enter-ing and exiting trades)—in the next chapter.
CHARTING THE COURSE
Let’s compare to a typical technical analysis chart used by the pros (shownin Figure 7.2) to the Wizetrade™ chart (shown in Figure 7.3).
The daily Wal-Mart chart in Figure 7.2 reflects some very important anduseful data. However, how simple is it for the average investor to successfullyinterpret this complex chart? Do you want to take the time to learn how to in-terpret this complex presentation of information?
Now, compare that chart to the one in Figure 7.3. This chart is the Wize-trade™ daily chart of Wal-Mart. It contains a lot of the same complex infor-mation of the previous charting system, yet the presentation of this data is laidout in a very simple format. It now becomes a matter of looking for the threevisual factors used to identify the entry and exit points—fresh cross, goodangle, and strong separation. Simple and accurate.
BASIC FOUNDATION FOR RECOGNIZING TRADES
It doesn’t work to urge people to think outside the box withoutgiving them the tools to climb out.
LAURIE DENNAVANT, 3M Health Care Systems
Until now, choosing stocks has been a complex, time-consuming task that,at best, was still a guessing game for the vast majority of individual investors.
The Genesis of Wizetrade™: New Approaches in a New World of Investing 109

Today, if you’re empowered with comprehensible tools to conduct real-timestock analysis instantly, then you can pick the best of the best as well as anyoneelse out there as long as you know what to look for.
We have already established the great dynamic that drives a stock up ordown: buyers and sellers, supply and demand. We also determined that pro-gram trading (using computerized systems) is the way to go because it pro-vides you with tools to conduct unemotional stock analysis and can computethousands of calculations simultaneously beyond the capability of any humanmind. It is the edge that’s needed by traders in today’s fast-moving markets.
110 D O N ’ T P L AY I N T H E S T R E E T
FIGURE 7.2 Typical Technical Analysis Chart for Wal-Mart Stores
Courtesy of StockCharts.com

First Things First
What good is a technical analysis system if the average investor can’t com-prehend and confidently use it to make choices about buying and sellingstocks to increase their net worth? An investor’s objective is to make tradingchoices simply, quickly, and reliably. You need to be able to instantly analyzestocks and confidently choose trades without being “paralyzed” by analysis.
An important capability provided by Wizetrade™ is the ability to quicklyevaluate and recognize whether a stock is a good trade or not. In Figures 7.1and 7.3, you saw illustrations of how ImClone and Wal-Mart were evaluatedwith Wizetrade™’s simplified system.
Regardless of what system you use, you need to be able to quickly check thestatus not only of stocks in your current portfolio but also ones you’re inter-
The Genesis of Wizetrade™: New Approaches in a New World of Investing 111
FIGURE 7.3 Wizetrade™ Chart for Wal-Mart Stores

ested in or just curious about. It is also imperative that you never enter into atrade without having an exit plan that covers every possible outcome whenthat stock inevitably fluctuates. Only then will you have the peace of mind thatcomes with having a plan.
The Three Wizemen™
With Wizetrade™ trend recognition software, your stock decision-makingprocess becomes as simple as “red light-green light.” Stop or Go? If there ismore buying pressure during a current time interval, the light is green. Ifthere is more selling pressure during a current time interval, the light is red.
The first filtering system for a potential investment is to have the three in-dicators for long term (the current month), mid-term (the current week), andshort term (the current day) all moving in the same direction. In Wizetrade™
vernacular, these three indicators (month, week, and day) are “in agreement”when all three are green or red—comprising the three Wizemen™.
If all three Wizemen™ are green, you might consider going long. In thiscase, long does not refer to trading long term but to buying a stock for anyamount of time with the intention of making money as it increases in value—as it gets longer, if you will. If all three Wizemen™ are red, you might consideranother kind of trade called shorting. I know shorting is a new concept to al-most all of you so there will be much more about shorting in Chapter 10.
Notice that in both cases I said “might consider”; again, these Wizemen™
indicators are your first filtering system, not your last. (Again note that the redlines appear as black, and the green lines as gray.)
In the Wizetrade™ trading screen in Figure 7.4, we can literally see in secondsthat the stocks for Verity (VRTY), Cablevision Systems Corp. (CVC), and Knight-Ridder (KRI) all have the three Wizemen™ in agreement—the month, week, andday indicators are all green. Quickly, you can recognize three possible long trades.The stock for Pep Boys–Manny Moe (PBY) is a candidate for a short trade.
The stock for Enzon, Inc. (ENZN) is giving mixed signals because theWizemen™ are not in agreement (one green light and two red lights) andshould be avoided for now. If the month, week, and day are not all the samecolor, the three Wizemen™ are not in agreement.
The more trends you have in agreement, specifically the long, mid, andshort term, generally speaking, the more conservative the trade is. Why?When the indicators on each of these trends indicate the same movement, itwill take a larger movement in the opposite direction to reverse that trend.
112 D O N ’ T P L AY I N T H E S T R E E T
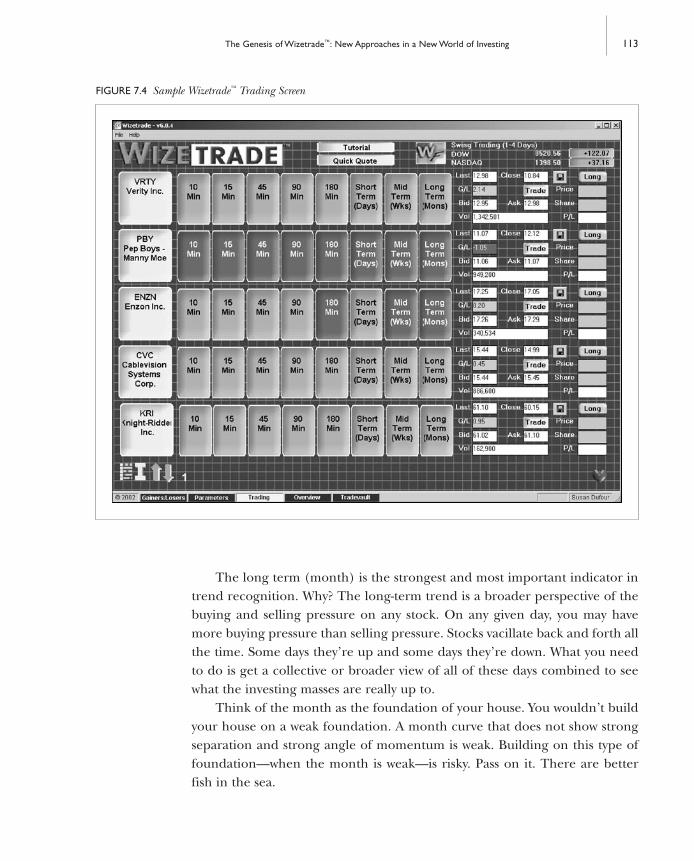
The long term (month) is the strongest and most important indicator intrend recognition. Why? The long-term trend is a broader perspective of thebuying and selling pressure on any stock. On any given day, you may havemore buying pressure than selling pressure. Stocks vacillate back and forth allthe time. Some days they’re up and some days they’re down. What you needto do is get a collective or broader view of all of these days combined to seewhat the investing masses are really up to.
Think of the month as the foundation of your house. You wouldn’t buildyour house on a weak foundation. A month curve that does not show strongseparation and strong angle of momentum is weak. Building on this type offoundation—when the month is weak—is risky. Pass on it. There are betterfish in the sea.
The Genesis of Wizetrade™: New Approaches in a New World of Investing 113
FIGURE 7.4 Sample Wizetrade™ Trading Screen

Trading Screen
The trading screen, like the one in Figure 7.4, gives you the ability notonly to look at the series of lights in eight time frames, but also to glimpse atthe most current price and the trading volume of a stock for the current trad-ing day. This screen gives you an overview of the direction in eight time framesfor any stock you choose. In fact, you can view five stocks at a time on onescreen. The constantly updated Dow and Nasdaq ticker can be found in theupper right-hand corner of all Wizetrade™ screens.
Figure 7.5 takes a quick gander at the information provided for each stockon the right-hand side of the screen. Again, this is not to toot Wizetrade™’shorn but to indicate to you the important up-to-the-second factors that youneed at your disposal when trading.
1. The last price at which the stock trades2. The gain or loss from the previous trading session3. The stock’s bid and ask prices4. The stock price at the end of the previous trading session5. The stock’s trading volume thus far for the current trading day6. The price at which you purchased the stock and the number of shares,
which allow you to track “real” trades or “paper” ones7. The color-coded real-time profit or loss of the trade (after deducting
execution costs)
Price per Share
At first glance, the current price of a stock is irrelevant to determiningwhether a stock is a good trade or not. The price alone does not indicatewhether a stock is a bargain or overpriced. After all, a $50 stock may be a greatbuy while a $20 stock may prove to be a stinker, or vice versa; it depends onthe particular stock. That being said, it is imperative that you have up-to-the-second quotes on bid and ask prices.
Taking nothing else into consideration, set your sights on stock priceswithin a range that fits your own budget and trading strategy. If your tradingbudget is limited, you may find lower-priced stocks to be more attractive be-cause you can buy more shares and diversify by buying shares in several dif-ferent companies. For example, if your total trading budget is $5,000, thenstocks costing $100 per share are probably too high for you because you can
114 D O N ’ T P L AY I N T H E S T R E E T

only buy 50 shares in that range and you don’t want to put all your eggs in onebasket by buying 50 shares of only one company. By choosing various stockswith share prices that average $20 apiece, you can buy 250 shares with thatsame $5,000 budget. (When budgeting, don’t forget those pesky broker com-mission fees that you’ll be paying for trades.)
However, some traders don’t feel comfortable trading stocks that are lowpriced (for example, those costing under $10). Again, it’s up to you and yourrisk tolerance. That’s why Wizetrade™ offers other parameters from which tochoose and various criteria to consider, which we’ll get to shortly.
Obviously, when you’re ready to buy or sell, you’re only interested in themost current prices being quoted—not what was quoted in yesterday’s paper.The two prices you need are:
1. Bid price. The highest price at which someone is willing to buy a stock.2. Ask price. The lowest price at which someone is willing to sell a stock.
The difference between the bid and ask prices is called the spread. For ex-ample, if the bid price is $15.00 and the ask price is $15.05, the spread is 5cents. The bid price is always lower than the ask price (hopefully only by pen-nies) so there is a profit margin for the market makers to make it worth theirwhile to be the middlemen for trades. If the spread is too high, then the stockmay be volatile and deserves further exploration (e.g., spiking volume indi-cates unusual trading activity and often influences higher spreads until thestock settles down).
If you want to buy a stock, look at the ask price because that’s how muchit will cost you to buy the stock. If you want to sell, look at the bid price becausethat’s how much other traders are willing pay you for your stock.
The Genesis of Wizetrade™: New Approaches in a New World of Investing 115
FIGURE 7.5 Sample Stock Data Provided on Wizetrade™’s Trading Screen

FAST™ (But Not Furious)
Be careful about the lure of green lights. They may prove to be weak orflat upon closer inspection. They should, however, be used as an encouragingfirst filter to investigate further when all three indicators (the three Wizemen™)are in agreement. Before making a trading decision, you need to identify thatthe movement is new, strong, and stable. To clarify this, we go to other charts.
For simplicity and quick recognition, Wizetrade™ provides three visualfactors you can easily identify when looking for entry and exit signals, as is ev-ident in the ImClone chart presented in Figure 7.1: fresh cross, strong angle,and strong separation (FAST™). Figure 7.6 highlights these three factors.
The fresh cross (1 in Figure 7.6) is when the green (solid) and red (dashed)lines first cross each other during the most pertinent time interval for yourtrading strategy. Entering a long trade, you look for the green line freshly cross-ing over the red one.
The fresh cross signals the beginning of a new trend. Why is it so impor-tant to enter a new trend? Simple: You want to ride the trend for as long as pos-sible by recognizing it at the onset, therefore increasing your profits. If youinvest two or three time periods after the fresh cross occurred, you might stillmake money—but not as much as the investor who jumped in and rode thewave when the fresh cross began. (You want to make as much money as pos-sible here, don’t you?)
An “embryonic cross” in which the lines have crossed but haven’t really es-tablished a trend, and yet signals that it’s too early to determine if the trendwill hold. Wait and see.
The good angle (2 in Figure 7.6) is represented by the angle of the greenline. When looking to go long, look for the green line to be on top of the red,pointing upward between 12:00 and 2:00 on a clock face. A good angle con-firms heavy buying pressure versus heavy selling pressure.
116 D O N ’ T P L AY I N T H E S T R E E T
FIGURE 7.6 The Three Factors of FAST™

Proper separation (3 in Figure 7.6) is represented by recognizable whitespace between the green and red lines, confirming the stability of the trade.It also confirms that the separation between the buying and selling pressureis significant enough to remain strong for a while.
If the green and red lines are close or converging (not separating as we’dlike), it is still a potential bounce situation (a bounce is when converging linesseparate once again and is as good as a cross), but if you try to anticipate abounce or a cross, you might as well anticipate a loss. Be patient and wait forthe buyer or seller momentum to choose sides. If you jump into a stock withan “I hope it works out” attitude, you’re in the wrong stock.
If a stock is moving sideways (when both the buying and selling are flat,resulting in no separation) and you still enter into this trade, you’ve just putyour money on hold and out of your hands. It’s better to use your tradingmoney elsewhere. Look for stronger signals.
Whether the trader is looking to hold a position for months, weeks, days,or minutes, the same key indicators of the three Wizemen™ and FAST™ areused. If you trade against the system, then you are at your own risk.
Ideally, you find a “freight train” when all three Wizemen™ indicatorsmake you exclaim “Wow!” A freight train is a stock that has maximum strengthand momentum where the month, week, and day all have increasing angle,separation, and momentum. The freight train analogy for trading longstrongly implies that the trend can’t be easily stopped because major buyingmomentum is in play (in the case of shorting, the selling momentum is veryprominent).
The “T” in FAST™ stands for timing—when exactly to enter and exit atrade. Timing is totally dependent on your trading strategy (for example, youenter a trade with a far different mind-set if you are monitoring it all day longas opposed to if you’re going on a month-long cruise and have no access to acomputer during that time).
The following trading strategies are fully addressed in Chapter 8, buthere’s a quick glance:
• Position/intermediate trader. One who enters a trade intending to holdthe stock for several weeks or a few months at a time.
• Swing trader. One who enters a trade intending to hold the stock for oneto five days.
• Active trader. One who enters a trade intending to hold the stock for nolonger than one day.
The Genesis of Wizetrade™: New Approaches in a New World of Investing 117

Trends as Friends
A lot of stocks have repetitive trend patterns. (Remember our ImCloneexample in Figure 7.1, moving up and down like a roller coaster, offeringthree buy and sell opportunities before it hit the skids?) For example, Com-pany XYZ’s stock might have a recognizable trend about every three weeks inwhich a fresh cross occurs every three weeks or so and it repeats itself againand again. This is more common than you might think.
If history repeats itself that consistently for a particular stock, you mightbe successful trading with that cyclical trend. Of course, you also want as manyother factors in play as possible to guide you so you don’t get burned on ahunch based solely on past performance. But don’t ignore the trend. Thetrend can be your friend. It can be so predictable that it can be like shootingfish in a barrel.
All green lights turn red sometime just like a traffic signal. If you’re driv-ing along a road and you see a green light a mile away and it’s still green ahalf-mile away, expect it to turn red as you get closer (all green lights turn redeventually unless they’re malfunctioning). Once the traffic light turns greenagain (a fresh cross), you should be assured that you can make it through theintersection because you saw how long the light stayed green as you ap-proached it. That’s an example of a trend in your favor. Green light/red light.Sound familiar?
When money flows out of the market for either one day or much longerperiods like a bear market, it is very difficult for a stock to rise in value. Yes, ithappens but it’s less likely. This is what’s called “swimming against the tide.”When this occurs, you have three options, listed from first preference to last:
1. Go with the market trend.2. Take a cash position (stay out of a trade).3. Go against the trend on a short-term basis (the highest risk of the
three).
Volume
Trading volume is very important to bear in mind when inspecting astock. For one thing, you don’t want to get stuck with a large number of sharesof a stock and then find that you can’t exit with a decent price whenever you’d
118 D O N ’ T P L AY I N T H E S T R E E T

like because the stock isn’t trading enough and therefore lacks liquidity.Lower volume also often has a greater spread between the bid and ask priceswhich puts more money into the market maker’s hands, not yours.
If a stock has good movement (a green line going up at a perfect anglewith great separation between the lines), look at the volume. If the volume isconsistent, you know that the movement of the stock is sound and can be sus-tained. On the other hand, if the volume is unusually high—as with a volumespike—you know that the price or momentum has been skewed. Most likely,the momentum cannot be sustained and the stock will fall back to its previousmovement. When trading, always keep an eye on the volume and make sureyou’re not riding a sudden and erratic wave of buying or selling that is oftenquickly followed by a return to the status quo or a crash of the wave.
Trading volume reflects the current supply and demand for that stock.Here are some good volume guidelines when going long.
• Consistency is the key.• 400,000 shares average daily volume (over the course of the past ten
trading days) is a good minimum that makes it easier to enter and exittrades with smaller spreads, good liquidity, and good flow of your orderwith your broker.
• Even though volume is figured into Wizetrade™’s summation formulaand algorithms, volume bars shown on the charts help you to visuallyinspect consistency and watch for spikes (unusual volume traded).
• Stocks with steady but increasing volume, good liquidity, and strong sig-nals are always your best and safest bets.
The chart in Figure 7.7 shows a stock exhibiting steady but increasing vol-ume that meets good trading criteria.
There is a reason we place a heavy emphasis on volume. You may hear onthe news that the market is down 100 points that day on huge volume. This isbad because it will take huge buying volume to reverse. If the market is down100 points on light volume, it is far less significant because it will take a lot lessvolume as a counterbalance to return those 100 points. A big movement onlittle volume suggests some people or a few institutions felt compelled to paymore for the stock then they had to.
FYI: In Wizetrade™, in order for a trend light to change colors while thevolume remains somewhat consistent, it takes the opposite (buying or selling)
The Genesis of Wizetrade™: New Approaches in a New World of Investing 119

pressure to be in control for approximately one-half of that time frame, if thevolume remains consistent, to reverse the trend.
Every stock has a typical daily volume of buying and selling, but a majormovement can be recognized as a spike in the volume for that day. Be carefulof stocks that are one-day wonders. An example would be a stock that usually av-erages low volume, say 20,000 shares per day for weeks, but all of the suddentrades 800,000 shares one day. If the volume drops back the next day, it is apossible sign that active traders herded in and out and then moved on to thenext hot stock.
Instead, stocks with steady but increasing volume, good liquidity, andstrong signals are usually your best and safest bet.
When stocks go up, you want to see strong volume heading to the upside.This indicates that strong bids to buy (most likely fueled by institutions) are
120 D O N ’ T P L AY I N T H E S T R E E T
FIGURE 7.7 Sample Chart of Good Trading Volume

pushing them up. As much as we all like to think that we influence the mar-kets, inevitably, it is institutional trading that really influences the direction ofthe markets. Thus, unless we’re ready to buck the system on riskier tradingstrategies, we need to try to trade “with the stream.”
Often stocks cycle up on strong volume and pull back on thin volume.Keep in mind that stocks are always going to correct downward after a strongcycle. However, if the correctional cycle is influenced by thinner volume thanwhat moved your position up, you’re more likely get another move in yourfavor.
CONCLUSION
You might find it interesting that brokers, analysts, and institutional in-vestors struggle at first with Wizetrade™ because they have ingrained concep-tions of what they are supposed to utilize when making stock choices. Theymuddy it up with their old ways of stock analysis—even though Wizetrade™ isbuilt on the most basic concept that buyers and sellers determine the market.
The folks who have the easiest time with these concepts and those mostquickly successful with Wizetrade™ are those who have never directly tradedon the market before.
As the opening quotation says, “It is also crucial to unlearn old knowledgethat has outlived its relevance.” If you’re a “newbie,” count yourself lucky thatyou don’t have to unlearn as much as the pros in this new world of investing.
It’s time now to get personal by identifying your trading strategy, prac-ticing it until you’re comfortable, and then going for it to make some bucks trading.
The Genesis of Wizetrade™: New Approaches in a New World of Investing 121


C h a p t e r
123
8
Management by objective works—if you know the objectives.
PETER F. DRUCKER
Let’s start with an old Wall Street joke.
What do you call a losing trade?A long-term investment.
Then there’s the old adage that you should always invest in stocks for thelong term, regardless of fluctuations in the market. The reason for this is thathistorically over the course of the past century, the stock market as a whole hasconsistently grown 11 to 12 percent per year. This is true, but what we’re fo-cusing on here is investing in individual stocks, not in the market as a whole.
Many experts advocate this buy-and-hold investment strategy of holdingonto stocks through thick and thin. But in today’s volatile market when majorindexes like the Dow and Nasdaq swing up or down as much as 5 percent ina day, I think this passive investment strategy should now be more aptly namedbuy-hold-and-pray. How many folks during a bear market are simply sitting on
LET’S GET PERSONALApplying Foundations to
Your Trading Strategy

all of their losses, praying for a rebound? Millions. If they would trade moreactively with a plan (including entry and exit strategies), they would know tosell whatever stocks reached the exit point they predetermined before enteringthe trade.
The concept of long-term investments should have changed with the ad-vent of the information age and the ensuing vast influx of individual investorsinto the market. Long term used to be 10 to 30 years; today, I contend that it’sabout 6 months, if that long. In the past, stock movement was like watchingpaint dry; now it’s month to month, if not day to day. There also used to belifetime loyalty to a company’s stock, but misguided loyalty only confuses theissue and can keep you in a bad investment far longer than you should.
The Spanish Armada used to be the most powerful force on earth. It wasfinally defeated by small boats using the guerilla tactics of hit and run. Usingthis analogy, the buy-and-hold strategy of our grandparents is like the SpanishArmada. Today’s strategy is more hit-and-run with this volatile market. Again,long-term investing used to mean years; now it’s months.
“WHERE’S MY NICHE?”
In the previous chapter, I introduced three trading strategies:
1. The position/intermediate trader enters a trade intending to hold the stockfor several weeks or a few months at a time.
2. The swing trader enters a trade intending to hold the stock for one tofive days.
3. The day-trader enters a trade intending to hold the stock for no longerthan one day.
It’s up to you to identify your trading style and strategy, especially takinginto account your risk tolerance and the amount of time you want (or do notwant) to dedicate to investing.
If you have a full-time day job and cannot be at the computer to monitorstocks all day, you would be a position/intermediate trader. If you’re able tosit at the computer all day, you may have the time to be a swing or day-traderif you’re so inclined.
Obviously, the shorter the trade period, the closer you need to monitorthe trade to identify your entry and exit points. Therefore, swing trading and
124 D O N ’ T P L AY I N T H E S T R E E T

day-trading require more time and focus on stock movements than positiontrading. Is that what you want to do (or have time to do)?
You should also take into account your time zone. The market in NewYork City is open from 9:30 AM to 4:30 PM. If you live in the Pacific time zone,that’s 6:30 AM to 1:30 PM. Because most fresh crosses occur during the firsthour of trading, as a swing trader or especially as a day-trader, you had betterbe an early bird or a very late bird to monitor the market while on the WestCoast. If you don’t, you’ll miss out on the trading opportunities of those twostrategies. Position traders are concerned with week-to-week or perhaps day-to-day movements, not hour-to-hour movements, so they can sleep late.
When you need the money is another factor. How long are you comfort-able tying up your investment dollars? How quickly do you need to realizeprofits (hopefully)? Months, weeks, one day? If you know what you want,you’re in a far better position to figure out how to get it.
How much time do you want to spend on investing? How active do youwant to be in managing your money? If you’re not sure, choose a tradingstrategy and practice it by paper trading (not making real trades but practicingthe methods for whatever strategy you want to explore). While practicing, youmay find that swing or day-trading is not to your liking or is too demanding ofyour time, or that position trading isn’t as hands-on or exhilarating as you’dlike it to be. You can then choose a different role and play again until you findyour niche. While you’re pretending you lose no money and can establishyour game plan.
What is your risk tolerance? This subject has been covered several timesin this book, but when choosing specific stocks, always evaluate the risk beforeentering a trade and have an exit strategy to get out.
The more trends you have in agreement, specifically the long, mid, andshort term, generally speaking, the more conservative the trade is. Why?When the indicators on each of the trends are all in agreement, it would takea larger movement in the opposite direction to reverse that trend. But if youare willing to take more risks in hopes of higher rewards, you may choose toignore the long-term trend and trade on a shorter-term basis, simply takingadvantage of the day-by-day or even minute-by-minute fluctuations in the buy-ing and selling pressures in play.
By knowing your risk tolerance level, you will know which trends you wantto confirm in agreement. If you really enjoy the excitement of day-trading,like to be at your computer all day long, and have the time to keep a close eyeon shorter trends, you may find that the reward ratio of trading off the minute
Let’s Get Personal: Applying Foundations to Your Trading Strategy 125

lights is perfectly suited for you. That doesn’t mean that every day-trader willdisregard the agreement of long-, mid-, and short-term trends (that we havecome to know as the three Wizemen™). Some will and some won’t. Those in-vestors who disregard trends in agreement have a higher risk tolerance thanthose that don’t.
Now let’s get more specific about risks involved for each trading strategy.Keep in mind that the biggest risk may be not taking enough risk, meaningnot investing enough in stocks.
TRADING AND TRIGGER WINDOWS
The basic principles and criteria of the three Wizemen™ and FAST™ applyfor all three trading strategies. If you want to be on the conservative side (notstraying from the trends), explore candidates only if the three Wizemen™ (themonth, week, and day) are in agreement—that is, they’re the same color,looking for all green lights for going long. Also observe the FAST™ criteria—a fresh cross or bounce in the “trigger” window, a strong angle of momentum,and a wide separation between the lines.
“But where do I look if I’m a position trader instead of a day-trader?”The three main trading strategies we’ve been looking at in this book—po-
sition, swing, and day-trading—have different trigger windows. The triggerwindow, which is immediately to the left of the trading window, is very impor-tant because it is where the trader identifies and times his or her good entryand exit points for making trades. It is critical to have a fresh cross in the trig-ger window (with strength and stability for longer terms).
Trading Strategy Trading Window Trigger Window
Intermediate Position (weeks or months) Week Day
Swing (days) Day 180 minutesDay (same day) 180 minutes Minutes (10, 30, 60, or 180)
Always start on the month to determine the foundation for trades, andthen proceed to the week and day. For whatever trading strategy that suits you,concentrate on its trading window for entry points and the trigger window forexit points.
126 D O N ’ T P L AY I N T H E S T R E E T

POINTS OF EXIT FOR ALLTRADING STRATEGIES
For exit points, you look for a strong movement of the red line to over-take the green line in your trigger window. At the point when the red linedoes cross over, the chart’s lights will turn red. The lights in the shorter-termtime frames to the left of the trigger window will give you a heads-up that thetakeover is possibly imminent and you should pay close attention.
If the trigger window chart reflects a weak upward or flat movement bythe green line, you might choose to hang on a while longer until a better sig-nal develops. You don’t want to jump out prematurely if the green line has thepotential to become more dominant again by bouncing up and away from thered line and separating as they resume going upward. Pay close attention untilthe trend continues or reverses itself and then make your trading decision.(To determine your selling/exit point, you should look for the same FAST™
signals as when you bought the stock, only now look for the red line overtak-ing the green line for a fresh cross, angle of separation, and divergence.)
When the stock price goes against you, sell it back to avoid further losses.You should set an absolute maximum loss you’re willing to sustain. Identifythat exit point and stick to it.
Figure 8.1 is an example of an exit point for an intermediate positiontrade, so we’re looking at the day window for the trigger point for an exit sig-nal. (I won’t show exit charts for all three strategies because they all look sim-ilar, but remember that the trigger window is different for each strategy.)
For this stock (F5 Networks Inc.), we are looking at the day/short-termchart because that’s the trigger point for this intermediate position trade. Wesee a strong movement by the sellers (the red line) overtaking the buyers (thegreen line) on the far right-hand side of the screen. Because there is also astrong angle of momentum and proper separation of the lines, we know it’sstrong movement by the sellers and decide to get out.
Here are a couple notes about the chart screens I’m using for illustrationsin this chapter:
• The month, week, and day charts go back 20 time periods with the mostcurrent on the far right of the graph.
• The minute charts go back 50 time periods, again with the most currenton the far right of the graph.
Let’s Get Personal: Applying Foundations to Your Trading Strategy 127

In all cases, the most current lines change as the stock’s movementchanges with buying and selling pressures (they’re “moving windows”); every-thing to the left is “fixed” because it reflects the history of the preceding timeperiods.
The volume bars at the bottom of the screen indicate relative movement(i.e., momentum) over the 20 to 50 time periods.
Now let’s explore the three trading strategies in more depth.
THE THREE TRADING STRATEGIES
Intermediate Position Trader
The intermediate position trader enters a trade intending to hold thestock for several weeks or a few months at a time.
128 D O N ’ T P L AY I N T H E S T R E E T
FIGURE 8.1 Example of a Position Trade Exit Point

If you have a full-time day job conflicting with market hours (9:30 AM to4:30 PM Eastern time), then you may consider adopting this strategy. Positiontrading is also a good strategy for those who don’t want to (or cannot) moni-tor their computer throughout the day, or at least during the first hour andlast hour of the market because those are the most active trading periods. Theposition trader is concerned with week-to-week and day-to-day movements,not hour-to-hour or minute-to-minute movements.
Relatively speaking, the position trader is more conservative than a swingtrader or day-trader because he or she invariably looks for all trends to be inagreement, namely the current time frames for long (month), mid (week),and short (day) all going in the same direction. The position trader wants tosee more buying than selling momentum for trading long during each ofthese three time frames to meet the three Wizemen™ criteria. The positiontrader also tends to look for the FAST™ criteria to be in full effect.
Entry Criteria for Intermediate Position Traders
Entry Point Week/mid-term with a fresh cross of the green(trading window) line, angle of momentum, and proper separa-
tion between the lines (FAST™)Other Wizemen™ Day/short term and month/long term crosses Windows are fresh or may be running a little longer
Average Volume over the 400,000 or moreLast Ten Trading Days
The chart in Figure 8.2 displays Yahoo! stock that meets these criteria forentering an intermediate position trade. (Note that we’re looking at the week/mid-term chart because that’s our trading window as an entry point for a po-sition trade.)
An intermediate position trader should be consistent with the type oftrading strategy he or she has chosen. For example, be patient when theminute and hour time periods fluctuate up and down. As a rule, ignore themor you’ll enter or, more likely, exit a trade too soon.
But, what if you are a position trader with more risk tolerance? If you strayfrom the more conservative trends, practice it (paper trade) until you reach aconfidence level to trade with real money. For example:
• You might trade on a cross in your trading window from last week in-stead of a fresh one during the current week (but because you likelymissed one week of taking profits, I’d look for a different trade to enter).
Let’s Get Personal: Applying Foundations to Your Trading Strategy 129

• During a bull market, you might consider a stock in which the monthhas a buying momentum for an indefinite period (several months) in-stead of a relatively fresh cross.
Exit point (trigger window) for intermediate position traders. Look forthe day / short term with a fresh cross of the red line with angle of momen-tum, proper separation between the lines, and significant volume supportingthe new strong selling momentum.
As a position trader, you can basically ignore the smaller minute windowsturning red unless you see a wave of red coming your way toward the day /short-term position. Then you might perk up and pay attention because anexit point might be imminent.
130 D O N ’ T P L AY I N T H E S T R E E T
FIGURE 8.2 Example of a Good Position Trade Stock

Also be aware that as a position trader possibly holding a stock for monthsat a time, it’s possible you’ll be holding stocks during quarterly earnings an-nouncements. These are required to be reported by companies (every threemonths). Pay attention to (or better yet, anticipate) those announcements re-lating to the stocks you’re holding because there’s often a significant swing upor down depending on the news.
Swing Trader
The swing trader enters a trade intending to hold a stock for one to fivedays.
Large institutions trade in volumes too large to move in and out of stocksin such a short period due to regulations. This leaves the one-to-five day timeframe for the individual to trade a “swing” stock with less competition fromlarge institutions than one might otherwise encounter.
It is possible for folks with full-time day jobs (or who have other daytimeconflicts) to swing trade but it’s important that they monitor their trades onthe computer during the first hour and last hour of the market because thoseare the most active trading periods.
I believe that beginning traders can quickly learn how to swing trade.Swing trading offers potential profit-making benefits for position traders ifthey’re willing to change gears and learn this strategy by practicing it. A swingtrader gets relatively quick feedback and might feel more motivated and dis-ciplined over the course of a few days compared to waiting the weeks or monthsrequired of a position trader. Which one fits your style and discipline? (In con-trast, day-trading may prove too great a white-knuckle ride for you because itrequires constant diligence in monitoring stocks minute to minute if not sec-ond to second.)
Different swing traders have different risk tolerances. Some are more con-servative and like to trade stocks only when the three Wizemen™ and FAST™
are in agreement. Others are willing to take a little more risk and may goagainst the long-term or mid-term trends. How much risk are you willing totake in hopes of a greater reward?
Let’s look at the entry criteria for a more “conservative” swing trader.
Let’s Get Personal: Applying Foundations to Your Trading Strategy 131

Entry Criteria for “Conservative” Swing Traders
Entry Point Day/short term with a fresh cross of the green (trading window) line, angle of momentum, and proper separa-
tion between the lines (FAST™)Other Wizemen™ Week/mid-term and month/long-term crosses Windows are fresh or may be running a little longer
Average Volume over the 400,000 or moreLast Ten Trading Days
The chart in Figure 8.3 displays Abercrombie & Fitch Co. stock that meetsthese relatively conservative criteria for entering a swing trade. (Note thatwe’re looking at the day/short term because that’s our trading window as anentry point for a swing trade.)
132 D O N ’ T P L AY I N T H E S T R E E T
FIGURE 8.3 Example of a Good Swing Trade Stock

What options do you have if you have more risk tolerance as a swing trader?(If you stray from the more conservative trends, practice it—paper trade—until you reach a confidence level to trade with real money.) For example:
• You can lower the average volume criteria (though I would never gobelow 300,000 average volume for a swing trade over the last ten trad-ing days—you need liquidity to sell it back).
• You might trade on a cross in your trading window from two days agoinstead of a fresh one during the current day (but because you likelymissed one day of taking profits, I’d look for a different trade to enter).
• Find stocks where the mid-term and long-term indicators are in agree-ment and the short-term indicator is the opposite color and is close tomaking a cross or bounce and put them on your “radar screen” forwhen the day/short-term indicator does cross or bounce.
• Even riskier, you can ignore the long-term when the short-term andmid-term indicators are in agreement.
Exit point (trigger window) for swing traders. Look for the 180 minutesor shorter period with a fresh cross of the red line with angle of momentum,proper separation between the lines, and significant volume supporting thenew strong selling momentum.
Active Trader
The active trader enters a trade intending to hold the stock for no longerthan one day and does not hold the position overnight.
It is really impossible for folks with full-time day jobs (or other daytimeconflicts) to day-trade because of the constant monitoring necessary for thisstrategy. But if their schedule permits a day or two to day-trade (as opposed totrading every day), then they might day-trade part time.
Unlike my encouragement for you to explore swing trading, I can’t be asenthusiastic for active trading unless you’re willing to be very diligent and dis-ciplined. Remember that I once financed a firm in the late 1990s and sawmany people lose their shirts active trading. Though I fully believe in Wize-trade™ as a great resource for active trading, almost every unbiased investmentexpert will tell you that active trading requires some degree of luck and re-quires extreme discipline for you to remain focused every hour, minute, and,in some circumstances, every second of the trading day.
Let’s Get Personal: Applying Foundations to Your Trading Strategy 133

One must also be willing to accept losses along with gains.Different active traders have different risk tolerances. Some are more
conservative and like to trade stocks only when the three Wizemen™ andFAST™ are in agreement. Others are willing to take a lot more risk and goagainst the long- or mid-term trends. Regardless, active trading is by far themost risky of the three strategies I’m presenting to you.
Let’s look at the entry criteria for the most “conservative” day-trader.
Entry Criteria for “Conservative” Active Traders
Entry Point 180 minutes (or far smaller time frames) with a (trading window) fresh cross of the green line, angle of momen-
tum, and proper separation between the lines(FAST™)
Other Wizemen™ Day/short-term, week/mid-term and month/Windows long-term crosses are fresh or may be running a
little longerAverage Volume over the 600,000 or moreLast Ten Trading Days
The chart in Figure 8.4 displays Sapient Corporation stock that meetsthese relatively conservative criteria for entering a day-trade. (Note that we’relooking at the three-minute chart as our trading window for our entry pointfor this day-trade.)
What options do you have if you have more risk tolerance as an activetrader? (Again, if you stray from the more conservative trends, practice it—paper trade—until you reach a confidence level to trade with real money.) For example:
• You might trade on a fresh cross in your trading window minutes agoinstead of during the current period (but because you likely missed oneperiod of taking profits, I’d look for a different trade to enter).
• You might consider trading one-day wonders where the day/short term meets the FAST™ criteria but ignores the mid-term and long-term indicators.
• Even riskier, you can ignore the long-term where the short-term andmid-term indicators are in agreement.
134 D O N ’ T P L AY I N T H E S T R E E T

Active traders should pay attention to the markets by paying attention tothe Dow and Nasdaq movements. Most active traders know that most of theintraday movement occurs in the first hour and last hour of trading.
Active traders must decide exactly what their plan of attack is and strictlyadhere to it. They have short periods of time that they are dealing with andlittle room for error. They should not flip-flop back and forth, doing onething sometimes and doing the opposite other times. Active traders need tofind their groove on what minute lights off of which they like to trade andstick with it.
Exit point (trigger window) for active traders. Based on the minute chartyou choose for your entry, look for and use a consistent, smaller time frame
Let’s Get Personal: Applying Foundations to Your Trading Strategy 135
FIGURE 8.4 Example of a Good Day-Trade Stock

chart with a fresh cross of the red line with angle of momentum, wide sepa-ration between the lines, and significant volume supporting the new strongselling momentum.
A couple more cautionary thoughts for potential active traders. If youintend to day-trade, you must select a computerized system which providesreal-time (up-to-the-second) price quotes and one which provides extremelyreliable data on buying/selling momentum as well as volume activity for eachindividual stock you want to day-trade. (Wizetrade™ provides all of this infor-mation, but regardless of where you get this vital information, it must be ex-tremely quick and accurate to be useful to a day-trader.)
Also, you should choose a brokerage that executes and confirms tradesextremely quickly; better yet, if you’re day-trading, choose a brokerage thatprovides direct access to Wall Street trading firms to buy or sell at a specificprice almost instantaneously. (Direct-access trading commissions tend to belower; however, commission costs are still high for day-traders due to the hugenumbers of trades that day-traders tend to make, even if they negotiate a dis-counted price of $5 to $10 per trade for high activity.)
Because active traders depend on making a few pennies or dimes on eachextremely short-term trading transaction, they often need to trade very highvolumes to make their trades worthwhile. For instance, if a active trader buys1,000 shares costing $25 each—or $25,000 total—and the stock goes up 10 centsper share during the short term of the day-trade, that’s only a $100 profit.Therefore, many active traders trade on margin—buying stocks from theirbroker with borrowed money to increase their buying capabilities. Rememberthat trading on margin means you borrow money. No matter how short thetime of the loan, you have to not only pay back your loan but also interest andcommission for the trade. If the stock dives when trading on margin, you cango into a hole quick.
Considering all I’ve said about active trading, is that what you want to do?There are high possibilities of reward in day-trading accompanied by higherrisks.
INTRADAY STOCK MOVEMENTS
Position traders should not be overly concerned with minute-to-minutetrade movements on the stock market. However, for swing traders and day-
136 D O N ’ T P L AY I N T H E S T R E E T

traders, there are three important intraday stock movements on Wall Street ofwhich they must be aware:
1. Most fresh crossovers occur in the first 30 minutes to 60 minutes of themarket’s open.
2. The market is often flat during midday (sometimes referred to as mid-day consolidation). Why? One reason is the market makers eat lunchthen!
3. Activity often accelerates during the last hour of the trading day.
I will explore intraday stock movements more in the Chapter 9, but youshould be aware that the first and last hours of the trading day (Eastern time)are traditionally the most active periods, so shorter-term traders need to bemost alert during those two time periods.
CONCLUSION
You can always change your strategy or technique if you’re in a positivetrade and your signal strengthens dramatically—stay with it.
However, in the same vein, if the trade goes against you, cut your losses—sell it. Don’t change your strategy in an attempt to salvage the trade in thehope that it will change course. Be disciplined but don’t ignore very strong orvery weak signals telling you what you should do. If you trade on mixed sig-nals, you get mixed results. Timing, patience, and consistency are the keys tosuccess.
Let’s Get Personal: Applying Foundations to Your Trading Strategy 137


C h a p t e r
139
9
It’s not whether you’re right or wrong that’s important, buthow much money you make when you’re right and how much you lose when you’rewrong.
GEORGE SOROS, Soros Fund Management
PAPER TRADING
A tourist in New York City asks a passerby, “How do I get to CarnegieHall?” The passerby replies, “Practice, practice, practice.”
How do you become comfortable and proficient with a new trading strat-egy before investing real money? Paper trading, paper trading, paper trading.
In the previous chapter, I introduced the three main trading strategies—position, swing, and day—along with trends to look for in each one plus entryand exit points. I also suggested ways that you can stray a bit from these strate-gies if your risk tolerance is greater than the conservative trends.
By this point, you might already identify with one strategy over the othersdue to your circumstances, risk tolerance, and time available to devote to trad-ing. If so, that’s great. However, if you have never invested on your own beforeor if you are a seasoned trader who’s embarking on a new strategy, I implore
TIPS AND PITFALLS

you to paper trade—to practice before using real money—until you grasp theconcepts and get the criteria and trading signals that work for you on a con-sistent basis down pat.
By paper trading first, you can save thousands of dollars while honingyour skills until you’re consistently getting positive results and feeling com-fortable with your success rate. If you try to learn while investing real money,you might find yourself out on a limb that is being sawed off behind you.
If you’re a newbie, learning any new trading program or strategy is likelearning a foreign language, no matter how easy it may be to understand.
Experienced traders need to take even more time to hone a new systemand strategy if they’ve depended on analyses that may no longer apply to theirnew path. For example, excellent drivers from America have to learn to driveon the left side of the road if they move to England. American drivers and ex-perienced traders have many ingrained notions that may not apply to theirnew situation and can be not only distracting but disastrous.
It is important to enter a paper trade as if it’s real. For example, onlypaper trade with dollar amounts that you actually have available to trade. Eventhough you’re practicing with pretend money, be realistic. If you paper tradewith $100,000 but you actually have only $5,000, then you might have fun pre-tending with the exaggerated amount but you won’t learn anything pertinentto your real-life situation. Paper trade with your real-life budget.
Track your trade by keeping a journal, or using a spreadsheet like Excelor Lotus 1-2-3, or simply writing it all down on a pad of paper. Wizetrade™ in-cludes a Tradevault screen (shown in Figure 9.1) that easily tracks all of thenecessary criteria for paper and real trading and it provides a real-time ac-count of your position.
What information should you track in order to learn while paper trading?When entering a paper trade, it is important to track the following:
• The company name and symbol• Date• Entering price (the ask price)• Number of shares you’re “buying”• The fee to your broker to enter the trade• The reasons you identified this stock as a good trade to enter
To calculate entrance and exit fees, assume that you’re trading onlinewithout your broker’s advice (which costs more) because you’re making the
140 D O N ’ T P L AY I N T H E S T R E E T

trade on your own. Use a low fee of $8 or $9 for both entering and exiting thetrade.
When exiting a paper trade, track the following:
• Date• Exiting price (the bid price)• Number of shares you’re selling • The fee to your broker to exit the trade• The reasons you’re exiting the trade
To do the math simply multiply the entry price by the number of shares(or the exit price by the number of shares), minus the fees to get into (or out
Tips and Pitfalls 141
FIGURE 9.1 Sample Tradevault Screen

of) the trade. You can then determine if you would you have made or lostmoney on the trade.
In your evaluation, pay special attention to the reasons you entered or ex-ited each trade. Then look back at the stock’s charts to see if you could havepinpointed a better entry or exit point by paying more attention to trends andcurves or ignoring misleading ones. Did you enter the trade too soon or too late?Did you exit too soon or too late? In hindsight, should you have not enteredthe trade at all? In other words, ask yourself if you could have done better.
By paper trading and learning from your experience prior to real trading,you test your proficiency in whatever strategy you’ve chosen and you can buildyour confidence in a short period of time. Paper trading also will alert you toany deficiencies in your trading strategy that need further exploration andexperimentation.
I’m often asked how many times to paper trade before moving on to realmoney. It depends. I know, you want a definite number but it really dependson the individual and the strategy. The goal is to hit your stride by earningconfidence and a success rate with which you’re comfortable. If you can dothat after five paper trades, wow. If it takes 60 or more, so be it.
The most common mistakes that newbies make are not trading a fresh crossfor their trader type, not keeping a log of their paper trades for self-evaluationor not paper trading at all.
Once you test and prove your methodology and consistency by papertrading, you can start trading real money. I suggest you start real trading withrelatively small lots and continue to ramp up as you become successful. Forexample, you might start your real trading with 100 shares and then ramp upto 200, 300, 400, and so on, as you gain confidence.
If you move on to real trading and want to begin exploring another strat-egy, paper trade again with the new strategy, no matter how similar it may beto the one you’ve learned, until you reach a level of success with which you’recomfortable.
Learn to Eliminate Emotions While Paper Trading
While paper trading, people have a tendency not to let emotions influ-ence their decisions to enter or exit trades because real money isn’t involved.However, emotions are far more likely to enter the equation when you begintrading with real money because the prospects of gaining or losing becomereal, not imagined.
142 D O N ’ T P L AY I N T H E S T R E E T

The main emotions involved in trading are fear and greed. Emotionscome into play more when you are exiting a trade than entering one—andprobably not in ways you might expect. What’s fascinating is that you wouldexpect fear to influence a trader to bow out at the first sign of trouble; instead,it influences the trader to stay in losing trades too long because he or she fearslosing even more money and hopes that somehow, some way, stocks will climbback up. Humans have a built-in antidote to fear, which is hope, and hope canwreak havoc on our investment choices. I’ve seen too many investors thatknew they owned bad stocks but held them hoping the market would reverseand push the prices higher. Mistake. The market isn’t moved by hopes.
Greed also impacts an investor’s actions negatively, but not in the way youmight expect. Greed influences a trader to get out of a successful trade toosoon because there is an overwhelming temptation to cash in his profits pre-maturely while the stock is still trending upward.
The important thing to remember is that if fear/false hope or greed pre-vails, you will lose money. But if you establish a successful exit strategy whilepaper trading when emotions are not involved, and trust that experiencewhen making the transition to real trades, you will not fall prey to the pitfallsof your emotions.
You can test the emotional impact on trading by “playing like” you’reusing real money when paper trading. Make a few trades based on your gutfeelings, not your analysis of the criteria, and see how greed and fear tend torear their ugly heads to influence bad decisions. By experiencing these emo-tions during paper trading, you’ll also learn to recognize these feelings shouldthey creep up during real trading. You’ll then be reminded of the importanceof sticking to your strategy.
Intuition and gut feelings can be valuable in many areas of life, especiallyin making many personal decisions, but they’re not at all reliable when ap-plied to investments. (Remember the adage, anticipate a cross then anticipatea loss?) If you were successful paper trading without emotions, don’t changeyour plan when you start using real money by trading on hunches or antici-pating events that haven’t happened.
If you ignore all the signals and indicators of your trading strategy, it’s likerunning through 100 red traffic lights with a devil-may-care attitude. You maymake it through a few unscathed, but the numbers will catch up with you.
How you think or feel a stock will perform is irrelevant. As boring as itsounds, be mechanical and disciplined when investing. This sounds simple,but it’s difficult to ignore our instincts and gut feelings. If you must exercise
Tips and Pitfalls 143

your emotions, gamble on hunches in Las Vegas; trade on trends on WallStreet.
INTRADAY STOCK MOVEMENTS
Stocks go through several market cycles and phenomena daily. Also theydon’t go up or down in a straight line; they go through many “steps” or “move-ments” throughout their trend.
If you have established a strategy for entering and exiting trades as a po-sition or swing trader, be disciplined and don’t second-guess yourself whilestocks fluctuate throughout the day as they invariably will do. The right timeto trade is based completely on an individual’s trading objectives. However,regardless of your strategy, it is important to understand that most trading ac-tivity typically occurs during the first and last hours of the trading day.
Buying Stocks at the Close
Most fresh crossovers occur during the opening hour of stock markets,driven largely by institutional buyers and day-traders. For this reason, youmight find it advantageous to closely watch for the following scenario at theend of the day: If a stock on the Wizetrade™ trading screen has a red day buta green week and green month with good separation on the curves, you mightwatch to see if the minute lights start to turn green and the lines start to crossand move to the upside near market close. If this occurs, it could potentiallymove much higher in the morning. By buying this stock at the close, youcould potentially catch a fresh cross early the next morning that could con-tinue moving strongly to the upside for several days. (This does contradict the“anticipate a cross, anticipate a loss” rule, but if the minute lights support thetrend in that direction, then it’s up to you to make the trading decision basedon your trading strategy.)
Midday Consolidation
In a midday consolidation pattern, there is strong movement in a stockduring the morning, a period of consolidation or downturn around the mid-dle of the day, then a resumption of momentum in the afternoon. However,
144 D O N ’ T P L AY I N T H E S T R E E T

the midday flatness or a slight dip may simply reflect that market makers areeating lunch! My advice to position and swing traders: Be patient during mid-day (Eastern time).
Price Spikes
Price spikes are quick but strong temporary moves in stock prices eitherup or down. The market makers may be “playing around” with the stock. Payattention but don’t panic, especially if you’re a position trader; you don’t wantto sell a stock that’s experiencing a temporary movement.
In case you haven’t noticed, I’m not a big fan of brokers and market mak-ers. Because they control the premarket and postmarket activity, they can playgames with your hard-earned money by creating temporary “false” spikes hop-ing to suck you into stocks on gap ups and scare you out of stocks with gapdowns. That’s why I developed the red light/green light program. By utilizingthe principles of Wizetrade™ for evaluating the week and day with a strongmonth, you can avoid the pitfalls that most people make when they’re undulyshaken out of their position while these Wall Street games play out.
An example of a price spike is the Nasdaq suck down. This drop in stockprice typically occurs when a stock is in a great uptrend, but perhaps is nowthree to four weeks into that trend and starting to get a little tired. For exam-ple, stock is at $20 per share, up $2 for the day. It has great curves but thetrend started when the stock was at $12 per share, so it’s already gone up 80percent at this point. In this case, the market makers may artificially move theprice down—a temporary price change that should only affect day-traders.However, sometimes this move startles longer-term traders. Position and swingtraders should check to see if the stock was moving up strong in the morning.If it drops down hard in the afternoon but the month indicator shows thestock in a great uptrend with the week early in its cycle (with a fresh cross),the position or swing trader may find this to be an opportunity to buy evenmore, not to bail out prematurely during the “suck down.”
This is called the Nasdaq suck down because it generally happens withNasdaq-listed stocks since Nasdaq allows after-market activity during whichthe market makers’ games might go unnoticed (the NYSE does not have after-market trading). Although a suck down can also occur sometimes with NYSEand other listed stocks, it occurs with greater regularity among Amex/Nasdaq/OTC stocks.
Tips and Pitfalls 145

Gap Down at the Open
Although the scenario could look solid—a stock’s trend moving higherand showing more buyers than sellers, the week trendline looking fairly fresh,and a solid month—sometimes the market as a whole goes down at the opentaking a stock with it.
If the stock gaps down but an uptrend is in place (the month and weekcurves are excellent), keep inspecting the day chart. If it remains separated,the stock will fill in the gap all day.
A bad gap down, however, is when the stock gaps down at the open but theshort-term minute curves look wrong. Check the news and information onthat stock because it is a probable indication that something materially nega-tive has happened with that company. This is not just a morning gap down,but a complete reversal in sentiment.
If a swing cycle is extended, a gap down may mean the end of a cycle atwhich time the stock becomes more volatile. The green line on the day startsto arc over and converge hard to the right—becoming unstable on a short-term basis. However, as long as the long term is rock solid (FAST™ in month,week, and day), the minute lights may not be indicative of how the stock willmove on a long-term basis.
TRADING ON EARNINGS ANNOUNCEMENTS
A publicly traded company is required by law to publish its earnings re-ports four times a year (once each quarter). “Earning season” lasts aboutthree weeks during the months after each quarter ends, that is, in January,April, July, and October. Therefore, there are 12 weeks (three weeks per quar-ter) in which to be aware of the earning season.
Why are these important times for the investor to remain alert? Stocks riseand fall when investors react to whether the company exceeds target expecta-tions or fails to do so. In fact, stocks rise and fall in anticipation of the earningsreports if rumors are being floated or if analysts on TV or major investmentWeb sites make predictions. I have poo-pooed trading on analysts’ predictionson TV, but if they name sources to back up their predictions on good, bad, orneutral earnings announcements, then check the charts. They may give you aheads-up to major buying or selling movement even before the announce-ment is actually made.
146 D O N ’ T P L AY I N T H E S T R E E T

Much like the release of blockbuster movies which are staggered through-out the busy viewing periods so they don’t all open at once, these earnings re-ports are made in bunches over the course of the three weeks. I’ve noticedthat the analogy can be carried further: If a company has an especially posi-tive earnings report, it’ll look for less competition on a release date and go outof its way to generate “buzz” so everyone notices it (much like with the way stu-dios release movies with Oscar potential on special days in late December). Ifa company is a dog with disappointing news, then it might try to slip the re-port in on a busy day or at a less newsworthy time of day so fewer people willnotice the “bad reviews.” However, blue chip stocks on the Dow will be noticedwhether they have good, bad, or indifferent announcements.
Most of these announcements are made right after the market closes orright before it opens; a few, however, are made during trading hours.
I have implored you not to trade on your own emotions or gut reactions,but don’t ignore the behavior of the masses because they are likely to move astock up or down based on euphoria or hysteria during earnings season. Whiledisciplined traders don’t trade on their own emotions, they should be cog-nizant of the major reaction the masses cause when they emotionally supportor reject a company (out of fear or greed) when earnings announcements arereleased. Carefully watch movements on the charts and let them be your guidebecause they reflect real—not perceived—buying and selling movement.
Specialty Trade during Earnings Season
This specialty trade works for active traders if the earnings announcementis scheduled just before or after the market closes (remember that anticipationof the news—if widespread—can have as great an effect on a stock’s move-ment as the actual announcement). Consider the following:
• Arrange lights to super active trading style—1, 3, 5, 15, 30 minutelights.
• One hour before the market closes, there may be a two to ten pointmove in the stock.
• Go in and out of the position in the last hour of trading. Don’t hold theposition overnight.
• Pay special attention to Nasdaq stocks that trade after hours when earn-ings announcements are often made, making them more volatile dur-ing these quarterly periods.
Tips and Pitfalls 147

ALLOCATE
No matter how short term your trading strategy is, you can still allocate bynever putting all of the money you’ve set aside for stock investments into onecompany—putting all your eggs in one basket so to speak. (I’m making a dis-tinction here between the money you allocate for stocks and that allocated forother investments such as in bonds, real estate, insurance policies, cash, etc.When I refer to 100 percent of your investment in this chapter, I’m only re-ferring to money you’ve allocated for stocks—not all of your investment money.)
If a company in which you’ve invested all your money suddenly and inex-plicably goes down the drain, you’ve lost everything. Think of what happenedto Enron recently when many employees had no choice but to have all theirfunds tied up in their company’s stock—they lost the entire value of their re-tirement savings.
No matter how safe an investment opportunity seems, don’t ever putmore than a small fraction of your assets into one company. It just isn’t worththe angst.
Here is a simple allocation model for stocks that you can easily replicate(this is not a plan of action, just an example).
If you own stocks in ten different companies with an equal amount ofmoney invested in each one, then each stock represents 10 percent (outof 100 percent) of the money you’ve set aside for stocks. If nine of the tenstocks break even (neither going up or down) but one goes bankrupt, youlose 10 percent of your investment. However, if you put a stop limit orderof 10 percent on each stock (meaning you’ve instructed your broker tosell any stock dropping 10 percent below the level at which you boughtit), nine of the stocks will be unaffected because their price remained thesame; the one that heads south is stopped and automatically sold after los-ing 10 percent as you directed. Now, you’ve only lost 10 percent of onestock. In other words, you’ve lost the value of one-tenth of 10 percent ofyour stocks—or 1 percent of your total investments.
See how that works? Allocating your stock investment money among tenstocks lowers your risk of big losses. While there’s no such thing as a risk-freeinvestment, there are ways of getting around the highest risks. Like I’ve saidbefore, the more risk you’re willing to take, the more likely you are to have alarge return, or, on the flip side, the loss of all of your investment capital.
148 D O N ’ T P L AY I N T H E S T R E E T

There’s a saying that has more than a grain of truth in it: There are old tradersand bold traders, but no old bold traders.
DON’T HOLD ON TO LOSERS
It’s quite common for people to sell their winners prematurely and holdon to their losers for too long, hoping they’ll improve in the future. If a stockis not performing up to your expectations (and reaches the threshold of yourpredetermined exit strategy), get rid of it and put the money elsewhere. Inthe same vein, when you make an investment mistake, rectify it by selling itand moving on (comfort yourself with the fact that you are far from alone).Learn from your experience, move on, and don’t dwell on it again.
INSIDER BUYING AND SELLING
Buy When Insiders Buy
If those who run and oversee a company are buying their own stock,chances are that they think the value of the stock will rise. Because they are inthe know—aware of hundreds of details about the company’s operation andfuture prospects that those of us on the outside could never hope to know—follow their lead if you can. How can you do that? Simple. Insiders must dis-close to the SEC all trades in their own company’s stocks and those transactionsare immediately available to the public in the SEC’s EDGAR database online.If you see an upward trend in the stock in which you’re interested, checkEDGAR to see if the bigwigs are buying. For example, insiders may knowabout a new product that’s about to be introduced that will increase revenuesubstantially, so they invest in their own company with their own money. Thatactivity is not only legal (as long as it’s properly reported), it is a great indica-tor to outsiders like us.
Sell (Run Like the Wind!) When Insiders Sell
While it’s obvious now in hindsight, if investors would have checked SEC’sEDGAR database during late 2001, they would have seen Enron executiveslike Kenneth Lay and Jeffrey Skilling selling hundreds of thousands (cumula-
Tips and Pitfalls 149

tively millions) of shares of their own company’s stock. Not a good sign. Theyobviously weren’t selling that much stock to buy a swimming pool or put theirkids through private schools—they were bailing out.
The charts gave you clear signals to sell Enron stock at about $78 pershare. These shares now sell for about $1 apiece. You could have confirmedthese failing signals by checking EDGAR. Why the SEC didn’t notice the redflags months before the scandal, I don’t know. Perhaps it is because thisagency is extremely understaffed and underfunded. The point is you couldhave discovered it before the stock dropped precipitously by making a fewclicks in EDGAR to see what Enron corporate executives were doing with theirown company’s stock. That information was available to the public before thescandal dominated the headlines.
TWO MYTHS
Mutual Funds
Myth: Mutual funds have smart managers. They will give you diversifica-tion and will protect you.
Three-quarters of all managed mutual funds underperform the stock mar-ket’s average return. That’s 75 percent! How “smart” can these managers be?Also, if you evaluate all the individual stocks in the vast majority of mutualfund offerings in charts like those Wizetrade™ provides, you’d find obviouslosers in the fund’s “family.” Why buy any package with losers built into thetrade? Of course, we all want diversification in our portfolio, but nobody’s def-inition of diversification implies a mix of winners and losers.
In additional to this, mutual fund managers of load funds charge 3 to 8percent up front as a sales fee. They justify this up-front load fee by not charg-ing administrative fees later on.
If you have the wherewithal to be independent with the know-how to eval-uate stocks and a computerized program with all the real-time data you need,why invest in a package of stocks not of your choosing? You can do far betteron your own by choosing all of our own stocks. If for some reason you want todiversify your stock portfolio with a package deal, then I urge you to invest inindex funds which, at a very low cost, track a segment of the market’s returns,which invariably outperform mutual funds.
150 D O N ’ T P L AY I N T H E S T R E E T

Mutual fund managers actively select which stocks to purchase. Remem-ber that managers are human and were no less immune than individual in-vestors to the seduction of dot-com companies during the recent boom years.Many loaded their funds with these flashy stocks and when the bubble burstso did the value of most mutual funds.
Index funds are immune to seduction. They don’t change with whims orgut feelings. The index fund manager sets up the portfolio to mirror a mar-ket index. Examples of these funds include the S&P 500 stock index (oftencalled Spiders, stock symbol SPY), the Dow Diamonds (DIA), or the Nasdaq100 general technology fund (QQQ), though there are over 100 index fundsavailable.
Beyond using index funds as an investment option, you can also track dif-ferent sectors by plugging in the stock symbol of an index fund into a programlike Wizetrade™ to gain insight into how that part of the market is perform-ing. For example, if you checked out QQQ (sometimes called the Qs), you’dinstantly get a snapshot of how the Nasdaq 100 general technology fund isdoing overall by checking its month, week, and day trends just like you wouldwith an individual stock. If the QQQ index is doing well and trending up, youmight consider buying that index fund or you might dig a little deeper withinthat index to find a particular stock to buy—looking for the best of the best,of course.
PE Ratios
Myth: The PE ratio is the most important indicator of the value of a stock.No doubt you have heard of the PE ratio because, second only to the price
of a stock, it is a number often cited in the media. PE ratio is the price of thestock (P) divided by its earnings (E) per share. A stock with a PE of ten orhigher is often touted by brokers and analysts as a hold-or-sell candidate be-cause the stock is considered overpriced, while a PE under ten is touted as abuy because it is underpriced. Wall Street dangled this benchmark and themedia took the baton and ran with it without question.
Accountants know that investors look at a PE ratio as a vital indicator, sothat’s why they monkey around with earnings reports. If the earnings are ma-nipulated (often legally) or fabricated (as we’ve seen far too often in this ageof Enron and WorldCom), then the equation as a whole is based on misinfor-mation or an outright lie and therefore cannot be trusted.
Tips and Pitfalls 151
Yet the media reports PE ratios as if they’re the holy grail for predictingfuture stock returns. When media analysts report a PE ratio as the reason tobuy or sell a stock, don’t shoot the messengers, just ignore them.
’TIS THE SEASON
For those of you who have been in the investing game for a while, youmight have noticed that stock investments tend to perform better during thewinter months than in the summer. (I’m not sure why exactly; maybe it’s sum-mer doldrums or the fact that market makers and institutional investors on va-cation.) I was astonished to find how great the discrepancy was when I cameacross facts quoted in Yale Hirsch’s 2002 edition of Stock Trader’s Almanac. Mr.Hirsch tracked the S&P 500 since 1950. If you invested $10,000 in the S&P 500in 1950, by mid-2001, these would be your results:
• From May 1 to October 31, the $10,000 would have grown to only$11,408
• From November 1 to April 30, the $10,000 would have grown to$314,056
Now, don’t let this scare you out of the market for six months out of theyear. After all, he tracked an index of 500 stocks. An individual stock can per-form well during down markets or poorly during up markets. That’s why I feelstrongly about choosing your own individual stocks rather than a package offunds.
FLY ME AWAY
I always wanted to learn to fly. Yet I didn’t want to devote years to obtain-ing and maintaining a pilot’s license. Then I would see these flying contrap-tions at boat shows called ultralights. They are basically powered paraglidersthat promised “the magic of simple, elemental, pure flight.” I gave one a tryat a one-day flight class and was hooked. I bought an ultralight and now I flywith the wind in my face and an unobstructed view of the countryside 100 feetbelow.
152 D O N ’ T P L AY I N T H E S T R E E T
You can only fly ultralights in winds of up to 15 mph, so I only fly early inthe morning or just before nightfall because where I live there are wind ther-mals during the day which produce increased wind speeds. My trainer told methere would be days when after 30 minutes of preparation the wind wouldpick up just before I’d be ready to take off. According to my trainer, if thewind speed is borderline there will be times when I’d be tempted to fly any-way. Then he told me something I will never forget: “It’s better to be on theground wishing you were in the air than being in the air wishing you were onthe ground.”
Later it occurred to me that this advice was valuable for trading as well.Both flying and trading have inherent risks that can be minimized if you setparameters and stick to them. You’ve got to trust the indicators and then havethe discipline to take action or not, depending on what the indicators tell you.
Never force a trade. You can’t force money out of the market. Let the tradecome to you. There are windows of opportunity. If you miss one, let it go. Pa-tience and timing are the keys to successful investing.
And remember, if it’s not a good day for flying or for trading, there’s al-ways another day.
Tips and Pitfalls 153


C h a p t e r
155
10
All things are difficult before they are easy.
THOMAS FULLER
Several times in this book, I have referred toshorting a stock, going short, or simply used the word short and said I’d ex-plain it later. Well the time has come.
What does shorting mean?
Shorting is when you sell a stock before you buy it. If you think the stockis going down in price, you sell it at the higher price and then buy it backat a lower price.
This is where you might respond, “Whoa, Nellie. How the heck do I makemoney doing that? By shorting, I sell a stock before I buy it? And after selling astock that I don’t even own, I root for it to drop in value, and then I buy it backfor a profit?” Absolutely. This trading technique is used very successfully everyday by many individuals and institutions. In the midst of a bear market, it is astrategy that should be considered.
ADVANCED STRATEGYShort Orders

Once you understand the concept and how and why it works, executing ashorting trade is easy—if you have the right tools for recognizing good short-ing opportunities and understand what you’re doing. Short selling is just onetechnique you can add to your trading toolbox, if it matches your risk toler-ance and investing style. (Having read this book, you already have all the basicterms at your disposal, so you don’t need to learn a new vocabulary in orderto short.)
Many savvy investors, however, can’t wrap their minds around the conceptof shorting because it doesn’t seem natural to trade on stocks that are goingdown—it’s like having to adjust to running red lights instead of stopping. Toadd to this, a person who goes short must borrow the stock from an institution(namely in the form of a margin loan from a brokerage for the cost of thestock) and pay interest for the duration of that loan. This is the price of beingallowed to sit at the table to play the shorting game and it applies to everyshort investor, even those as rich as Bill Gates.
Scared off yet? I hope not. Give me another chance to explain it. But re-member, until you truly grasp the concept of shorting, don’t try it. If you don’tunderstand the concept, it’s like playing a game without knowing the rules orplaying while wearing a blindfold, and that’s a very risky game to play whenyour money’s on the line.
TAKE TWO . . . AND THREE
What does shorting mean? I’ll try to define it a couple more times but Ithink you’ll understand it better when I explain how it works. After all, it’sharder to define the game of football than to explain how it’s played.
Take two. Shorting is the opposite of going long. That is, short sellersmake money if the stock goes down in price; long investors make money if thestock goes up in price. Trading or investing long refers to investing money theold fashioned way—buying an asset, holding on to it while it hopefully appre-ciates in value, and selling it to make a profit. An investor in a short transac-tion only makes money if the stock falls in value.
In terms of supply and demand, the person going short expects more sell-ers than buyers to drive the stock’s price down; the person going long expectsmore buyers than sellers to drive the stock’s price up.
156 D O N ’ T P L AY I N T H E S T R E E T

Take three. A short sale occurs when an investor—usually a short-termtrader—sells borrowed stock from a broker with the expectation that the stock’sprice will fall. Those shares are then sold on the market and the proceeds fromthe sale are credited to your brokerage account. These proceeds comprise the“loan” so, at this point, you have no access to them.
At some point, you must buy the shares back. If your expectation provescorrect and the stock’s price falls, you then buy the shares back at a lowerprice (“covering the short”). The borrowed stock then is returned to the bro-ker and you keep the profits (less the commissions and any interest owned onthe loan).
Regardless of whether the stock’s price goes down or up, people whoshort a stock have committed themselves to buy the stock back to close theirshort position with the lender (the broker). The risk in doing this is that, ifthe stock goes up instead of down, you must buy it back at the higher priceand take the loss. You then pay “margin interest” for the loan of the stock thatyour broker let you borrow from the proceeds that you received when youshorted the stock.
HOW DOES SHORTING WORK, ALREADY?
Okay, enough definitions. Let’s explore how an investor makes (or loses)money when shorting.
A short transaction only has two steps:
1. Choosing a stock to short (entering the trade)2. Closing the short (exiting the trade)
You do nothing else between those two steps except keep track of yourshorting choices. (See, it seems easier already.) Why would you initiate a trans-action to short a stock? Because you have reason to believe that the stock is onthe verge of dropping in price.
A Fictional Example
A company called Toilets for Dogs (TFD) has been successful for a while,but you have reason to believe that the price is going to drop from its current
Advanced Strategy: Short Orders 157
cost of $70 per share. You based this theory on the fact that TFD was a suc-cessful novelty for awhile but now you have objective reasons to believe thatthe cost of the stock will drop now or very soon. You decide to short 100 sharesat the current market price of $70 per share.
Your broker lends you 100 shares of TFD at $70 per share for a total of$7,000. In essence, you have borrowed those stocks. Those shares are thensold on the open market to another individual investor or institution and theproceeds ($7,000) are credited to your brokerage account for the time being.
One of two things can happen after you enter the short trade and beforeyou are ready to close the short (exiting the trade and returning the borrowedshares to your broker):
1. The stock’s price can drop as you anticipated.2. The stock’s price can rise to your chagrin.
If the price of TFD drops as you anticipated, let’s say to $25, you can buythe stock back at the lower price ($25) and make a profit on the differencebetween the purchase price ($70) and the sales price ($25). Your borrowedshares then are returned to the broker
TFD Sinks in Price from $70 to $25
Borrowed and sold 100 shares of TFD @ $70 $7,000Bought back and returned 100 shares of TFD @ $25 $2,500Your Total Short Profits +$4,500
($7,000 − $2,500)
You made a nice profit of $4,500 because your cumulative shares droppedin value by that amount. The broker/lender sends you the difference or putsit into your account, depending on your arrangement.
However, if the price of TFD rises let’s say to $100, you have to buy it backat the higher price—adding your own money to meet the difference. In this trans-action, you lose money. The borrowed shares then are returned to the broker.
TFD Rises in Price from $70 to $100
Borrowed and sold 100 shares of TFD @ $70 $7,000Bought back and returned 100 shares of TFD @ $100 $10,000Your Total Short Losses − $3,000
($7,000 − $10,000)
158 D O N ’ T P L AY I N T H E S T R E E T

You lost $3,000 because your cumulative shares rose in value by that amountand now you have to pay the difference to your broker/lender out of your ownpocket. This is the danger of shorting: You have to buy back the shares you initiallyborrowed and sold. Whether the price is higher or lower when you decidedto end the shorting transaction, you must buy back the shares at some point.
In either case, whether the stock goes up or down, the interest charged byyour broker that accrued during the duration of your loan is deducted fromyour account. Your profit or loss is also diminished by the commission expenses.
A True Example
The example in Figure 10.1 is a real stock (QLogic Corporation) thatshowed three shorting opportunities in less than a month. The pricing boxeswith red arrows (signaling when to short) and green arrows (when to get outof the short by buying the stock back) have been superimposed on the Wize-trade™ chart to demonstrate the visual factors that you should look for to sig-nal a good short-trading opportunity and the exit points at which to get outof a short trade. (Note that the red lines appear here as black, and the greenlines as gray.)
In reference to Figure 10.1, the following table shows the date and priceof the three short-trading opportunities, the exit dates, the price of the stockat the time it was best to buy it back (the point at which there’s an indicationthat the stock price is going back up), and the profits that could have beentaken by shorting during these three periods.
Date of Stock Date of buy- Stock price Potential profit per short signal price back signal at buy-back share while shorting
6/19/02 45.72 6/26/02 35.00 +10.72 (45.72 − 35.00)6/28/02 39.16 7/2/02 34.91 +4.25 (39.16 − 34.91)7/8/02 39.68 7/11/02 36.67 +3.01 (39.68 − 36.67)
Potential total short)profits per share: $17.98)
The potential per-share profit on these trades is $17.98—a 39 percentprofit in less than a month (based on the original $45.72 price and the $17.98profit). This potential 39 percent profit was made even though the actualvalue of the stock during this trading cycle lowered from $45.72 to $36.67.
Advanced Strategy: Short Orders 159

If the investor had 100 shares at $17.98 profit per share, the total profit inshorting this stock was $1,798. Again, this profit would have been made in lessthan a month on a stock that lowered in value by about $9 per share.
The investor could have potentially profited by 39 percent on short trad-ing this stock just by paying attention to easily identifiable key indicators(fresh cross, strong angle, and good separation) and recognizing when to shortthis stock and when to buy it back three times in less than a month.
MAJOR CONSIDERATIONS FOR GOING SHORT
• Market direction• High-priced stocks
160 D O N ’ T P L AY I N T H E S T R E E T
FIGURE 10.1 Example of a Good Short Trade

• Catch the wave• Volume• Paper trading and radar screens
In order to recognize good shorting opportunities, you need a researchtool (like Wizetrade™) or other resources to recognize the overall marketdirection and a particular stock’s current performance in regard to price, anuptrend on the verge of going down (“catching the wave” based on buyer/sellerpressure), and the volume being traded.
Market Direction
When looking for stocks to short, pay careful attention to the overall mar-ket direction. If the market is cycling down (money is flowing out of the mar-ket), there will often be more shorting opportunities. Instead of the overallmarket, you might concentrate on a particular sector—a group of securitiesin the same industry, like in healthcare or transportation. If a sector has anoverall downtrend, then that sector may have several ripe shorting prospects.
If the market trend is going up, it is still possible to successfully short aparticular stock but you need to be even more attentive because you’re swim-ming against the tide by fighting the overall trend. When in doubt, don’t fightmarket trends; go with the flow if you’re not comfortable with shorting.
High-Priced Stocks
When shorting, look for high-priced stocks because you need room for thestock to fall; the bigger they are, the farther they can fall. Higher-priced stocksprovide a greater opportunity for bigger profits when shorting. Obviously, an$80 stock has more room to fall than an $8 stock. If you short an $80 stockthat drops 25 percent ($20) as opposed to an $8 stock that also drops 25 per-cent ($2), you would make $18 more profit by shorting the higher-priced stock.
Catch the Wave
The best opportunity to short a stock is when it’s at the top of a long up-trend (the price has increased for awhile due to buying pressure) and you canrecognize the moment it “runs out of gas” and starts heading down due to sell-
Advanced Strategy: Short Orders 161

ing pressure. It is natural for all stocks to occasionally come down; no stockcontinually goes up.
If you catch a fresh cross when a stock begins to go down after enjoying along uptrend, then you can maximize your profits by shorting at the highestprice possible and completing the transaction at the end of the downwardcycle just before it resumes heading up.
When stocks go up, they tend to chug up slowly; when they go down, theytend to plunge like they were falling off a cliff. The cycle is like a rollercoasterchugging slowly to reach the apex and then racing down to the bottom. Theseare natural up-and-down tendencies, so you can expect similar results duringeach cycle.
Volume
You want short orders to be processed fast—both when entering and ex-iting—to ensure that you will have no problem completing the transactionwhen you buy the stock back to cover the short. Therefore, volume is a veryimportant factor when shorting. You want a stock that has a lot of activity (thatis liquid) instead of one that’s stagnant on the market.
For short trades, I recommend making sure that a stock has experienceda minimum trading volume of 600,000 shares daily on average, over the courseof the past ten days or so. The higher the volume, the better your opportunitywill be to get in and out of short trades when you want to rather than when themarket makers dictate that you can. (See “Other Risks” later in this chapter.)
Paper Trading and Radar Screens
If you have never short traded before, I implore you to paper trade—prac-tice, practice, practice—until you get the procedures and criteria that workfor you down pat. “Pretend” that you make short trades and then carefullynote the results (e.g., if you could have chosen a better entry point, what hap-pened after the short was enacted, and if you could improve on pinpointingan exit point).
By putting trades on your radar screen (monitoring and looking for clearmovement and signals until a good short opportunity arises), you can learn tosuccessfully choose short trade opportunities without losing money. Like whenpaper trading, no harm, no foul.
162 D O N ’ T P L AY I N T H E S T R E E T

SHORTING WITH BROKERS: MARGIN TRADES
In Chapter 4, I made a distinction between the two types of accounts youmay have with a broker: a cash account, in which you provide money up frontas a deposit, and a margin account, in which you borrow money from the bro-ker to make transactions and pay interest on the loan. Both accounts are sub-ject to fees or commissions per trade.
The way the rules are set up for shorting, there is no getting around short-trading with a margin account. You cannot conduct shorts with a cash accountso you must set up a margin account to short. Make sure you read your bro-ker’s margin agreement and understand its implications. (As when applyingfor any loan or credit line, not everyone qualifies.)
When shorting, you are loaned the stock on margin by your broker. Whensomeone buys your stock, your broker holds on to that money in your accountas collateral to make sure you cover the short. If your stock goes in the red (ifthe share price rises), you pay interest on what you’re losing until you coverthe short transaction by buying back the stock.
For example, if you short 100 shares of a stock costing $50 each, the bro-ker holds onto the $5,000 in your margin account. Hopefully, the share’s pricewill drop lower so you can make a profit. However, if the share price increasesto $60, then you not only owe $1,000 ($10 times 100 shares) but you also payinterest on that amount until you cover (buy back) the stock.
There’s no limit to how high the price of a stock might rise—it can dou-ble (go up 100 percent), triple (up 200 percent), or go through the roof (thesky’s the limit), and you must pay interest on your short as it goes up. There-fore, you should set an absolute maximum loss that you’re willing to sustain be-fore bailing out by covering the short. Stick to it. In contrast, when you goshort on a stock using a margin account, the best it can do is to go down tozero, so the maximum gain is 100 percent.
OTHER RISKS
I’ve already mentioned that the risk of losses is unlimited because astock’s price has no ceiling when going up. Now let’s cover some other risksto be aware of when shorting.
Advanced Strategy: Short Orders 163

Short Interest and Short Squeeze
Short interest is the number of shares or percentage of a stock that hasbeen sold short but has not yet been covered. Most stock exchanges trackshort interest in each stock and issue reports at the end of the month. This al-lows investors to see what short sellers are doing.
Rising short interest means that a growing number of people believe astock will go down. High short interest indicates there will eventually be sig-nificant upward pressure on price when all the short sellers cover their shortpositions at the same time. You can see why it is advisable not to short a stockwith high short interest.
If a stock starts to rise and a large number of short sellers try to cover theirpositions at the same time, it can quickly drive up the price even further. Yourincentive is to cover before your fellow shorters do—to beat them to thepunch—because as the buying pressure increases with all the short traderscovering their positions, the price increases, which is the opposite of what you want.
Many times in a down market, you will see a stock spike up in volume andprice. This is often due to individual and institutional traders filling theirshort positions. This volatility is the reason you want to have high volume/liq-uidity in a stock that you short. You need to be able to cover your positionwhen the supply is high, not when it’s limited because you’ll have trouble find-ing a buyer.
Short and Distort
“Short and distort” takes place when traders manipulate stock prices in abear market by taking short positions and then use a smear campaign to drivedown the target stocks even further. Unethical traders spread false informa-tion in an attempt to drive the price of a stock down and make a profit forthemselves by selling short.
Short and distort is the reverse of “pump and dump” in which crooks buystock in a long position and issue false information that causes the targetstocks price to increase.
164 D O N ’ T P L AY I N T H E S T R E E T

ETHICS
Shorting is legal and regulated. Yet there are traders who feel guilty about“betting against the home team” by shorting because they hope to make aprofit on a stock going down. Others perceive short selling as unethical andbad for the market. However, shorting contributes to the market by providingliquidity, efficiency, and acting as a voice of reason in bull markets. Also re-member that every transaction requires a seller (you as a shorter) and a buyer.You can’t trick anyone into buying a stock you’re shorting; they’re going tobuy it anyway. Because shorting provides a ready supply of sellers, short sell-ing helps to maintain a liquid and rational market for those posed to buy.
If you short a stock, you eventually have to buy it back; that’s the way itworks. If you and a lot of other people short the same stock, it may cause thestock price to fall in the short term. Eventually, however, you and every otherperson shorting have to buy the stock back. This activity alone drives priceshigher.
Shorting stocks is a great way to make money if you know what you’redoing and have resources to choose good candidates. You’re not hurting any-body, you’re not hurting the market, and you’re still more of a player in themarket by going short than those who have pulled their money out of themarket entirely and are sitting on the sidelines.
If you make some wise choices, you can make money not only when thestocks you own go up in price but also when the stocks you shorted fall.
Advanced Strategy: Short Orders 165

C h a p t e r
167
11
Joy! Rapture! I’ve got a brain!
SCARECROW, The Wizard of Oz
In this book, you have learned how to clearlyevaluate any stock in the market and recognize good trading opportunities.Now, how do you find those great stocks? Where the heck are they?
You can spend several hours a day on your own researching companiesand stock markets while you dig for sound opportunities, but by performingyour own hunt for a “perfect” trade candidate, you undoubtedly will misssome opportunities while you’re looking—especially short-term trades due totheir small windows of opportunity.
Another option is to explore software programs and online resources thatcan search far quicker than you can because they are computerized. Plus, youcan program them to search for exactly what you’re seeking. The more spe-cific you are about your criteria, the better the program can perform.
How would you like to use a program that searches—in seconds—35,000stocks in major stock markets to locate and identify potential trading candi-dates that meet your personal trading style and strategy? What if that program
EVALUATING 35,000 STOCKSIN SECONDS
also took into account your parameters for a wise trade: the price per sharethat fits your budget and strategy, the minimum volume of activity you want,and your criteria for exploring long or short candidates—and scanned a vari-ety of stock exchanges?
A software program called Wizefinder™ foots this bill. It was designed tobe used in conjunction with Wizetrade™ and quickly scans major stock mar-kets—representing 35,000 stocks—to find potential trading candidates thatmeet your trading style as well as the Wizetrade™ criteria. You can also narrowyour search to meet the parameters you specify; I explain these parameter op-tions in this chapter.
For illustrative purposes in this chapter, I utilize graphics from Wize-finder™. You do not need to subscribe to Wizefinder™ to find great candidates,but it’s a pretty terrific tool, if I do say so myself.
I want to emphasize that I wrote this chapter so that it is valuable to allreaders, whether they have Wizefinder™ or not.
BASIC PARAMETERS
Your trading budget and risk tolerance will define what type of trader youare. Choose parameters that meet your trading style and strategy. Figure 11.1and the sections that follow take a look at parameters for price per share andvolume activity on Wizefinder™’s basic parameter screen. Next, we’ll choosewhether to look at long or short candidates that meet these parameters.
Price per Share
You should set parameters for stock prices within a certain range that fitsyour budget and trading strategy. Wizefinder™ lets you pick any range of stockprices per share that you’re interested in exploring. (In the basic parametersscreen in Figure 11.1, we chose to search for stocks ranging from $10 to $40.)Obviously, the broader the price range, the more candidates you’ll find.
Just remember that a $20 stock may be a great buy while a $50 stock mayprove to be a stinker; it depends on the individual stock. That’s why we desig-nate other parameters and criteria.
Whatever price-per-share range you choose, make sure it fits your budgetand your trading strategy.
168 D O N ’ T P L AY I N T H E S T R E E T

Volume
As I have often stressed before, it is very important to bear in mind trad-ing volume when inspecting a stock. For example, you wouldn’t want to get“stuck” in a stock of which you’ve got a large of number of shares that youcan’t sell because the stock isn’t trading enough volume and therefore lacksliquidity. Lower volume could also mean a greater spread between the bid andask which puts more money into the market makers’ hands, not yours.
By default, Wizefinder™ sets a minimum trading volume of 300,000 sharesper day. You’d like that to be the minimum average over the course of severaldays because consistency in volume is important. I would suggest that, depend-ing on the situation, you look for the following minimum average volume:
Evaluating 35,000 Stocks in Seconds 169
FIGURE 11.1 Example of the Wizefinder™ Basic Parameter Screen

• If you’re going long, use an average daily volume of 400,000 over thecourse of ten days.
• If you’re going short, it’s a good idea to use an average daily volume of600,000 over the course of ten days. This will reflect better liquiditywhich is what you want so that when you are ready to cover your shortthere will be a nice volume of shares traded and the price will reflectthat good liquidity.
In the parameter screen in Figure 11.1, we chose 400,000 for Today’s Min-imum volume, we checked Time Adjusted, and chose 400,000 for AverageDaily Volume (10 days). Let’s look at these volume parameters one at a time.
Today’s Minimum volume will limit the number of stocks returned to thosethat have traded a specified minimum number of shares at the current mo-ment for that day. However, by using Today’s Minimum without selecting Av-erage Daily Volume, the list of potential trading candidates will include stocksthat may be considered one-day wonders (those that spike up in volume forone day only) which are more volatile.
By using Today’s Minimum and Time Adjusted, you’ll limit the number ofstocks returned to those that are on schedule to trade the minimum amountfor the remainder of the trading day. For example, if it’s 10:00 AM and you se-lect a minimum amount of 400,000 along with Time Adjusted, the stocks re-turned may not have traded 400,000 shares so far that day, but if the volumecontinues at the current rate, it is projected that they will have traded at least400,000 shares for the day.
By using Average Daily Volume (over the course of ten days), you will limitthe number of stocks returned to those that have traded, on average, thenumber of shares you select over the past ten days. For example, if you select400,000 as the Average Daily Volume (10 Days), the stocks returned will havetraded on average 400,000 shares or more each day for the past ten days.
Also, by indicating an Average Daily Volume of hundreds of thousands ofshares, you will avoid one-day wonders which may normally be selling rela-tively few shares, for example, 50,000 shares a day, but pop up to hundreds ofthousands of shares one day due to a very unusual amount of buying or sell-ing—no doubt due to institutional manipulation of the market. (If you arelooking for one-day wonders—hopefully for relatively short-term trades thatyou keep a very close watch on—you can choose to view these candidates byclicking on One Day Wonders on the Advanced Parameters page.)
170 D O N ’ T P L AY I N T H E S T R E E T

Long or Short
If the general direction of the market is going up, you’ll find more trad-ing opportunities by selecting the long option. Conversely, if the general di-rection of the market is going down, you’ll find more trading opportunitiesby selecting Short. You can always take a look at both positions—Long andShort—to find as many good trading candidates as possible. In our example,we checked Long.
Other Basic Parameters
Though the layout of the output screen can be customized, we will lookat the standard layout for our purposes. (Only Wizefinder™ users should beconcerned with customizing. The same can be said for the Gap and Net Changeparameters, which generally are not chosen by many users because they fur-ther narrow the trading candidates.)
ADVANCED PARAMETERS
Now let’s switch screens to choose more parameters to help identify stocksthat meet your specific trading strategy, namely your trading techniques andwhich stock exchanges to explore. Figure 11.2 shows this advanced parameterscreen.
Trading Techniques
Wizefinder™ searches the markets for stocks that meet the traditionalWizetrade™ criteria and/or a combination of the following trading techniques(listed under Symbols Satisfying):
• 3 FAST Wizemen™. This parameter finds stocks where the short-term (day),mid-term (week) and long-term (month) indicators are in agreement.
• One-Day Wonders. This parameter finds stocks where the short-term (day)indicator meets the Wizetrade™ criteria. The mid-term and long-termindicators are not considered.
Evaluating 35,000 Stocks in Seconds 171
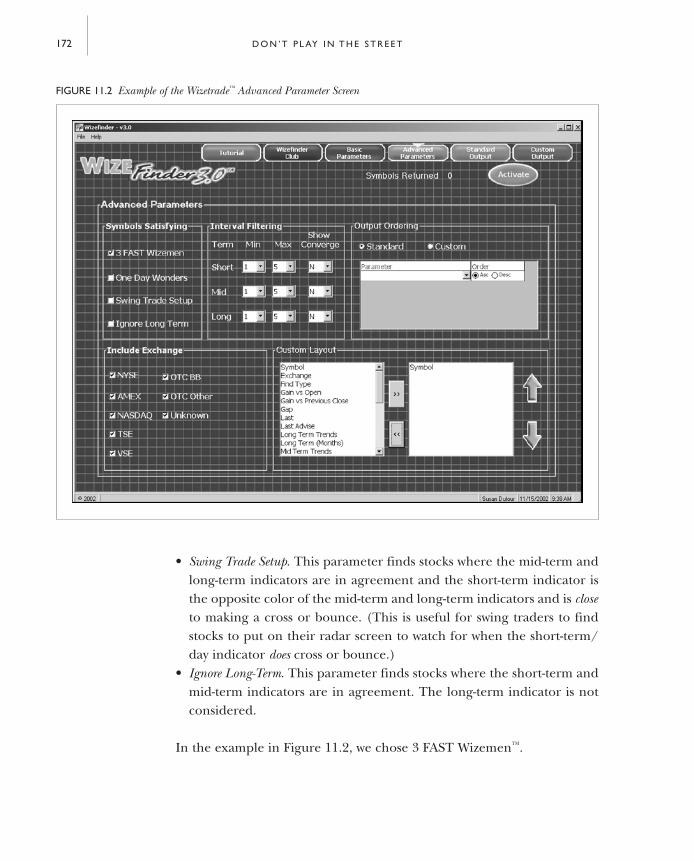
• Swing Trade Setup. This parameter finds stocks where the mid-term andlong-term indicators are in agreement and the short-term indicator isthe opposite color of the mid-term and long-term indicators and is closeto making a cross or bounce. (This is useful for swing traders to findstocks to put on their radar screen to watch for when the short-term/day indicator does cross or bounce.)
• Ignore Long-Term. This parameter finds stocks where the short-term andmid-term indicators are in agreement. The long-term indicator is notconsidered.
In the example in Figure 11.2, we chose 3 FAST Wizemen™.
172 D O N ’ T P L AY I N T H E S T R E E T
FIGURE 11.2 Example of the Wizetrade™ Advanced Parameter Screen

Stock Exchanges
Users may also filter their selection based on all the stocks in specific ex-changes, including:
• New York Stock Exchange (NYSE)• American Stock Exchange (AMEX)• Nasdaq• Two Canadian stock exchanges: TSE (Toronto) and VSE (Vancouver)• Over-the-counter bulletin board (OTC BB)• Over-the-counter other (OTC Other)• Unknown exchanges
If all of these exchanges are chosen for scanning, Wizefinder™ searchesfor candidates among the 35,000 stocks represented by these exchanges and,within seconds, returns the results that meet the parameters you’ve chosen.
In our example, we chose all of the stock exchanges available.
Output Ordering
Under Output Ordering, you can choose the results to be presented inthe standard format or you can customize the output to view whatever datayou desire (choices are listed under Custom Layout) and in the order youwant it displayed. This benefit allows the user to have the list sorted accordingto his or her particular trading concerns. However, for our purposes, we’vechosen the standard format.
Activate for the Outcome Screen
At the top right-hand corner of any screen, you can click the Activate but-ton to show a list of stocks that meet the selected parameters that you’ve cho-sen. You will be taken to either the standard or custom output screen that liststhe stocks that meet your parameters and displays all the pertinent data plusseveral other informative categories.
Figure 11.3 displays on the standard output screen the symbols that arereturned based on the sample parameters we selected for possible long trades.
Evaluating 35,000 Stocks in Seconds 173

The number of symbols returned can be found toward the top right-hand sideof the screen.
On the far left, you can see the list of all of the stock symbols returned forpossible long trades that meet the parameters we chose. If you have tailoredWizefinder™ for your personal trading strategy, you will get a handful of ex-cellent trading candidates.
Most of the category headings for the returned data should be familiar toyou. Let’s concentrate on the four columns toward the right with symbolsknown as pictographs consisting of green and red lines. (The indication of3FW under the Find Type heading at the far right refers to the 3 FAST Wize-men™ criteria at which we chose to look. If we’d chosen One Day Wonders, itwould say ODW instead.)
174 D O N ’ T P L AY I N T H E S T R E E T
FIGURE 11.3 Exampleof the Wizefinder™ Output Screen for Long

Pictographs
Under the headings 90 Min. (Mins), Short Term (Days), Mid Term (Wks),and Long Term (Mons) are pictographs followed by a number in parenthe-ses. The pictographs show the general direction of the green (buying) and red(selling) lines in the Wizetrade™ software.
This is important: The pictographs show the general directions and may notreflect the actual graphs in Wizetrade™. The green and red lines are depictedin one of three directions: up, flat, or down. Therefore, there is a possibility ofnine different pictographs instead of the vast variations found in Wizetrade™.Therefore, you should always verify each trading candidate in Wizetrade™.
The number in parentheses to the right of the pictograph shows thenumber of time intervals since a fresh cross or bounce first occurred. If theletter “c” appears with the number it means that the green and red lines areconverging. Because we’re looking for separation instead of convergence, thepreference would be to not choose stocks with “c” indicators (except in thecase of a swing trade setup) or to put those stocks on our radar screen for fu-ture consideration. (Convergence is when the end of the green and red lineson the chart are pointing toward each other and coming closer together. It ispossible that the lines will soon cross each other or they may “bounce” awayfrom each other; this is wait-and-see time.)
Going Long
In the output screen in Figure 11.3, we chose to look at potential stocksfor going long. Therefore you will notice that green lines (indicating buyingpressure) are all on top of the red lines (indicating selling pressure). The picto-graphs give us a quick way to evaluate the criteria, but you need to know yourobjectives to know what to look for. Are you looking for a long-term positiontrade, an intermediate trade, or a swing trade? The following lists describe thedirection of the lines (as you’d see them on the face of a clock) which youshould concentrate on for each of these strategies when going long.
Long-term position trade (sort list by its mid-term pictograph).
• Day: green line pointing to one o’clock, red line pointing to three o’clock
Evaluating 35,000 Stocks in Seconds 175

• Week: parallel lines (green over red) going up; or green one o’clock,red three o’clock signaling a fresh cross on the week or month
• Month: parallel lines (green over red) going up signaling fresh cross onthe week or month
Intermediate trade (sort list by its mid-term pictograph).
• Day: green at one o’clock, red at three o’clock• Week: green at one o’clock, red at three o’clock signaling a fresh cross
on the week• Month: parallel lines (green over red) going up
Swing trade (sort list by its short-term pictograph).
• Day: green at one o’clock, red at three o’clock signaling a fresh crosson the day
• Week: parallel lines (green over red) going up• Month: parallel lines (green over red) going up
A pictograph represented by green at two o’clock and red at four o’clock(known as an “alligator mouth” because it looks like open jaws) is least desir-able. There is more volatility in this scenario since the sellers (red line) aren’tas active as you would like them to be. With this wide angle, something willhave to give—either the buying pressure will give way to the selling pressureor vice versa. We don’t know at this point in time. (You don’t want to getcaught going the wrong way on a one-way street.)
Going Short
Now let’s look at the standard output screen if we had chosen to go shortwith the same parameters we chose before (see Figure 11.4). The number ofpossible symbols to play short can be found toward the upper right-hand cor-ner of the screen.
In this case, we chose to look at stocks for going short. Therefore you willnotice that red lines (indicating selling pressure) are all on top of the greenlines (indicating buying pressure). The following lists describe the directionof the lines that you should concentrate on for each strategy when going short.
176 D O N ’ T P L AY I N T H E S T R E E T

Long-term position trade (sort list by its mid-term pictograph).
• Day: red at three o’clock, green at five o’clock• Week: red at three o’clock, green at five o’clock; or parallel lines (red
over green) going down signaling a fresh cross on the week or month• Month: parallel lines (red over green) going down signaling a fresh
cross on the week or month
Intermediate trade (sort list by its mid-term pictograph).
• Day: red at three o’clock, green at five o’clock
Evaluating 35,000 Stocks in Seconds 177
FIGURE 11.4 Example of the Wizefinder™ Output Screen for Short

• Week: red at three o’clock, green at five o’clock signaling a fresh crosson the week
• Month: parallel lines (red over green) going down
Swing trade (sort list by its short-term pictograph).
• Day: red at three o’clock, green at five o’clock signaling a fresh cross onthe day
• Week: red at three o’clock, green at five o’clock; or parallel lines (redover green) going down
• Month: parallel lines (red over green) going down
A pictograph represented by red at two o’clock and green at four o’clock(an “alligator mouth”) is least desirable because there is more volatility in thisscenario. The buyers aren’t as active as you would like them to be. Just as whengoing long, either the selling pressure will give way to the buying pressure orvice versa. Again, we don’t know at this point in time.
Going with the Flow
When we looked at both the long and short output screens, we saw thenumber of possible trading candidates that were found for each strategy.What if the number for the long or short candidates greatly outnumbered thecandidates of the other? What should we glean from a big discrepancy be-tween the number of long and short candidates?
Let me relate a true story that will help me explain.When I first visited the campus of North Texas State where I went to
school, I tried to get my bearings by driving around looking for buildings. Ididn’t think I knew any students or faculty there, however, the occupants ofevery car I passed going the other way waved at me. Being from Texas, I wavedback, wondering if I knew them. Then cars started blowing horns and flash-ing lights at me. I thought, “These folks are awful friendly here.” I must havelooked like a fire truck as I flashed my lights and honked my horn in return.Finally, I noticed a one-way sign. I was going the wrong way.
Wizefinder™ tells you when you’re going the wrong way. If you run a scanof the 35,000 stocks and find only 5 stocks on the long side and 120 stocks on
178 D O N ’ T P L AY I N T H E S T R E E T

the short side, yet you still are trying to go long, Wizefinder™ tells you thatyou’re going the wrong way.
It also tells you when to go to cash and stay out of the market altogether.Cash is always a viable option as opposed to trading. If you run a scan for longtrades and only a couple of stocks are returned, it’s a warning to not go long.If you run a scan for short trades and only a couple come back, you would bewell advised not to be trading short.
Going back to my flying story from Chapter 9, there are days when youwish that you were in the air while you’re sitting on the ground but that’s bet-ter than being in the air and wishing you were on the ground. Wizefinder™ isan invaluable tool that identifies the overall market condition and direction,whether it’s intraday or over the course of days, weeks, or months.
If there is an overwhelming trend for longs or shorts, you can either gowith the flow or take your chances in going the opposite direction—but atleast you’ll know what you’re getting into.
EXCEL-LENT POSSIBILITY
Once your list of stocks is on the screen, you may export this informationto a Microsoft Excel spreadsheet by clicking on the export icon in the upperright-hand corner of the screen (it looks like two overlapping pieces of paper).This allows you to save your list in an Excel file and make notations about thestocks you selected and why you decided to trade or not trade a particularstock. This will be beneficial over time, especially if you add a notation inExcel about why you chose to trade a particular stock. You can learn from yoursuccesses and your mistakes.
TALKING TO WIZETRADE™
A big time saver is the ability to drag and drop Wizefinder™ opportunitiesinto Wizetrade™ for further analysis. Wizefinder™’s purpose is to help youquickly find candidates. While it shows basic criteria, you need to see the in-depth charts found in Wizetrade™ so you can analize the stock more com-pletely. After all, we only use nine pictographs in Wizefinder™ so it cannot beas specific or show the long-term trends as the charts in Wizetrade™.
Evaluating 35,000 Stocks in Seconds 179

Here are seven steps to success while utilizing Wizefinder™ and Wizetrade™:
In Wizefinder™: 1. Set your basic and advanced parameters 2. Select long or short 3. Activate Wizefinder™ to scan the stock exchanges4. Transfer a resulting stock symbol into Wizetrade™
In Wizetrade™:
1. Verify charts for fresh cross or bounce 2. Verify charts for good angle and separation in the short term (days),
mid-term (weeks) and long term (months) 3. Check all indicators for fresh crosses to time your entry
Happy trails and happy trading!
180 D O N ’ T P L AY I N T H E S T R E E T

181
P h o t o G a l l e r y
Greg Schardt and George Thompson
George Thompson and Marc Sparks

182 Photo Gallery
George Thompson, Zig Zigler, Marc Sparks
Mark McDonnell

Photo Gallery 183
Marc Sparks, George Thompson, Senator Bob Dole
Senator Bob Dole and George Thompson

184 Photo Gallery
George Thompson at GlobalTec Solutions Office
GlobalTec Solutions Team

Photo Gallery 185
Mark McDonnell, Ron Points, Jack Kyne, George Thompson
WizeFEST 2002 Las Vegas Money Show

186 Photo Gallery
WiseFEST 2002
Marc Sparks and George Thompson, Studio Production

A p p e n d i x
187
Truth be told, most people are baffled by thestock tables and quotations bombarding them on TV and over the Internet.Perhaps the only people you ever see scouring the zillions of stock quotes inthe financial pages of the newspaper are those you pass in First Class as youdrag your carry-on back to coach (Who are they trying to impress?!) If youown a bird, those pages most likely are the first to line its cage.
I suspect that many folks are intimidated to ask how to decipher thesequotes because they think “I should know that, but I don’t want anyone toknow I don’t have a clue.” Well, there’s nothing to be embarrassed about. Ifyou don’t understand these quotes, you’re in the majority. Believe me. I don’twant to turn this into a conspiracy, but remember when I said that Wall Streetinstitutions wanted us to be clueless so we’ll blindly follow their advice and paydearly for it. Why should stock tables be any different?
The truth shall set you free. Here’s the scoop.
IN THE NEWSPAPER
You’ve probably noticed the long columns of numbers and symbols at theback of the financial section of your newspaper. Although they may seem con-
HOW TO READ STOCK TABLES

fusing at first, these columns—referred to as stock tables or listings—are theheart of the financial pages.
The stock tables list just about every publicly traded company in theUnited States and include a summary of its market activities from the previ-ous day and other crucial information about the company and its stock. Se-curities listed include stocks (both common and preferred), bonds, moneymarket funds, and mutual funds.
Once you adjust your eyes to the fine print, reading the stock tables is re-ally quite simple. Figure A.1 is a sample stock table, and Figure A.2 providesdescriptions of all the elements of this table.
In addition to these standard abbreviations, the stock tables in the Wall StreetJournal (and other newspapers) often include other symbols indicating a varietyof factors, such as stock splits, dividend changes, first day of trading, new 52-week high or low, warrants, and many other relevant conditions. The financialsection provides a key to explain the symbols or abbreviations for these categories.
Another interesting note is that the prices you used to see that included1/2, 3/4, etc., have been changed to decimals. In 2001, the NYSE became the firstU.S. market to adopt this practice of trading in dollars and cents instead offractions.
READING A QUOTE ON THE INTERNET
Today, it’s far more convenient and accessible for most folks to get stockquotes off the Internet. This method is superior to printed quotes becausemost Web sites:
188 How to Read Stock Tables
FIGURE A.1 Sample Stock Table
52 W 52 W YIELD VOL NETHIGH LOW STOCK TICKER DIV % P/E 00S HIGH LOW CLOSE CHG
s45.39 19.75 ResMed RMD 0.00 0.00 52.5 3831 42.00 39.51 41.50 -1.90s11.63 3.55 Revlon A REV 162 6.09 5.90 6.09 +0.12s77.25 55.13 RioTinlo RTP 2.30 3.2 168 72.75 71.84 72.74 +0.03s31.31 16.63 RitchieBr RBA 20.9 15 24.49 24.29 24.49 -0.01s 8.44 1.75 RiteAid RAD 31028 4.50 4.20 4.31 +0.21s38.63 18.81 RobtHall RHI 26.5 6517 27.15 26.50 26.50 26.50 +0.14s51.25 27.69 Rockwell ROK 1.02 2.1 14.5 6412 49.99 47.00 47.54 +0.24
↑ ↑ ↑ ↑ ↑ ↑ ↑ ↑ ↑ ↑ ↑ ↑1 2 3 4 5 6 7 8 9 10 11 12

• Update throughout the day (some more often than others)• Give you more related information, news, charting, research, etc.
Also if you don’t understand an abbreviation, you usually can click on itto find out what it means. (Because each site tailors its presentation to beunique, they’re all a little different, however, they try to make this informationas accessible as possible to new “visitors.”)
To get quotes, simply enter the ticker symbol in the quote box of anymajor financial site.
How to Read Stock Tables 189
FIGURE A.2 The Elements of a Stock Table
Column Column # Heading What It Means
1 52 W High The highest prices paid for the stock during the past year.2 52 W Low The lowest prices paid for the stock during the past year.3 Stock The name of the company. If there are no special symbols or letters
following the name, it is a common stock. Different symbols imply dif-ferent classes of shares, for example, “pf” means the shares are pre-ferred stock.
4 Ticker This ticker symbol is the unique alphabetic name identifying the stock.If you don’t know what a particular company’s ticker is, you can searchfor it online at <www.finance.yahoo.com>.
5 Div Short for dividend. A dividend is when a public company decides to paya portion of its profits to stockholders. For each share of stock owned,a shareholder should receive the listed price from the company’s an-nual profits.
6 Yield % The yield, or rate of return, on a stockholder’s investment. It is figuredby dividing the annual dividend by the current price of the stock.
7 P/E Short for price/earnings ratio. The price of a share of stock divided bythe company’s earnings per share for the last year.
8 Vol 00s The total amount of stock traded during the previous day with the last (or Sales 00s) two digits dropped off (i.e., a listing of 3831 translates as 383,100).
9 High The highest price paid for the stock during the previous day.10 Low The lowest price paid for the stock during the previous day.11 Close The last/closing price paid for the stock at the end of the previous day.
(or Last) If the closing price is up or down more than 5 percent than the previ-ous day’s close, the entire listing for that stock is boldfaced. Keep inmind, you are not guaranteed to get this price if you buy the stock thenext day because the price is constantly changing, but it’s an approxi-mation of what you might expect to pay.
12 Net Chg The difference between the last trade and the previous day’s price.(or Chg)

The example in Figure A.3 shows a quote for Microsoft (MSFT) fromYahoo! Finance. You interpret the data in the same way you do in the news-paper, though again, quotes will be presented differently on various Web sites.
READING A STOCK TICKER ON TV
If you’ve ever watched a financial program on TV (perhaps CNBC orCNNfn), you’ve no doubt noticed those numbers scrolling along the bottomof the TV screen. This is known as a stock ticker, a presentation conceived byThomas Edison, though today ticker tape has been replaced by an electronicscroll. Figure A.4 shows an example of a TV ticker scroll, and Figure A.5 pres-ents the corresponding explanations.
Many streaming tickers use colors to distinguish how the stock is faringthat day. Most TV stations use the following color scheme:
• Green. The stock is trading higher than the most recent closing price.• Red. The stock is trading lower than the most recent closing price.• Blue or white. The stock is unchanged from the most recent closing price.
190 How to Read Stock Tables
FIGURE A.3 Sample Online Stock Table

It’s impossible for TV stations to report every single trade on their tickertape because there are millions of trades made on over 10,000 different stocksevery day. The TV station selects which trades to show based on factors suchas volume, trading activity, price change, and how widely held a stock is.
How to Read Stock Tables 191
FIGURE A.4 Sample TV Ticker
FIGURE A.5 The Elements of a TV Ticker
Ticker Symbol The unique characters used to identify the company; in this case Microsoft (MSFT).Shares Traded Volume of the trade being quoted. Abbreviations are K = 1000, M = 1,000,000,
and B = 1,000,000.Price Traded Price per share for the particular tradeChange Direction Shows whether the trade was higher or lower compared to the previous day’s
closing price.Change Amount The difference in price from the previous day’s close.
How to Read a Stock Ticker
MSFT 5K @ 61.25 ▼ 1.35Ticker
SymbolSharesTraded
PriceTraded
ChangeDirection
ChangeAmount

G l o s s a r y
192
agent A person who buys or sells for the account and risk of another. Gener-ally, an agent takes no financial risk and charges a commission for his orher services.
arbitrage A technique used by alert traders, now aided by sophisticated com-puter programs, to profit from minute price differences for the same secu-rity on different markets. For example, if a computer monitoring marketsnotices that ABC stock can be bought on a New York exchange for $10 ashare and sold on a London exchange at $10.12, the arbitrageur or a spe-cial program can simultaneously purchase ABC stock in New York whileselling the same amount it in London, thus pocketing the difference.
averages A statistical tool for measuring the performance of securities mar-kets. The most common is an average such as the Dow Jones Industrial Av-erage, in which the prices of 30 industrial stocks are totaled and dividedby a divisor that is intended to compensate for past stock splits and divi-dends. As a result, point changes in the average have only the vaguest re-lationship to dollar price changes in stocks included in the average.
bear market A term to describe a market of declining prices.
beta Coefficient measuring a stock’s relative volatility. The beta is a covarianceof the stock in relation to the rest of the stock market. The Standard &Poor’s 500 Stock Index has a beta coefficient of 1. Any stock with a higherbeta is more volatile than the market, and any with a lower beta can be ex-pected to rise and fall more slowly than the market. A conservative in-vestor whose main concern is preservation of capital should focus onstocks with low betas, whereas one willing to take high risks in an effort toearn high rewards should look for high-beta stocks.
bid and ask Collectively called the “quote,” the bid refers to the highest pricea buyer is willing to pay for a stock, while the ask is the lowest price a sellerwill accept.
broker An agent who acts as an intermediary between buyer and seller in trad-ing securities, commodities, or other property. He charges a commissionfor this service.

capital gain Profit earned on the sale of securities, either through dividends orby selling the securities at a higher price than they originally cost.
capital stock All shares representing ownership of a business, including com-mon and preferred.
capitalization Total amount of various securities issued by a corporation. Cap-italization may include bonds, debentures, preferred and common stock,and surplus.
cash sale A transaction on the floor of a stock exchange that calls for deliveryof the securities the same day. In regular stock trades, the seller is to de-liver on the third business day. Bonds must be delivered on the next dayafter a trade.
collateral Securities or other property pledged by a borrower to secure repay-ment of a loan.
commission The broker’s basic fee for purchasing or selling securities as anagent.
commission broker An agent who executes the public’s orders for the pur-chase or sale of securities or commodities.
common stock Securities that represent an ownership interest in a corpora-tion. If the company has also issued preferred stock, both common andpreferred have ownership rights. Common stockholders assume the greaterrisk, but generally exercise the greater control and may gain the greateraward in the form of dividends and capital appreciation. The terms com-mon stock and capital stock are often used interchangeably when the com-pany has no preferred stock.
competitive trader A member of an exchange who trades in stocks on the floorfor an account in which there is an interest. Also known as a registeredtrader.
cumulative voting A method of voting for corporate directors that enables theshareholders to multiply the number of their shares by the number of di-rectorships being voted on and to cast the total for one director or a se-lected group of directors. A 10-shareholder normally casts 10 votes foreach of, say, 12 nominees to the board of directors. One thus has 120votes. Under the cumulative voting principle, one may do that or may cast120 (10×12) votes for only one nominee, 60 for two, 40 for three, or anyother distribution one chooses. Cumulative voting is required under thecorporate laws of some states and is permitted in most others.
day order An order to buy or sell which, if not executed, expires at the end ofthe trading day on which it was entered.
Glossary 193

dealer An individual or firm in the securities industry who buys and sells stocksand bonds as a principal rather than as an agent. The dealer’s profit orloss is the difference between the price paid and the price received for thesame security. The dealer’s confirmation must disclose to the customerthat the principal has been acted upon. The same individual or firm mayfunction, at different times, either as broker or dealer.
debit balance In a customer’s margin account, that portion of the purchaseprice of stock, bonds, or commodities that is covered by credit extendedby the broker to the margin customer.
delayed opening The postponement of the trading of an issue on a stock ex-change because of unusual market conditions. Reasons for the delay mightbe an influx of either buy or sell orders, an imbalance of buyers and sell-ers, or pending corporate news that requires time for dissemination.
Depository Trust Company (DTC) The Depository Trust Company (DTC) isthe world’s largest securities depositary with more than $10 trillion worthof securities in custody. In 1995, DTC processed $41 trillion of securitiesthrough its book-entry settlement system. DTC is a national clearinghouse for the settlement of trade in corporate and municipal securitiesand performs securities custody-related services for its participating banksand broker-dealers. DTC is owned by members of the financial industryand by their representatives who are its users. DTC is 35.1 percent ownedby the New York Stock Exchange on behalf of the Exchange’s members.It is operated by a separate management and has an independent boardof directors. It is a limited purpose trust company and is a member of theFederal Reserve.
director Person elected by shareholders, usually during an annual meeting, toserve on the board of directors of a corporation. The directors appointthe president, vice president, and all other operating officers. Directorsdecide, among other matters, if and when dividends shall be paid.
discretionary account An account in which the customer gives the broker orsomeone else discretion to buy and sell securities or commodities includ-ing selection, timing, amount, and price to be paid or received.
diversification Spreading investments among different types of securities andvarious companies in different fields.
dividend The payment designated by the board of directors to be distributedpro rata among the shares outstanding. For preferred shares, the dividendis usually a fixed amount. For common shares, the dividend varies withthe fortunes of the company and the amount of cash on hand, and maybe omitted if business is poor or if the directors determine to withhold
194 Glossary

Glossary 195
earnings to invest in plants and equipment. Sometimes a company willpay a dividend out of past earnings even if it is not currently operating ata profit.
earnings report A statement issued by a company showing its revenues and ex-penses over a given period. The health of a company’s earnings is whatmost investors consider when buying stock.
economic indicator A key statistic in the overall economy that experts use as ayardstick to predict the performance of the stock market.
equity Ownership in a company. Whereas bonds represent debt, stocks repre-sent equity.
ex-dividend A synonym for “without dividend.” The buyer of an ex-dividendstock is not entitled to the next dividend payment. Dividends are paid ona set date to all those shareholders recorded on the books of the companyas of a previous date of record. For example, a dividend may be declaredas payable to stockholders of record on a given Friday. Because three busi-ness days are allowed for delivery of stock in a regular transaction on theNew York Stock Exchange, the exchange would declare the stock ex-dividend as of the opening of the market on the preceding Wednesday.That means anyone who bought it on or after that Wednesday would notbe entitled to that dividend. When stocks go ex-dividend, the stock tablesinclude the symbol “x” following the name.
fair market price A reasonable price for securities based on supply and demand.
free and open market A market in which supply and demand are freely ex-pressed in terms of price. Contrasts with a controlled market in whichsupply, demand, and price may all be regulated.
fundamental research Analysis of industries and companies based on such fac-tors as sales, assets, earnings, products or services, markets, and manage-ment. As applied to the economy, fundamental research includesconsideration of gross national product, interest rates, unemployment, in-ventories, savings, etc.
good delivery Certain basic qualifications must be met before a security soldon an exchange may be delivered. The security must be in proper formto comply with the contract of sale and to transfer title to the purchaser.
good ’til cancelled (GTC) order An order to buy or sell that remains in effectuntil it is either executed or canceled. Also called an open order.
hypothecation The pledging of securities as collateral; for example, to securethe debit balance in a margin account.
Intermarket Trading System (ITS) An electronic communications network that linksthe exchanges of nine markets—New York (NYSE), American (AMEX),

196 Glossary
Boston (BSE), Chicago (MSE), Cincinnati (CSE), Pacific (PSE), Philadel-phia (PHLX), the Chicago Board Options Exchange (CBOE), and theNASD. The system enables market professionals to interact with theircounterparts in other markets whenever the nationwide ConsolidatedQuote System (CQS) shows a better price. ITS was inaugurated on a pilotbasis on April 17, 1978, with the New York and Philadelphia exchangestrading 11 stocks. During mid-1978, four other exchanges joined the sys-tem. Gradually, more issues were added. The Cincinnati Stock Exchangejoined in February 1981. The NASD became a participant on May 17,1982, when an experimental linkage between ITS and CAES, an automatedsystem operated by the NASD, was ordered by the SEC. This pilot wasoriginally limited to 30 listed stocks (23 on the NYSE and 7 on the AMEX)in which SEC Rule 19c-3 permits exchange member firms to make dealermarkets in away from any exchange trading floor. The Chicago Board Op-tions Exchange joined on February 20, 1991. The 3,293 issues eligible fortrading on ITS at the end of 1994 represented most of the stocks tradedon more than one exchange. Of these stocks, 2,817 are listed on the NewYork Stock Exchange and 476 on the American Stock Exchange.
investment bank Also known as underwriters, investment banks serve as mid-dlemen between corporations issuing new securities and the buying public.Normally, one or more investment banks buy the new issue of securitiesfrom the issuing company for a negotiated price. The company walksaway with this new supply of capital, while the investment banks form asyndicate and resell the issue to their customer base and the investingpublic. Investment banks perform a variety of other financial services,such as merger and acquisition advice and market analysis.
investment company A company or trust that uses its capital to invest in othercompanies. There are two principal types: the closed end and the openend, also known as a mutual fund. Shares of closed-end investment com-panies, most of which are listed on the NYSE, are readily transferable inthe open market and are bought and sold like shares of stock. Capitaliza-tion of these companies remains the same unless action is taken tochange, which is rare. Open-end funds sell their own new shares to in-vestors, stand ready to buy back their old shares, and are not listed. Open-end funds are so called because their capitalization is not fixed; they issuemore shares as people want them.
IRA (individual retirement account) An individual pension fund that anyonemay open with a bank. An IRA permits investment of contributed fundsthrough intermediaries like mutual funds, insurance companies, andbanks, or directly in stocks and bonds through stockbrokers. Because it isintended for retirement, money in an IRA enjoys many tax advantages

over traditional investments, but may not be withdrawn early withoutheavy penalty fees.
Keough plan Tax-advantaged personal retirement program that can be estab-lished by a self-employed individual.
limit order An order to buy or sell when and if a security reaches a specificprice.
limit order processing The limit order system electronically files orders whichare to be executed when and if the specific limit price is reached. The sys-tem accepts limit orders up to 99,999 shares and electronically updatesthe specialist’s electronic book. Good ’til cancelled orders not executed onthe day of submission are automatically stored until executed or cancelled.
liquidity (1) How easily one’s assets can be converted back into cash. For ex-ample, money in an account that can’t be withdrawn for ten years is notvery liquid. (2) The ability of the market in a particular security to absorba reasonable amount of buying or selling at reasonable price changes.Liquidity is one of the most important characteristics of a good market.
listed stock The stock of a company that is traded on a securities exchange.The various stock exchanges have different standards for listing. Some ofthe guides used by the New York Stock Exchange for an original listingare national interest in the company and a minimum of 1.1 million sharespublicly held among not less than 2,000 round-lot stockholders. The pub-licly held common shares should have a minimum aggregate marketvalue of $18 million. The company should have net income in the latestyear of over $2.5 million before federal income tax and $2 million in eachof the preceding two years.
long Signifies ownership of securities. “I am long 100 IBM” means the speakerowns 100 shares.
manipulation An illegal operation. Buying or selling a security for the purposeof creating false or misleading appearance of active trading or for the pur-pose of raising or depressing the price to induce purchase or sale by others.
margin The amount paid by the customer when using a broker’s credit to buyor sell a security. Under Federal Reserve regulations, the initial margin re-quired since 1934 has ranged from 40 percent of the purchase price up to 100 percent. Since 1974 the current rate of 50 percent has been ineffect.
margin call A demand upon a customer to put up money or securities with thebroker. The call is made when a purchase is made; also if a customer’s eq-uity in a margin account declines below a minimum standard set by theexchange or by the firm.
Glossary 197

198 Glossary
market-on-close (MOC) order A market order, which is to be executed in its en-tirety at the closing price, on an exchange, of the stock named in the order,and if not so executed, is to be treated as cancelled. The term at the closeorder shall also include a limit order that is entered for execution at theclosing price, on an exchange, of the stock named in the order pursuantto such procedures as an exchange may from time to time establish.
market maker A broker/dealer who is registered to trade in a given securityon the Nasdaq.
market order processing SuperDot’s market order system is designed to processmember firms’ market orders of up to 30,099 shares. The system providesfor rapid execution and reporting of market orders. In 1994, market or-ders were executed and reported back to the originating member firm onaverage within 24 seconds.
market order An order to buy or sell at the best price, currently available onthe Trading Floor.
market price The last reported price at which the stock or bond sold, or thecurrent quote.
market value The current resale value of a security. The market value of anissue is easily computed as the closing price multiplied by the shares outstanding.
member An individual that has trading privileges on the New York Stock Ex-change. There are three ways to become a member:1. Purchase or lease a seat. Currently, there is a fixed number of seats (1,366)
on the NYSE. An individual must purchase or lease from someone whois already a member. The most recent seat sale was on March 1, 1999,for $2,600,000.
2. Apply for physical access. An individual pays an annual fee to the NYSEthat allows access to the floor for trading.
3. Apply for electronic access. An individual pays an annual fee to the NYSEthat allows all member privileges except the ability to trade on the floor.
member corporation A securities brokerage firm organized as a corporation,with at least one member of the New York Stock Exchange who is an offi-cer or employee of the corporation.
member firm A securities brokerage firm organized as a corporation, partner-ship, or sole proprietorship with at least one member of the NYSE who isan officer or employee of the corporation.
NASD The National Association of Securities Dealers is an industry associationof broker/dealers in the over-the-counter securities business. The NASDis self-regulatory body and administers the Nasdaq stock market.

Nasdaq An automatic information network that provides brokers and dealerswith price quotations on securities traded over the counter; see over-the-counter market.
net change The change in the price of a security from the closing price of oneday to the closing price on the next day on which the stock is traded. Thenet change is ordinarily the last figure in the newspaper stock price list.The mark +1 1/8 means up $1.125 a share from the last sale on the pre-vious day the stock traded.
new issue A stock or bond sold by a corporation for the first time. Proceedsmay be used to retire outstanding securities of the company, for newplants or equipment, for additional working capital, or to acquire a pub-lic ownership interest in the company for private owners.
New York Stock Exchange (NYSE) The NYSE marketplace blends public pricingwith assigned dealer responsibilities. Aided by advanced technology, pub-lic orders meet and interact on the trading floor with a minimum ofdealer interference. The result is competitive price discovery at the pointof sale. Liquidity in the NYSE auction market system is provided by indi-vidual and institutional investors, member firms trading for their own ac-counts, and assigned specialists. The NYSE is linked with other marketstrading listed securities through the Intermarket Trading System (ITS).NYSE-assigned dealers, known as specialists, are responsible for maintain-ing a fair and orderly market in the securities assigned to them. Most trad-ing, however, is conducted by brokers acting on behalf of customers,rather than by dealers trading for their own account. For this reason, theNYSE is often described as an agency auction market. The interaction ofnatural buyers and sellers determines the price of a NYSE-listed stock.
odd lots Stock transactions that involve less than 100 shares.
offer The price at which a person is willing to sell a security.
options A derivative security that gives the holder the right to buy or sell aspecified amount of the underlying security at a specific strike price andwithin a specified time frame. The purchaser hopes that the stock pricewill go up (if he or she buys a call) or down (if he or she buys a put) byan amount sufficiently above or below the strike price to provide a profitwhen the option is exercised. If the stock price holds steady or moves inthe opposite direction, the price paid for the option is lost entirely. Thereare several other types of options available to the public but these are ba-sically combinations of puts and calls. Individuals may write (sell) as wellas purchase options. Options on stock indexes, futures, and debt instru-ments also exist.
Glossary 199

over-the-counter (OTC) market A market for securities made up of dealerswho may or may not be members of a securities exchange. OTC firmsconduct business over the telephone and act either as principals or deal-ers (buying and selling stock from their own inventory and charging amarkup) or as a broker or agent and charging a commission.
paper profit (loss) An unrealized profit (or loss) on a security still held. Paperprofits (and losses) become realized only when the security is sold.
penny stocks Low-priced issues, often highly speculative, selling at less than $1a share. Frequently used as a term of disparagement, although some pennystocks have developed into investment-caliber issues.
preferred stock A type of stock that pays a fixed dividend regardless of corpo-rate earnings, and which has priority over common stock in the paymentof dividends. However, it carries no voting rights, and should earnings risesignificantly the preferred holder is stuck with the same fixed dividendwhile common holders collect more. The fixed income stream of pre-ferred stock makes it similar in many ways to bonds.
price-earnings (PE) ratio A popular measure for comparing stocks selling at dif-ferent prices in order to single out overvalued or undervalued issues. ThePE ratio is simply the price per share divided by the company’s earningsper share. However, PE is not always an accurate guide to a stock’s qual-ity. Some people tend to think that a stock is inflated and drastically over-valued if its price is many times its earnings. Yet that same stock may bequite accurately valued to reflect the company’s rapid growth and poten-tial for high future earnings. When comparing PEs it is therefore impor-tant to choose stocks in the same industry that are likely to face the sameearnings prospects.
primary market The process by which a corporation’s stock is issued for thefirst time. It is then sold to the public on the secondary market.
principal Any person who buys or sells a security for his or her own account.Also refers to an executive of a firm that actively engages in that firm’strading business.
program trade Program trading is defined as a wide range of portfolio tradingstrategies involving the purchase or sale of 15 or more stocks having atotal market value of $1 million or more. One example is index arbitrage.Index arbitrage is defined as the purchase or sale of a basket of stocks inconjunction with the sale or purchase of a derivative product, such asindex futures, in order to profit from the price difference between thebasket and the derivative product. Other examples of program tradingstrategies are liquidation of facilitation’s, liquidation of EFP stock posi-
200 Glossary

tions, and portfolio management, which includes portfolio realignmentand portfolio liquidations. The NYSE’s program trading statistics are aimedat assessing the impact of these transactions on the normal functioning ofthe market. Daily program trading activity is calculated as the sum ofshares bought, sold, and sold short in program trades. The total of theseshares divided by total reported volume then provides a percentage whichillustrates the relative importance of program trading during the periodin question. This method is not the only way to measure program trading.One alternative would be to examine buy programs as a percentage oftotal purchases; another would be to examine sell programs as percent-age of total sales. A third alternative is to calculate program purchases andsales as a percentage of total purchases and sales or twice total volume(TTV).
proxy A ballot by which stockholders can transmit their votes on corporatematters without needing to attend the actual shareholders meeting. Aproxy could also state the stockholder’s intention to transfer voting rightsto someone else. A company’s shareholders are commonly asked to voteon such matters as electing a board of directors, approving mergers andacquisitions, and sometimes on proposals that other stockholders havesubmitted to management. One share generally equals one vote.
quote The highest bid to buy and the lowest offer to sell any stock at a giventime.
rally A brisk rise following a decline in the general price level of the market,or in an individual stock.
recession A period of no or negative economic growth and high unemployment.
registered competitive market maker Members of the New York Stock Ex-change who trade on the floor for their own or their firm’s account andwho have an obligation, when called upon by an exchange official, to nar-row a quote or improve the depth of an existing quote by their own bidor offer.
registered representative The person, normally employed by a brokerage firmor broker/dealer, who acts as an account executive for customers to buyand sell securities. The term registered means the individual has passedqualifying securities examinations and is registered with the SEC.
regular way delivery Unless otherwise specified, securities sold on the NewYork Stock Exchange are to be delivered to the buying broker by the sell-ing broker and payment made to the selling broker by the buying brokeron the third business day after the transaction. Regular delivery for bondsis the following business day.
Glossary 201

Regulation T The federal regulation governing the amount of credit that maybe advanced by brokers and dealers to customers for the purchase of securities.
Regulation U The federal regulation governing the amount of credit that maybe advanced by a bank to its customers for the purchase of listed stock.
round lot order An order to buy or sell in multiples of 100 shares.
secondary distribution Also known as a secondary offering. The redistributionof a block of stocks some time after it has been sold by the issuing com-pany. The sale is handled off of the exchange by one or more securitiesfirms at a fixed price related to the market price. The block of stock is usu-ally large, such as might be involved in the settlement of an estate.
secondary market When stocks or bonds are traded or resold, they are said tobe sold on a secondary market. The majority of all securities transactionstake place on a secondary market.
Securities and Exchange Commission (SEC) A watch-dog agency created by theU.S. Congress to monitor the securities industry and enforce punish-ments of those that violate the industry’s regulations.
Securities Industry Association (SIA) Represents the collective business interestsof more than 500 brokerages and investment banking firms. Membershipincludes most NYSE member organizations, major firms of all U.S. andCanadian exchanges, and the OTC market.
Securities Industry Automation Corporation (SIAC) The organization which op-erates the automation and communications systems of the New York StockExchange and American Stock Exchange to support trading, market datareporting, and surveillance activities. SIAC also supports the NSCC’s na-tionwide clearance and settlement systems and it is the systems processorfor industry-wide National Market System components, such as CTS, CQS,and ITS. SIAC is jointly owned by the NYSE and AMEX.
self-regulation The way in which the securities industry monitors itself to cre-ate a fair and orderly trading environment.
settlement The conclusion of a transaction in which parties pay for securitiespurchased and take delivery of securities sold.
short covering Buying stock to return stock previously borrowed to make de-livery on a short sale.
short position Stock options or futures contracts sold short and not covered asof a particular date. On the NYSE, a tabulation is issued once a month list-ing all issues on the exchange in which there was a short position of 5,000or more shares and issues in which the short position had changed by
202 Glossary

2,000 or more shares in the preceding month. Short position also meansthe total amount of stock an individual has sold short and has not cov-ered, as of a particular date.
short sale A transaction by a person who believes a security will decline andsells it, though the person does not own the security. For instance: You in-struct your broker to sell 100 shares of XYZ. Your broker borrows thestock so delivery of the 100 shares can be made to the buyer. Your brokerdeposits the money value of the shares borrowed with the lender. Sooneror later you must cover your short sale by buying the same amount ofstock you borrowed for return to the lender. If you are able to buy XYZ ata lower price than you sold it for, your profit is the difference between thetwo prices, not counting commission and taxes. But if you have to paymore for the stock than the price you received, that is the amount of yourloss. Stock exchange and federal regulations govern and limit the condi-tions under which a short sale may be made on a national securities ex-change. Sometimes people will sell short a stock they already own in orderto protect a paper profit. This is known as selling short against the box.
specialist Central to the New York Stock Exchange customer-driven system isthe specialist. Specialists manage the auction market in the specific secu-rities allocated to them. Specialist units are independent companies incorporate or partnership structures. There are ten firms employing 482specialists who specialize in more than 2,800 stocks. Specialists conducttrading in equities across a range of industries. The number of stockstraded by an individual specialist varies according to the total activity ofthe stocks. Specialist firms distribute the activity to balance the workloadfor each specialist. Most specialists manage between five and ten stocks. Aspecialist managing one of the most active issues would normally special-ize in that stock and perhaps one less active stock. A specialist must main-tain a fair, competitive, orderly and efficient market. This means that allcustomer orders have an equal opportunity to interact and receive thebest price. It also means that once auction trading begins, a customershould be able to buy or sell a reasonable amount of stock close to the lastsale. Therefore, a specialist works to avoid large or unreasonable pricevariations between consecutive sales. The results: almost 98 percent of alltrades take place at 1/8 point or less from the last sale. The auction takesplace at the specialist’s post where the stocks are traded. This single loca-tion, or point of sale, combined with rules of trading, guarantees maxi-mum order exposure, interaction, and market liquidity.
split The division of the outstanding shares of a corporation into either alarger or smaller number of shares, without any immediate impact in indi-
Glossary 203

vidual shareholder equity. For example, a three-for-one forward split by acompany with one million shares outstanding results in three million sharesoutstanding. Each holder of 100 shares before the split would have 300shares each worth less, although the proportionate equity in the companywould stay the same. A reverse split would reduce the number of sharesoutstanding and each share would be worth more.
stock dividend A dividend paid in securities rather than cash. The dividendmay be additional shares of the issuing company, or in shares of anothercompany (usually a subsidiary) held by the company.
stop-limit order An order to buy or sell at a specified price or better, called astop-limit price, but only after a given stop price has been reached orpassed. It is a combination of a stop order and a limit order.
stop order An order to buy or sell at the market price once the security hastraded at a specified price called the stop price. A stop order may be a day-limit order, a GTC order, or any other form of time-limit order. A stoporder becomes a market order when the stop price is reached. A stoporder to buy must always be executed when the buy price is at or abovethe stop price. A stop order to sell must always be executed when the sellprice is at or below the stop price.
SuperDot (Super Designated Order Turnaround System) Transmits member firms’market and day limit orders, up to specified sizes in virtually all listedstocks, through the common message switch to the proper trading floorworkstation. Specialists receiving orders through SuperDot execute themin the trading crowd at their posts as quickly as market interest and activ-ity permit, and return reports to the originating firm’s offices via the sameelectronic circuit that brought them to the floor. SuperDot can handledaily volume exceeding two billion shares.
syndicate A group of investment bankers who together underwrite and dis-tribute a new issue of securities or a large block of an outstanding issue.
S&P 500 A capitalization-weighted index of 500 stocks. Standard and Poor’s500 index represents the price trend movements of the major commonstock of U.S. public companies. It is used to measure the performance ofthe entire U.S. domestic stock market.
technical research Analysis of the market and stocks based on supply and de-mand. The technician studies price movements, volume, trends, and pat-terns which are revealed by charting these factors and attempts to assessthe possible effects of current market action or future supply and demandfor securities and individual issues.
204 Glossary

tender offer A public offer to buy shares from existing stockholders of a com-pany, usually made by another company attempting an acquisition. So-calledbecause stockholders are asked to tender (surrender) their holdings fora premium above the current market price.
third market Securities listed on a stock exchange that are also traded in theover-the-counter market by broker/dealers.
tick The tick is the direction in which the price of a stock moved on its lastsale. An up tick means the last trade was at a higher price than the onebefore it and a down tick means the last sale price was lower than the onebefore it. A zero-plus tick means the transaction was at the same price asthe one before, but still higher than the nearest preceding different price.The tick becomes especially important when large market movementstrigger the implementation of certain circuit breakers meant to stabilizethe market.
treasury stock Shares, formerly outstanding, that were repurchased by the is-suing company. Companies often repurchase stock to benefit existingshareholders. Those who sell receive a premium price from the companyfor their shares, thus substituting a large capital gain for future dividends.This ploy is used when dividend taxes are higher than capital gains taxes.Remaining investors who keep their shares benefit from a tightened sup-ply, which raises the share price. Companies may later resell treasury stockor retire it according to a shareholder vote.
triple witching hour The last trading hour on the third Friday of March, June,September, and December when options and futures on stock indexes ex-pire concurrently.
up tick A term used to designate a transaction made at a price higher than thepreceding transaction. Also called a plus tick. A zero-plus tick is a transac-tion at the same price as the preceding trade but higher than the preced-ing different price. Conversely, a down tick or minus tick is a transactionmade at a price lower than the preceding trade. A plus sign or minus signis displayed throughout the day. They are attached to the last price of eachstock and can be seen on the trading post at the floor of the New YorkStock Exchange.
volatility A measure of the fluctuation in market price of a security. A volatileissue has frequent and large swings in price. Mathematically, volatility iscalculated as the annualized standard deviation of returns.
volume The number of shares or contracts traded in a security or an entiremarket during a given period. Volume is normally considered on a dailybasis, with a daily average being computed for longer periods.
Glossary 205

voting right The common stockholders’ right to vote their stock in the affairsof a company. Preferred stock usually has the right to vote when preferreddividends are in default for a specified period. The right to vote may bedelegated by the stockholder to another person.
when issued A short form of when, as, and if issued. The term indicates a con-ditional transaction in a security authorized for issuance but not as yet actually issued. All when-issued transactions are on an “if” basis, to be set-tled if and when the actual security is issued and an exchange or NASDrules the transactions are to be settled.
206 Glossary

I n d e x
207
A
Active Trader, see Day TraderAdelphia, 39Allocating, 148–49American Stock Exchange
(AMEX), 55Ames, Oakes, 5Analysts, 88–89Arthur Andersen, 4Ask price, 55, 56, 71, 115Audit committee, board of
directors, 41Auditors, 37, 41–42Auto industry, 8, 53
B
Bad gap down, 146Bank of America Securities, 15Barry, Tim, 36Bear, Stearns & Co., 15, 19Bear markets, 62–65Bid price, 55, 56, 71, 115Black Monday, 9Blair, Gary Ryan, 99Blodget, Henry, 21Blue chip stocks, 52–53, 54, 58,
60Boards of directors, 37–38,
39–41, 49–50Boesky, Ivan, 10Boiler rooms, 28–30Bonds, 48–49, 66–67Broker(s), 81–96
costs of, 84–85decisions regarding, 86–87defined, 82discount, 87, 91–92full service, 87, 88–90
interviewing, 85–86online, 87–88, 92–96placing orders with, 83–84requirements, 83
Buffett, Warren, 12, 53, 96Bulletin boards, 31–32Bull markets, 62–65Bush, George W., 38, 39–40, 43Buy-and-hold strategy, 123–24Buy/sell recommendations,
14–15
C
Cap (market capitalization), 52Carlson, Peter, 4–5Carnegie, Andrew, 4Cash account, 71–72, 163Cement companies, 53CEOs, compensation of, 39–40,
42–43Charles Schwab, 16Chinese walls, 17–19, 88Cisco, 59Citigroup Inc., 19Cold call scams, 28–30, 33–34Cole, Benjamin Mark, 17Colfax, Schuyler, 5Commissions, 16, 85, 90
direct-access, 136full-service brokers, 88
Common stock, 51Conflicts of interest, 12, 15, 17
auditors and, 42Glass-Steagall Act and,
17–18investment banking/
research, 19Construction equipment
companies, 53
Consumer Federation ofAmerica, 20
Corporate fraud task force, 43“Covering the short,” 157Crash of 1929, 6–7Credit Mobilier, 5Credit Suisse First Boston, 15, 19Cyclical stocks, 53
D
Day order, 73, 75Day trader/day trading, 101,
117, 124–25, 126entry points for, 133–35exit points for, 127–28,
135–36intraday stock movements
and, 136–37Deep discount brokers, 87, 91Defensive stocks, 53Deming, W. Edwards, 81Dennavant, Laurie, 109Depression (Great Depression),
7, 63Deregulation, of commissions, 16Deutsche Bank Alex. Brown, 15Direct-access trading
commissions, 136Discount brokers, 30, 87, 91–92.
See also Broker(s)Dividends, 50Dot-coms. See Internet
companies/stocksDouglas, Michael, 9–10Dow Diamonds, 151Dow Jones Industrial Average,
11, 58, 59, 60–61Drexel Burnham Lambert, 10Drucker, Peter F., 65, 123

Duer, William, 2Dutch tulip mania, 4, 14
EEarnings, 68, 146–48Electronic marketplace, 55Emotions, 142–44Enron, 3, 4, 36, 38, 40, 148,
149–50Equilibrium price, 55Equity, 49Esar, Evan, 58Ethics, shorting stocks and, 165Exit points, 127–28
FFear, 143Federal Reserve, 10Fiedler, Edgar R., 62Financial Sense Online, 58Fraud/scams, 27–46
auditors and, 41–42boards of directors and,
39–41bulletin boards and, 31–32CEO rewards/stock
options, 42–43cold call scams, 28–30, 33–34hidden alliances, 36–38online investment
guidelines, 32–33penalties for, 38, 43–44pump and dump scheme,
34–36SEC and, 44–45spam, 32web scams, 30–31
Fuller, Thomas, 155Full service brokers, 87, 88–90,
92. See also Broker(s)Fundamental analysis, 105Futures, 95
GGap down, 146Garten, Jeffrey E., 3
Giuliani, Rudolph, 10Glass-Steagall Act of 1933, 17–18Global Crossing, 39Goals, 77–79Goldman Sachs, 15Gold speculation, 4Good ’till cancelled (GTC)
order, 72, 74–75Gould, Jay, 4Grant, Ulysses S., 5Great Depression, 7, 63Greed, 9–10, 143Gross, Brian, 44Growth stocks, 53Grubman, Jack, 21
H
Hamilton, Alexander, 2Hirsch, Yale, 152
I
ImClone, 107–8Income stocks, 53Index(es) (stock market), 58–62Index funds, 150–51, 151Industrial companies, 60Inflation, 65–66Initial public offerings (IPOs),
15, 16, 89Insider trading, 149–50Institutional movements, 67–68Intel, 59Intermediate position trader,
117, 124entry criteria for, 129exit points for, 127–28,
130–31Internal Revenue Service, 38Internet, 101
bulletin boards, 31–32companies/stocks, 6, 8, 17,
18stock scams, avoiding,
34–36Intraday stock movements,
136–37, 144–46
Investment banking, 16Investor confidence, 9
J–K
J. P. Morgan Chase & Co., 19Jaffe, Charles A., 70Jupiter Media Metrix, 32Krueger, Ivar, 7
L
Lagging indicator, 25, 26Large cap stocks, 52, 61Lay, Kenneth, 40, 149–50Lehman Brothers Inc., 15, 19Levine, Dennis, 10Levitt, Arthur, 41Limit order, 72, 73, 93Limit order—all or none, 73Lincoln, Abraham, 4Listed market, 54Long trading, 156, 171Lynch, Peter, 51
M
Margin interest, 157Margin trades, 71, 72, 163Market capitalization, 52Market indicators, 58–62Market maker, 56Market order, 72, 73, 74, 93Markman, Jon D., 13, 20May Day, 16Media influence, 21–26Mega cap, 52Merrill Lynch, 3, 15, 19–20, 21,
22, 89Micro cap stocks, 29, 52Microsoft, 59Mid cap stocks, 52Midday consolidation, 144–45Milken, Michael, 10Morgan, J. P., 4Morgan Stanley Dean Witter &
Co., 15, 19Mutual funds, 150–51
208 Index

N
Nano cap stocks, 52NASAA, 27, 93NASD, 55, 83, 86, 93Nasdaq (National Association of
Securities Dealers AutomatedQuotation), 35, 55–56
corporate guidelines, 40Nasdaq Composite Index,
6, 59, 60, 61Nasdaq 100 general
technology fund, 151Nasdaq suck down, 145Small Order Executive
System and, 9NASD Public Disclosure
Program, 33National Association of
Securities Dealers (NASD),55, 83, 86, 93
National Enquirer, 24New York Stock Exchange
(NYSE), 35, 54–55North American Securities
Administration Association(NASAA), 27, 93
O
Odd lot, 75Offshore scams, 33One-day wonders, 28, 120, 171Online investment guidelines,
32–33Online trading, 92–96OTC Bulletin Board, 35OTC (Over-the-counter)
markets, 35, 55–56Oxley, Michael, 42
P
Paper trading, 125, 139–44, 162
People magazine, 24PE ratios, 151–52Peter, Laurence J., 87
Pied Pipers of Wall Street, The:How Analysts Sell You Down theRiver (Cole), 17
Pink Sheets, 35Pitt, Harvey, 20, 45Preferred stock, 51–52Price earnings ratios, 151–52Price per share, 168Price spikes, 145PriceWaterhouseCoopers, 42“Price-weighted,” 58Program trading, 103, 104–5Promoters, 31, 33, 35Public Company Accounting
Oversight Board, 45Pump and dump schemes,
34–36Puplava, James J., 58–59
Q–R
QLogic Corporation, 159–60Quarterly reports, 37Railroad scandal, 5Raytheon, 42Reich, Robert, 3Rigas family, 39Risk, 51, 65–70
allocation and, 148–49risk tolerance, 79–80, 125
Robber barons, 4–5Rockefeller, John D., 4Roper, Barbara, 20Round lot, 75
S
Salomon Smith Barney Inc., 15,19, 21
Santayana, George, 12Sarbanes, Paul, 42Sarbanes-Oxley Act of 2002, 38,
39, 43–44, 45Savings-and-loan crisis, 9Scams. See Fraud/scamsScandals, 1–20
crash of 1929 and, 6–7cycles of, 2–3
greed and, 9–10robber barons, 4–5
Securities and ExchangeCommission (SEC), 7, 20, 83,85, 93
commission deregulation,16
conflict of interestregulation, 23
corporate conduct/compensation and, 40
EDGAR database, 35, 149enforcement resources,
44–45online investment
guidelines, 32–33web site, 30
Securities exhanges, 53–56Nasdaq, 35, 55–56New York Stock Exchange
(NYSE), 54–55Seneca, Lucius Annaeus, 77Short and distort, 164Short interest, 164Short orders, 155–65
ethics and, 165examples, 157–60major considerations for,
160–62margin trades, 163risks, 163–64
Short trading, 171Skilling, Jeffrey, 40, 149–50Small cap stocks, 52, 55–56Small Order Executive System
(SOES), 9Software
Wizefinder™, 168–80Wizetrade™, 99–103
Soros, George, 139Southern Pacific, 5S&P 500, 59, 61, 151Spam, 30, 32Specialist, 55Specialty trade, 147Speculative bubble, 5–6Spiders, 151Spitzer, Eliot, 19, 22
Index 209
Spread, 55, 56, 71Standard and Poors 500 Index,
59, 61, 151Stanford University, 13Steel companies, 53Stock(s)
anatomy of a trade, 56–57bear and bull markets,
62–65and bonds compared, 48–49defined, 47–49dividends, 50equity, 49market indicators, 58–62market trading, 53–56options, 42–43ownership voting rights, 50placing orders, 70–75price move tendencies,
68–70price per share, 114–15risks, 65–70trading strategies. See
Trading strategiestypes of, 51–53
Stockbrokers. See Broker(s)Stock exchanges
Nasdaq, 35, 55–56NYSE, 33, 54–55Wizefinder™ filter, 173
Stock marketsee also Stock(s)bear and bull, 62–65rise and fall 1998 to mid-
2002, 11Stock Trader’s Almanac (Hirsch),
152Stone, Amey, 20Stop-limit order, 72, 74Stop-loss order, 72, 73–74Stop order, 93Suck down, 145Supply and demand, 103–4Swing trader, 117, 124–25, 131–33
entry points for, 131–33exit points for, 127–28, 133
intraday stock movementsand, 136–37
Swing trade setup, 172
T
Taking stock, 78fgoals, 77–79risk tolerance, 79–80
Technical analysis, 105–8Technology-oriented stocks, 19,
60, 61Telecommunication stocks, 19Telecom stocks, 6Templeton, John, 24–26theStreet.com, 30Thomson Financial/First Call,
14–15Time zone, trading strategy
and, 125Timing, 117Trading posts, 55Trading strategies, 117, 124–25
day trader, 133–36intraday stock movements
and, 136–37points of exit for, 127–28position trader, 128–31swing trader, 131–33trading window and, 126trigger windows and, 126
Trading volume, 118–20, 169–70Transcontinental railroad, 5Trends, 25, 26, 125
Wizetrade™ and, 112, 118Tulip mania, 4, 14Turner, Lynn, 44Twain, Mark, 62Tyco, 3
U
UBS Walburg, 15, 19Union Pacific, 5University of California, 13Utilities, 53
V–W
Volume, 118–20, 169–70Wall Street (movie), 9–10Wal-Mart, 109–12WealthEffect.com, 26Web scams, 30–31Web sites, 86, 93Webster, William, 45Whistleblowers, 39Whitney, Richard, 7“Why Not Dow 1,000,000?”,
50–51Wind trade, 14Winnick, Gary, 39Wizefinder™, 168–80
advanced parameters,171–79
basic parameters, 168–71communication with
Wizetrade™, 179–80going long, 175–76going short, 176–78pictographs, 175stock exchange filters,
173Wizetrade™, 99–103, 161
buying at close, 144communication with
Wizefinder™, 179–80comparing charts, 109development of, 100–103entry/exit signals, 108–9FAST™, 109, 116–17, 126,
171recognizing trades and,
109–16red light/green light
program, 145technical analysis and,
105–8Tradevault screen, 140, 141trends and, 118volume and, 118–20
WorldCom, 3, 4, 38, 59Wrap accounts, 90
210 Index

A b o u t t h e A u t h o r
211
George Thompson has revolutionized themethod of analyzing stocks by creating an easy-to-use software program thatthe average investor can utilize to make intelligent trading decisions. His pro-gram, Wizetrade, is successfully used by thousands of traders across the globeeach day. George’s desire is to help level the playing field so that top WallStreet analysts are not the only ones that can increase their net worth. He feelsthat every person can benefit from the stock market given a little knowledgeand the right tools.
Mr. Thompson hosts a nationally syndicated radio program, has appearedon television, and has educated thousands of people on the art of successfultrading. His entrepreneurial leadership and dedication to taking the guess-work out of trading have been the cornerstone of his career.
