don't guess, measure - labcell app guide - email.pdf · the neher-mcgrath calculations which...
TRANSCRIPT

DON'T GUESS, MEASUREA Guide to Soil Thermal Resistivity
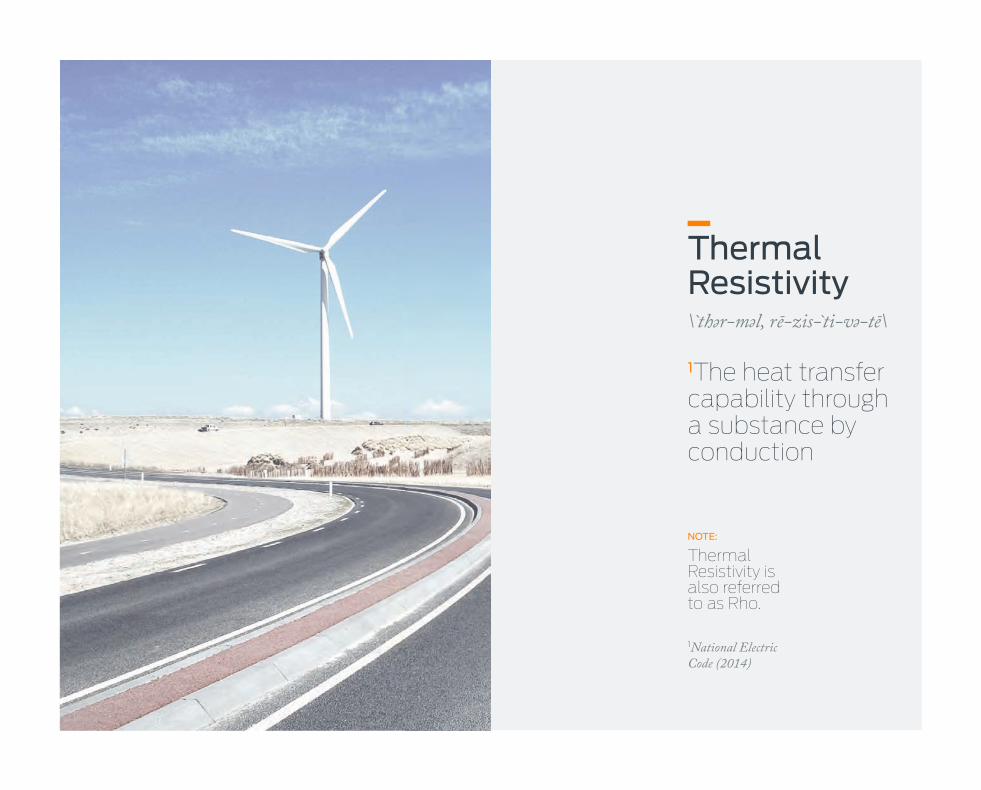
ThermalResistivity\ t̀h r-m l, rē-zis-̀ti-v -tē\
1The heat transfer capability through a substance by conduction
NOTE:
Thermal Resistivity is also referred to as Rho.
1National Electric Code (2014)
04 05
Electricity flowing in a conductor generates heat. Any resistance to heat flow between the cable and the ambient environment causes the cable temperature to rise. When cables are buried, soil forms part of the thermal resistance, and thus soil thermal properties become an important part of cable design.
Even in a well-designed system, the soil may account for half of the total thermal resistance. Engineers need to treat soil thermal resistivity with as much respect as they do the cables and ducts.
Thermal resistivity, or Rho, is defined in the National Electrical Code (2014) as “the heat transfer capability through a substance by conduction.”
It is the reciprocal of thermal conductivity. In buried cable applications, soil thermal resistivity is an essential factor in the Neher-McGrath calculations which allow engineers to predict the temperature of buried cable and determine cable ampacity ratings.
Thermal resistivity is often reported in different measurement units. Internationally it is reported in SI units as °K-m/W (degrees Kelvin-meter per watt). In the United States it is more commonly reported as °C-cm/W (degrees Celsius-centimeter per watt).
PC
PREFACE 05
THEORY 06
1 Never Use Standard Values 09
2 Understand Water Content 14
3 Density Affects Rho 19
4 Rho Must Be Measured 22
5 Consider Site-Specific Variables 24
MEASURE 26
1 Two Ways to Test 29
2 Create a Dryout Curve 32
3 Things to Keep in Mind 38
4 Reporting Rho 40
5 Standards 41
STUDIES 42
1 Wind Farms 45
2 Data Centers 46
3 Public Utilities 49
4 Underwater Cables 50
REFERENCES 52

1 Never Use “Standard” Values 09
Look at the Variables 11
What to Learn from the Models 12
2 Understand Water Content 14
Water Content in the Field 15
Critical Water Content 16
3 Density Affects Rho 19
Grading Counts 20
4 Rho Must Be Measured 22
Instrumentation 22
Lab Services 22
5 Consider Site-Specific Variables 24
Unique Situation 24
Watch the Surface 24
Consider Engineered Backfill Material 25
Hot Spots 25
T
09
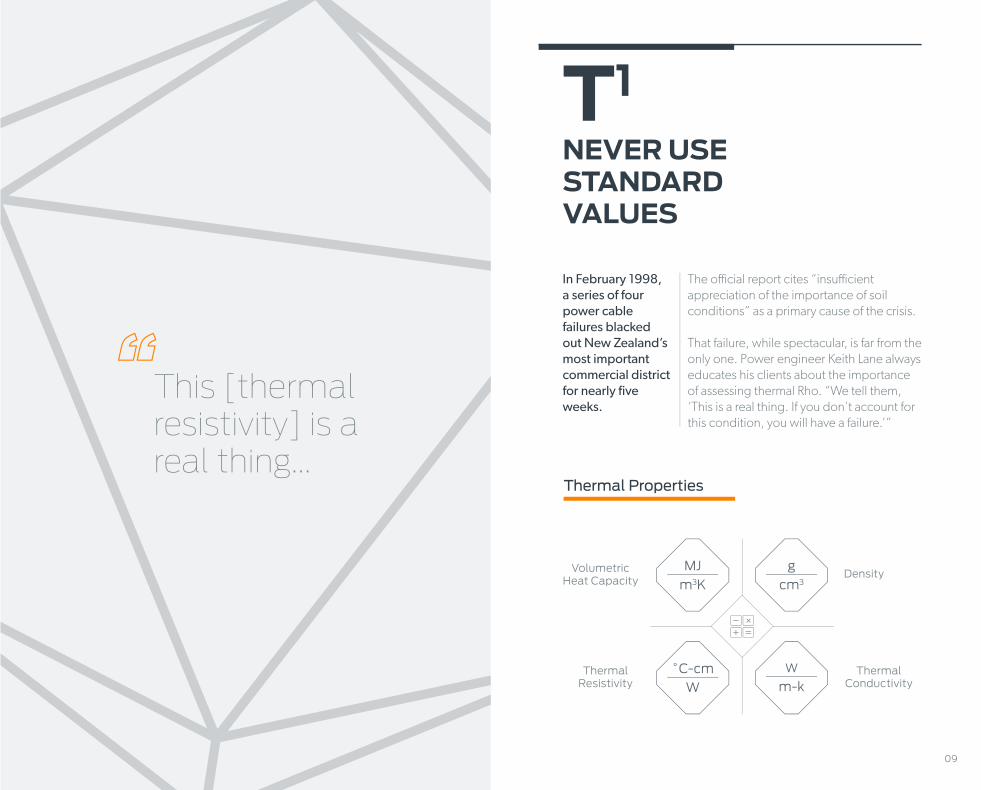
In February 1998, a series of four power cable failures blacked out New Zealand’s most important commercial district for nearly five weeks.
This [thermal resistivity] is a real thing...
NEVER USE STANDARD VALUES
T1
gcm3
Density
W
m-kThermal
Conductivity˚C-cm
WThermal
Resistivity
MJm3K
VolumetricHeat Capacity
Thermal Properties
The official report cites “insufficient appreciation of the importance of soil conditions” as a primary cause of the crisis.
That failure, while spectacular, is far from the only one. Power engineer Keith Lane always educates his clients about the importance of assessing thermal Rho. “We tell them, ‘This is a real thing. If you don’t account for this condition, you will have a failure.’”
11
DensityThermal
ConductivityThermal
ResistivityVol. Heat Capacity
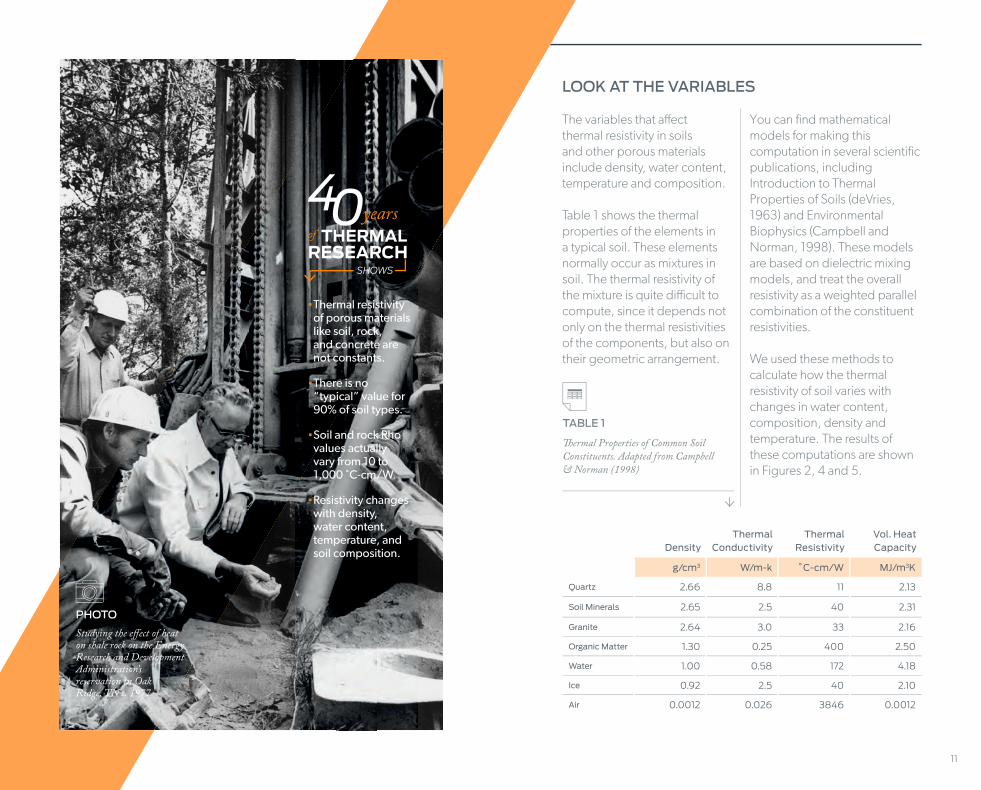
g/cm3 W/m-k ˚C-cm/W MJ/m3K
Quartz 2.66 8.8 11 2.13
Soil Minerals 2.65 2.5 40 2.31
Granite 2.64 3.0 33 2.16
Organic Matter 1.30 0.25 400 2.50
Water 1.00 0.58 172 4.18
Ice 0.92 2.5 40 2.10
Air 0.0012 0.026 3846 0.0012
LOOK AT THE VARIABLES
The variables that affect thermal resistivity in soils and other porous materials include density, water content, temperature and composition.
Table 1 shows the thermal properties of the elements in a typical soil. These elements normally occur as mixtures in soil. The thermal resistivity of the mixture is quite difficult to compute, since it depends not only on the thermal resistivities of the components, but also on their geometric arrangement.
You can find mathematical models for making this computation in several scientific publications, including Introduction to Thermal Properties of Soils (deVries, 1963) and Environmental Biophysics (Campbell and Norman, 1998). These models are based on dielectric mixing models, and treat the overall resistivity as a weighted parallel combination of the constituent resistivities.
We used these methods to calculate how the thermal resistivity of soil varies with changes in water content, composition, density and temperature. The results of these computations are shown in Figures 2, 4 and 5.
TABLE 1
�ermal Properties of Common Soil Constituents. Adapted from Campbell& Norman (1998)
•Thermal resistivity of porous materials like soil, rock, and concrete are not constants.
•There is no “typical” value for 90% of soil types.
•Soil and rock Rho values actually vary from 10 to 1,000 ˚C-cm/W.
•Resistivity changes with density, water content, temperature, and soil composition.
of THERMALRESEARCH
years
SHOWS
PHOTO
Studying the e�ect of heat on shale rock on the Energy Research and Development Administration’s reservation in Oak Ridge, TN c. 1977

12 13
WHAT TO LEARN FROM THE MODELS
Organized in Figure 1 are five constituents that are important in determining the thermal resistivity of soil.
FIGURE 1
�ermal Resistivities of Common Soil Constituents
FIGURE 2
Water Content and �ermal Resistivities of Common Soil Components
In general, the thermal resistivity of a mixture is strongly influenced by the component with the highest resistivity. Dry quartz sand and dry loam soil have comparable resistivities, even though the resistivity of the minerals differs by a factor of 3 (Table 1). As the limiting resistivity becomes smaller, differences in the resistivities of the other components have a larger effect. For example, dry quartz and loam differ in resistivity by about 10%, while water-saturated quartz sand has about half the resistivity of saturated loam (Figure 2).
11Quartz
40Other Soil Minerals
172Water
400Organic Matter
3846 Air
Without knowing anything about the weighting factors for these in an actual soil or fill material, four things should be clear:
01 Air is bad. In order to achieve acceptably low thermal resistivity, fill must be tightly packed.
02 Organic matter, no matter how wet, will still have a very high resistivity.
03 Replacing air with water helps, but water alone is still not a very good conductor.
04 Fill materials high in quartz will have the lowest resistivity, other things being equal.
Thermal Resistivities (˚C-cm/W)
THE RESISTIVITY OF WET ORGANIC SOIL, THOUGH BETTER THAN
WHEN DRY, IS STILL MUCH TOO HIGH TO PROVIDE REASONABLE HEAT DISSIPATION FOR BURIED
CABLE (SEE FIGURE 2).
14 15
Understand Water Content
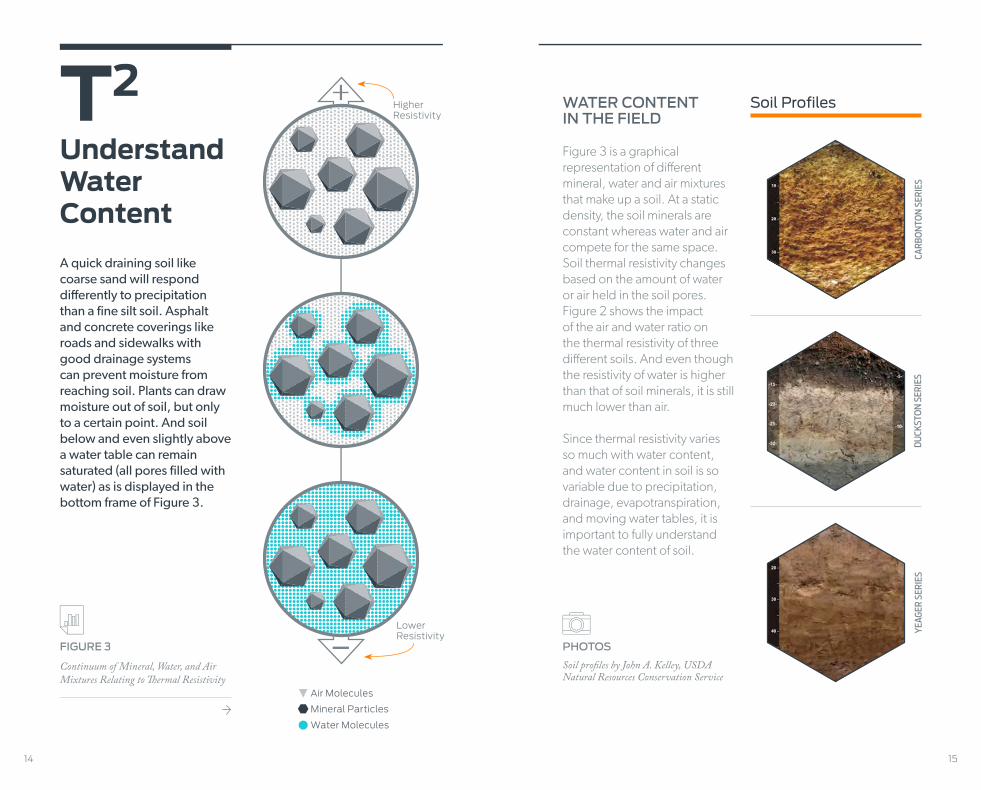
A quick draining soil like coarse sand will respond differently to precipitation than a fine silt soil. Asphalt and concrete coverings like roads and sidewalks with good drainage systems can prevent moisture from reaching soil. Plants can draw moisture out of soil, but only to a certain point. And soil below and even slightly above a water table can remain saturated (all pores filled with water) as is displayed in the bottom frame of Figure 3.
WATER CONTENTIN THE FIELD
Figure 3 is a graphical representation of different mineral, water and air mixtures that make up a soil. At a static density, the soil minerals are constant whereas water and air compete for the same space. Soil thermal resistivity changes based on the amount of water or air held in the soil pores. Figure 2 shows the impact of the air and water ratio on the thermal resistivity of three different soils. And even though the resistivity of water is higher than that of soil minerals, it is still much lower than air.
Since thermal resistivity varies so much with water content, and water content in soil is so variable due to precipitation, drainage, evapotranspiration, and moving water tables, it is important to fully understand the water content of soil.
FIGURE 3
Continuum of Mineral, Water, and Air Mixtures Relating to Thermal Resistivity
T2 HigherResistivity
LowerResistivity
Mineral Particles
Water Molecules
Air Molecules
PHOTOS
Soil profiles by John A. Kelley, USDA Natural Resources Conservation Service
Soil Profiles
YEAG
ER S
ERIE
SD
UCK
STO
N S
ERIE
SCA
RBO
NTO
N S
ERIE
S
16 17
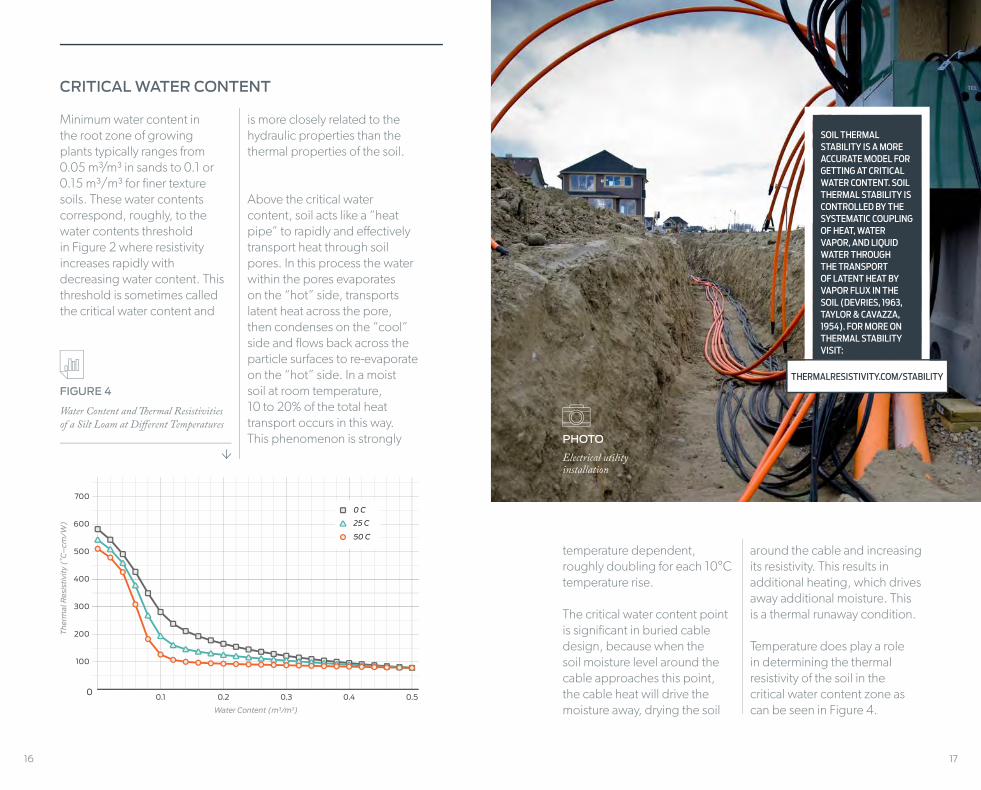
CRITICAL WATER CONTENT
Minimum water content inthe root zone of growingplants typically ranges from 0.05 m³/m³ in sands to 0.1 or 0.15 m³/m³ for finer texture soils. These water contents correspond, roughly, to the water contents threshold in Figure 2 where resistivity increases rapidly with decreasing water content. This threshold is sometimes called the critical water content and
is more closely related to the hydraulic properties than the thermal properties of the soil.
Above the critical water content, soil acts like a “heat pipe” to rapidly and effectively transport heat through soil pores. In this process the water within the pores evaporates on the “hot” side, transports latent heat across the pore, then condenses on the “cool” side and flows back across the particle surfaces to re-evaporate on the “hot” side. In a moist soil at room temperature, 10 to 20% of the total heat transport occurs in this way. This phenomenon is strongly
FIGURE 4
Water Content and �ermal Resistivities of a Silt Loam at Di�erent Temperatures
temperature dependent, roughly doubling for each 10°C temperature rise.
The critical water content point is significant in buried cable design, because when the soil moisture level around the cable approaches this point, the cable heat will drive the moisture away, drying the soil
around the cable and increasing its resistivity. This results in additional heating, which drives away additional moisture. This is a thermal runaway condition.
Temperature does play a role in determining the thermal resistivity of the soil in the critical water content zone as can be seen in Figure 4.
SOIL THERMAL STABILITY IS A MORE ACCURATE MODEL FOR GETTING AT CRITICAL WATER CONTENT. SOIL THERMAL STABILITY IS CONTROLLED BY THE SYSTEMATIC COUPLING OF HEAT, WATER VAPOR, AND LIQUID WATER THROUGH THE TRANSPORT OF LATENT HEAT BY VAPOR FLUX IN THE SOIL (DEVRIES, 1963, TAYLOR & CAVAZZA, 1954). FOR MORE ON THERMAL STABILITY VISIT:
THERMALRESISTIVITY.COM/STABILITY
PHOTO
Electrical utility installation
19
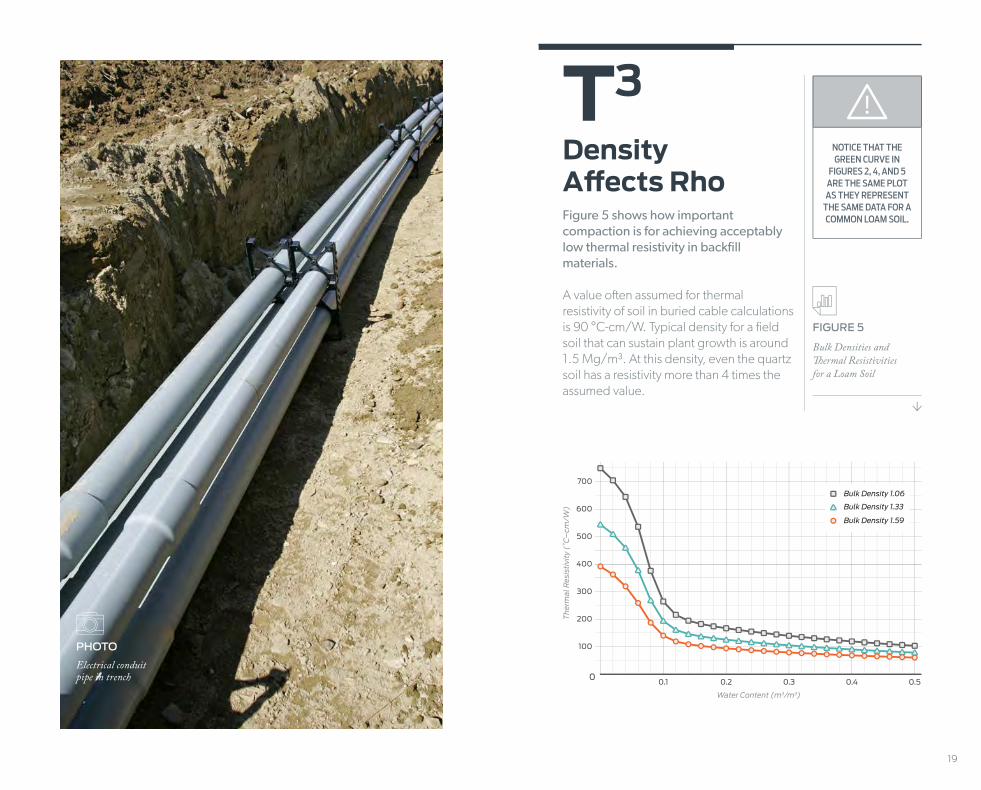
Density A�ects RhoFigure 5 shows how important compaction is for achieving acceptably low thermal resistivity in backfill materials.
A value o§en assumed for thermalresistivity of soil in buried cable calculations is 90 °C-cm/W. Typical density for a field soil that can sustain plant growth is around 1.5 Mg/m³. At this density, even the quartz soil has a resistivity more than 4 times the assumed value.
FIGURE 5
Bulk Densities and �ermal Resistivities for a Loam Soil
T3
PHOTO
Electrical conduit pipe in trench
NOTICE THAT THE GREEN CURVE IN
FIGURES 2, 4, AND 5 ARE THE SAME PLOT AS THEY REPRESENT
THE SAME DATA FOR A COMMON LOAM SOIL.

21
601 Soil thermal resistivity
values are influenced by soil composition, compaction, moisture, and temperature.
02 Soil composition high in organics is bad; composition high in quartz is good.
03 Increasing soil moisture can lower resistivity values.
04 The compaction/solid fraction/density of soil plays an important role in thermal resistivity because air spaces limit the flow of heat.
05 Temperature becomes more critical as soil dries.
06 Air is bad, water is better, but a high quartz content soil, well graded and compacted with high levels of moisture is best.
GRADING COUNTS
It is worth mentioning that arbitrarily high densities are not attainable just by compaction. Uniform sized particles pack to a given maximum density. To attain densities beyond that without crushing particles, smaller particles are added to the voids between the larger particles. Highest densities are therefore attained by using well-graded materials.
PHOTO
Dozer lined up on the jobsite
LESSONSFrom The DATA
From Table 1 and Figures 2, 4, and 5
22
Rho Must Be Measured
While it is possible to compute thermal resistivity, it is usually easier to measure it directly. The measurement of soil thermal properties should be guided by a standard like ASTM D5334-14, “Standard Test Method for Determination of Thermal Conductivity of Soil and Soft Rock by Thermal Needle Probe Procedure,” IEEE 442 (1981), “Guide for Soil Thermal Resistivity Measurements” or “Methods of Soil Analysis” by Soil Science Society of America.
Measuring the thermal resistivity of soil using the heated needle technique as suggested in the standards mentioned above is straightforward. Adhering to a few measurement tips can ensure you get accurate data.
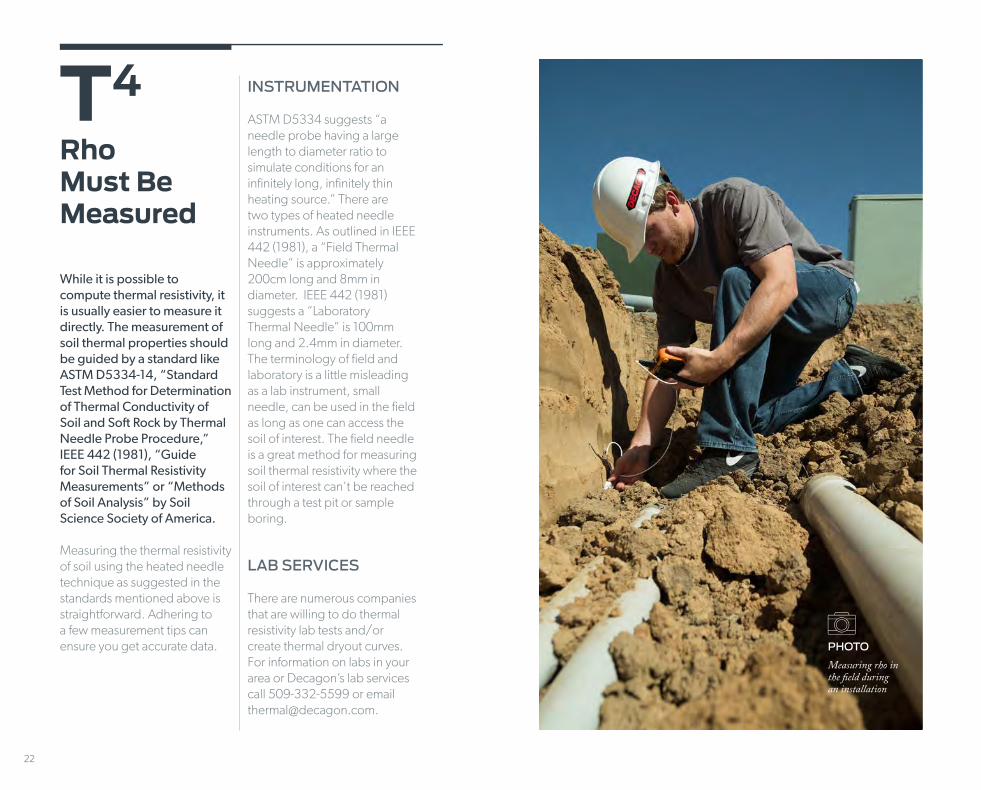
INSTRUMENTATION
ASTM D5334 suggests “a needle probe having a large length to diameter ratio to simulate conditions for an infinitely long, infinitely thin heating source.” There are two types of heated needle instruments. As outlined in IEEE 442 (1981), a “Field Thermal Needle” is approximately 200cm long and 8mm in diameter. IEEE 442 (1981) suggests a “Laboratory Thermal Needle” is 100mm long and 2.4mm in diameter. The terminology of field and laboratory is a little misleading as a lab instrument, small needle, can be used in the field as long as one can access the soil of interest. The field needle is a great method for measuring soil thermal resistivity where the soil of interest can’t be reached through a test pit or sample boring.
LAB SERVICES
There are numerous companies that are willing to do thermal resistivity lab tests and/or create thermal dryout curves. For information on labs in your area or Decagon’s lab services call 509-332-5599 or email [email protected].
T4
PHOTO
Measuring rho in the field during an installation
24 25
Consider Site-Specific Variables
In addition to the issues discussed above there are also several site-specific issues that need to be taken into account when designing and implementing underground power cable systems. These include the depth of burial, surface conditions, backfill, and surrounding vegetation.
T5
CONSIDER ENGINEERED BACKFILL MATERIAL
Lower dry resistivities than those shown in Figure 2 can be achieved using specially designed backfill materials. For example, one thermally stable backfill can be poured in place, and has a dry resistivity of around 75 °C-cm/W, decreasing to below 50 °C-cm/W when wet. When native backfill is not suitable, engineered backfill, thermally enhanced, may be required to ensure adequate thermal conditions.
HOT SPOTS
Potential ‘hot spots’ along the cable route (such as zones of well drained sandy soils or vegetated areas that could lead to significant soil drying) should receive particular attention to ensure long-term success of any installation. Clay soils in particular can crack on drying, resulting in development of air gaps around cables, and every effort must be made to avoid these situations.
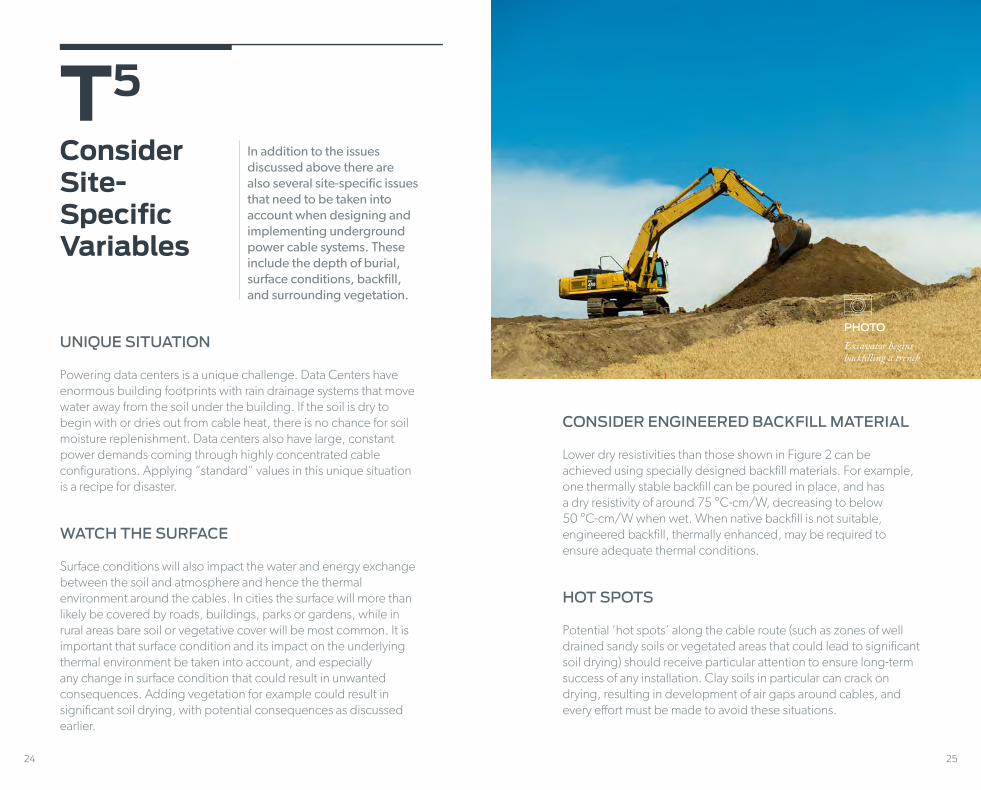
PHOTO
Excavator begins backfilling a trench
UNIQUE SITUATION
Powering data centers is a unique challenge. Data Centers have enormous building footprints with rain drainage systems that move water away from the soil under the building. If the soil is dry to begin with or dries out from cable heat, there is no chance for soil moisture replenishment. Data centers also have large, constant power demands coming through highly concentrated cable configurations. Applying “standard” values in this unique situation is a recipe for disaster.
WATCH THE SURFACE
Surface conditions will also impact the water and energy exchange between the soil and atmosphere and hence the thermal environment around the cables. In cities the surface will more than likely be covered by roads, buildings, parks or gardens, while in rural areas bare soil or vegetative cover will be most common. It is important that surface condition and its impact on the underlying thermal environment be taken into account, and especially any change in surface condition that could result in unwanted consequences. Adding vegetation for example could result in significant soil drying, with potential consequences as discussed earlier.
M
1 Two Ways to Test 29
Field Testing 29
Lab Testing 30
2 Create a Dryout Curve 32
3 Things to Keep in Mind 38
Oven Dry VS. Air Dry 38
Methods for Clay Soils 38
Finding Rho at Maximum Density 39
Temperature Considerations 39
4 Reporting Rho 40
5 Standards
ASTM 5334-14 41
IEEE 442 (1981) 41
SSSA Book Series: 5 41

28
If you don’t account for this condition you will have a failure...
M1
Two Ways to Test
There are two ways to test the thermal resistivity of soil. You can either test directly in the field or take a soil sample and test in a lab.
FIELD TESTING
Field measurements typically don’t give you much information. A field measurement is a single snapshot of soil thermal resistivity in time. Relying on the snapshot of Rho can lead to poor design because thermal resistivity is dependent on soil water content, which is affected by precipitation, drainage, evapotranspiration, and moving water tables.
PHOTOS
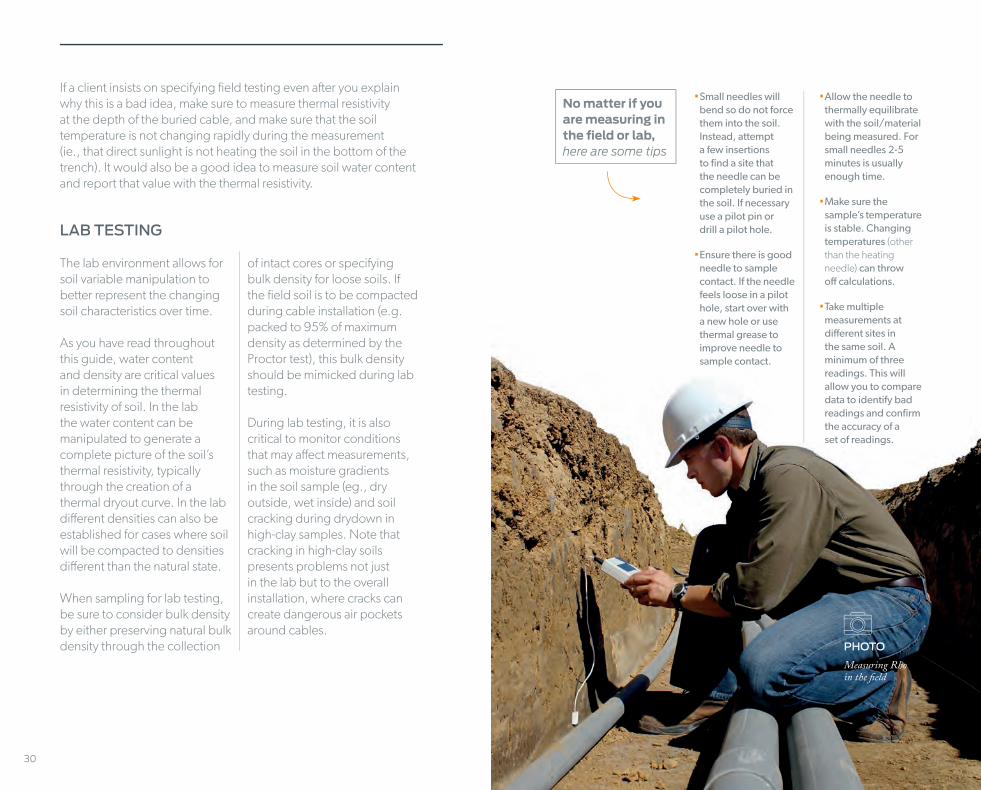
TOP: Needle is inserted into ground during �eld testing
BOTTOM: Soil sample from the �eld is tested in the lab
30
If a client insists on specifying field testing even a§er you explain why this is a bad idea, make sure to measure thermal resistivity at the depth of the buried cable, and make sure that the soil temperature is not changing rapidly during the measurement (ie., that direct sunlight is not heating the soil in the bottom of the trench). It would also be a good idea to measure soil water content and report that value with the thermal resistivity.
LAB TESTING
The lab environment allows for soil variable manipulation to better represent the changing soil characteristics over time.
As you have read throughout this guide, water content and density are critical values in determining the thermal resistivity of soil. In the lab the water content can be manipulated to generate a complete picture of the soil’s thermal resistivity, typically through the creation of a thermal dryout curve. In the lab different densities can also be established for cases where soil will be compacted to densities different than the natural state.
When sampling for lab testing, be sure to consider bulk density by either preserving natural bulk density through the collection
of intact cores or specifying bulk density for loose soils. If the field soil is to be compacted during cable installation (e.g. packed to 95% of maximum density as determined by the Proctor test), this bulk density should be mimicked during lab testing.
During lab testing, it is also critical to monitor conditions that may affect measurements, such as moisture gradients in the soil sample (eg., dry outside, wet inside) and soil cracking during drydown in high-clay samples. Note that cracking in high-clay soils presents problems not just in the lab but to the overall installation, where cracks can create dangerous air pockets around cables.
•Small needles will bend so do not force them into the soil. Instead, attempt a few insertions to find a site that the needle can be completely buried in the soil. If necessary use a pilot pin or drill a pilot hole.
•Ensure there is good needle to sample contact. If the needle feels loose in a pilot hole, start over with a new hole or use thermal grease to improve needle to sample contact.
No matter if you are measuring in the field or lab,here are some tips
•Allow the needle to thermally equilibrate with the soil/material being measured. For small needles 2-5 minutes is usually enough time.
•Make sure the sample’s temperature is stable. Changing temperatures (other than the heating needle) can throw off calculations.
•Take multiple measurements at different sites in the same soil. A minimum of three readings. This will allow you to compare data to identify bad readings and confirm the accuracy of a set of readings.
PHOTO
Measuring Rho in the �eld
32 33
Create a Dryout Curve
M2
SOME LABS TAKE AN “AS-RECEIVED”
RHO VALUE TO CHECK AGAINST THE CALCULATED CURVE.
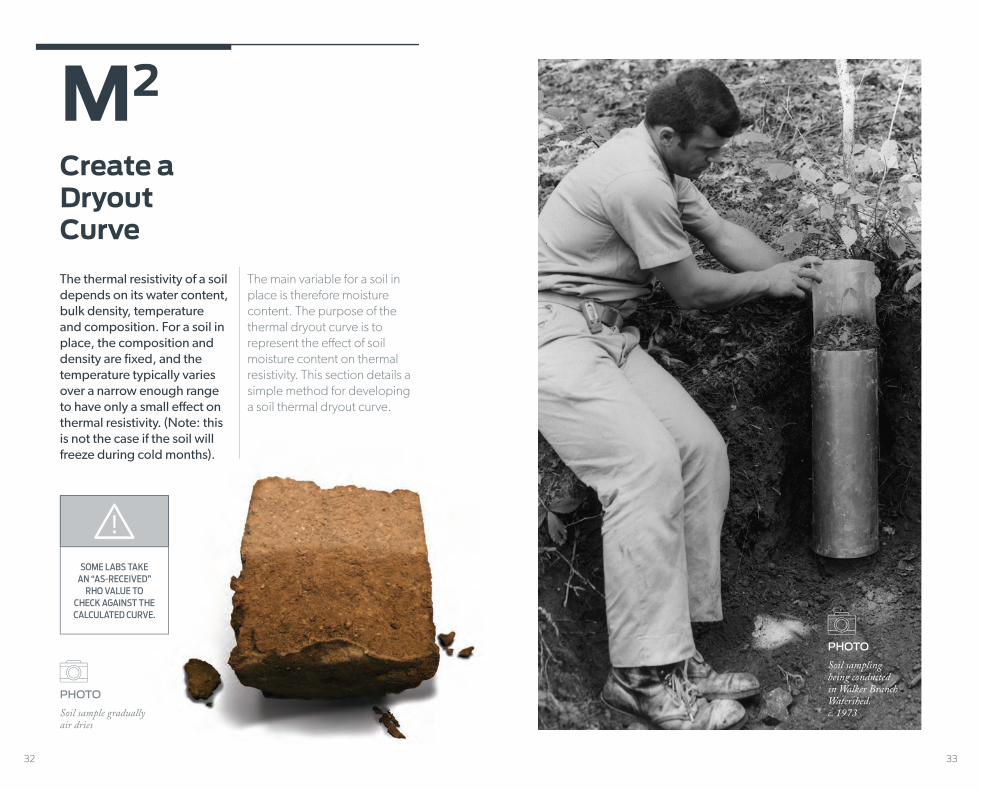
The thermal resistivity of a soil depends on its water content, bulk density, temperature and composition. For a soil in place, the composition and density are fixed, and the temperature typically varies over a narrow enough range to have only a small effect on thermal resistivity. (Note: this is not the case if the soil will freeze during cold months).
The main variable for a soil in place is therefore moisture content. The purpose of the thermal dryout curve is to represent the effect of soil moisture content on thermal resistivity. This section details a simple method for developing a soil thermal dryout curve.
PHOTO
Soil sample gradually air dries
PHOTO
Soil sampling being conducted in Walker Branch Watershed.c. 1973
34 35
From the weight measurement, compute the density and water content when wet. This set of measurements fixes two points on the drydown curve with direct measurements. You can then interpolate the curve between these two points using an equation from Campbell (1985):
where θ is the volumetric water content (m3m-3). The constants in the equation are determined from the measurements. D is 100/Rhodry. B is computed from:
where �(m3m-3) is the total porosity of the soil, ρb is the measured bulk density (Mg/m3) of the sample and ρs is the particle density, generally assumed to be 2.65 Mg/m3.
The term g is discussed below, but has a value of 1 when the soil is wet so, from Equation 1 and the measurements at saturation:
Equation
1
Equation
2
Equation
3
Rho (˚C-cm/w) =100
A + Bθ + (D–A)(1–g)
B = 2.8� = 2.8 (1-ρb )ρs
A = 100
Rhowet – Bθwet
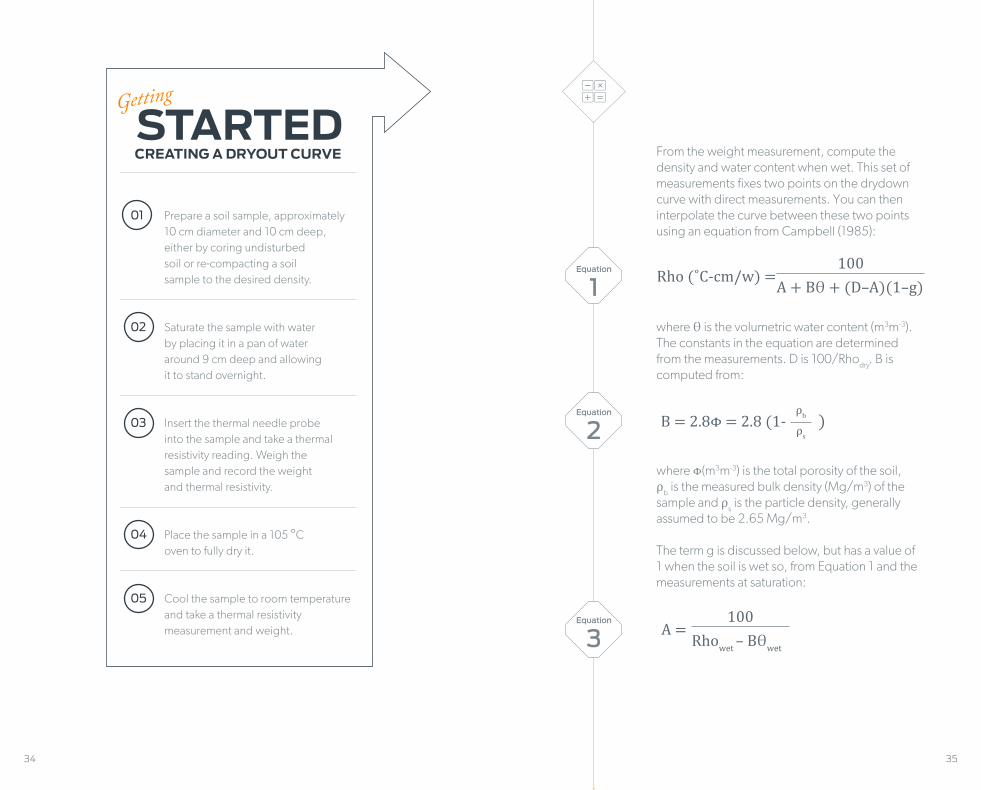
01 Prepare a soil sample, approximately 10 cm diameter and 10 cm deep, either by coring undisturbed soil or re-compacting a soil sample to the desired density.
02 Saturate the sample with water by placing it in a pan of water around 9 cm deep and allowing it to stand overnight.
03 Insert the thermal needle probe into the sample and take a thermal resistivity reading. Weigh the sample and record the weight and thermal resistivity.
04 Place the sample in a 105 °C oven to fully dry it.
05 Cool the sample to room temperature and take a thermal resistivity measurement and weight.
Getting
STARTEDCREATING A DRYOUT CURVE
36 37
g =1
1+ θ θo
θo = 0.3073mc + 0.0334
Clay Fraction
Critical Water Content
Air Dry Water Content (wad)
g/g m3/m3 g/g
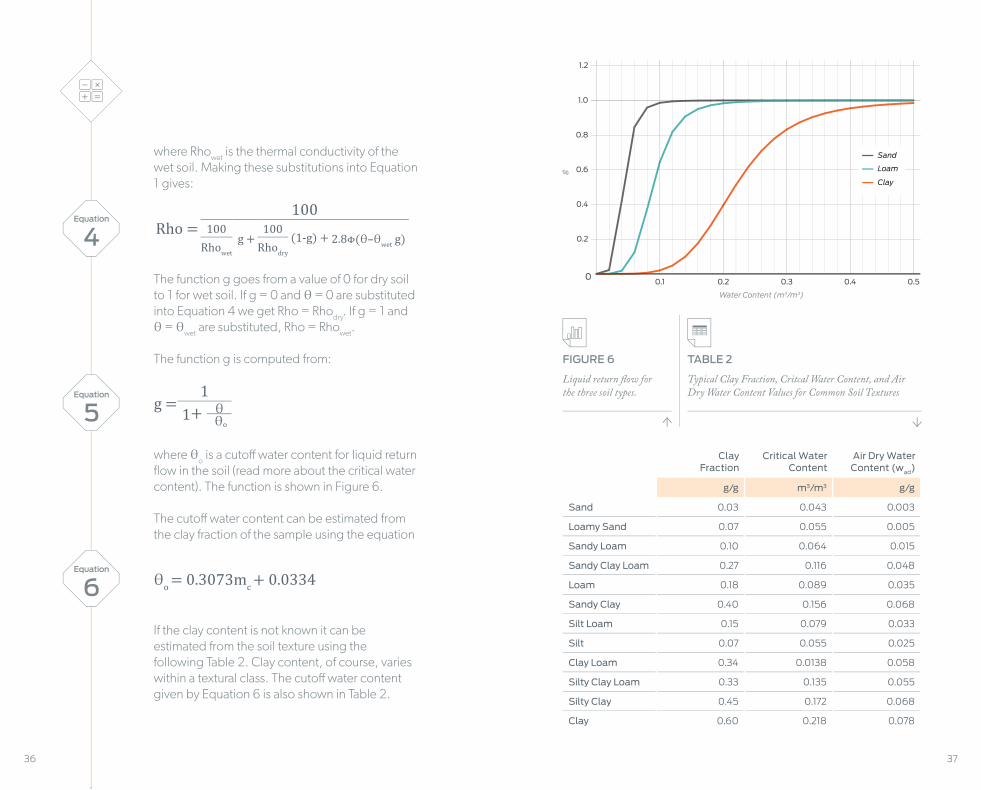
Sand 0.03 0.043 0.003
Loamy Sand 0.07 0.055 0.005
Sandy Loam 0.10 0.064 0.015
Sandy Clay Loam 0.27 0.116 0.048
Loam 0.18 0.089 0.035
Sandy Clay 0.40 0.156 0.068
Silt Loam 0.15 0.079 0.033
Silt 0.07 0.055 0.025
Clay Loam 0.34 0.0138 0.058
Silty Clay Loam 0.33 0.135 0.055
Silty Clay 0.45 0.172 0.068
Clay 0.60 0.218 0.078
TABLE 2
Typical Clay Fraction, Critcal Water Content, and Air Dry Water Content Values for Common Soil Textures
where Rhowet is the thermal conductivity of the wet soil. Making these substitutions into Equation 1 gives:
The function g goes from a value of 0 for dry soil to 1 for wet soil. If g = 0 and θ = 0 are substituted into Equation 4 we get Rho = Rhodry. If g = 1 and θ = θwet are substituted, Rho = Rhowet.
The function g is computed from:
where θo is a cutoff water content for liquid return flow in the soil (read more about the critical water content). The function is shown in Figure 6.
The cutoff water content can be estimated from the clay fraction of the sample using the equation
If the clay content is not known it can be estimated from the soil texture using the following Table 2. Clay content, of course, varies within a textural class. The cutoff water content given by Equation 6 is also shown in Table 2.
Rho = 100
100 g +
100 (1-g) + 2.8�(θ–θwet g)
Rhowet Rhodry
FIGURE 6
Liquid return �ow for the three soil types.
Equation
4
Equation
5
Equation
6
38 39
Things to Keep in Mind
M3
OVEN DRY VS. AIR DRY
In the thermal dryout equations, the Rhodry value is for oven dry soil. This water content is lower than is ever encountered in nature. Its value therefore should not be considered the resistivity of naturally dry soil.
Table 2 gives approximate values for air dry water content of soil. Soil in place will almost always have higher water contents than air dry. One exception might occur if a
trench is excavated and the fill allowed to dry for an extended period of time on the soil surface before it is replaced. It would always be wise to wet the fill around a buried cable, both to increase its density and to reduce its resistivity. A little moisture goes a long way in decreasing resistivity at the dry end. Also note that the high water content matching point does not need to be at saturation.
METHODS FOR CLAY SOILS
Swelling clay soils shrink and crack as they dry. Such soils present special problems for the methods outlined here. The wet or saturated measurement can be made as outlined here, but the dry measurement needs to be done in a different way. It is hard to give methods that will work in every situation, but the dry resistivity of these soils can sometimes be measured by taking a clod or ped of the dry soil, carefully drilling a hole for the probe, inserting the probe with adequate thermal grease and making the measurement.
FINDING RHO AT MAXIMUM DENSITY
One would often like to know the thermal resistivity of a sample packed to maximum density. Once optimum water content for maximum density is determined using standard methods, a sample at the optimum water content can be packed and its thermal resistivity determined. This becomes the wet matching point.
TEMPERATURE CONSIDERATIONS
The dryout curves using these procedures are for the temperature at which the measurements are made. Temperature has little effect on saturated and dry soil resistivity, but significantly affects the resistivity of soil at intermediate water contents. (See Figure 4) For thermal resistivities at temperatures other than room temperature, either detailed models or a full set of measurements must be used. The interpolation method given here for creating thermal dryout curves will not work.
PHOTO
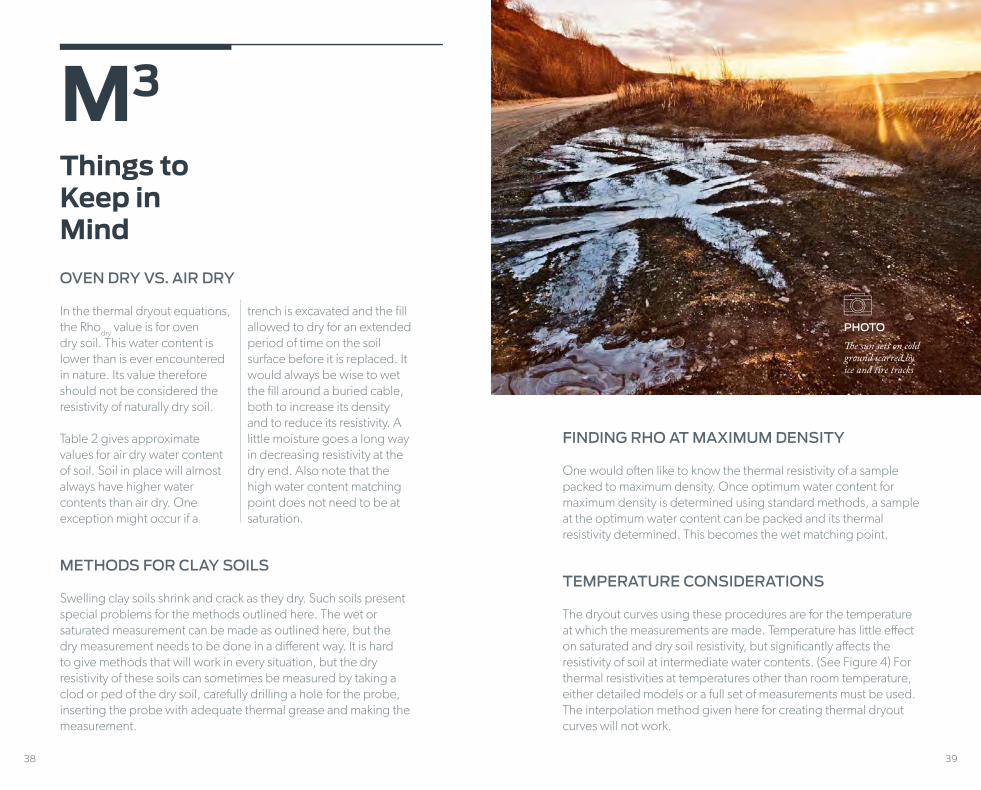
The sun sets on cold ground scarred by ice and tire tracks
40 41
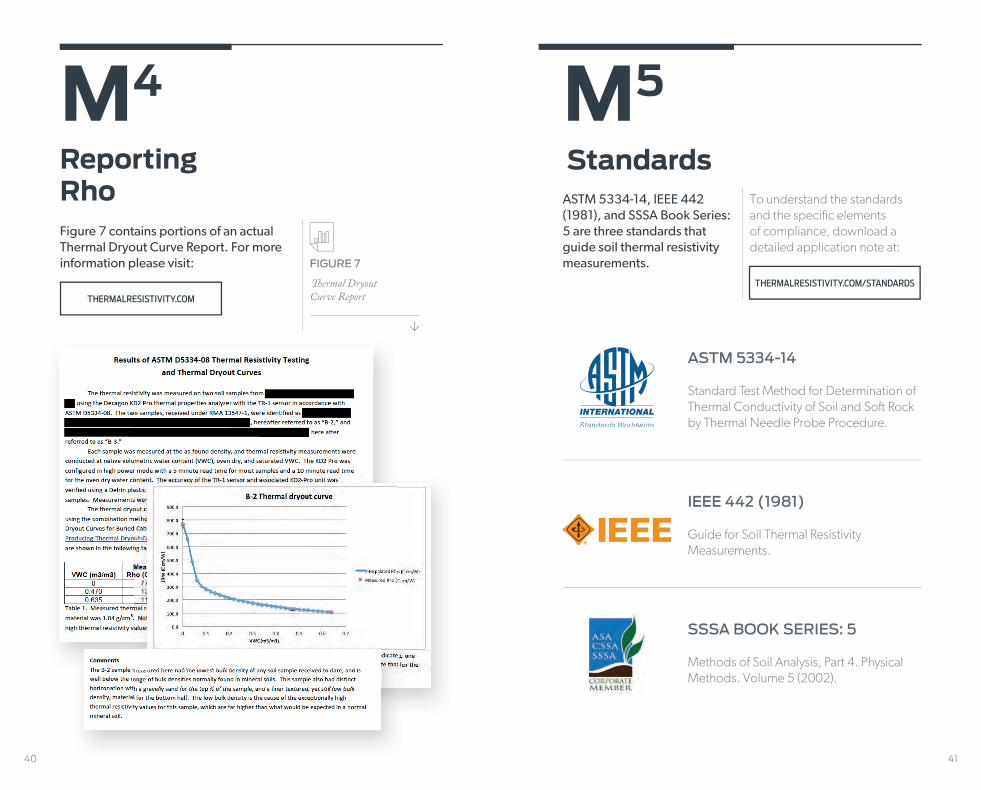
Reporting Rho
M4
THERMALRESISTIVITY.COM
FIGURE 7
�ermal Dryout Curve Report
M5
StandardsASTM 5334-14, IEEE 442 (1981), and SSSA Book Series: 5 are three standards that guide soil thermal resistivity measurements.
THERMALRESISTIVITY.COM/STANDARDS
ASTM 5334-14
Standard Test Method for Determination of Thermal Conductivity of Soil and So§ Rock by Thermal Needle Probe Procedure.
IEEE 442 (1981)
Guide for Soil Thermal Resistivity Measurements.
SSSA BOOK SERIES: 5
Methods of Soil Analysis, Part 4. Physical Methods. Volume 5 (2002).
To understand the standards and the specific elements of compliance, download a detailed application note at:
Figure 7 contains portions of an actual Thermal Dryout Curve Report. For more information please visit:

1 Wind Farms
2 Data Centers
3 Public Utilities
4 Underwater Cables
S Power engineers Keith Lane and
Scott Coburn of Lane Coburn and Associates spoke to us about how
ignoring Rhocan lead to
catastrophicfailure.
S1
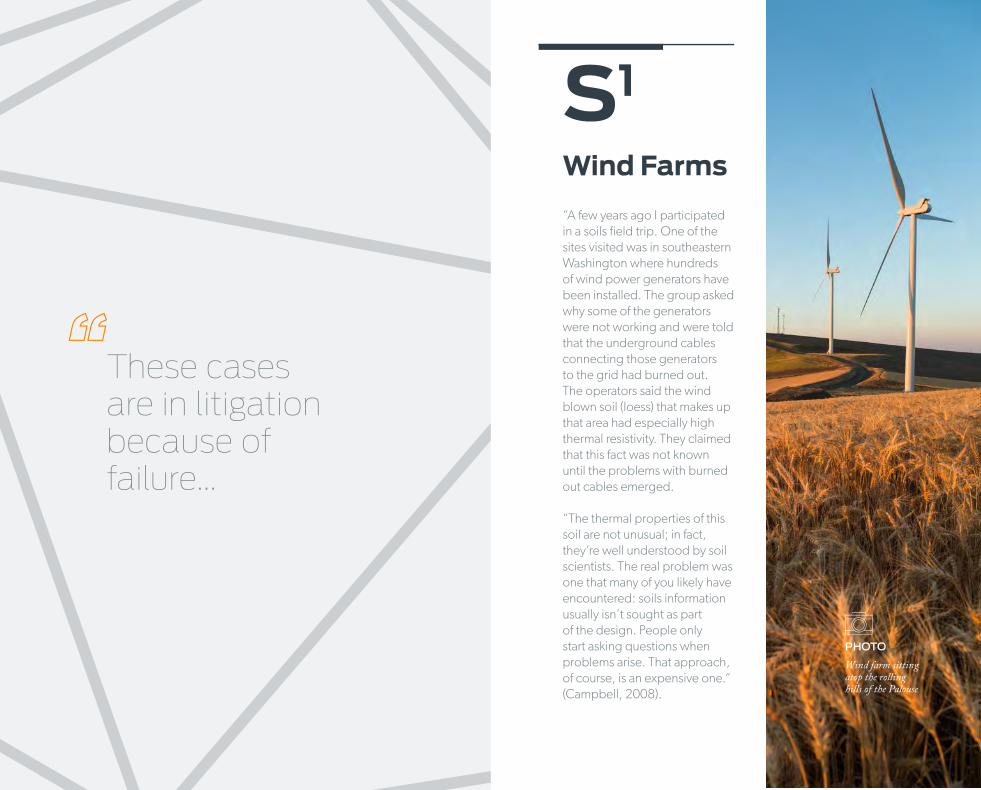
Wind Farms
“A few years ago I participated in a soils field trip. One of the sites visited was in southeastern Washington where hundreds of wind power generators have been installed. The group asked why some of the generators were not working and were told that the underground cables connecting those generators to the grid had burned out. The operators said the wind blown soil (loess) that makes up that area had especially high thermal resistivity. They claimed that this fact was not known until the problems with burned out cables emerged.
“The thermal properties of this soil are not unusual; in fact, they’re well understood by soil scientists. The real problem was one that many of you likely have encountered: soils information usually isn’t sought as part of the design. People only start asking questions when problems arise. That approach, of course, is an expensive one.” (Campbell, 2008).
PHOTO
Wind farm sitting atop the rolling hills of the Palouse
These cases are in litigation because of failure...

46 47
S2
Data Centers
“Data Centers are a new challenge for power engineers,” says Lane. “During the early years of data center design, there was not a true understanding of the effects of heating in underground electrical systems. The NEC [National Electrical Code] offered some guidance, but in general engineers didn’t understand the effects of load factor and Rho value. They designed electrical systems for critical environments like they would for a normal building, and used a standard Rho value taken from the NEC that we now know to be false.”
The results were sometimes catastrophic. “When PVC conductors overheat, they outgas chlorine,” explains Lane. “The chlorine gas can mix with moisture often found in underground systems and create hydrochloric acid (HCL) that can result in corrosion
on switchgear and failed conductor insulation. It’s just a matter of time until you have a catastrophic failure.”
“I’ve seen pictures of two year old switchgear that looks like it’s 100 years old,” adds Lane’s partner, Scott Coburn.
Lane and Coburn agree that even now quite a few electrical engineers are just not aware of these issues. “We always start by educating our clients,” Lane
says. “We tell them, ‘This is a real thing. If you don’t account for this condition, you will have a failure.’ I’ve acted as an expert witness in cases where [the original designer] assumed a thermal Rho of 90. These cases are in litigation because of failure.”
One solution to the problem is to be extremely conservative in the design, but this type of design dramatically and unnecessarily increases costs.
Most businesses can’t accept the expense of gross over-design. Lane and Coburn have instead done the work to understand the factors involved in complex Neher-McGrath heatings and 3-D modeling, work they’ve shared in a website at Neher-Mcgrath.com. And they never assume a Rho value of 90. They require all sites to be tested and use the actual Rho of the native soil in their calculations.
PHOTO
Cable Racks at Grid Computing Center, Fermilab with Blue Lights

49
Public Utilities
In February 1998, a series of four power cable failures blacked out New Zealand’s most important commercial district for nearly five weeks. The official investigation into the failure cited improper ampacity rating of the buried cables.
“Soil and geographic conditions can have a major influence on the performance of the cable and for this reason these conditions need to be monitored. In particular accurate data is needed on the soil temperature and soil resistivity. Because these conditions can change over time it may be necessary to also change the supply capacity rating of the cables over time.
“Both the gas and oil cables were installed in soil conditions which did not allow the cables to achieve their specified rating. Mercury had a view that the
S3
two oil filled cables were fully reliable –up to their full nominal rating of 60MVA. In fact the rating of these cables was much lower due to the ground conditions in which they were buried. When they were loaded to more than half their nominal rating they would have started to overheat.
“Once the cables were installed most of these issues would not be detected by conventional routine cable maintenance practices and there are grounds to believe that Mercury Energy may have been lulled into a false sense of security. Mercury’s false sense of security is confirmed by an apparent lack of precautions that other operators may have taken following the failure of the two gas filled cables.” (Auckland Power Supply Failure 1988).PHOTO
Transfer station with high-line poles in the background

50
Underwater Cables
S4
Denmark
“In the situation described in Denmark, it was stated that ‘Cooling conditions for a submarine cable are normally assumed to be very good and the ampacity is based on a low value of thermal resistivity of the seabed.’ Since the land section had a thermal resistivity of 43 to 54 °C-cm/Watt, it was assumed that the value in the seabed was equally as low. After two joints failed in service, it was discovered in laboratory investigations that the seabed material contained high organic levels and that the thermal resistivity was 105 °C-cm/Watt. Needle probes into the seabed discovered a Rho of 94 °C-cm/Watt.
London
“In the London investigation, they found the [Rho of the] silt in the bottom of canals to be as high as 118 °C-cm/Watt and that even higher values could be reached in the presence of heated cables.
Lake Champlain
“The Lake Champlain 115 kV cables were installed in 1958 and failed in 1969 at a depth of about 300 feet. A sample of the soil near the failure was sent to a laboratory for analysis. They found the silt to have an average value of Rho of 90 to 100 even though the silt ‘was not tested in the condition that it was in the lake bottom.’ The new cable rating was based on the lake bed silt to have a Rho of 140 °C-cm/Watt.” (Thue, 2003).
PHOTO
Offshore wind park in the Baltic Seaby M. Prinkle
52 53
R P
New Zealand Ministry of Commerce. (1998). Auckland Power Supply Failure 1998: The Report of the Ministerial Inquiry into the Auckland Power Supply Failure. Wellington: Ministry of Commerce.
Campbell, G.S. & Norman, J.M. (1998). An Introduction to Envi-ronmental Biophysics. (2nd Edition). New York: Springer.
DeVries, D. A. (1963). Thermal Properties of Soils. In W. R. van Wijk (Ed.), Physics of Plant Environment. New York: John Wiley.
Campbell, G.S. (2008). Measuring and Modeling Thermal Prop-erties of Soil, Rock and Concrete. Virtual Seminar. Retrieved from http://[LINK]
International Electrotechnical Commision. (1982). Calculation of continuous current rating of cables (100% load factory). Publications 287 Geneva: IEC Central Office.
Mumford, J. (2014) Where the Cloud Meets the Soil. Retrieved from http://[LINK]
National Fire Protection Association. (2014). NFPA 70: National Electric Code Quincy, MA: National Fire Protection Association.
Neher, J. H. and M. H. McGrath. (1957). The Calculations of the Temperature Rise and Load Capability of Cable Systems. AIEE Transactions, 76, 752-764.
Taylor, S. A. & Cavazza, L. (1954) Movement of Soil Moisture in Response to Temperature Gradients, Soil Science Society of America, 18, 351-358.
Thue, William. (ed.). (2003) Electrical Power Cable Engineering. 2nd Ed. New York: Marcel Dekker.
54

19 - 12 - 14
Distributed by:
Version 1.0 July 2015
LABCELL LTD FOUR MARKS, ALTON, HAMPSHIRE GU34 5PZ TEL: ++44 (0)1420 568150 FAX: ++44 (0)1420 568151 e: [email protected] www.labcell.com