donald bruce - rock anchors then and nowgeosystemsbruce.com/v20/biblio/z185_2003_rockanchors...sept...
TRANSCRIPT
Sept2003
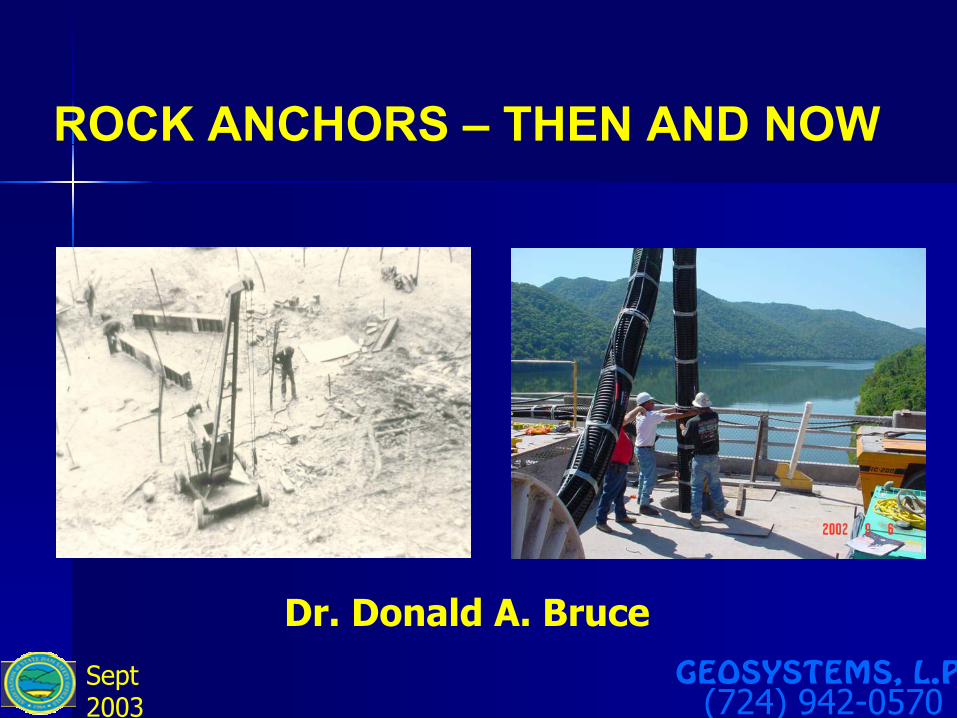
ROCK ANCHORS – THEN AND NOW
Dr. Donald A. BruceGEOSYSTEMS, L.P.
(724) 942-0570

Sept2003
1. Background2. Geotechnical Design3. Construction
3.1 Drilling3.2 Water Pressure Testing3.3 Grouting3.4 Tendon
4. Stressing and Testing5. As-Built Records6. Overview
1.1. BackgroundBackground2.2. Geotechnical DesignGeotechnical Design3.3. ConstructionConstruction
3.13.1 DrillingDrilling3.23.2 Water Pressure TestingWater Pressure Testing3.33.3 GroutingGrouting3.43.4 TendonTendon
4.4. Stressing and TestingStressing and Testing5.5. AsAs--Built RecordsBuilt Records6.6. OverviewOverview
GEOSYSTEMS, L.P.(724) 942-0570

Sept2003
1.1. BackgroundBackground
Large dam, Pacific NorthwestLarge dam, Pacific Northwest142 vertical anchors installed in 1975, to resist sliding142 vertical anchors installed in 1975, to resist sliding“Button head” wire tendons, total length 55 to 168 “Button head” wire tendons, total length 55 to 168 feet.feet.Design Working Load 205 to 1490 kipsDesign Working Load 205 to 1490 kipsLong term performance monitored via 4Long term performance monitored via 4--wire wire ““minitendonsminitendons””Original records available, permitting comparison with Original records available, permitting comparison with current PTI (1996) Recommendationscurrent PTI (1996) Recommendations

Sept2003 GEOSYSTEMS, L.P.
Then:Uniform bond distributionτw = 100 to 130 psi“Volume of rock cone”theory for overall stability
Then:Then:Uniform bond distributionUniform bond distributionττww = 100 to 130 psi= 100 to 130 psi““Volume of rock coneVolume of rock cone””theory for overall stabilitytheory for overall stability
2.2. Geotechnical DesignGeotechnical Design
Sept2003 GEOSYSTEMS, L.P.
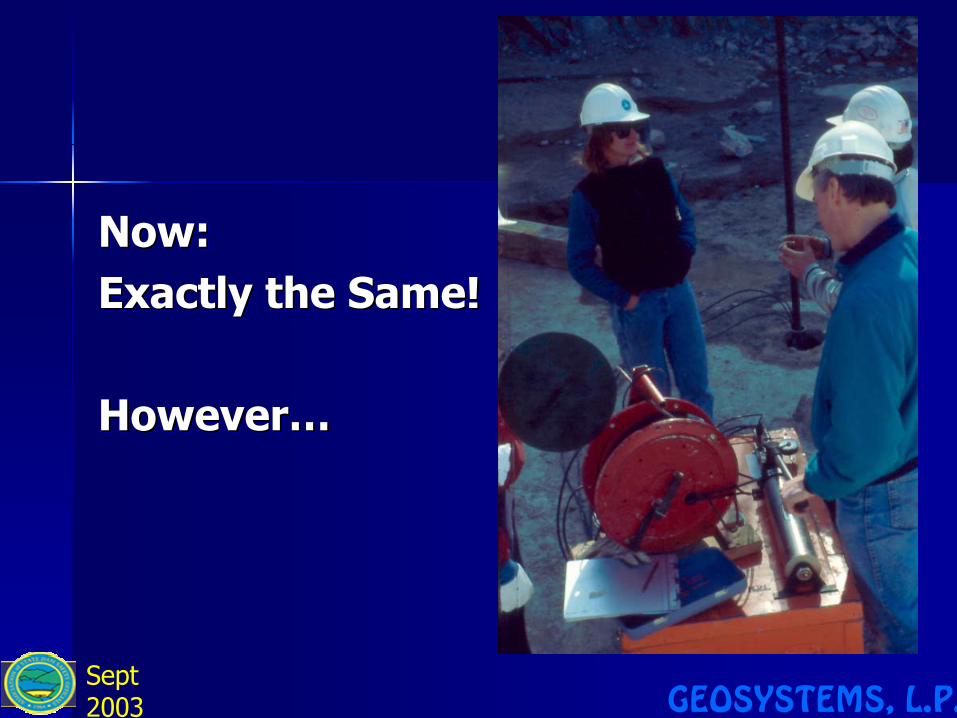
Now:Exactly the Same!
However…
Now:Now:Exactly the Same!Exactly the Same!
HoweverHowever……
Sept2003
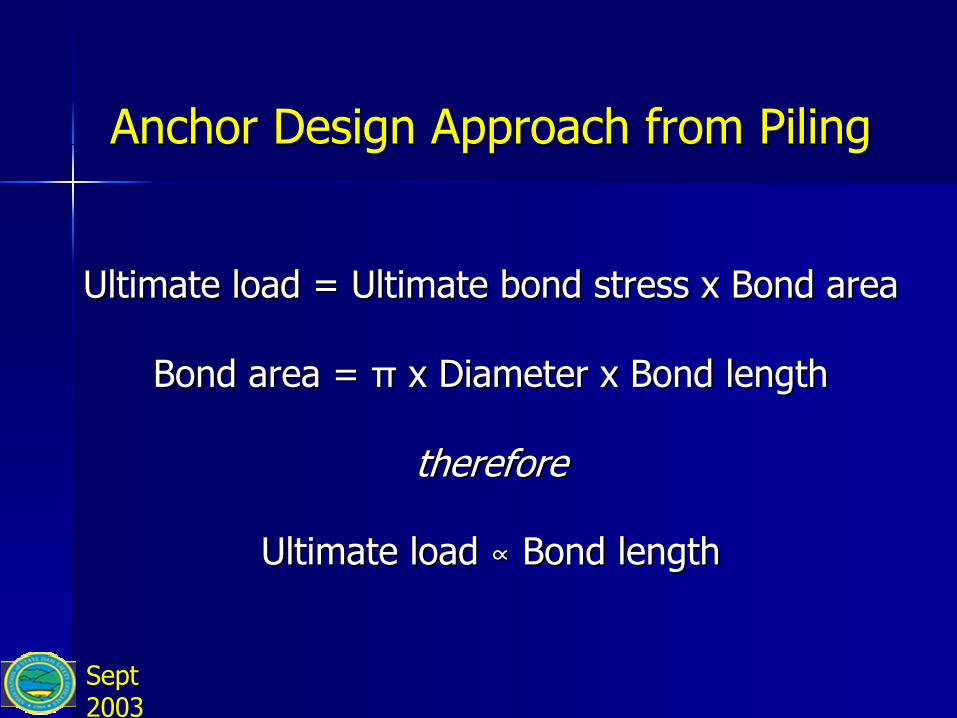
Anchor Design Approach from PilingAnchor Design Approach from Piling
Ultimate load = Ultimate bond stress x Bond areaUltimate load = Ultimate bond stress x Bond area
Bond area = Bond area = ππ x Diameter x Bond lengthx Diameter x Bond length
thereforetherefore
Ultimate load Ultimate load ∝∝ Bond length Bond length

Sept2003
ASSUMPTION
Normal Anchor DesignNormal Anchor Design
Stress distribution of a simple design approachStress distribution of a simple design approachUltimate load = Ultimate load = ππ x d x L x x d x L x ττultult
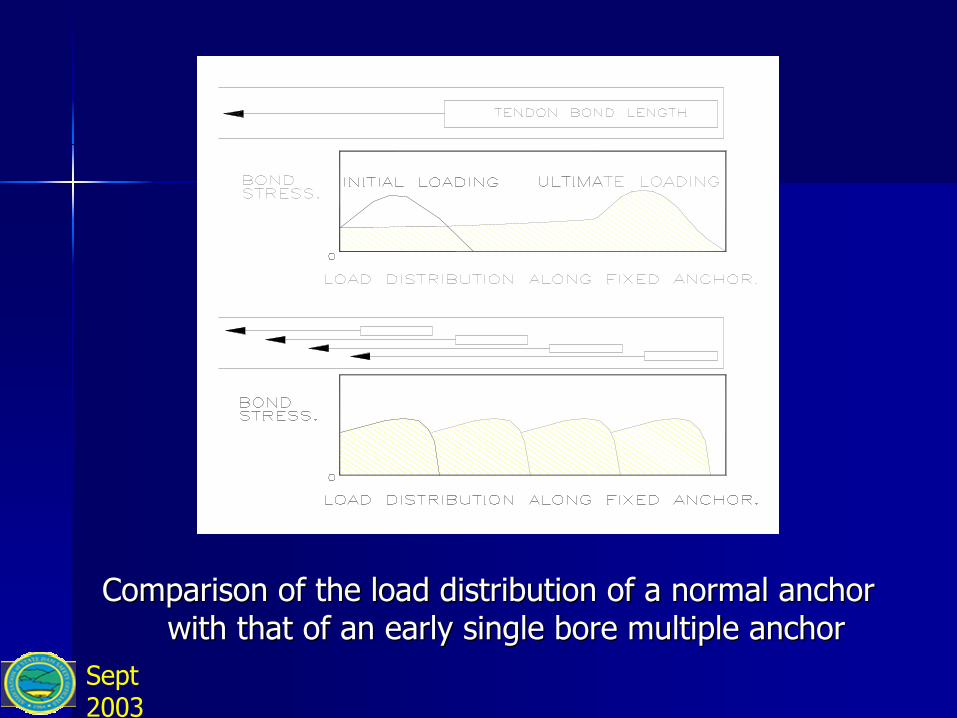
This means load This means load ∝∝ fixed lengthfixed lengthThis is This is notnot a true statement.a true statement.

Sept2003
Actual normal anchor load distribution during Actual normal anchor load distribution during loadingloading

Sept2003
Distribution of anchor efficiency with fixed length Distribution of anchor efficiency with fixed length showing best fit curve (Barley, 1995)showing best fit curve (Barley, 1995)
0
0.1
0.2
0.3
0.4
0.5
0.6
0.7
0.8
0.9
1
0 5 10 15 20 25
FIXED LENGTH (m)
(fef
f) EF
FIC
IEN
CY
FAC
TOR
f eff = 1.6L-0.57
Sept2003
Comparison of the load distribution of a normal anchor Comparison of the load distribution of a normal anchor with that of an early single bore multiple anchorwith that of an early single bore multiple anchor

Sept2003
1010--m Efficiency factor = 0.43m Efficiency factor = 0.432.52.5--m Efficiency factor = 0.95m Efficiency factor = 0.95
Therefore, SBMA hasTherefore, SBMA has
0.95/0.43 = 2.2 x normal anchor capacity0.95/0.43 = 2.2 x normal anchor capacityin same boreholein same borehole
Normal 10 m anchor capacity vs.10 m Multiple anchor capacitycomprising four 2.5 m units

Sept2003
Load distribution developed in a SBMALoad distribution developed in a SBMA
Where ground Strength improves with depth
Realistic consideration from circa 1992

Sept2003
3.13.1 DrillingDrilling
Then:Then:Diamond drilling in concreteDiamond drilling in concreteRotary or rotary percussive in rockRotary or rotary percussive in rockDeviation monitoring (< 1 in 100)Deviation monitoring (< 1 in 100)Pressure groutingPressure groutingMaintain full logsMaintain full logs

Sept2003
3.13.1 DrillingDrilling
Now:Now:Diamond drilling only for reinforced concrete or Diamond drilling only for reinforced concrete or veryvery weak structuresweak structuresUse downUse down--thethe--hole hammerhole hammer–– Deviation controlDeviation control–– SpeedSpeed–– Vibrations/pneumatic fractureVibrations/pneumatic fracture
MWDMWD

Sept2003
Rock Drilling MethodsRock Drilling Methods
1.1. RotaryRotaryHigh rpm, low torque, low thrust (blind or core)High rpm, low torque, low thrust (blind or core)Low rpm, high torque, high thrustLow rpm, high torque, high thrust
2.2. Rotary PercussiveRotary PercussiveTop HammerTop HammerDownDown--thethe--hole Hammer hole Hammer
–– Direct circulationDirect circulation–– Reverse circulationReverse circulation–– Dual fluid drillingDual fluid drilling–– Water hammersWater hammers
3.3. Rotary Vibratory (Sonic)Rotary Vibratory (Sonic)

Sept2003
Sonic Drilling: AdvantagesCan provide continuous, relatively Can provide continuous, relatively undisturbed cores in soil (75undisturbed cores in soil (75--250 mm 250 mm diameter) and rockdiameter) and rockVery high penetration ratesVery high penetration ratesReadily penetrates obstructionsReadily penetrates obstructionsDepths to 150 mDepths to 150 mCan easily convert to other types of Can easily convert to other types of drillingdrillingNo flush in overburden, minor amounts No flush in overburden, minor amounts in rockin rock

Sept2003
Circulation Type and ApplicationCirculation Type and ApplicationUp-hole velocity (UHV) > “sinking velocity”UHV (m/min) = 1274 x Flush Pump Rate (Liters/min)
D2 – d2 (mm)where D = drill hole diameter (in mm)
d = drill string diameter (in mm)Typical UHVTypical UHV– Air, or air/water “mist”: 1500 m/s (max 2100 m/s– Water: 36 m/s (max 120 m/s)– Low to medium viscosity mud: 30 m/s– Very thick mud: 18 m/s– Foam: 12 m/s

Sept2003
OVERBURDENDRILLING METHODS
Overburden isSTABLE*
Overburden isUNSTABLE*
SolidStemAuger
Open Hole(with Rock
DrillingMethods)
HollowStemAuger
“Combination”Methods
SlurrySupportedMethods
CasedMethods
VERY HIGH ------------------------------------------------------------------------------------ Instantaneous Penetration Rate Potential ---------------------------------------------------------------------------------- LOWER
LOW ------------------------------------------------------------------------- Technological Sophistication ----------------------------------------------------------------------- HIGH
LOW --------------------------------------------------------------------------- Presence of Obstructions --------------------------------------------------------------------- SEVERE
LOW ----- Presence of -- SEVEREObstructions
HIGH --– Environmental ---- LOWConcerns
Sonic SingleTube
RotaryDuplex
RotaryPercussive
Duplex(Eccentric)
DoubleHead
Duplex
*Stability refers to the overburden’s ability to maintain the shape and size of the drilled hole without detriment to thesurrounding ground after withdrawal of the drilling system.
Bentonite Polymer SelfHardening
RotaryPercussive
Duplex(Concentric)

Sept2003
Circulation Type and Application Circulation Type and Application (Continued)(Continued)
Air vs. Water Air vs. Water –– Rotary vs. Rotary PercussionRotary vs. Rotary PercussionGuideline for selectionGuideline for selection–– Provide clean holeProvide clean hole–– Enhance penetration rateEnhance penetration rate–– Minimize tool wearMinimize tool wear–– Consistent with purpose of holeConsistent with purpose of hole–– Minimal damage to formation and/or structuresMinimal damage to formation and/or structures–– Environmentally compatibleEnvironmentally compatible–– Reconsider options if “lost flush” occursReconsider options if “lost flush” occurs

Sept2003
Borehole DeviationBorehole DeviationPotential for deviation depends onPotential for deviation depends on
Nature of subsurface conditionsNature of subsurface conditionsNature of surface conditions (“drill platform”)Nature of surface conditions (“drill platform”)Nature of drilling method and toolingNature of drilling method and toolingAccuracy of initial drill set upAccuracy of initial drill set upInclination and length of holeInclination and length of holeExpertise and technique of drillerExpertise and technique of drillerNature and length of guide casingNature and length of guide casingUse of special stabilizing devicesUse of special stabilizing devices
NoteNote: Different deviations are acceptable: Different deviations are acceptabledepending on project requirements and technique.depending on project requirements and technique.

Sept2003 Typically 1 to 2 in 100Down-the-hole hammer
< 5 to 20 in 100 depending on depthTop Drive Percussion
2 to 5 in 100High Speed Rotary
GeneralFHWA (1999)
Up to 1 in 30 normally acceptableGeneral statementTiebacksPTI (1996)
Less than 1 in 100Percussive DuplexHorizontal holes in soil
Up to 1 in 200Wireline Core
Up to 1 in 100Rotary Core
Up to 1 in 33Rotary Blind
Up to 1 in 50Down-the-hole
“Unavoidable”
Up to 1 in 20Percussion
Grout holes in rockKutzner (1996)
Up to 1 in 14Drive DrillingGeneral in soilXanthakos et al. (1994)
Target 1 in 125: consistently achieved as little as 1 in 400Down-the-hole hammerDam anchors in rock and concreteBruce et al. (1993)
1 in 6“Dry Drilled Percussion”
1 in 100 increasing to 1 in 20 with increasing depth (70 m)Down-the-hole hammer
Grout holes in rockWeaver (1991)
Up to 1 in 10 at 60 mPercussionGrout holes in rockHoulsby (1990)
1 in 30 “should be anticipated”GeneralGround anchorsBS 8081 (1989)
Achieved 1 in 50 to 1 in 1000 (average 1 in 80)
Double headDuplexDeep grout holes in fillBruce and Croxall
(1989)
Target 1 in 60 to 1 in 240Mainly 1 in 100 or better achievedDown-the-hole hammer and rotaryDam anchors in rock and concreteBruce (1989)
RECORDED DEVIATIONMETHODAPPLICATIONSOURCE
Table 2. Summary of recorded drill hole deviations from more recently published data

Sept2003
Measurement of DeviationMeasurement of Deviation
Not routinely conductedNot routinely conductedReal time vs. retrospectiveReal time vs. retrospectiveVarious principlesVarious principles–– OpticalOptical–– PhotographicPhotographic–– MagneticMagnetic–– GyroscopicGyroscopicScope for “projectScope for “project--specific” adaptationsspecific” adaptations

Sept2003
Recording of Drilling Progress and Recording of Drilling Progress and ParametersParametersValue of real time continuous monitoring Value of real time continuous monitoring for design purposes (manual vs. for design purposes (manual vs. automatic)automatic)Look for “exceptions and unexpecteds” Look for “exceptions and unexpecteds” [Weaver, 1991][Weaver, 1991]Indication of progressive improvement Indication of progressive improvement (e.g., denser, less permeable conditions)(e.g., denser, less permeable conditions)Concept of Concept of specific energyspecific energySeveral generations/evolutionsSeveral generations/evolutions

Sept2003
Calculation of Specific EnergyCalculation of Specific Energy
e = F + 2 π N TA AR
wheree = specific energy (kJ/m3)F = thrust (kN)A = cross sectional area of hole (m2)N = rotational speed (revolutions/second)T = torque (kN-m)R = penetration rate (m/sec)

Sept2003
3.23.2 Water Pressure TestingWater Pressure Testing
Then:Then:Full lengthFull length0.5 gpm at 60 psi0.5 gpm at 60 psi(more typical 0.001 gal/inch diameter/ft/min(more typical 0.001 gal/inch diameter/ft/minat 5 psi)at 5 psi)Very conservative criterionVery conservative criterion

Sept2003
ANCHOR WATERTIGHTNESS CRITERIA
0
5
10
15
20
25
30
35
40
0 20 40 60 80 100 120 140 160 180 200 220 240 260
Length ( ft )
Gal
lons
in 1
0 M
inut
es
PTI 1996
PTI 1974 8"
PTI 1974 12"
PTI 1974 15"
Germany Eder Dam
Hanna
Germany Bornhard &SperberSwitzerland Buro
Switzerland Moshler &MattUK Devonport
European StandardprEN1537:1997
3.23.2 Water Pressure TestingWater Pressure Testing
Now:Now:Knowledge of fissure control on Knowledge of fissure control on permeabilitypermeability2.5 gal at 5 psi excess2.5 gal at 5 psi excessGravity groutGravity grout

Sept2003
3.33.3 GroutingGrouting
Then:Then:Proprietary nonProprietary non--shrink grout for first stageshrink grout for first stageWater:cement ratio ≤ 0.45Water:cement ratio ≤ 0.45PrePre--construction testingconstruction testingHigh speed, high shear mixerHigh speed, high shear mixerTremie groutTremie grout

Sept2003
3.33.3 GroutingGrouting
Now: Now: SameSame except:except:No use of No use of preblendpreblend cementscementsFocus on fluid property testingFocus on fluid property testingOften single stage groutingOften single stage grouting

Sept2003
Trial MixesTrial Mixes
Cement selectionCement selectionCompatibility with Compatibility with admixturesadmixturesMinimize bleedMinimize bleedWater:cement ratioWater:cement ratioStabilityStability

Sept2003
Trial BatchesTrial BatchesTrial Batches
Workability– Flow– Stability
Measure Performance– Bleed– Density– StrengthMixing Time– Manufacturer’s Recommendations– ≅ 4-5 Minutes– Mixer Optimization Process
WorkabilityWorkability–– FlowFlow–– StabilityStability
Measure PerformanceMeasure Performance–– BleedBleed–– DensityDensity–– StrengthStrengthMixing TimeMixing Time–– Manufacturer’s RecommendationsManufacturer’s Recommendations–– ≅≅ 44--5 Minutes5 Minutes–– Mixer Optimization ProcessMixer Optimization Process

Sept2003
3.43.4 TendonTendon
Then:Then:Contractor selectionContractor selectionUse of wire/button headUse of wire/button headNo corrosion protection other than groutNo corrosion protection other than grout

Sept2003
3.43.4 TendonTendon
Now:Now:Tendon specifiedTendon specifiedNo use of wire tendonsNo use of wire tendonsClass 1 Class 1 –– Class 2 Corrosion ProtectionClass 2 Corrosion ProtectionUse of epoxy coated strandUse of epoxy coated strand

Sept2003
How to provide the neededHow to provide the neededCorrosion Protection? Corrosion Protection?
Extrusion Sheathed StrandExtrusion Sheathed Strand–– Complete filling of all Interstices with Corrosion Complete filling of all Interstices with Corrosion
Inhibitor Inhibitor –– No VoidsNo VoidsEpoxy Coated StrandEpoxy Coated Strand–– ASTM AASTM A--882, revised 2002882, revised 2002–– Coating is a barrier to corrosion, Coating is a barrier to corrosion, –– If damaged, Local Galvanic Cell may occur If damaged, Local Galvanic Cell may occur
Corrugated Outer Duct Corrugated Outer Duct –– Barrier to corrosion elements Barrier to corrosion elements –– Larger dia. duct is job site installed.Larger dia. duct is job site installed.–– Larger dia. drill hole may be required.Larger dia. drill hole may be required.

Sept2003
How to provide the unbonded length?How to provide the unbonded length?
Sheath Extruded onto the StrandSheath Extruded onto the Strand–– Assured Corrosion ProtectionAssured Corrosion Protection–– High Force Transmission Efficiency High Force Transmission Efficiency
Slipped on Tube SheathSlipped on Tube Sheath–– Larger accumulated diameter of anchor Larger accumulated diameter of anchor
tendon bundletendon bundle
Two stage grouting Two stage grouting –– no sheathno sheath–– Additional step of grouting after stressingAdditional step of grouting after stressing

Sept2003
Corrosion Protection Decision TreeCorrosion Protection Decision Tree
Class 2
Yes
None
No
Agressive
Temporary<24 Months
Class 1
Yes
Class 1
Serious
Class 1
Inexpensive
Class 2
Expensive
In Place Cost
Non Serious
Failure
No
Agressive
Permanent>24 Months
Service Life

Sept2003
Corrosion Protection RequirementsCorrosion Protection RequirementsPROTECTION REQUIREMENTS
CLASS ANCHORAGE UNBONDED TENDON BONDLENGTH LENGTH
I 1. TRUMPET 1. GREASE-FILLED 1. GROUT-FILLED ENCAPSULATED 2. COVER IF SHEATH, OR ENCAPSULATION, TENDON EXPOSED 2. GROUT-FILLED OR
SHEATH, OR 2. EPOXY 3. EPOXY FOR FULLY BONDED ANCHORS
II 1. TRUMPET 1. GREASE-FILLED GROUT 2. COVER IF SHEATH, OR GROUT PROTECTED EXPOSED 2. HEAT SHRINK TENDON SLEEVE
Sept2003
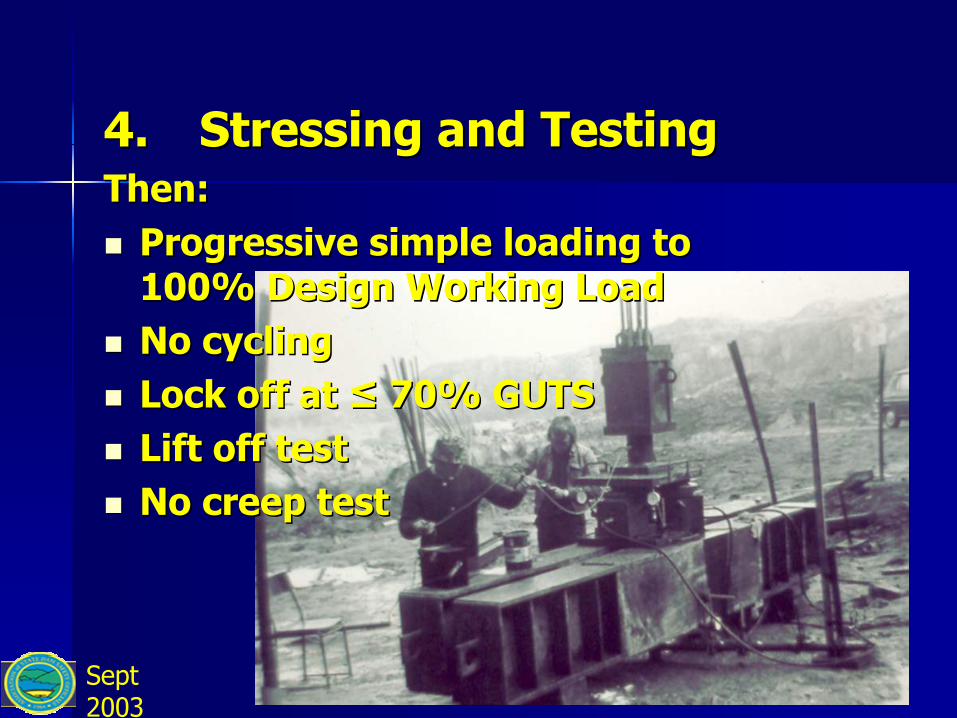
4.4. Stressing and TestingStressing and TestingThen:Then:
Progressive simple loading to Progressive simple loading to 100% Design Working Load100% Design Working LoadNo cyclingNo cyclingLock off at ≤ 70% GUTSLock off at ≤ 70% GUTSLift off testLift off testNo creep testNo creep test

Sept2003
4.4. Stressing and TestingStressing and Testing
Now:Now:Proof and Performance TestsProof and Performance TestsAnalysis of elastic dataAnalysis of elastic dataCreep testCreep testLift offLift offLock off ≤ 60% GUTSLock off ≤ 60% GUTS
Sept2003
Anchor Tests Anchor Tests -- GeneralGeneral
1. Pre-production TestsCarried out on one or two anchors, to confirm the grout / ground bond stress assumed. These tests are carried out on non-production anchors.
2. Performance TestsCarried out on the first two to three anchors, plus a minimum of 2% thereafter, to confirm that the anchors meet the detailed design and specification. These tests are carried out on production anchors.
3. Proof TestsCarried out an all other production anchors, to confirm that the anchors meet the general requirements of the design and specification.
Plus:Supplementary Extended Creep Tests
At least two extended tests shall be made on permanentanchors in soils having a Plasticity Index greater than 20.

Sept2003
Performance TestsPerformance TestsTo Determine:
a) whether the anchor has sufficient load carrying capacity,
b) that the apparent free tendon length has been satisfactorily established,
c) the magnitude of the residual movement,and
d) that the rate of creep stabilizes within the specified limits.
Acceptance Criteria:
133% of design load
minimum > 80% Free lengthmaximum < (Free length + 50% of bond length)
no absolute criterion, but must be determined to evaluate the elastic movement for calculating “ above”
< 1 mm at Test Load during 1 to 10 minutesor if this is exceeded< 2 mm at test Load for a period of 6 to 60 minutes
Cycling loading to: 25%, 50%, 75%, 100%, 120%, 133%(TL) of the design load(DL)Load is decreased to alignment load (AL) after each cycle
After acceptance , adjust to lock-off load

Sept2003
Graphical Analysis of Performance Test DataGraphical Analysis of Performance Test Data
ElasticMovement
ResidualMovement
0
AL
(0. 1
0 )
0.25
δe
δr
0.50 1.00
0 .75
1.20
1.33
Line A: 80% Free Length
Line B: Free Length + 50% Bond Length
LoadDL

Sept2003
Proof TestsProof TestsTo Determine:
a) whether the anchor has sufficient load carrying capacity,
b) that the apparent free tendon length has been satisfactorily established, and
d) that the rate of creep stabilizes within the specified limits.
Acceptance Criteria:
133% of design load
minimum > 80% Free lengthmaximum < (Free length + 50% bond length
< 1 mm at Test Load during 1 to 10 minutesor if this is exceeded< 2 mm at test Load for a period of 6 to 60 minutes
Incrementally loading to: 25%, 50%, 75%, 100%, 120%, 133%(TL) of the design load(DL)After acceptance , adjust to lock-off load

Sept2003
Graphical Analysis of Proof Test DataGraphical Analysis of Proof Test Data
ElasticMovement
ResidualMovement
0
AL
(0. 1
0 )
δe
δr
0.50
1.00
0 .75
1.20
1.33
Line A: 80% Free Length
Line B: Free Length + 50% Bond Length
LoadDL
0.25

Sept2003
Supplementary Extended Creep TestsSupplementary Extended Creep Tests
To Determine: that there is no indication that futureunacceptable movement or creep failure is probable.
A family of creep curves is plotted on a semi-logarithmic chart.
Creep movement < 1 mm at Test load during 1 to 10 minutesor
Creep movement < 2 mm at Test load during 6 to 60 minutes
Testing in accordance with the schedule in Table 8.3
. Note: Epoxy coated strand itself has a significant value and thusshould be accounted for when assessing the creep of the anchor

Sept2003
Special Considerations for Special Considerations for Epoxy Coated Strand AnchorsEpoxy Coated Strand Anchors
ASTM AASTM A--882 alone is not quality guarantee.882 alone is not quality guarantee.Inspect strands during fabricationInspect strands during fabrication
Patch any coating holidays or holes.Patch any coating holidays or holes.Very abrasive surface causes need to protect men Very abrasive surface causes need to protect men and equipmentand equipmentStrand has more curvature memory makingStrand has more curvature memory makinghandling and fabrication more difficult. handling and fabrication more difficult. Coiling very much more difficult due to friction of Coiling very much more difficult due to friction of strands when tendon bent. strands when tendon bent. Handling of anchors may cause coating damage. Handling of anchors may cause coating damage. Efficient patching methods needed. Efficient patching methods needed. Stressing has extra requirements and must be very Stressing has extra requirements and must be very disciplined. Little tolerance for variation.disciplined. Little tolerance for variation.
Slippages have occurred causing rejected anchors.Slippages have occurred causing rejected anchors.

Sept2003
5.5. As Built RecordsAs Built Records
Then:Then:Focus on drilling logs via coresFocus on drilling logs via coresGrout strength data (cubes)Grout strength data (cubes)LoadLoad--extension dataextension data
Now: Much enhanced, e.g.,Now: Much enhanced, e.g.,MWDMWDFluid grout testsFluid grout testsStressing dataStressing data[Computers help][Computers help]

Sept2003
6.6. OverviewOverview
Better material
knowledgeGrouting
Tendon
Water pressure testing
NOWTHEN
Equally good, but quality reflects construction processAs-Built Records
Stressing and Testing
ProductionInvestigationConstructionDrilling
Same – equally conservativeGeotechnical design