dominant role of tectonic inheritance in supercontinent...
TRANSCRIPT

LETTERSPUBLISHED ONLINE: 13 FEBRUARY 2011 | DOI: 10.1038/NGEO1080
Dominant role of tectonic inheritance insupercontinent cyclesPascal Audet* and Roland Bürgmann
Supercontinents episodically assemble and break up, inassociation with the closure and opening of ocean basins1.During these cycles, continental margins are repeatedly weak-ened and deformed during subduction, orogeny and rifting,whereas continental cores tend to remain intact2,3. It hastherefore been suggested that deformation during supercon-tinent cycles is controlled by the pre-existing structure ofthe lithosphere, for example by rheological heterogeneitiesand mechanical anisotropy that were acquired during pasttectonic events4,5. However, observational constraints for thisidea have been lacking. Here we present global, high-resolutionmaps of the lithosphere’s effective elastic thickness over thecontinents—a proxy for the rigidity or long-term strength ofthe lithosphere—calculated from a comparison of the spectralcoherence between topography and gravity anomalies and theflexural response of an equivalent elastic plate to loading.We find that effective elastic thickness is high in Archeancratons, but low in the surrounding Phanerozoic belts. Wealso estimate the anisotropy in effective elastic thickness,indicative of a directional dependence of lithospheric rigidity,and show that directions of mechanical weakness align withlarge gradients in effective elastic thickness and with tectonicboundaries. Our findings support the notion that lithosphericrigidity is controlled by pre-existing structure, and that duringthe supercontinent cycle, strain is concentrated at pre-existingzones of weakness.
The Earth has experienced several supercontinent cycles since2.7Gyr, the last one ending with the breakup of Pangaea into thecurrent plate configuration. The driving mechanism is associatedwith verticalmotion of the convectivemantle fromboth subductionof ocean basins during supercontinent assembly and warm mantleupwelling causing breakup and the creation of new ocean floor6.Although the details of the dynamics are still debated7–9, it isgenerally agreed that continental margins are repeatedly deformedwithin weak, diffuse zones, and that stronger cratonic lithosphereremains intact during this process2. Most cratonic cores withincontinents show crustal ages greater than 2.0Gyr, are depletedin basaltic constituents and conductively cooled through time,thus acquiring a thick, high-viscosity thermo-chemical root2.Continental margins, in contrast, are much younger (<0.5Gyr),have been thermally rejuvenated and structurally reactivated4,and are much thinner. Such large differences in structure implycomparably large gradients in rheological properties of thelithosphere. These factors, combined with numerical simulationsof coupled mantle convection and continental plates, indicate thatdeformation during supercontinent cycles may be controlled bypre-existing structure acquired from past tectonic events4,5. Thereis little observational constraint, however, on the spatial variabilityof rheological properties of the lithosphere because it cannotbe observed directly10.
Berkeley Seismological Laboratory and Department of Earth and Planetary Science, Berkeley, California 94720, USA. *e-mail: [email protected].
A useful proxy for the long-term strength of the lithosphereis given by the flexural rigidity, D = ETe
3/12(1− ν2), where Eis Young’s modulus and ν is Poisson’s ratio, which governs theresistance to vertical flexure10. The strong dependence of D on Teimplies that the magnitude and spatial variations of Te can havea significant influence on the degree and style of deformation asa result of long-term tectonic loads11. In particular, it is expectedthat spatial variations and gradients in Te can prescribe where strainmay localize and consequently determine the locus of deformationas manifested by brittle (for example seismicity, faulting) andthermal processes (for example volcanism, rifting). Te is estimatedby comparing the spectral coherence between topography andBouguer gravity anomalies with that predicted for an equivalentelastic plate bending under surface and internal loading10. Theplate response is modelled either as isotropic or anisotropic,and the coherence is inverted for a single parameter, Te, or thethree parameters of an orthotropic elastic plate (that is, havingdifferent rigidities in two perpendicular directions), Tmin, Tmax, andφe, the direction of weakest rigidity12. Here we use the wavelettransform method to calculate the coherence and estimate Te andTe anisotropy12,13 and apply the technique to all major continents,with the exception of Greenland and Antarctica where thick icecaps complicate the analysis and data coverage is incomplete. Weaccount for possible bias in Te estimation by considering the effectof gravitational ‘noise’ (as defined by refs 14,15) and maskingregions where the model fails15. Regions where bias is strongestgenerally coincide with areas where topography is low14,15 (Fig. 1a),although the converse is not true in general. A discussion ofthe technique, error analysis and ‘noise’ bias is included in theSupplementary Information.
Figure 1a shows the azimuthal variations of the weak directionof Te superposed on the pattern of Te variations. The results arein agreement with a global, low-resolution compilation of Te fromvarious sources and techniques10, and with regional studies that usehigh-resolution gravity-topography coherencemapping12,13,15–19. Ingeneral the Te pattern correlates with age since the last thermo-tectonic event20, consistent with previous regional findings15–19.Te is high (>100 km) in Early to Late Proterozoic and Archeancratonic provinces, with the largest values found in the NorthAmerican, West African, and East European shields. Some cratons(for example South Africa, North China, South India) exhibitlower Te (50< Te < 100 km), where lithosphere has been thinnedby plume-related magmatism or delamination. Low Te (<40 km)is found in young Phanerozoic orogens (for example AmericanCordillera, Alpide belt) and tectonically active provinces (forexample western North America, Afar Triple Junction and most ofcentral-eastern Asia). Te is also generally low in the hanging wallof past and present subduction zones and along most continentalmargins, possibly the result of thermal and fluid-related weakeningas a consequence of subduction and rifting processes10,21.
184 NATURE GEOSCIENCE | VOL 4 | MARCH 2011 | www.nature.com/naturegeoscience
© 2011 Macmillan Publishers Limited. All rights reserved.

NATURE GEOSCIENCE DOI: 10.1038/NGEO1080 LETTERS
20 40 60 80
0
0
15
30
45
60
7580
¬15
¬30
¬45
¬60
Longitude (° E)
Latit
ude
(° N
)
¬30¬60¬90¬120¬150¬180 30 60 90 120 150 180
0
0
15
30
45
60
7580
¬15
¬30
¬45
¬60
Longitude (° E)
Latit
ude
(° N
)
¬30¬60¬90¬120¬150¬180 30 60 90 120 150 180
100 120 140
a
Te(km)
0 0.1 0.2 0.3
b
|∇Te|
Figure 1 |Global effective elastic thickness over continents calculated from the coherence between Bouguer gravity and topography using a wavelettransform. a, Te anisotropy (sampled on a 3◦×3◦ grid) superposed on filtered (using a Gaussian function of width 900 km) and colour-contoured Te overcontinents and continental shelves (depth shallower than 500 m below sea level). Shaded areas correspond to regions where Te estimation is biased bygravitational ‘noise’14,15. The length of black bars is given by the magnitude of Te anisotropy from the ratio (Tmax−Tmin)/(Tmax+Tmin). b, Magnitude anddirection of Te gradient. All images are in a Robinson projection with a central meridian of 0◦ longitude.
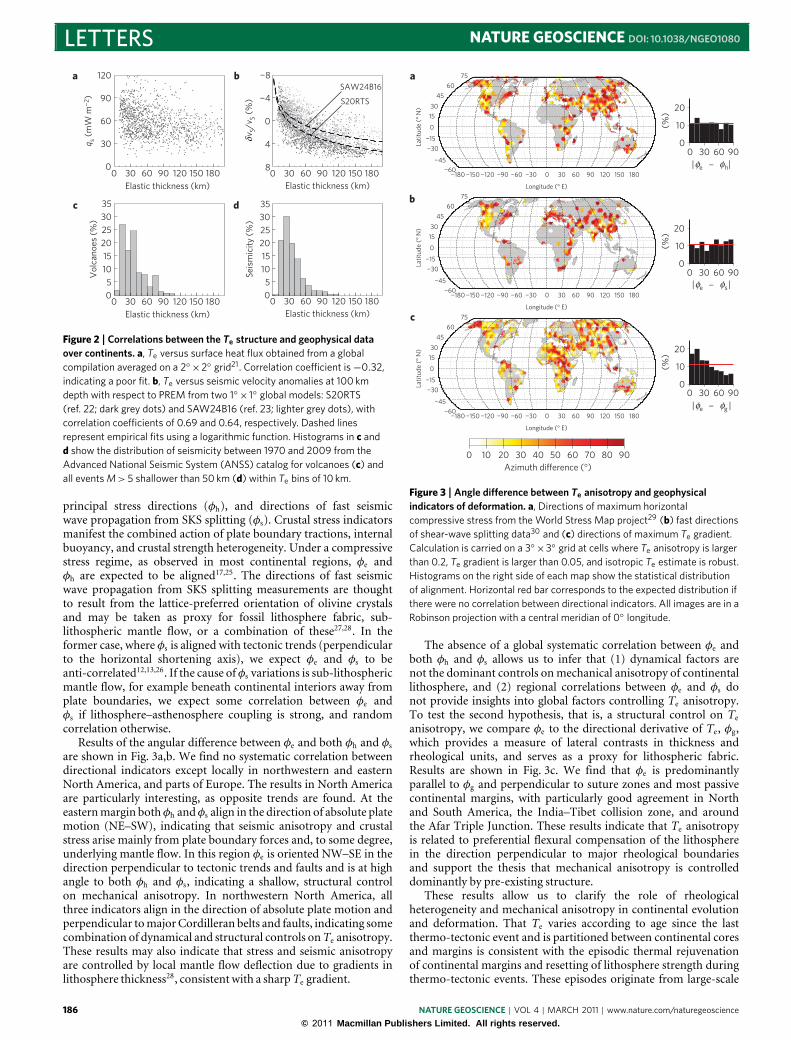
To examine the factors controlling Te variations, we comparethe Te map with global surface heat flux20 (qs) and globalseismic velocity anomalies (δvs/vs) at 100 km depth22,23 (Fig. 2a,b).We find a good correlation (r > 0.64) with both publishedseismic models, indicating that seismic velocities and Te aresensitive to the same range of parameters, mainly temperatureand composition (and thus geotherm24). However, we do notfind a statistically significant relationship between Te and heatflow (r = −0.32). One reason for this discrepancy is the effectproduced by significant upper-crustal heat generation on surfaceheat flow. As such, qs is a poor indicator of lithosphere geothermand does not provide a good measure of lithosphere mantletemperature, and thus temperature-dependent creep strength, oncontinents. Finally, we find a good correlation between low Te andactive tectonic processes: more than 70% of seismicity (for eventsshallower than 50 km) and volcanic centres concentrate whereTe< 40 km (Fig. 2c,d).
Te anisotropy varies over short spatial scales (∼200–500 km) inboth magnitude and direction (Fig. 1a), thus ruling out a deep,sub-lithospheric mantle-flow origin. Magnitude of Te anisotropyis inversely correlated with Te, as young, low-Te provinces exhibitlarger magnitude than older, high-Te cratons. Te anisotropyreflects directional variations in the flexural compensation ofthe lithosphere and has been speculated to originate from twocompeting effects: dynamical17,25 (for example in-plane stress-weakening and basal tractions from underlying mantle flow), orstructural12,13,26 (for example fossil lithospheric fabric, crustal-scalefault systems and gradients in lithosphere thickness). Proxies fordynamical indicators of deformation are given by the crustaldeviatoric stress tensor, and to some degree by seismic anisotropyfrom SKS splitting measurements, although the source of seismicanisotropy is amatter of much debate27 andmay be complex28 (thatis, vertically layered). We test the hypothesis of dynamical controlon Te anisotropy by comparing φe to the maximum horizontal
NATURE GEOSCIENCE | VOL 4 | MARCH 2011 | www.nature.com/naturegeoscience 185© 2011 Macmillan Publishers Limited. All rights reserved.
LETTERS NATURE GEOSCIENCE DOI: 10.1038/NGEO1080
0
30
60
90
120q s
(m
W m
¬2 )
a
0
4
¬4
8
¬8
v S/v
S (%
)
b
05
1015
20253035
Seis
mic
ity (
%)
0 30 60 90 120 150 180Elastic thickness (km)
0 30 60 90 120 150 180Elastic thickness (km)
d
05
1015
20253035
Vol
cano
es (
%)
0 30 60 90 120 150 180Elastic thickness (km)
0 30 60 90 120 150 180Elastic thickness (km)
c
S20RTS
SAW24B16
δ
Figure 2 | Correlations between the Te structure and geophysical dataover continents. a, Te versus surface heat flux obtained from a globalcompilation averaged on a 2◦×2◦ grid21. Correlation coefficient is−0.32,indicating a poor fit. b, Te versus seismic velocity anomalies at 100 kmdepth with respect to PREM from two 1◦× 1◦ global models: S20RTS(ref. 22; dark grey dots) and SAW24B16 (ref. 23; lighter grey dots), withcorrelation coefficients of 0.69 and 0.64, respectively. Dashed linesrepresent empirical fits using a logarithmic function. Histograms in c andd show the distribution of seismicity between 1970 and 2009 from theAdvanced National Seismic System (ANSS) catalog for volcanoes (c) andall events M> 5 shallower than 50 km (d) within Te bins of 10 km.
principal stress directions (φh), and directions of fast seismicwave propagation from SKS splitting (φs). Crustal stress indicatorsmanifest the combined action of plate boundary tractions, internalbuoyancy, and crustal strength heterogeneity. Under a compressivestress regime, as observed in most continental regions, φe andφh are expected to be aligned17,25. The directions of fast seismicwave propagation from SKS splitting measurements are thoughtto result from the lattice-preferred orientation of olivine crystalsand may be taken as proxy for fossil lithosphere fabric, sub-lithospheric mantle flow, or a combination of these27,28. In theformer case, where φs is aligned with tectonic trends (perpendicularto the horizontal shortening axis), we expect φe and φs to beanti-correlated12,13,26. If the cause ofφs variations is sub-lithosphericmantle flow, for example beneath continental interiors away fromplate boundaries, we expect some correlation between φe andφs if lithosphere–asthenosphere coupling is strong, and randomcorrelation otherwise.
Results of the angular difference between φe and both φh and φsare shown in Fig. 3a,b. We find no systematic correlation betweendirectional indicators except locally in northwestern and easternNorth America, and parts of Europe. The results in North Americaare particularly interesting, as opposite trends are found. At theeasternmargin bothφh andφs align in the direction of absolute platemotion (NE–SW), indicating that seismic anisotropy and crustalstress arise mainly from plate boundary forces and, to some degree,underlying mantle flow. In this region φe is oriented NW–SE in thedirection perpendicular to tectonic trends and faults and is at highangle to both φh and φs, indicating a shallow, structural controlon mechanical anisotropy. In northwestern North America, allthree indicators align in the direction of absolute plate motion andperpendicular tomajorCordilleran belts and faults, indicating somecombination of dynamical and structural controls onTe anisotropy.These results may also indicate that stress and seismic anisotropyare controlled by local mantle flow deflection due to gradients inlithosphere thickness28, consistent with a sharpTe gradient.
0
10
20
(%)
0 30 60 90| e hφφ |
| e sφφ |
| e gφφ |
a
0
10
20
(%)
0 30 60 90
b
0
10
20
(%)
0 30 60 90
c
0 10 20 30 40 50 60 70 80 90Azimuth difference (°)
¬
¬
¬
0
0
15
30
45
60
75
¬15
¬30
¬45
¬60
Longitude (° E)
Latit
ude
(° N
)
¬30¬60¬90¬120¬150¬180 30 60 90 120 150 180
0
0
15
30
45
60
75
¬15
¬30
¬45
¬60
Longitude (° E)
Latit
ude
(° N
)
¬30¬60¬90¬120¬150¬180 30 60 90 120 150 180
0
0
15
30
45
60
75
¬15
¬30
¬45
¬60
Longitude (° E)
Latit
ude
(° N
)¬30¬60¬90¬120¬150¬180 30 60 90 120 150 180
Figure 3 |Angle difference between Te anisotropy and geophysicalindicators of deformation. a, Directions of maximum horizontalcompressive stress from the World Stress Map project29 (b) fast directionsof shear-wave splitting data30 and (c) directions of maximum Te gradient.Calculation is carried on a 3◦×3◦ grid at cells where Te anisotropy is largerthan 0.2, Te gradient is larger than 0.05, and isotropic Te estimate is robust.Histograms on the right side of each map show the statistical distributionof alignment. Horizontal red bar corresponds to the expected distribution ifthere were no correlation between directional indicators. All images are in aRobinson projection with a central meridian of 0◦ longitude.
The absence of a global systematic correlation between φe andboth φh and φs allows us to infer that (1) dynamical factors arenot the dominant controls onmechanical anisotropy of continentallithosphere, and (2) regional correlations between φe and φs donot provide insights into global factors controlling Te anisotropy.To test the second hypothesis, that is, a structural control on Teanisotropy, we compare φe to the directional derivative of Te, φg,which provides a measure of lateral contrasts in thickness andrheological units, and serves as a proxy for lithospheric fabric.Results are shown in Fig. 3c. We find that φe is predominantlyparallel to φg and perpendicular to suture zones and most passivecontinental margins, with particularly good agreement in Northand South America, the India–Tibet collision zone, and aroundthe Afar Triple Junction. These results indicate that Te anisotropyis related to preferential flexural compensation of the lithospherein the direction perpendicular to major rheological boundariesand support the thesis that mechanical anisotropy is controlleddominantly by pre-existing structure.
These results allow us to clarify the role of rheologicalheterogeneity and mechanical anisotropy in continental evolutionand deformation. That Te varies according to age since the lastthermo-tectonic event and is partitioned between continental coresand margins is consistent with the episodic thermal rejuvenationof continental margins and resetting of lithosphere strength duringthermo-tectonic events. These episodes originate from large-scale
186 NATURE GEOSCIENCE | VOL 4 | MARCH 2011 | www.nature.com/naturegeoscience
© 2011 Macmillan Publishers Limited. All rights reserved.

NATURE GEOSCIENCE DOI: 10.1038/NGEO1080 LETTERSvertical convective motion of the mantle during continentalassembly and breakup and are accompanied by margin-widefaulting and fault reactivation (either from rifting or thrusting)that further weaken marginal lithosphere and induce significantmechanical anisotropy. A weak and faulted lithosphere mayenhance deformation by concentrating strain at pre-existingstructures. Over time, these factors isolate continental interiorsfrom deformation due to plate boundary forces during continentalassembly and allow only a small fraction of continental lithosphereto get recycled. Only in rare cases do plumes or delamination eventsde-stabilize cratonic cores. This model is consistent with numericalmodels of continental evolution that simulate the stability ofcratonic crust and longevity of deeper roots as a consequence ofhigher yield strength with respect to oceanic lithosphere, and thebuffering effect of weak mobile belts and margins that absorbstresses during repeated supercontinent cycles7–9. This, in turn,implies that the inherited weakness of marginal lithosphere isrelatively long-lived, despite its tendency to get recycled intothe mantle during orogeny, possibly the result of continuousaccretion of terranes and plateaus that further enhances mechanicalweakness and anisotropy.
Received 24 May 2010; accepted 11 January 2011; published online13 February 2011
References1. Wilson, J. T. Did the Atlantic close and then re-open? Nature 211,
676–681 (1966).2. Jordan, T. H. Composition and development of the continental tectosphere.
Nature 274, 544–548 (1978).3. Li, Z. X. et al. Assembly, configuration, and break-up history of Rodinia: A
synthesis. Precambr. Res. 160, 179–210 (2008).4. Thomas, W. A. Tectonic inheritance at a continental margin. GSA Today 16,
4–11 (2006).5. Vauchez, A., Tommasi, A. & Barruol, G. Rheological heterogeneity, mechanical
anisotropy and deformation of the continental lithosphere. Tectonophysics 296,61–86 (1998).
6. Gurnis, M. Large-scale mantle convection and the aggregation and dispersal ofsupercontinents. Nature 332, 695–699 (1988).
7. Gurnis, M., Zhong, S. & Toth, J. in The History and Dynamics of Global PlateMotions (eds Richards, M. A., Gordon, R. G. & van der Hilst, R. D.) 73–94(Am. Geophys. Union, 2000).
8. Lenardic, A., Moresi, L-N. & Mühlhaus, H. Longevity and stability of cratoniclithosphere: Insights from numerical simulations of coupled mantle convectionand continental tectonics. J. Geophys. Res. 108, 2303 (2003).
9. Coltice, N. et al. Global warming of the mantle as the origin of flood basaltsover supercontinents. Geology 35, 391–394 (2007).
10. Watts, A. B. Isostasy and Flexure of the Lithosphere(Cambridge Univ. Press, 2001).
11. Burov, E. B. & Diament, M. The effective elastic thickness (Te) of continentallithosphere: What does it really mean? J. Geophys. Res. 100, 3905–3927 (1995).
12. Kirby, J. F. & Swain, C. J. Mapping themechanical anisotropy of the lithosphereusing a 2D wavelet coherence, and its application to Australia. Phys. EarthPlanet. Int. 158, 122–138 (2006).
13. Audet, P. &Mareschal, J-C.Wavelet analysis of the coherence between Bouguergravity and topography: Application to the elastic thickness anisotropy in theCanadian Shield. Geophys. J. Int. 168, 287–298 (2007).
14. McKenzie, D. Estimating Te in the presence of internal loads. J. Geophys. Res.108, 2438 (2003).
15. Kirby, J. F. & Swain, C. J. A reassessment of spectral Te estimation incontinental interiors: The case of North America. J. Geophys. Res. 114,B08401 (2009).
16. Pérez-Gussinyé, M. & Watts, A. B. The long-term strength of Europe and itsimplications for plate forming processes. Nature 436, 381–384 (2005).
17. Audet, P., Jellinek, A. M. & Uno, H. Mechanical controls on the deformation ofcontinents at convergent margins. Earth Planet. Sci. Lett. 264, 151–166 (2007).
18. Tassara, A., Swain, C., Hackney, R. & Kirby, J. Elastic thickness structure ofSouth America estimated using wavelets and satellite-derived gravity data.Earth Planet. Sci. Lett. 253, 17–36 (2007).
19. Pérez-Gussinyé, et al. Effective elastic thickness of Africa and its relationshipto other proxies for lithospheric structure and surface tectonics. Earth Planet.Sci. Lett. 287, 152–167 (2009).
20. Artemieva, I. M. Global 1× 1 thermal model TC1 for the continentallithosphere: Implications for lithosphere secular evolution. Tectonophysics 416,245–277 (2006).
21. Hyndman, R. D., Currie, C. A. & Mazzotti, S. Subduction zone backarcs,mobile belts, and orogenic heat. GSA Today 15, 4–10 (2005).
22. Ritsema, J., Jan van Heijst, H. & Woodhouse, J. H. Global transition zonetomography. J. Geophys. Res. 109, B02302 (2004).
23. Mégnin, C. & Romanowicz, B. The shear velocity structure of the mantle fromthe inversion of body, surface and higher modes waveforms. Geophys. J. Int.143, 709–728 (2000).
24. Hyndman, R. D., Currie, C. A., Mazzotti, S. & Frederiksen, A.Temperature control of continental lithosphere elastic thickness, Te vsVs. Earth Planet. Sci. Lett. 277, 539–548 (2009).
25. Lowry, A. R. & Smith, R. B. Strength and rheology of the western US Cordillera.J. Geophys. Res. 100, 17947–17963 (1995).
26. Simons, F. J. & van der Hilst, R. D. Seismic and mechanical anisotropy andthe past and present deformation of the Australian lithosphere. Earth Planet.Sci. Lett. 211, 271–286 (2003).
27. Fouch, M. J. & Rondenay, S. Seismic anisotropy beneath stable continentalinteriors. Phys. Earth Planet. Int. 158, 292–320 (2006).
28. Yuan, H. & Romanowicz, B. Lithospheric layering in the North Americancraton. Nature 466, 1063–1068 (2010).
29. Heidbach, O. et al. The World Stress Map database release 2008,http://dc-app3-14.gfz-potsdam.de/index.html (2008).
30. Wüstefeld, A., Bokelmann, G., Barruol, G. & Montagner, J-P. Identifyingglobal seismic anisotropy patterns by correlating shear-wave splitting andsurface-wave data. Phys. Earth Planet. Int. 176, 198–212 (2009).
AcknowledgementsThis work is supported by the Miller Institute for Basic Research in Science(UC Berkeley).
Author contributionsP.A. performed data processing and inversion. P.A. and R.B. wrote the paper.
Additional informationThe authors declare no competing financial interests. Supplementary informationaccompanies this paper on www.nature.com/naturegeoscience. Reprints and permissionsinformation is available online at http://npg.nature.com/reprintsandpermissions.Correspondence and requests for materials should be addressed to P.A.
NATURE GEOSCIENCE | VOL 4 | MARCH 2011 | www.nature.com/naturegeoscience 187© 2011 Macmillan Publishers Limited. All rights reserved.