domestic retail market report - june 2007 · domestic retail market re port, june 2007 4 july 2007...
TRANSCRIPT

Team: Ben Smithers (0207 901 7174; [email protected] ) Email: [email protected]: 020 7901 7270Contact name and details: Louise van Rensburg
Target Audience: Energy suppliers, customers, consumer organisations and representatives, academics, Government, and other interested parties
Date of Publication: 4 July 2007
Domestic Retail Market Report - June 2007
Ref: 169/07
Document Type: Report
Office of Gas and Electricity Markets Promoting choice and value for all gas and electricity customers
Overview: There has been a lot of political and media debate about how competitive the market for domestic gas and electricity is. Concerns include: the size and speed of suppliers' price cuts in response to falling wholesale prices, customer service levels and whether the market adequately protects vulnerable and fuel poor customers. Our analysis shows that all segments of the market remain highly competitive and not just for customers who pay by direct debit or online. The key findings are: Vigorous price competition between the big six suppliers for all customers - the
spread between prices has shrunk and the most expensive suppliers have been forced to become more competitive to stem customers losses
Suppliers are innovating to retain and win customers - there has been rapid growth in: fixed and capped price deals that shield customers from rising wholesale prices; cheaper online deals; and green tariffs. They now account for roughly 20% of the market
Customer service is improving: suppliers are investing huge sums to improve their systems and 5 suppliers have cut the number of unresolved complaints
Annual customer switching rates are at the highest in 4 years Customer switching in response to poor service or uncompetitive prices helps to keep the market competitive. We will continue to make sure that all customers - including the vulnerable and fuel poor - have access to good information to enable them to make the right choice for them and switching remains simple and hassle free.

Domestic Retail Market Report, June 2007 4 July 2007
Context Our principal objective is to protect the interests of consumers. We do this by promoting effective competition where possible and through regulation where necessary. Since the late 1990s domestic gas and electricity customers have been free to choose who supplies their gas and electricity. In 2002 we concluded that the market was sufficiently competitive to remove price controls for domestic retail customers. Since then our primary role has been to monitor market developments to ensure that residential energy consumers are still protected by effective competition. We do this every day but periodically we publish analysis of the data we routinely collect when there are significant developments to report. We published our last Domestic Retail Market Report in July 2006. This document reports on the key developments in the retail energy market over the past 12 months. This report is designed to inform the debate about the health of retail energy markets. It shouldn't be used by domestic energy customers who are looking to switch supplier to work out who offers the best deal for them. Suppliers' prices and offers change regularly and the price comparisons used in this report are for customers with average gas and electricity consumption - the cheapest supplier may vary according to your own circumstances. Customers looking to switch can access a range of online price comparison services through contacting energywatch (phone: 0845 906 0708 or website www.energywatch.org.uk) We will shortly complete a major review of gas and electricity supply licences that will halve their length and the number of obligations placed on suppliers. We expect that the new slimmed down electricity and gas supply licences, will provide existing (and we hope new) suppliers with more scope to innovate and compete in the retail market, while providing the protection that vulnerable customers in particular require.
Associated Documents Domestic Retail Market Report - March 2006, July 2006 (Ref. No. 110/06) http://www.ofgem.gov.uk/Markets/RetMkts/Compet/Documents1/12875-2306.pdf Domestic Retail Market Report - September 2005, February 2006 (Ref. No. 23/06) http://www.ofgem.gov.uk/Pages/MoreInformation.aspx?file=12875-2306.pdf&refer=Markets/RetMkts/Compet Domestic Retail Market Report - June 2005, February 2006 (Ref. No. 24/06) http://www.ofgem.gov.uk/Markets/RetMkts/Compet/Pages/Compet.aspx
Office of Gas and Electricity Markets

Domestic Retail Market Report, June 2007 4 July 2007
Table of Contents Summary ........................................................................................... 1 1. The domestic retail market............................................................ 3
Domestic energy suppliers ........................................................................ 3Domestic supply contracts and payment methods ........................................ 4
2. The relationship between wholesale and retail energy prices........ 63. Prices ............................................................................................ 94. Product Innovation...................................................................... 12
Price Guarantee Tariffs ............................................................................12Online tariffs..........................................................................................14Green tariffs ..........................................................................................15
5. Customer service......................................................................... 17The Energy Supply Ombudsman ...............................................................18
6. Switching .................................................................................... 197. Market Shares ............................................................................. 228. Prepayment Customers and Fuel Poverty .................................... 26
Cost differences between payment methods ..................................................28Price differences between payment methods..................................................30
Price differences by supplier and fuel type..................................................31PPM switching ...........................................................................................32Prepayment tariffs, fuel poverty, and vulnerable customers .............................33
Equalisation of prepayment tariffs to direct debit or standard credit ...............34Social tariffs and other corporate social responsibility initiatives ....................35Further actions targeting prepayment and vulnerable customers ...................35
Appendices ...................................................................................... 37Appendix 1 – Data Tables ................................................................ 38
Switching .................................................................................................38Annual bills ...............................................................................................42
Appendix 2 - Feedback .................................................................... 49Appendix 3 – The Authority’s Powers and Duties ............................ 50Appendix 5 - Glossary...................................................................... 52
Office of Gas and Electricity Markets

Domestic Retail Market Report, June 2007 4 July 2007
Summary Our analysis and review of developments in the domestic energy supply market over the past 12 months suggests that the market remains dynamic and highly competitive. A record number of customers are switching suppliers - this is driving energy suppliers to offer more competitive prices, improve customer service and innovate by offering new products both to retain existing customers and win new customers. Our analysis reveals a dynamic market where a supplier's competitive position can change quickly and where the best suppliers are seeing significant increases in their market share by delivering superior service at competitive prices. There are also encouraging signs that domestic energy suppliers are beginning to face up to the challenges presented by the need to tackle climate change. Suppliers are taking the first steps towards becoming energy service companies, offering new products such as microgeneration and incentives to help their customers use less energy and reduce their carbon footprint. Our research shows that the record numbers of customers who switch are offered a range of products - from cheaper online deals, to green tariffs and fixed and capped rate products at highly competitive prices. But there are still large numbers of customers who haven't switched who are missing out on the significant savings, better products and better customer service that switching can bring. Over the past 12 months all suppliers have announced price cuts and there has been a significant competitive repositioning among the big 6 suppliers. The most expensive dual fuel supplier 12 months ago now offers the cheapest online deal. Companies that are not delivering on price or service have been punished by significant customer losses and churn. Suppliers who have charged uncompetitive prices in the regions where they used to have a monopoly have seen higher than average market share losses. In 7 of the 14 regions, electricity incumbents now have less than 50% of the market. Where the incumbent has retained market share it is usually because they have offered competitive prices. Despite these price reductions, concerns have been raised about whether suppliers were slow to cut their prices in response to falling wholesale prices and whether they have passed all of the reduction in wholesale prices through to customers. In this report we set out how suppliers typically buy energy for their domestic customers. Suppliers "hedge" their requirements by buying a significant proportion of their customers' energy needs in advance. When wholesale prices are going up, customers benefit as there is a lag before suppliers raise retail prices. When wholesale prices fall it takes time for suppliers to see reduced purchasing costs and pass these through to their customers. Our analysis suggests that competition between suppliers has saved all domestic customers more than £100 on average by protecting them from the full impact of rising wholesale prices over the last 4 years. Customers who did shop around saved even more - £279 on average. And customers who signed up for fixed price deals have made even greater savings. Suppliers all use the same pipes and wires to deliver the same product so they compete on price, service and innovation. We have collected additional data from suppliers to assess the degree of innovation in the market. We would like to thank them for their help in collecting this information. Our analysis shows that around
Office of Gas and Electricity Markets 1
Domestic Retail Market Report, June 2007 4 July 2007
20% of the market is now served by new products such as fixed or capped rate products, online deals or a green supply product. Fixed price deals are particularly popular and four years after they were introduced 6 million customers have signed up to these products. Those that did have enjoyed lower prices and have been protected from much of the rise in wholesale prices. Another finding is that suppliers are beginning to develop new products aimed at encouraging customers to save energy. These products give more choice and are a small but important step towards delivering a low carbon economy. Domestic suppliers are visibly seeking to improve the service they offer customers. Complaints statistics show a steady decrease in unresolved customer grievances. The exception is British Gas - whose complaints have risen significantly as they move to a new customer IT system that they have invested several hundred million pounds in. British Gas has also had to cut prices to become more competitive - perhaps in part because of these problems. Suppliers have also put in place self-regulatory measures. They have set up an Energy Supply Ombudsman (ESO) that can award compensation to the relatively small number of customers who are let down by their supplier and cannot resolve the matter with their supplier. We will be reviewing the performance of the ESO this autumn.
In this report, we have also looked in more detail at how prepayment customers are served by the market. We take an in-depth look at price levels and switching amongst prepayment customers. This analysis suggests that it can be more expensive to supply these customers but that the best tariffs on offer are highly competitive. Our research suggests that prepayment customers could save over £250m a year by switching. Although this wouldn't solve the problem of fuel poverty it would be an important step in the right direction. We recognise that some prepayment customers may find it more difficult to participate in the market. We have started a "switch and save" campaign for prepayment customers and will be looking in more detail at the other factors that might make switching difficult, such as debt blocking and access to reliable price information on switching sites.
We are also looking at what more we can do to help vulnerable and fuel poor customers - the majority of whom are not on prepayment tariffs - get the best deals the market has to offer. As a first step we will soon publish a corporate social responsibility framework to make it clearer what actions are being taken by suppliers to assist vulnerable customers over and above the assistance that they are required to provide by the supply licence or by statute.
We continue to strive to reduce the barriers to market entry and innovation. Our supply licence review will see the size of the supply licence halved and the removal of barriers to innovation such as the 28 day rule. Our work on smart meters could also help tackle concerns about estimated bills and help customers be more energy efficient. For the energy market to work well, customers need to be well informed, involved and active. Our switch and save campaigns and our work on guidelines for green supply should help customers get the right deal for them from the market.
Office of Gas and Electricity Markets 2

Domestic Retail Market Report, June 2007 4 July 2007
1. The domestic retail market
Chapter Summary
There are 26 million domestic electricity and 21.5 million domestic gas customers in Great Britain, supplied mainly by six suppliers. Nearly half of all customers pay their bills by monthly direct debit and just over 12% pay through a prepayment meter. About a third of all customers get their gas and electricity from the same supplier.
This Chapter sets out more information on the different segments of the energy market and how they have evolved over recent years.
1.1. There are 26 million domestic electricity and 21.5 million domestic gas customers in Great Britain. The energy market tends to be categorised according to whether or not the customer uses the same supplier to provide both gas and electricity and by the customer's payment method.
Domestic energy suppliers
1.2. Most of the domestic energy market is served by six suppliers. These brands are British Gas, Powergen, Scottish and Southern Energy (SSE), npower, EDF Energy and ScottishPower. Smaller suppliers include Countrywide Farmers, who provide only gas, and Good Energy and Ecotricity, who both supply only electricity.
1.3. Figure 2.1 shows the current market shares of suppliers in the gas and electricity market respectively. We provide more details on how market shares have changed over time in chapter 7.
Figure 2.1. Market shares (March 2007)
Gas market shares
9%
12%
7%
13% 46%
<1%
13%British GasScottish PowerNpowerEDF EnergyPowergenSSECountry wide
Electricity market shares
18%
14%
16%
19%
<1%
21%12%
British GasPowergenNpowerEDF EnergySSEScottish PowerOthers
Source: Domestic gas suppliers and electricity distribution companies
Office of Gas and Electricity Markets 3

Domestic Retail Market Report, June 2007 4 July 2007
Domestic supply contracts and payment methods
1.4. Before the domestic retail market opened to competition, suppliers could not offer both gas and electricity. Market liberalisation has allowed incumbent electricity suppliers to compete for gas customers and vice versa and has allowed new entrants to sell both fuels. As customers switch from their incumbent energy suppliers there has been an increased take up of dual fuel contracts.
Electricity only:
20%
Dual Fuel:
33%Separate gas and
electricity:
47%
1.5. One third of all customers now have a dual fuel contract. We expect this to continue to rise as more people take advantage of dual fuel discounts.
1.6. Not all customers will move to dual fuel contracts. Some suppliers, particularly the niche (and green) suppliers, do not offer both gas and electricity and customers wanting to take them up on their offer will remain on single fuel contracts. In addition, around 20% of electricity customers are not connected to the gas network.
1.7. Customers pay their bills either when they receive their bill (standard credit), through monthly direct debit payments (MDD), or by using a prepayment (PPM) meter. Figures 2.2 and 2.3 illustrate the proportion of total customers on each payment method. For both gas and electricity MDD is the most popular method of payment with 49% of gas and 45% of electricity customers using this payment method. The proportion of customers paying by standard credit (SC) is similar for both fuels, around 40%. PPM is the smallest segment of both markets. There are slightly more PPM electricity customers (14%) than gas (11%).
Customers by payment method Figure 2.2: Gas customers Figure 2.3: Electricity Customers Source: suppliers
Office of Gas and Electricity Markets 4

Domestic Retail Market Report, June 2007 4 July 2007
1.8. In monitoring the retail market we generally look at each of the following different customer segments:
different payment methods: SC, MDD and PPM dual fuel (DF) contracts, single fuel (SF) contracts and those that are not
connected to the gas mains and who have a higher than average use of electricity.
1.9. Over the past few years there has been a notable increase in the range of new products offered by energy retailers and new products now account for around 20 percent of customer accounts. Information on these different products and the number of customers on them is set out in chapter 4.
1.10. In chapter 8 we give more detailed information on how the retail market serves customers with prepayment meters and also those in fuel poverty and vulnerable customers.
Office of Gas and Electricity Markets 5

Domestic Retail Market Report, June 2007 4 July 2007
2. The relationship between wholesale and retail energy prices
Chapter Summary
This chapter explains the relationship between wholesale and retail price
movements to address some of the concerns that have been expressed about whether suppliers took too long to cut their prices after wholesale prices had fallen and whether they have cut them enough to reflect the fall in wholesale prices.
2.1. Commentators often judge whether retail markets are competitive by assessing whether domestic retail prices track movements in wholesale energy prices. This chapter provides a simple description of the many factors that influence the wholesale costs suppliers incur and explains why in a competitive retail market, domestic retail prices may not simply reflect changes in wholesale energy prices.
2.2. The wholesale costs the supplier faces will depend on their procurement strategy. The retail price the customer pays will depend on this procurement strategy and the suppliers' retail strategy.
2.3. The key decision a supplier has to make in energy procurement is what proportion of the energy should be bought ahead (hedged) on the forward markets. If they don't buy all of their customer's energy requirements in advance they must buy then at day ahead or spot prices. Hedging reduces suppliers' exposure to the volatility of day ahead and spot prices. But it also leaves suppliers in a less flexible position, and more reliant on their forecasts for their customer numbers and their customer demand being accurate. The balance between hedging and buying at spot can impact heavily on the wholesale costs faced by a supplier.
2.4. We illustrate this point with figures 2.1 and 2.2. These show the forward prices for gas in the first quarters of 2006 (Q1 2006) and 2007 (Q1 2007) respectively. The shaded area on each chart shows the average day ahead gas price during each of these quarters. The examples show that the forward trading price for delivery of gas in Q1 2006 was lower than the average Q1 2006 day ahead price (shown as the shaded area) for the majority of its 360 days of futures trading. In contrast, gas for delivery in Q1 2007 traded well above the eventual average day ahead price over the entire 360 day trading period. A company that had kept to a successful Q1 2006 procurement strategy of contracting ahead for the bulk of their customers' demand would have faced higher wholesale costs in contracting ahead for Q1 2007 than a company buying on a day ahead basis in Q1 2007.
Office of Gas and Electricity Markets 6

Domestic Retail Market Report, June 2007 4 July 2007
Gas day ahead price vs. future price over a 360 day trading period Figure 2.1 (Q1 2006) Figure 2.2: (Q1 2007)
0
20
40
60
80
100
120
Apr-03 Jul-03 Oct-03 Jan-04 Apr-04 Jul-04 Oct-04 Jan-05 Apr-05 Jul-05 Oct-05
p/therm
average day-ahead gas price actually seen in Q1 06 forward price for delivery of gas in Q1 06
0
20
40
60
80
100
120
Apr-04 Jul-04 Oct-04 Jan-05 Apr-05 Jul-05 Oct-05 Jan-06 Apr-06 Jul-06 Oct-06
p/therm
average day ahead price actually seen in Q1 2007 forward price for delivery of gas in Q1 2007 Data source: Heren Energy
2.5. Figure 2.3 demonstrates the importance of timing in a hedging strategy. Pricing strategies need to be dynamic. There are potentially large penalties for choosing the wrong strategy.
Figure 2.3: Forward trading price for 2005/06, 2006/07and 2007/08 winter energy supply, 360 days of trading before supply
0
10
20
30
40
50
60
70
80
360 330 300 270 240 210 180 150 120 90 60 30
Days left before start of contract delivery
£/
MW
h
Winter 05/06 Winter 06/07 Winter 07/08
So far it has been a more expensive strategy to buy early for winter 07/08. Prices have dropped as we move towards the delivery date.
Buying energy early for winter 05/06 was a good strategy as prices rose as the delivery date approached.
Data source: Heren Energy
2.6. Each supplier (even a new entrant supplier) employs a wide variety of hedging strategies. This means there is no simple correlation between a supplier's wholesale costs and the wholesale price at any point in time. Added to that, there is a cost to suppliers of changing their retail prices, which means that the retail price will not always reflect the wholesale cost the supplier is facing. For these reasons, even in a highly competitive retail market, retail prices are unlikely to closely track wholesale price movements in the short term.
Office of Gas and Electricity Markets 7

Domestic Retail Market Report, June 2007 4 July 2007
2.7. Effective retail competition will mean that suppliers have a strong incentive to buy their wholesale energy as cheaply as possible. If they don't, they are likely to be constrained in the extent to which they can pass on higher wholesale costs to customers as other, more efficient, suppliers will undercut their prices. This is the reason Ofgem focuses on monitoring the level of competition in the retail market, to check whether competition is sufficient to provide a real constraint on suppliers' prices, rather than tracking in detail the direct relationship between wholesale and retail prices.
2.8. The chart below shows the broad relationship between wholesale costs and retail prices based on an illustrative hedging strategy for a supplier. The blue line does not reflect the actual costs of any particular supplier but provides an illustration of the general relationship between wholesale costs and retail prices for a plausible hedging strategy1. The chart shows that the most competitive supplier's prices increased by £279 less than the total increase in our illustrative wholesale costs over the last four years. It also shows that on average, suppliers passed through less than the full increase in wholesale costs to domestic customers over the same period. This saved the average customer £116.
Figure 2.4. Illustrative graph of wholesale cost increases since 2002 against actual retail increases
-50
0
50
100
150
200
250
300
350
400
Mar-03 Jun-03 Sep-03 Dec-03 Mar-04 Jun-04 Sep-04 Dec-04 Mar-05 Jun-05 Sep-05 Dec-05 Mar-06 Jun-06 Sep-06 Dec-06 Mar-07 Jun-07
estimated average wholesale energy cost for typicaldomestic customer (gas+elec)average standard credit dual fuel bill
best direct debit dual fuel offer (inc online tariffs)
Tota
l in
crea
se (
£ in r
eal te
rms)
sin
ce
Dec
ember
2002
Data source: Heren Energy and TheEnergyShop.com
1 In this hedging strategy example, the estimated wholesale cost is based on an 18 month average of the relevant forward wholesale prices Office of Gas and Electricity Markets 8

Domestic Retail Market Report, June 2007 4 July 2007
3. Prices
Chapter Summary
Even after recent price reductions all customers irrespective of payment type can save by switching supplier: on average £107 for PPM customers, £91 for SC customers and £68 for customers paying by direct debit.
The spread between the most expensive and cheapest supplier has narrowed and some suppliers have responded to falling market shares by becoming more competitive
Customers who currently pay by monthly direct debit can often save money by going to an online deal. Customers who pay by standard credit can save by switching to the best online direct debit deals. Customers on prepayment should also consider changing their payment method if they can.
3.1. About two-thirds of customers switch supplier because they want to pay less for their energy2. Since the beginning of this year, all suppliers have dropped their prices, for example the average annual bill for a dual fuel customer paying by direct debit has declined by about £80. But customers can still make extra savings by switching supplier, whatever payment method they use. On average, customers can save by switching from incumbent suppliers to the best offer. The average savings available for dual fuel customers are £107 for prepayment customers, £91 for standard credit customers and £68 for direct debit customers.
3.2. Appendix 1 shows the impact of the recent price changes across the three main payment methods: monthly direct debit, standard credit and prepayment, separately for gas and electricity (where customers take their gas and electricity from different suppliers), dual fuel and electricity only customers.
3.3. As an example, figure 3.1 illustrates how the situation has changed for customers on dual fuel direct debit. Apart from significant price reductions, the graphs show a narrowing price spread and competitive repositioning by suppliers. For example, British Gas, who saw a significant loss in customers numbers last year, has cut prices to position themselves more competitively in the market. In general, differentials have fallen as incumbents have priced more competitively relative to other suppliers.
2 See Accent survey published as Appendix to June 2005 Domestic Retail Market Report, Ref.24b/06. Office of Gas and Electricity Markets 9

Domestic Retail Market Report, June 2007 4 July 2007
Figure 3.1. Changes in dual fuel direct debit annual bills3
£750
£800
£850
£900
£950
£1,000
£1,050
£1,100
EastMidlands
Eastern London Manweb Midlands Northern Norweb ScottishHydro
ScottishPower
Seeboard Southern Swalec SWEB Yorkshire
An
nu
al
bil
l (£
)
British Gas EDF Energy npower Powergen SSE ScottishPower
750
800
850
900
950
1000
1050
1100
EastMidlands
Eastern London ManwebMidlandsNorthernNorweb ScottishHydro
ScottishPower
SeeboardSouthernSwalec SWEB Yorkshire
An
nu
al
bil
l (£
)
British Gas EDF Energy npower Powergen SSE ScottishPower
Dual fuel direct debit prices May 2007Dual fuel direct debit prices in Jan 2007
Tariff data source: TheEnergyShop.com
3.4. Suppliers are following different pricing strategies by region and by payment method. Figure 3.2 shows the savings available to non-switchers on various payment methods across 14 regions of the country (as at 15 June 2007)4. We show in chapter 7 that regional pricing strategies have impacted upon suppliers regional market shares. It is clear that however a customer pays for their energy, and wherever they are in the country, there are potential savings to be made by switching supplier. These savings are particularly significant for PPM customers and we look at the PPM market in further detail in chapter 8.
Figure 3.2 - Potential savings for energy customers who have never switched supplier (June 2007)
0
20
40
60
80
100
120
140
160
180
200
EastMidlands
Eastern London Manweb Midlands Northern Norweb ScottishHydro
ScottishPower
SeeboardSouthern Swalec SWEB Yorkshire
Pote
ntial Savi
ngs
£
Monthly Direct Debit Prepayment Standard Credit
Tariff data source: TheEnergyShop.com
3 The data has been calculated using annual bills for consumers of medium consumption (20,500kWh for gas and 3,300 kWh for electricity) on standard tariffs, available to new customers 4 Savings are calculated by comparing the sum of gas and electricity incumbent's bills with the minimum of the dual fuel best offer, and the sum of the best individual offers for gas and electricity. Office of Gas and Electricity Markets 10

Domestic Retail Market Report, June 2007 4 July 2007
3.5. Table 3.1 shows the average difference in annual bills between the incumbent's standard tariff and the cheapest standard tariff open to new customers. We have calculated these national figures by taking the mean values of the relevant regional figures.
Table 3.1 - Potential savings compared to incumbents (June 2007)
Source: Ofgem Tariff data source: TheEnergyShop.com
3.6. Table 3.2 shows the difference in annual bills paid by customers who are with the same supplier, but use different payment methods. Customers that want to stay with their chosen supplier(s) can potentially save money through looking at alternative payment methods or tariff offerings.
Table 3.2 - Potential savings available for switching between different payment methods (June 2007)
Incumbent (£)Average
Entrant (£) Incumbent (£)Average
Entrant (£) Incumbent (£)Average
Entrant (£)
Electricity 23 18 2 29 25 50Gas 59 35 48 20 107 55Electricity and gas 82 53 51 50 132 105Dual Fuel n/a 72 n/a 66 n/a 125
Fuel TypeSaving made by
switching from SC to MDD
Saving made by switching from PPM to
SC
Saving made by switching from PPM to
MDD
Source: Ofgem Tariff data source: TheEnergyShop.com
3.7. We discuss in the following chapter non-standard tariffs. These include internet tariffs, fixed-price, capped-price or tracker deals, and "green" tariffs.
Office of Gas and Electricity Markets 11

Domestic Retail Market Report, June 2007 4 July 2007
4. Product Innovation
Chapter Summary
Innovative products offer more choice to customers and have proved very popular. We estimate products such as fixed price deals, green tariffs and online deals now account for around 20% of all gas and electricity accounts. Suppliers are beginning to offer energy services to domestic customers and are starting to reward customers for saving energy.
4.1. Suppliers are offering a greater range of products to attract new and retain existing customers. These have proved popular in the market: there are some 9 million gas and electricity accounts on green, fixed price and online deals, accounting for roughly 20% of all energy accounts. Social tariffs that offer cheaper deals to vulnerable customers will be discussed in more detail in chapter 8.
Price Guarantee Tariffs
4.2. Price guarantee tariffs offer customers certainty over future bills. There was particular demand for this in the period when retail prices were rising. Suppliers responded by introducing price guarantee deals, including fixed price, capped price, and tracker deals.
4.3. Figure 4.1 compares selected price guarantee offers with the best variable price offer. The price guarantee offers shown are the cheapest price guarantee deal in each 6 month intervals. While individual customers’ savings depend on their choice of tariff, the chart below illustrates that customers on the best deals enjoyed significant savings.
4.4. As bills for standard offers have fallen, suppliers have responded by reducing prices charged to customers on fixed price deals, and giving rebates of up to £50 for customers currently on fixed price deals.
Office of Gas and Electricity Markets 12

Domestic Retail Market Report, June 2007 4 July 2007
Figure 4.1: Best offer price guarantee tariff (by price) – at 6 month intervals in real terms (March 2007 prices)
550
600
650
700
750
800
850
900
950
1000
Jan-
03
Jul-0
3
Jan-
04
Jul-0
4
Jan-
05
Jul-0
5
Jan-
06
Jul-0
6
Jan-
07
an
nu
al b
ill £
Lowest variable offer
Jul 03 - lowest price fixed offer (1 tariff open)
Jan 04 - lowest price fixed offer (1 tariff open)
Jul 04 - lowest price fixed offer (2 tariffs open)
Jan 05 - lowest price fixed offer (1 tariff open)
Jul 05 - lowest price fixed offer (2 tariffs open)
Jan 06 - lowest price fixed offer (5 tariffs open)
Jul 06 - lowest price fixed offer (5 tariffs open)
Jan 07 lowest price fixed deal (5 tariffs open)
Source: Ofgem; Tariff data source: The EnergyShop.com
4.5. The first price guarantee tariff was introduced in 2003, and by March 2007 all suppliers offered a price guarantee tariff. These tariffs have evolved over time. For example, all suppliers have removed exit charges and allow customers to switch without penalty.
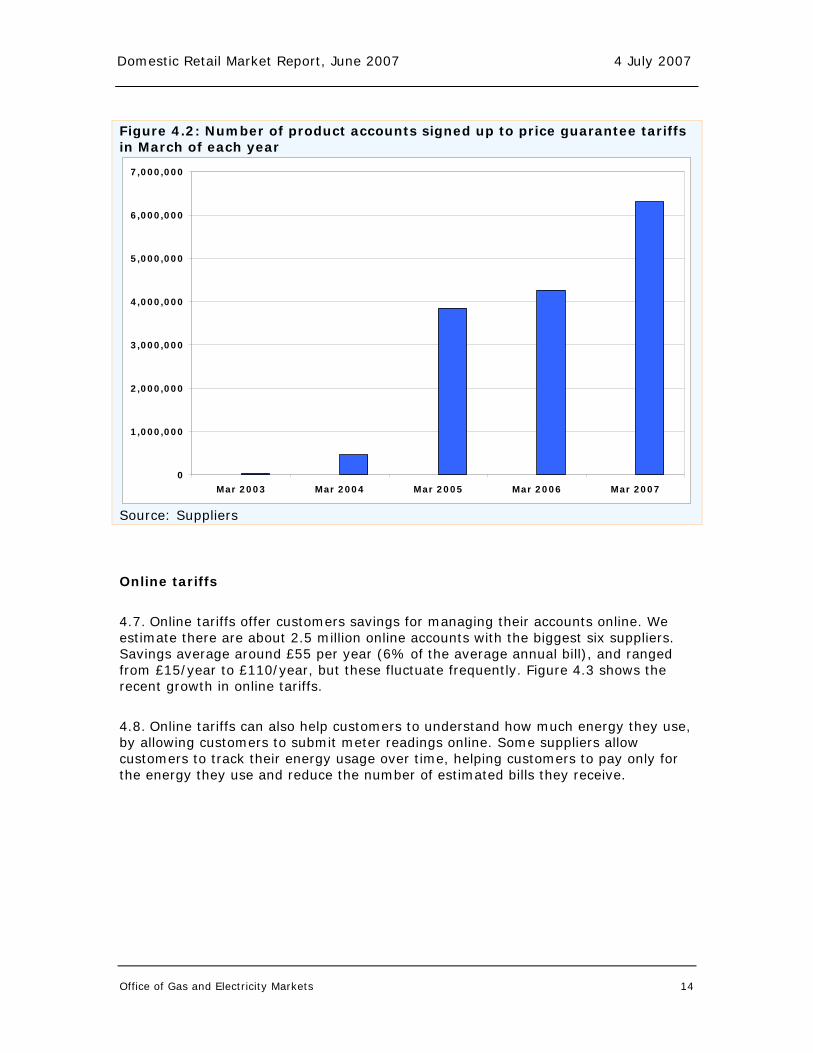
4.6. Figure 4.2 shows the increasing popularity of price guarantee tariffs over time. As at March this year around 6 million product accounts (gas and electricity) - or around 13% of the market - were on price guarantee tariffs.
Office of Gas and Electricity Markets 13
Domestic Retail Market Report, June 2007 4 July 2007
Figure 4.2: Number of product accounts signed up to price guarantee tariffs in March of each year
0
1,000,000
2,000,000
3,000,000
4,000,000
5,000,000
6,000,000
7,000,000
Mar 2003 Mar 2004 Mar 2005 Mar 2006 Mar 2007
Source: Suppliers
Online tariffs
4.7. Online tariffs offer customers savings for managing their accounts online. We estimate there are about 2.5 million online accounts with the biggest six suppliers. Savings average around £55 per year (6% of the average annual bill), and ranged from £15/year to £110/year, but these fluctuate frequently. Figure 4.3 shows the recent growth in online tariffs.
4.8. Online tariffs can also help customers to understand how much energy they use, by allowing customers to submit meter readings online. Some suppliers allow customers to track their energy usage over time, helping customers to pay only for the energy they use and reduce the number of estimated bills they receive.
Office of Gas and Electricity Markets 14

Domestic Retail Market Report, June 2007 4 July 2007
Figure 4.3: Number of customer accounts signed up to online tariffs in March of each year
0
500,000
1,000,000
1,500,000
2,000,000
2,500,000
3,000,000
Mar 2005 Mar 2006 Mar 2007
Source: Suppliers
Green tariffs
4.9. Green tariffs range from committing suppliers to sourcing energy from renewable sources, to giving contributions to green funds, which offset carbon emissions, or contribute in some way to carbon reduction.
4.10. Two suppliers entered the market specialising in green energy: Good Energy and Ecotricity. In addition, large suppliers have signed up a total of 290,000 accounts on green tariffs.
4.11. In 2002, as more green tariffs emerged in the market, we published green supply guidelines, setting out good practice for suppliers with regard to green tariffs. Following an initial consultation in April 2005, we issued a further consultation in June 2007 proposing to modify our guidelines for green supply tariffs, and we intend to issue a revised set of guidelines in September 2007. The consultation is available on our website at the address below http://www.ofgem.gov.uk/Sustainability/Environmnt/Policy/Documents1/Developing%20Guidelines%20for%20Green%20Supply.pdf
Office of Gas and Electricity Markets 15

Domestic Retail Market Report, June 2007 4 July 2007
Energy Services
4.12. Suppliers are showing signs of beginning to compete in the provision of services aimed at reducing energy consumption rather than just selling more energy. All suppliers offer products and services along these lines such as free home energy surveys, discounted loft and cavity insulation, energy efficient boilers and numerous energy saving appliances.
4.13. The latest innovation is contracts that offer a reward to consumers for saving energy. For example, SSE is launching a programme where customers can earn credits by reducing their consumption, or choosing electronic billing. They can then use these credits to buy more energy efficient appliances or loft insulation, or get discounts from their bill. Another supplier, EDF Energy, has a product that provides consumers with loyalty card reward points for each year in which they reduce their energy consumption.
4.14. In addition, all suppliers provide consumers with information and advice for reducing their energy consumption. They produce energy saving booklets that contain tips for reducing energy and information on consumption of various household appliances. They also have energy saving help lines and tell customers where they can get more information on energy efficiency.
4.15. We expect suppliers to increasingly develop product offerings in this area in response to government's climate change commitments5 and as metering technology evolves. Ofgem is working to remove market barriers that may limit the introduction of smart meters, for example through our Supply Licence Review6, and our smart meter interoperability working group. The latter works with industry to ensure that customers with smart meters can switch supplier without necessarily having to change their meter and that suppliers will not face technical barriers to interacting with smart meters installed by their competitors.
5 See the Energy White Paper at http://www.dti.gov.uk/energy/whitepaper/page39534.html 6 Supply Licence review: Final Proposals: Ref. 128/07 http://www.ofgem.gov.uk/Pages/MoreInformation.aspx?docid=156&refer=Markets/RetMkts/Compl/SLR Office of Gas and Electricity Markets 16

Domestic Retail Market Report, June 2007 4 July 2007
5. Customer service
Chapter Summary
Recorded customer complaints have declined for most suppliers. Where they haven't suppliers are investing significant resources to improve the position. Suppliers have also set up the Energy Supply Ombudsman that provides a route to compensation and complaint resolution for customers who cannot resolve a complaint with their supplier. We are currently reviewing the effectiveness of these arrangements after their first year in operation.
5.1. Improving customer service is another way in which suppliers can attract new customers and retain existing customers, and we see improvements in this area. Figure 5.1 shows the level of unresolved complaints recorded by energywatch, broken down by the supplier against which the complaint is being made. These complaint levels have fallen steadily over the last 2 years for 5 of the big 6 suppliers7.
Figure 5.1: Total number of complaints made to energywatch per 1000 customers (by supplier)
0.00
0.05
0.10
0.15
0.20
0.25
0.30
Apr-05 Jun-05 Aug-05 Oct-05 Dec-05 Feb-06 Apr-06 Jun-06 Aug-06 Oct-06 Dec-06 Feb-07
com
pla
ints
per
10
00
cu
stom
ers
British Gas Trading EDF Energy Group Npower Group Powergen SSE ScottishPower
Data source: energywatch
7 energywatch introduced an empowerment process in Sept 2006. In this process a customer who has called with a straightforward supplier complaint is referred by direct transfer to dedicated teams within suppliers (provided the customer is not vulnerable). A complaint is then recorded only if the customer comes back to energywatch with the problem still unresolved. We note that empowerment records increased mainly during 2007. energywatch will in future be amending how they present complaints information on their website. Office of Gas and Electricity Markets 17

Domestic Retail Market Report, June 2007 4 July 2007
5.2. The increase in complaints made about British Gas reflects the difficulties they have faced in transferring customers to a new billing system. British Gas as part of its business transformation has invested in new systems infrastructure, undertaken extensive training, and recruited an additional 800 customer service staff. The company has reported that their investment is beginning to pay off, and that service levels indicators are showing improvements since this chart was compiled.
The Energy Supply Ombudsman
5.3. In spring 2005 Ofgem investigated suppliers' billing practices following a super-complaint made by energywatch. Although we found that there was no widespread failure of industry billing arrangements, a small number of customers suffered real harm as a result of billing errors. Our response called on suppliers to establish an independent dispute resolution scheme.
5.4. In July 2006 suppliers set up the Energy Supply Ombudsman (ESO). The ESO provides a backstop for customers to achieve independent resolution of a complaint when they are unable to resolve the issue with their supplier.
5.5. The ESO will be publishing its first annual report on the 24 July this year, including statistics on the number of cases it has handled up to 31 March 20078.
5.6. We are conducting a review of the ESO, and have issued an open letter setting out the proposed scope of the review, which can be accessed at the link below. We intend to publish this review in September.
Open letter: http://www.ofgem.gov.uk/Markets/RetMkts/Compet/Documents1/Open%20letter%20on%20scope%20of%20Ombudsman%20review%20230507.pdf
8 The ESO website is www.energy-ombudsman.org.uk. Office of Gas and Electricity Markets 18

Domestic Retail Market Report, June 2007 4 July 2007
6. Switching
Chapter Summary
Annual rates of switching are at the highest levels in 4 years. There were on average 30 000 more switches per month than in the previous year. This is an 11% increase in monthly switching rates over the year.
6.1. The net effect of switching continues to reduce the market share of incumbent suppliers (see chapter 7), showing that more customers are engaging in the market and switching for the first time. There is also switching between non-incumbent suppliers by those customers that regularly shop around for a better deal. These customers provide an important competitive constraint on all suppliers, not just the incumbent suppliers.
6.2. Our research shows that of those customers who have not switched, the majority (more than 70%) say they are happy with the price and service they get from their supplier. A small proportion of (around 15%) say they have not switched away from the incumbent supplier because they do not see the point. Less than 3% of customers think switching is too difficult or say they are unaware that it is possible to switch.
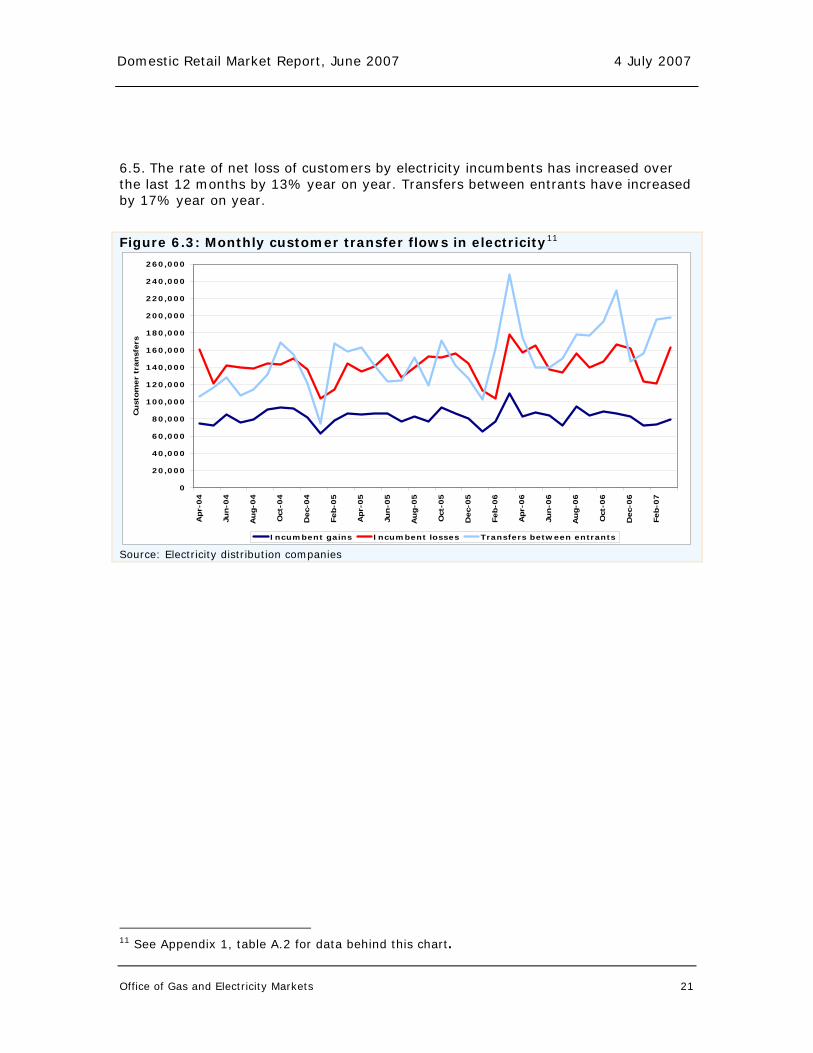
6.3. The charts in this chapter show the number of domestic meter points that are transferred from one supplier to another each month. Figures 6.2 and 6.3 show the flow of customers to and from the incumbent supplier (“incumbent gains” and “incumbent losses” respectively). They also show customer flows between entrant suppliers. The electricity incumbent figures consist of 5 different incumbent supply groups across 14 regions.
Office of Gas and Electricity Markets 19

Domestic Retail Market Report, June 2007 4 July 2007
Figure 6.1: Monthly customer transfers in gas and electricity9
0
100,000
200,000
300,000
400,000
500,000
600,000
Apr-
04
Jun-0
4
Aug-0
4
Oct
-04
Dec-
04
Feb-0
5
Apr-
05
Jun-0
5
Aug-0
5
Oct
-05
Dec-
05
Feb-0
6
Apr-
06
Jun-0
6
Aug-0
6
Oct
-06
Dec-
06
Feb-0
7
Cust
om
er
transf
ers
Gas Electricity Source: Domestic gas suppliers and electricity distribution companies
6.4. On average, over the 12 months to March 2007, the net rate of loss of customers for the gas incumbent has increased 62% year on year. Switching between entrants has increased by 14% year on year.
Figure 6.2: Monthly customer transfer flows in gas10
0
20,000
40,000
60,000
80,000
100,000
120,000
140,000
160,000
180,000
200,000
220,000
Apr-
04
Jun-0
4
Aug-0
4
Oct
-04
Dec-
04
Feb-0
5
Apr-
05
Jun-0
5
Aug-0
5
Oct
-05
Dec-
05
Feb-0
6
Apr-
06
Jun-0
6
Aug-0
6
Oct
-06
Dec-
06
Feb-0
7
Cust
om
er
transf
ers
Incumbent gains Incumbent losses Transfers between entrants
Source: Domestic gas suppliers
9 See Appendix 1, table A.1 for data behind this chart.10 See Appendix 1, table A.2 for data behind this chart. Office of Gas and Electricity Markets 20
Domestic Retail Market Report, June 2007 4 July 2007
6.5. The rate of net loss of customers by electricity incumbents has increased over the last 12 months by 13% year on year. Transfers between entrants have increased by 17% year on year.
Figure 6.3: Monthly customer transfer flows in electricity11
0
20,000
40,000
60,000
80,000
100,000
120,000
140,000
160,000
180,000
200,000
220,000
240,000
260,000
Apr-
04
Jun-0
4
Aug-0
4
Oct
-04
Dec-
04
Feb-0
5
Apr-
05
Jun-0
5
Aug-0
5
Oct
-05
Dec-
05
Feb-0
6
Apr-
06
Jun-0
6
Aug-0
6
Oct
-06
Dec-
06
Feb-0
7
Cust
om
er
transf
ers
Incumbent gains Incumbent losses Transfers between entrants
Source: Electricity distribution companies
11 See Appendix 1, table A.2 for data behind this chart. Office of Gas and Electricity Markets 21

Domestic Retail Market Report, June 2007 4 July 2007
7. Market Shares
Chapter Summary
The market share of entrants continues to grow. Gas market shares for British Gas are below 50% and in the electricity market incumbents have less than half their original customers in 7 regions.
Market share data is only one indicator of competitive pressures - static market shares do not show the extent to which suppliers have had to offer cheaper online or fixed price deals to retain their existing customers
Suppliers who are uncompetitive in their former monopoly regions have seen greater losses in market share.
7.1. During 2006 British Gas's national market share in gas fell below 50% for the first time, indicating that the majority of customers have now switched their gas supplier at least once. Table 7.1 displays market shares in the national gas market.
Table 7.1: National market shares in Gas (March 2007)
Source: Domestic gas suppliers
7.2. Table 7.2 shows national market shares for electricity supply. As with table 7.1, these shares summarise net changes in the entire market. They under represent competitive pressures in the market as a supplier group may lose market share in some regions, and gain market share in others. So even if a supplier's market share is static it may have had to cut prices or offer new products to retain existing customers. Across the GB market, though, SSE has seen the highest increase in market shares and this has been particularly pronounced in the 12 months to March 2007.
Office of Gas and Electricity Markets 22

Domestic Retail Market Report, June 2007 4 July 2007
Table 7.2: National market share in electricity (March 2007)
Source: Electricity distribution companies
7.3. Overall, the number of customers who have yet to switch has continued to fall. This is clearly shown in figure 7.1 that shows the proportion of gas and electricity customers no longer with their incumbent suppliers. Record levels of switching have continued to affect incumbent market shares, and the gas incumbent's net loss of market share has increased over the last 12 months.
Figure 7.1: Market share of entrant suppliers (March 2007)
0%
10%
20%
30%
40%
50%
60%
70%
80%
90%
100%
Apr-96
Apr-97
Apr-98
Apr-99
Apr-00
Apr-01
Apr-02
Apr-03
Apr-04
Apr-05
Apr-06
Market share of new entrants - gas
Market share of new entrants - elec
Full national domestic competition
Source: Domestic gas suppliers and electricity distribution companies
7.4. In March 2007 the electricity incumbent's market share was below 50% in 7 of the 14 regions. Figure 7.2 shows the regional market share of the incumbent electricity supply group in each region. The incumbent supply group is identified in brackets alongside the name of the region.
Office of Gas and Electricity Markets 23

Domestic Retail Market Report, June 2007 4 July 2007
Figure 7.2: Electricity regional market shares (March 2007)
47 4957
48 44 45 40
80
6151
6270
5447
53 5143
52 56 55 60
20
3949
3830
4653
0%
10%
20%
30%
40%
50%
60%
70%
80%
90%
100%
Eas
t M
idla
nds
(Pow
erg
en)
Eas
tern
(Pow
erg
en)
London (
ED
FEner
gy)
Man
web
(Sco
ttis
hPow
er)
Mid
lands
(npow
er)
Nort
hern
(npow
er)
Norw
eb
(Pow
erg
en)
Sco
ttis
h H
ydro
(SSE)
Sco
ttis
hPow
er
(Sco
ttis
hPow
er)
See
boar
d (
ED
FEner
gy)
South
ern (
SSE)
Sw
alec
(SSE)
Sw
eb (
ED
FEner
gy)
Yor
kshire
(npow
er)
Market share of incumbents Market share of others
Source: Electricity Distribution companies by MPAN (meter point administration number)
7.5. Smaller losses in market share by an incumbent supplier does not necessarily illustrate that customers in the area are not benefiting from competition. Some incumbents have responded to the threat of competition by dropping prices in area. Figure 7.3 shows loss of market share of electricity incumbents compared against the competitiveness of the incumbent price, over 12 months to March 2007. In most cases where suppliers have retained market share their prices are very competitive. Those suppliers who price higher than the average prices in the region have lost the most incumbent market share. This provides further evidence that customers are switching in sufficient numbers to put competitive pressure on suppliers.
Office of Gas and Electricity Markets 24

Domestic Retail Market Report, June 2007 4 July 2007
Figure 7.3: Electricity Incumbent price, relative to average price, against loss of market share (12 months to March 2007)
-10%
-5%
0%
5%
10%
15%
20%
0.0% 0.5% 1.0% 1.5% 2.0% 2.5% 3.0% 3.5% 4.0% 4.5%
Loss in market share
Incu
mb
en
t p
rice
rela
tive t
o a
vera
ge
Source: Ofgem Data source: TheEnergyShop.com and electricity distribution companies
7.6. Similarly, as we have seen in chapters 4 and 5, even if a supplier's market share is static, it doesn't show competition is stalling. Suppliers have introduced more products, such as fixed price and online deals, and invested in improving customer service to keep existing customers
7.7. Studying prices, new products and customer service levels largely indicate the competitive market is delivering benefits to engaged customers. The next chapter focuses on two areas of the market where our work has suggested that we can do more to help customers: Prepayment and vulnerable customers.
Office of Gas and Electricity Markets 25

Domestic Retail Market Report, June 2007 4 July 2007
8. Prepayment Customers and Fuel Poverty
Chapter Summary
Nearly 11 per cent of gas customers and 14 per cent of electricity customers pay using a prepayment meter. Savings available to prepayment customers are higher than for any other customers, on average £100. Ofgem is exploring ways to help prepayment, fuel poor and vulnerable customers to take advantage of the best offers in the market and to increase switching rates.
8.1. Savings available to prepayment customers who have never switched are greater on average than those available for standard credit and direct debit customers. On average across all regions, prepayment customers can save around £100 on a combined gas and electricity bill, significantly above the savings available to direct debit customers of around £60. In some regions, prepayment customers that have never switched can save up to £170 by switching to the best available offer for both gas and electricity.
8.2. For prepayment customers who use electricity only, based on an annual consumption of 6,600 kWh, potential savings are even higher at around £250 in some regions.
8.3. Despite these high savings, our analysis suggests that PPM customers have historically been less likely than other customers to take advantage of the competitive market through switching. Later in this chapter we discuss possible reasons for this, and outline the steps Ofgem is taking to help ensure that all segments of the supply market – including PPM customers, the fuel poor and vulnerable customers – benefit from competition through better service and lower prices.
8.4. The figures 8.1 and 8.2 illustrate the large amount that prepayment customers can save by switching, and the variation in suppliers' pricing strategies for prepayment customers. Prepayment customers with both incumbents can save up to £170 on a combined gas and electricity bill by switching.
Office of Gas and Electricity Markets 26

Domestic Retail Market Report, June 2007 4 July 2007
Figures 8.1 and 8.2: Prices for prepayment customers for gas and electricity, with an annual consumption of 20,500kWh and 3,300 kWh of gas and electricity respectively Gas
£250
£300
£350
£400
£450
£500
£550
£600
£650
EastMidlands
Eastern London Manweb Midlands Northern Norweb ScottishHydro
ScottishPower
Seeboard Southern Swalec SWEB Yorkshire
Region
Ann
ual b
ill (£
)
British Gas EDF Energy npower Powergen SSE ScottishPower
Electricity
250
300
350
400
450
500
550
600
650
EastMidlands
Eastern London Manweb Midlands Northern Norweb ScottishHydro
ScottishPower
Seeboard Southern Swalec SWEB Yorkshire
Region
Annual bill (£)
British Gas EDF Energy npower Powergen SSE ScottishPower
Tariff data source: TheEnergyShop.com
Office of Gas and Electricity Markets 27

Domestic Retail Market Report, June 2007 4 July 2007
Figure 8.3: Prices for prepayment customers for electricity only customers, with an annual consumption of 6,600kWh
400
450
500
550
600
650
700
750
800
850
900
EastMidlands
Eastern London Manweb Midlands Northern Norweb ScottishHydro
ScottishPower
SeeboardSouthern Swalec SWEB Yorkshire
Region
An
nu
al b
ill (£
)
British Gas EDF Energy npower Powergen Scottish Hydro-Electric SP 15.06.07 estimate
Tariff data source: TheEnergyShop.com
Cost differences between payment methods
8.5. Prepayment meter customers are generally more expensive for suppliers to serve. This is primarily for two reasons: firstly, prepayment meters are themselves more expensive to buy and to service; and secondly they require a specialised back-office administration system (prepayment meter infrastructure provision or PPMIP). In addition, token meters require visits to the premises to recalibrate the meter when prices change – although the need for such visits will reduce over time as suppliers proceed with their plans for accelerated replacement of token PPMs12.
8.6. PPM customers also generate some savings for suppliers relative to standard credit customers because they pay for their energy use in advance. However, these savings are not enough to offset the higher costs of service associated with meter provision and PPMIP, as well as increased call centre costs relative to MDD customers.
12 An update of recent action by suppliers to tackle the problems associated with token PPMs and debt build-up can be found at: http://www.ofgem.gov.uk/Sustainability/SocAction/Publications/Documents1/Token%20PPM%20and%20debt%20build%20up%20Feb%20Mar%20Update.pdf Office of Gas and Electricity Markets 28

Domestic Retail Market Report, June 2007 4 July 2007
8.7. Figures 8.4 and 8.5 show the breakdown of the estimated cost differences between serving PPM, MDD and SC customers. These cost differentials reflect current metering arrangements, which may well change in the future, particularly if smart meters are introduced more widely. Smart meters may help reduce these differentials in costs and allow easier switching between payment types as customers circumstances or preferences change.
Figure 8.4: This figure shows a breakdown of the additional cost of serving a PPM customer compared to a MDD customer (for both gas and electricity)13
TOTAL = £85
Figure 8.5: Breakdown of additional cost of serving a PPM customer compared to a SC customer (for both gas and electricity)¹³
TOTAL = £65
Note: a negative supply business cost difference denotes higher costs for SC than PPM for supply business costs. The percentage figures reflect this.
13 These costs are estimated based on information provided by a supplier that is competitive in prepayment. Each supplier may have different costs and different methods of allocating costs to separate customer groups.
Office of Gas and Electricity Markets 29

Domestic Retail Market Report, June 2007 4 July 2007
Price differences between payment methods
8.8. Figure 8.6 below shows the difference between the best offer on prepayment and the best offer on monthly direct debit and standard credit tariffs for a combined gas and electricity customer, since January 2004. The difference between prepayment and dual fuel direct debit tariffs has fluctuated within a range of around £50 to £120, with what appears to be a slight upward trend over time; the current difference is however consistent with the estimated difference in costs to serve of approximately £8514. In contrast, the difference between prepayment prices and standard credit prices has at most times been below than the estimated difference in costs to serve of approximately £60.
8.9. The large fluctuations observed in both differentials month by month are primarily due to differences in the timing of price changes for different customer groups. For example, the negative price differential between PPM and standard credit prices around the second quarter of 2006 resulted from a delay in price rises for PPM customers by SSE.
Figure 8.6 - Payment method differentials over time; PPM-MDD and PPM-SC (Jan 2004 - June 2007)
-£60
-£40
-£20
£0
£20
£40
£60
£80
£100
£120
£140
Jan-
04
May
-04
Sep-
04
Jan-
05
May
-05
Sep-
05
Jan-
06
May
-06
Sep-
06
Jan-
07
May
-07
Best
off
er
dif
fere
nti
al (£
)
DF PPM-SC DF PPM-DD
Linear (DF PPM-SC) Linear (DF PPM-DD )
SSE delayed price rise for PPM customers.
Tariff data source: TheEnergyShop.com
14 It should be noted that these figures differ from figures presented in the Government’s recent Energy White Paper, which suggested that the differential between PPM and Direct Debit prices had increased from £84 in 2005 to around £120 in 2006. The discrepancy relates partly to the timeframes used, but more importantly to the fact that our figures compare best available offers while the White Paper compared average bills. Both figures have their uses: by using the best offer we can see that the market is providing choice to customers, and that the companies with the best offers are offering tariffs that appear to reflect differences in costs to serve. On the other hand, average figures highlight the spread between PPM tariffs and other payment types, which is in part what has prompted Ofgem to look at the level of competitive pressure in this segment of the market. Office of Gas and Electricity Markets 30

Domestic Retail Market Report, June 2007 4 July 2007
Price differences by supplier and fuel type
8.10. The following charts show that price differences between prepayment bills and other payment types vary widely across suppliers – reflecting differences in suppliers’ marketing and pricing strategies.
8.11. The charts also show that the differential between PPM and MDD/SC prices varies by fuel type. In most cases, the differential in gas PPM prices is noticeably higher than that for electricity PPM prices – although there are exceptions, such as npower, where the differential in electricity PPM prices (at least for out-of-area customers) is above that for gas PPM.
8.12. This variability across suppliers, combined with the earlier analysis showing that savings available to PPM customers are greater on average, highlights that it is particularly important to encourage prepayment customers to switch. Moreover, the variability in pricing strategies by fuel type suggests that it may be important for PPM customers to adopt a “pick and mix” strategy (ie, take their gas and electricity from different suppliers) in order to achieve the best savings available.
Figure 8.7: Difference between direct debit and prepayment prices by supplier
£0
£20
£40
£60
£80
£100
£120
£140
£160
EDF Energy Scottish Power SSE Powergen British Gas npower
Combined gas and elec GasElec in area Elec out of area
Tariff data source: TheEnergyShop.com
Office of Gas and Electricity Markets 31

Domestic Retail Market Report, June 2007 4 July 2007
Figure 8.8: Difference between standard credit prices and prepayment prices by supplier
-£60
-£40
-£20
£0
£20
£40
£60
£80
£100
£120
Scottish Power EDF Energy SSE Powergen British Gas npower
Combined gas and elec Gas Elec in area Elec out of area
Tariff data source: TheEnergyShop.com Note: a negative differential indicates that PPM prices are currently below standard credit prices
PPM switching
8.13. There has been some concern that prepayment customers are not participating in the competitive market to the same extent as other customers. In particular, previous research indicated that the proportion of prepayment customers who had switched was below the average for the market as a whole (see table 8.1), and was particularly low compared to customers paying by direct debit. (Switching rates for prepayment customers were however slightly above those for standard credit customers.)
Table 8.1: % of customers that have switched supplier
Source: Accent 200515
15 See Accent survey published as Appendix to June 2005 Domestic Retail Market Report, Ref.24b/06. Office of Gas and Electricity Markets 32

Domestic Retail Market Report, June 2007 4 July 2007
8.14. Low rates of switching among prepayment customers are also reflected in market share data as shown in table 8.2 below. This table indicates that the gas incumbent’s market share is higher among prepayment customers than for direct debit and standard credit customers, while in electricity, incumbent market shares are similar for prepayment and standard credit customers but are significantly above market shares for direct debit.
Table 8.2: Incumbent market share by payment type
Source: DTI 2007
8.15. There may be a number of reasons for there being historically lower switching rates among PPM customers. Recent qualitative research carried out by Mori on behalf of Ofgem16 suggests that some PPM customers have a low awareness of the benefits of switching and limited information on how to switch to the best available deal (for example, through the use of switching websites). Debt blocking by suppliers may also be an issue in some cases. Ofgem intends to carry out further work in this area to gain a better understanding of PPM switching behaviour, so that we can take effective action to address any barriers to PPM switching.
8.16. As a first step, we are currently compiling information from suppliers on the number of switches broken down by payment method. Initial results show an encouraging increase in PPM switching, with the percentage of customers who have switched over the past year higher within PPM customers than within direct debit or standard credit customer groups. While table 8.2 suggests there is some catching up to do, this information is extremely encouraging and we continue to urge PPM customers who have never switched to engage in the market.
Prepayment tariffs, fuel poverty, and vulnerable customers
8.17. Issues facing PPM customers are often linked to concerns over fuel poverty and vulnerable customers. While it is true that prepayment customers on average have lower incomes than standard credit and direct debit customers, only 25% of the fuel poor use PPMs while 75% pay by either standard credit or direct debit (see figure 8.9).
8.18. The relationship between prepayment and vulnerable customers is also not a straightforward one: while the proportion of customers on prepayment tariffs is high 16 Switching Rates for Vulnerable Customers - 164/07, link: http://www.ofgem.gov.uk/Pages/MoreInformation.aspx?docid=42&refer=Sustainability/SocAction Office of Gas and Electricity Markets 33

Domestic Retail Market Report, June 2007 4 July 2007
among some categories of vulnerable customer (such as unemployment beneficiaries), for other groups - particularly pensioners - it is below average.
Figure 8.9: Prepayment, fuel poor & vulnerable customers
Source: Accent 200517
Equalisation of prepayment tariffs to direct debit or standard credit
8.19. There have been calls by some consumer groups for prepayment tariffs to be made equal to direct debit tariffs, or at the minimum to standard credit rates. However, since the majority of fuel poor customers do not use prepayment meters, this strategy would mean that most fuel poor customers would end up paying more for their energy – since revenues lost from PPM customers would need to be made up elsewhere. We estimate that if PPM rates were aligned with MDD, the annual cost to a typical customer would be around £14 per year. Similarly, if prepayment were aligned to standard credit tariffs a typical customer would pay an extra £6 per year. Equalisation would therefore make the 3 million MDD and SC customers who are fuel poor worse off, while only making the remaining 25% of fuel poor customers better off.
8.20. Forcing suppliers to set the same prices could also undermine competition for prepayment customers amongst suppliers, by placing a strict constraint on their pricing. As discussed earlier in this chapter, PPM customers can currently save up to £170 in some regions by switching to the best offers available in the competitive market.
8.21. The above analysis suggests that measures aimed at assisting prepayment customers may not be particularly successful in assisting the fuel poor and vulnerable customers. We intend to put more effort into finding ways to ensure that these customers get a good deal from the competitive supply market, and are able to access the services they need at a price they can afford.
17 See Accent survey published as Appendix to June 2005 Domestic Retail Market Report, Ref.24b/06.
Office of Gas and Electricity Markets 34

Domestic Retail Market Report, June 2007 4 July 2007
Social tariffs and other corporate social responsibility initiatives
8.22. Suppliers are also playing an important role in delivering help and support to customers who are vulnerable – both those who are financially vulnerable and those who are vulnerable due to age, health or circumstance. Through their actions in this area, suppliers enhance their corporate reputation and brand value by acting in a responsible manner and can make an immediate and significant impact on customers’ comfort and finances.
8.23. All suppliers currently offer some sort of social tariff and/or rebate to provide cheaper energy to qualifying customers. Qualification criteria vary across suppliers, but often include being eligible for certain means tested benefits. The extent of the rebate or discount offered varies widely between suppliers, from a national average of £15 to £160. Customer numbers on these tariffs or rebates also vary a great deal between suppliers. One supplier – British Gas -offers substantial savings to up to 750,000 customers deemed “vulnerable” by government.
8.24. In addition to these tariffs and rebates, suppliers have developed a number of innovative “social” products, including partnerships with charities sponsoring outreach work, and trust funds that give grants to write off debt or to fund the purchase of new appliances. This diversity of approaches may be valuable in an area where there is no simple solution. However, there is little visibility of each supplier’s respective actions at present and concerns have been raised that the number of schemes can be confusing for both consumers and consumer advisers. There is a need to better understand the value and suitability of different measures.
8.25. As a result, Ofgem has committed to develop a corporate social responsibility framework. This initiative aims to provide greater visibility to the actions being taken by suppliers to provide additional help and assistance to vulnerable customers over and above the assistance that they are required to provide by virtue of their licence obligations or statutory obligations such as EEC. We expect to publish a first draft of this framework in July.
Further actions targeting prepayment and vulnerable customers
8.26. As mentioned earlier in the chapter, we have recently commissioned Mori to conduct a workshop with prepayment customers, the results of which are available on our website18. Among other things, this research suggested that PPM customers would like more information about switching.
8.27. In an effort to address such concerns, we have recently published a factsheet and launched a switch and save campaign targeted at encouraging PPM customers to take advantage of the high savings available to them, and thereby exert more competitive pressure on PPM prices. Increased competition and switching rates
18 Prepayment meter customer workshop - 155/07, link: http://www.ofgem.gov.uk/Pages/MoreInformation.aspx?file=Prepayment%20meter%20Customer%20Workshop.pdf&refer=Sustainability/SocAction/Publications Office of Gas and Electricity Markets 35

Domestic Retail Market Report, June 2007 4 July 2007
should help to drive lower prices for all PPM customers, including those who currently have difficulty in switching.
8.28. We are also considering further action to ensure targeted education for vulnerable customers. We must ensure that the benefits of competition are extended to all customers, including PPM customers, vulnerable customers, and the fuel poor.
Office of Gas and Electricity Markets 36

Domestic Retail Market Report, June 2007 4 July 2007
Appendices
Appendices Index
Name of Appendix Page Number Appendix
1 Data Tables 38 2 Feedback 49 3 The Authority's Powers and Duties 50 4 Glossary 52
Office of Gas and Electricity Markets 37

Domestic Retail Market Report, June 2007 4 July 2007
Appendices
Appendix 1 – Data Tables
Switching
Table A.1: Table A.2: Monthly transfer figures Monthly transfer flows in gas and electricity in electricity
Source: Domestic gas suppliers and electricity distribution companies Office of Gas and Electricity Markets 38
Domestic Retail Market Report, June 2007 4 July 2007
Appendices
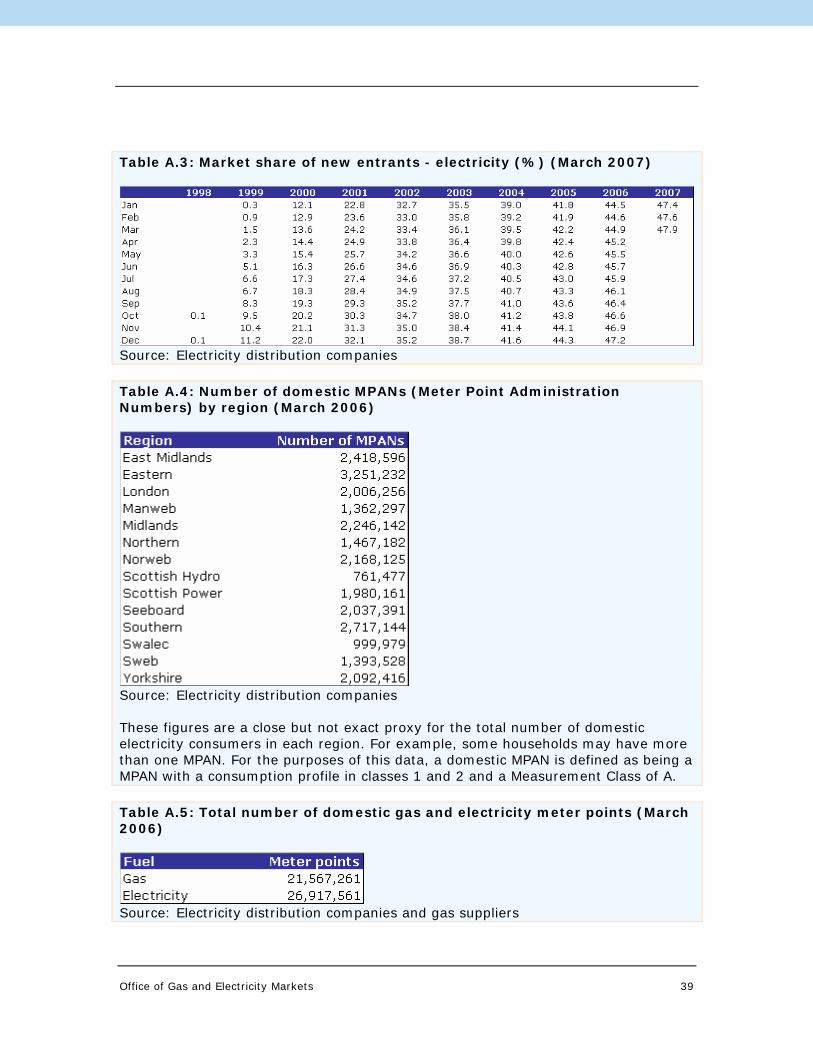
Table A.3: Market share of new entrants - electricity (%) (March 2007)
Source: Electricity distribution companies Table A.4: Number of domestic MPANs (Meter Point Administration Numbers) by region (March 2006)
Source: Electricity distribution companies These figures are a close but not exact proxy for the total number of domestic electricity consumers in each region. For example, some households may have more than one MPAN. For the purposes of this data, a domestic MPAN is defined as being a MPAN with a consumption profile in classes 1 and 2 and a Measurement Class of A. Table A.5: Total number of domestic gas and electricity meter points (March 2006)
Source: Electricity distribution companies and gas suppliers
Office of Gas and Electricity Markets 39

Domestic Retail Market Report, June 2007 4 July 2007
Appendices
Table A.6: Real annual standard credit gas bills since privatisation (June 2007 prices)
Source: Ofgem. Inflation forecast for May and June: Treasury
Office of Gas and Electricity Markets 40
Domestic Retail Market Report, June 2007 4 July 2007
Appendices
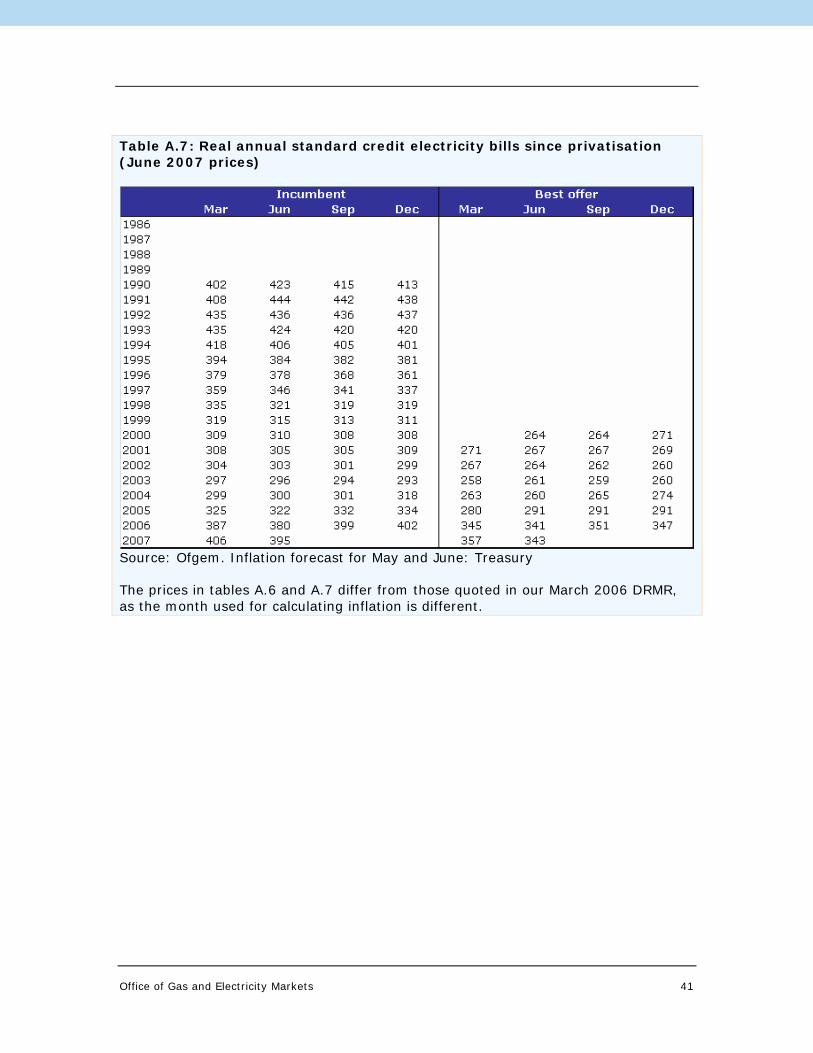
Table A.7: Real annual standard credit electricity bills since privatisation (June 2007 prices)
Source: Ofgem. Inflation forecast for May and June: Treasury The prices in tables A.6 and A.7 differ from those quoted in our March 2006 DRMR, as the month used for calculating inflation is different.
Office of Gas and Electricity Markets 41

Domestic Retail Market Report, June 2007 4 July 2007
Appendices
Annual bills
Figures A.8-A.19 compare the range of prices from the big 6 suppliers before and after the recent round of price cuts, on 28 February 2007 and 15 June 2007. The charts show offers for each payment method (MDD, SC and PPM) for dual fuel, electricity only and gas only where a customer buys gas and electricity from separate suppliers (standard consumption for each), and electricity only (where the customer doesn't use gas and therefore has a higher than average consumption for electricity). They show the lowest and highest priced offers in each region and thus the range of prices available to consumers. The chart is only calculated for medium consumption and does not take account of preserved tariffs or non-standard offers, such as internet tariffs, fixed-price, capped-price or tracker deals, and tariffs requiring payment of a membership fee. Information making a more comprehensive price comparison is available from the energywatch website ( ). www.energywatch.org.uk Fig A.8 MDD dual fuel bills - open to new customers (June 2007)
750
800
850
900
950
1000
1050
1100
1150
1200
1250
EastMidlands
Eastern London Manweb Midlands Northern Norweb ScottishHydro
ScottishPower
SeeboardSouthern Swalec SWEB Yorkshire
Region
Annual bill
(£)
Minimum 28 Feb 07 Maximum 28 Feb 07 Minimum 15 June 07 Maximum 15 June 07 Tariff data source: TheEnergyShop.com
Office of Gas and Electricity Markets 42

Domestic Retail Market Report, June 2007 4 July 2007
Appendices
Figure A.9: SC dual fuel bills - open to new customers (June 2007)
750
800
850
900
950
1000
1050
1100
1150
1200
1250
EastMidlands
Eastern London Manweb Midlands Northern Norweb ScottishHydro
ScottishPower
SeeboardSouthern Swalec SWEB Yorkshire
Region
Annual
bill
(£)
Minimum 28 Feb 07 Maximum 28 Feb 07 Minimum 15 June 07 Maximum 15 June 07 Tariff data source: TheEnergyShop.com These charts are only calculated for medium consumption consumers and do not take account of preserved tariffs or non-standard offers, such as internet tariffs, price guarantee tariffs, social tariffs, green tariffs, or those requiring payment of a membership fee. Information making a more comprehensive price comparison is available from the energywatch website ( ). www.energywatch.org.uk Figure A.10: PPM dual fuel bills - open to new customers (June 2007)
750
800
850
900
950
1000
1050
1100
1150
1200
1250
EastMidlands
Eastern London Manweb Midlands Northern Norweb ScottishHydro
ScottishPower
SeeboardSouthern Swalec SWEB Yorkshire
Region
Annual bill
(£)
Minimum 28 Feb 07 Maximum 28 Feb 07 Minimum 15 June 07 Maximum 15 June 07 Tariff data source: TheEnergyShop.com
Office of Gas and Electricity Markets 43

Domestic Retail Market Report, June 2007 4 July 2007
Appendices
Figure A.11: MDD electricity bills - open to new customers (June 2007)
250
300
350
400
450
500
550
EastMidlands
Eastern London Manweb Midlands Northern Norweb ScottishHydro
ScottishPower
SeeboardSouthern Swalec SWEB Yorkshire
Region
Annual
bill
(£)
Minimum 28 Feb 07 Maximum 28 Feb 07 Minimum 15 June 07 Maximum 15 June 07 Tariff data source: TheEnergyShop.com These charts are only calculated for medium consumption consumers and do not take account of preserved tariffs or non-standard offers, such as internet tariffs, price guarantee tariffs, social tariffs, green tariffs, or those requiring payment of a membership fee. Information making a more comprehensive price comparison is available from the energywatch website ( ). www.energywatch.org.uk Figure A.12: SC electricity bills - open to new customers (June 2007)
250
300
350
400
450
500
550
EastMidlands
Eastern London Manweb Midlands Northern Norweb ScottishHydro
ScottishPower
SeeboardSouthern Swalec SWEB Yorkshire
Region
Annual bill
(£)
Minimum 28 Feb 07 Maximum 28 Feb 07 Minimum 15 June 07 Maximum 15 June 07 Tariff data source: TheEnergyShop.com
Office of Gas and Electricity Markets 44

Domestic Retail Market Report, June 2007 4 July 2007
Appendices
Figure A.13: PPM electricity bills - open to new customers (June 2007)
250
300
350
400
450
500
550
EastMidlands
Eastern London Manweb Midlands Northern Norweb ScottishHydro
ScottishPower
SeeboardSouthern Swalec SWEB Yorkshire
Region
Annual
bill
(£)
Minimum 28 Feb 07 Maximum 28 Feb 07 Minimum 15 June 07 Maximum 15 June 07 Tariff data source: TheEnergyShop.com These charts are only calculated for medium consumption consumers and do not take account of preserved tariffs or non-standard offers, such as internet tariffs, price guarantee tariffs, social tariffs, green tariffs, or those requiring payment of a membership fee. Information making a more comprehensive price comparison is available from the energywatch website ( ). www.energywatch.org.uk Figure A.14: MDD gas bills - open to new customers (June 2007)
400
450
500
550
600
650
700
750
EastMidlands
Eastern London Manweb Midlands Northern Norweb ScottishHydro
ScottishPower
SeeboardSouthern Swalec SWEB Yorkshire
Region
Annual bill
(£)
Minimum 28 Feb 07 Maximum 28 Feb 07 Minimum 15 June 07 Maximum 15 June 07 Tariff data source: TheEnergyShop.com
Office of Gas and Electricity Markets 45

Domestic Retail Market Report, June 2007 4 July 2007
Appendices
Figure A.15: SC gas bills - open to new customers (June 2007)
400
450
500
550
600
650
700
750
EastMidlands
Eastern London Manweb Midlands Northern Norweb ScottishHydro
ScottishPower
SeeboardSouthern Swalec SWEB Yorkshire
Region
Annual
bill
(£)
Minimum 28 Feb 07 Maximum 28 Feb 07 Minimum 15 June 07 Maximum 15 June 07 Tariff data source: TheEnergyShop.com These charts are only calculated for medium consumption consumers and do not take account of preserved tariffs or non-standard offers, such as internet tariffs, price guarantee tariffs, social tariffs, green tariffs, or those requiring payment of a membership fee. Information making a more comprehensive price comparison is available from the energywatch website ( ). www.energywatch.org.uk Figure A.16: PPM gas bills - open to new customers (June 2007)
400
450
500
550
600
650
700
750
EastMidlands
Eastern London Manweb Midlands Northern Norweb ScottishHydro
ScottishPower
SeeboardSouthern Swalec SWEB Yorkshire
Region
Annual bill
(£)
Minimum 28 Feb 07 Maximum 28 Feb 07 Minimum 15 June 07 Maximum 15 June 07
Tariff data source: TheEnergyShop.com
Office of Gas and Electricity Markets 46

Domestic Retail Market Report, June 2007 4 July 2007
Appendices
Figure A.17: MDD electricity only bills - open to new customers (June 2007)
400
500
600
700
800
900
1000
EastMidlands
Eastern London Manweb Midlands Northern Norweb ScottishHydro
ScottishPower
Seeboard Southern Swalec SWEB Yorkshire
Region
Annual
bill
(£)
Minimum 28 Feb 07 Maximum 28 Feb 07 Minimum 15 June 07 Maximum 15 June 07 Tariff data source: TheEnergyShop.com These charts are calculated using a annual consumption of 6,600KWH and do not take account of preserved tariffs or non-standard offers, such as internet tariffs, price guarantee tariffs, social tariffs, green tariffs, or those requiring payment of a membership fee. Information making a more comprehensive price comparison is available from the energywatch website ( ). www.energywatch.org.uk Figure A.18: SC electricity only bills - open to new customers (June 2007)
400
500
600
700
800
900
1000
EastMidlands
Eastern London Manweb Midlands Northern Norweb ScottishHydro
ScottishPower
Seeboard Southern Swalec SWEB Yorkshire
Region
Annual
bill
(£)
Minimum 28 Feb 07 Maximum 28 Feb 07 Minimum 15 June 07 Maximum 15 June 07 Tariff data source: TheEnergyShop.com
Office of Gas and Electricity Markets 47

Domestic Retail Market Report, June 2007 4 July 2007
Appendices
This chart is calculated using a annual consumption of 6,600KWH and does not take account of preserved tariffs or non-standard offers, such as internet tariffs, price guarantee tariffs, social tariffs, green tariffs, or those requiring payment of a membership fee. Information making a more comprehensive price comparison is available from the energywatch website ( ). www.energywatch.org.uk Fig A.19 PPM electricity only bills - open to new customers (June 2007)
400
500
600
700
800
900
1000
EastMidlands
Eastern London Manweb Midlands Northern Norweb ScottishHydro
ScottishPower
Seeboard Southern Swalec SWEB Yorkshire
Region
Annual
bill
(£)
Minimum 28 Feb 07 Maximum 28 Feb 07 Minimum 15 June 07 Maximum 15 June 07 Tariff data source: TheEnergyShop.com
Office of Gas and Electricity Markets 48

Domestic Retail Market Report, June 2007 4 July 2007
Appendices
Appendix 2 - Feedback 2.1. Ofgem would like to hear the views of interested parties in relation to the form, style and content of this report. 2.2. Comments should be sent to: Ben Smithers Regulatory Economist, GB Markets Ofgem 9 Millbank London SW1P 3GE Tel: 020 7901 7174 Email: [email protected] 2.3. Unless marked confidential, responses may be published by placing them in Ofgem’s library and on its website www.ofgem.gov.uk. Respondents may request that their response is kept confidential. Ofgem shall respect this request, subject to any obligations to disclose information, for example, under the Freedom of Information Act 2000 or the Environmental Information Regulations 2004. 2.4. Respondents who wish to have their responses remain confidential should clearly mark the document/s to that effect and include the reasons for confidentiality. It would be helpful if responses could be submitted both electronically and in writing. Respondents are asked to put any confidential material in the appendices to their responses. 2.5. Any questions on this document should, in the first instance, be directed to: Louise van Rensburg Regulatory Economist, GB Markets Ofgem 9 Millbank London SW1P 3GE Tel: 020 7901 7270 Email: [email protected]
Office of Gas and Electricity Markets 49

Domestic Retail Market Report, June 2007 4 July 2007
Appendices
Appendix 3 – The Authority’s Powers and Duties
1.1. Ofgem is the Office of Gas and Electricity Markets which supports the Gas and Electricity Markets Authority (“the Authority”), the regulator of the gas and electricity industries in Great Britain. This Appendix summarises the primary powers and duties of the Authority. It is not comprehensive and is not a substitute to reference to the relevant legal instruments (including, but not limited to, those referred to below).
1.2. The Authority's powers and duties are largely provided for in statute, principally the Gas Act 1986, the Electricity Act 1989, the Utilities Act 2000, the Competition Act 1998, the Enterprise Act 2002 and the Energy Act 2004, as well as arising from directly effective European Community legislation. References to the Gas Act and the Electricity Act in this Appendix are to Part 1 of each of those Acts.19
1.3. Duties and functions relating to gas are set out in the Gas Act and those relating to electricity are set out in the Electricity Act. This Appendix must be read accordingly20.
1.4. The Authority’s principal objective when carrying out certain of its functions under each of the Gas Act and the Electricity Act is to protect the interests of consumers, present and future, wherever appropriate by promoting effective competition between persons engaged in, or in commercial activities connected with, the shipping, transportation or supply of gas conveyed through pipes, and the generation, transmission, distribution or supply of electricity or the provision or use of electricity interconnectors.
1.5. The Authority must when carrying out those functions have regard to:
The need to secure that, so far as it is economical to meet them, all reasonable demands in Great Britain for gas conveyed through pipes are met;
The need to secure that all reasonable demands for electricity are met; The need to secure that licence holders are able to finance the activities which
are the subject of obligations on them21; and The interests of individuals who are disabled or chronically sick, of pensionable
age, with low incomes, or residing in rural areas.22
1.6. Subject to the above, the Authority is required to carry out the functions referred to in the manner which it considers is best calculated to:
19 entitled “Gas Supply” and “Electricity Supply” respectively. 20 However, in exercising a function under the Electricity Act the Authority may have regard to the interests of consumers in relation to gas conveyed through pipes and vice versa in the case of it exercising a function under the Gas Act. 21 under the Gas Act and the Utilities Act, in the case of Gas Act functions, or the Electricity Act, the Utilities Act and certain parts of the Energy Act in the case of Electricity Act functions. 22 The Authority may have regard to other descriptions of consumers. Office of Gas and Electricity Markets 50

Domestic Retail Market Report, June 2007 4 July 2007
Appendices
Promote efficiency and economy on the part of those licensed23 under the relevant Act and the efficient use of gas conveyed through pipes and electricity conveyed by distribution systems or transmission systems;
Protect the public from dangers arising from the conveyance of gas through pipes or the use of gas conveyed through pipes and from the generation, transmission, distribution or supply of electricity;
Contribute to the achievement of sustainable development; and Secure a diverse and viable long-term energy supply.
1.7. In carrying out the functions referred to, the Authority must also have regard, to:
The effect on the environment of activities connected with the conveyance of gas through pipes or with the generation, transmission, distribution or supply of electricity;
The principles under which regulatory activities should be transparent, accountable, proportionate, consistent and targeted only at cases in which action is needed and any other principles that appear to it to represent the best regulatory practice; and
Certain statutory guidance on social and environmental matters issued by the Secretary of State.
1.8. The Authority has powers under the Competition Act to investigate suspected anti-competitive activity and take action for breaches of the prohibitions in the legislation in respect of the gas and electricity sectors in Great Britain and is a designated National Competition Authority under the EC Modernisation Regulation24 and therefore part of the European Competition Network. The Authority also has concurrent powers with the Office of Fair Trading in respect of market investigation references to the Competition Commission.
23 or persons authorised by exemptions to carry on any activity. 24 Council Regulation (EC) 1/2003 Office of Gas and Electricity Markets 51

Domestic Retail Market Report, June 2007 4 July 2007
Appendices
Appendix 5 - Glossary A Annual bill The annual bill is the amount that a customer would have to pay for gas and electricity over one whole year. B BGT British Gas Trading Ltd, formerly part of British Gas plc, now part of Centrica plc. C Capped Price Tariffs Guarantees that the price paid per kWh for gas or electricity will not rise beyond a set level for a given period of time. D Day Ahead Prices Electricity quantities and market clearing prices are calculated individually for each hour of the day on the basis of participant bids for energy sales and purchases. Domestic energy suppliers Companies who sell energy to and bill residential customers in Great Britain. Dual fuel A dual fuel customer is a customer that takes gas and electricity from the same supplier. E energywatch The customer watchdog for gas and electricity markets in the UK. Energywatch can be contacted via their website at www.energywatch.org.uk or by calling their helpline number on 08459 06 07 08. Energy Supply Ombudsman
Office of Gas and Electricity Markets 52

Domestic Retail Market Report, June 2007 4 July 2007
Appendices
An independent body who deal with customer complaints made against member gas and electricity suppliers. They can be contacted via their website www.energy-ombudsman.org.uk or by calling their Enquiry Team on 0845 055 0760 or 01925 530263 Entrant An entrant in the gas supply sector refers to all gas suppliers except BGT. This includes the incumbent electricity suppliers. In the electricity sector, all customers in each region were supplied by the same monopoly supplier prior to market opening. In any one region, entrants are defined as entrants as all suppliers other than those in the same supply group as the former monopoly supplier in the region. This includes BGT and supply groups containing former monopoly suppliers from other regions. F Forward Market Is the trading of commodities to be delivered at a future date. Contracts for forward delivery are personalised as the amount and price are determined by the individual buyer and seller. Fixed Price Tariffs Guarantees that the price paid per kWh for gas or electricity will change for a given period of time. G Gains and losses When a customer completes a switch to (from) a supplier, a gain (loss) is recorded for that supplier. Over a period of time, the result of these customer flows to and from a supplier is a net fall or rise in a supplier's customer numbers. A review of the magnitude of customer movement to and away from a supplier can therefore indicate market activity that may not be immediately apparent from a review of other indicators, such as market share. I Incumbent An incumbent is the group containing the former monopoly supplier in a particular sector. The incumbent in each region for electricity is the supply group containing the ex-PES. British Gas is the incumbent in the gas market. Prior to the introduction of competition into domestic gas and electricity supply, all residential customers were with BGT for gas and the regional incumbent supplier for electricity. K Office of Gas and Electricity Markets 53

Domestic Retail Market Report, June 2007 4 July 2007
Appendices
kWh kilowatt-hour is a unit used to measure energy consumption in both electricity and gas. M Market share This is a measure of industry concentration. In this report, it shows the proportion of total customers (as proxied by the number of meter points) within a market that are registered to a particular supply group. Medium consumption A consumer with medium consumption has an annual demand of 3,300 kWh in electricity and 20,500 kWh in gas. MDD Direct debit (DD) is a method of payment where a fixed amount is taken from a bank account each month, quarter or year. In this report, direct debit refers to monthly direct debit (MDD) only - suppliers typically offer a discount to customers who use this payment method. N Net switching For gas, net switching refers to the proportion of customers no longer registered with BGT. For electricity, the national net switching figure refers to the average proportion of customers no longer registered with their local incumbent electricity supplier. Although this indicator provides a measure of progress of competition, it can understate the progress of competition as it does not account for customers regained by BGT (gas) or the regional incumbent supplier (electricity). Net switching is the inverse of the incumbent market share. Non-price offers For the purposes of this report, this term refers to a broad range of inducements offered by a supplier that are designed to alter a customers’ valuation of functionally identical products, ie gas and electricity. Non-switcher Customers who have never switched from their incumbent supplier, ie BGT in gas or regional incumbent in electricity. P
Office of Gas and Electricity Markets 54

Domestic Retail Market Report, June 2007 4 July 2007
Appendices
PES Public Electricity Supplier is the former term for the 14 companies in England, Wales and Scotland that from privatisation in 1990 until 1998 had a monopoly of electricity supply and distribution in their designated areas. PPM A prepayment meter (PPM) customer pays for energy by inserting electronic tokens, keys or cards into a PPM. Preserved tariff A preserved tariff remains open for existing customers. However, new customers are unable to gain access to it. Price Guarantee Tariff Tariffs which provide customers with a degree of price certainty. S SC Standard credit (SC) is a payment method that typically covers a wide range of payment mechanisms, including cash, cheque, credit card and standing order. A SC tariff is not available for PPM customers and does not attract a MDD discount. Spot Price The price for the immediate delivery of a commodity. Supercomplaint Section 11 of the Enterprise Act 2002 enables designated consumer bodies such as energywatch to make a complaint to the Office of Fair Trading or a relevant economic regulator that any feature, or combination of features, of a market in the UK for goods and services is or appears to be significantly harming the interests of consumers. These complaints are called 'Supercomplaints'. Switchers Customers who have changed gas and/ or electricity supplier at least once. T Tracker Tariffs
Office of Gas and Electricity Markets 55

Domestic Retail Market Report, June 2007 4 July 2007
Appendices
Guarantees that the price paid per kWh will remain lower than a specified benchmark until a set date. V VAT Value Added Tax (VAT) is added to both gas and electricity domestic bills at a rate of five per cent. The annual bills shown in this report include VAT.
Office of Gas and Electricity Markets 56