domestic market pressures facing the …sds.ukzn.ac.za/files/rr33.pdfdomestic market pressures...
TRANSCRIPT

DOMESTIC MARKET PRESSURES FACINGTHE SOUTH AFRICAN AUTOMOTIVE
COMPONENTS INDUSTRY
Research Report No. 33
Justin Barnes
Industrial Restructuring ProjectSchool of Development Studies
University of Natal
August 2000
ISBN No. 1-86840-399-8
2
FOREWORD
The Industrial Restructuring Project (IRP) was initiated at the beginning of1996 as the KwaZulu-Natal Industrial Restructuring Project (KZN IRP). Theproject initially focused exclusively on KwaZulu-Natal, but is now aimed atsupporting industrial policy in South Africa at the national, provincial and locallevels. It is facilitated by international experts and is based at the School ofDevelopment Studies, University of Natal Durban. The project has twoimportant features. Firstly, it focuses on critical issues that are impacting on thecompetitiveness of manufacturing sectors that are under threat from increasedinternational competition and the liberalisation of the South African traderegime. Secondly, it is action-oriented in design. The findings that have beengenerated have, for example, been presented to numerous industrystakeholders, including government, business associations and trade unions.The project consequently has the support of various regional and nationalstakeholders.
This particular research report has arisen out of both new research and thecumulative knowledge that has been generated from previous studies. Thesecover a number of IRP reports, working papers, journal articles and conferencepapers. Some of the themes covered include South Africa’s manufacturingcompetitiveness, the automotive industry, the clothing and textiles sectors,footwear, middle-management capacity, human resource development,institutional support for industrial restructuring, and business services formanufacturing competitiveness. Enquiries regarding IRP material should beaddressed to: The Librarian, Centre for Social and Development Studies,University of Natal, Durban, 4041. Tel: 031 2601031; Fax: 031 2602359;email: [email protected].
Prof. Mike MorrisHead: IRP
3
ACKNOWLEDGEMENTS
This School of Development Studies research report was originally written forthe South African government's Department of Trade and Industry as anintegral part of the Industrial Restructuring Project’s Policy SupportProgramme for the DTI. The European Union funds this programme. Thefinancial support of the European Union is sincerely appreciated and herebyacknowledged. The Department of Trade and Industry has given its approvalfor its publication as a SoDS research report in order to ensure its widespreaddissemination to stakeholders in industry. This approval is also herebyacknowledged.
At an academic level a special thank you needs to be directed towards SeanEllis who helped with data analysis and the generation of certain tables andfigures for the report. The views expressed in this report are, however, solelythose of the author. All responsibility for its content therefore lies with theauthor alone.

4
CONTENT
INTRODUCTION 5
RESEARCH METHODOLOGY 7
1. DOMESTIC MARKET PRESSURES FACINGTHE AUTO COMPONENTS INDUSTRY 9
1.1. MARKET LIBERALISATION 91.2. REINTEGRATION INTO THE GLOBAL OPERATING
ENVIRONMENT 111.3. DOMESTIC MARKET STAGNATION 13
2. AUTO COMPONENT RESPONSES TO DOMESTICMARKET CHALLENGES: THE VIEW OF THE OEMS 15
2.1 THE COMPETITIVENESS OF SA AUTO COMPONENT MANUFACTURERS: THE VIEW OF THE OEMS 162.2 PURCHASING OF LOW VALUE TO WEIGHT PRODUCTS 182.3 RE-DESIGNING FOR LOCAL MARKET CONDITIONS 192.4 THE DEATH OF SA TECHNOLOGY? 192.5 THE DEATH OF THE LOCAL FIRM? 202.6 SUMMARY 21
3. CUSTOMER PERCEPTION SURVEY FINDINGS 22
3.1 PURPOSE OF THE PERCEPTION STUDY 223.2 THE AUTOMOTIVE COMPONENT MANUFACTURERS’
PERFORMANCE PERCEPTIONS 253.3 CUSTOMER PERCEPTIONS OF THE COMPONENT
MANUFACTURERS’ PERFORMANCE LEVELS 263.4 OEM, OES/IAM AND “OTHER AUTOMOTIVE COMPONENT
MANUFACTURER” CUSTOMER PERCEPTIONS OFPERFORMANCE LEVELS 29
3.5 CUSTOMER PERCEPTIONS ACCORDING TO CUSTOMER OWNERSHIP 333.6 KEY LESSONS 36
CONCLUSION 37
REFERENCES 39

5
INTRODUCTION
In line with the rapid liberalisation of the South African trade regime, the domesticautomotive assembly and components industry is rapidly being integrated into theglobal operating environment. As a result of this integration, domestic automotivemarket demands have become increasingly onerous. To follow the terminology ofTerry Hill (1987), the previously order winning performance criteria of the SouthAfrican automotive market are now simply order qualifying. If automotive componentmanufacturers wish to survive in the domestic market they need to meet ever moredemanding performance requirements.
The huge competitiveness pressures being exerted on the automotive componentsindustry in South Africa have been comprehensively documented in a number ofprevious Industrial Restructuring Project (IRP) studies, including Barnes andKaplinsky (1998) and Barnes (1997, 1998, 1999a, 2000). The Barnes and Kaplinskystudy (1998) focused on South African Original Equipment Manufacturers’ (OEMs orassemblers) perceptions of domestic automotive component competitiveness, whilstthe four Barnes studies (1997, 1998, 1999a, 2000) considered the firm-levelcompetitiveness responses of the automotive component manufacturers over alongitudinal time frame. These studies highlighted that the domestic automotivecomponents industry is rapidly improving its competitiveness, although off a very lowbase. Using an extensive set of lean production benchmarks, it was found thatsustained improvements in performance were being experienced in almost alloperational areas, including inventory control, internal and external qualityperformance, internal and external flexibility and human resource development.
The Barnes and Kaplinsky study (1998), on the other hand, highlighted that themajority of the South African-based OEMs are being rapidly assimilated into theirparent company’s global operations, with this leading to a systematic restructuring oftheir relationship with South African automotive component manufacturers. Theargument that was presented by the OEMs was that they wanted their local componentmanufacturers to become part of Multinational Corporations (MNC). Alternativelythey would either source their components internationally or facilitate theestablishment of MNC operations in South Africa, thus displacing the localmanufacturers. The South African OEMs viewed the performance of theirdomestically based suppliers as sub-optimal and believed there were significant gapsbetween all of their requirements and domestic supplier performance levels. TheOEMs indicated that significant performance improvements were therefore requiredfrom their suppliers.
Given the importance and impact of the OEM views expressed in the Barnes andKaplinsky (1998) study, as well as the continued integration of these OEMs into theirparent company operations through to 2000, this study was undertaken as amechanism for updating and further developing the 1998 findings. Importantly,however, it also represents a far more detailed exploration of domestic marketperceptions of South Africa automotive component manufacturing performance. Inaddition to the detailed interrogation of OEM perceptions, a large number of domesticcustomer surveys were undertaken for a group of automotive componentmanufacturers. These customer surveys were sent to OEM, Original Equipment

6
Supply (OES or Parts and Accessory), independent aftermarket and other componentmanufacturer buyers, thus providing an extensive overview of customer perceptionsof component manufacturing capabilities relative to the demands of a number ofdifferent market segments. Critically, the updating and further development of the1998 domestic market perception study fits in with the IRP’s development of alongitudinal database on the firm-level competitiveness of the South Africanautomotive components industry.
Given the purpose of the study, its findings are presented in this report in threesections. In Section 1, a brief background is provided on the pressures facing theautomotive components industry in South Africa. The impact of the Motor IndustryDevelopment Programme (MIDP) and the stagnation of the domestic retail market areexplored, as are the ongoing economic difficulties of the automotive componentmanufacturers in spite of sustained firm-level competitiveness improvements. InSection 2, the perceptions of the OEMs are presented in some detail. Both thequantitative and the qualitative findings from the interviews undertaken with seniorpurchasing personnel at the seven OEMs is explored, and contrasted with the findingsfrom the 1998 round of interviews. South African-based OEMs are the most importantmarket for domestic automotive component manufacturers and generating anunderstanding of their views and their assessments of the capabilities of domesticallybased component manufacturers is therefore very important.
Section 3 constitutes another critically important part of the report, with the findingsfrom the 58 customer perception surveys undertaken on behalf of 14 automotivecomponent manufacturers that belong to the KwaZulu-Natal and Eastern CapeBenchmarking Clubs presented. The perception surveys were sent to buyers at each ofthe major customers of the Benchmarking Club members and cover the domesticOEM market, as well as the OES/independent aftermarket and supply into otherautomotive component manufacturers. In addition, each of the 14 Club membersprovided a self-assessment of their own performance relative to market requirements.This enabled us to ascertain the extent to which firms were “hearing their markets”. Aconclusion drawing together the key findings presented in each of the three sectionscompletes the report.
Before considering these findings, a detailed outline of the research methodologyemployed for the undertaking of the study is presented.
7
RESEARCH METHODOLOGY
A number of research tools were used in the four overlapping stages of the study. Thefirst stage began in January 2000 with background research into the market pressuresfacing the domestic automotive components industry. Unstructured qualitativeinterviews were conducted with a number of Managing Directors/General Managersof automotive component manufacturers to gauge the extent to which domesticmarket changes were occurring, whilst secondary research was carried out into thechanging nature of the domestic automotive market. This included an analysis ofautomotive market related articles in daily newspapers, weekly financial magazinesand industry-specific publications. The research notes generated out of the Barnes andKaplinsky study carried out in 1998 were also revisited, as were the academicpublications that arose from that study (Barnes and Kaplinsky, 1998, 2000a, 2000b).
On the basis of the background research carried out in January and early February, aninterview schedule was developed for the second stage of the research. Thiscomprised semi-structured interviews with senior purchasing personnel at each of theseven South African based OEMs. The National Association of AutomobileManufacturers of South Africa (NAAMSA) facilitated contact with the OEMs, thusensuring their participation1. In addition, a short four page quantitatively basedquestionnaire was developed for completion by each of the OEMs. Thesequestionnaires were not self-administered, but rather completed by the interviewees intheir own time after the completion of the more open-ended interviews. Thequestionnaire was similar to the one used in 1998, although more detailed and specificquestions were posed in the 2000 version. Four of the seven OEMs returned thequestionnaires in time for the writing of this report. The interviews that wereundertaken varied greatly in length, with the shortest interview completed in one hourand the longest in three hours. Most of the interviews were conducted in March,although one interview was conducted in early May. Professor Raphael Kaplinsky,one of the principal researchers involved in the 1998 study visited two of the OEMswith the IRP’s automotive researcher and helped with the construction of the newquestionnaire.
Concomitant with the second stage of research, the third stage of research wasundertaken by accessing the customer survey databases of the KwaZulu-Natal andEastern Cape Benchmarking Clubs. These two Clubs are formally linked to the IRPand we were as such able to use their extensive customer databases that weregenerated by undertaking customer perception surveys through the later part of 1999and early 2000. Given the strong institutional link between the IRP and the twoBenchmarking Clubs and the cross-pollination of intellectual inputs, the databases ofthe two Clubs contained extremely useful and directly useable buyer perceptioninformation. This is because the methodology followed at the Clubs for theundertaking of customer benchmarks is identical to the methodology used by the IRPin previous academic perception surveys (Barnes 1997, 1999a, Harrison 1996). Theone to 10 rating scale used in the perception surveys was developed over a number ofyears by the IRP and then further developed for the customer surveys in collaborationwith the member firms of the two Clubs. The accuracy and relevance of the 1 NAAMSA also facilitated contact with the OEMs for the 1998 study.
8
perception scales as a research tool has therefore been widely workshopped andanalysed.
The KwaZulu-Natal and Eastern Cape Benchmarking Club databases were generatedby sending buyer perception questionnaires to 70 of the 14 automotive componentmanufacturers’ major domestic customers. Of these, 58 were returned. The perceptionmeasurement system used in the short two-page customer questionnaire was the sameused for the OEM study, thereby ensuring data complementarity between the variouscomponents of the research. In addition, each of the 14 automotive componentmanufacturers provided the IRP with an assessment of the requirements of themarkets they supply into, as well as a self-assessment of their performance relative tothese requirements. These assessments were based on exactly the same perceptionscales used in the customer surveys and in the OEM component of the study. Theactivities of the third stage of the research were largely completed during the courseof March and April 2000.
For the purposes of statistical analysis, the two Clubs’ customer survey databaseswere merged into one SPSS database. The 14 firms’ market perceptions andperformance self-assessments were captured in another SPSS database, with thesmaller set of OEM findings also punched into SPSS. All the statistical findingspresented in this report were therefore generated using SPSS.
Despite their different research processes, and the fact that the customer surveys werenot directly undertaken by the IRP, the second and third stages of the researchtherefore dovetailed together. Both stages led to the generation of a comprehensivequantitative data set that highlights the extent to which South African automotivecomponent manufacturers are presently meeting their markets’ performancerequirements. The fourth stage of the research, which comprised the analysis andwriting up of the research findings, was therefore reliant on the successful completionof all three of the previous research stages. The fourth stage was completed in lateMay 2000.
Importantly, as with all IRP research studies, the research methodology followed wasdistinctly action-based in orientation. All the automotive component firms and OEMswho participated in the study were promised an outline of the findings in return fortheir participation. In addition the firms were promised formal presentations of thefindings, with these due to take place towards the latter part of 2000.

9
1. DOMESTIC MARKET PRESSURES FACING THEAUTO COMPONENTS INDUSTRY
The three key defining features of the operating environment for automotivecomponent manufacturers in South Africa since 1995 are the rapid liberalisation ofthe automotive industry, the reintegration of the domestic industry into the globaloperating environment, and the ongoing stagnation of the domestic automotivemarket. Each of these three key defining features has been explored in-depth inprevious IRP automotive research reports/working papers written for the Departmentof Trade and Industry Policy Support Programme (DTI-PSP). An analysis of the rapidliberalisation of the automotive industry under the MIDP was the focus of Barnes andMorris (2000), whilst the reintegration of the domestic industry into the globaloperating environment was covered in Barnes (1999b and 1999c). Issues pertaining tothe stagnation of the domestic automotive market were also covered in Barnes(1999b) and Barnes and Morris (2000).
Given the detailed explorations of each of the defining features of the South Africanautomotive components industry in these papers, this section does not attempt tocover the whole ambit of “background” issues impacting on the domestic automotiveindustry. The intent is to rather present a brief outline of each of these three factorsonly insofar as they create new market pressures for the automotive componentsindustry in South Africa.
1.1. MARKET LIBERALISATION
The phased liberalisation of the South African automotive market under the MotorIndustry Development Programme (MIDP) since 1995 has placed hugecompetitiveness pressures on the South African automotive components industry. Thedomestic OEMs are no longer forced to purchase from local componentmanufacturers. Given the proliferation of duty credits being generated through theImport Export Complementation (IEC) component of the MIDP at least two of theseven OEMs now have an excess of duty credits2. These OEMs are therefore able tobring in their foreign sourced components duty-free. In certain instances, then, theautomotive components industry is operating in a completely open economy with notrade barriers to provide artificial levels of competitive advantage.
As argued in Barnes (2000), automotive component manufacturers would appear tohave suffered enormous economic difficulties as a result of their rapid exposure tointernational competition through market liberalisation. This is clearly highlighted inFigures 1 and 2. Figure 1 illustrates the stagnant average output levels of a sample ofautomotive component firms through the mid to latter part of the 1990s, whilst Figure2 reveals the aggregated employment losses in the automotive assembly andcomponents industries over the same period.
2 This was highlighted during the course of interviews with the OEM purchasing personnel.

10
Figure 1.
Indexed and inflation adjusted turnover trend for sample of automotive component firms (n = 17): 1994 - 1999
100 .0 101 .99 5 . 7
9 2 . 09 4 . 8
8 5 . 1
0
2 0
4 0
6 0
8 0
1 0 0
1 2 0
1 9 9 4 1 9 9 5 1 9 9 6 1 9 9 7 1 9 9 8 1 9 9 9 ( p r o j e c t e d )
Y e a r
Tren
d
Source: Barnes (2000)
Figure 2.
Employment levels in the domestic automotive industry: 1994 - 1999
37.638.6 38.6
37.1
33.7
46.045.0
44.0
40.039.0
32.0
47.0
20
25
30
35
40
45
50
1994 1995 1996 1997 1998 1999
Year
Nu
mb
er e
mp
loye
d (t
ho
usa
nd
)
Assemblyindustry
Componentindustry
Source: DTI (1999)
Importantly, this poor economic performance has occurred despite the significant factthat the domestic automotive components industry has rapidly responded to thecompetitiveness pressures being placed on it as a result of the industry’s liberalisation.Using a range of “lean production” benchmarks to gauge the competitivenesstrajectory of the automotive components industry, a number of IRP research studieshave found that automotive component manufacturers are significantly improvingtheir firm-level competitiveness.
Some of these improvements are summarised in Table 1. As revealed in the table,automotive component manufacturers have rapidly improved their competitivenessbetween 1995 and 1999 in terms of all the lean production benchmarks used. The onlyexception is finished goods inventory holding and this is hardly an indication ofdeteriorating performance, relating as it does to the increased levels of exporting fromthe sampled automotive component manufacturers.

11
Table 1: Key operational competitiveness measures for a sample of automotivecomponent manufacturers and their performance trajectory since 1995
Measure Performance1995
Performance1999
Change: 1995to 1999 (%)
Raw material stock holding (days) 33.1 28.0 15.4Work in Progress stock holding (days) 11.2 10.2 8.9Finished goods stock holding (days) 17.9 23.1 -29.1Customer return rate (parts permillion)
6,148 3,585 41.7
Labour turnover rate (%) 8.5 3.7 56.5Absenteeism rate (%) 5.5 4.0 27.2
Source: Barnes and Morris (2000)
The reasons underpinning the economic difficulties of the automotive componentmanufacturers despite their significantly improved levels of competitiveness relate tothe even greater levels of competitiveness of their international competitors. Using thesame “lean production” benchmarks, this performance gap is clearly highlighted inTable 2. With protection levels radically reduced, domestic component manufacturersare now expected to meet the operating standards of their international competitors.Competitiveness improvements in themselves are no longer adequate –competitiveness performance levels of an international standard are. This is,moreover, not only the standard being set for component manufacturers that supplythe OEMs. Independent aftermarket (IAM) focused component manufacturers are alsofacing enormous pressure from direct imports, especially from South East Asia.
Table 2: Average operational competitiveness levels of a group of surveyed SAfirms (1999) versus a group of international automotive component firms (1997)
Measure Surveyed SAfirms 1999
Internationalfirms 1997
SA vs. internat.firms (%)
Raw material stock holding (days) 28.0 20.8 -25.7Work in Progress stock holding (days) 10.2 7.2 -29.4Finished goods stock holding (days) 23.1 9.1 -60.6Customer return rate (ppm) 3,585 260 -92.7Labour turnover rate (%) 3.7 7.7 +108.1Absenteeism rate (%) 4.0 4.6 +15
Source: Barnes and Morris (2000)
1.2. REINTEGRATION INTO THE GLOBAL OPERATINGENVIRONMENT
The issues pertaining to rapid market liberalisation are further compounded by thereintegration of the domestic industry into the global operating environment. Thepost-1995 period has not only been impacted on by the liberalisation of the SouthAfrican automotive trade regime. It has also been directly impacted upon by thereincorporation of the South African-based OEMs into their global families. Prior tothe 1990s the majority of domestic based OEMs were South African owned operatingunder licensing agreements with Multinational Corporations (MNCs). This haschanged with all seven of the OEMs now either fully or partly owned by MNC parentcompanies. This has had huge implications for the domestic components supply base
12
of the OEMs. In line with the homologation tendencies of the MNCs, domesticcomponent suppliers are now expected to meet internationally set performancestandards. Failure to comply with these standards results quite simply in the transferof business to foreign component manufacturers, either directly or throughCompletely Knocked Down (CKD) kits. The rapid liberalisation of the industry andthe consequent ability of OEMs to bring in components duty-free facilitate this.
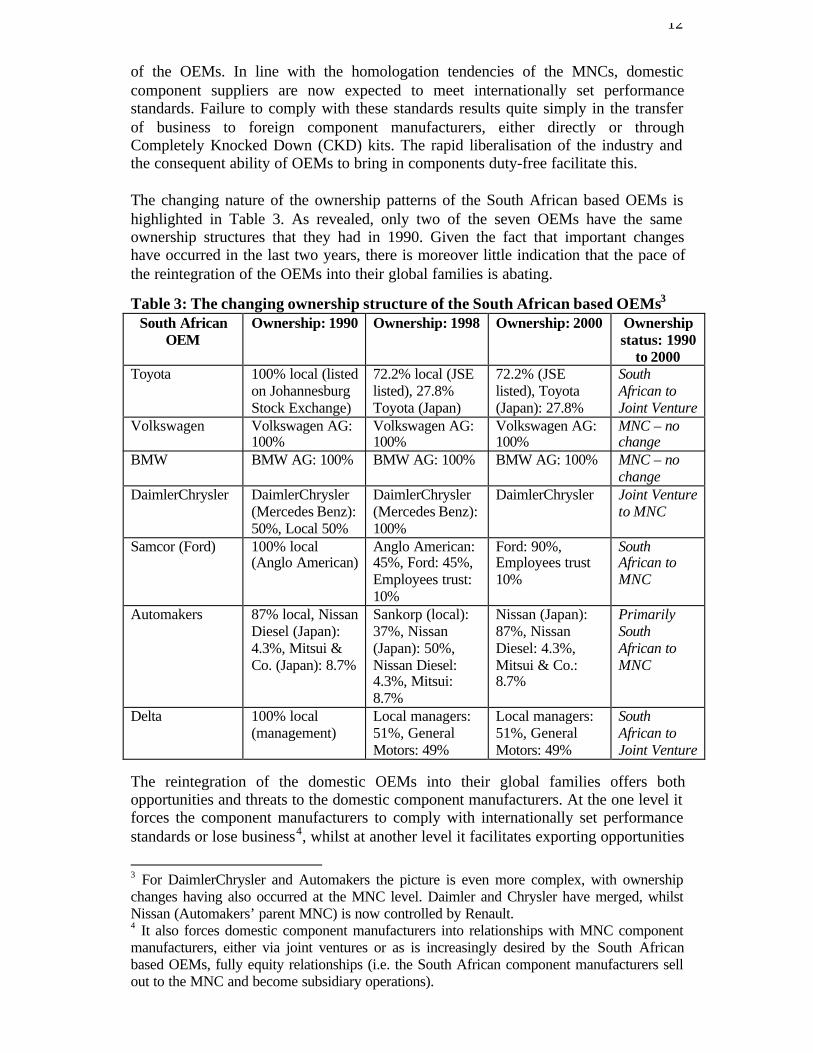
The changing nature of the ownership patterns of the South African based OEMs ishighlighted in Table 3. As revealed, only two of the seven OEMs have the sameownership structures that they had in 1990. Given the fact that important changeshave occurred in the last two years, there is moreover little indication that the pace ofthe reintegration of the OEMs into their global families is abating.
Table 3: The changing ownership structure of the South African based OEMs3
South AfricanOEM
Ownership: 1990 Ownership: 1998 Ownership: 2000 Ownershipstatus: 1990
to 2000Toyota 100% local (listed
on JohannesburgStock Exchange)
72.2% local (JSElisted), 27.8%Toyota (Japan)
72.2% (JSElisted), Toyota(Japan): 27.8%
SouthAfrican toJoint Venture
Volkswagen Volkswagen AG:100%
Volkswagen AG:100%
Volkswagen AG:100%
MNC – nochange
BMW BMW AG: 100% BMW AG: 100% BMW AG: 100% MNC – nochange
DaimlerChrysler DaimlerChrysler(Mercedes Benz):50%, Local 50%
DaimlerChrysler(Mercedes Benz):100%
DaimlerChrysler Joint Ventureto MNC
Samcor (Ford) 100% local(Anglo American)
Anglo American:45%, Ford: 45%,Employees trust:10%
Ford: 90%,Employees trust10%
SouthAfrican toMNC
Automakers 87% local, NissanDiesel (Japan):4.3%, Mitsui &Co. (Japan): 8.7%
Sankorp (local):37%, Nissan(Japan): 50%,Nissan Diesel:4.3%, Mitsui:8.7%
Nissan (Japan):87%, NissanDiesel: 4.3%,Mitsui & Co.:8.7%
PrimarilySouthAfrican toMNC
Delta 100% local(management)
Local managers:51%, GeneralMotors: 49%
Local managers:51%, GeneralMotors: 49%
SouthAfrican toJoint Venture
The reintegration of the domestic OEMs into their global families offers bothopportunities and threats to the domestic component manufacturers. At the one level itforces the component manufacturers to comply with internationally set performancestandards or lose business4, whilst at another level it facilitates exporting opportunities
3 For DaimlerChrysler and Automakers the picture is even more complex, with ownershipchanges having also occurred at the MNC level. Daimler and Chrysler have merged, whilstNissan (Automakers’ parent MNC) is now controlled by Renault.4 It also forces domestic component manufacturers into relationships with MNC componentmanufacturers, either via joint ventures or as is increasingly desired by the South Africanbased OEMs, fully equity relationships (i.e. the South African component manufacturers sellout to the MNC and become subsidiary operations).
13
for globally competitive firms. This is further supported by the Import-ExportComplementation (IEC) component of the MIDP as OEMs can earn lucrative dutyrebates for facilitating component exports. In many cases, then, the distinctionbetween domestic and international markets is falling away. The net result of thesechanges is new market demands. South African based customers will no longer acceptthe previous performance standards of their component suppliers. This does not onlyrelate to pricing issues, but to a range of other performance issues such as adherenceto quality standards, conformance to internationally set specifications, deliveryreliability in the face of increasing Just in Time (JIT) requirements, new productdevelopment capabilities, flexibility, etc.
1.3. DOMESTIC MARKET STAGNATION
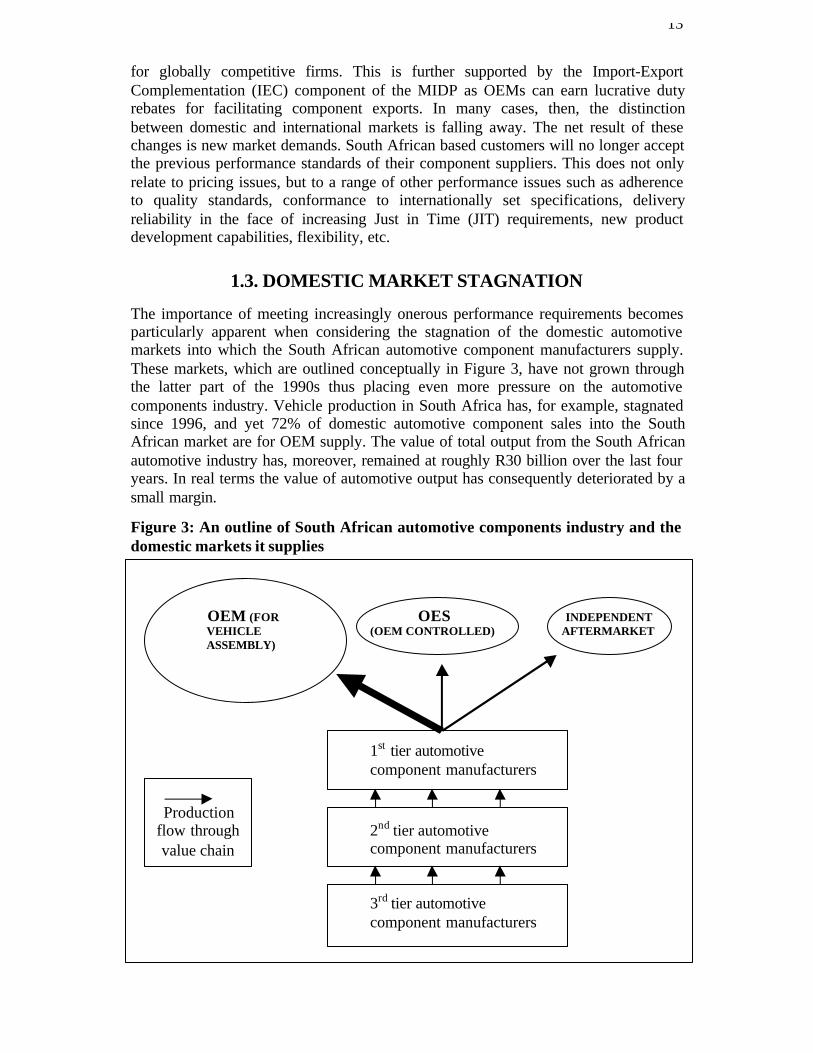
The importance of meeting increasingly onerous performance requirements becomesparticularly apparent when considering the stagnation of the domestic automotivemarkets into which the South African automotive component manufacturers supply.These markets, which are outlined conceptually in Figure 3, have not grown throughthe latter part of the 1990s thus placing even more pressure on the automotivecomponents industry. Vehicle production in South Africa has, for example, stagnatedsince 1996, and yet 72% of domestic automotive component sales into the SouthAfrican market are for OEM supply. The value of total output from the South Africanautomotive industry has, moreover, remained at roughly R30 billion over the last fouryears. In real terms the value of automotive output has consequently deteriorated by asmall margin.
Figure 3: An outline of South African automotive components industry and thedomestic markets it supplies
OEM (FOR OES INDEPENDENT VEHICLE (OEM CONTROLLED) AFTERMARKET ASSEMBLY)
1st tier automotivecomponent manufacturers
2nd tier automotivecomponent manufacturers
3rd tier automotivecomponent manufacturers
Productionflow throughvalue chain

14
The fact that the domestic automotive market, which still constitutes the mostimportant market for South African based OEMs, is not booming and has not grownsince the 20% market growth experienced in 1995 places even more competitivenesspressure on the domestic automotive components industry. This is because the OEMshave not only shifted their sourcing decisions in line with the liberalisation of thedomestic industry and their re-incorporation into global networks. They have alsobegun bolstering their own competitiveness in the face of a stagnant domestic marketwith seven principal domestic competitors as well as a host of direct importers. Thesemarket-related pressures have obviously exacerbated the squeeze on componentmanufacturers, with OEMs looking to generate competitive advantage through thegeneration of improved supply chain efficiencies.
Understanding the domestic market pressures bearing down on the automotivecomponents industry is therefore of enormous relevance, particularly in terms ofOEM supply. Whilst these pressures are, of course not new, they have clearlyintensified over the last couple of years. Although previous IRP research explored themagnitude of these pressures from the perspective of the OEMs (Barnes andKaplinsky 1998), given the further intensification of the trends noted in this section, afurther analysis of market perceptions of automotive component manufacturingperformance is critically important. In Section 2, the views of the OEMs are thereforeexplored, whilst in Section 3 consideration is given to a range of OEM, aftermarketand “other component manufacturer” customer viewpoints regarding the performanceof their automotive component suppliers.
15
2. AUTO COMPONENT RESPONSES TO DOMESTICMARKET CHALLENGES: THE VIEW OF THE OEMS
The six OEMs that participated in the 1998 IRP study into OEM perceptions ofdomestic automotive component manufacturers had very strong views pertaining tothe competitiveness and long-term trajectory of the industry. The five key points thatwere raised were:
1. The generally poor competitiveness of automotive component manufacturers inSouth Africa relative to OEM requirements, with this having negative implicationsfor future domestic sourcing arrangements in line with the MIDP’s tariff phasedown process. It was highlighted that component manufacturers needed to reachinternational levels of competitiveness if they wanted to remain first tier suppliers.
2. Continued purchasing of products locally that have a low value to weight ratio andthat need to be purchased on a Just-in-Time basis from suppliers located near tovehicle assembly operations.
3. The shift away from needing to procure certain components locally irrespective ofadaptations in the local market. The advent of global purchasing and the design of“world cars” was highlighted as the most important factor underpinning themovement away from procuring products re-designed specifically for the SouthAfrican market. This, however, applied only to new models that were beingreleased.
4. The movement away from purchasing products made with South Africantechnology. This was seen as inevitable due to global sourcing arrangements andthe restructuring of relationships between OEMs and their first tier suppliers at theglobal level.
5. The movement away from purchasing from South African owned companies.Given lead source arrangements, it was strongly argued that South African firsttier automotive component manufacturers could not survive in the long term bysimply having licensing agreements with MNC lead source suppliers. Thereconsequently needed to be a strong emphasis on attracting foreign equity into theSouth African first tier suppliers. Alternatively, the OEMs would “followersource”; i.e. they would encourage the location of a MNC lead source supplier’splant in South Africa. This was seen as particularly important for JITrequirements.
These were the same five areas explored in the OEM survey undertaken in 2000 andthe interviews that were conducted with key purchasing personnel. The purpose ofthis was to track changes over the last two years, thus identifying those areas wherethe OEM views held in 1998 have or have not been borne out, as well as whereprojected trends have intensified or shifted. Given the clear responses received in1998, the 2000 survey was strongly informed by these previous responses, and as suchthe structure of this section follows the key points raised in 1998.
16
2.1 The competitiveness of South African automotive componentmanufacturers: The view of the OEMsIn order to gauge OEM perceptions of the competitiveness of South Africanautomotive component manufacturers against their own requirements, we asked thedomestic OEMs to rate the performance of the suppliers against their requirements inboth 1998 and 2000. Whilst six OEMs completed the assessment of the componentmanufacturers’ performance levels in 1998 only five returned the questionnaire in2000. The 2000 perception questionnaire was also more refined than the 1998questionnaire, with “innovation” as a performance criterion being divided into threeseparate performance criteria: New product development capacity, capacity to modifyproducts and process innovation capacity. Not all of the findings are therefore directlycomparable.
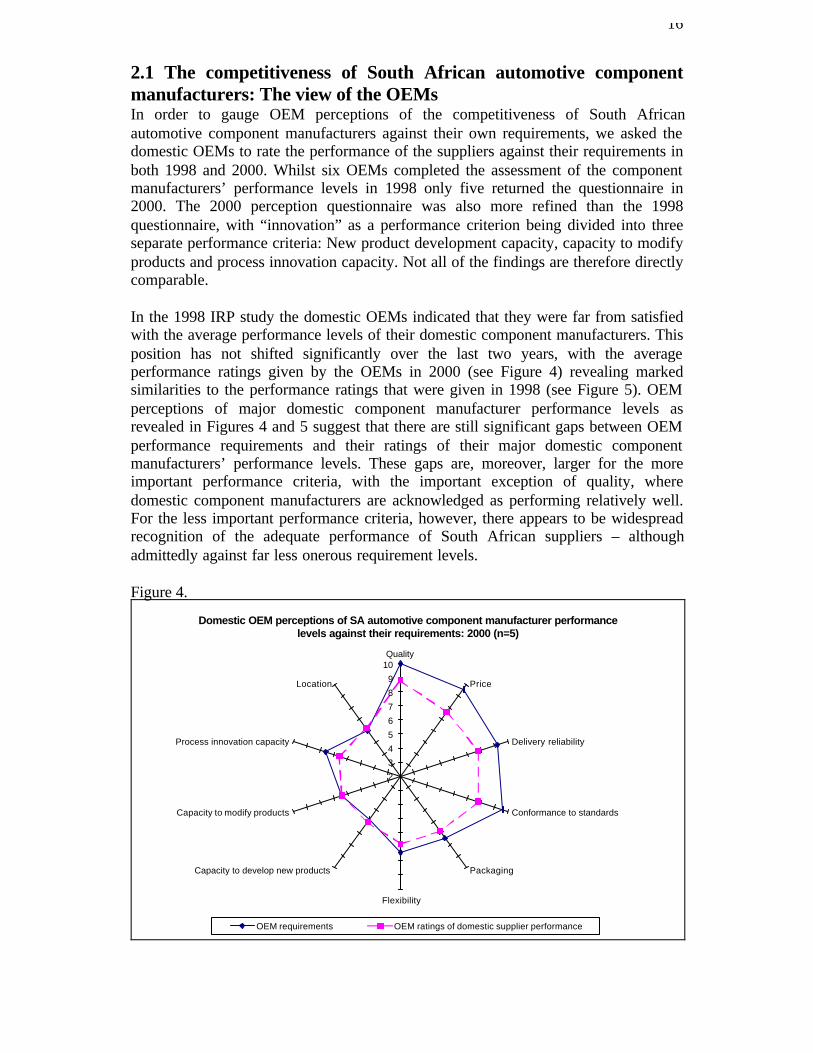
In the 1998 IRP study the domestic OEMs indicated that they were far from satisfiedwith the average performance levels of their domestic component manufacturers. Thisposition has not shifted significantly over the last two years, with the averageperformance ratings given by the OEMs in 2000 (see Figure 4) revealing markedsimilarities to the performance ratings that were given in 1998 (see Figure 5). OEMperceptions of major domestic component manufacturer performance levels asrevealed in Figures 4 and 5 suggest that there are still significant gaps between OEMperformance requirements and their ratings of their major domestic componentmanufacturers’ performance levels. These gaps are, moreover, larger for the moreimportant performance criteria, with the important exception of quality, wheredomestic component manufacturers are acknowledged as performing relatively well.For the less important performance criteria, however, there appears to be widespreadrecognition of the adequate performance of South African suppliers – althoughadmittedly against far less onerous requirement levels.
Figure 4.
Domestic OEM perceptions of SA automotive component manufacturer performance levels against their requirements: 2000 (n=5)
2
3
4
5
6
7
8
9
10Quality
Price
Delivery reliability
Conformance to standards
Packaging
Flexibility
Capacity to develop new products
Capacity to modify products
Process innovation capacity
Location
OEM requirements OEM ratings of domestic supplier performance

17
Figure 5.
OEM perceptions of automotive component manufacturer performance levels relative to their requirements: 1998 (n=6)
2
3
4
5
6
7
8
9
10Quality
Price
Delivery reliability
Conformance to spec.
Packaging
Flexibility
Innovation
Financial stability
OEM perception Rating of domestic supplier performance
The domestic OEMs’ perceptions of their foreign supplier performance levels in2000, were also quite similar to the perceptions held in 1998. The one significant shiftrelates to their recognition of the importance of South African technology . Whilst theSouth African automotive component manufacturers continue to receive lower ratingsthan their international counterparts in terms of all the key performance requirementsexplored, as highlighted in Figures 6 (2000) and 7 (1998), the gaps are notoverwhelming. The significant difference relates rather to new product developmentcapacity where the international suppliers are seen to have a huge – and growing -advantage over their South African counterparts.
Figure 6.
Domestic OEM performance requirements and their assessments of South African and international automotive component manufacuturer performance levels: 2000
2
3
4
5
6
7
8
9
10Quality
Price
Delivery reliability
Conformance to standards
Packaging
Flexibility
Capacity to develop new products
Capacity to modify products
Process innovation capacity
Location
OEM requirements OEM ratings of domestic supplier performance OEM ratings of foreign supplier performance

18
Figure 7.
Domestic OEM perceptions of domestic and foreign supplier performance levels versus requirements: 1998
2
3
4
5
6
7
8
9
10Quality
Price
Delivery reliability
Conformance to spec.
Packaging
Flexibility
Innovation
Financial stability
OEM perception Domestic supplier rating Foreign supplier rating
In summary, then, domestic OEMs are still largely dissatisfied with the performanceof their South African automotive component suppliers. This is revealed not onlythrough the measures highlighted above, however, as this was a point that wasreiterated at all of the interviews undertaken with OEM purchasing personnel. Inaddition, these average figures mask the very uneven development of the industry.Whilst two of the seven OEMs were dismissive of the potential of their South Africanautomotive component supply base as it is presently constituted, the other OEMsrecognised that many of their suppliers were significantly improving theirperformance, with some starting to achieve world class performance standards. Twoof the seven OEMs were strongly advocating the importance of follower sourcing,whilst the five other OEMs held far more nuanced positions regarding the competitivecapabilities of their domestic suppliers.
2.2 Purchasing of low value to weight productsAs was the case in 1998, performance dissatisfaction with local suppliers does notinevitably lead to global purchasing. Unless significant technology changes occur,certain components were highlighted as always likely to be sourced locally. This wasprincipally due to their low value to weight ratio, transportation difficulty, and/orlocal adaptation requirement. All of these factors necessitate supply in close proximityto OEM operations. The five most significant components sourced from each of theOEMs’ most important domestic suppliers is highlighted below in Table 4. As isapparent, whilst there has been some shift in the make-up of these components from1998, they tend to be non-core technology parts with low value to weight ratios.

19
Table 4: The most significant components sourced from each of the five most important domesticcomponent suppliers by five OEMs
Type of component Number of assemblers: 2000(n=5)
Number of assemblers: 1998(n=6)
Axles 3 5Sheet metal/pressings 2 5Air conditioners/radiators 3 4Wiring harnesses 3 3Seats 3 3Glass 1 2Trim 2 1Wheels 2 0Exhausts 2 1Machined components 1 2Other 3 4
2.3 Re-designing for local market conditionsAll of the OEMs indicated that South African market conditions were not unique andthat apart from certain interior and exterior trim components that were designedexclusively for the peculiar tasted of the South African market, most productsfollowed global source design, with adaptations where necessary for hot climateconditions. These adaptations are not unique to the local market, although in certaininstances the adaptations are designed in South Africa. Importantly, moreover, thesedesigns are carried out in-house at the OEMs and as such design technology is not animportant purchasing requirement for the domestic OEMs. This was clearlyhighlighted in Figure 6 and further clarified through the qualitative interviews carriedout at the OEMs.
2.4 The death of SA technology?One of the key findings from the 1998 study was the indication on the part of theOEMs that they had already largely moved away from purchasing components fromSouth African automotive component manufacturers with their own technology. Inline with their own integration into their parent company’s global operations theyindicated a strong preference for purchasing components from MNCs located in SouthAfrica. The qualitative interviews undertaken at the OEMs suggested that this trendwas likely to intensify. In line with these assertions we developed a conceptualoverview of where we saw the industry progressing, with this highlighted in Figure 8.
Figure 8.Changing strategic perspectives on the ownership of component suppliers
1993 1998 2003
Wholly-owned subsidiaries
Joint ventures
Local firms with foreign technology
Local firms with local technology
Source: Barnes and Kaplinsky (1998)

20
In order to quantitatively verify the actual progress made in this regard we asked eachof the OEMs in 2000 to indicate the ownership and technology breakdown of theirSouth African component supply base in 1997, in early 2000 then the likely scenarioin 2003. The findings, highlighted in Table 5, are illuminating, as they reveal theaccuracy of the conceptual trajectory postulated in 1998. For example, wholly ownedsubsidiary operations of MNCs in SA presently account for approximately 32% ofcomponent sales into domestic OEMs and this is expected to increase to 37.5% in2003. Similarly, purchasing from Joint Venture operations is expected to increasefrom 26% to 32.5%. The purchasing of components from SA companies with SAtechnologies is expected to decline from the present level of 18% to 10% in 2003,which is considerably down from the 1997 level of 26%.
Whilst the general trajectory highlighted in Figure 8 has been borne out, it may still betoo early to refer to the death of SA technology in the automotive componentsindustry. Its scope may be rather limited, but at least 10% of all of the OEMs’ localpurchases in 2003 are expected to be from SA companies with SA technology.
Table 5: Categorisation of the ownership status of, and the technology used by, SA based componentmanufacturers that supply SA OEMs: 1997, presently and 2003 projections (n=4)
Category 1997 Presently 2003Wholly owned subsidiaries of MNC auto componentmanufacturers
26% 31.7% 37.5%
Joint ventures between SA companies and MNC autocomponent manufacturers
18.5% 26% 32.5%
SA companies with technology agreements with MNCauto component manufacturers
29.8% 24.3% 20%
SA companies with SA technologies 25.8% 18% 10%Total 100% 100% 100%
2.5 The death of the local firm?Linked to the ongoing demise of the importance of SA technology, increasinglyonerous OEM requirements, as well as the critical need for sales into global markets,many locally owned automotive component manufacturers were expected in 1998 toeither shift down to the second tier of the automotive supply chain or become JVpartners with, or subsidiaries of, MNCs. As suggested in Table 5 (above) and asfurther revealed in Table 6 (below) this trend appears to have occurred over the lasttwo years. In 1998, the major suppliers of the six OEMs who participated in the IRPstudy represented a mix of South African owned and internationally ownedcompanies, whereas in 2000, the majority of major suppliers are MNC owned.
Table 6: Ownership status of the SA OEM’s major SA based component suppliers: 1998 versus 2000Ownership Proportion of major suppliers:
1998* (n=19)Proportion of major suppliers:
2000* (n=20)South African 58% 40%Joint Venture 5% 10%Multinational 37% 60%* Please note that all double counting has been removed hence the smaller n. numbers.
The shift in ownership has been dramatic. In only two years, MNC owned suppliersbased in South Africa have become the dominant major suppliers to the OEMs.Whilst some of this has been through the acquisition of previously independent SouthAfrican operations or an expansion of previously smaller South African operations,
21
the development of greenfield sites has also been important, in line with the “followersourcing” strategy of certain of the OEMs. The importance of carrying throughfollower sourcing strategies in South Africa was strong argued during the course ofthree of the seven OEM interviews. These OEMs viewed the location of lead sourcesuppliers close to their operations as key to their own competitive potential.
2.6. SummaryFive of the seven OEMs that were interviewed during the course of the study returnedthe perception questionnaires that were handed over to them at the time of thequalitative interviews in time for the writing of this report. The views expressed in theseven interviews remained largely unchanged from the views that were expressedduring the course of the 1998 OEM study. Domestic OEMs are still largelydissatisfied with the performance of the local supply base, with the domesticcomponents industry being rapidly restructured as a result. Whilst low value to weightproducts are still largely being purchased in South Africa, domestic OEMs nowpurchase less inputs from South African owned automotive component manufacturersand even less inputs from South African owned companies with local technology. Thetrend that was envisaged in this regard in 1998 has clearly maintained its momentumover the last two years. Critically, the South African based OEMs viewed thetrajectory of the automotive components industry as intractable, and likely to intensifyover the next few years, especially as new vehicle models are released into thedomestic market.

22
3. CUSTOMER PERCEPTION SURVEY FINDINGS
This section comprises five sub-sections. First, we consider the purpose of theperception study that was carried out, with this including a profile of the customersand automotive component manufacturers sampled. Secondly we outline theautomotive component manufacturers’ perceptions of their own performance relativeto customer demand. Third, we consider the aggregated customer perceptions ofautomotive component manufacturer performance levels relative to their demands.Then we disaggregate the customer perceptions according to their market andownership profiles, thus highlighting variance in demand and satisfaction ratingsacross domestic market segments. Finally we consider the survey responses accordingto customer ownership – South African versus Multinational.
3.1. Purpose of the perception studyThe purpose of sending perception surveys to the major customers of 14 KwaZulu-Natal and Eastern Cape Benchmarking Club members was to gauge how effectivelyeach of the automotive component manufacturers’ performance levels matched upagainst the performance requirements of the markets into which they fed. By sendingthe perception questionnaires to the buyers at each of the major customers, theautomotive component manufacturers were able to gain a clear understanding ofwhere their customers perceived their major strengths and weaknesses. Anaggregation of the responses from the 58 customers therefore allows us to generate anunderstanding of the average customer perceptions of the 14 automotive componentmanufacturers’ performance levels.
Whilst the 14 automotive component manufacturers are not a representative sample ofautomotive component manufacturers nationally, given their skewed geographicallocation, the 14 firms are broadly representative of the types of automotive componentmanufacturers operative in South Africa. A brief profile of the 14 automotivecomponent manufacturers relative to the profile of a larger sample of 35 firmssurveyed in a 1998 study of the competitiveness of the South African componentsindustry (see Barnes 1998) supports this contention. Ownership, firm-size(employment and turnover), date of establishment, export propensity andcategorisation according to primary raw material input indicators suggest similaritiesbetween the two sets of firms.
The findings therefore appear to be largely representative of domestic customerperceptions of South African automotive component manufacturer performancelevels.

23
Table 7: Profile of the 14 Benchmarking Club members against a sample of componentmanufacturers surveyed in 1998 (n=35)
Benchmarking Club members Auto component firms (1998)Average employment level 331 320Average turnover R88 million R72 millionDate of establishment Pre-1970: 57%, 1971-90: 36%,
1991+: 7%Pre-1970: 48%, 1971-90: 33%,
1991+: 18%Geographical location Gauteng: 0%, Eastern Cape: 36%,
KwaZulu-Natal: 64%Gauteng: 31%, Eastern Cape:27%, KwaZulu-Natal: 42%
Ownership MNC or JV (SA/MNC): 50%South African: 50%
MNC or JV (SA/MNC): 26%South African: 74%
Categorisation according toprimary raw material input
Ferrous metal: 29%, Non ferrousmetal: 21%, Plastics/chemical:
14%, Textiles: 14%, Glass: 14%,Electronics: 7%
Ferrous metal: 54%, Non ferrousmetal: 11%, Plastics/chemical:
23%, Textiles: 11%
% of turnover generatedfrom exporting
18.3% (1998) 17.8% (1997)
Given the importance of the domestic OEM market for automotive componentmanufacturers (as highlighted in Section 1) it is also significant to note that 46% ofthe surveyed customers were OEMs, with a smaller percentage OES/IAM customersand the remainder automotive component manufacturers. This is illustrated in Figure9 below. Due to the particular demands of each of the domestic markets outlined inFigure 9, the findings from the total dataset are disaggregated according to each ofthese market segments. Given the important dissimilarities in customer requirementsand their perceptions of supplier performance levels across each of the marketcategories, it is important that these be explored.
Figure 9.Breakdown of customers by market (n=58)
46%
26%
28%
OEM OES/IAM Auto component manuf.
Another key distinction that needs to be made between the customers is theirownership. As argued in Section 1, as the industry increasingly integrates into theglobal operating environment so competitiveness pressures intensify. One wouldtherefore expect the domestic customers who are part of multinational organisations tobe more demanding in terms of their supplier performance levels. Is this, however,really the case or have South African owned customers increased their performancerequirements to that of their MNC owned competitors? Given the relatively evenownership split amongst the 58 customers surveyed (see Figure 10), a breakdown of

24
domestic automotive component manufacturer performance levels through the eyes ofMNC owned and SA owned customers is therefore also presented in this section.
Figure 10.
Breakdown of customers according to their ownership (n=58)
59%
41%
South African MNC
The 12 key customer performance requirements that were explored in each of theperception surveys were:
1. Quality2. Price3. Delivery reliability4. Conformance to standards5. Packaging6. Flexibility
7. New product development8. Capacity to modify products9. Process innovation capacity10. Financial stability11. Offering of credit facilities12. Geographical location
Each customer was requested to rate the importance of each of these criteria whenassessing the performance of their suppliers. A perception scale of one to ten was usedfor all the criteria, with a rating of one highlighting that the performance criteria wasnot important at all and ten that it was critically important. Each customer was thenrequested to indicate the performance of the component manufacturer using the sameperception scale; thus allowing us to gauge the relative importance of eachperformance criteria, as well as the relative performance of the componentmanufacturer against the customer’s requirements.
Before the customer findings are presented, an overview of the 14 automotivecomponent manufacturers’ perceptions of their own customer requirements and theirself-perception of performance relative to these requirements is outlined. The sameperception scale was used, with this exercise offering a useful indication of (1) theextent to which the 14 automotive component manufacturers believe they are meetingtheir customers’ demands and (2) the extent to which they are actually reading theircustomers’ performance requirements. Automotive component firms that over-ratetheir own performance relative to customer requirements are unlikely to respond aspositively to market changes as those firms that have a clear understanding of theircustomers’ performance requirements, their customers’ perceptions of theirperformance levels, and where performance gaps clearly exist. It is therefore

25
important to first gain an impression of the automotive component manufacturers’perceptions of their own performance relative to customer demands.
3.2. The automotive component manufacturers’ performanceperceptions
As highlighted in Figure 11, the 14 automotive component manufacturers believe thattheir customers’ most important performance requirements are price, quality,conformance to standards and delivery reliability, with each of these performancecriteria receiving an average rating of over 9. Another important requirement isflexibility, which received an average importance rating of over 8. All the otherperformance requirements were deemed to be of less importance, receiving averageperformance ratings of less than 8. The performance requirement perceived as beingof least importance was geographical location, which received an averageperformance requirement of under 6. The automotive component manufacturersindicated that they either met or even surpassed all of their major customers’ lessimportant performance criteria. Performance gaps were, however, recognised for themore important peformance criteria, with significant gaps indicated for price andquality.
Figure 11
Auto component firms' self perceptions of customer requirements and their relative performance (n=14)
4
5
6
7
8
9
10Quality
Price
Delivery reliability
Conformance to standards
Packaging
Flexibility
Capacity to develop new products
Capacity to modify products
Process innovation capacity
Financial stability
Offering of credit facilities
Location
Customer requirements Ratings of own performance
The extent of the perceived performance gaps is clearly illustrated in Figure 12. Foronly two criteria were performance gaps perceived to be larger than 10% of theautomotive component manufacturers’ performance levels. This represents arelatively comfortable self-diagnosis on the part of the automotive componentmanufacturers. This is a level of comfort that should not exist. As will be highlightedin 3.3 the performance gaps are significantly larger when viewed through the eyes ofthe customers themselves, with more performance criteria also deemed to beimportant.

26
Figure 12.
Gap analysis of firm perceptions of customer requirements and their self assessment of performance relative to these requirements (n=14)
11 .76
18 .25
8.53
7.69
1.64
0.00
-3 .77
-0 .99
-3 .64
-25 .64
-20 .07
-16 .88
0 2 4 6 8 1 0 1 2 1 4 1 6 1 8 2 0
Qual i ty
Price
Del ivery re l iabi l i ty
C o n f o r m a n c e t o s t a n d a r d s
P a c k a g i n g
Flexibil i ty
Capac i t y t o deve lop new p roduc ts
Capac i ty to mod i fy p roduc ts
Process innova t ion capac i t y
Financia l s tabi l i ty
Of fer ing o f c red i t fac i l i t ies
Loca t i on
P e r c e n t ( % )
Gap between requirements and own performance rating
Please note: A negative (-) figure indicates that the component suppliers believe they are surpassingtheir customers’ performance requirements.
3.3. Customer perceptions of the component manufacturers’performance levels
Customer perceptions of the automotive component manufacturers’ performancelevels are significantly less promising than the automotive component manufacturers’self perceptions. As highlighted in Figure 13, whilst the automotive componentmanufacturers are correct in rating their customers’ quality, price, delivery reliabilityand conformance standards as being critically important they underestimate theimportance of the other performance requirements. Packaging, flexibility, newproduct development capacity, capacity to modify products, process innovationcapacity and financial stability were given average performance requirements ofbetween 8 and 9, thus signifying their importance. Only the offering of credit facilitiesand geographical location received average ratings below 8.
Figure 13.
Domestic customer requirements and ratings of auto component firm performance (n=58)
4
5
6
7
8
9
10Quality
Price
Delivery reliability
Conformance to standards
Packaging
Flexibility
Capacity to develop new products
Capacity to modify products
Process innovation capacity
Financial stability
Offering of credit facilities
Location
Domestic customer requirements Ratings of firm performance
27
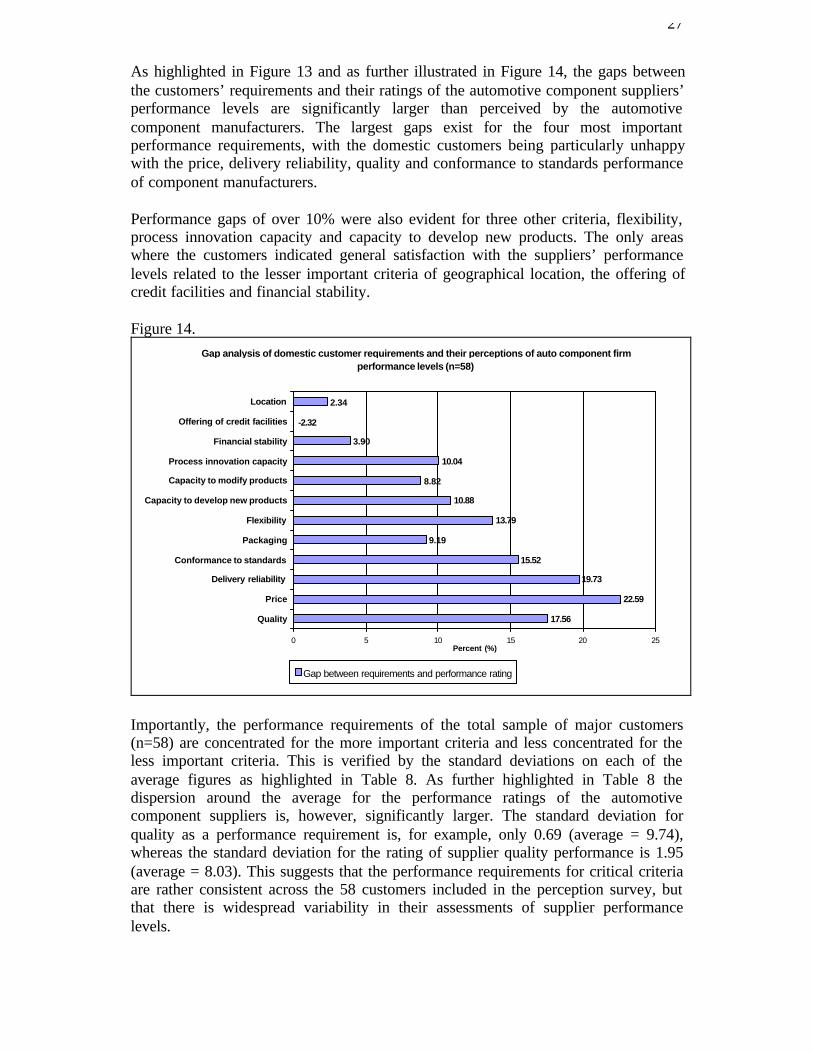
As highlighted in Figure 13 and as further illustrated in Figure 14, the gaps betweenthe customers’ requirements and their ratings of the automotive component suppliers’performance levels are significantly larger than perceived by the automotivecomponent manufacturers. The largest gaps exist for the four most importantperformance requirements, with the domestic customers being particularly unhappywith the price, delivery reliability, quality and conformance to standards performanceof component manufacturers.
Performance gaps of over 10% were also evident for three other criteria, flexibility,process innovation capacity and capacity to develop new products. The only areaswhere the customers indicated general satisfaction with the suppliers’ performancelevels related to the lesser important criteria of geographical location, the offering ofcredit facilities and financial stability.
Figure 14.Gap analysis of domestic customer requirements and their perceptions of auto component firm
performance levels (n=58)
17.56
22.59
19.73
15.52
9.19
13.79
10.88
8.82
10.04
3.90
2.34
-2.32
0 5 10 15 20 25
Quality
Price
Delivery reliability
Conformance to standards
Packaging
Flexibility
Capacity to develop new products
Capacity to modify products
Process innovation capacity
Financial stability
Offering of credit facilities
Location
Percent (%)
Gap between requirements and performance rating
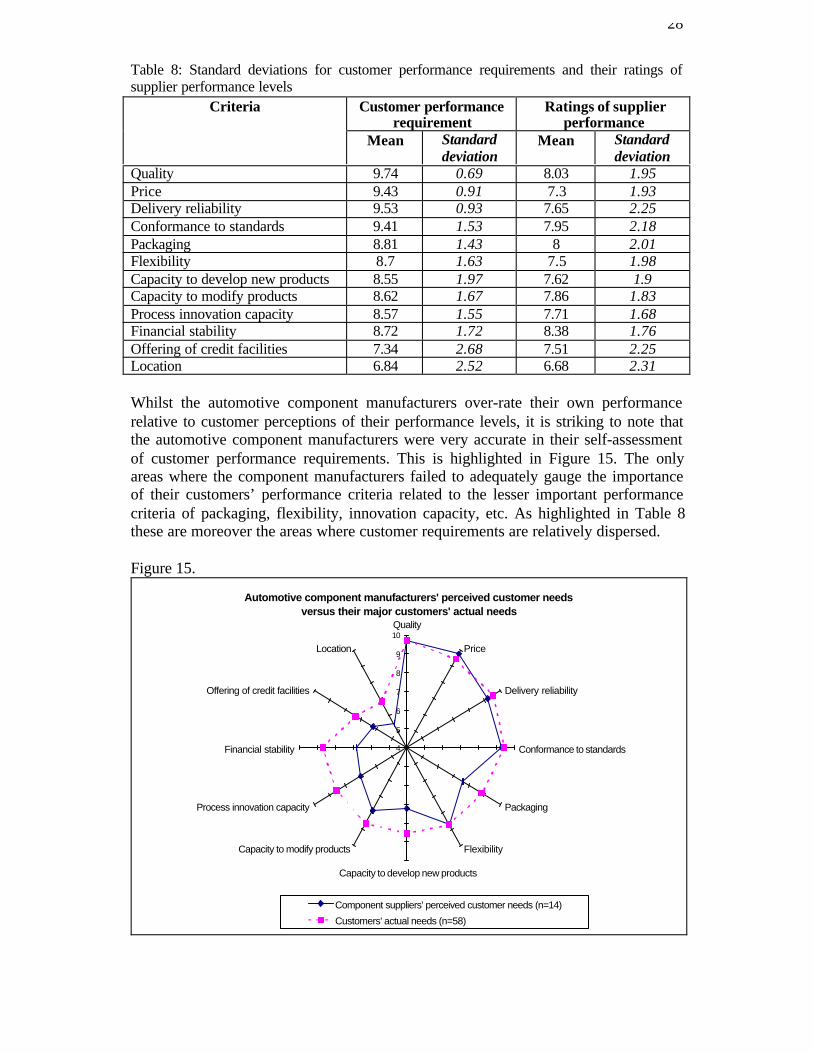
Importantly, the performance requirements of the total sample of major customers(n=58) are concentrated for the more important criteria and less concentrated for theless important criteria. This is verified by the standard deviations on each of theaverage figures as highlighted in Table 8. As further highlighted in Table 8 thedispersion around the average for the performance ratings of the automotivecomponent suppliers is, however, significantly larger. The standard deviation forquality as a performance requirement is, for example, only 0.69 (average = 9.74),whereas the standard deviation for the rating of supplier quality performance is 1.95(average = 8.03). This suggests that the performance requirements for critical criteriaare rather consistent across the 58 customers included in the perception survey, butthat there is widespread variability in their assessments of supplier performancelevels.
28
Table 8: Standard deviations for customer performance requirements and their ratings ofsupplier performance levels
Customer performancerequirement
Ratings of supplierperformance
Criteria
Mean Standarddeviation
Mean Standarddeviation
Quality 9.74 0.69 8.03 1.95Price 9.43 0.91 7.3 1.93Delivery reliability 9.53 0.93 7.65 2.25Conformance to standards 9.41 1.53 7.95 2.18Packaging 8.81 1.43 8 2.01Flexibility 8.7 1.63 7.5 1.98Capacity to develop new products 8.55 1.97 7.62 1.9Capacity to modify products 8.62 1.67 7.86 1.83Process innovation capacity 8.57 1.55 7.71 1.68Financial stability 8.72 1.72 8.38 1.76Offering of credit facilities 7.34 2.68 7.51 2.25Location 6.84 2.52 6.68 2.31
Whilst the automotive component manufacturers over-rate their own performancerelative to customer perceptions of their performance levels, it is striking to note thatthe automotive component manufacturers were very accurate in their self-assessmentof customer performance requirements. This is highlighted in Figure 15. The onlyareas where the component manufacturers failed to adequately gauge the importanceof their customers’ performance criteria related to the lesser important performancecriteria of packaging, flexibility, innovation capacity, etc. As highlighted in Table 8these are moreover the areas where customer requirements are relatively dispersed.
Figure 15.
Automotive component manufacturers' perceived customer needs versus their major customers' actual needs
4
5
6
7
8
9
10Quality
Price
Delivery reliability
Conformance to standards
Packaging
Flexibility
Capacity to develop new products
Capacity to modify products
Process innovation capacity
Financial stability
Offering of credit facilities
Location
Component suppliers' perceived customer needs (n=14)
Customers' actual needs (n=58)

29
Whilst there are significantly larger gaps between customer requirements andautomotive component manufacturer performance levels than perceived by theautomotive component manufacturers themselves, which is a cause for some concernfor industry stakeholders, the overall findings from the customer perception surveyare not too disconcerting. Although automotive component manufacturers generallyover-rate their own performance relative to customer requirements and are notmeeting their customers’ key performance criteria, they appear to be largely cognisantof the critical success factors in the automotive market and the weightingsapportioned to these criteria by their customers.
A disaggregation of the customer perception findings according to type of market andownership reveals some interesting dissimilarities between customer perceptions oftheir automotive component suppliers’ capability levels. It is therefore important toconsider these findings.
3.4. OEM, OES/IAM and “Other automotive componentmanufacturer” customer perceptions of automotive componentmanufacturer performance levelsAs highlighted in Section 1, South African automotive component production feedsinto a number of different domestic automotive markets. The customer surveysundertaken for the KwaZulu-Natal and Eastern Cape Benchmarking Club membersillustrated this, with production feeding into the domestic OEM and OES markets, aswell as the independent aftermarket and other automotive component manufacturers.For the purposes of analysis the total customer population was divided in terms ofthree market categories, with the description of the findings presented below based onthese market categories.
3.4.1. OEM customer perceptions: The domestic OEM customer perceptions of theautomotive component manufacturers’ performance were rather consistent with theaggregated findings generated. This is highlighted in Figure 16, with their four keyperformance requirements in order of importance being quality, conformance tostandards, delivery reliability and price, with packaging also receiving an averagerequirement rating of over 9. All other performance requirements received averageratings of between 8 and 9, with the exception of geographical location and theoffering of credit facilities, which received importance ratings of between 7 and 8. Asrevealed in Figure 17, it was for these two requirements that the OEMs believed theautomotive component manufacturers came closest to meeting their performancerequirements. Substantial gaps were recorded for all the other criteria. Performancegaps were largest for the four most important performance criteria, with quality andprice ratings of automotive component manufacturer performance levels particularlysevere.

30
Figure 16.
Domestic OEM customer requirements and their perceptions of auto component firm performance (n=27)
4
5
6
7
8
9
10Quality
Price
Delivery reliability
Conformance to standards
Packaging
Flexibility
Capacity to develop new products
Capacity to modify products
Process innovation capacity
Financial stability
Offering of credit facilities
Location
Domestic OEM requirements OEM ratings of firm performance
Figure 17.
Gap analysis of domestic OEM customer requirements and their ratings of auto component firm performance (n=27)
19.94
20.13
16.70
17.65
12.18
13.03
12.83
10.25
10.31
9.65
4.30
7.45
0 5 10 15 20 25
Quality
Price
Delivery reliability
Conformance to standards
Packaging
Flexibility
Capacity to develop new products
Capacity to modify products
Process innovation capacity
Financial stability
Offering of credit facilities
Location
Percent (%)
Gap between requirements and performance ratings
3.4.2. OES/IAM customer requirements: The OES/IAM customers differed quitesubstantially from the OEM customers in their assessment of the automotivecomponent manufacturers’ performance levels relative to their requirements. Whilstthe key performance criteria remain the same (Figure 18), as highlighted in Figure 19,the biggest problem these customers have with the component manufacturers is theirpoor delivery reliability and flexibility.

31
Qualitative interviews at the automotive component manufacturers offered an insightinto the reasons for the very poor performance ratings for these two criteria. Theautomotive component manufacturers are apparently very aware of the penaltiesassociated with the stopping of OEM assembly lines and as such ensure that theirOEM customers receive preferential treatment in terms of supply. Production runs forOES/IAM components will be broken into in order to produce OEM components thatare required urgently, but the opposite will not occur, even when the OES/IAMcomponent is the more financially lucrative to manufacture.
Component manufacturers will also sometimes delay aftermarket production untiladequate volume has been demanded. Due to their production organisation manycomponent manufacturers will not manufacture below a certain batch quantity, thuslimiting their response time to OES/IAM orders (i.e. they will postpone productionuntil they have a large enough batch run to justify the manufacture of the component).
In line with the less demanding nature of the OES/IAM, less concern was revealedabout the quality/conformance to standards performance of the componentmanufacturers. Whilst the OES/IAM customers gave these two performance criteriavery high ratings they indicated that their component suppliers were not too far off theperformance standards expected of them. This differs quite significantly from theOEM customers. In addition, whilst the OEM customers were largely unhappy withthe performance of the component manufacturers across all of the criteria explored,the OES/IAM customers expressed far less concern with the componentmanufacturers’ performance in terms of the lesser important criteria. Price concernsare however very similar between the two different market segments.
Figure 18.
Domestic OES/IAM customer requirements and their perceptions of auto component performance (n=15)
4
5
6
7
8
9
10Quality
Price
Delivery reliability
Conformance to standards
Packaging
Flexibility
Capacity to develop new products
Capacity to modify products
Process innovation capacity
Financial stability
Offering of credit facilities
Location
Domestic OES/IAM requirements Domestic OES/IAM ratings of firm performance

32
Figure 19.Gap analysis of OES/IAM customer requirements and their perceptions of auto
component firm performance (n=15)
12.95
18.15
25.73
7.13
8.28
24.73
7.37
5.65
3.96
3.00
-0.92
-14.05
0 5 10 15 20 25 30
Quality
Price
Delivery reliability
Conformance to standards
Packaging
Flexibility
Capacity to develop new products
Capacity to modify products
Process innovation capacity
Financial stability
Offering of credit facilities
Location
Percent (%)
Gap between requirements and performance ratings
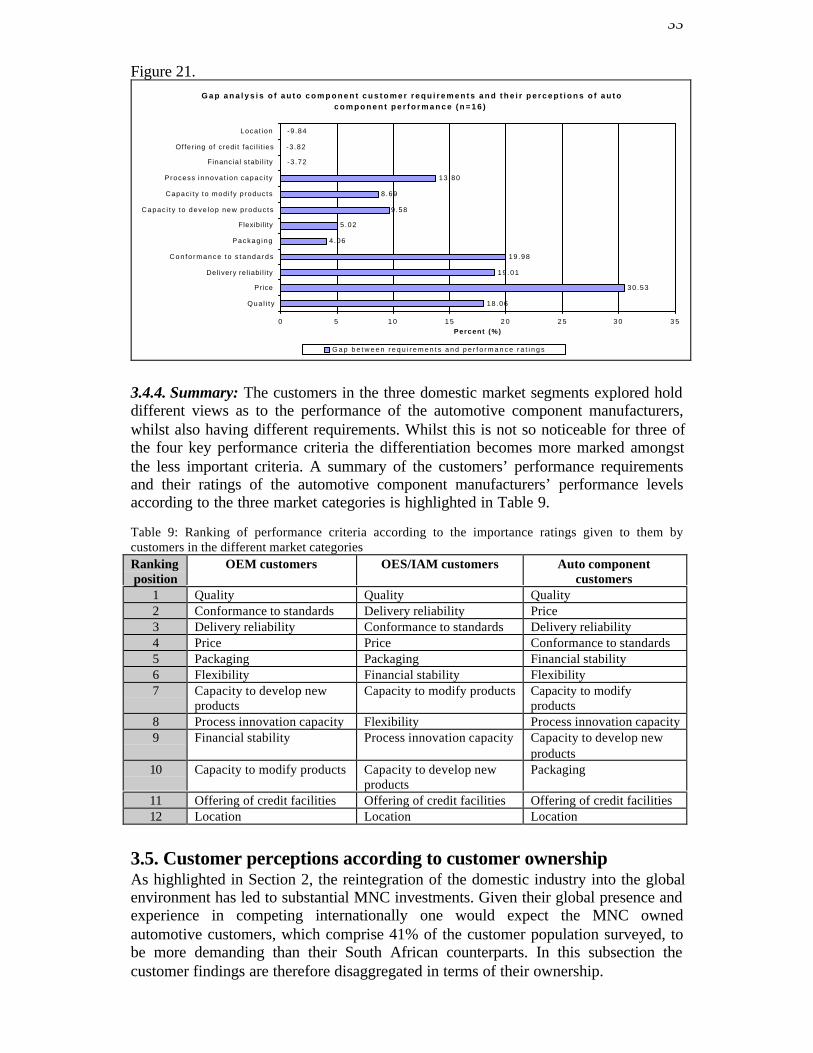
3.4.3. Other automotive component manufacturer perceptions: The most importantperformance requirements of the other automotive component manufacturers suppliedby the Club members was quality and price, followed by delivery reliability andconformance to standards (Figure 20). The increased focus on price by thesecustomers is unsurprising given the fact that the majority feed their production intothe domestic OEMs and as such are under an enormous amount of cost-downpressure, hence the focus on price. This is further reflected by their assessment of theautomotive component manufacturers’ price performance. Interestingly, the autocomponent customers are also particularly severe on the automotive componentmanufacturers in terms of their quality, conformance to standards and deliveryreliability, while expressing a degree of satisfaction with their performance in terms ofmost of their lesser important requirements.
Figure 20.
Domestic component manufacturer customer requirements and their perceptions of auto component firm performance (n=16)
4
5
6
7
8
9
10Quality
Price
Delivery reliability
Conformance to standards
Packaging
Flexibility
Capacity to develop new products
Capacity to modify products
Process innovation capacity
Financial stability
Offering of credit facilities
Location
Component manuf. requirements Component manuf. ratings
33
Figure 21.G a p a n a l y s i s o f a u t o c o m p o n e n t c u s t o m e r r e q u i r e m e n t s a n d t h e i r p e r c e p t i o n s o f a u t o
c o m p o n e n t p e r f o r m a n c e ( n = 1 6 )
18 .06
30 .53
19 .01
19 .98
4.06
5.02
9.58
8.69
13 .80
-3 .72
-3 .82
-9 .84
0 5 1 0 1 5 2 0 2 5 3 0 3 5
Qua l i t y
Price
Del ivery rel iabi l i ty
C o n f o r m a n c e t o s t a n d a r d s
Packag ing
Flexibil i ty
Capac i t y t o deve lop new p roduc ts
Capac i ty to mod i fy p roduc ts
Process innova t ion capac i t y
Financial stabi l i ty
Offer ing of credi t faci l i t ies
Locat ion
Percent (%)
G a p b e t w e e n r e q u i r e m e n t s a n d p e r f o r m a n c e r a t i n g s
3.4.4. Summary: The customers in the three domestic market segments explored holddifferent views as to the performance of the automotive component manufacturers,whilst also having different requirements. Whilst this is not so noticeable for three ofthe four key performance criteria the differentiation becomes more marked amongstthe less important criteria. A summary of the customers’ performance requirementsand their ratings of the automotive component manufacturers’ performance levelsaccording to the three market categories is highlighted in Table 9.
Table 9: Ranking of performance criteria according to the importance ratings given to them bycustomers in the different market categoriesRankingposition
OEM customers OES/IAM customers Auto componentcustomers
1 Quality Quality Quality2 Conformance to standards Delivery reliability Price3 Delivery reliability Conformance to standards Delivery reliability4 Price Price Conformance to standards5 Packaging Packaging Financial stability6 Flexibility Financial stability Flexibility7 Capacity to develop new
productsCapacity to modify products Capacity to modify
products8 Process innovation capacity Flexibility Process innovation capacity9 Financial stability Process innovation capacity Capacity to develop new
products10 Capacity to modify products Capacity to develop new
productsPackaging
11 Offering of credit facilities Offering of credit facilities Offering of credit facilities12 Location Location Location
3.5. Customer perceptions according to customer ownershipAs highlighted in Section 2, the reintegration of the domestic industry into the globalenvironment has led to substantial MNC investments. Given their global presence andexperience in competing internationally one would expect the MNC ownedautomotive customers, which comprise 41% of the customer population surveyed, tobe more demanding than their South African counterparts. In this subsection thecustomer findings are therefore disaggregated in terms of their ownership.
34
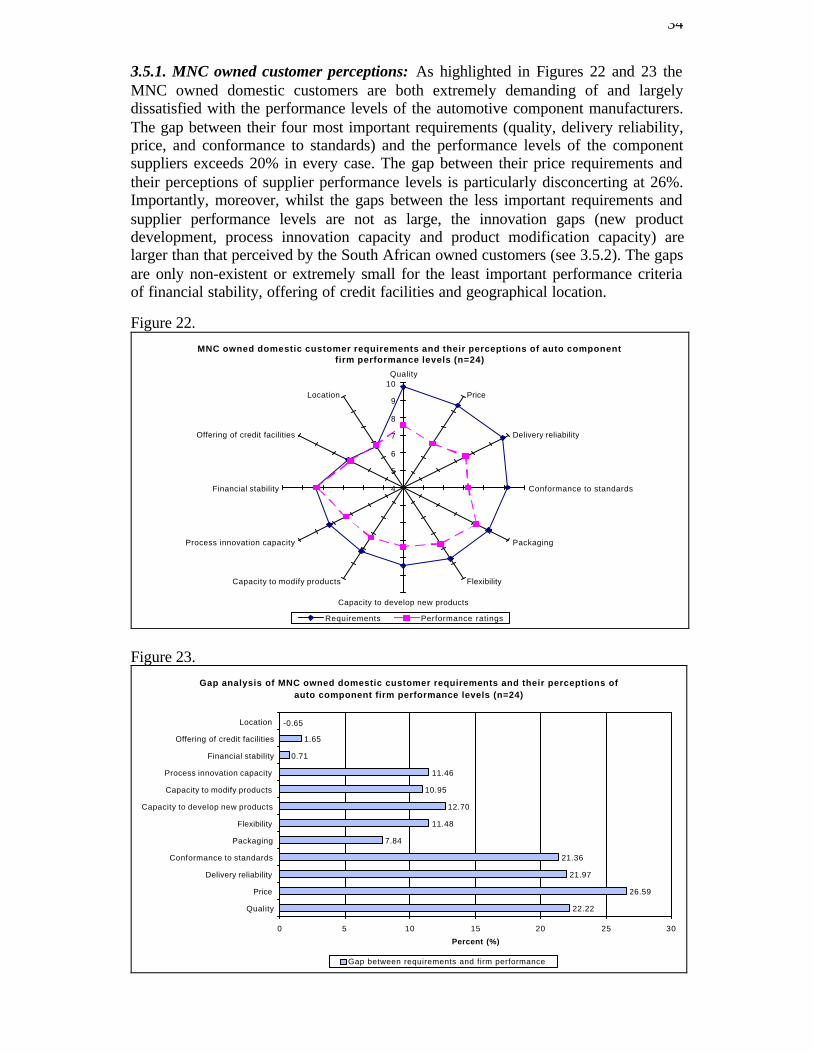
3.5.1. MNC owned customer perceptions: As highlighted in Figures 22 and 23 theMNC owned domestic customers are both extremely demanding of and largelydissatisfied with the performance levels of the automotive component manufacturers.The gap between their four most important requirements (quality, delivery reliability,price, and conformance to standards) and the performance levels of the componentsuppliers exceeds 20% in every case. The gap between their price requirements andtheir perceptions of supplier performance levels is particularly disconcerting at 26%.Importantly, moreover, whilst the gaps between the less important requirements andsupplier performance levels are not as large, the innovation gaps (new productdevelopment, process innovation capacity and product modification capacity) arelarger than that perceived by the South African owned customers (see 3.5.2). The gapsare only non-existent or extremely small for the least important performance criteriaof financial stability, offering of credit facilities and geographical location.
Figure 22.
MNC owned domestic customer requirements and their perceptions of auto component firm performance levels (n=24)
4
5
6
7
8
9
10Quality
Price
Delivery reliability
Conformance to standards
Packaging
Flexibility
Capacity to develop new products
Capacity to modify products
Process innovation capacity
Financial stability
Offering of credit facilities
Location
Requirements Performance ratings
Figure 23.
Gap analysis of MNC owned domestic customer requirements and their perceptions of auto component firm performance levels (n=24)
22.22
26.59
21.97
21.36
7.84
11.48
12.70
10.95
11.46
0.71
1.65
-0.65
0 5 10 15 20 25 30
Quality
Price
Delivery reliability
Conformance to standards
Packaging
Flexibility
Capacity to develop new products
Capacity to modify products
Process innovation capacity
Financial stability
Offering of credit facilities
Location
Percent (%)
Gap between requirements and firm performance

35
3.5.2. SA owned customer perceptions: The view that MNC owned domesticcustomers may be more demanding than their South African counterparts is borne outby the views of the South African owned customers. While the SA owned customerswere largely dissatisfied with the performance levels of the automotive componentmanufacturers the magnitude of the gaps between their performance requirements andthat of their suppliers was significantly smaller. For example, the gap betweenrequirements and supplier performance levels for the four most important criteria ofquality, conformance to standards, delivery reliability and price ranged from 11% to20%, significantly less than the 20% and higher of the MNC owned customers. Thegaps for the less important innovation performance criteria were similarly smaller inmagnitude, although the SA owned customers are less satisfied with the performanceof the component manufacturers in terms of some of their less important performancerequirements, such as flexibility and packaging.
Figure 24.
South African owned domestic customer requirements and their perceptions of supplier performance levels (n=34)
4
5
6
7
8
9
10Quality
Price
Delivery reliability
Conformance to standards
Packaging
Flexibility
Capacity to develop new products
Capacity to modify products
Process innovation capacity
Financial stability
Offering of credit facilities
Location
Requirements Performance ratings
Figure 25.Gap analysis of SA owned domestic customer requirements and their perceptions of auto
component firm performance levels (n=34)
14.37
19.70
18.07
11.68
10.15
15.42
9.64
7.49
9.06
6.44
4.34
-4.55
0.00 5.00 10.00 15.00 20.00 25.00
Quality
Price
Delivery reliability
Conformance to standards
Packaging
Flexibility
Capacity to develop new products
Capacity to modify products
Process innovation capacity
Financial stability
Offering of credit facilities
Location
Percent (%)
Gap between requirements and firm performance

36
3.5.3. Summary: The MNC owned and the South African owned customers wouldappear to hold very similar views of the automotive component manufacturers. Theonly important distinction between the two sets of customers is the magnitude of theperceived gaps between their requirements and component manufacturer performancelevels, with the MNC owned customers generally being far more critical of thecomponent manufacturers’ performance levels.
3.6. Key lessonsOne of the key lessons one can draw from the findings presented in this section of thereport relates to the increasing pressure bearing down on the automotive componentsindustry in South Africa. In support of the findings presented in Section 2, it is quiteclear that South African based automotive component manufacturers are struggling tocompete in increasingly demanding domestic automotive markets. This applies to theOEM, OES/independent aftermarket and other automotive component manufacturercustomers. Whilst there is some demand variability across market segments, with theOEM market the most demanding, as highlighted in Table 8 the weightingsapportioned to the most important performance criteria by customers are relativelyconsistent across the different automotive market segments.
Importantly, it was also highlighted that MNC-owned customers tend to be moredemanding of automotive component manufacturer performance levels relative totheir South African owned counterparts. Given the findings presented in Section 2,this poses an important set of questions for component manufacturers. As the MNCpresence in the domestic automotive industry further consolidates how intense are thecompetitiveness pressures likely to become? Will the MNC customers tolerateperformance levels that are below internationally set standards? As suggested in 3.5,these are extremely pertinent questions that are likely to become more pertinent as theMNC-owned customers of the automotive component manufacturers increase theirdominance of the domestic automotive industry.

37
CONCLUSION
The extensive data collected during the course of the various facets of the researchstudy has revealed a number of very important findings. As revealed in Section 1, theautomotive industry in South Africa is presently undergoing a number of majorstructural changes, with competitiveness issues now critical to its future survival. Thisis a result of market liberalisation and the industry’s rapid reintegration into the globalautomotive operating environment. As also revealed in Section 1, the most importantmarket for domestic automotive component manufacturers remains the South AfricanOEM market, a market which is presently undergoing profound transformation, whilststagnating in terms of absolute levels of output.
In order to ascertain the extent, as well as the intensity at which the domestic OEMmarket was changing for automotive component manufacturers, all of the OEMs inSouth Africa were visited. This was done to gain an impression of their viewspertaining to their domestic automotive component suppliers. The OEMs were alsoleft with a detailed perception questionnaire that was to be completed as a mechanismfor quantifying their views of the South African automotive components industry, aswell as their procurement changes over the last two years. This was undertaken as afollow up to a similarly constituted study undertaken in 1998. The information fromthe seven qualitative interviews that were undertaken and the five OEM procurementquestionnaires that were completed formed the content of Section 2. As revealed inSection 2, three key interlinked findings emerged from this component of theresearch:
(1) OEMs are still largely dissatisfied with the performance of their South Africanbased component suppliers, although absolute levels of dissatisfaction are verysimilar to the levels recorded in 1998,
(2) OEMs are increasingly sourcing their major components from MNC ownedsuppliers and
(3) South African technology is increasingly being squeezed out of the domesticOEMs’ supply chains.
These three findings are unsurprising and were projected in the IRP’s 1998 analysis ofdomestic OEM procurement shifts in South Africa (Barnes and Kaplinsky 1998).Importantly, however, the follow-up research that was undertaken for this studyquantified these shifts, thus concretely highlighting both their intensity and exactmagnitude. These were important weaknesses in the 1998 study.
The customer perception survey that was carried out as part of the overall study alsorevealed a number of important findings, as revealed in Section 3. In support of (andin addition to) the more general findings presented in Section 2, the findings from the58 domestic customer surveys that were undertaken revealed the enormous pressurebeing placed on the automotive components industry in all market segments. Thefindings revealed the importance of both price and non-price factors in the differentmarket segments that were analysed, whilst also revealing the extensive pressure thatis likely to build amongst automotive component suppliers and customers as MNCdominance of the industry consolidates over the next few years.
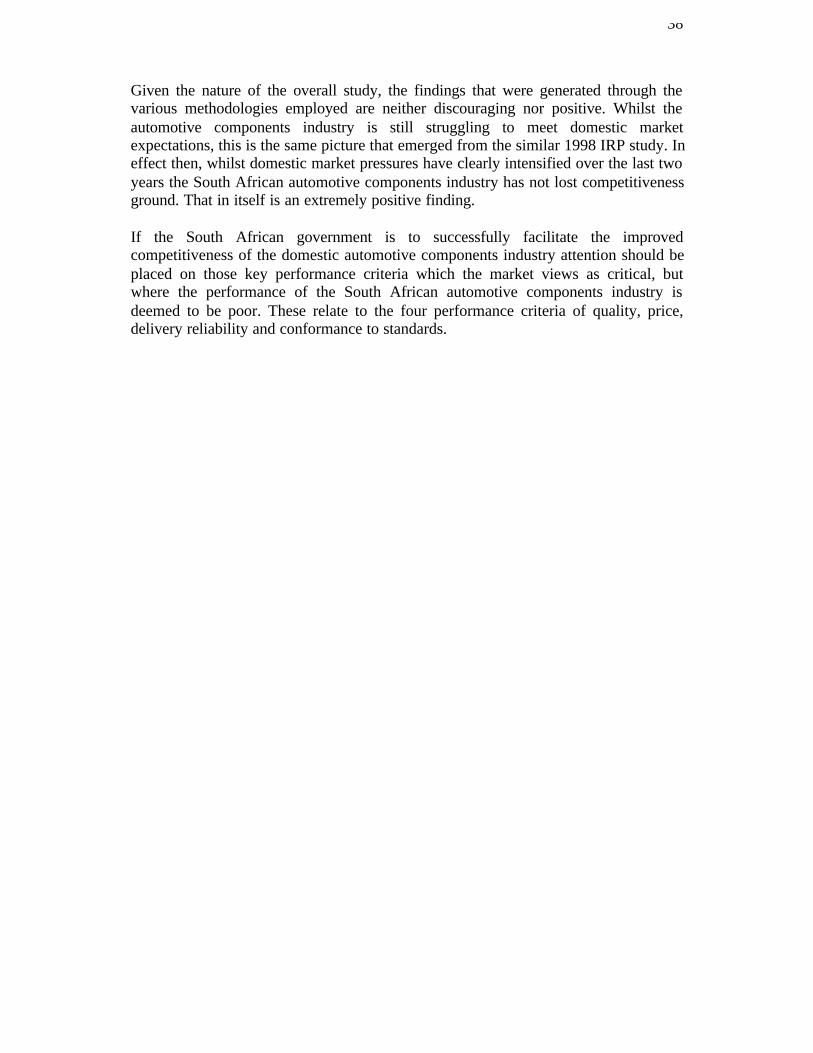
38
Given the nature of the overall study, the findings that were generated through thevarious methodologies employed are neither discouraging nor positive. Whilst theautomotive components industry is still struggling to meet domestic marketexpectations, this is the same picture that emerged from the similar 1998 IRP study. Ineffect then, whilst domestic market pressures have clearly intensified over the last twoyears the South African automotive components industry has not lost competitivenessground. That in itself is an extremely positive finding.
If the South African government is to successfully facilitate the improvedcompetitiveness of the domestic automotive components industry attention should beplaced on those key performance criteria which the market views as critical, butwhere the performance of the South African automotive components industry isdeemed to be poor. These relate to the four performance criteria of quality, price,delivery reliability and conformance to standards.
39
REFERENCES
Barnes, J. R. (2000) The competitiveness of the South African automotivecomponents industry: Findings from the 1999 follow-up study, CSDSResearch Report No. 27. Durban, Centre for Social and DevelopmentStudies, University of Natal.
Barnes, J. R. (1999) What chances international competitiveness in the South Africanautomotive components industry? Evidence from an international benchmarkundertaking, CSDS Research Report No. 20. Durban, Centre for Social andDevelopment Studies, University of Natal.
Barnes, J. (1998) Competing in the Global Economy: The Competitiveness of theSouth African Automotive Components Industry. CSDS Research ReportNo. 13 , Centre for Social and Development Studies, Durban: University ofNatal.
Barnes, J. R. (1997), Facing up to the global challenge: The state of KwaZulu-Natal’sautomotive components industry, CSDS Research Report No. 11, Durban,Centre for Social and Development Studies, University of Natal.
Barnes, J. & Kaplinsky, R. (2000a) Globalisation and Trade Policy Reform: Whitherthe Automobile Components Sector in South Africa? Competition andChange, Vol. 4, pp. 211-243.
Barnes, J. & Kaplinsky, R. (2000b) Globalisation and the death of the local firm? Theautomobile components sector in South Africa. Regional Studies(forthcoming).
Barnes, J. & Kaplinsky, R. (1998) Globalisation and the Death of the Local Firm: Theautomobile components sector in South Africa. Presented at the Trade andIndustry Policy Secretariat 1998 Annual Forum, 20-22 September 1998.Johannesburg.
Barnes, J.R & Morris, M. (2000) An analysis of the endogenous and exogenousfactors impacting on the success of the Motor Industry DevelopmentProgramme, CSDS Working Paper No. 27. Durban: Centre for Social andDevelopment Studies, University of Natal.
Department of Trade and Industry (1998) Current Developments in the AutomotiveIndustry, DTI Republic of South Africa, December 1998
Department of Trade and Industry (1999) Current Developments in the AutomotiveIndustry, DTI, Republic of South Africa, September 1999
Hill T. (1987), Manufacturing Strategy, London, Macmillan.Harrison, K. (1996) Changing SA Markets and Supply Chain Developments, KZN
IRP Clothing Industry Report, unpublished mimeo.