domestic heat distribution systems: evidence gathering
TRANSCRIPT

February 2021
DOMESTIC HEAT DISTRIBUTION SYSTEMS: EVIDENCE GATHERING Final Report BEIS Research Paper Number: 2021/015

© Crown copyright 2020
This publication is licensed under the terms of the Open Government Licence v3.0 except where otherwise stated. To view this licence, visit nationalarchives.gov.uk/doc/open-government-licence/version/3 or write to the Information Policy Team, The National Archives, Kew, London TW9 4DU, or email: [email protected].
Where we have identified any third-party copyright information you will need to obtain permission from the copyright holders concerned.
Any enquiries regarding this publication should be sent to us at: [email protected]

3
Contents
Executive summary _________________________________________________________ 6
Introduction ______________________________________________________________ 6
Methodology _____________________________________________________________ 6
Heat distribution systems in the UK housing stock ________________________________ 6
Capacities of heat distribution systems _______________________________________ 7
Conversion of heat distribution systems to low temperature sources __________________ 8
Performance of heat distribution system technologies ____________________________ 10
Summary ______________________________________________________________ 10
Introduction ______________________________________________________________ 13
Current heat distribution system technologies and practices _______________________ 14
History of heat distribution systems ________________________________________ 14
Different types of heat distribution systems and their operation ___________________ 15
Changes in physical components and installation over time ______________________ 21
Typical commissioning and maintenance practices ____________________________ 22
Methodology ______________________________________________________________ 24
Literature and market review _______________________________________________ 24
Stakeholder engagement __________________________________________________ 24
Primary data collection ____________________________________________________ 24
Preparing for the survey _________________________________________________ 24
Carrying out the survey __________________________________________________ 26
Analysing the survey results ______________________________________________ 27
Further Notes _________________________________________________________ 29
Analysis of primary data ___________________________________________________ 29
Assessment of heat distribution system oversizing _____________________________ 29
UK housing stock model ___________________________________________________ 31
Existing UK housing stock________________________________________________ 31
UK stock model of heat distribution system attributes ___________________________ 31
Discussion of project findings _________________________________________________ 33
Heat distribution systems market review ______________________________________ 33
Technical standards for heat distribution systems _____________________________ 34
Reasons for purchase and installation of components __________________________ 37
Relevant policies _______________________________________________________ 38
Heat distribution systems costs and cost projections _____________________________ 39
Heat distribution capital costs _____________________________________________ 39

4
Heat distribution systems in the UK housing stock _______________________________ 40
Prevalence of different types of heating system _______________________________ 40
Capacities of current heat distribution systems ________________________________ 43
Suitability of the UK housing stock for conversion to low temperature heat sources ___ 50
Regional and age profiles of heat distribution systems __________________________ 52
Performance of heat distribution system technologies ____________________________ 54
Inefficiencies of heat distribution systems ____________________________________ 54
Technical factors determining the performance of heat distribution systems _________ 55
Change in the performance of the system over time ____________________________ 56
Conversion of Heat Distribution Systems to low Temperature heat sources ___________ 56
Suitability of other technologies for low temperature heating _____________________ 59
Prior policy suggestions _________________________________________________ 59
Actions and products for improved performance ________________________________ 60
Performance enhancing actions ___________________________________________ 60
Performance enhancing products for preventing sludge and limescale build up _______ 62
Performance enhancing measures to improve radiator output ____________________ 64
Performance enhancing measures to prevent waste heat _______________________ 65
Further innovations _____________________________________________________ 67
Evaluation of performance enhancing measures ______________________________ 68
Conclusions ______________________________________________________________ 69
Heat distribution systems in the UK ________________________________________ 69
Design, commissioning, and installation of heat distribution systems _______________ 69
The market for heat distribution systems ____________________________________ 69
Inefficiencies of heat distribution systems and performance enhancing measures _____ 69
Capacities of heat distribution systems and suitability of the UK housing stock for low temperature heat sources. _______________________________________________ 70
Appendices ______________________________________________________________ 71
1 Radiator Data Bins______________________________________________________ 71
2 Housing survey data corrections ___________________________________________ 72
3 Correlations used for mapping to UK housing stock ____________________________ 73
Oversizing factor _______________________________________________________ 73
Heat demand per square metre of floor area _________________________________ 75
Presence of a magnetic filter ______________________________________________ 77
Limescale inhibitor _____________________________________________________ 79
Use of thermostatic radiator valves _________________________________________ 80
The presence of an annual service _________________________________________ 81
4 Survey Questions ______________________________________________________ 82

5
5 Radiator photographs ___________________________________________________ 84

Heat distribution systems evidence gathering: Executive summary
6
Executive summary
Introduction
Meeting the UK’s legally binding carbon emissions reduction goals will require deep decarbonisation of all sectors of energy use, including the energy used to heat our buildings. Many low carbon heating options including heat pumps and heat networks operate more efficiently at low temperatures, and are most efficient at 45°C or less, versus the 60-70°C that fossil fuel boilers typically operate at1. To meet thermal comfort a reduction in the supply temperature within the home could require a change in the heat distribution system. There is significant uncertainty on the characteristics of heat distribution systems installed across the UK and the implications in terms of cost and disruption of a widespread transition to low temperature heating. This study aims to fill gaps in the current evidence base and focuses on two key areas: the state of heat distribution systems in the UK housing stock and the measures that could be taken to improve these systems.
Methodology
Three main sources of evidence gathering were used for this project; a literature review, stakeholder engagement and primary data collection in dwellings. Relevant literature around heat distribution systems was gathered and analysed and a broad range of stakeholders were consulted, including from industry associations, accredited testing facilities, manufacturers, distributors, installers, and house builders.
Primary data collection took place in 515 domestic properties in the UK. An accredited Energy Performance Certificate assessor completed a survey of each property’s heat distribution system while carrying out their Reduced data Standard Assessment Procedure (RdSAP) assessments for an EPC. This allows for a calculation of the “oversizing factor” of a dwelling’s heat distribution system, defined by the rated thermal output of the radiators in a dwelling divided by the peak steady state heat demand (kW) for the same dwelling. From UK housing stock data2, a full stock of dwellings in the UK with wet central heating systems has been created, and information gathered about heat distribution systems from the primary surveys is mapped across this.
Heat distribution systems in the UK housing stock
- 95% of dwellings in the UK have central heating, with 83% of homes’ central heating powered by the gas grid2.
1 Operating conventional gas condensing boilers at lower flow and return temperatures will increase their efficiency. So some results of this study are also relevant to improving the performance of existing systems. 2 English Housing Survey 2016: Housing Stock Data, the Scottish Household Survey, 2015-17, the Welsh Housing Conditions Survey 2017-18, and the Northern Ireland House Condition Survey, 2016

Heat distribution systems evidence gathering: Executive summary
7
- 90% of dwellings use wet heating systems with a boiler and radiators, although a smallbut increasing number of these dwellings use underfloor heating2.
- 1.4% of dwellings in the project sample surveyed had underfloor heating, whereasunderfloor heating makes up 4% of the combined radiator and underfloor heatingmarket, and its market share is growing3.
Capacities of heat distribution systems
The capacity of a heat distribution system relates to the amount of useful heat that it can provide to a dwelling. In practice all dwellings require different amounts of heat, so the capacity of the heat distribution system in this study is characterised by an “oversizing factor”, defined as the ratio of the rated output of the radiators4 in a dwelling to the peak steady state thermal demand (kW) of that dwelling. The oversizing describes the relative ability of the heat distribution system, to meet the steady state thermal demand (kW) of the property. The distribution of oversizing in the survey results is shown Figure 1 below.
Undersized Oversized
Figure 1 - The distribution of oversizing in the sample of UK dwellings.
There is some uncertainty in the calculation of the oversizing of each dwelling. Firstly, radiators are not expected to perform at the rated output suggested by their manufacturer; in this study a 10% decrease in radiator performance is assumed as a significant but not extreme decrease. Secondly, there is significant uncertainty in the calculation of the SAP heat loss coefficient, and studies have suggested that the heat loss coefficient of dwellings is 45% larger than that calculated by SAP when measured in a coheating test5. The impact of these uncertainties on the ability to provide thermal comfort at a range of flow temperatures is shown below.
3 BSRIA World Radiators and Underfloor Heating – UK, BSRIA, 2018 4 At standard conditions of 75°C flow 65°C return, 20°C room temperature. 5 Magnitude and extent of building fabric thermal performance gap in UK low energy housing, 2018, Gupta and Kotopouleas, https://www.sciencedirect.com/science/article/pii/S0306261918304343

Heat distribution systems evidence gathering: Executive summary
8
Conversion of heat distribution systems to low temperature sources
Many low carbon methods for providing space heating are designed to deliver heat at lower temperatures (for example in the range 35-60°C) than conventional fossil fuel boilers, which can provide heat in excess of 80°C6. This can be a barrier to uptake of low carbon heating technologies if the existing heat distribution system in a property is not capable of providing enough thermal output when operating at the lower temperature. Usual practice is that the heat emitters in a property are replaced with significantly larger ones when switching to operate at a lower flow temperature.
The UK stock model developed for this study gives the distribution of the oversizing of dwellings’ radiators relative to their peak heat demand (kW) for the whole UK. It uses data from the sample of the UK stock surveyed for this project mapped to the full UK stock of wet heat distribution systems. The model results relating to the flow temperature that could be used in different proportions of the housing stock are shown in Figure 2. It shows that 10% of dwellings in the UK are already suitable, on a peak winter day, for heat pumps with a 55°C flow temperature with no changes to their heat distribution systems; only 1% are suitable for a heat pump with a flow temperature of 45°C. However, when considering reductions in radiator performance over time or additional heat demand above what is calculated by SAP these figures are significantly reduced.
Another consideration for the conversion to low temperature heating is operation during an average winter day rather than the peak day. Assuming the average temperature for the coldest winter month rather than that for the peak day, the proportion of dwellings able to provide comfort at lower flow temperatures increases, as shown in Figure 3. The results suggest that 53% of dwellings can be heated with a 55°C flow temperature with no changes in their heat emitters or flow rates for most of the heating season. Provided that the heat pump is able meet the maximum required flow temperature for the peak heat demand (kW), the flow temperature could be reduced for much of the heating season, thereby increasing the overall efficiency; given that many modern heat pumps can operate with variable flow temperature7,8.
Further, these results suggest that there is an opportunity for hybrid heat pumps, or heat pumps with additional heat sources such as electric fan heaters9, to be used with no changes to heat distribution systems, with the heat pump providing the vast majority of the annual heating demand (kWh), across a relatively large portion of the housing stock.
6 Conventional condensing boilers are also more efficient when operating at lower temperatures, so a reduction in flow temperature also benefits dwellings with these installed. 7 https://www.dimplex.co.uk/product/9kw-high-temperature-domestic-ground-source-heat-pump-sih9me 8 https://library.mitsubishielectric.co.uk/pdf/download_full/751 9 The use of lower efficiency electric fan heaters rather than heat pumps would create a larger load on the electricity network and the lower efficiency could result in more expensive heating for the resident.

Heat distribution systems evidence gathering: Executive summary
9
Figure 2- Proportion of UK dwellings, with wet central heating systems, that could meet peak heat demand (kW) at each flow temperature. (Average temperature across sample for the peak is -3.5°C. Error bars give 95% statistical confidence interval.
Figure 3 - The proportion of UK dwellings, with wet central heating systems, that could meet heat demand (kW) on a typical winter day at each flow temperature. (Average temperature across sample is 4.7°C, error bars give the 95% confidence interval)
Heat distribution systems evidence gathering: Executive summary
10
Performance of heat distribution system technologies
The main inefficiencies of heat distribution systems are poor hydraulic balancing, which can reduce performance by 10%10,11; the build-up of sludge which can reduce efficiency by 15%12; air which can reduce the system performance by 6%13; or limescale which can reduce the efficiency by 15%14. These reduce system performance significantly and can prevent the system from providing thermal comfort. Following best practice for the installation, commissioning, and maintenance of heat distribution systems will allow the heating system to perform to the specifications set out by the manufacturer. However little information is available to support how closely systems perform to their rated output.
In wet central heating systems, performance enhancing measures and maintenance can improve the lifetime of the system, increase the output of radiators relative to standard conditions, and/or reduce the heat wasted in the system.
Performance enhancing actions that can be taken to maintain the system include hydraulic balancing, power flushing of the system, manual flushing of radiators and radiator bleeding. Products available to reduce the build-up of air, sludge and limescale include corrosion inhibitors, water softeners and limescale reducers, magnetic filters and de-aerators. Products that can improve the output of radiators include radiator fans, heat transfer modifiers, high performance radiators. Products that can reduce the heat wasted by the system include thermostatic radiator valves, radiator reflectors, heat recovery systems and self-balancing radiators.
There is robust evidence around the benefits of some performance enhancing actions and products although for others this is lacking. The products designed to reduce air, sludge and limescale are thought to be useful for maintaining the system performance. In addition, there is robust evidence that thermostatic radiator valves can give energy savings of 3% in real dwellings and that radiator fans can increase the thermal output of radiators by 14%-19% in laboratory tests. There is still a significant gap in the evidence base around how these measures will impact performance in real systems in dwellings, and the evidence base for all measures could be increased by additional in situ testing.
Summary
History of Heat Distribution Systems
- 90% of dwellings in the UK have wet heating systems with radiators
- Steel panel radiators have always dominated the central heating market due to their low cost and reliability, and no major shift away from their use is expected.
10 BEIS, Heat in Buildings: Boiler Plus, October 2017 11 Sustainable energy association heating system plus, August 2015 12 https://www.eua.org.uk/uploads/5A8D4F9A4E161.pdf 13 https://www.installeronline.co.uk/deaeration-maximise-heating-system-efficiency/ 14 https://www.viessmann.co.uk/heating-advice/how-to-prevent-limescale-in-boilers

Heat distribution systems evidence gathering: Executive summary
11
- Underfloor heating only made up 4% of the combined radiator and underfloor heating market in 2018.
- The design and commissioning of heat distribution systems has changed relatively little over time.
Performance and Maintenance of Heat Distribution Systems
- Heat distribution systems are rarely hydraulically balanced and are often significantly oversized.
- An annual service of the heat distribution system should be standard practice, but only 20% of dwellings undertake this.
- The main inefficiencies of heat distribution systems are poor hydraulic balancing, which can reduce performance by 10%15 16; the build-up of sludge which can reduce performance by 15%17; air which reduces the system performance by 6%18; or limescale which can reduce the performance by 15%.
- Proper maintenance and commissioning of the system can eliminate or significantly reduce these issues.
- The performance enhancing measures with the most robust evidence base around their use are thermostatic radiator valves, giving a 3% energy saving. There is some evidence that other measures improve performance, but further trials and testing of these are required to verify this.
Suitability of Existing Heat Distribution Systems for Low Temperature Heating
- Oversizing is a measure of the rated output of the radiators in the dwelling divided by the calculated heat loss of a dwelling. The heat distribution systems in the sample of properties surveyed have a mean oversizing of 1.46 with a median of 1.3, but there is a large spread with many properties significantly under or oversized.
- In the baseline case 10% of UK dwellings could meet heat demand (kW) with a 55°C flow temperature and 1% at 45°C on a peak heating day.
- On an average winter day, 53% of dwellings could use a 55°C flow temperature, and 6% could use a 45°C flow temperature, with no changes to their heat emitters or flow rates.
- When including a possible decrease in radiator performance over time and an increase in the heat demand (kW) relative to the calculated demand the proportions of dwellings which can be heated at low temperature is substantially reduced. Further work to better understand and quantify this uncertainty has been suggested to BEIS.
- These results are significant, since they help to quantify the number of dwellings for which changes are required to the heat distribution system when a low temperature heat source is installed. They suggest a significant opportunity for hybrid systems to be used to significantly reduce emissions without making any disruptive changes to heat emitters. Further work is needed to verify these results in relation to the ‘real’ output of
15 BEIS, Heat in Buildings: Boiler Plus, October 2017 16 Sustainable energy association heating system plus, August 2015 17 https://www.eua.org.uk/uploads/5A8D4F9A4E161.pdf 18 https://www.installeronline.co.uk/deaeration-maximise-heating-system-efficiency/

Heat distribution systems evidence gathering: Executive summary
12
systems compared to their rated output and the true heat demand (kW) of occupied properties.

13
Introduction
Meeting the UK’s legally binding carbon emissions reduction targets will require deep decarbonisation of all sectors of energy use, including the energy used to heat our buildings. BEIS is undertaking an extensive programme of research into the technical, economic and consumer impacts of the various options for decarbonisation of heating, including approaches based on electrification of heat, decarbonisation of gas for heating, and hybrid gas-electric approaches.
A domestic heat distribution system is the equipment and technology used to distribute heat throughout a domestic building, excluding the heat source itself. It includes heat emitters, pipes pumps and valves. The heat source, heating controls, thermal storage and domestic hot water are not considered part of the heat distribution system.
Many low carbon heating options including heat pumps and heat networks operate more efficiently at low temperatures, and favour supply of heat within the home at around 45°C or less, versus the 60-70°C more typical in conventional domestic heating systems. Conventional condensing boilers can also function at a higher efficiency at lower temperatures. A reduction in the supply temperature within the home could require a change in the heat distribution system, unless accompanied by energy efficiency improvements.
While a substantial amount of research has been undertaken on the various low carbon heat sources, there is significant uncertainty on the characteristics of heat distribution systems installed across the UK and, therefore, the implications in terms of cost and disruption of any transition to low temperature heating.
There has also been a gap in the evidence base on the contribution of heat distribution systems themselves to system efficiency losses, and on the efficacy of measures to improve their performance, including cleaning, flushing and filtration, inclusion of additives, improved emitter design and others.
BEIS has commissioned this study to address these information gaps, and to develop a more robust evidence base on domestic heat distribution systems, including an assessment of the systems currently installed across the UK stock, how well they perform, how often they are replaced, how they could be improved and how these factors impact on the cost and viability of decarbonising heat.
Element Energy and Ricardo Energy & Environment, working as a partnership, were commissioned to undertake this project. A limited number of prior studies have been carried out on the topic of domestic heat distribution systems, and most had a focus on a different aspect of the heating system. This study is the first to focus exclusively on domestic heat distributions systems in the UK.
This report first describes current heat distribution systems in the UK, it then discusses the methods used during the project for primary data collection, analysis of this data, and the creation of a UK stock model for heat distribution systems. The project findings are then discussed and conclusions drawn.

14
Current heat distribution system technologies and practices
History of heat distribution systems
Before the widespread uptake of central heating, homes were predominantly heated with coal fires19. Early attempts at creating radiators and central heating did so with steam, however these had limited success and the first water radiators in the UK were produced in the 1840s, with the first “modern” radiators produced in the 1870s20. Early central heating systems involved large bore pipes and were driven by gravity. The invention of small-bore central heating in the 1950s, with quiet pumps, led to an expansion in the uptake of central heating.
The discovery of natural gas in the North Sea in the 1960s catalysed the expansion of gas central heating and there is currently a very high prevalence of gas central heating in the UK. In 2017, 85% of homes in England were heated by gas and 80% of Scottish homes where heated by gas, in 2018 82% of houses in Wales were heated by gas. There is a lower prevalence of gas central heating in Northern Ireland, in 2016 22% of dwellings in Northern Ireland were heated by gas.
In the 1960s and 70s it was normal to heat a dwelling using a combination of different technologies such as gas fires and storage heaters as it took time for the whole house to be connected to the central heating system. As the methods of heating houses changed so did the usage of different rooms, for example the living room became used much more after a radiator was installed in it to provide heat21. This meant that by the 1980s central heating became regarded as a basic requirement.
Studies have shown that since the introduction of central heating consumers have been heating their homes to increasingly higher temperatures than in the past. Between 1978 and 1996 the average temperature of a bedroom increased by 3.3°C and in 2014 houses were at least 4°C warmer on average than they were in 1970 22,23. A study by Delta Energy & Environment in 2018 suggested that the most common temperature for residents to heat their homes to was 20-21°C24.
Before the widespread adoption of the internet, heat load calculations for radiator and pipe sizing were done manually or using a Mear Calculator slide rule. These established a room’s heat load which would need to be met by installing a sufficiently sized radiator. Usually, on installation, a margin of error is included to ensure that the radiator can meet the heat demand (kW) of the room. The Mear calculator adds in a 10% margin automatically25, but installers doing manual calculations may add in their own margin. Analysis of older Mear calculators shows that the temperature used to calculate the heat demand (kW) of the living areas of homes increased from 18°C to 21°C from the 1970s to the 1990s.
Another trend in heat distribution systems has been related to the insulation of homes. Very early heat distribution systems were designed to have a very high thermal mass and radiators
19 Hanmer, Clare and Abram, Simone (2017) 'Actors, networks, and translation hubs : gas central heating as a rapid socio-technical transition in the United Kingdom.', Energy research social science., 34 . pp. 176-183. 20 https://www.designerradiatorsdirect.co.uk/blog/a-complete-history-of-radiators/ 21 Pathways to central heating: insights and lessons from past transitions, Demand Centre, Lancaster University 22 Historic Variations in Winter House Temperatures, Indoor Built Environ 2013;22:360–375 23 https://www.telegraph.co.uk/finance/personalfinance/household-bills/10603400/Homes-heated-at-least-4C-warmer-than-in-1970-study-finds.html 24 Focus Report: Functionality and performance of heating systems, 2018, Delta Energy & Environment 25 Mear calculator Model No. 9 metric

15
had a high-water content, this meant that in poorly insulated spaces, heat could be produced for a long period of time thus keeping them warm. Current buildings have much higher levels of insulation and so less energy is needed to maintain a constant temperature. As a result, there is a trend towards low thermal mass radiators which can adjust very rapidly to changes in the room temperature so that they only deliver heat when required; this can improve the efficiency of the heat distribution system in cases where the heat source is not operating continuously26.
Different types of heat distribution systems and their operation
Heat distribution systems are required to meet or exceed the heat demand for a house to provide thermal comfort to its occupants. The demand for heat in dwellings in the UK housing stock varies considerably. In older homes the heat demand can be as high as 250𝑊/𝑚2,
however in well insulated homes it can be lower than 10𝑊/𝑚2. A variety of types and sizes of heat distribution system are available to meet this wide range of heat demands.
Hot water systems
There are two main types of central heating system installed in the UK housing stock: vented and sealed. Vented systems tend to be older and were commonly installed until the invention of the combi boiler in the 1980s27.
Vented systems have a boiler which heats water, usually to ~70°C; a pump; a motorised valve, which directs water to either the space heating system, or to the coil heat exchanger of a hot water cylinder; a header tank; and radiators which provide the space heating.
Sealed systems are very similar to vented but are closed off from the atmosphere. Instead of having a header tank, they have a closed expansion vessel allowing the water to expand and contract. They may also have a pressure gauge and purge points.
Combination systems have a combination boiler, which produces hot water on demand for space heating and domestic hot water, are sealed contain the expansion vessel and pump inside the boiler28.
It is usual, especially in larger homes, for central heating systems to be divided into zones, each with its own pipes from a manifold or zone valve. Zones each have their own temperature control giving greater flexibility for temperature control in different parts of the dwelling. Installation of these systems such that each radiator is independent can take 40% less time since there are fewer joints required29.
Heat emitters
A radiator is a heat emitter which warms a room by convection when hot water flows through it30. As hot water is pumped through the radiator it warms the metal, which then warms the air next to the radiator causing it to rise and heat the room by convection. Radiators are typically made from steel, although there is a small market for cast iron and aluminium high-performance radiators.
26 Jaga low H2O heat emitters energy efficiency study, November 2006, Carbon Trust 27 https://www.theheatinghub.co.uk/open-vented-sealed-central-heating-systems 28http://www.aphc.co.uk/UNDERSTANDING%20CENTRAL%20HEATING%20SYSTEMS%20Dec13.pdf 29 http://emmeti.co.uk/articles/the-use-of-manifolds-in-domestic-heating-systems/ 30 Radiators also produce some radiative heat, but most of the heat they produce is delivered by convection.

16
There are several main types of radiator:
Panel radiators
The most common type of radiators are panel radiators, these are made from two steel sheets welded together with water in between. Double and triple panel radiators have multiple panels attached together with gaps in between. These radiators usually have convection fins welded between the panels, or to the back of a single panel to promote convective air flow. The radiators shown below are single (in Figure 5), double (in Figure 6), and triple panel (in Figure 7).
Figure 4 shows an analysis of the thermal output per unit area of standard steel panel radiators manufactured by Stelrad and Myson, two of the largest radiator brands in the UK, compared to their cost per unit area of footprint. In general, the two scale linearly, however triple panel radiators are more expensive than the other types when comparing equivalent single and double panel options31. The large range in output among double panel radiators is because some have two convectors and others only one. Information from manufacturers and suppliers of panel radiators suggests that they have a typical lifetime of around 30 years and calculations based on total sales of radiators also support this32.
Figure 4- A comparison of the price and thermal output of single double and triple panel radiators.
A comparison of the cost of radiators per kW of output compared to their size revealed that in general it is slightly more cost effective per kW to buy larger radiators, and there is little difference between cost per kW in single and double panel radiators, however equivalent triple panel radiators are in general 25% more expensive per kW.
31 https://www.plumbnation.co.uk 32 Total radiator sales (World Radiators and Underfloor Heating – UK, BSRIA, 2018) correspond to replacement of radiators by 3-4% of dwellings in each year, corresponding to a lifetime of between 24 and 34 years.
17
Figure 5 - A single panel radiator33.
Figure 6 - A double panel radiator.
Figure 7 - A triple panel radiator.
Column and designer radiators
Column radiators have arrays of vertical pipes joined at the top and bottom and are generally more expensive than panel radiators, these radiators are usually made of steel, but can also be made from cast iron. Designer radiators offer improved appearance over conventional radiators and can be custom made to fit in small spaces. They are significantly more expensive than panel radiators.
33 Photographs of the components were taken by surveyors during the data collection for the project.

18
Figure 8 - A column radiator.
Figure 9 - A designer radiator.
Towel rails
Towel rails are a type of radiator usually installed in bathrooms and are a heated towel rack. They provide heat to the bathroom as well as warming, and drying, towels. Towel rails have become much more common in recent years having previously been considered a luxury item.

19
Figure 10 - A towel rail radiator.
Aluminium radiators
Aluminium radiators make use of aluminium’s superior heat conductivity to steel to allow for much faster heating up of the radiator, lower water volumes, and high heat output when compared to similar sized steel radiators. Aluminium radiators are more expensive than steel radiators and so are either marketed as a premium designer product or as a high-performance energy saving radiator; a discussion of the energy saving abilities of high performance radiators is included in the section ‘Actions and products for improved performance’ below.
Other components
Pumps
Central heating pumps pump water around heat distribution systems and are electrically powered. Combination boilers, found in 56% of English homes in 2017, have pumps inside their case. The energy used by the pump in a typical European dwelling is 2-3% of the dwelling’s total energy use34. Oversizing of pumps can cause the efficiency of systems to be reduced. A typical central heating pump has a lifetime of 15-30 years35. There are 3 main types of pump found in central heating systems, first single speed pumps operate at a single pressure and cannot be changed, multi speed pumps operate typically at 3 different pressures, and variable speed pumps can operate at a continuous range of pressures. The installer should match the pressure produced by the pump to the flow rate required and hydraulic resistance in the system. The section Conversion of Heat Distribution Systems to low Temperature heat sources suggests that if the pump is already appropriately sized for the system then it will not be a barrier to the installation of a low temperature heat source.
34 Energy savings across EU domestic Building Stock by Optimizing Hydraulic distribution in Domestic Space heating systems, Ahern and Norton, Energy and Buildings, 2015 35 https://www.pumpsalesdirect.co.uk/blog/5-common-central-heating-pump-problems-explained/

20
Pipework
Central heating pipes are usually made of copper, but plastic pipes are also available. Plastic pipes are growing in popularity, and now make up over half of the new build market, since they are cheaper, quicker, and easier to install than copper pipes. Pipes come in several different sizes and the appropriate diameter is chosen for each circuit, or part of each circuit, to ensure that the flow velocity is not so high as to create noise in the system but is sufficiently high to allow each radiator to achieve its quoted thermal output. Central heating pipework is generally expected to last more than 30 years, however poor maintenance will decrease its lifetime.
Valves and manifolds
Radiator systems may be plumbed through a manifold or zone valve, isolating the radiators in each room or area from the other rooms or areas.
There are four main types of valve which could be installed on a radiator:
Bleed valve: These are valves on the top of the radiator which can be used to release any air that has built up on the inside, in usual circumstances these are kept closed.
Wheelhead valve: This valve is found on the inlet of some radiators, although it is more usual for new systems to have a TRV. It has a cap which can be turned to alter the valve mechanism, allowing for manual control of radiators.
Thermostatic Radiator valve (TRV): This sort of valve is usually installed on the inlet to the radiator. It contains a temperature sensitive material which expands to stop the flow through the radiator when the room temperature reaches a desired level. This means that these valves can keep a room at a constant temperature by automatically adjusting the radiator power output36. The amount of expansion required to block the valve can be manually changed by rotating the valve allowing the room temperature to be set at a range of different values. These valves have an expected lifetime of over 10 years but may need to be replaced before the radiator that they are attached to37.
Lockshield valve: These valves are usually found on the outlets of radiators and are used to change the relative flow rates through each radiator in a system. They have a cap which does not allow the valve mechanism to be turned unless it is removed preventing the valve setting from being accidentally altered.
Underfloor heating systems
Underfloor heating (UFH) is an alternative to radiators. UFH consists of a series of pipes, usually made from plastic, that are connected to a hot water source (e.g. boiler, heat pump, solar hot water) through a manifold and are laid below the floor surface38. The system is usually installed in screed under the floor, but joisted and suspended systems are also available for wooden floors. Operating water temperatures are typically around 45°C and thermal power outputs are typically around 100 W/m2 of floor area39. It is generally suggested that in well insulated houses water underfloor heating is more efficient than radiators
36 http://www.freeheatingadvice.com/articles/radiator-valves/ 37 http://www.avnir.org/documentation/book/LCAconf_andrews_2012_en.pdf 38 https://www.which.co.uk/reviews/underfloor-heating-systems/article/underfloor-heating-explained/water-underfloor-heating 39 https://www.underfloorheatingsystems.co.uk/wp-content/uploads/2016/04/UHSSINGLEROOMPACKINSTRUCTIONS.pdf

21
particularly with heat pumps which tend to operate more continuously throughout the day, although some radiator manufacturers suggest that the use of the system by residents can mean that radiators use less energy due to constant turning on and off of the system and a desire for lower response times. Underfloor heating is also generally suggested as being a good option for use with low temperature heat sources, such as heat pumps, and some studies predict that it will become the replacement for radiators in the future. However, several stakeholders consulted during the project suggested that the difficulties of installation of underfloor heating was a barrier to its widespread uptake. Underfloor heating installations are expected to last for at least 50 years after they are installed40.
Warm air systems
In a whole-house warm air system, air is warmed at the base of the house and is guided through ducts and released through grills in the floors and walls41. A pump at the top of the house collects warm air and blows it into a different room to maintain circulation. Warm air can be heated by an air to air heat pump, a ground source heat pump, gas combustion, a hot water heat exchanger, or electric resistance heating. Warm air systems are becoming increasingly unpopular and spare parts can be rare and expensive42. The English Housing Survey reports that in 2017-18 warm air systems are found in 0.5% of homes43 44. Warm air furnace systems have a typical lifetime of 15-20 years45.
Trench heating systems
Trench heating systems consist of a fan blowing air past a hot water heat exchanger and out of a grill to warm the room. The apparatus is inside a small trench, typically next to a wall or window46. These systems have the advantage that only very little water needs to be heated47. These systems are very rare in domestic buildings and none were present in the properties surveyed for this project.
Changes in physical components and installation over time
Research has shown that there has been very little change in the technology behind heat distribution systems since they first started to be installed widely in the 1980s. Steel panel radiators have always taken up most of the market, although there has been a slight trend towards double panel radiators more recently as these take up less wall area than single panel radiators with the same heat output. Stakeholders consulted during the project felt that other heat distribution technologies such as underfloor heating or warm air systems were very unlikely to challenge radiators, and there was no apparent trend towards this. For example, some homebuilders suggested that they were phasing out the installation of UFH as problems with installation had slowed down projects and increased costs.
40 https://www.underfloorheatingtradesupplies.co.uk/underfloor-heating-frequently-asked-questions 41 https://sippin.com/hvac/heating-equipment/warm-air-systems/
42 https://www.thegreenage.co.uk/warm-air-ducted-heating-vs-wet-central-heating/ 43https://www.hamworthy-heating.com/Technical-library/Manuals/Installation-operation-maintenance-manuals 44 https://www.homebuilding.co.uk/warm-air-heating-2/
45 https://homeguides.sfgate.com/long-should-central-heating-system-last-90140.html 46 http://www.dqheating.com/installation-instructions/dq_trench_heating.pdf 47 https://www.theradiatorcentre.com/blog/article/12/what-is-trench-heating

22
One change that was noted was that most new build homes do not include a hot water cylinder or space for one, this has been a trend since the widespread rollout of combi boilers in the 2000s. Older properties are much more likely to include a hot water cylinder.
Radiator sizing and the degree of oversizing was an area with little agreement amongst stakeholders consulted for this project. In general, it was felt that in new houses, especially those in large developments, radiator sizing would be quite exact as installing smaller radiators is a way for developers to reduce costs and the thermal requirements of these homes are in general well known. There was more uncertainty about the degree of oversizing in existing homes with retrofitted central heating, but in general it was agreed that radiators are oversized as plumbers consider it better to add a margin of error to ensure the radiators will be able to provide thermal comfort for the homeowner. It was suggested that since the mid-2000s it has become easier to calculate radiator sizes, using an online system rather than calculating manually, and so oversizing has decreased from ~35-40% before to ~20% after. However, other stakeholders felt that radiators were, on average, oversized by as much as a factor of 2. There was some further discussion which suggested that when radiators are replaced, they are often replaced with one the same size as the original, to avoid or reduce the required changes to the pipework. This means that if houses have had extra insulation added, or a more powerful radiator added, then the degree of oversizing will be increased.
Typical commissioning and maintenance practices
Best practice when commissioning a system involves filling the system carefully ensuring that there is no air, adding a chemical corrosion inhibitor, adding a water softener or limescale inhibitor if in a hard water area, and hydraulically balancing the system. Maintenance should involve a yearly service of the system. A service should involve checking the inhibitor level in the system, checking the radiators and pipes for air, leaks and sludge, bleeding any radiators which contain trapped air, checking the hydraulic balancing of the system and cleaning any filters that are installed. From time to time, the water in the system should be replaced and the radiators flushed either manually or with a powerflush.
Research has suggested that hydraulic balancing is not common either when systems are installed or when they are maintained. Stakeholders agreed that an inhibitor was almost always installed when a boiler was replaced as this is usually a requirement for the new boiler’s warranty. Most stakeholders suggested that the inhibitor strength was reduced over time, as radiators were taken off the wall and flushed, or through leaks. It was suggested that the inhibitor strength was lost in 70% of systems, although the rate at which the strength decreased was not clear.
Heat distribution systems should be serviced annually, and this can easily be combined with a boiler service. Most stakeholders thought that systems were in fact serviced much less frequently than this. 17% of the properties surveyed for this project had an annual service of their heat distribution system, with several others indicating that although they had an annual service of their boiler, this did not include any checks of the heat distribution system. Most of the properties used a local gas engineer to service their system, although some also used larger, UK wide companies. Very few residents knew what the servicing of the heat distribution would involve, showing a general lack of engagement with their heating systems. A Delta EE report suggested that 26% of consumers never monitor the efficiency or performance of their heating system, and 40% only check it only once a year when the boiler is serviced, it is unclear whether this check is focused on only the boiler, or if the entire distribution system is
23
checked and therefore a comparison with the data from this study is difficult48. Flats surveyed had an annual service of their heat distribution system at half of the rate of other properties (10% for flats as opposed to 19% for other dwellings within the sample).
A survey of installers of heat distribution systems shows that 35% of installers always size radiators for low temperature heating, and that 25% always carry out hydraulic balancing. However, a larger 32% never hydraulically balance systems and 8% never size radiators for low temperature heating. However, this survey had a large share of off grid installers, who are thought to have a greater knowledge of low carbon heat technologies49. Other studies have suggested that hydraulic balancing is only found in 10% of European heating systems50.
48 Functionality and performance of heating systems, Delta EE, 2018 49 BEIS installer survey 50 Energy savings across EU domestic Building Stock by Optimizing Hydraulic distribution in Domestic Space heating systems, Ahern and Norton, Energy and Buildings, 2015

24
Methodology
Literature and market review
Relevant literature sources to the deployment of heat distribution systems, the market for these, their performance and performance enhancing interventions were gathered. Although a significant number of sources relating to the installation and commissioning of heat distribution systems were readily available there were very few prior studies focusing on the stock of heat distribution systems, or the technical principals. Relevant literature from academic publications, prior government studies and consultations, industry testing reports and studies, and installer training information was reviewed, and the information extracted is included in the project results below.
Stakeholder engagement
Key stakeholders for the project were identified and invited to attend a workshop. Stakeholders who were unable to attend the workshop were consulted via bilateral phone calls and email.
In total 24 stakeholders attended the workshop, the attendees represented manufacturers, suppliers, distributers, and installers of heat distribution systems, their additives, and performance enhancing measures. Several stakeholders were also from industry associations and approved testing facilities relevant to heat distribution systems, along with house builders. The attendees were introduced to the project and split into four breakout groups which allowed time for each to deliver information to the project team. Each breakout group had a focus towards a different part of the heat distribution system (e.g. one group was made up of mostly pump manufacturers and industry associations), but all groups provided responses across the various topics. After the meeting, several stakeholders offered to collate further data relevant to the project from their contacts, and this data was communicated by email.
Primary data collection
Preparing for the survey
Primary data collection was carried out at domestic properties in England, Wales, and Scotland. This data collection was carried out to:
Obtain data and information to answer the BEIS research questions which could only be answered by such primary collection.
Obtain data and information to augment findings from other sources, where this was practicable.
The BEIS research questions were reviewed and those which could be informed by primary data collection at domestic properties were identified. The identified questions were further analysed, and specific, structured data requests were formulated and included in a data collection form, the questions can be seen in Appendix 4 Survey Questions. In order for the sample to be as representative as possible of the UK housing stock, the National Housing

25
Model (NHM) was used to determine the share of UK domestic properties falling into each of the 32 distinct combinations of domestic property type and age observed in that model51. The sample for this work was defined to reproduce the distribution of property attributes found during the English Housing Survey (EHS) 2014.
Surveys were scheduled to take place alongside Energy Performance Certificate (EPC) assessments arising for a variety of reasons. In this way the costs of collecting primary data for this project were reduced. Upcoming EPC surveys of properties were identified and those fulfilling the sample frame for this project were surveyed. There were challenges associated with this, as market transactions giving rise to EPC assessments occur at different rates for different property types. For example, flats are sold and rented out far more frequently than detached properties, making it necessary to wait much longer to fulfil the detached property quota. The effect of the COVID-19 pandemic on the availability of properties to survey has resulted in detached properties being somewhat underrepresented in the overall sample, however there is reasonable representation of all other property types and all property ages. The number of each property type and age in the achieved and target sample is shown in Table 1.
Category Value
Number in achieved sample
Number in target sample
Dwelling type
Purpose Built High Rise Flat
16 10
Purpose Built Low Rise Flat
97 79
Converted Flat
23 17
Mid-Terrace
98 97
End-Terrace
48 50
Semi-Detached
123 127
51 This derives from there being eight property types: Purpose built high rise flat, purpose built low rise flat, converted flat, mid-terrace, end-terrace, semi-detached, bungalow and detached, and four property ages: pre-1919, 1919-64, 1965-90 and post 1990.
26
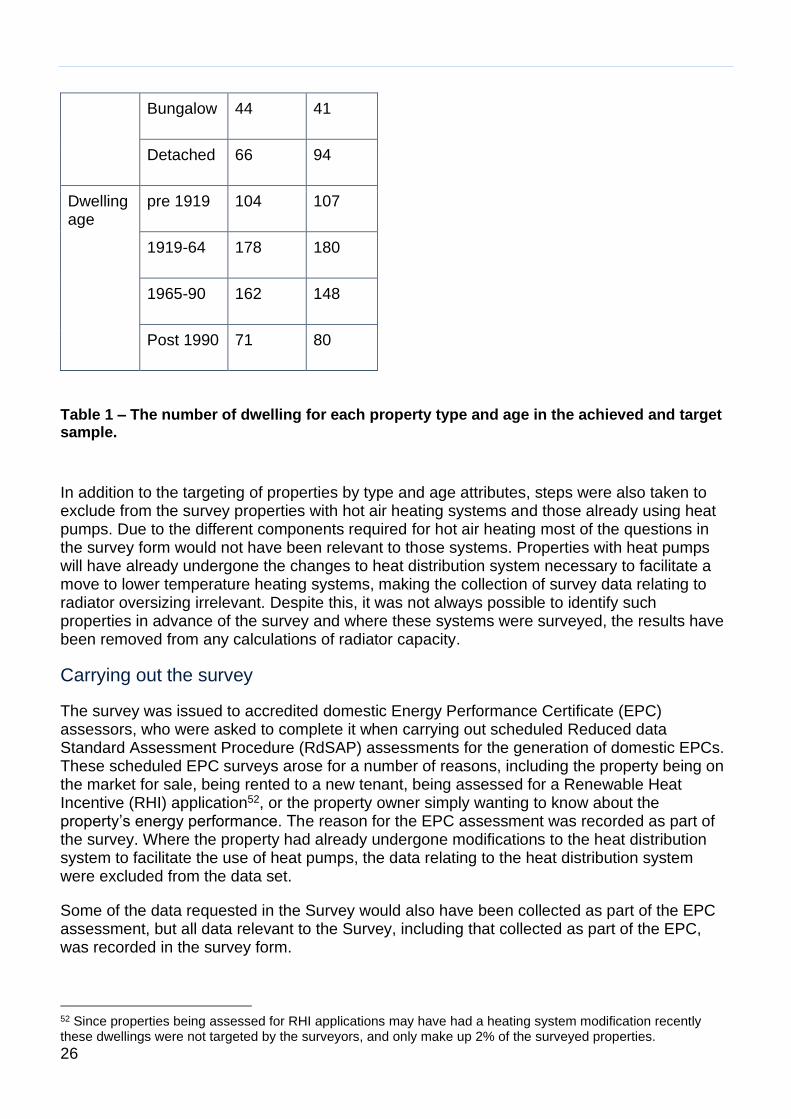
Bungalow 44 41
Detached 66 94
Dwelling age
pre 1919 104 107
1919-64 178 180
1965-90 162 148
Post 1990 71 80
Table 1 – The number of dwelling for each property type and age in the achieved and target sample.
In addition to the targeting of properties by type and age attributes, steps were also taken to exclude from the survey properties with hot air heating systems and those already using heat pumps. Due to the different components required for hot air heating most of the questions in the survey form would not have been relevant to those systems. Properties with heat pumps will have already undergone the changes to heat distribution system necessary to facilitate a move to lower temperature heating systems, making the collection of survey data relating to radiator oversizing irrelevant. Despite this, it was not always possible to identify such properties in advance of the survey and where these systems were surveyed, the results have been removed from any calculations of radiator capacity.
Carrying out the survey
The survey was issued to accredited domestic Energy Performance Certificate (EPC) assessors, who were asked to complete it when carrying out scheduled Reduced data Standard Assessment Procedure (RdSAP) assessments for the generation of domestic EPCs. These scheduled EPC surveys arose for a number of reasons, including the property being on the market for sale, being rented to a new tenant, being assessed for a Renewable Heat Incentive (RHI) application52, or the property owner simply wanting to know about the property’s energy performance. The reason for the EPC assessment was recorded as part of the survey. Where the property had already undergone modifications to the heat distribution system to facilitate the use of heat pumps, the data relating to the heat distribution system were excluded from the data set.
Some of the data requested in the Survey would also have been collected as part of the EPC assessment, but all data relevant to the Survey, including that collected as part of the EPC, was recorded in the survey form.
52 Since properties being assessed for RHI applications may have had a heating system modification recently these dwellings were not targeted by the surveyors, and only make up 2% of the surveyed properties.

27
Before assessors were sent out to do surveys they were fully briefed on the background and requirements of the survey. Importantly, they were informed of the definition and boundaries of a “domestic heat distribution system”, as defined for the purposes of this BEIS study53. This ensured that data and information were collected only for the system’s relevant components. In the case of systems using combi boilers, where the pump is located within the boiler unit, it was often difficult to directly collect data relating to the pump.
To collect the data required in the most robust and efficient way while on site, assessors took photos of key components of the heat distribution system for subsequent analysis. This allowed for more accurate and verifiable recording of component size, capacity, make and model and of system set points.
One of the most important items of data collected related to radiator size, number of radiator panels and presence of convector fins attached to panels. These determine the thermal output of a radiator. Photos were taken of each radiator in the property to establish these characteristics. To ensure that the size of the radiator could be correctly determined, assessors also took and recorded the measurements of each radiator. This information was later used to establish an estimate of each radiator’s rated thermal output and, ultimately, the capacity of all radiators in the property to emit heat. Comparing this overall capacity with the property’s thermal demand (kW), established from other data collected during the RdSAP assessment, allows an assessment to be made about whether the radiators are oversized or undersized for the property’s heating requirements, and by how much.
The radiator inlet control valve was also photographed so that its type could be determined.
In addition to gathering factual data on the presence of different heating system components, and their characteristics, assessors were also asked to collect data on the operation of the heat distribution system, aspects of its servicing, including frequency, whether any changes had been made to the system, the costs of these changes and the occupant’s experiences with comfort levels and operational issues. To facilitate this, surveys were undertaken when the occupant was present.
Analysing the survey results
As the surveys were carried out, the results were forwarded by the surveyors to the Ricardo Energy & Environment project team for QA and analysis. The results were in the form of completed Excel workbooks containing the results of the questionnaire and a number of photographs of radiators and other components of the heat distribution system.
The results were assessed for completeness and consistency, an important part of the latter being a verification that data related to radiator dimensions corresponded with the correct radiator photos, such that the radiator could be fully characterised and its rated thermal output estimated. Having passed QA, questionnaire data were extracted into one common workbook to facilitate analysis.
There was significant further processing required for the radiators. In order to estimate the rated thermal output of radiators, it was necessary to define a range of common radiator types, consult the literature on radiator outputs for each common type, use this to establish specific
53 For the purposes of this study, a domestic heat distribution system includes the following components: heat emitters (e.g. radiators or underfloor heating), pipework, pumps and valves. It excludes the following components: heat generators (e.g. boiler), domestic hot water systems, thermal storage and heating controls, such as boiler programmers and room thermostats. Pumps were only assessed if external to the boiler.

28
thermal outputs for each type (i.e. W/cm² radiator footprint area) and, from that, the rated
thermal output of each radiator.
The common types established are shown in the table below and in Appendix 5 Radiator photographs.
Radiator Type Description of Radiator Characteristics
Type 10 Single panel, no fins (Figure 5)
Type 11 Single panel, one set of fins54(see Figure 51 - A type 11 radiator. Figure 51)
Type 20 Double panel, no fins (Figure 6)
Type 21 Double panel one set of fins (see Figure 52)
Type 22 Double panel, two sets of fins (see Figure 53)
Radiator supplier literature from four radiator suppliers55 was consulted to obtain the rated thermal output for a range of radiator sizes and used to create a library of radiators.
From these data it was found that the specific thermal output (W/cm² footprint area) for
different radiator sizes within the same type varied in the range 5-8%. For example, the
specific thermal output varied from 0.174 W/cm² for the smallest single panel, single fin
radiator of area 1,200 cm2 to 0.167 W/cm² for the same radiator type of area 11,100 cm². In
order to iron out this variation in the analysis, a radiator library was established, and radiators grouped into size bins, with each size bin representing a narrower range of radiator footprint.
For each size bin, a specific rated thermal output (W/cm²) was established. The specific rated
thermal output for each bin was taken as the average value for all the radiators within that bin across the data for the four radiator suppliers. Appendix 1 Radiator Data Bins shows the values derived for the different radiator types.
The Rated Thermal Output (RTO) of a given radiator is then:
𝑅𝑇𝑂 (𝑊) = 𝑆𝑅𝑇𝑂𝑖,𝑗 (𝑊
𝑐𝑚2) × 𝑅𝑎𝑑𝑖𝑎𝑡𝑜𝑟 𝐹𝑜𝑜𝑡𝑝𝑟𝑖𝑛𝑡 (𝑐𝑚2)
Where 𝑆𝑅𝑇𝑂𝑖,𝑗 is Specific Rated Thermal Output for a radiator of type i (e.g. Type 10) in bin j.
The rated thermal output for the whole property is simply the sum of the RTO for all radiators in the property. It should be noted that subsequent analysis, whereby the RTO is compared
54 Radiator fins can be seen in the triple panel radiator shown in Figure 7. 55 Kudox, Stelrad, Korado and Lidea.

29
against thermal demand, can only be carried out at the whole property level, since thermal demand is not available at the individual room level.
Further Notes
It was not possible in all cases to derive the rated thermal output for all radiators in a property. There are two reasons for this:
Not all heat emitters were standard panel radiators of the types discussed above. Some were traditional cast iron column radiators, some were designer radiators and some were towel rails. The diversity of size and shape of these non-standard radiators meant that there was no readily available library of radiator outputs for these radiator types and so the rated thermal output could not be reliably determined.
It is not uncommon for radiators to be hidden from view and enclosed for aesthetic reasons. In these cases, it was not possible to confirm the radiator type or dimensions. In total 84 dwellings were excluded from the analysis of oversizing either because data was not available for the radiators, the system already used a heat pump or other low temperature system, or RdSAP outputs were unavailable. All other data from these properties was used to inform the research questions.
The rated and specific rated thermal output are derived from supplier data assuming a hot water supply temperature of 75°C, a return temperature of 65°C and an ambient (i.e. room) temperature of 20°C56. Under this assumption the average radiator temperature is 70°C, making a delta T between radiator and room of 50°C.
Radiator footprint means the footprint of the radiator against the wall and not the total area of the panels making up the radiator. Specific rated thermal outputs are expressed per unit of radiator footprint.
Analysis of primary data
Assessment of heat distribution system oversizing
For each dwelling the total heat output of all the radiators was added together to find the total heating output under standard conditions. The peak steady state heat demand (kW) was estimated by multiplying the RdSAP heat loss coefficient (W/K) for the dwelling by the difference between the internal and peak external temperature. A 20°C57 internal temperature was used and the external temperature was taken from the CIBSIE guide A, these temperatures are set regionally and such that the temperature is equal to or exceeds these values in 99.6% of the heating hours in the year.
Every dwelling in the UK stock has a slightly different heat demand (kW) and this makes comparisons of the absolute capacity of the heat distribution system difficult. In this study the size of heat distribution system is measured relative to the peak steady state thermal demand
56 Best practice for HDS installation involves assuming different room temperatures between 18 and 21°C for different rooms, and so the assumption of 20°C internal temperature is consistent with these.

30
(kW) of a property57. This measure, which we call “oversizing”, is calculated as the rated thermal power output of the radiators in a dwelling divided by the dwelling’s peak steady state thermal demand (kW). An oversizing of 1 corresponds to the radiators’ output being equal to the peak thermal demand (kW) of a property, i.e. the radiators in the property are sized to exactly meet the peak thermal demand (kW).
The analysis of oversizing in this report does not consider the extra heat distribution system capacity required for a “cold start”, where the dwelling is heated up to the desired temperature from a colder temperature after a period where the heating is not on. Best practice for radiator installation involves sizing radiators around 20% larger than the steady state heat demand (kW) so that the dwelling can be heated up from cold in a reasonable time. This extra radiator capacity is not accounted for in this analysis, where only the steady state heat demand (kW) is considered, for consistency with standard radiator thermal outputs. This means, that it is likely that in typical houses the oversizing factors assumed in this analysis to be suitable for lower flow temperatures are underestimations and in real dwellings on peak days higher flow temperatures will be required. To understand the requirements during a cold start, in situ testing and monitoring would be required for a range of initial internal temperatures across a variety of building types.
Oversizing was also calculated for a typical winter day and a 20-year peak day. When calculating the “oversizing” on a typical winter day, the RdSAP output for the average external temperature in January was used. For a 20-year peak day, daily average temperatures were found for each property from 2000-2020, and the minimum daily average temperature for each location was used58.
There is a body of evidence suggesting that the energy demand (kWh) of houses is larger than the designed or modelled energy demand (kWh) calculated using the Standard Assessment Procedure. Wide ranges in the measured U-Values exist for all wall types and current U-value assumptions mean that typical uninsulated walls perform better than measured and insulated walls worse59. In 2016, Innovate UK found that in most properties the SAP design estimate for a dwellings heat loss coefficient was less than a measured value from a co-heating test60. The Leeds Beckett university co-heating database contains information about the measured and predicted heat loss coefficients for 27 dwellings in the UK. This database shows that for 8 of the dwellings the difference between the predicted and measured performance is greater than 70% and for two dwellings it is greater than 100%. On average the measured fabric heat loss coefficient was 45% greater than the calculated coefficient, it is suggested that extra ventilation losses can make up a significant portion of this deficit61 62. These results demonstrate that there is a large amount of uncertainty in the actual performance of dwellings relative to their
57 At steady state, the property is already warm, and the radiators balance the heat losses from the property. 58 Postcode level temperature data was accessed from the NASA MERRA-2 dataset for T2M (temperature 2 metres above ground level) via the NASA power API. https://power.larc.nasa.gov 59 9. BRE, 2014. In-situ measurements of wall U-values in English housing. https://assets.publishing.service.gov.uk/government/uploads/system/uploads/attachment_data/file/409428/In-situ_u-values_final_report.pdf 60 Innovate UK, 2016. Building Performance Evaluation Programme: Findings from domestic projects Report https://www.gov.uk/government/publications/low-carbon-homes-best-strategies-and-pitfalls 61 The Building Fabric Thermal Performance of Passivhaus Dwellings—Does It Do What It Says on the Tin? https://passivhaustrust.org.uk/UserFiles/File/Technical%20Papers/16%2001%2020_Building%20Fabric%20Thermal%20Performance_Does%20it%20do%20what%20it%20says%20on%20the%20tin%202016.pdf 62 Magnitude and extent of building fabric thermal performance gap in UK low energy housing, 2018, Gupta and Kotopouleas,https://www.sciencedirect.com/science/article/pii/S0306261918304343

31
performance calculated by SAP. However, it should be noted these studies are made up of few samples, and the range in their results is large. The SAP heat demand (kWh) is regarded as the best data available for the calculations in this report, but these results emphasise the importance of further work being carried out to examine the effect of radiator oversizing on the provision of thermal comfort in real dwellings.
In later sections, when results of radiator oversizing are presented, a sensitivity analysis is shown. This shows the differences in results when a 10% reduction in radiator output is applied, due to poor radiator performance, and a 45% increase in the heat loss coefficient is applied, to represent the average difference between the real and calculated heat demand (kWh). These corrections allow for the uncertainties in the calculations of the oversizing to be understood by the reader.
UK housing stock model
Existing UK housing stock
Housings surveys conducted prior to this project have collected large datasets about the condition of the housing stock in the UK including the presence of central heating. The datasets used were; the English Housing Survey 2016: Housing Stock Data, the Scottish Household Survey, 2015-17, the Welsh Housing Conditions Survey 2017-18, and the Northern Ireland House Condition Survey, 2016. Some of the datasets did not contain information about the characteristics with the required granularity. In these cases, corrections were applied as described in Appendix 2 Housing survey data corrections.
A stock of the UK dwellings which contained wet central heating systems was created giving the number of dwellings with each key characteristic which had central heating systems. The English, Welsh and Northern Irish surveys contained information relating explicitly to the presence of a central heating system that was “wet with radiators” whereas in Scotland there was only mention of if the property had central heating and the fuel used, in this case electric central heating was excluded, but all others were assumed to be wet systems with radiators.
The UK housing stock developed for this project describes dwellings in terms of archetype characteristics. These characteristics are dwelling type, dwelling age, loft insulation thickness, wall type, and country. These characteristics are known for both the stock and the sample of houses surveyed, allowing mapping of the sample data to the full UK housing stock.
UK stock model of heat distribution system attributes
A UK stock model of heat distribution systems allows for estimates to be made of the number of dwellings in the UK that have a particular property of their heat distribution system. It gives the full housing stock of UK dwellings in terms of the key archetype attributes, and whether these dwellings have wet central heating systems. This allows for data from the surveys of

32
dwellings commissioned for this project to be mapped to the full UK housing stock, giving a UK stock of heat distribution systems. The model process is shown in Figure 11.
Figure 11 - UK stock model flowchart.
The key model steps involve finding correlations between the archetype properties of dwellings and the survey results, and then mapping these through to the full UK housing stock. For example, oversizing was correlated with the age of the dwelling, so dwelling age was used to distribute the distribution of oversizing across the full UK stock, with a weighting to correct for the different frequencies of different dwelling types and ages in the sample and the stock. The Appendix 3 Correlations used for mapping to UK housing stock, gives the outputs of several different comparisons of primary data to archetype attributes and describes which correlations were used to do the mapping.
The major assumption contained within this modelling approach was that the sample of dwellings for which data was collected was representative of the UK stock. By matching the sample collected to both the age and property type that is contained within the UK stock these features of dwellings are representative of the full stock. Since no surveys took place in Northern Ireland, the housing stock in Northern Ireland was assumed have the same characteristics of heat distribution systems as were observed for the rest of the UK. A limitation of regional comparison in this project is that fewer surveys were conducted in Scotland and Wales to England, this means that there is significantly less coverage of ages and property types in these devolved nations, however comparisons where the level of statistical significance is low have not been included in this report. A second limitation is that due to the lower rate of EPC assessments taking place in detached properties, these are slightly underrepresented in the sample relative to the full housing stock, this potential bias was corrected for by weighting the sample results by the ratio of their frequency in the sample to their frequency in the stock when grossing up to the full stock.
The mapping is applied to the UK housing stock allowing for assesment of the state of heat distribution systems across the full stock.
A mapping is found between the survey data and the key characteristic(s), weightings are applied to reduce bias caused by the make up of the survey sample
Survey data compared to archetype characteristics to find correlations, a key characteristic(s) is chosen (e.g. Oversizing factor is correlated with dwelling age)

33
Discussion of project findings
Heat distribution systems market review
A review of the market for heat distribution systems and components was conducted by desk-based research and consultation with stakeholders. Key data on sales and end use are available for some components, e.g. radiators. For others, such as valves, there is less information available. In general, the market for these products is fragmented as the products are marketed separately to developers for new build properties, plumbers, and consumers. As a result, radiators and other heat distribution components are sold direct from the manufacturer, by wholesalers, by installers or by retailers. It is noted that the market forecasts presented here were all created before the outbreak of the COVID-19 pandemic, and so will not account for the large-scale disruption to building work caused by this.
BSRIA publishes a regular report on key markets for hydronic radiators and underfloor heating (UFH)63. It gives data on the current market trends, drivers and obstacles as well as providing forecasts to 2022. In 2017, the total UK radiator market was 7,742,000 units, with 85% of those being steel panel radiators. Modest growth of 0.8% was reported for 2017, but the forecast growth to 2022 is between 1.6% and 3.1% Compound Annual Growth Rate (CAGR).
Steel panel radiators are regarded as the “default choice for new builds” due to their price, reliability, and ease of installation. Areas of larger growth were, designer radiators including tubular (column) radiators, and aluminium radiators, although these areas combined still make up less than 3% of the total radiator market. Designer radiators are being purchased increasingly to save space or improve the décor of a property. Towel rails, which make up 12% of the market by volume have swapped from being a luxury item to a common type of radiator and their installation in bathrooms is now seen as standard practice. Underfloor heating has been a steady growth market with the sales volume increasing by 7.5% per annum from 2012 to 2017. Further growth is expected with a projected CAGR of 7.1% to 2022 with growth highly related to increased deployment of heat pumps. Although, with only 24,000 installations in 2017, UFH still makes up only 4% of the combined radiator and UHF market. The most common type of installation, making up 75% of UFH installations, is screed and solid, with floating and joisted installations being less popular, especially for new builds.
The BSRIA 2015 World Radiators and Underfloor heating report64 provides historical context to the 2018 report and allows comparison of changes in market trends and drivers. In the 5 years leading up to 2013 there had been a slow decline in the radiator market. This was due to the economic downturn and the following reduction in construction. With growth in the construction industry, expected radiator market growth of 2-3% was forecast which is similar to the reported growth in 2018. Forecast growth in the UFH pipe market was 6-7% and this is exceeded by the 7.5% average growth reported in the 2018 report. Between 2015 and 2018, there was little change in the market shares or distribution systems of the main brands and suppliers in the radiator and UHF market
Data gathered from the Manufacturing Association of Radiators and Convectors (MARC) for the numbers of sales of radiators suggest roughly constant radiator sales since 2009, but a slight decline in sales of towel rails. This suggests that an increasingly large proportion of the
63 World Radiators and Underfloor Heating – UK, BSRIA, 2018 64 World Radiators and Underfloor Heating – UK, BSRIA, 2015

34
radiator market is being made up of manufacturers who are not members of this association. In fact, the MARC members have seen a decline in their sales of towel rails since 2011, whereas the BSRIA report suggests that the sales of these products have increased significantly.
In general, the stakeholders felt that steel panel radiators dominated the market, with UFH making up a small section: mostly in high-end properties. The cost of radiators was suggested to be linked to steel prices and it was proposed that the price of radiators might decrease if radiator production increases in China as the price of steel there is less than in other radiator manufacturing countries. The stakeholders did not anticipate that there would be a large move towards high performance radiators, for example triple panel radiators or fanned radiators, with the higher cost of these products and the noise of fans being a barrier to their uptake, although it was suggested that incremental improvements in fin design on steel panel radiators was possible.
Stakeholders felt that around 75% of the UK’s radiators were imported from Turkey, with the remainder manufactured mostly in the UK, Poland, and China; although it was suggested that exact information about the proportion of imports was difficult to find65.
Technical standards for heat distribution systems
Technical standards are examined in this report as they give information about what commissioning and maintenance practices are required when installing heat distribution systems. Historic standards are included as many heat distribution systems, which can have a lifetime of 30 years or longer, will have been installed before the current regulations were introduced. These historic standards give an idea around how the installation of heat distribution systems has changed over time, and the likely state of systems of different ages.
Although the exact laws and documents regulating building work in the different parts of the UK are different, the requirements are the same for all major aspects of heat distribution systems. This means that little difference is expected between heat distribution systems for the different parts of the UK with regards to their regulation.
Regulations and compliance guides for England and Wales
Building regulations approved documents L1a and L1b: Conservation of fuel and power, April 2016
These documents give guidance on how to comply with the energy efficiency requirements of the ‘Building Regulations 2010 for England’, and relate to the conservation of fuel and power in dwellings. Part La refers to new buildings and Lb to existing buildings. They are supported by the Domestic building services compliance guide, which sets out approved procedures for heat distribution systems. The regulations apply in England and Wales.
Domestic building services compliance guide, 2013
The Domestic building services compliance guide (2013) gives practical advice as to how buildings can be constructed to comply with the ‘Building Regulations 2010 for England’. The guide covers heat distribution systems and states that central heating systems should be flushed and cleaned before installing a new boiler; appropriate corrosion inhibitors which are build cert approved should be added to a wet heating system; and limescale formation
65 Information gathered from stakeholder consultation.

35
inhibitors should be used in hard water areas. In addition, the standards require pipes for space heating to be insulated whenever they pass through an unheated area.
Domestic Heating Compliance Guide, First Edition May 2006
The Domestic Heating Compliance Guide 2006 is an earlier version of the Domestic building services compliance guide. There is little difference between the minimum provisions required in this document and the 2013 version, showing regulations around central heating systems have changed little since 2006.
Regulations and compliance guides for Scotland
Building standards technical handbook 2019: domestic
The building standards technical handbook provides guidance as to how to meet the standards set in the Building (Scotland) Act 2004, which is the primary legislation for Scotland’s building system. This handbook gives the technical standards required in Scotland for insulation of buildings and heating systems. It references the Scottish building services compliance guide as where to get information relating to meeting regulations.
Scottish building services compliance guide, 2015
The Scottish building services compliance guide gives practical guidance as how to comply with the Building (Scotland) Act 2004. Its recommendations are the same those set out in the equivalent English document.
Regulations and compliance guides for Northern Ireland
Technical booklet F1 conservation of heat and power, October 2012
The technical booklet F1 provides practical guidance as to how to meet the technical requirements of the Building Regulations (Northern Ireland) 2012 about the conservation of heat and power. It references the English Domestic Building Services Compliance Guide 2010 as a document where more practical information about meeting the standards is contained.
Domestic Building services Compliance Guide, 2010
This previous edition of the English Domestic Building Service Compliance Guide is very similar to the 2013 version, except that all dwellings are required to have zoned heating rather than just those larger than 150𝑚2.
British standards
British standards are produced by the National Standards Body (NSB) for the UK and are incorporated into building regulations to ensure that a products and installation methods meet safety and efficiency requirements. Standards are often updated or replaced, and this section contains descriptions of some relevant current standards as well as some historic standards that would have applied when older systems were installed.
It is thought in general that although the standards and regulations around heat distribution systems are well known, they are weakly enforced. Some stakeholders felt that this had led to some inferior products being sold in the UK as well as some substandard installations.
BS-EN 12828: 2012+A1: 2014

36
The European standard BS EN 12828 sets out the standards for design of water-based heating systems. It covers the design of heat distribution systems and heat emission systems, however it does not cover requirements for installation or commissioning. It says that all parts of the heat distribution system should be sized to the heat load of the building, and that the system should be appropriately balanced. It also sets out appropriate safety requirements for these systems.
BS-EN 442: 2014
All radiators sold in the UK must meet the technical standards set out in BS-EN 442. It provides a standardised test of thermal output under different operating conditions, which is independently verified. This standard also contains the radiator characteristic equation, from which the thermal output at different flow and return temperatures can be determined. Compliance with this standard allows a radiator to display a kitemark. The standard also sets a maximum operating pressure and ensures that the radiator is durable and will not release any dangerous substances.
BS 7291: 2010
BS 7291 covers the technical requirements of plastic pipes for carrying water in domestic contexts, including in central heating systems. The standard relates to the effect of thermal cycling on plastic pipes and the long-term hydrostatic pressure resistance of the pipes to ensure that they are durable and safe for use in buildings.
BS 7593: 2019
BS 7593 provides guidance on best practice in maintenance and commissioning procedures for central heating systems. It covers five key areas, including:
Before a system is chemically treated, a new filter installed, or the boiler replaced, the system should be cleaned.
An inline filter should be added to maintain the system against debris.
A correct chemical water treatment, and, in hard water areas, scale reducers or water softeners, should be used.
Annual boiler servicing is recommended in line with the manufacturer’s instructions.
Inhibitor levels should be tested at regular intervals.
BS 5422: 2009
This regulation controls the minimum insulation thicknesses for warm air ducts and space heating pipes carrying hot water through unheated areas.
BS 1264: 2011
BS 1264 applies to underfloor heating systems. It limits the surface temperature of the floor to a maximum of 29°C. It also mandates that the pipework should be laid out to achieve an even temperature distribution across the whole floor and requires the system to be tested at a minimum pressure of 6 bar to check the quality of the installation.
BS 5449:1977

37
BS 5449:1977 is a historical standard giving a code of practice for forced circulation hot water systems. It deals with the work involved in planning, designing and installation of forced hot water systems. This standard suggests that post installation in the late 1970s and 1980s systems should have been properly maintained and the installer should have offered a regular distribution system service to the customer. It also mentions hydraulic balancing and mandates that the system should be balanced to ensure a satisfactory temperature at each heat emitter. It suggests that heat emitters should be placed below windows to stop drafts from windows reducing thermal comfort. The standard does not mention the addition of a corrosion inhibitor, or what the maintenance of the system should involve.
BS 5449:1990
This later updated version of BS 5449 has a few relevant differences to the equivalent document from 1977; it mentions that corrosion inhibitor should only be added in places where the water is known to cause corrosion, and that a chemical cleanser should be added if recommended by the boiler manufacturer. Unlike the previous standard, it does not mention that radiators should be placed under windows.
BS 7593:1992
BS 7593 gives the code of practice for treatment of water in domestic hot water central heating systems. Its relevant aims are to minimise corrosion of the system, and to inhibit the formation of scale and sludge. It suggests that water may be treated with an inhibitor to reduce corrosion and recommends manually flushing the system when replacing components. The standard finally suggests that if an inhibitor is added to the system, then its concentration should be checked annually.
The National Sanitation Foundation Chemical Inhibitor Approval Scheme (NSP CIAS)
The National Sanitation Foundation Chemical Inhibitor Approval Scheme assesses the performance of chemical inhibitors for them to be BuildCert (now called NSF International) approved, which is a requirement for use.
Reasons for purchase and installation of components
Limited published literature exploring when and why components of heat distribution systems are purchased and installed is available. A Delta EE report based on a customer panel of 17 homeowners suggested that the breakdown or unreliability of a heating system was a key trigger for replacement of parts, and consumers in general had a high level of trust in local suppliers66. Most of the homeowners would only replace radiators “if absolutely necessary”, although some others would be willing to change to achieve higher efficiency. The English housing survey67 reports that replacement of a boiler can be a trigger point for replacing radiators. In the 5 years prior to the report, 28% of owner-occupied homes that had replaced their boiler had replaced their radiators at the same time. The reasons for not replacing the radiators were that there were no problems with their heating, or that the contractor advised keeping them.
Most of the stakeholders thought that heating system components would only be replaced when they were broken and that it would be very rare to replace the whole system; when new
66 Focus Report: Online focus groups exploring the path to purchase, Delta EE, 2018 67 MHCLG, English housing survey, Energy report, 2017-18

38
components were added they would simply be joined up to the existing pipes and the majority of the radiator pipes and other components would last decades. This means that many homes have a selection of components of different ages, especially if central heating was only added gradually to the property. Boilers were thought to last 10-15 years and would usually be the first part of the system to fail. The replacement of one part of the system might be a trigger for replacing other parts, for example the stakeholders suggested that often when the boiler was replaced the pump would also be replaced and the radiators might be checked if they were performing poorly. However, they noted that if other components were working well it is unlikely that they would be replaced. It was not considered unusual for radiators to be in homes for over 30 years without being replaced. Most stakeholders felt that the main factor affecting the life expectancy of the components was the water quality in the system, with inhibitors and proper cleaning and maintenance leading to much longer component lifetimes.
In rented accommodation, decreases in energy bills resulting from energy efficiency improvements following replacement of heating system components are passed onto the tenant not the landlord, this acts as a major barrier to uptake. Landlords are often reluctant to make a capital investment where the ongoing cost savings are seen only by the tenant.
In the surveys carried out during this project, residents were asked to indicate when and why they had replaced different parts of their heat distribution systems. The vast majority of responses indicated that their replacement of components had been when the whole heating system, including a new heat source, had been installed or upgraded; often this was suggested to be associated with other building work on the property. A small number of responses indicated that parts had been replaced due to faults such as a leaky radiator.
Relevant policies
Energy Company Obligation (ECO), April 2013
This is a government energy efficiency scheme launched in 2013 which aims to increase efficiency of heating systems. Under this scheme suppliers are obliged to promote and fund energy efficiency measures to domestic properties. These measures could include adding additional insulation, installing a renewable heating system like a heat pump, or installing efficiency improving measures like TRVs or smart heating controls.68
Green Deal Home Improvement Fund
The Green Deal Home Improvement Fund provides loans to homeowners to help them spread the payment for energy saving measures over time, avoiding large upfront capital cost. It was initially launched in 2012, but until 2015 only 15,000 loans were issued. The scheme was relaunched in 2017 backed by private investors. Homes must have a Green Deal assessment first to ascertain whether they are eligible. Money from this scheme can be used to fund innovative wet heat distribution systems such as UHF, as well as adding insulation or installing a heat pump69,70.
68 ofgem.gov.uk/system/files/docs/2019/09/eco3_measures_table_v3.3_0.pdf 69 https://www.gov.uk/green-deal-energy-saving-measures 70 https://www.which.co.uk/reviews/home-grants/article/home-grants/the-green-deal
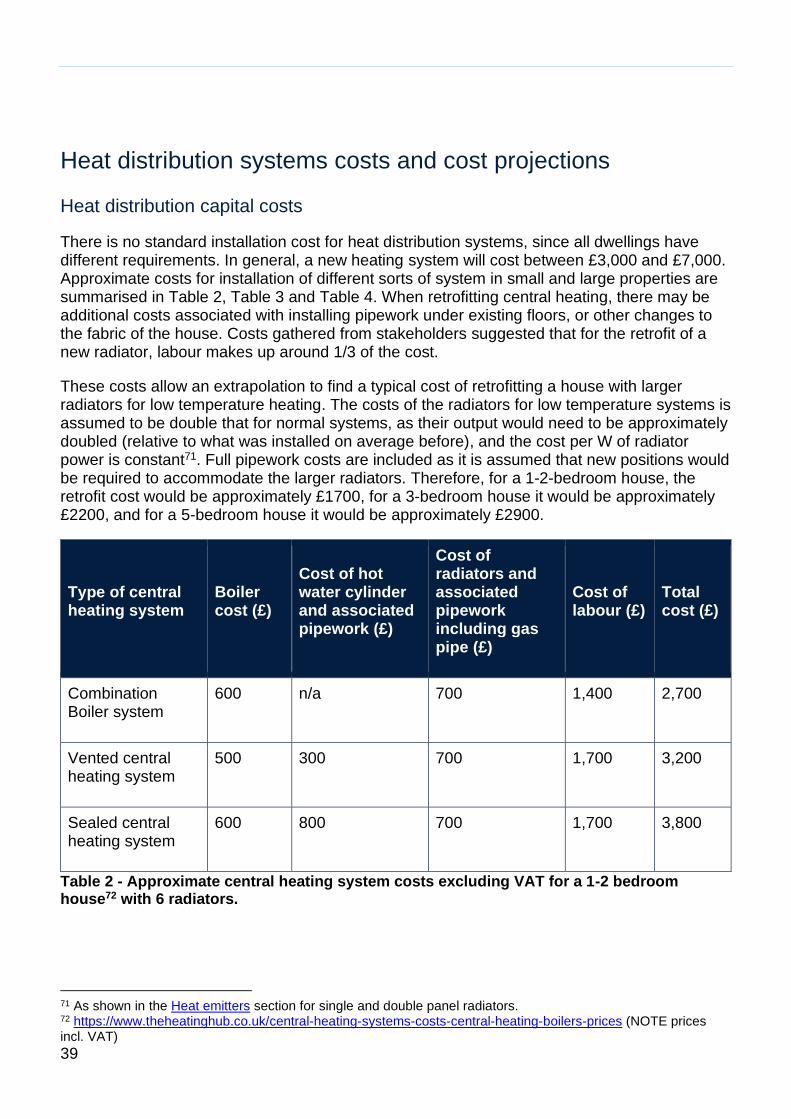
39
Heat distribution systems costs and cost projections
Heat distribution capital costs
There is no standard installation cost for heat distribution systems, since all dwellings have different requirements. In general, a new heating system will cost between £3,000 and £7,000. Approximate costs for installation of different sorts of system in small and large properties are summarised in Table 2, Table 3 and Table 4. When retrofitting central heating, there may be additional costs associated with installing pipework under existing floors, or other changes to the fabric of the house. Costs gathered from stakeholders suggested that for the retrofit of a new radiator, labour makes up around 1/3 of the cost.
These costs allow an extrapolation to find a typical cost of retrofitting a house with larger radiators for low temperature heating. The costs of the radiators for low temperature systems is assumed to be double that for normal systems, as their output would need to be approximately doubled (relative to what was installed on average before), and the cost per W of radiator power is constant71. Full pipework costs are included as it is assumed that new positions would be required to accommodate the larger radiators. Therefore, for a 1-2-bedroom house, the retrofit cost would be approximately £1700, for a 3-bedroom house it would be approximately £2200, and for a 5-bedroom house it would be approximately £2900.
Type of central heating system
Boiler cost (£)
Cost of hot water cylinder and associated pipework (£)
Cost of radiators and associated pipework including gas pipe (£)
Cost of labour (£)
Total cost (£)
Combination Boiler system
600 n/a 700 1,400 2,700
Vented central heating system
500 300 700 1,700 3,200
Sealed central heating system
600 800 700 1,700 3,800
Table 2 - Approximate central heating system costs excluding VAT for a 1-2 bedroom house72 with 6 radiators.
71 As shown in the Heat emitters section for single and double panel radiators. 72 https://www.theheatinghub.co.uk/central-heating-systems-costs-central-heating-boilers-prices (NOTE prices incl. VAT)
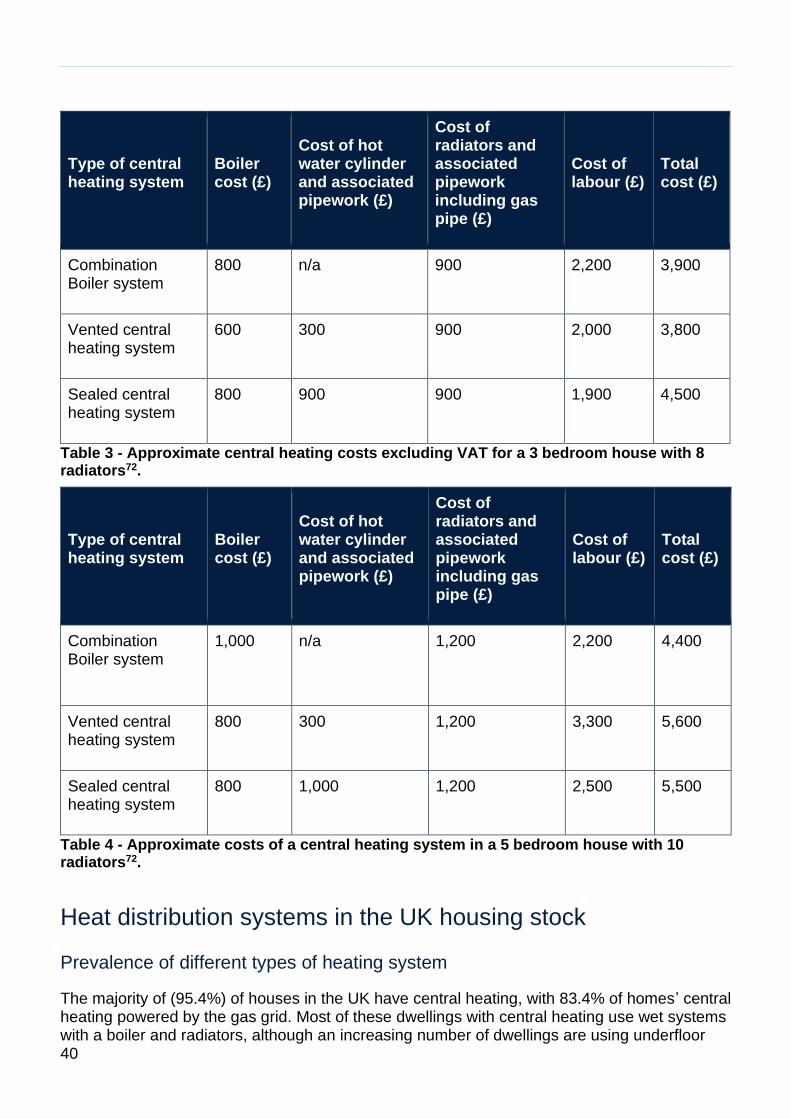
40
Type of central heating system
Boiler cost (£)
Cost of hot water cylinder and associated pipework (£)
Cost of radiators and associated pipework including gas pipe (£)
Cost of labour (£)
Total cost (£)
Combination Boiler system
800 n/a 900 2,200 3,900
Vented central heating system
600 300 900 2,000 3,800
Sealed central heating system
800 900 900 1,900 4,500
Table 3 - Approximate central heating costs excluding VAT for a 3 bedroom house with 8 radiators72.
Type of central heating system
Boiler cost (£)
Cost of hot water cylinder and associated pipework (£)
Cost of radiators and associated pipework including gas pipe (£)
Cost of labour (£)
Total cost (£)
Combination Boiler system
1,000
n/a 1,200 2,200 4,400
Vented central heating system
800 300 1,200 3,300 5,600
Sealed central heating system
800 1,000 1,200 2,500 5,500
Table 4 - Approximate costs of a central heating system in a 5 bedroom house with 10 radiators72.
Heat distribution systems in the UK housing stock
Prevalence of different types of heating system
The majority of (95.4%) of houses in the UK have central heating, with 83.4% of homes’ central heating powered by the gas grid. Most of these dwellings with central heating use wet systems with a boiler and radiators, although an increasing number of dwellings are using underfloor

41
heating 1.4% of dwellings in the project sample had underfloor heating and underfloor heating makes up 4% of the combined radiator and underfloor heating market73. Electric heating is also common, heating 8% of dwellings in England, 5% in Wales, 12% in Scotland, and 2% in Northern Ireland. There are a very limited number of dwellings heated by other systems such as warm air or trench heaters74.
The heating systems in our sample of the UK housing stock are shown in Figure 12 below. The sample was focused towards dwellings with wet radiator heat distribution systems, so only represents the fuel use of dwellings with these systems. 89% of systems had a gas boiler, 4% an oil boiler, 2% a heat pump or district heating, and the remainder had other technologies. Since the survey was targeted towards dwellings with wet central heating, the higher prevalence of gas central heating than in the full UK stock is expected a large proportion of the dwellings that do not have gas central heating are electric and do not have wet central heating.
Figure 12 - The distribution of different heat sources in the survey sample.
Information about the type of heat distribution system was gathered from the properties surveyed. The heating systems were either combination boiler sealed systems, non-combination boiler sealed systems, or non-combination boiler vented systems. Of the houses surveyed, where a heating system type was identified, half were combination boiler sealed systems, with another third non combination sealed systems, the remaining 17% of systems were non combination boiler vented. Combination boiler sealed systems were most common in old dwellings, with more sealed non combination boilers in newer properties, this is shown in
73 BSRIA World Radiators and Underfloor Heating – UK, BSRIA, 2018 74 English Housing Survey 2016: Housing Stock Data, the Scottish Household Survey, 2015-17, the Welsh Housing Conditions Survey 2017-18, and the Northern Ireland House Condition Survey, 2016

42
Figure 13 below. As of 2017, 56% of English homes had combination boilers75 this is slightly higher than the 46% of English dwellings in the sample that had combination boilers.
Figure 13- The proportion of each type of central heating system in different ages of dwellings.
The surveys recorded what sort of heat emitter was used in each room in the dwelling for 514 properties, all but 2 of the 514 properties76 had a radiator in at least 1 room, and 10 out of 514 had underfloor heating in at least 1 room. No warm air systems were found in the sample, and 2 properties contained other heat emitters e.g. a gas fire.
The majority (92.1%) of the pipes observed by the surveyors during this project were copper, although some cast iron (6%) and plastic (2%) pipes were also observed. For a subset of the houses observed, the diameter of the pipe feeding the radiators was measured. The majority (93%) of pipes had a 15 ± 1mm diameter, but a few had other diameters, with 20mm (5%) the most common. Plastic pipes were more likely to have a larger diameter, because of their greater hydraulic resistance they need to be larger than copper pipes to give the same flow rate at a fixed pump pressure. The CIBSE A guide suggests a maximum flow velocity in copper pipes 15mm or larger of 1m/s77. Using the heat demand (kW) for a dwelling, it is possible to calculate the flow speed in the pipes running from the boiler to the radiators78, assuming that these operate under standard conditions, this allows for a maximum increase in flow rate to be found. For the 25th percentile of heat demand (kW) in the sample, the flow rate in 15mm pipes is 0.5m/s, so could be doubled, but for the 75th percentile of heat demand (kW) the flow rate would be 0.9m/s so no significant increase would be possible without increasing the size of the pipes.
The type of pump that was present in dwellings was recorded during the primary data collection, in most dwellings the surveyor was unable to determine the type of pump (mostly this was due to it being embedded within a combination boiler), but in 132 dwellings they were.
75MHCLG, English housing survey, headline report 2017-18 76 These dwellings had underfloor heating in every room. 77 https://www.heatweb.co.uk/w/index.php?title=Pipework_Calculations#Current_Standards 78 This calculation assumes a temperature drop of 10°C across the heat distribution system so the volumetric flow rate is given by the thermal power output divided by the heat capacity of water, the temperature drop and the density of water (this can be converted into a speed by dividing by the cross sectional area of the pipe).

43
It was found that 55% of these dwellings had fixed speed pumps, 27% had variable speed, and 17% had multi speed (e.g. 3 speed)79.
Capacities of current heat distribution systems
The capacity of the heating system is the amount of useful heat that it can produce for a dwelling. In practice all dwellings require different amounts of heat, so the capacity of the heat distribution system in this study is defined by an “oversizing factor” which gives the relative ability of the heat distribution system (when operating under standard conditions80) to meet the thermal demand (kW) of a property during the peak in heat demand (kW). Stakeholders suggested that typical oversizing factors might range from 1.2-1.4. The properties surveyed had a range of different amounts of oversizing, from severely undersized, to severely oversized. The distribution of oversizing in the survey results is shown in Figure 14 below.
Undersized Oversized
Figure 14 – The distribution of oversizing in the sample of houses surveyed for this project.
It is possible to determine the flow temperature required to meet thermal demand (kW) at each oversizing factor, Figure 15 below gives the cumulative proportion of the survey sample that could meet demand (kW) on a peak day at each flow temperature. The results show that 23% of the surveyed houses are unable to meet their peak heat demand (kW) with a flow
temperature of 75°C. However, they also show that 14% of dwellings in the sample could
change to a heating technology with a flow temperature of 55°C with no changes to the heat
distribution system components, although some cleaning and maintenance of the system, for example a powerflush, may be required to ensure that the radiators are operating at their installed capacity. Further work is needed to verify that this is the case in practise, for example “in-situ” monitoring or field trials, different options have been recommended to BEIS through a scoping study carried out as a part of this project. In addition to this, Figure 16 gives the
79 Due to rounding percentages may not sum to 100% 80 75°C flow 65°C return, 20°C room temperature.

44
proportional increase in oversizing required across the sample to meet heat demand (kW) at
55°C. 14% of dwellings need no increase in their oversizing factor, 39% would need an
increase by 1.6x or less, but 22% would need their oversizing to be more than doubled. This shows that for most dwellings significant changes in either radiator output or heat demand (kW) would be required to meet the peak heat demand (kW) at this flow temperature, but that the standard increase in size of 2.4 times81 when fitting low temperature heating may not be required in most dwellings.
Figure 15 - The fraction of the survey sample that could meet their heat demand (kW) on a peak day at each flow temperature.
81 Installers of low temperature heating systems indicated that it was standard practice to size radiators 2.4 times what they had originally been when fitting a low temperature system.

45
Figure 16 - The proportional increase in oversizing factor required to meet heat demand (kW) across the sample at 55°C.
There is significant uncertainty in the calculations of oversizing due to differences between calculated and measured heat loss coefficients and uncertainty in radiator output, these are discussed in detail in the section Assessment of heat distribution system oversizing. The impact of this uncertainty on the oversizing is significant and shown as a sensitivity analysis in Figure 17 below.

46
Figure 17 - Proportion of dwellings in the sample that can meet heat demand (kW) at each flow temperature. (Average temperature across sample for the peak is -3.5°C)
The relationship between the oversizing of the heat distribution system, and other attributes of
the dwelling was investigated. The oversizing is weakly correlated (R²=0.3) with the annual
heat demand (kWh) per square metre82 as shown in Figure 18, this backs up an assertion made by some stakeholders that installers may be installing radiators based on rules of thumb rather than using rigorous calculations of heat demand (kW). In addition to this, both the annual demand (kWh) per square metre, and the radiator oversizing are correlated well the age of the dwelling, these trends are shown in Figure 19 and Figure 20. Another key factor of a dwelling determining its oversizing was whether it was a purpose built flat or not. The average oversizing for a purpose built flat was 2.0, but for all other types of dwelling it was 1.4, this trend is shown in Figure 21.
Figure 18 - This graph shows the relationship between the annual heating demand (kWh) per square metre of floor area and the radiator oversizing, purpose built flats are shown in orange. R²=0.3
82 Defined by the EPC annual demand divided by the EPC floor area.

47
Figure 19 - These graphs show the relationship between heat demand (kWh) per square metere of floor area and the age of dwellings.
Figure 20 – These graphs show the relationship between the age of dwellings and their oversizing.

48
Figure 21 – This graph shows the difference in oversizing between flats and non-flats.
These trends are used in the creation of a stock model for the oversizing across the full UK housing stock, the detailed methodology describing this process is above in section UK stock model of heat distribution system attributes.
Across the full UK housing stock, the distribution of the oversizing of radiators has been found as the proportion of dwellings that can meet heat demand (kW) at each flow temperature. Figure 22 below shows the proportion of the UK housing stock that could meet heat demand (kW) on a peak day at a range of flow temperatures, this shows that in the baseline case 10%
of dwellings are suitable for conversion to low temperature heating at a 55°C flow temperature,
and 1% are suitable for 45°C flow temperature, with no changes to the heat distribution system or flow rates.
The oversizing of radiators for a 20-year peak heating demand (kW) day was also considered. The 20-year peak temperature was found as the coldest day (at postcode level) from the last 20 years83. The proportion of dwellings that could be heated at each flow temperature on this day is shown in Figure 23 below. This shows that for 40% of dwellings in the UK, a central heating flow temperature of 75°C would be inadequate, and so to reach an internal temperature of 20°C these dwellings would have to use a higher flow temperature, or have additional heating e.g. electric fan heaters.
83 Postcode level temperature data was accessed from the NASA MERRA-2 dataset for T2M (temperature 2 metres above ground level) via the NASA power API. https://power.larc.nasa.gov

49
Figure 22 - The proportion of UK dwellings that can meet heat demand (kW) at each flow temperature. (Average temperature across sample for the peak is -3.5°C, error bars give 95% confidence interval)
Figure 23 - Fraction of the UK stock of dwellings with wet central heating that could meet heat demand (kW) on a 20 year peak day with their current radiators and a standard flow
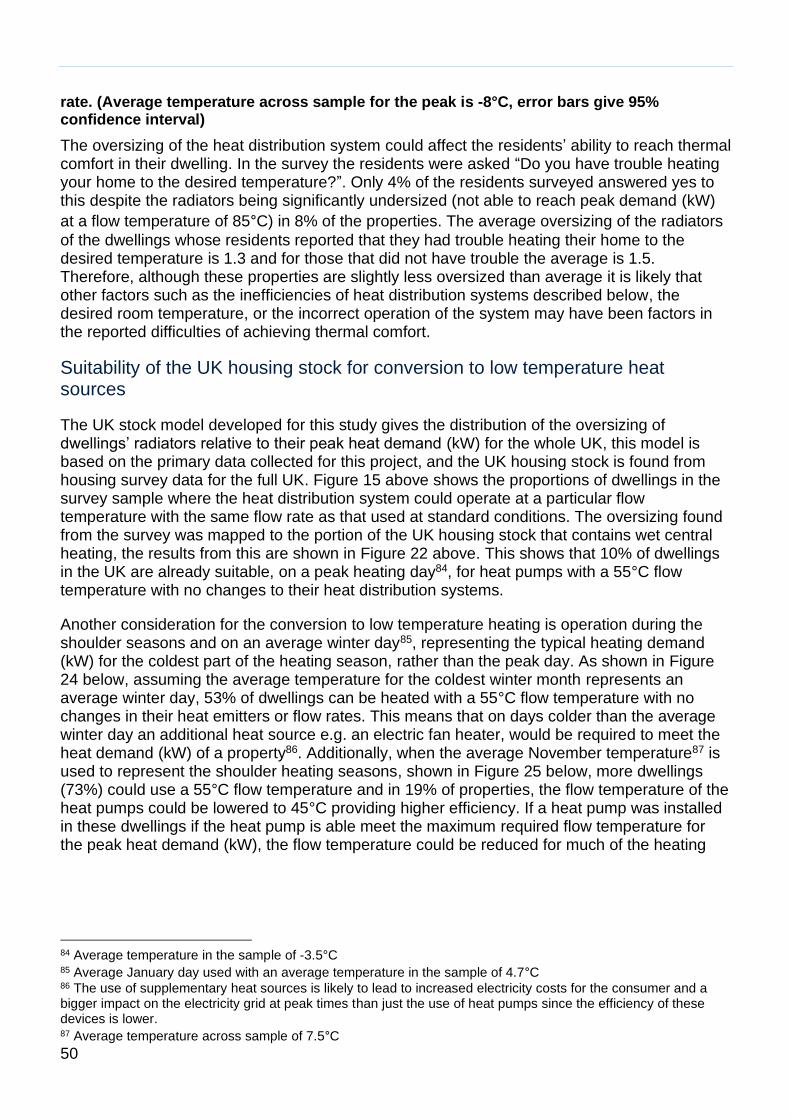
50
rate. (Average temperature across sample for the peak is -8°C, error bars give 95% confidence interval)
The oversizing of the heat distribution system could affect the residents’ ability to reach thermal comfort in their dwelling. In the survey the residents were asked “Do you have trouble heating your home to the desired temperature?”. Only 4% of the residents surveyed answered yes to this despite the radiators being significantly undersized (not able to reach peak demand (kW)
at a flow temperature of 85°C) in 8% of the properties. The average oversizing of the radiators
of the dwellings whose residents reported that they had trouble heating their home to the desired temperature is 1.3 and for those that did not have trouble the average is 1.5. Therefore, although these properties are slightly less oversized than average it is likely that other factors such as the inefficiencies of heat distribution systems described below, the desired room temperature, or the incorrect operation of the system may have been factors in the reported difficulties of achieving thermal comfort.
Suitability of the UK housing stock for conversion to low temperature heat sources
The UK stock model developed for this study gives the distribution of the oversizing of dwellings’ radiators relative to their peak heat demand (kW) for the whole UK, this model is based on the primary data collected for this project, and the UK housing stock is found from housing survey data for the full UK. Figure 15 above shows the proportions of dwellings in the survey sample where the heat distribution system could operate at a particular flow temperature with the same flow rate as that used at standard conditions. The oversizing found from the survey was mapped to the portion of the UK housing stock that contains wet central heating, the results from this are shown in Figure 22 above. This shows that 10% of dwellings in the UK are already suitable, on a peak heating day84, for heat pumps with a 55°C flow temperature with no changes to their heat distribution systems.
Another consideration for the conversion to low temperature heating is operation during the shoulder seasons and on an average winter day85, representing the typical heating demand (kW) for the coldest part of the heating season, rather than the peak day. As shown in Figure 24 below, assuming the average temperature for the coldest winter month represents an average winter day, 53% of dwellings can be heated with a 55°C flow temperature with no changes in their heat emitters or flow rates. This means that on days colder than the average winter day an additional heat source e.g. an electric fan heater, would be required to meet the heat demand (kW) of a property86. Additionally, when the average November temperature87 is used to represent the shoulder heating seasons, shown in Figure 25 below, more dwellings (73%) could use a 55°C flow temperature and in 19% of properties, the flow temperature of the heat pumps could be lowered to 45°C providing higher efficiency. If a heat pump was installed in these dwellings if the heat pump is able meet the maximum required flow temperature for the peak heat demand (kW), the flow temperature could be reduced for much of the heating
84 Average temperature in the sample of -3.5°C 85 Average January day used with an average temperature in the sample of 4.7°C 86 The use of supplementary heat sources is likely to lead to increased electricity costs for the consumer and a bigger impact on the electricity grid at peak times than just the use of heat pumps since the efficiency of these devices is lower. 87 Average temperature across sample of 7.5°C

51
season, thereby increasing the overall efficiency, on the basis that many modern heat pumps can operate with variable flow temperature88,89.
These results suggest that there is an opportunity for hybrid heat pumps, or heat pumps with additional heat sources such as electric fan heaters, to be used with no changes to heat distribution systems, with the heat pump providing the vast majority of the annual heating demand (kW), across a relatively large portion of the housing stock.
Figure 24 - Proportion of dwellings in UK housing stock that have wet central heating with radiators that can meet heat demand (kW) on an average winter day at each flow temperature. (Average temperature across sample is 4.7°C, error bars give 95% statistical confidence interval)
88 https://www.dimplex.co.uk/product/9kw-high-temperature-domestic-ground-source-heat-pump-sih9me 89 https://library.mitsubishielectric.co.uk/pdf/download_full/751

52
Figure 25 - Proportion of the UK housing stock that have wet central heating that can meet heat demand (kW) on an average November day at each flow temperature. (Average temperature across sample is 7.5°C)
Regional and age profiles of heat distribution systems
Housing survey data allows for comparisons to be made about the prevalence of heat distribution system types around the UK. In England 89% of dwellings have wet central heating with radiators. In Wales 94%, in Northern Ireland 96% and in Scotland, 86% of dwellings are thought to have wet central heating90. The percentage of dwellings with warm air heaters, which are the next most prevalent heat distribution system in the scope of this project, is 0.61% in England, 0.08% in Wales, and 0% in Northern Ireland. The remaining properties have heating systems outside the scope of this project.
The stakeholders consulted for the project said that there were not thought to be any regional differences between the type, installation, or maintenance of heat distribution systems. However, it was felt that there may be differences between housing types, with smaller properties having combi boilers and affluence being a key driver of better system maintenance, with more affluent homes having newer, better maintained systems
463 of the surveys were carried out in England, 36 in Scotland, and 24 in Wales. This means that it is possible to examine some regional trends in heat distribution systems, due to the small sample size in Wales and Scotland the coverage of dwelling types and ages is not as representative as that in England. The results show no statistically significant difference between the amount of oversizing across the devolved nations. As expected, due to their soft water, there were no limescale inhibitors found in Wales or Scotland. There was also different usage of thermostatic radiator valves across the three countries, with TRVs being used more in Scotland than England, however the sample was not large enough to determine if TRVs are used with a different frequency in Wales, this is shown in Figure 26 below. Magnetic filters are
90 Assumptions detailed in methodology.

53
installed much more commonly in England, with 30% of dwellings having these as oppose to less than 10% in Scotland and Wales, this trend is shown in Figure 27 below.
Figure 26 – TRV use by country.
Figure 27 - Magnetic filter prevalence by country.
The age of the heat distribution system in a dwelling is in some cases difficult to determine. Due to the long lifetimes of heat distribution systems dwellings have usually had several different occupants since the heat distribution system was installed or last replaced, this issue is especially prevalent in rented properties. The surveyor asked the resident whether the

54
radiators, pipes, pumps, and valves had ever been replaced and when any replacement had happened, allowing the age of replaced components to be identified. Many residents indicated that they did not know if their components had ever been replaced (28% for radiators, 33% for pumps, 41% for valves, and 33% for pipes). Of those who knew if their component had ever been replaced 16% indicated that the radiators had been replaced,12% the pumps, 12% the valves and 9% the pipes. Given the expected lifetimes of these products, and the fact that they were likely first installed in 1960s, 70s or 80s in most dwellings these figures are likely to be underestimates and instead correspond to whether the components have been replaced recently, 80% of the replacements mentioned in the survey had taken place in the last 10 years (and 72% of respondents had lived in the property for 5 years or fewer, so the memory of replacements before this time is limited).
Performance of heat distribution system technologies
Inefficiencies of heat distribution systems
The operational efficiency of a heat distribution system can be thought of as the amount of energy used to provide a certain level of thermal comfort. There are several key factors that influence this efficiency:’
The build-up of sludge in the system can clog up pipes, pumps, radiators or the boiler reducing efficiency and lifetime. Some reports have suggested that sludge can reduce the efficiency of a central heating systems by 15%91.
The build-up of limescale in a system can reduce the efficiency of heat transfer between components in the system, limescale can build up on the inside surface of pipes radiators and valves. British Water claims limescale can reduce a boiler’s efficiency by 12%, and Fernox, a water treatment product manufacturer, claims that limescale build up on the inside of pipes could increase fuel demand by 15%92. Hard water areas are particularly at risk of limescale build up and are defined as areas with water containing more than 200 mg/l of CaCO3. Limescale build up is limited by the quantity of Calcium and magnesium ions in the system, but topping up the system or replacing the water will replenish these, so leaky systems may be more likely to have limescale.
Poor hydraulic balancing can change the way that the system is operated to provide thermal comfort increasing the amount of energy used. Studies have suggested that correct balancing can improve efficiency by at least 10%93,94 and a comprehensive study by Enertec International shows that the effect of hydraulic imbalance depends on the severity of the imbalance and that increased heat output required due to imbalance might be between 3.5% and 70% depending on the degree of imbalance95. Imbalance can also seriously affect the residents thermal comfort, making some rooms very difficult to heat whilst others overheat significantly.
91 https://www.eua.org.uk/uploads/5A8D4F9A4E161.pdf 92 https://www.viessmann.co.uk/heating-advice/how-to-prevent-limescale-in-boilers 93 BEIS, Heat in Buildings: Boiler Plus, October 2017 94 Sustainable energy association heating system plus, August 2015 95 Hydronic balancing, Enertec for Grundfos, 2017

55
Air can enter a central heating system and causes noise and increased corrosion and sludge build up, as well as reducing the thermal output of radiators. An independent study in the Netherlands has shown that air can reduce the performance of a system by 6%96.
Other factors that may reduce the performance of the heat distribution system are wrongly sized pumps and pipes, these will prevent radiators from operation under their standard conditions and may impact the efficiency of the boiler by increasing the return temperature of the water, or cause heat loss in parts of the system other than the radiators. The position of radiators is also important, radiators that are covered or underneath a shelf will have restricted convection and so will not be able to provide as much heat to the room at the same flow temperature.
In the surveys of heat distribution systems commissioned for this project the occupier was asked if they experienced specific problems with their heating systems, to understand the prevalence of common inefficiencies in heat distribution systems. Residents were asked if they experienced noise from their radiators, a common sign of air in the system; radiators being hot at the bottom and cold at the top, a common sign of air building up in radiators; and if some radiators got hot while others stay cold, a sign of poor hydraulic balancing. Just 1% of respondents had experienced noise, 1% had experienced radiators being hot at the top and cold at the bottom, and 1% had experienced some radiators being hot and others cold. Although these problems appear rare from the study, it is likely that only more extreme problems are noticed by the resident and the real incidence of these issues which reduce the efficiency of systems is larger. In addition, only problems with the system at that time were noted, so it is possible that these figures represent problems that were large enough to be noticed, but not large enough for the resident to take action to fix.
Technical factors determining the performance of heat distribution systems
The performance of a heat system is a measure of its ability to provide thermal comfort with as little energy used as possible. For a system with a condensing boiler, the colder the return temperature to the boiler is, the more efficiently the boiler can operate. This means that for boiler systems having larger temperature drops across radiators is beneficial to the boiler efficiency, but not necessarily the performance of the heat distribution system. The performance considered in this report is purely that of the heat distribution system, not including the boiler, so only measures that are able to increase the thermal output of radiators, or provide thermal comfort at a lower flow temperature are considered.
The efficiencies in the previous section describe how a system might not operate at its rated output, but there are also methods for increasing the performance of heat distribution systems which are unrelated to common inefficiencies. There has been some prior work around the way that different heat emitters provide thermal comfort. Some studies suggest that transient temperature and radiative heat from radiators can help to provide higher levels of thermal comfort and some modern radiators are optimised to provide more radiative heat97. Other studies have shown that by increasing the rate of convective flow in a room the temperature can become less stratified and suggest that this allows the same level of thermal comfort to be
96 https://www.installeronline.co.uk/deaeration-maximise-heating-system-efficiency/ 97 Rettig, ProRadiator Programme, January 2010

56
provided with a lower energy output from radiators98,99. Finally it is thought that in some dwellings underfloor heating may be able to provide higher levels of thermal comfort with the same energy use since the temperature gradient in the room keeps the lower portion of the room where people are hotter than the upper portion. Further work around the impact of different convection rates and ratios of conductive to radiative heat transfer to the room is required to better understand the role of the heat distribution system in providing thermal comfort in different dwellings and at different flow temperatures.
Change in the performance of the system over time
Following best practice for the installation, commissioning, and maintenance of heat distribution systems will allow the heating system to perform to the specifications set out by the manufacturer. However, stakeholders consulted for this project thought that the performance of heat distribution systems would deteriorate over time, starting 2 years after installation. Since there are few datasets available about the performance of heat distribution systems after installation, it is difficult to quantify how big this deterioration might be.
Conversion of Heat Distribution Systems to low Temperature heat sources
Many low carbon methods for providing space heating deliver heat more efficiently at lower temperatures, and so are designed to operate at lower temperatures (for example in the range 35-60°C) than conventional fossil fuel boilers, which can provide heat in excess of 80°C. This can be a challenge since the existing heat distribution system in a property may not be capable of providing sufficient amounts of heat when operating at the lower temperatures to meet space heating needs.
On installation of a low temperature heating technology, to ensure appropriate heat output the heat distribution system may need some or all of the radiators in a property to be replaced with radiators with a larger thermal output. If an increase in flow rate is required then some of the pipes in the system may also need to be replaced. In some cases additional insulation of the building could also be required as well as the changes to the heat distribution system.
The remainder of this section gives a quantitative description of the changes that may be needed to convert to a low temperature heat source.
BS EN: 442 gives the characteristic equation of a radiator as: 𝑄 = 𝐾∆𝑇𝑛
Where 𝑄 is the thermal output of the radiator, ∆𝑇 the difference between the average radiator
temperature and the air, 𝐾 is a constant and depends on the size and shape of the radiator, and 𝑛 is the exponent of the characteristic equation and has value 1.3 ± 0.1, depending on the shape of the radiator. Figure 28 below shows the modelled required radiator oversizing factor to provide the same thermal output at a range of values of ∆𝑇. This shows that for a change to low flow temperatures of 50°C the radiators would have to be oversized (i.e. their 𝐾 value would need to be increased) by at least 2.4 to provide the same thermal output as at the
98 JOA report for speed comfort, July 2019, https://speedcomfort.co.uk/storage/Validation%20Report%20SpeedComfort%20_%20Final%2030.08.2019.pdf 99 This is achieved by using a lower flow temperature.

57
standard conditions of 75°C flow 65°C return.
Figure 28 – Oversizing required in radiators for different flow temperatures. In normal radiators n is between 1.2 and 1.4, so the dashed lines give the limit of normal behaviour in radiators. Oversizing of 1 is ability to meet heat demand (kW) at 75°C flow, 65°C return.
One way of increasing the thermal output of radiators is to increase the flow rate. This has the effect of reducing the temperature loss across the radiator, thereby increasing ΔT and in turn the thermal output of the radiator. Figure 29 below shows the modelled change in thermal output of a radiator at different flow rates at a range of flow temperatures. This demonstrates that the gains in thermal output from increasing the flow rate100 in existing radiators are small.
Figure 30 below shows the required flow rates at a range of flow temperatures for radiators with larger rated thermal outputs giving the same actual thermal output as in a standard case (75°C flow, 65°C return). This shows that whilst increasing the flow rate can reduce the need for larger radiators, when the flow temperature is significantly reduced larger radiators are still required. For example, as shown in Figure 29, at a flow temperature of 55°C it is not possible to achieve more than 63% of the original rated output of the radiator with any increase in flow rate.
The potential to increase the actual thermal output by increasing the flow rate has diminishing returns as flow temperature is decreased. This means that increased flow rate should only be considered as an option to mitigate the extent of additional and/or higher performance radiators required where the existing pipework allows for such an increase in flow rate. Considering 55°C flow temperature, increasing the flow rate by 3 times from the standard case gives an improvement in rated output of around 10%.
In addition to this, a decrease in the difference between the flow and return temperatures can lead to small improvements in the COP of a heat pump, so it may be preferable in these systems to run at higher flow rates to reduce the difference between the flow and return temperatures and get this efficiency advantage101, however for gas boiler systems a larger
100 Relative to that required to give the radiator’s standard output. 101 Element Energy analysis for BEIS has previously shown this. https://assets.publishing.service.gov.uk/government/uploads/system/uploads/attachment_data/file/700572/Hybrid_heat_pumps_Final_report-.pdf

58
difference between flow and return gives better efficiency, so in these systems an increase in flow rate could reduce the efficiency.
Figure 29 - This figure shows the relative flow rate required when installing a new radiator with a larger rated thermal output, in order to achieve the same actual thermal output. All numbers are relative to 75°C flow 65°C return.
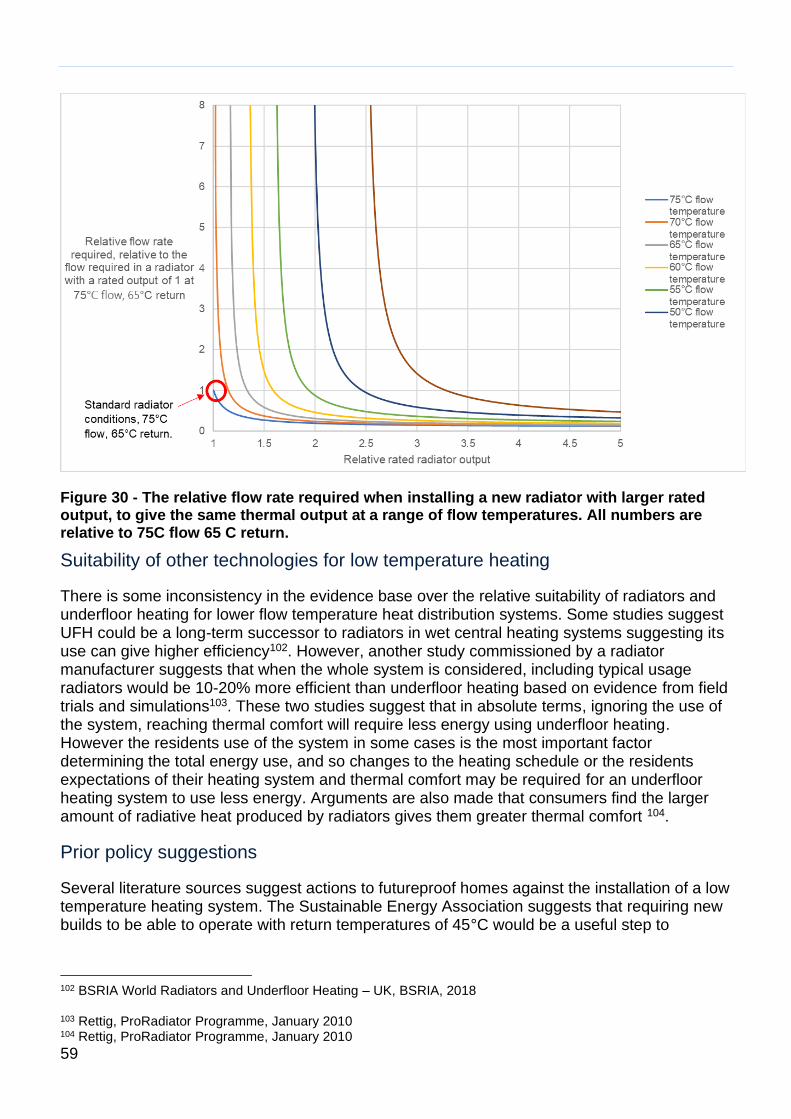
59
Figure 30 - The relative flow rate required when installing a new radiator with larger rated output, to give the same thermal output at a range of flow temperatures. All numbers are relative to 75C flow 65 C return.
Suitability of other technologies for low temperature heating
There is some inconsistency in the evidence base over the relative suitability of radiators and underfloor heating for lower flow temperature heat distribution systems. Some studies suggest UFH could be a long-term successor to radiators in wet central heating systems suggesting its use can give higher efficiency102. However, another study commissioned by a radiator manufacturer suggests that when the whole system is considered, including typical usage radiators would be 10-20% more efficient than underfloor heating based on evidence from field trials and simulations103. These two studies suggest that in absolute terms, ignoring the use of the system, reaching thermal comfort will require less energy using underfloor heating. However the residents use of the system in some cases is the most important factor determining the total energy use, and so changes to the heating schedule or the residents expectations of their heating system and thermal comfort may be required for an underfloor heating system to use less energy. Arguments are also made that consumers find the larger amount of radiative heat produced by radiators gives them greater thermal comfort 104.
Prior policy suggestions
Several literature sources suggest actions to futureproof homes against the installation of a low temperature heating system. The Sustainable Energy Association suggests that requiring new builds to be able to operate with return temperatures of 45°C would be a useful step to
102 BSRIA World Radiators and Underfloor Heating – UK, BSRIA, 2018 103 Rettig, ProRadiator Programme, January 2010 104 Rettig, ProRadiator Programme, January 2010

60
futureproof for the installation of low temperature systems105. However a BEIS consultation found the heating industry generally felt that future proofing increased costs for uncertain gain because of uncertainty about the development of technologies in the future. However, some respondents felt that hot water cylinders, or space for a hot water cylinder would be a useful futureproofing measure106.
The Future Homes Standard, 2019 Consultation
The Future Homes Standard consultation is a consultation on changes to Part L of the building regulations for new dwellings. It suggests that futureproofing of new dwellings should mean that they are designed to operate with a flow temperature of 55°C or lower. It is expected that this would result in larger heat emitters being installed than under current regulations and should ensure that no retrofit of larger area radiators would be required on installation of a low carbon heat source, it should be noted, that many low carbon heat sources operate with their best efficiency at 45°C and operation at 55°C would be less efficient than this. This would be a significant change to the standard installation procedure of heat distribution systems, as this study has shown that few heat distribution systems are currently designed for operation at this flow temperature. It is also proposed that self-regulation devices, e.g. a TRV, must be installed in every room in a dwelling.
Actions and products for improved performance
Since most of the UK stock of heat distribution systems is made up of wet central heating systems, the following section will focus on these systems.
In wet central heating systems performance enhancing measures and maintenance have two main purposes, the first is to improve the energy efficiency of the system, and the second is to improve the lifetime of the components. There are regulations described above enforcing most of the key performance enhancing measures at the time of installation, however there are few regulations regarding maintenance.
For most of these measures, there is limited information about their prevalence in homes and the number of sales. Stakeholders indicated that the demand for energy saving measures had increased in recent years due to consumers being increasingly environmentally conscious and that the market for these performance enhancing measures was expected to grow.
Performance enhancing actions
The actions described in this section will maintain the heat distribution system performance close to that of a new system and are considered best practice.
Hydraulic balancing
In wet central heating circuits, to maximise the efficiency of the whole system, the temperature difference between the inlet and outlet of each radiator needs to be the same. The temperature
105 Sustainable energy association, Heating System Plus Policy Position Paper, August 2016 106 A Future Framework for Heat in Buildings, Call for Evidence, Government Response, BEIS, December 2018

61
change over each radiator depends on the heating requirement of the room it heats and the flow rate across the radiator. This means that to maximise efficiency the flow rate through each radiator must be adjusted such that the temperature drop across each one is the same. When this is achieved each radiator exactly meets the heating requirements of the room it is in. This adjustment is known as hydraulic balancing and it is carried out by iterative adjustment of the lock shield valves on the outlet of each radiator, changing the flow rates to the required values. Balancing is a time-consuming process and can take a skilled plumber several hours in a standard house.
In unbalanced systems, radiators close to the boiler have a higher flow rate than required and those further away have lower flow rates than required. The effect of this on efficiency of the heating system is threefold. Firstly, if heating is required in radiators further from the heat source a variable speed pump (if there is one installed) may be turned up increasing its energy use. Secondly, if the system is set such that the further away radiators provide thermal comfort, rooms with radiators closer to the boiler may be too hot and so will be ventilated by opening a window, wasting energy. Thirdly, for condensing boilers there will be an efficiency penalty if the return temperature is too close to the flow temperature. If there is little temperature drop over the nearby radiators, and more over the further radiators, it will be harder to achieve a temperature difference that maximises efficiency.
Hydraulic balancing should be carried out during the installation of the system, and it also should be regularly checked, since the balancing can be changed by the build-up of sludge in radiators and pipes, or by the removal of radiators for decorating. In some cases variable valves such as TRVs can act to reduce the need for balancing (although not eliminate it), as they are able to restrict flow through radiators if the room that they are in heats up, so helping to more effectively distribute the heat through the heat distribution system.
Power flushing
Power flushing involves using a specialist high power pump to force water around the central heating system at high flow rates removing sludge deposits in the system107. Water that has been pumped around the central heating circuit is released at a purge point, carrying sludge with it. Power flushes typically cost around £400 - £750.
Manual flush
A manual flush involves removing radiators and flushing them with a hose to remove sludge. This can be done by a homeowner or a plumber, with a professional service costing around £150. In some systems with old pipework this may be a better option than a powerflush, as the high pressures used when powerflushing can cause leaks.
Radiator bleeding
Bleeding is the removal of air that accumulates at the top of radiators in central heating systems. The air is released from a valve at the top of the radiator. Removing this air, means that the radiator performs more efficiently.
107 https://www.emergencyplumber.uk.com/plumbing/central-heating-sludge/

62
Performance enhancing products for preventing sludge and limescale build up
These measures act to decrease the reduction in performance of heat distribution systems caused by sludge and limescale. Both corrosion inhibitors and water softeners108 are required by building regulations and magnetic filters have recently become regarded as best practice. There is only very little evidence suggesting that there may be a gain in performance from installing an aerator.
Corrosion inhibitors
Corrosion inhibitors are chemicals added to the water in the heating system that form a protective coating on the surface of the components in contact with the central heating water, preventing these from breaking down into sludge. The addition of an inhibitor is required by building regulations when a system is commissioned. The concentration of corrosion inhibitor in central heating system water should be checked by a water sample at least once per year since its concentration can be changed by radiator removal, draining of water during maintenance or absorption onto the surface of sludge109. Sludge is composed of many small particles and therefore has a very large surface area to volume ratio, the Heating and hot water industry council (HHIC) estimates that each gram of sludge adds an effective absorbing area for inhibitor of 0.75m, the HHIC also suspect that larger systems, which make up 26% of all systems, are often under inhibited, this is because installers tend to just add one bottle of inhibitor regardless of the size of the system.
Water softeners and limescale reducers
In hard water areas the build-up of limescale on the inside of boilers and the rest of the heating system can be a problem. British Water claims limescale can reduce a boiler’s efficiency by 12%, and Fernox, a water treatment product manufacturer, claims that limescale build up on the inside of pipes could increase fuel demand by 15%110. Hard water areas are particularly at risk of limescale build up and are defined as areas with water containing more than 200 mg/l of CaCO3. It has been estimated by the Energy Saving Trust that in areas with more than 300 mg CaCO3/l, the costs of maintenance and water heating could be reduced by up to £50 per year by using a water softener111. In hard water areas building regulations require the use of a water softener or limescale reducer.
Water softeners use salt to exchange the hard water Calcium Carbonate ions for Sodium in an ion-exchange process, this removes the possibility of limescale build up as there are no Calcium ions in the water to precipitate on surfaces.
Limescale inhibitors work by preventing the Calcium ions from building up on the inside of pipes rather than removing them from the water. Chemical scale reducers form a residue on the inside of pipework which prevents scale from building up. The cartridges for this need replacing every 6 months. Electrolytic scale reducers act as an electrochemical cell to produce Zinc ions which the limescale precipitates onto and this prevents build up in pipework. Magnetic scale reducers work in a similar way, with scale forming into crystals in the magnetic field so not sticking to pipes112.
108 Water softeners are only required in hard water areas. 109https://www.hvpmag.co.uk/Annual-inhibitor-checks-are-vital-for-system-protection-explains-the-HHIC/11131 110 https://www.viessmann.co.uk/heating-advice/how-to-prevent-limescale-in-boilers 111 Energy Saving Trust, product performance standard, Water Softeners 112 https://www.calmagltd.com/our-domestic-products/scale-inhibitors/

63
The surveys commissioned as a part of this project recorded whether a dwelling had a limescale inhibitor fitted to its heat distribution system. No limescale inhibitors were found in properties in Scotland or Wales since the water in those parts of the UK is predominantly soft. In England, 12% of dwellings in the survey sample were fitted with a limescale inhibitor. These were found predominantly in flats and smaller dwellings rather than larger detached dwellings; it is possible that this is because larger dwellings may have full salt-based water softening systems the presence of which was not recorded during the surveyor’s visit.
Magnetic filtration
Magnetic filters remove sludge from central heating systems, reducing the chance of sludge building up elsewhere in the system. These filters contain a magnetic rod which attracts sludge made of magnetic iron oxides and traps it inside a filter unit113. They are fitted on the return pipe just before the boiler and need to be cleaned every year. The fitting of magnetic filters is regarded as industry best practice, and many installers now do it as standard, however there is some controversy over the possible energy saving ability of magnetic filters. Some manufacturers suggest that filters are not known for energy savings and are also not a substitute for proper cleaning of systems. Other manufacturers claim that the installation of a magnetic filter can provide energy savings of up to 6% per year.
It was found that magnetic filters were present in 27% of the sample of dwellings surveyed for this project, magnetic filters were found more commonly in larger dwellings.
Figure 31 - A magnetic filter.
De-aeration
De-aeration is the removal of air bubbles in the central heating system that would otherwise reduce performance by up to 6%. Air reduces performance by reducing water mass flow rates,
113 https://www.adey.com/themes/adey/assets/downloads/Pro_Installation.pdf

64
or by gathering in the top of radiators114. Several different de-aeration products are sold on the market, including: bottle vents, microbubble removers, and automatic bleeding valves installed at high points in the system. Some manufacturers claim that their de-aeration devices can offer energy use reductions to the consumer by changing the thermal conductivity of the water in the system, however it is unclear if the results from any independent tests support this claim. Stakeholders suggested that if dissolved air in the system was removed by a deaerator then there may be less corrosion in the system and so less sludge, but no robust evidence has been found to support this claim.
Performance enhancing measures to improve radiator output
Increasing the output of radiators in a heat distribution system allows for thermal comfort to be met more easily and at a lower flow temperature. There is robust evidence supporting that the use of radiator fans can increase radiator outputs. High performance radiators will also provide increased output at lower flow temperature, but their high cost and the disruption from their fitting means that they will not be suitable for most dwellings. If a radiator was being replaced, it would be cheaper to install a significantly larger one than to change to a high performance radiator. There is some evidence suggesting that heat transfer modifiers may be able to increase the thermal output of radiators, but a more robust series of tests and case studies will be required to further verify this.
Radiator fans
It is possible to fit fans to blow air across radiators, rather than relying on natural convection to drive the air flow. This increases the heat output of the radiator, particularly at low temperatures where convective air flow would otherwise be slow. An independent testing report commissioned by a manufacturer of radiator fans suggests that energy savings of 11.2% on average can be achieved in a room by fitting a radiator fan, with an increase in radiator output of 14.3% to 19.4%. These savings arise from the fan providing higher boiler efficiency due to a reduced return temperature, faster heat up times of the room and lower temperature stratification leading to the same degree of thermal comfort being achieved at a lower thermostat setting. In addition to this, the independent report presents the results from a survey of 1,700 users of the radiator fan, which suggests that 71.7% experienced better thermal comfort after the fans installation. In addition, 17% of respondents to the survey noticed a reduction in energy use after the installation of the fan115.
High performance radiators
High performance radiators often combine very low water volumes with fans or other convection boosting measures. Often, they are made from aluminium since it suits low water volume applications due to its high heat conductivity. These radiators are usually marketed as being best installed with heat pumps and tend to be significantly more expensive than conventional radiators116. For example, the Stelrad elite steel panel 300x500 has a heat output of 388W and costs £26.53, while the high-performance aluminium Jaga Linea plus 200x700 has a heat output of 398W and costs £120, almost 5x the price of a steel radiator with the same output. High performance radiators are more efficient than steel panel radiators since
114 https://www.installeronline.co.uk/deaeration-maximise-heating-system-efficiency/ 115 JOA report for speed comfort, July 2019, https://speedcomfort.co.uk/storage/Validation%20Report%20SpeedComfort%20_%20Final%2030.08.2019.pdf 116 https://www.dimplex.co.uk/smartrad

65
they tend to have a lower thermal mass, which allows the radiators to heat up faster. In addition to this, since it is quicker to heat up and cool down, there is less chance of overshooting the desired temperature and wasting energy in this way. A study from Jaga suggests that high performance radiators can be 15% more efficient in mild and 5% more efficient in cold winter conditions than steel panel radiators117. There is currently only a very small market for high-performance radiators.
Heat transfer modifiers
Some companies produce additives which change the thermal properties of water to improve the efficiency of the central heating system. One manufacturer suggests that their product (a plant-based surfactant) improves efficiency by 15% with evidence from laboratory testing. This product works by reducing the heat capacity and surface tension of the water allowing radiators to heat up quicker and emit more power for the same temperature difference across them118. There has been some discussion of the effectiveness of these additives, with some parties suggesting that it is not clear that their effectiveness has been rigorously independently tested119. Further trials of these products in domestic properties are necessary to confirm any potential savings.
Performance enhancing measures to prevent waste heat
Some heat distribution systems may waste heat, by radiating it through external walls, loosing hot air by ventilation or overheating some rooms due to poor hydraulic balancing or other heat gains. Thermostatic radiator valves act to reduce the overheating of rooms and there is very robust information about their energy saving ability. Radiator reflectors will prevent some radiative loss, but their actual effectiveness is not well known. Heat recovery is often used in dwellings e.g. from waste water to heat domestic hot water, but it is not clear if it is often used to heat water for central heating.
Thermostatic radiator valves
As explained above TRVs allow for automatic regulation of radiator output as the room temperature changes. TRVs contain a temperature sensitive material which expands to block the valve when the temperature in the room increases to a set level, restricting the flow through the radiator and lowering its thermal output. The amount of expansion required to block the valve can be manually changed by rotation of the valve allowing for the room temperature to be set at a range of different values. TRVs can also reduce, but not eliminate, the impact of bad hydraulic balancing, as they are able to limit the amount of overheating that this causes in rooms and give a lower resistance path into underheated rooms. Studies have suggested that using TRVs rather than wheelhead valves can reduce energy use by 15%, however it is estimated that savings of around 3% are more realistic. It was estimated in December 2016 that between a half and a third of UK households have a TRV installed on every radiator and a survey suggested that 66% of households have at least one120,121.
117 http://www.jagamaktes.com/pdf/jaga-low-h2o-energye-efficiency-study.pdf 118https://patentimages.storage.googleapis.com/fa/71/b1/c5fccad4d5f031/US10435605.pdf 119https://www.ncm-pcdb.org.uk/sap/filelibrary/pdf/Principle%20Papers/SAP-Principle-Paper---Treatment-of-Heat-Transfer-Modifiers--Inhibitors--Flushing-Techniques-and-Inline-Cleaners---V1.2.pdf 120 http://www.avnir.org/documentation/book/LCAconf_andrews_2012_en.pdf 121https://assets.publishing.service.gov.uk/government/uploads/system/uploads/attachment_data/file/575299/Heat_in_Buildings_consultation_document_v1.pdf

66
Figure 32 - A thermostatic radiator valve.
Although a large fraction of the population has TRVs installed in their homes, the results from the surveys collected for this project suggest that a much smaller fraction of the population actually use these to adjust the temperature of their rooms. Just 16% of the surveyed residents suggested that they “sometimes” used TRVs and only 3% said that they “often” used TRVs to change the heat output of their radiators. TRVs were used most commonly in dwellings built between 1965 and 1990, with their use less common in newer and older dwellings, these trends are shown in Figure 33.
Figure 33 – TRV use by dwelling age.

67
Radiator reflectors
Radiator reflectors are infrared mirrors usually made of reflective foil placed behind a radiator to reduce radiative heat loss through an outer wall. As much as 20% of the total heat of a radiator might be radiated to the back wall, although this number will depend on the size and type of radiator and the flow temperature. One manufacturer of reflectors claims that heat transfer through the wall behind the radiator is reduced by 45% when their reflector is installed, this would give an overall efficiency gain of 11.3% compared to the base case where the heat is lost, with the assumption that all of the heat transferred through the wall behind the radiator is usually lost. Modern radiators are often designed to limit radiative heat loss to the wall behind them so it is unclear if this effect will be as large in practice. It is also possible to install additional insulation behind the radiator to limit this conduction through the properties wall, but few studies have explored what the possible energy savings from this installation might be.
Air heat recovery
Heat recovery systems use a heat exchanger at the top of a building which uses warm air leaving the building to warm cool air entering the building. Some systems can extract 90% of the heat from air leaving the building122. It has been suggested that heat recovery systems can reduce the need for heating in properties by 25%, however only fully airtight homes are suitable and domestic systems are expensive, typically costing between £2,000 and £4,000123.
Wastewater heat recovery
Wastewater heat recovery is a system where hot water from shower drains is passed through a heat exchanger to preheat the mains water traveling into the boiler, this is typically used to heat domestic hot water, but it could be possible to also heat water in a central heating system. These devices are typically 60% efficient, but can be higher124,125 and allow an average home to save £20-30 on their heating bill annually. However, these systems are very difficult to retrofit and often are not cost effective due to the high upfront cost, with typical domestic installation costs around £1,000 including labour126.
Further innovations
In general innovations in heat distribution systems are often rejected by consumers and industry due to their increased cost, however there are some examples of current innovative products. One company produces an aluminium plate which attaches to the top of a radiator and creates a more efficient upward flow of hot air. Its manufacturers claim independent tests have proved it can reduce heating bills by 11.5%127. Some studies have suggested that pulsed
122https://www.renewableenergyhub.co.uk/main/heat-recovery-systems-information/how-do-heat-recovery-and-ventilation-systems-work/ 123https://www.renewableenergyhub.co.uk/main/heat-recovery-systems-information/savings-when-using-heat-recovery-and-ventilation-systems/ 124 https://powerpipehr.co.uk/ 125 https://showersave.com/ 126 https://www.thegreenage.co.uk/tech/waste-water-heat-recovery-systems/ 127 https://energysquirrel.co.uk/wp-content/uploads/2014/05/Radiator-Squirrel-Test-Results-Exec-Summary.pdf

68
flow through radiators can produce the same amount of heating with less energy use, however it is unclear if this has been rigorously tested in a domestic environment128,129.
Other companies have released self-balancing radiators, which come pre fitted with the correct valves. These are pre-set for a heat drop over the radiator at a certain flow pressure. This ensures good but not perfect balancing due to different length pipes between the radiators, allows for no extra adjustment time during installation, and ensures that with a gas boiler the return temperature is below the condensing point increasing efficiency130.
Evaluation of performance enhancing measures
The performance enhancing measures discussed above are in varying stages of development and have different levels of robustness surrounding their performance improving ability. The performance enhancing actions and measures to reduce sludge and limescale are all required by building regulations or regarded as best practice (except deaerators). Thermostatic radiator valves have a proven energy saving ability of around 3%. There is evidence supporting the use of radiator fans for increasing the heat output of radiators and these can lead to energy savings in the range of 11% and 15% with gas boilers in laboratory tests, but more work is needed to quantify the impact of this and of other measures in real dwellings.
128https://research.ncl.ac.uk/protem/components/pdfs/ICAE2013/Effect_of_flow_pulsation_on_energy_consumption_of_a_radiator_in_a_centrally_heated_building.pdf
129https://watermark.silverchair.com/ctu024.pdf 130 Stelrad Radical technical information

69
Conclusions
Heat distribution systems in the UK
Most heat distribution systems in the UK are wet systems with radiators. In England 89% of dwellings have wet central heating with radiators. In Wales 94%, in Northern Ireland 96% and in Scotland, 86% of dwellings are thought to have wet central heating131. There is a growing market for underfloor heating especially for houses changing to a low temperature heat source, underfloor heating made up 4% of the combined radiator and underfloor heating market in 2018132, and it was present in at least 1 room in 2% of dwellings surveyed for this project. Older heat distribution systems tend to be vented, non-combination, with newer systems tending to be sealed system or sealed combination boiler systems. Combination boilers becoming increasingly common and many new houses are not built with space for a hot water cylinder.
Design, commissioning, and installation of heat distribution systems
The design and commissioning of heat distribution systems has changed relatively little over time. Some aspects of best practice, such as installing TRVs on radiators and installing magnetic filters have, however, become more common. Adding inhibitor to the water in the system only became common in the 2000s.
Some installers will do the minimum possible required to meet the building regulations, meaning that systems are rarely hydraulically balanced and are often significantly oversized. Magnetic filters, found in 27% of dwellings, tend to be installed in larger, better insulated homes. Limescale inhibitors were found in 12% of dwellings in England. 18% of residents surveyed used thermostatic radiator valves “sometimes” or “often”. Although an annual service of a heat distribution system is regarded as best practice, only 20% of dwellings undertake this, and residents’ understanding of what is involved in a service is low.
The market for heat distribution systems
The market for heat distribution systems is mature and significant changes in the market are uncommon. A current trend is that the share of underfloor heating installations is increasing, although stakeholders did not expect this growth to continue indefinitely due to issues with the installation and costs of these systems. Designer, towel rail, and high-performance radiators have small but growing market shares.
Inefficiencies of heat distribution systems and performance enhancing measures
The main inefficiencies of heat distribution systems are poor hydraulic balancing, which can reduce performance by over 10%133 134; the build-up of sludge which can reduce efficiency by 15%135; air which reduces the system performance by 6%136; or limescale which can reduce
131 Assumptions detailed in methodology. 132 BSRIA World Radiators and Underfloor Heating – UK, BSRIA, 2018 133 BEIS, Heat in Buildings: Boiler Plus, October 2017 134 Sustainable energy association heating system plus, August 2015 135 https://www.eua.org.uk/uploads/5A8D4F9A4E161.pdf 136 https://www.installeronline.co.uk/deaeration-maximise-heating-system-efficiency/

70
the efficiency by 15%137. It is relatively straightforward to address these inefficiencies through proper commissioning, maintenance, and cleaning, for example a powerflush of the system followed by balancing of the radiators and the fitting of a water softening device could resolve all these issues in an existing system.
Several performance enhancing actions and measures are available for heat distribution systems. Some act to keep the system performing to its installation specification, whereas others claim to provide additional performance benefits to the system. The market for these products has been increasing in recent years and is expected to increase further as products perceived to be “good for the environment” become more popular. The performance enhancing measures with evidence supporting their use are: thermostatic radiator valves, prior government policy appraisals have estimated that these can provide a 3% energy saving138; radiator fans, a survey of 1700 users of a radiator fan in the Netherlands found that thermal comfort was improved in 71% of cases, however more robust field trial would be needed to quantify the exact energy saving in real properties. There is also some evidence to suggest that high performance radiators, heat transfer modifiers, radiator reflectors, and other measures improve performance, but further independent testing in real properties is needed to verify and quantify all these savings.
Capacities of heat distribution systems and suitability of the UK housing stock for low temperature heat sources.
Oversizing is a measure of the rated output (kW) of the radiators in the dwelling divided by the calculated heat demand (kW) of a dwelling. The heat distribution systems in the sample of properties surveyed for this project have a mean oversizing of 1.5 with a median of 1.3. There is a large spread in the oversizing of heat distribution systems with many being significantly undersized and oversized.
There are significant uncertainties in the analysis of oversizing presented in this report, these arise from uncertainties about the performance of radiators in “real” systems and uncertainties in the calculation of the heat loss coefficient by the RdSAP methodology. These uncertainties are addressed using a sensitivity analysis based on a 10% reduction in radiator performance and a 45% increase in heat demand (kWh). The impact of the uncertainties on the proportion of UK dwellings that can be heated at a specific flow temperature is given in the section Conversion of Heat Distribution Systems to low Temperature heat sources.
Analysis of the sizes of heat distribution systems has revealed that 10% of UK dwellings with
wet central heating systems can meet heat demand (kW) at a 55°C flow temperature, and 1%
with a 45°C flow temperature, on a peak heating day, with no changes to their heat distribution
system139. In addition to this, 53% of dwellings could use a 55°C flow temperature, and 8%
45°C flow temperature, on the average winter day with no changes to their heat emitters or flow rates. These results are significant, since they quantify the changes required to dwellings when low temperature heat sources are installed. Typical costs for retrofitting heat emitters for low temperature heating are £1700 for a 1-2-bedroom house, £2200 for a 3-bedroom house
137 https://www.viessmann.co.uk/heating-advice/how-to-prevent-limescale-in-boilers 138https://assets.publishing.service.gov.uk/government/uploads/system/uploads/attachment_data/file/575299/Heat_in_Buildings_consultation_document_v1.pdf 139 These values are based on manufacturers rated heat output of radiators and SAP estimations of heat demand, it is possible that older radiators in poorly maintained systems are unable to reach the manufacturers heat demand, and that the actual heat required for dwellings is larger than that estimated by SAP. Further work will be required to better understand the impacts of changing heat distribution systems in dwellings to lower flow temperatures.

71
and approximately £2900 for a 5-bedroom house, so the avoidance of this cost is significant for future work examining the costs of a change in the UK housing stock to low temperature heating, it is possible that hybrid systems or other back-up systems would be feasible in 55%140 of dwellings that already have wet central heating.
Appendices
1 Radiator Data Bins
The following specific rated thermal output values have been used to calculate the rated thermal output of different radiator types of different footprints.
140 The proportion that can meet heat demand on an average winter day.
Footprint Range (cm^2) Average Output/cm^2
Lower Upper
Type 10 1200 3180 0.114
Type 10 3181 5160 0.111
Type 10 5161 7140 0.109
Type 10 7141 9120 0.108
Type 10 9121 11100 0.108
Type 10 11101 13080 0.108
Type 10 13081 15060 0.108
Type 10 15061 17040 0.107
Type 10 17041 19020 0.107
Type 10 19021 21000 0.107
Footprint Range (cm^2) Average Output/cm^2
Lower Upper
Type 11 1200 3180 0.174
Type 11 3181 5160 0.170
Type 11 5161 7140 0.169
Type 11 7141 9120 0.168
Type 11 9121 11100 0.167
Type 11 11101 13080 0.167
Type 11 13081 15060 0.167
Type 11 15061 17040 0.166
Type 11 17041 19020 0.166
Type 11 19021 21000 0.166

72
2 Housing survey data corrections
The Scottish housing survey only lists the age of properties as “post 1982” since we were interested in the proportion that were “post 1990” a correction where the proportion of
Footprint Range (cm^2) Average Output/cm^2
Lower Upper
Type 20 1200 3180 0.193
Type 20 3181 5160 0.182
Type 20 5161 7140 0.181
Type 20 7141 9120 0.180
Type 20 9121 11100 0.179
Type 20 11101 13080 0.178
Type 20 13081 15060 0.177
Type 20 15061 17040 0.177
Type 20 17041 19020 0.177
Type 20 19021 21000 0.176
Footprint Range (cm^2) Average Output/cm^2
Lower Upper
Type 21 1200 3180 0.246
Type 21 3181 5160 0.237
Type 21 5161 7140 0.234
Type 21 7141 9120 0.232
Type 21 9121 11100 0.231
Type 21 11101 13080 0.230
Type 21 13081 15060 0.229
Type 21 15061 17040 0.229
Type 21 17041 19020 0.228
Type 21 19021 21000 0.228
Footprint Range (cm^2) Average Output/cm^2
Lower Upper
Type 22 1200 3180 0.309
Type 22 3181 5160 0.303
Type 22 5161 7140 0.298
Type 22 7141 9120 0.296
Type 22 9121 11100 0.295
Type 22 11101 13080 0.294
Type 22 13081 15060 0.293
Type 22 15061 17040 0.293
Type 22 17041 19020 0.292
Type 22 19021 21000 0.292

73
dwellings across the rest of the UK that were built between 1982 and 1990 was multiplied by the weight of each post 1982 dwelling and added to the 1965-1990 bin, and the remaining weight of the properties in the post 1982 bin were placed in the post 1990 bin. In addition the Scottish household survey only lists if a house is a terrace, not a mid or end terrace, the terraced houses weights were divided into min and end terraces in the same proportion that these were found across the rest of the UK housing stock using the method described above.
The Northern Irish house conditions survey only details if a property has <100mm of loft insulation, whereas we required a <50mm bin. The dwellings in Northern Ireland with <100mm loft insulation had their weighting distributed between the <50mm and 50-150mm bins in the same proportions as dwellings in the rest of the UK (which had between 0 and 100mm of insulation).
3 Correlations used for mapping to UK housing stock
The graphs shown in this section show the correlations between archetype characteristics and heat distribution system attributes that were used in order to map the attributes to the UK housing stock. The majority of correlations identified related to the building type, or age, but we did consider the relationship will all attributes, and where relevant these graphs are included.
Oversizing factor
The oversizing factor was mapped using the property age.
Figure 34 – Oversizing for different property ages.

74
Figure 35 – Oversizing for dwelling types.
Figure 36 – Oversizing for different wall types.
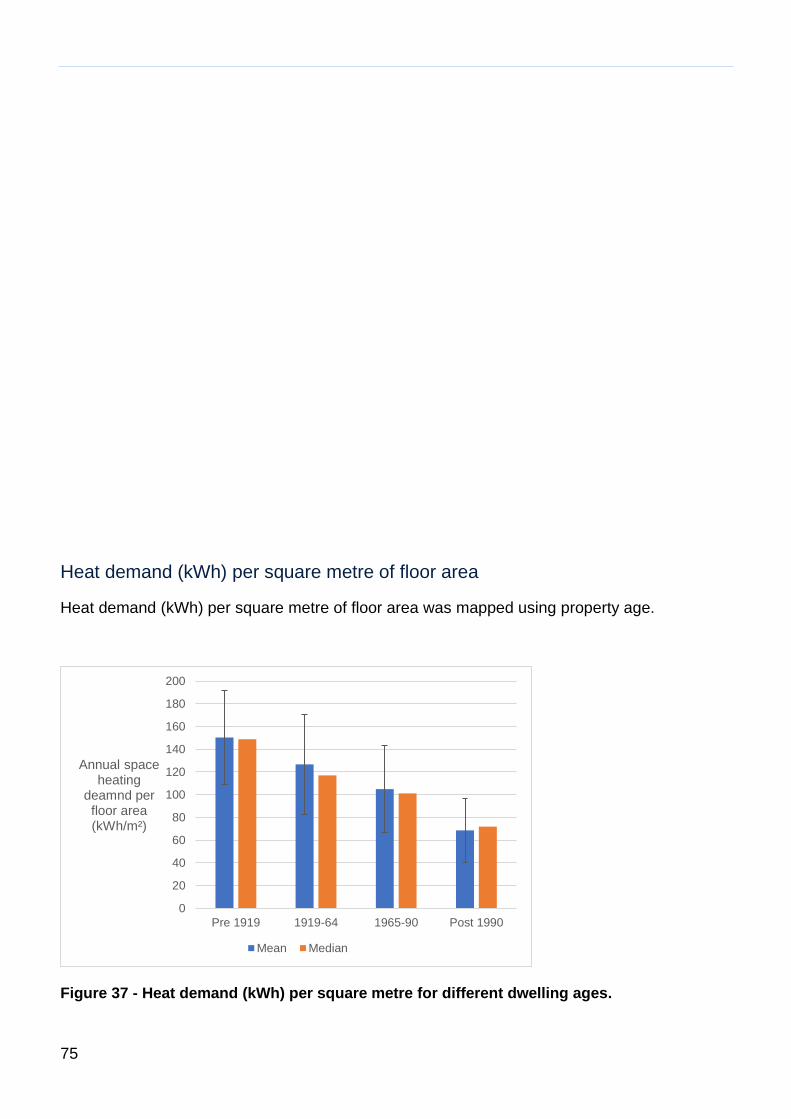
75
Heat demand (kWh) per square metre of floor area
Heat demand (kWh) per square metre of floor area was mapped using property age.
Figure 37 - Heat demand (kWh) per square metre for different dwelling ages.
0
20
40
60
80
100
120
140
160
180
200
Pre 1919 1919-64 1965-90 Post 1990
Annual space heating
deamnd per floor area (kWh/m²)
Mean Median

76
Figure 38 - Heat demand (kWh) per square metre for different house types.
Figure 39 – Heat demand (kWh) per square meter for different wall types.
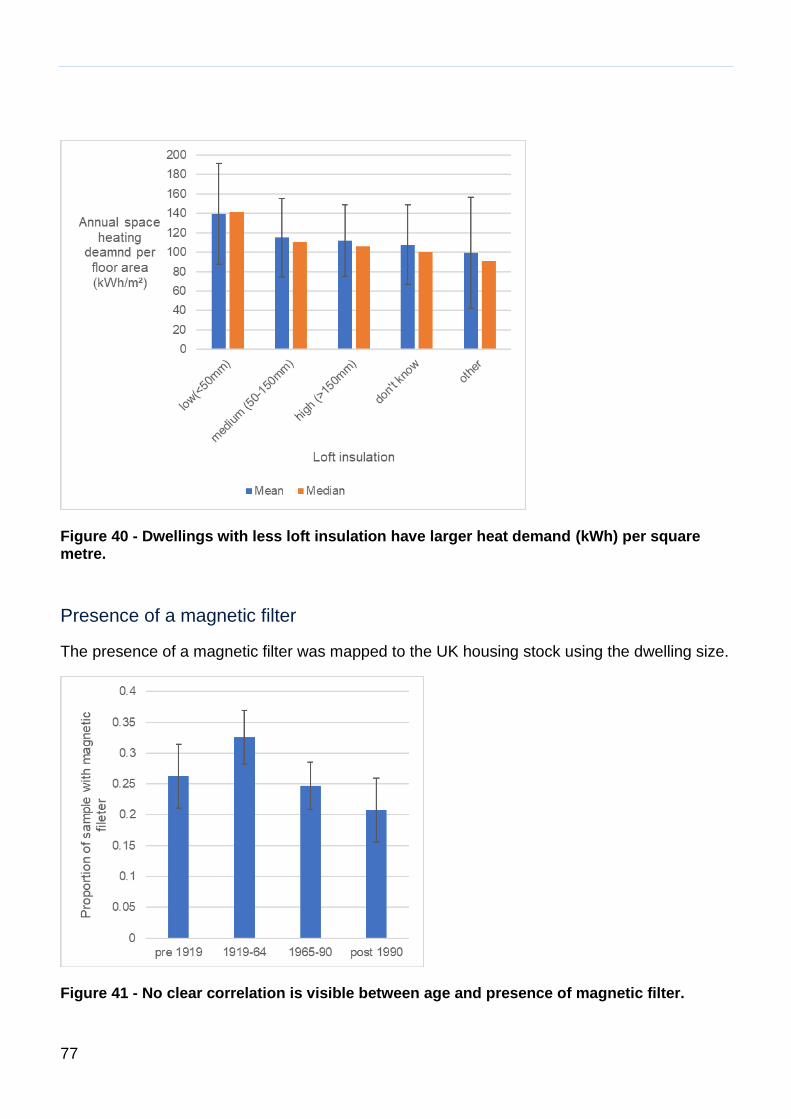
77
Figure 40 - Dwellings with less loft insulation have larger heat demand (kWh) per square metre.
Presence of a magnetic filter
The presence of a magnetic filter was mapped to the UK housing stock using the dwelling size.
Figure 41 - No clear correlation is visible between age and presence of magnetic filter.

78
Figure 42 - Proportion of each dwelling type with a magnetic filter.
Figure 43 - Dwellings in the sample with more loft insulation are more likely to have a magnetic filter.
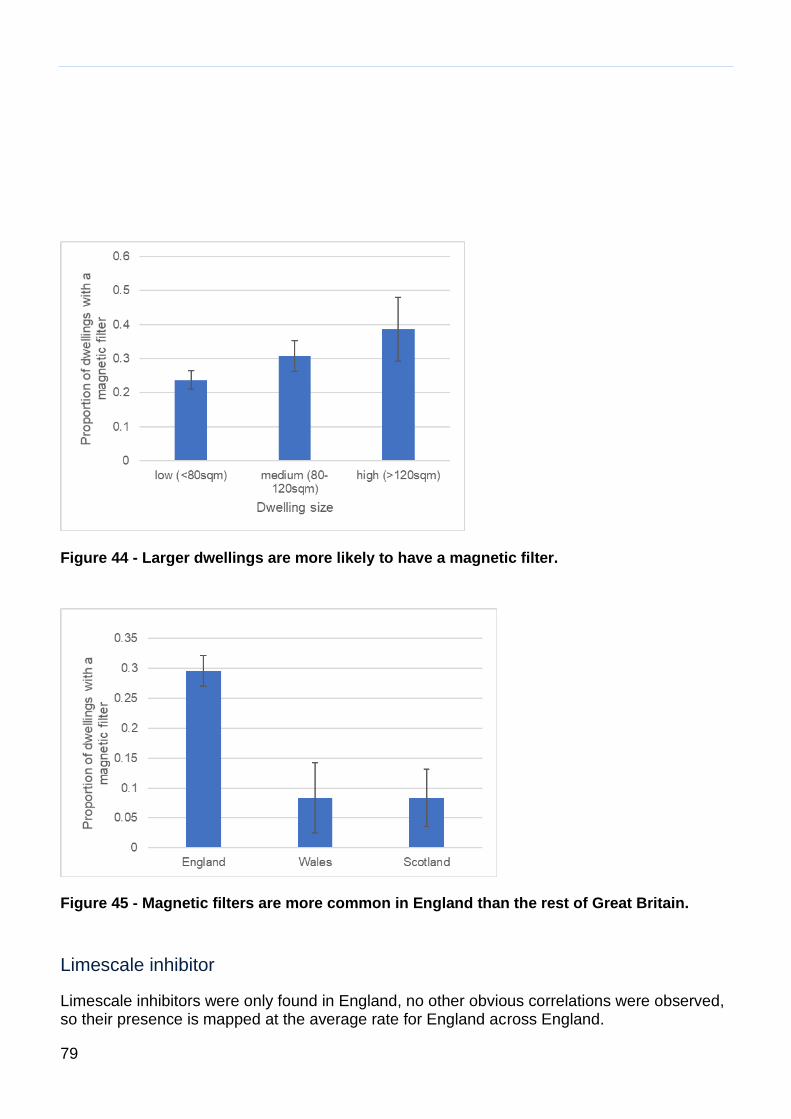
79
Figure 44 - Larger dwellings are more likely to have a magnetic filter.
Figure 45 - Magnetic filters are more common in England than the rest of Great Britain.
Limescale inhibitor
Limescale inhibitors were only found in England, no other obvious correlations were observed, so their presence is mapped at the average rate for England across England.
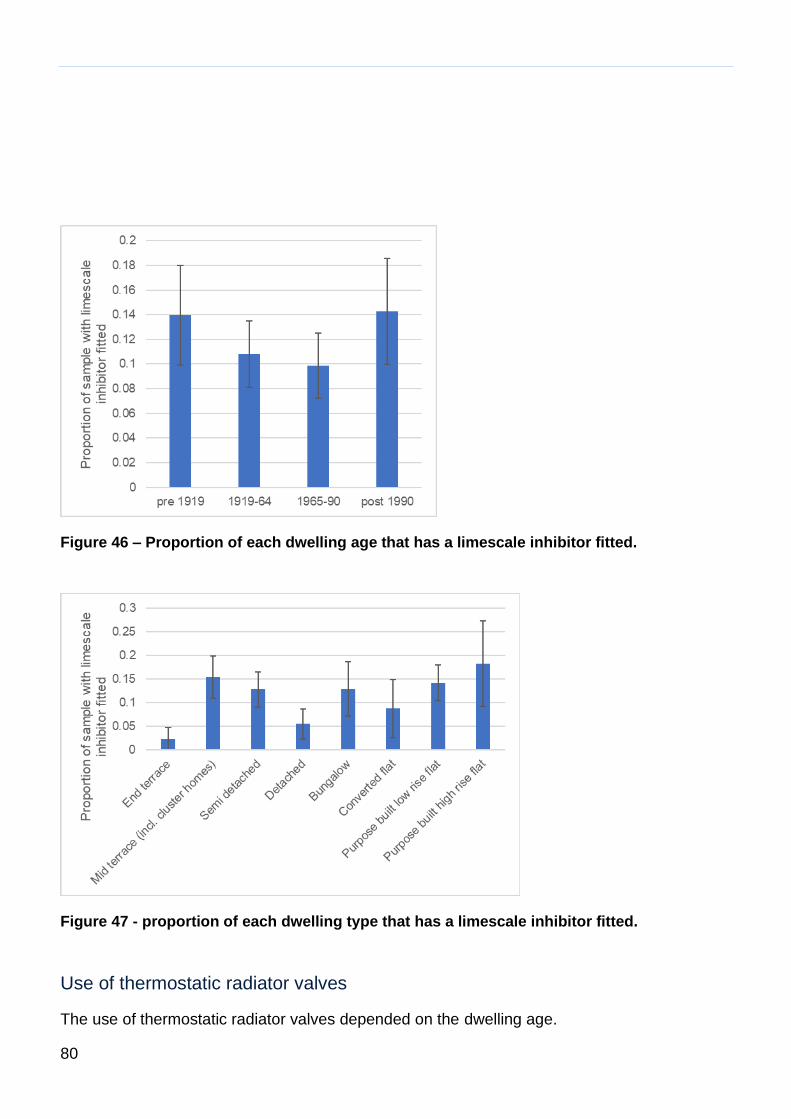
80
Figure 46 – Proportion of each dwelling age that has a limescale inhibitor fitted.
Figure 47 - proportion of each dwelling type that has a limescale inhibitor fitted.
Use of thermostatic radiator valves
The use of thermostatic radiator valves depended on the dwelling age.
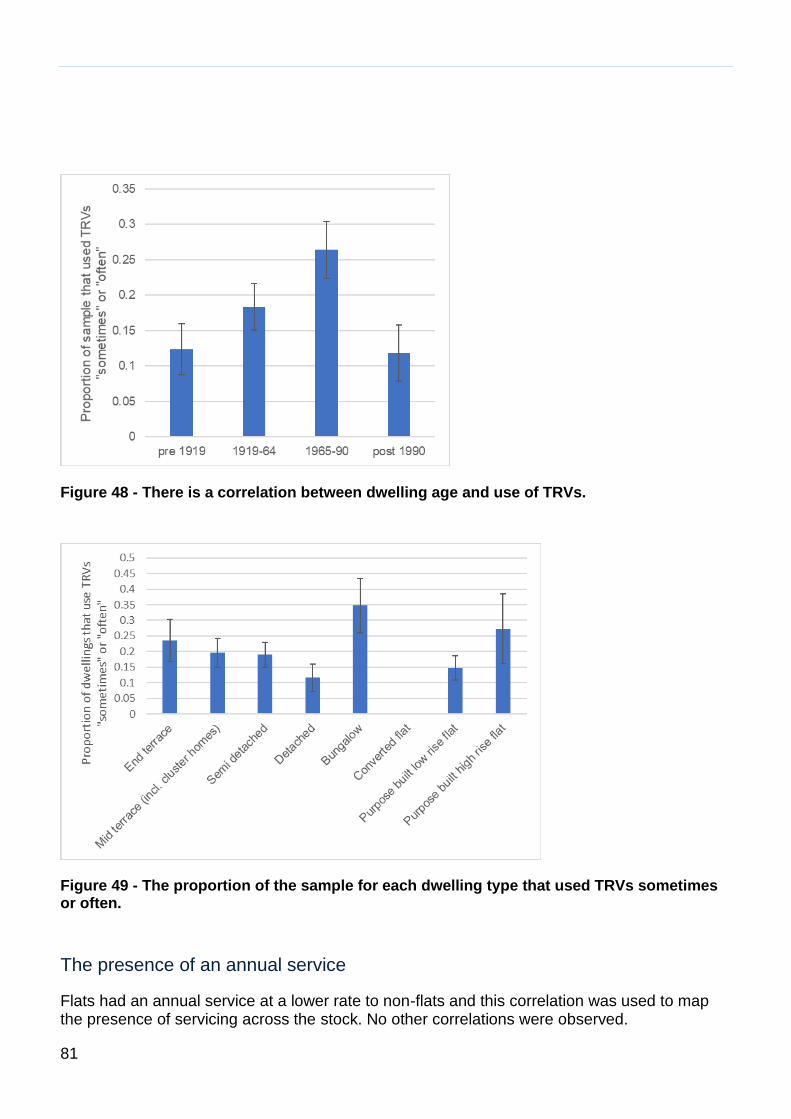
81
Figure 48 - There is a correlation between dwelling age and use of TRVs.
Figure 49 - The proportion of the sample for each dwelling type that used TRVs sometimes or often.
The presence of an annual service
Flats had an annual service at a lower rate to non-flats and this correlation was used to map the presence of servicing across the stock. No other correlations were observed.

82
Figure 50 - There is a correlation between house type and the presence of an annual service of the heat distribution system.
4 Survey Questions
In some cases the questions are abridged for clarity.
1 What has triggered this EPC (e.g. Rental or RHI)?
2 Type of property (e.g. Detached)
3 Number of rooms in dwelling
4 Number of rooms heated by Underfloor heating, radiators, hot air, other
5 Means of generating heat (e.g. Gas boiler)
6 Type of heating system (Vented/Sealed/Combination)
7 Distribution of hot water (Ring or Start circuit)
8 Temperature set point of heating system °C
9 Type of pipework (copper/plastic/cast iron)
10 Type of pump (single/multi/variable speed)
11 Is there a magnetic filter?
12 Is there a electrolytic limescale filter fitted?
13 How is the heat distribution system activated (e.g. timer)?

83
14 In a typical 24-hour weekday period during the heating season, how long is the heating switched on?
15 Do you often use TRVs to change the heat output of radiators? In which rooms?
16 Do you have trouble heating your home to the desired temperature?
17 Do you experience Noise from radiators?
18 Do you experience Radiators hot at bottom and cold at top?
19 Do you experience some radiators hot while others cold?
20 What is the boiler capacity?
21 What is the capacity of each radiator (surveyor to photograph each radiator and provide measurements of its height and width)?
22 What type of valve is there at each heat emitter?
23 What is the EPC estimated energy consumption of the house for space heating and hot water?
24 When was the house built ?
25 How long has the resident occupied the property?
26 Have the radiators ever been replaced? When?
27 Have the pumps ever been replaced? When?
28 Have the valves ever been replaced? When?
29 Have the pipes ever been replaced? When?
30 How much did any changes to the heat distribution system cos?
31 How often is the heat distribution system serviced?
32 What does the service of the heat distribution system entail?
33 Who does the servicing of the heat distribution system?
34 Is the servicing under contract?

84
5 Radiator photographs
Figure 51 - A type 11 radiator.

85
Figure 52 - A type 21 radiator.
Figure 53 - A section of a type 22 radiator.

86

87
This publication is available from: https://www.gov.uk/government/collections/heat-pump-research
If you need a version of this document in a more accessible format, please email [email protected]. Please tell us what format you need. It will help us if you say what assistive technology you use.