domestic and foreign direct investment realization · investment realization in quarter ii 2019: rp...
TRANSCRIPT

DOMESTIC AND FOREIGN DIRECT INVESTMENT REALIZATIONQUARTER II AND JANUARY – JUNE 2019
INDONESIA INVESTMENT COORDINATING BOARD
Jakarta, July 30th 2019

The Investment Coordinating Board of the Republic of Indonesia
2
TABLE OF CONTENTS
I QUARTER II AND JANUARY – JUNE 2019: In Comparison with 2018
II QUARTER II 2019: Sector, Location, and Country of Origin
III JANUARY – JUNE 2019: Sector, Location, and Country of Origin
IV INDONESIAN LABOR ABSORPTION
V PROGRESS OF INVESTMENT REALIZATION 2014 – JUNE 2019

The Investment Coordinating Board of the Republic of Indonesia
3
I. Quarter II and January - June 2019 : In Comparison with 2018
The Investment Coordinating Board of the Republic of Indonesia
4
*) The Target of 2019 in accordance with letter of Head of BKPM No. 371/A.1/2018 dated 05th September 2018 regarding The Revision of Targets Investment of2018-2019 to Minister of National Development Planning/Head of Bappenas and Minister of Finance
**) against The Targets of 2019
Investment Realization in Quarter II 2019
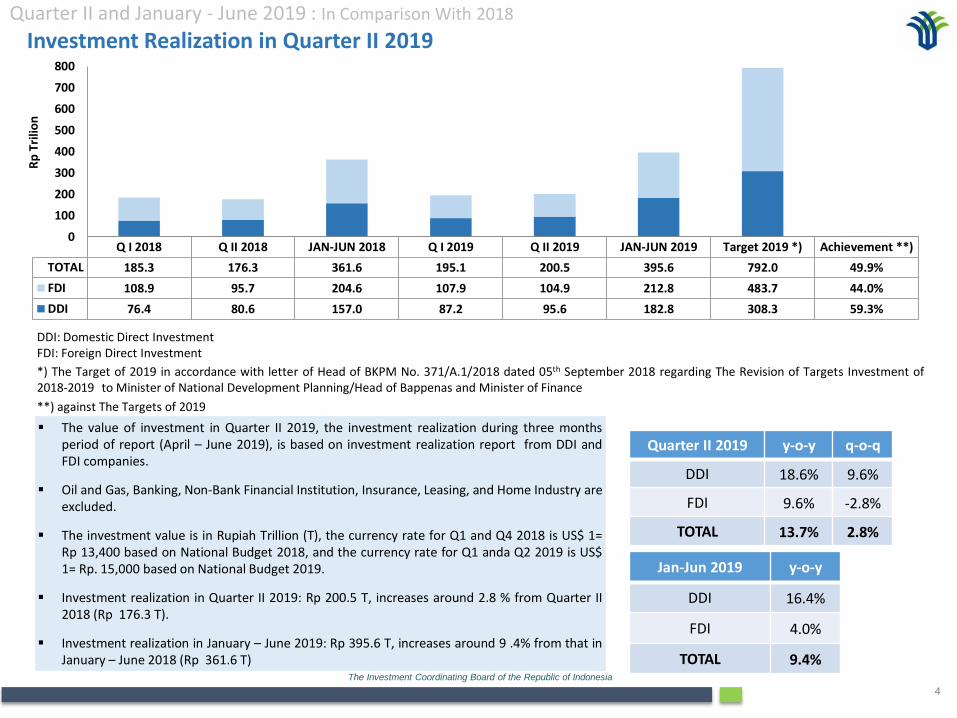
▪ The value of investment in Quarter II 2019, the investment realization during three monthsperiod of report (April – June 2019), is based on investment realization report from DDI andFDI companies.
▪ Oil and Gas, Banking, Non-Bank Financial Institution, Insurance, Leasing, and Home Industry areexcluded.
▪ The investment value is in Rupiah Trillion (T), the currency rate for Q1 and Q4 2018 is US$ 1=Rp 13,400 based on National Budget 2018, and the currency rate for Q1 anda Q2 2019 is US$1= Rp. 15,000 based on National Budget 2019.
▪ Investment realization in Quarter II 2019: Rp 200.5 T, increases around 2.8 % from Quarter II2018 (Rp 176.3 T).
▪ Investment realization in January – June 2019: Rp 395.6 T, increases around 9 .4% from that inJanuary – June 2018 (Rp 361.6 T)
DDI: Domestic Direct InvestmentFDI: Foreign Direct Investment
Quarter II and January - June 2019 : In Comparison With 2018
Quarter II 2019 y-o-y q-o-q
DDI 18.6% 9.6%
FDI 9.6% -2.8%
TOTAL 13.7% 2.8%
Jan-Jun 2019 y-o-y
DDI 16.4%
FDI 4.0%
TOTAL 9.4%
Q I 2018 Q II 2018 JAN-JUN 2018 Q I 2019 Q II 2019 JAN-JUN 2019 Target 2019 *) Achievement **)
TOTAL 185.3 176.3 361.6 195.1 200.5 395.6 792.0 49.9%
FDI 108.9 95.7 204.6 107.9 104.9 212.8 483.7 44.0%
DDI 76.4 80.6 157.0 87.2 95.6 182.8 308.3 59.3%
0
100
200
300
400
500
600
700
800
Rp
Tri
lion

The Investment Coordinating Board of the Republic of Indonesia
5
Investment Realization in Quarter II and January – June 2019 Compared to The Same Period in 2018 : DDI and FDI
Quarter II 2018 Quarter II 2019
Jan-Jun 2018 Jan-Jun 2019
1. Quarter II 2018 and Quarter II 2019 : DDI and FDI
2. Jan-Jun 2018 and Jan-Jun 2019 : DDI and FDI
T= Trillion
Realization y-o-y
DDI 16.4%
FDI 4.0%
TOTAL 9.4%
Realization y-o-y
DDI 18.6%
FDI 9.6%
TOTAL 13.7%
Quarter II and January - June 2019 : In Comparison With 2018
DDIRp 95.6 T(47.7%)
FDIRp 104.9 T
(52.3%)
Total : Rp 200.5 T
DDIRp 80.6 T(45.7%)
FDIRp 95.7 T(54.3%)
Total : Rp 176,3 T
DDIRp 157.0 T
(43.4%)
FDIRp 204.6 T
(56.6%)
Total : Rp 361.6 T
DDIRp 182.8 T
(46.2%)
FDIRp 212.8 T
(53.8%)
Total : Rp 395.6 T

The Investment Coordinating Board of the Republic of Indonesia
6
Investment Realization in Quarter II and January – June 2019 Compared to The Same Period in 2018 : Java and Outside Java
Quarter II 2018 Quarter II 2019
Jan-Jun 2018 Jan-Jun 2019
1. Quarter II 2019 and Quarter II 2018 : Java and Outside Java
2. Jan – Jun 2019 and Jan - Jun 2018: Java and Outside Java
T= Trillion
Realization y-o-y
Java 5.8%
Outside Java 14.2%
TOTAL 9.4%
Realization y-o-y
Java 15.3%
Outside Java 12.0%
TOTAL 13.7%
Quarter II and January - June 2019 : In Comparison With 2018
JavaRp 94.4 T(53.5%)
Outside JavaRp 81.9 T(46.5%)
Total : Rp 176.3 T
JavaRp 206.2 T
(57.0%)
Outside JavaRp 155.4 T
(43.0%)
Total : Rp 361.6 T
JawaRp 108.8 T
(54.3%)
Luar JawaRp 91.7 T(45.7%)
Total : Rp 200.5 T
JawaRp 218.1 T
(55.1%)
Luar JawaRp 177.5 T
(44.9%)
Total : Rp 395.6 T

The Investment Coordinating Board of the Republic of Indonesia
7
II. Quarter II 2019 : Sector, Location, and Country of Origin

The Investment Coordinating Board of the Republic of Indonesia
8
FDI
DDI FDI + DDI
T= TrillionB= Billion
Quarter II 2019: Sector, Location, and Country of Origin
Investment Realization in Quarter II 2019: Based on Sector
Electricity, Gas and Water Supply
US$ 1.3 B(18.6%)
Transportation, Warehouse, and
Telecommunication US$ 1.0 B
(14.3%)
Metal, Except Machinery, and
Equipment Industry US$ 0.9 B (12.8%)
Mining US$ 0.7 B
(10.0%)
Housing, Industrial Estate,
and Office Building
US$ 0.6 B(8.6%)
Others US$ 2.5 B
(35.7%)
Transportation, Warehouse, and
Telecommunication Rp 20.2 T
(21.1%)
Food Crops, Plantation, and
Livestock Rp 12.6 T
(13.2%)
Food Industry Rp 12.3 T
(12.9%)
Construction Rp 12.0 T
(12.6%)
Mining Rp 5.0 T
(5.2%)
Others Rp 33.5 T
(35.0%) Transportation, Warehouse, and
Telecommunication Rp 34.5 T
(17.2%)
Electricity, Gas and Water Supply
Rp 23.6 T(11.8%)
Food Industry Rp 17.2 T
(8.6%)
Food Crops, Plantation, and
Livestock Rp 16.9 T
(8.4%)
Mining Rp 15.1 T
(7.5%)
Others Rp 93.2 T
(46.5%)

The Investment Coordinating Board of the Republic of Indonesia
9
FDI
Investment Realization in Quarter II 2019 : Based on SectorDDI
NO SECTORInvestment(Rp Billion)
PROJECT
1 Transportation. Warehouse. and Telecommunication
20,222.4 385
2 Food Crops. Plantation. and Livestock 12,577.2 736
3 Food Industry 12,330.3 1.061
4 Construction 11,985.6 396
5 Mining 5,043.4 220
6 Other Services 4,566.5 755
7 Hotel and Restaurant 4,356.3 596
8 Trade and Reparation 4,252.0 2.220
9 Forestry 4,130.8 34
10 Chemical and Pharmaceutical Industry 3,604.5 513
11 Electricity. Gas and Water Supply 3,397.7 359
12 Housing. Industrial Estate. and Office Building 2,881.3 368
13 Metal. Except Machinery. and Equipment Industry
2,072.0 275
14 Wood Industry 667.5 163
15 Textile Industry 662.7 240
16 Paper. Paper Based Goods and Printing Industry 653.1 198
17 Rubber. Rubber and Plastic Based Goods Industry
652.8 378
18 Non Metallic Mineral Industry 586.5 173
19 Vehicle and Other Transportation Industry 562.2 112
20 Other Kind of Industries 292.1 154
21 Metal. Machinery. Electronic Medical instrument. Precision. Optical. and Watch Industry
107.5 167
22 Fishery 19.2 34
23 Leather Goods and Footwear Industry 9.7 30
TOTAL 95,633.3 9,567
NO SECTORInvestment
(US$ Million)PROJECT
1 Electricity. Gas and Water Supply 1,350.5 315
2 Transportation. Warehouse. and Telecommunication
949.8 349
3 Metal. Except Machinery. and Equipment Industry
857.9 475
4 Mining 672.4 368
5 Housing. Industrial Estate. and Office Building
621.4 541
6 Chemical and Pharmaceutical Industry 391.1 703
7 Vehicle and Other Transportation Industry 332.8 532
8 Food Industry 323.5 960
9 Food Crops. Plantation. and Livestock 288.3 478
10 Other Services 213.2 1.884
11 Metal. Machinery. Electronic Medical instrument. Precision. Optical. and Watch Industry
186.8 603
12 Trade and Reparation 163.7 2.699
13 Non Metallic Mineral Industry 127.9 165
14 Hotel and Restaurant 115.8 900
15 Rubber. Rubber and Plastic Based Goods Industry
95.1 443
16 Textile Industry 83.1 449
17 Paper. Paper Based Goods and Printing Industry
69.1 205
18 Other Kind of Industries 40.6 318
19 Fishery 34.0 66
20 Construction 32.6 145
21 Wood Industry 23.3 130
22 Leather Goods and Footwear Industry 14.7 139
23 Forestry 4.7 44
TOTAL 6,992.3 12,911
Quarter II 2019: Sector. Location. and Country of Origin

The Investment Coordinating Board of the Republic of Indonesia
10
DDI + FDIDDI
FDI
T= TrillionB= Billion
Investment Realization in Quarter II 2019 : Based on LocationQuarter II 2019: Sector. Location. and Country of Origin
West JavaUS$ 1.5 B(21.4%)
Special Territory of Jakarta
US$ 0.9 B(12.9%)
Central JavaUS$ 0.7 B(10.0%)
BantenUS$ 0.5 B
(7.1%)
Riau IslandsUS$ 0.5 B
(7.1%)
OthersUS$ 2.9 B(41.5%)
Special Territory of JakartaRp 16.2 T(17.0%)
East JavaRp 15.5 T(16.2%)
RiauRp 9.1 T(9.5%)
West JavaRp 8.9 T(9.3%)
East KalimantanRp 6 T(6.3%)
OthersRp 39.9 T(41.7%)
West JavaRp 31.4 T(15.6%)
Special Territory of Jakarta
Rp 29.8 T(14.9%)
Central JavaRp 19.4 T
(9.7%)
East JavaRp 14.7 T
(7.4%)
BantenRp 12.1 T
(6%)
OthersRp 93.1 T(46.4%)

The Investment Coordinating Board of the Republic of Indonesia
11
FDIDDI
NO LOCATIONINVESTMENT
PROJECT(Rp Billion)
1 Special Territory of Jakarta 16,242.2 918
2 East Java 15,496.1 1,507
3 West Java 9,100.4 218
4 Riau 8,894.0 1,464
5 Central Java 5,983.9 527
6 East Kalimantan 4,406.9 681
7 Banten 4,325.1 376
8 North Sumatera 3,749.7 976
9 South Sumatera 2,671.7 163
10 Central Kalimantan 2,537.3 55
11 West Kalimantan 2,509.6 185
12 South Kalimantan 2,387.7 207
13 North Sulawesi 1,564.7 216
14 Bali 1,518.5 181
15 Southeast Sulawesi 1,325.1 132
16 North Kalimantan 1,294.5 129
17 Riau Islands 1,256.3 94
18 Aceh 1,212.0 276
19Special Territory of Yogyakarta
1,164.0 70
20 Jambi 1,150.3 72
21 West Nusa Tenggara 1,144.1 79
22 Central Sulawesi 1,134.5 62
23 Lampung 811.9 152
24 South Sulawesi 720.1 83
25 West Sumatera 661.2 223
26 East Nusa Tenggara 631.8 93
27 Bangka Belitung Islands 601.1 236
28 West Sulawesi 331.2 23
29 Bengkulu 271.7 14
30 North Maluku 256.3 70
31 Gorontalo 134.6 22
32 Maluku 100.7 12
33 West Papua 34.7 28
34 Papua 9.2 23
TOTAL 95,633.3 9,567
NO LOCATIONINVESTMENT
PROJECT(US$ Million)
1 West Java 1,498.2 3,050
2 Special Territory of Jakarta 902.6 3,249
3 Central Java 732.9 508
4 Banten 511.4 1,090
5 Riau Islands 451.0 408
6 Papua 384.0 85
7 Central Sulawesi 368.3 121
8 North Maluku 261.4 839
9 East Java 260.0 43
10 Southeast Sulawesi 250.6 56
11 West Kalimantan 173.0 249
12 East Kalimantan 164.0 264
13 Bali 158.9 119
14 South Sumatera 124.2 853
15 South Kalimantan 106.5 365
16 South Sulawesi 74.1 342
17 North Sumatera 66.8 129
18 Riau 60.4 119
19 North Sulawesi 59.4 73
20 Lampung 58.7 82
21 Central Kalimantan 58.3 124
22 Gorontalo 57.2 142
23 West Nusa Tenggara 39.8 17
24 West Sumatera 39.6 41
25 Bengkulu 33.0 62
26 Bangka Belitung Islands 30.7 14
27 North Kalimantan 17.5 17
28 Aceh 15.6 49
29 East Nusa Tenggara 11.9 53
30 Jambi 9.4 109
31 Maluku 7.0 124
32 West Papua 4.5 77
33Special Territory of Yogyakarta
1.3 8
34 West Sulawesi 0.2 30
TOTAL 6,992.3 12,911.0
Investment Realization in Quarter II 2019 : Based on LocationQuarter II 2019: Sector. Location. and Country of Origin

The Investment Coordinating Board of the Republic of Indonesia
12
Investment Realization Quarter II 2019 : Based on Country of Origin
B = Billion
Quarter II 2019 : Sector, Location, and Country of Origin
SingaporeUS$ 1.7 B(24.5%)
Japan US$ 1.2 B(17.5%)
ChinaUS$ 1.1 B(16.2%)
Hongkong US$ 0.7 B(10.4%)
Netherlands US$ 0.4 B
(5.3%)
OthersUS$ 1.8 B(26.1%)

The Investment Coordinating Board of the Republic of Indonesia
13
Quarter II 2019 : Sector, Location, Country of Origin and RegionInvestment Realization in Quarter II 2019 : Based on Country of Origin
NO COUNTRY OF ORIGININVESTMENT (US$ Million)
PROJECT
1 Singapore 1,708.5 2,815
2 Japan 1,225.1 2,181
3 China 1,130.4 884
4 Hongkong 729.8 629
5 Netherlands 373.2 569
6 Malaysia 341.4 793
7 United States of America 302.8 283
8 South Korea 274.9 1,214
9 British Virgin Islands 186.0 298
10 Thailand 164.8 128
11 Australia 72.1 349
12 France 58.8 266
13 United Arab Emirates 43.9 33
14 England 41.5 343
15 Taiwan 40.5 262
16 Cayman Islands 39.5 69
17 Canada 34.1 59
18 Luxembourg 33.7 83
19 Mauritius 23.7 70
20 Turkey 23.0 31
21 Sweden 18.4 80
22 Germany 17.7 243
23 Russia 16.9 28
24 Belgium 16.0 75
25 India 14.3 226
26 Seychelles 9.8 60
27 Philippines 7.5 26
28 Sri Lanka 5.8 1
29 Norway 5.7 22
30 Denmark 4.5 48
31 Austria 4.3 26
32 Italy 3.9 103
33 North Korea 2.9 90
NO COUNTRY OF ORIGININVESTMENT (US$ Million)
PROJECT
34 Finland 2.8 6
35 Switzerland 2.2 121
36 Cyprus 1.6 6
37 New Zealand 1.6 30
38 Spain 1.3 43
39 Western Samoa 1.1 27
40 Marshall Island 0.8 15
41 Yemen 0.6 31
42 Hungary 0.5 5
43 Panama 0.4 10
44 Czech Republic 0.4 5
45 Poland 0.3 10
46 Lebanon 0.3 4
47 Ireland 0.3 13
48 Mexico 0.3 2
49 Lithuania 0.3 3
50 Uruguay 0.2 1
51 Pakistan 0.2 11
52 Bulgaria 0.2 2
53 Iran 0.2 4
54 Bangladesh 0.2 7
55 Argentina 0.2 4
56 Brazil 0.1 8
57 Sierra Leone 0.1 3
58 Malta 0.1 1
59 Tunisia 0.1 2
60 Iceland 0.1 4
61 Afghanistan 0.1 15
62 Saudi Arabia 0.1 22
63 Nigeria 0.1 15
64 Ukraine 0.1 4
65 South Africa 0.0 13
66 Kuwait 0.0 6
NO COUNTRY OF ORIGININVESTMENT (US$ Million)
PROJECT
67 Cook Islands 0.0 1
68 Liberia 0.0 3
69 Armenia 0.0 1
70 Liechtenstein 0.0 2
71 Palestine 0.0 1
72 Greece 0.0 2
73 Iraq 0.0 2
74 Egypt 0.0 6
75 Jordan 0.0 9
76 Bahamas 0.0 5
77 Morocco 0.0 1
78 Nepal 0.0 1
79 Slovenia 0.0 1
80 Syria 0.0 1
81 Algeria 0.0 1
82 Romania 0.0 2
83 Mauritania 0.0 4
84 Croatia 0.0 3
85 Macao 0.0 2
86 Brunei Darussalam 0.0 3
87 Isle of Man 0.0 2
88 Channel Islands 0.0 4
89 Libya 0.0 1
90 Guernsey 0.0 2
91 Bermuda 0.0 1
92 Burkina Faso 0.0 1
93 Kenya 0.0 3
94 Slovakia 0.0 1
95 Bahrain 0.0 1
96 Scotland 0.0 2
97 Belize 0.0 1
98 Kazakhstan 0.0 1
TOTAL 6,992.3 12,911

The Investment Coordinating Board of the Republic of Indonesia
14
III. January – June 2019 : Sector, Location, and Country of Origin

The Investment Coordinating Board of the Republic of Indonesia
15
FDI
DDI DDI + FDI
Investment Realization in January – June 2019: Based on SectorJanuary – June 2019 : Sector, Location, Country of Origin, and Region
T= TrilionB= Billion
Electricity, Gas and Water Supply
US$ 2.9 B(20.3%)
Transportation, Warehouse, and Telecommunication
US$ 2.6 B(18.3%)
Housing, Industrial Estate, and Office Building
US$ 1.6 B(11.1%)
Metal, Except Machinery, and Equipment Industry
US$ 1.5 B (10.4%)
MiningUS$ 1.3 B
(9.1%)
Others US$ 4.4 B (30.8%)
Transportation, Warehouse, and
Telecommunication Rp 32.9 T(18,0%)
Construction Rp 31.2 T(17.1%)
Food Crops, Plantation, and Livestock
Rp 21.3 T(11.7%)
Food Industry Rp 21.3 T(11.6%)
Electricity, Gas and Water Supply
Rp 13.7 T(7.5%)
Others Rp 62.4 T(34.1%)
Transportation, Warehouse, and
Telecommunication Rp 71.8 T (18.0%)
Electricity, Gas and Water
Supply Rp 56.8 T
(14.4%)
Construction Rp 32.0 T
(8.2%)Food Industry Rp 31.9 T
(8.1%)Housing, Industrial Estate, and Office
Building Rp 31.0 T
(7.8%)
Others Rp 172.1 T
(43.5%)

The Investment Coordinating Board of the Republic of Indonesia
16
FDIDDI
Investment Realization in January – June 2019 : Based on SectorJanuary – June 2019 : Sector. Location. Country of Origin. and Region
NO SECTORINVESTMENT
PROJECT(US$ Million)
1 Electricity. Gas and Water Supply 2,876.9 558
2 Transportation. Warehouse. and Telecommunication
2,591.6 618
3 Housing. Industrial Estate. and Office Building
1,570.9 967
4 Metal. Except Machinery. and Equipment Industry
1,469.5 812
5 Mining 1,287.2 640
6 Food Industry 706.7 1,822
7 Chemical and Pharmaceutical Industry
705.1 1,226
8 Food Crops. Plantation. and Livestock 505.4 850
9 Vehicle and Other Transportation Industry
411.9 936
10 Other Services 303.2 3,490
11 Hotel and Restaurant 275.4 1,796
12 Trade and Reparation 262.4 4,899
13 Non Metallic Mineral Industry 254.2 289
14 Metal. Machinery. Electronic Medical instrument. Precision. Optical. and Watch Industry
244.4 1,029
15 Rubber. Rubber and Plastic Based Goods Industry
201.7 752
16 Textile Industry 114.0 768
17 Leather Goods and Footwear Industry 105.8 266
18 Other Kind of Industries 91.9 545
19 Paper. Paper Based Goods and Printing Industry
87.2 371
20 Construction 51.5 293
21 Fishery 37.9 118
22 Wood Industry 27.1 249
23 Forestry 5.2 69
TOTAL 14,186.9 23,363
NO SECTORINVESTMENT
PROJECT(Rp Billion)
1 Transportation. Warehouse. and Telecommunication
32,935.5 630
2 Construction 31,236.4 593
3 Food Crops. Plantation. and Livestock
21,334.7 1.305
4 Food Industry 21,261.1 2.005
5 Electricity. Gas and Water Supply 13,688.4 634
6 Mining 10,920.6 362
7 Forestry 7,724.9 49
8 Housing. Industrial Estate. and Office Building
7,473.5 738
9 Trade and Reparation 7,378.5 3.398
10 Hotel and Restaurant 6,310.1 935
11 Other Services 5,451.9 1.117
12 Metal. Except Machinery. and Equipment Industry
4,760.4 449
13 Chemical and Pharmaceutical Industry
4,669.2 827
14 Paper. Paper Based Goods and Printing Industry
1,373.5 346
15 Non Metallic Mineral Industry 1,289.2 303
16 Rubber. Rubber and Plastic Based Goods Industry
1,221.5 645
17 Wood Industry 1,144.9 267
18 Textile Industry 922.0 431
19 Vehicle and Other Transportation Industry
688.2 183
20 Other Kind of Industries 651.3 267
21 Metal. Machinery. Electronic Medical instrument. Precision. Optical. and Watch Industry
297.4 292
22 Fishery 78.5 56
23 Leather Goods and Footwear Industry
21.4 48
TOTAL 182,833.0 15.880

The Investment Coordinating Board of the Republic of Indonesia
17
DDI + FDIDDI
FDI
T= TrillionB= Billion
January – June 2019 : Sector, Location, Country of Origin, and RegionInvestment Realization in January – June 2019 : Based on Location
Special Territory of
JakartaRp 26.7 T(14.6%)
East JavaRp 25.4 T(13.9%)
West JavaRp 20.5 T(11.2%)
RiauRp 17.3 T
(9.5%)
Central JavaRp 13.5 T
(7.4%)
OthersRp 79.4 T (43.5%)
West JavaUS$ 3.2 B(22.6%)
Special Territory of JakartaUS$ 1.9 B(13.0%)
Central JavaUS$ 1.5 B(10.6%)
BantenUS$ 1.0 B
(7.4%)
Riau IslandsUS$ 0.9 B
(6.4%)
OthersUS$ 5.7 B(40.0%)
West JavaRp 68.7 T(17.4%)
Special Territory of Jakarta
Rp 54.5 T(13.8%)
Central JavaRp 36.2 T
(9.1%)East JavaRp 32.0 T
(8.1%)
BantenRp 24.6 T
(6.2%)
OthersRp 179.6 T
(45.4%)

The Investment Coordinating Board of the Republic of Indonesia
18
FDIDDI
January – June 2019 : Sector. Location. Country of Origin. and Region
Investment Realization in January - June 2019 : Based on Location
NO LOCATIONINVESTMENT(Rp Billion)
PROJECT
1 Special Territory of Jakarta 26,652.4 1,556
2 East Java 25,448.9 2,721
3 West Java 20,454.1 2,214
4 Riau 17,316.9 523
5 Central Java 13,517.4 1,564
6 East Kalimantan 12,422.6 765
7 Banten 8,846.3 1,078
8 North Sumatera 8,681.6 584
9 South Sumatera 7,027.5 396
10 Central Kalimantan 4,264.2 334
11 West Kalimantan 3,784.3 449
12 South Kalimantan 3,291.7 301
13 North Sulawesi 2,948.7 132
14 Bali 2,774.7 243
15 Southeast Sulawesi 2,728.4 96
16 North Kalimantan 2,691.9 111
17 Riau Islands 2,257.8 394
18 Aceh 2,156.5 223
19Special Territory of Yogyakarta
1,970.9198
20 Jambi 1,788.1 346
21 West Nusa Tenggara 1,679.3 110
22 Central Sulawesi 1,585.3 122
23 Lampung 1,370.5 169
24 South Sulawesi 1,280.7 410
25 West Sumatera 1,254.4 284
26 East Nusa Tenggara 1,142.0 131
27 Bangka Belitung Islands 768.0 138
28 West Sulawesi 728.9 27
29 Bengkulu 667.9 93
30 North Maluku 569.5 30
31 Gorontalo 378.2 48
32 Maluku 193.2 40
33 West Papua 102.8 14
34 Papua 87.2 36
TOTAL 182,833.0 15,880
NO LOCATIONINVESTMENT(US$ Million)
PROJECT
1 West Java 3,216.1 5,034
2 Special Territory of Jakarta 1,858.0 6,081
3 Central Java 1,509.7 961
4 Banten 1,049.7 1,984
5 Riau Islands 906.7 828
6 Papua 708.2 119
7 Central Sulawesi 591.8 186
8 North Maluku 495.4 65
9 East Java 436.7 1,714
10 Southeast Sulawesi 417.0 89
11 West Kalimantan 358.1 413
12 East Kalimantan 300.4 427
13 Bali 253.3 1,497
14 South Sumatera 242.1 286
15 South Kalimantan 221.0 148
16 South Sulawesi 201.6 239
17 North Sumatera 186.3 663
18 Riau 152.3 308
19 North Sulawesi 128.1 179
20 Lampung 127.2 151
21 Central Kalimantan 122.3 274
22 Gorontalo 121.6 39
23 West Nusa Tenggara 115.0 589
24 West Sumatera 76.6 167
25 Bengkulu 76.2 45
26 Bangka Belitung Islands 59.1 104
27 North Kalimantan 55.9 62
28 Aceh 50.8 103
29 East Nusa Tenggara 39.1 191
30 Jambi 33.5 136
31 Maluku 31.6 22
32 West Papua 29.8 47
33Special Territory of Yogyakarta
8.8200
34 West Sulawesi 7.0 12
TOTAL 14,186.9 23,363

The Investment Coordinating Board of the Republic of Indonesia
19
January – June 2019 : Sector, Location, Country of Origin, and RegionInvestment Realization in January – June 2019 : Based on Country of Origin
B= Billion
Singapore US$ 3.4 B (23.9%)
Japan US$ 2.4 B (16.9%)
China US$ 2.3 B (16.2%)
Hongkong US$ 1.3 B
(9.2%)
Malaysia US$ 1.0 B
(7.0%)
Others US$ 3.8 B (26.4%)

The Investment Coordinating Board of the Republic of Indonesia
20
January – June 2019 : Sector, Location, Country of Origin, and RegionInvestment Realization in January – June 2019 : Based on Country of Origin
NO COUNTRY OF ORIGININVESTMENT (US$ Million)
PROJECT
1 Singapore 3,431.7 5,348
2 Japan 2,358.7 3,708
3 China 2,289.9 1,518
4 Hongkong 1,312.8 1,068
5 Malaysia 1,046.9 1,432
6 Netherlands 738.5 1,183
7 United States of America 631.7 515
8 South Korea 544.4 2,130
9 British Virgin Islands 385.4 633
10 Thailand 262.2 222
11 Marshall Island 152.2 24
12 Australia 137.3 624
13 Germany 134.5 426
14 Cayman Islands 92.7 128
15 Canada 92.2 105
16 France 69.3 467
17 English 65.3 576
18 Taiwan 62.6 441
19 Luxembourg 54.9 149
20 United Arab Emirates 46.3 57
21 Belgium 44.7 140
22 Mauritius 27.5 167
23 India 24.7 399
24 Turkey 23.9 49
25 Sweden 21.8 120
26 Seychelles 17.2 93
27 Russia 17.1 40
28 Italy 12.3 167
29 Panama 11.1 20
30 Norway 10.5 35
31 Austria 8.7 50
32 Philippines 7.5 38
33 Sri Lanka 5.8 2
34 Switzerland 4.9 248
35 Denmark 4.7 86
36 North Korea 3.8 223
37 Western Samoa 3.3 49
38 Finland 3.0 20
39 Yemen 2.7 54
40 Cook Islands 2.6 2
NOCOUNTRY OF
ORIGININVESTMENT (US$ Million)
PROJECT
41 New Zealand 2.3 62
42 Malta 2.2 2
43 Spain 1.7 94
44 Cyprus 1.6 8
45 Colombia 0.9 1
46 Brazil 0.7 23
47 Ireland 0.7 24
48 Saudi Arabia 0.7 42
49 Croatia 0.6 5
50 Pakistan 0.6 22
51 Hungary 0.6 8
52 Lebanon 0.6 5
53 Slovenia 0.6 5
54 Brunei Darussalam 0.5 10
55 Poland 0.5 12
56 Jordan 0.5 13
57 Greece 0.5 7
58 Palestine 0.4 2
59 Czech Republic 0.4 7
60 Bangladesh 0.4 12
61 Mexico 0.3 3
62 Iran 0.3 14
63 Lithuania 0.3 3
64 Uruguay 0.2 1
65 Bulgaria 0.2 3
66 Nigeria 0.2 22
67 Argentina 0.2 7
68 Siera Leone 0.1 3
69 Tunisia 0.1 3
70 Ukraine 0.1 9
71 Iceland 0.1 5
72 Afghanistan 0.1 28
73 Tanzania 0.1 1
74 Liberia 0.1 5
75 Kuwait 0.1 8
76 Vietnamese 0.1 1
77 Bolivia 0.1 2
78 South Africa 0.0 19
79 Senegal 0.0 1
80 Libya 0.0 4
NOCOUNTRY OF
ORIGININVESTMENT (US$ Million)
PROJECT
81 Egypt 0.0 11
82 Syria 0.0 6
83 Armenia 0.0 1
84 Liechtenstein 0.0 3
85 Anguilla 0.0 1
86 Iraq 0.0 4
87 Scotland 0.0 6
88 Slovakia 0.0 1
89 Sudan 0.0 1
90 Kenya 0.0 4
91 Algeria 0.0 2
92 Mauritania 0.0 6
93 Cameroon 0.0 1
94 Channel Islands 0.0 8
95 Chile 0.0 1
96 Peru 0.0 1
97 Jamaica 0.0 1
98 Morocco 0.0 3
99 Papua New Guinea 0.0 1
100 Nepal 0.0 2
101 Kazakhstan 0.0 2
102 Bahamas 0.0 7
103 Belize 0.0 2
104 Romania 0.0 3
105 Macao 0.0 6
106 Namibia 0.0 1
107 Bermuda 0.0 3
108 Guinea 0.0 2
109 Guernsey 0.0 3
110 Isle of Man 0.0 3
111 Portugal 0.0 2
112 Nicaragua 0.0 1
113 Burkina Faso 0.0 1
114 Bahrain 0.0 1
TOTAL 14,186.9 23,363

The Investment Coordinating Board of the Republic of Indonesia
21
DDIDDI and FDI
Investment Realization in January – June 2019: Based on Region
T= Trillion
January – June 2019 : Sector, Location, Country of Origin, and Region
Realization based on region in January – June 2019
period, the highest realization of DDI and FDI is located in
Java island. The further ranks of realization of the DDI is in
Java, Sumatera, Kalimantan, Sulawesi, Bali and Nusa
Tenggara, and also Maluku and Papua regions. The further
ranks of realization of the FDI is in Java, Sumatera,
Sulawesi, Maluku and Papua, Kalimantan as well as Bali
and Nusa Tenggara regions.
FDI
8,078.9
1,910.81,467.1 1,264.9 1,057.8
407.4
0
1,000
2,000
3,000
4,000
5,000
6,000
7,000
8,000
9,000
Java Sumatera Sulawesi Maluku andPapua
Kalimantan Bali andNusa
Tenggara
US$
.Mill
ion
96,890.1
43,289.1
26,454.8
9,650.25,596.0
952.70
20,000
40,000
60,000
80,000
100,000
120,000
Java Sumatera Kalimantan Sulawesi Bali andNusa
Tenggara
Maluku andPapua
Rp
Bill
ion
Java Rp 218.1 T
(55.1%)
Sumatera Rp 72.0 T (18.2%)
Kalimantan Rp 42.3 T(10.7%)
Sulawesi Rp 31.7 T
(8.0%)
Maluku and Papua
Rp 19.9 T(5.0%)
Bali and Nusa Tenggara Rp 11.7 T
(3.0%)

The Investment Coordinating Board of the Republic of Indonesia
22
IV. 2014 – June 2019 : Indonesian Labor Absorption

The Investment Coordinating Board of the Republic of Indonesia
23
Indonesian Labor Absorption Progress 2014 – June 2019 : Per Quarter
Indonesian Labor Absorption : 2014 – June 2019
Person
Note:Since the 2nd Quarter of 2016, Indonesia workers is an additional data of labor absorption.

The Investment Coordinating Board of the Republic of Indonesia
24
V. Progress of Investment Realization 2014 – June 2019

The Investment Coordinating Board of the Republic of Indonesia
25
Progress of Investment Realization 2014 – June 2019 : Per Quarter
Progress of Investment Realization: 2014 – June 2019
Q I Q II Q III Q IV Q I Q II Q III Q IV Q I Q II Q III Q IV Q I Q II Q III Q IV Q I Q II Q III Q IV Q I Q II
2014 2015 2016 2017 2018 2019
DDI 34.6 38.2 41.6 41.7 42.5 42.9 47.8 46.2 50.4 52.2 55.6 58.1 68.8 61.0 64.9 67.6 76.4 80.6 89.1 86.9 87.2 95.6
FDI 72.0 78.0 78.3 78.7 82.1 92.2 92.5 99.2 96.1 99.4 99.7 101.3 97.0 109.8 111.7 112.0 108.9 95.7 84.7 99.0 107.9 104.9
Total 106.6 116.2 119.9 120.4 124.6 135.1 140.3 145.4 146.5 151.6 155.3 159.4 165.8 170.8 176.6 179.6 185.3 176.3 173.8 185.9 195.1 200.5
00
40
80
120
160
200
Rp
Tri
llio
n

The Investment Coordinating Board of the Republic of Indonesia
26
Progress of Investment Realization of FDI 2014 – June 2019 in US Dollar: Per Quarter
Notes:- 2013 (Q I and Q II), exchange rate US$ 1 = Rp 9,300 (based on State Budget 2013)- 2013 (Q III and Q IV), exchange rate US$ 1 = Rp 9,600 (based on Revised State Budget 2013)- 2014 (Q I, Q II and Q III) exchange rate US$ 1 = Rp 10,500 (based on State Budget 2014)- 2014 (Q IV) exchange rate s US$ 1 = Rp 11,600 (based on Revised State Budget 2014)- 2015 (Q I, Q II, Q III and Q IV) exchange rate US$ 1 = Rp 12,500 (based on Revised State Budget 2015)- 2016 (Q I and Q II) exchange rate US$ 1 = Rp 13,900 (based on State Budget 2016)- 2016 (Q III and Q IV) exchange rate US$ 1 = Rp 13,500 (based on Revised State Budget 2016)- 2017 (Q I and Q II), exchange rate US$ = Rp 13,300 (based on State Budget 2017)- 2017 (Q III and Q IV), exchange rate US$ = Rp 13,400 (based on Revised State Budget 2017)- 2018 (Q I, QII and Q III), exchange rate US$ 1 = Rp 13,400 (based on State Budget 2018)- 2019 (Q I and Q II), exchange rate US$ 1 = Rp 15,000 (based on State Budget 2019)
Progress of Investment Realization 2014 - June 2019

The Investment Coordinating Board of the Republic of Indonesia
27
I = Investment (Rp Trillion)
Progress of Investment Realization 2014 – June 2019 : Based on Primary, Secondary, Tertiary Sector
Progress of Investment Realization: 2014 – June 2019
DDI 2014 2015 2016 2017 2018 Jan – Jun 2019 2014 - Jun 2019
I % I % I % I % I % I %I %
Primary16.5 10.6 17.1 9.5 27.7 12.8 43.6 16.6 67.4 20.5 40.0 21.8 212.3 16.0
Secondary 59.0 37.8 89.0 49.6 106.8 49.4 99.2 37.8 83.7 25.5 38.3 21.0 476.0 35.9
Tertiary 80.6 51.6 73.4 40.9 81.7 37.8 119.5 45.6 177.5 54.0 104.5 57.2 637.2 48.1
Total 156.1 100.0 179.5 100.0 216.2 100.0 262.3 100.0 328.6 100.0 182.8 100.0 1,325.5 100.0
FDI 2014 2015 2016 2017 2018 Jan – Jun 2019 2019 - Jun 2019
I % I % I % I % I % I % I %
Primary 75.2 24.5 77.9 21.3 61.3 15.5 81.1 18.8 64.7 16.5 27.5 12.9 387.7 18.4
Secondary 140.1 45.6 147.0 40.2 229.0 57.7 175.6 40.8 138.6 35.3 66.3 31.2 896.6 42.6
Tertiary 91.7 29.9 141.0 38.5 106.3 26.8 173.8 40.4 189.4 48.2 119.0 55.9 821.2 39.0
Total 307.0 100.0 365.9 100.0 396.6 100.0 430.5 100.0 392.7 100.0 212.8 100.0 2,105.5 100.0
2014 2015 2016 2017 2018 Jan-Jun 2019 % Jan-Jun 2019 2014-Jun 2019% 2014-Jun
2019
Primary 91.7 95.0 89.0 124.7 132.1 67.5 17.1 600.0 17.5%
Secondary 199.1 236.0 335.8 274.8 222.3 104.6 26.4 1,372.6 40.0%
Tertiary 172.3 214.4 188.0 293.3 366.9 223.5 56.5 1,458.4 42.5%
Total 463.1 545.4 612.8 692.8 721.3 395.6 100.00 3,431.0 100.0%
0
250
500
750R
p T
rilli
on

The Investment Coordinating Board of the Republic of Indonesia
28
ServicesRp 80.6 T(51.6%)
ManufacturingRp 59.0 T(37.8%)
Food Crops and PlantationsRp 12.7 T
(8.1%)
MiningRp 3.1 T(2.0%)
LivestockRp 0.7 T(0.4%)
FisheryRp 0.02 T
(0.0%)
ForestryRp 0.0003 T
(0.0%)
2014
DDI Trends Sector : 2014– June 2019
T = Trillion
Investment Realization Growth : 2014 – June 2019
20182017
ManufacturingRp 89.0 T(49.6%)
ServicesRp 73.4 T(40.9%)
Food Crops and PlantationsRp 12.0 T
(6.7%)
MiningRp 4.0 T(2.2%)
LivestockRp 0.3 T(0.2%) Fishery
Rp 0.3 T(0.1%)
ForestryRp 0.5 T(0.3%)
2015
ManufacturingRp 106.8 T
(49.4%)
ServicesRp 81.7 T(37.8%)
Food Crops and PlantationsRp 21.0 T
(9.7%)
MiningRp 6.0 T(2.8%)
LivestockRp 0.5 T(0.2%)
ForestryRp 0.2 T(0.1%) Fishery
Rp 0.003 T(0.0%)
2016
ServicesRp 119.6 T
(45.6%)
ManufacturingRp 99.2 T(37.8%)
Food Crops and PlantationsRp 22.0 T
(8.4%)
MiningRp 20.6 T
(7.9%)
LivestockRp 0.8 T(0.3%)
ForestryRP 0.03 T
(0.0%)
ServicesRp 177.5 T
(54.1%)
ManufacturingRp 83.6 T(25.4%)
MiningRp 33.1 T(10,1%)
Food Crops, Plantations, and
LivestockRp 31.2 T
(9.5%)
ForestryRp 3.1 T(0,9%) Fishery
Rp 0.1 T(0.0%)
Services Rp 104.5 T
(57.1%)
Manufacturing Rp 38.3 T (21.0%)
Food Crops, Plantation,
and LivestockRp 21.3 T(11.7%)
Mining Rp 10.9 T
(6.0%)
Forestry Rp 7.7 T(4.2%)
Fishery Rp 0.1 T (0.0%)
Jan – Jun 2019

The Investment Coordinating Board of the Republic of Indonesia
29
FDI Trends Sector : 2014 – June 2019
B = Billion
Investment Realization Growth : 2014 – June 2019
ManufacturingUS$ 11.8 B
(40.2%)
ServicesUS$ 11.3 B
(38.5%)
MiningUS$ 4.0 B(13.7%)
Food Crops and PlantationUS$ 2.0 B
(7.0%)
LivestockUS$ 0.1 B
(0.3%)
FIsheryUS$ 0.05 B
(0.2%) ForestryUS$ 0.02 B
(0.1%)
2015
ManufacturingUS$ 13.0 B
(45.6%)
ServicesUS$ 8.5 B(29.9%)
MiningUS$4.7 B(16.4%)
Food Crops and PlantationUS$ 2.2 B
(7.7%)
ForestryUS$ 0.05 B
(0.2%)Fishery
US$ 0.04 B(0.1%)
LivestockUS$ 0.03 B
(0.1%)
2014
2017
ManufacturingUS$ 16.7 B
(57.6%)
ServicesUS$ 7.8 B
(26.8)
MiningUS$ 2.7 B
(9.5%)
Food Crops and PlantationsUS$ 1.6 B
(5.5%)
ForestryUS$ 0.08 B
(0.3%)
LivestockUS$ 0.05 B
(0.2%) FisheryUS$ 0.04B
(0.1%)
2016
Jan – Jun 2019
ManufacturingUS$ 13.1 B
(40.6%)
ServicesUS$ 13.0 B
(40.3%)
MiningUS$ 4.4 B(13.6%)
Food Crops and PlantationUS$ 1.4 B
(4.3%)
LivestockUS$ 0.2 B
(0.6%)
FisheryUS$ 0.1 B
(0.3%)
ForestryUS$ 0.05 B
(0.2%)
ServicesUS$ 14.1 B
(48.3%)
ManufacturingUS$ 10.4 B
(35.3%)
MiningUS$ 3.1 B(10.4%)
Food Crops, Plantations, and
LivestockUS$ 1.7 B
(5.8%)
ForestryUS$ 0.04 B
(0.1%) Fishery
US$ 0.02 B(0.1%)
2018
MiningUS$ 1.3 B
(9.1%)
Food Crops, Plantations, and LivestockUS$ 0.5 B
(3.5%)
ForestryUS$ 0.005 B
(0.0%)Fishery
US$ 0.04 B(0.0%)
ServicesUS$ 8.0 B(56.2%)
ManufacturingUS$ 4.4 B(31.2%)

The Investment Coordinating Board of the Republic of Indonesia
30
T = Trillion
DDI and FDI Trends Sector : 2014 – June 2019Investment Realization Growth : 2014 – June 2019
ManufacturingRp 199.1 T
(43.0%)
ServicesRp 172.3 T
(37.2%)
MiningRp 53.3 T(11.5%)
Food Crops and Plantations
Rp 36.4 T(7.9%)
LivestockRp 1.0 T(0.2%)
ForestryRp 0.6 T(0.1%)
FisheryRp 0.4 T(0.1%)
2014
Manufacturing
Rp 236.0 T(43.3%)
ServicesRp 214.4 T
(39.3%)
MiningRp 54.2 T
(9.9%)
Food Cropsand Plantations
Rp 37.9 T(7.0%)
LivestockRp 1.3 T(0.2%)
ForestryRp 0.9 T(0.2%)
FisheryRp 0.7 T(0.1%)
2015
20182017 Jan – Jun 2019
ManufacturingRp 335.8 T
(54.8%)
ServicesRp 188.0 T
(30.7)
MiningRp 43.6 T
(7.0%)
Food Crops and
PlantationsRp 42.8 T
(7.0%)
ForestryRp 1.3 T(0.2%) Livestock
Rp 1.1 T(0.2%)
FisheryRp 0.6 T(0.1%)
2016
ServicesRp 293.4 T
(42.3%)
ManufacturingRp 274.7 T
(39.7%)
MiningRp 79.1 T(11.4%)
Food Crops and PlantationRp 41.2 T
(5.9%)
LivestockRp 3.0 T(0.4%)
FisheryRp 0.8 T(0.1%) Forestry
Rp 0.7 T(0.1%)
ServicesRp 367.0 T
(50.9%)
ManufacturingRp 222.3 T
(30.8%)
MiningRp 73.8 T(10.2%)
Food Crops, Plantations and
LivestockRp 54.2 T
(7.5%)
ForestryRp 3.6 T(0.5%)
FisheryRp 0.4 T(0.1%) Mining
Rp 30.2 T (7.6%)
Food Crops, Plantations, and Livestock
Rp 28.9 T(7.3%)
ForestryRp 7.8 T(2.0%)
FisheryRp 0.6 T(0.2%)
ServicesRp 223.5 T
(56.5%)ManufacturingRp 104.6 T
(26.4%)
The Investment Coordinating Board of the Republic of Indonesia
31
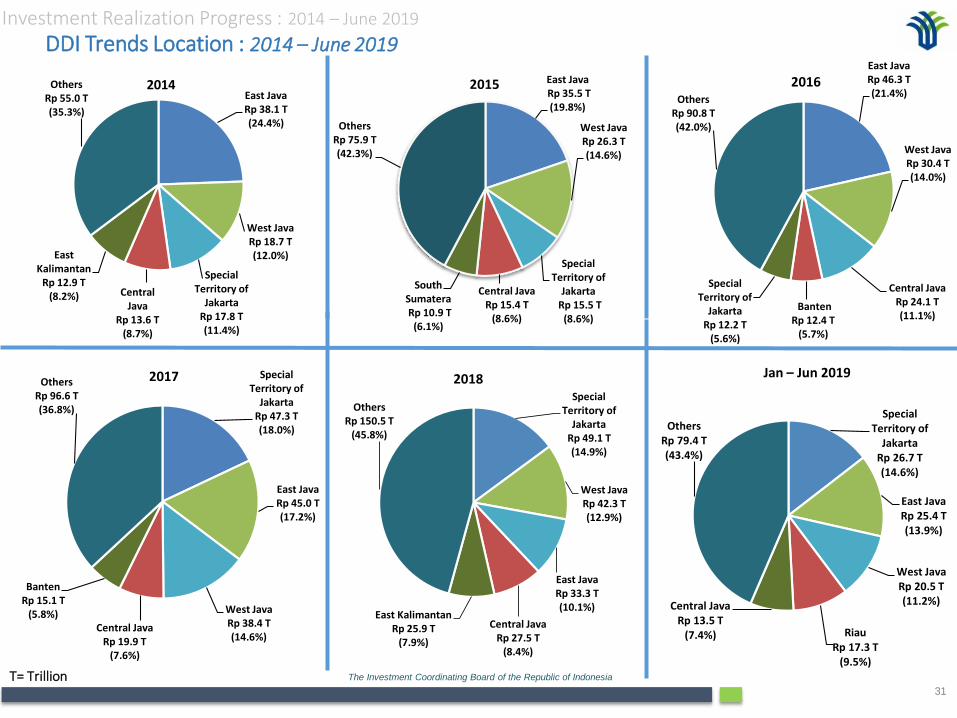
DDI Trends Location : 2014 – June 2019
T= Trillion
Investment Realization Progress : 2014 – June 2019
East JavaRp 38.1 T(24.4%)
West JavaRp 18.7 T(12.0%)
Special Territory of
JakartaRp 17.8 T(11.4%)
Central Java
Rp 13.6 T(8.7%)
East Kalimantan
Rp 12.9 T(8.2%)
OthersRp 55.0 T(35.3%)
2014 East JavaRp 35.5 T (19.8%)
West JavaRp 26.3 T (14.6%)
Special Territory of
JakartaRp 15.5 T
(8.6%)
Central JavaRp 15.4 T
(8.6%)
South Sumatera Rp 10.9 T
(6.1%)
OthersRp 75.9 T (42.3%)
2015
SpecialTerritory of
Jakarta Rp 47.3 T(18.0%)
East JavaRp 45.0 T(17.2%)
West JavaRp 38.4 T(14.6%)
Central JavaRp 19.9 T
(7.6%)
BantenRp 15.1 T
(5.8%)
OthersRp 96.6 T(36.8%)
2017
East JavaRp 46.3 T(21.4%)
West JavaRp 30.4 T(14.0%)
Central JavaRp 24.1 T(11.1%)
BantenRp 12.4 T
(5.7%)
SpecialTerritory of
JakartaRp 12.2 T
(5.6%)
Others Rp 90.8 T(42.0%)
2016
2018Special
Territory ofJakarta
Rp 49.1 T(14.9%)
West JavaRp 42.3 T(12.9%)
East JavaRp 33.3 T(10.1%)
Central JavaRp 27.5 T
(8.4%)
East KalimantanRp 25.9 T
(7.9%)
OthersRp 150.5 T
(45.8%)
Jan – Jun 2019
Special Territory of
JakartaRp 26.7 T(14.6%)
East JavaRp 25.4 T(13.9%)
West JavaRp 20.5 T(11.2%)
RiauRp 17.3 T
(9.5%)
Central JavaRp 13.5 T
(7.4%)
OthersRp 79.4 T(43.4%)

The Investment Coordinating Board of the Republic of Indonesia
32
FDI Trends Location : 2014 – June 2019
B = Billion
Investment Realization Growth : 2014 – June 2019
West JavaUS$ 6.6 B(23.0%)
Special Territory of
JakartaUS$ 4.5 B(15.8%)
East KalimantanUS$ 2.1 B
(7.5%)
BantenUS$ 2.0 B
(7.1%)
East JavaUS$ 1.8 B
(6.3%)
OthersUS$ 11.5 B
(40.3%)
2014 West JavaUS$ 5.7 B (19.6%)
Special Territory of
JakartaUS$ 3.6 B (12.4%)
East JavaUS$ 2.6 B
(8.9%)Banten
US$ 2.5 B (8.7%)
East KalimantanUS$ 2.4 B
(8.1%)
OthersUS$ 12.4 B
(42.3%)
2015
West JavaUS$ 5.1 B (16.0%)
SpecialTerritory of
JakartaUS$ 4.6 B(14.2%)
Banten US$ 3.0 B
(9,5%)Central Java
US$ 2.4 B(7.3%)
PapuaUS$ 1.9 B
(6.0%)
OthersUS$ 15.2 B
(47.0%)
West JavaUS$ 5.5 B(18.9%)
SpecialTerritory of
JakartaUS$ 3.4 B (11.7%)
BantenUS$ 2.9 B (10.1%)
South SumateraUS$ 2.8 B
(9.6%)
East JavaUS$ 1.9 B
(6.7%)
Others US$ 12.4 B
(43.0%)
West JavaUS$ 5.6 B(19.1%)
SpecialTerritory of
JakartaUS$ 4.9 B(16.7%)
BantenUS$ 2.8 B
(9.6%)Central Java
US$ 2.4 B(8.2%)
East Java;US$ 1.3 B
(4.4%)
OthersUS$ 12.3 B
(42.0%)
2016
2017 2018 Jan – Jun 2019West JavaUS$ 3.2 B(22.7%)
Special Territory of
JakartaUS$ 1.9 B(13.1%)
Central JavaUS$ 1.5 B(10.6%)
BantenUS$ 1.1 B
(7.4%)
Riau IslandsUS$ 0.9 B
(6.4%)
OthersUS$ 5.6 B(39.8%)

The Investment Coordinating Board of the Republic of Indonesia
33
West JavaRp 89.3 T(19.3%)
Special Territory of Jakarta
Rp 66.3 T(14.3%)
East JavaRp 57.5 T(12.4%)East
KalimantanRp 36.0 T
(7.8%)
BantenRp 30.0 T
(6.5%)
OthersRp 184.0 T
(39.7%)
2014
DDI and FDI Trends Location : 2014 – June 2019
T = Trillion
Investment Realization Growth : 2014 – June 2019
West JavaRp 98.0 T (18.0%)
East JavaRp 67.9 T (12.5%)
SpecialTerritory of Jakarta
Rp 60.7 T (11.1%)
BantenRp 42.5 T
(7.8%)
East Kalimantan Rp 39.4 T
(7.2%)
OthersRp 236.9 T
(43.4%)
2015
SpecialTerritory of
JakartaRp 108.6 T
(15.7%)
West JavaRp 107.1 T
(15.5%)
East JavaRp 66.0 T
(9.5%)BantenRp 55.8 T
(8.1%)
Central JavaRp 51.5 T
(7.4%)
OthersRp 303.8 T
(43.9%)
2017 West JavaRp 116.9 T
(16.2%)
SpecialTerritory of
JakartaRp 114.2 T
(15.8%)
Central JavaRp 59.3 T
(8.2%)
BantenRp 56.5 T
(7.8%)
East JavaRp 51.2 T
(7.1%)
OthersRp 323.2 T
(44.9%)
2016
2018 Jan – Jun 2019
West JavaRp 68.7 T(17.4%)
Special Territory of JakartaRp 54.5 T(13.8%)
Central JavaRp 36.2 T
(9.1%)East JavaRp 32.0 T
(8.1%)
BantenRp 24.6 T
(6.2%)
OthersRp 179.6 T
(45.4%)

The Investment Coordinating Board of the Republic of Indonesia
34
FDI Trends by Country of Origin (Top 5) : 2014 – June 2019
SingaporeUS$ 5.8 B(20.4%)
JapanUS$ 2.7 B
(9.5%)
MalaysiaUS$ 1.8 B
(6.2%)
NetherlandsUS$ 1.7 B
(6.1%)UKUS$ 1.6 B
(5.6%)
OthersUS$ 14.9 B
(52.2%)
2014
B = Billion
Investment Realization : 2014 – June 2019SingaporeUS$ 5.9 B (20.2%)
MalaysiaUS$ 3.0B(10.5%)
JapanUS$ 2.9 B
(9.8%)
NetherlandsUS$ 1.3 B
(4.5%)
South KoreaUS$ 1.2 B
(4.1%)
OthersUS$ 14.9 B
(50.9%)
2015
2018 Jan - June 2019
2016
SingaporeUS$ 9.2 B(31.4%)
JapanUS$ 4.9 B(16.7%)
ChinaUS$ 2.4 B
(8.2%)
HongkongUS$ 2.0 B
(6.8%)
MalaysiaUS$ 1.8 B
(6.2%)
OthersUS$ 10.0 B
(30.7%)
SingaporeUS$ 9.2 B(31.7%)
JapanUS$ 5.4 B (18.6%)
China US$ 2.7 B
(9.2%)
HongkongUS$ 2.2 B
(7.8%)
NetherlandsUS$ 1.5 B
(5.1%)
OthersUS$ 8.0 B (27.6%)
SingaporeUS$ 8.4 B(26.2%)
JapanUS$ 5.0 B(15.5%)
ChinaUS$ 3.4 B (10.4%)
HongkongUS$ 2.1 B
(6.6%)
South KoreaUS$ 2.0 B
(6.3%)
Others US$ 11.3 B
(35.0%)
2017 SingaporeUS$ 3.4 B(24.2%)
JapanUS$ 2.4 B(16.6%)
ChinaUS$ 2.3 B(16.1%)
HongkongUS$ 1.3 B
(9.3%)
MalaysiaUS$ 1.0 B
(7.4%)
OthersUS$ 3.8 B(26.4%)

The Investment Coordinating Board of the Republic of Indonesia
35
SingaporeUS$ 9.2 B(31.7%)
JapanUS$ 5.4 B(18.6%)
ChinaUS$ 2.7 B
(9.2%)
UEUS$ 2.6 B
(9.0%)
HongkongUS$ 2.2 B
(7.8%)
USAUS$ 1.2 B
(4.0%)
MalaysiaUS$ 1.1 B
(3.9%)
South KoreaUS$ 1.1 B
(3.7%)
AustraliaUS$ 0.2 B
(0.6%)
TaiwanUS$ 0.1 B
(0.5%)
OthersUS$ 3.2 B(11.0%)
2016FDI Trends by Main Country of Origin: 2014 – June 2019
B = BillionEU = European Union
Investment Realization : 2014 – June 2019
SingaporeUS$ 5.8 B
(20.3%)
EUUS$ 3.8 B(13.3%)
JapanUS$ 2.7 B
(9.5%)
Malaysia US$ 1.8 B
(6.3%)
USA
US$ 1.3 B(4.5%)
South KoreaUS$ 1.1 B
(3.8%)
ChinaUS$ 0.8 B
(2.8%)
Hong Kong US$ 0.7 B
(2.4%)
Australia US$ 0.6 B
(2.1%)
TaiwanUS$ 0.1 B
(0.4%)
OthersUS$ 9.9 B
(34.6%)
2014
Jan - Jun 20192017
SingaporeUS$ 5.9 B(20.2%)
MalaysiaUS$ 3.1 B(10.5%)
JapanUS$ 2.9 B
(9.8%)
EUUS$ 2.3 B
(7.7%)South Korea
US$ 1.2 B(4.1%)
HongkongUS$ 0.9 B
(3.2%)
USAUS$ 0.9 B
(3.1%)
ChinaUS$ 0.6 B
(2.1%)
AustraliaUS$ 0.2 B
(0.6%)
OthersUS$ 11.2 B
(38.3%)
2015
SingaporeUS$ 8.4 B(26.2%)
JapanUS$ 5.0 B(15.5%)
EUUS$ 3.8 B(11.8%)
ChinaUS$ 3.4 B(10.4%)
HongkongUS$ 2.1 B
(6.6%)
South KoreaUS$ 2.0 B
(6.3%)
USAUS$ 2.0 B
(6.2%)
MalaysiaUS$ 1.2 M
(3.8%)
AustraliaUS$ 0.5 B
(1.6%)
TaiwanUS$ 0.4 B
(1.2%)Others
US$ 3.4 B(10.4%)
SingaporeUS$ 9.2 B(31.4%)
JapanUS$ 4.9 B(16.7%)China
US$ 2.4 B(8.2%)
EUUS$ 2.3 B
(7.8%)
HongkongUS$ 2.0 B
(6.8%)
MalaysiaUS$ 1.8 B
(6.1%)
South KoreaUS$ 1.6 B
(5.5%)
USAUS$ 1.2 B
(4.1%)
AustraliaUS$ 0.6 B
(2.0%)
TaiwanUS$ 0.2 B
(0.7%) OthersUS$ 3.1 B(10.7%)
2018
Singapore US$ 3.4 B (24.2%)
Japan US$ 2.4 B (16.6%)
China US$ 2.3 B (16.1%)
Hongkong US$ 1.3 B
(9.3%)
EU US$ 1.2 B
(8.5%)
Malaysia US$ 1.1 B
(7.4%)
USA US$ 0.6 B
(4.5%)
South Korea US$ 0.5 B
(3.8%)
Australia US$ 0.1 B
(1.0%)
Taiwan US$ 0.1 B
(0.4%)
Others US$ 1.2 B
(8.5%)

36
Badan Koordinasi Penanaman Modal (BKPM)
Indonesia Investment Coordinating Board
Jln. Jend. Gatot Subroto No. 44Jakarta 12190 - Indonesia
t . +62 21 525 2008
f . +62 21 525 4945
www.bkpm.go.id
Thank YouTerima Kasih

The Investment Coordinating Board of the Republic of Indonesia
37
I = Investment (Rp Trilion)
Progress of Investment Realization 2014 – June 2019 : New and Expansion Project
Progress of Investment Realization: 2014 - June 2019
DDI
2014 2015 2016 2017 2018 Jan - Jun 2019 Total 2014 – Jun 2019
I % I % I % I % I % I % I %
New 110.1 70.5 114.7 63.9 156.9 72.6 205.2 78.2 285.2 86.8 175.3 95.9 1,047.4 79.0
Expansion 46.0 29.5 64.8 36.1 59.3 27.4 57.1 21.8 43.4 13.2 7.5 4.1 278.1 21.0
Total 156.1 100.0 179.5 100.0 216.2 100.0 262.3 100.0 328.6 100.0 182.8 100.0 1,325.5 100.0
FDI 2014 2015 2016 2017 2018 Jan - Jun 2019 Total 2014 – Jun 2019
I % I % I % I % I % I % I %
New 213.1 69.4 284.4 77.7 305.7 77.1 350.2 81.3 331.7 84.5 185.9 87.4 1,671.0 79.4
Expansion 93.9 30.6 81.5 22.3 90.9 22.9 80.3 18.7 61.0 15.5 26.9 12.6 435.5 20.6
Total 307.0 100.0 365.9 100.0 396.6 100.0 430.5 100.0 392.7 100.0 212.8 100.0 2,105.5 100.0
2014 2015 2016 2017 2018Jan-Jun
2019% Jan-Jun
20192014-Jun
2019% 2014-Jun
2019
New 323.2 399.1 462.6 555.4 616.9 361.2 91.3 2,718.4 79.2
Expansion 139.9 146.3 150.2 137.4 104.4 34.4 8.7 712.6 20.8
Total 463.1 545.4 612.8 692.8 721.3 395.6 100.0 3,431.0 100.0
-
100
200
300
400
500
600
700
Rp
Tri
llio
n