dolmetsch stem cells
TRANSCRIPT

Stem Cell Models of Autism Spectrum Disorders: An Entree into Gene-Environment Interactions
Ricardo Dolmetsch Ph.D.Department of Neurobiology
Stanford University

Are human stem cells a useful tool to study the
environmental contributions to autism?

Social Impairment
Communication Impairment
Restricted Interests &Compulsivity
Asperger Syndrome
Autism
PDD-NOS
Nervous Child 2, 217–250 (1943)
“He seems self satisfied and has no apparent affection when petted....He seems to almost draw into his shell and live within himself.”
“He wandered about making stereotyped movements with his fingers...He spun with great pleasure anything he could seize upon
to spin.”
“Words to him had a literal inflexible meaning. He seemed unable to generalize”
AutismLeo Hans Asperger 1944
Autism is a diverse spectrum of disorders

0
10
20
30
40
19431965
19701973
19761979
19821985
19881991
19941997
Aut
ism
per
10,
000
Birt
hs
Birth Year
Autism
Prevalence in 2009: 1/100
Autism
Monozygotic Dizygotic Siblings
60-90% 0-6% 4-5%

SNP- single nucleotide polymorphisms RM - rare mutations
CNV - copy number variation

Model
Autism is highly heritable
CNV RM
SNPProtective
SNPSNP
SNP- single nucleotide polymorphisms
RM - rare mutations
CNV - copy number variation

What about environmental agents?
• Valproic acid during pregnancy
• Influenza or Rubella infection during pregnancy
• Auto-immune disease ?
• Environmental Toxins ?
How do we find how a mutation causes autism?

Genes & Proteins
Behavior
Circuits
Cells
How do genetic mutations lead to changes in thoughts and behavior?
You make a mouse
And...mice are not humans
But.... Autism involves many genes and it is hard to replicate a human genetic
background in a mouse

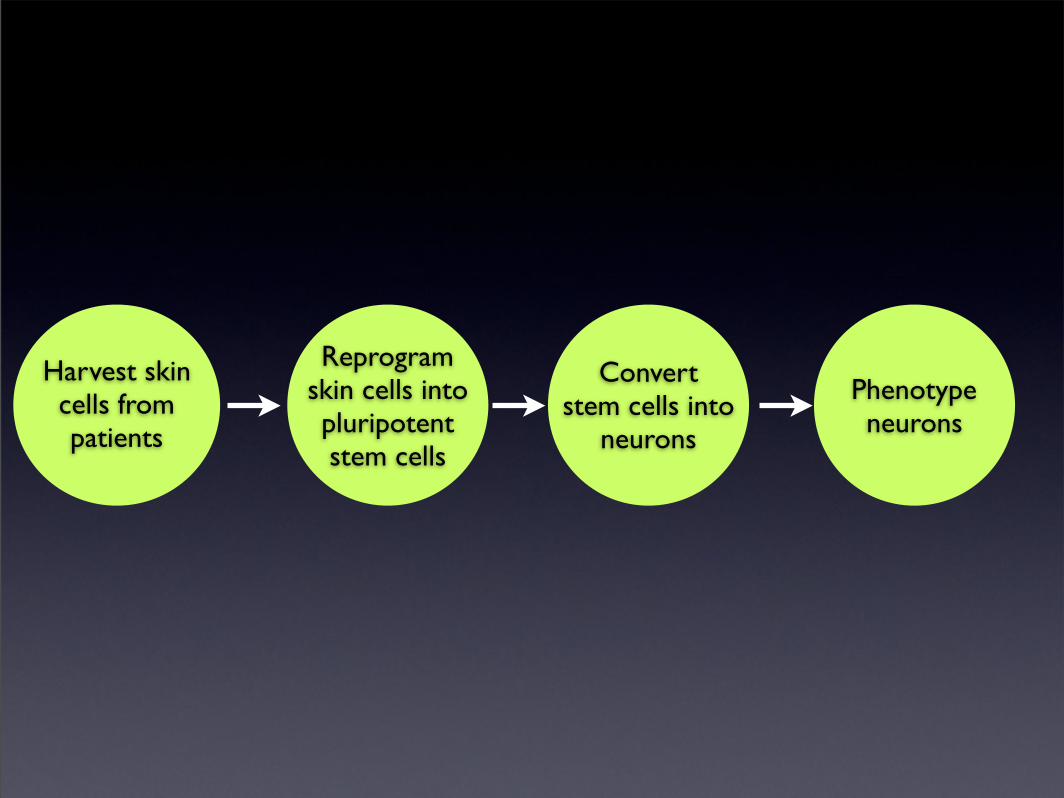
Harvest skin cells from patients
Reprogram skin cells into pluripotent stem cells
Convert stem cells into
neurons
Phenotype neurons

Which patients
• Timothy Syndrome
• Ch22q13 DS
• Williams Beuren Syndrome
• Craniovelofacial Syndrome(Ch22q11 DS)
• Other copy number variations (Ch16p11.2)
• Idiopathic autism
Reprogram skin cells into pluripotent stem cells
Harvest skin cells from patients
Convert stem cells into
neurons
Phenotype neurons

Making stem cells from the skin cells of ASD patients
+Oct3/4Sox-2Klf-4
Kazutoshi Takahashi.... Shinya Yamanaka Cell 2007

Convert stem cells into
neurons
Harvest skin cells from patients
Reprogram skin cells into pluripotent stem cells
Phenotype neurons

Recapitulating human neural development in vitro
Blastocyst
Neurulation
FoxG1 NCad
Pax6 NCad
specific part of one body segment into the homolo-gous part of another (Palka 1982). These mutationsinclude rearrangement of the Antennapedia (Antp)locus which, through ectopic expression of the Antpprotein, transform antennae into legs (Fig. 2,16), andcertain loss-of-function mutations at the bithorax(bx) locus, which transform the third thoracic seg-ment into a duplicate of the second one, leading tomutant flies with two pairs of wings.
2.5 Neurogenesis, Gliogenesis and Migration
The CNS uses several strategies to generate distinctclasses of neurons during development (Jacobson1991; McConnell 1995; Nieuwenhuys 1998b): dor-sal–ventral polarization in the spinal cord, segmenta-tion in the brain stem and lamination in the cerebralcortex. Most types of neurons are generated in theprimary proliferative compartment (the ventricularzone), but several cell types arise from secondaryproliferative compartments, including the subven-tricular zone and the external granular or germinallayer.
2.5.1 Neurogenesis: Primary and SecondaryProliferative Compartments
The neural plate and early neural tube consist of asingle layer of columnar cells, the neuroepithelium.Through thickening, this layer gradually forms apseudostratified epithelium, i.e. its nuclei becomearranged in more and more layers, but all elementsremain in contact with the outer and inner surfaces(Fig. 2.17). Mitotic figures are only found along theventricular surface (Fig. 2.18). Early students of thedeveloping neural tube, like His (1889), thought thatthese mitoses belong to cells which form a ventricu-lar layer of germinal cells (Keimzellen), and that themore peripherally located cells represent spon-gioblasts, primordial glial cells, forming a syncytialmeshwork (Markgerüst). Neuroblasts arising fromthe germinal cells were supposed to migrate periph-erally in the intercellular spaces of this meshwork.Although Schaper (1897a, b) already challenged His’sconcept of neurogenesis, it was Sauer (1935a, b) whoproved that the neural tube is composed of discretecells that do not form a syncytium. In fact, His’s radi-ally arranged columnar cells (spongioblasts) and therounded cells near the lumen, passing through mito-sis, are not two types of cells, but are the interkineticand mitotic stages of the same cell (Figs. 2.18a, 2.21).Thus, the early neural tube is composed of a singletype of epithelial cell in various stages of the mitoticcycle: the resting cells reside in the outer part of the
wall, and the nuclei of the cells that are going todivide are moving towards the ventricular surface. Atthe end of this migration phase, the peripheralprocesses lose their contacts with the outer surfaceand retract. The cells round up and divide into twodaughter cells each. Each daughter cell produces anew peripheral process, and their nuclei move awayfrom the ventricle. Sauer’s cytological studies wereconfirmed by numerous studies using [3H]thymidineautoradiography (Fujita 1963, 1966), and electronmicroscopy (Hinds and Ruffett 1971; Meller andTetzlaff 1975).
At a certain developmental stage the nuclei of theelongated neuroepithelial cells withdraw from themost superficial layer of the neural tube (Fig. 2.19).The outer, anuclear zone, or marginal layer, first con-sists of the external processes of the neuroepithelialcells, but is soon invaded by the axonal processes ofmaturing neuroblasts.The inner zone is known as thematrix layer (Kahle 1951; Fujita 1963, 1966; Keyser
2.5 Neurogenesis, Gliogenesis and Migration 63
Fig. 2.17 Scanning electron micrograph of the developingforebrain wall. The sagittal fracture of a cerebral hemisphereof an E10 mouse embryo shows the undulating membranesof the different cell types (arrows); V marks a blood vessel.(From Meller and Tetzlaff 1975, with permission)
Differentiation and Migration
Nestin, NCadh,Hoechst Pax6,
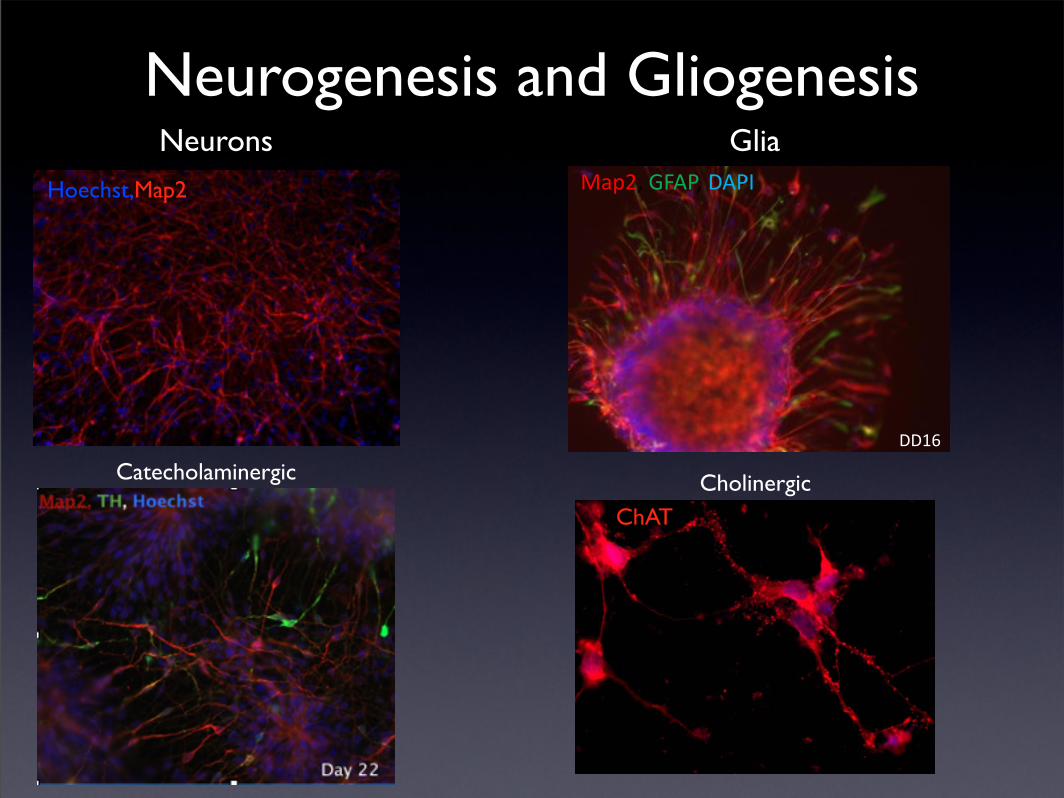
Neurogenesis and Gliogenesis
Hoechst,Map2
Neurons
DD16
Map2, GFAP, DAPI
Glia
Catecholaminergic
ChATCholinergic

Neurons fire action potentials and form synapses
Syn1, PSD95, Hoechst

Neurons have calcium elevations

Phenotype neurons
Convert stem cells into
neurons
Harvest skin cells from patients
Reprogram skin cells into pluripotent stem cells

Single Cell AssaysCell BasedGene expression
Cell markers and signaling events
Experiment One
Muscle total RNA was prepared using a 10-fold serial dilution to produce samples of 10 ng, 1 ng, 0.1 ng, 0.01
ng, and 0.00 1 ng concentrations (the lower concentrations resembling the total RNA contents of a single-cell).
Each preparation was setup as triplicate reactions for each protocol, against 48 assays. Replicate assays were
performed to enhance data reliability. The data was collected on the BioMark system.
Comparison of Two Protocols for Single-Cell Gene Expression on Dynamic Arrays
The following is a supplement to the application note BioMark Dynamic Arrays for Single-Cell Gene Expression Analysis
(MRKT00075a) and the BioMark Advanced Development Protocol 5. The supplement describes experiments performed
with dynamic arrays to compare two protocols for single cell analysis — one recently developed by Fluidigm, the
other a traditional two-step Reverse Transcription (RT) preamplification (PreAmp) protocol. Both experiments were
performed with RNA standards, instead of real cells, to control for the reproducibility of sample concentration.
Figure 1. Standard Curves for CSNK2B and GAPDH assays. Table 1. Average Ct and Sigma Ct values.
Figure 2. Heat maps for Fluidigm single-cell gene expression and two-step with muscle only samples.
S U P P L E M E N TS I N G L E C E L L G E N E E X P R E S S I O N
Results
Standard curves show that both the Fluidigm single-cell analysis protocol and the standard two-step RT-PreAmp
protocol have excellent linearity and reproducibility. The Ct and Sigma C
t values demonstrate good sensitivity,
only the Fluidigm protocol registering a Ct value at the lowest concentration. Dynamic array heat maps show
the same gene expression pattern for both protocols.
y = -1.7Ln(x) + 18.2
y = -1.4Ln(x) + 19.5
R2= 0.9939
y = -1.5Ln(x) + 10.5 R2= 0.9999
R2= 0.9903
y = -1.6Ln(x) + 13.4 R2= 0.9998
0
5
10
15
20
25
30
35
0.001 0.01 0.1 1 10
Target RNA Concentration (ng)
Muscle total RNA Sample and CSNK2B Assay3 preps * 4 assay replicates * 3 sample replicates =
36 data points per concentration(Error bars reflect +/- 1 standard deviation.)
Muscle total RNA Sample and GAPDH Assay3 preps * 4 assay replicates * 3 sample replicates =
36 data points per concentration(Error bars reflect +/- 1 standard deviation.)
Average Ct
Target RNA Concentration (ng)
Average Ct
single-cell GE protocol2-step RT-PreAmpLog. (single-cell GE protocol)Log. (2-step RT-PreAmp)
0
5
10
15
20
25
30
0.001 0.01 0.1 1 10
single-cell GE protocol2-step RT-PreAmpLog. (single-cell GE protocol)Log. (2-step RT-PreAmp)
CSNK2B target concentration 10 1 0.1 0.01 0.001 ngAverage Ct single-cell GE protocol 14.7 18.3 21.7 25.5 31.0 2-step RT-PreAmp 16.2 19.5 23.2 25.7 n/a
Sigma Ct single-cell GE protocol 0.14 0.18 0.29 1.30 1.66 2-step RT-PreAmp 0.09 0.20 0.75 1.02 n/a
GAPDH target concentration 10 1 0.1 0.01 0.001 ngAverage Ct single-cell GE protocol 7.0 10.6 14.0 17.6 21.0 2-step RT-PreAmp 9.7 13.4 16.9 20.6 24.2
Sigma Ct single-cell GE protocol .10 0.12 0.11 0.15 0.22 2-step RT-PreAmp 0.09 0.16 0.29 0.14 0.98

Splawski et al., 2004
Timothy Syndrome (TS)
• QT prolongation
• Syndactyly
• Autism

Are there differences in gene expression in neurons from TS patients?

Differentially Expressed GenesControl Timothy
1 2Individual
Cell Line
1 2 3
1 2 3 1 2 1 2 3 4 5 6
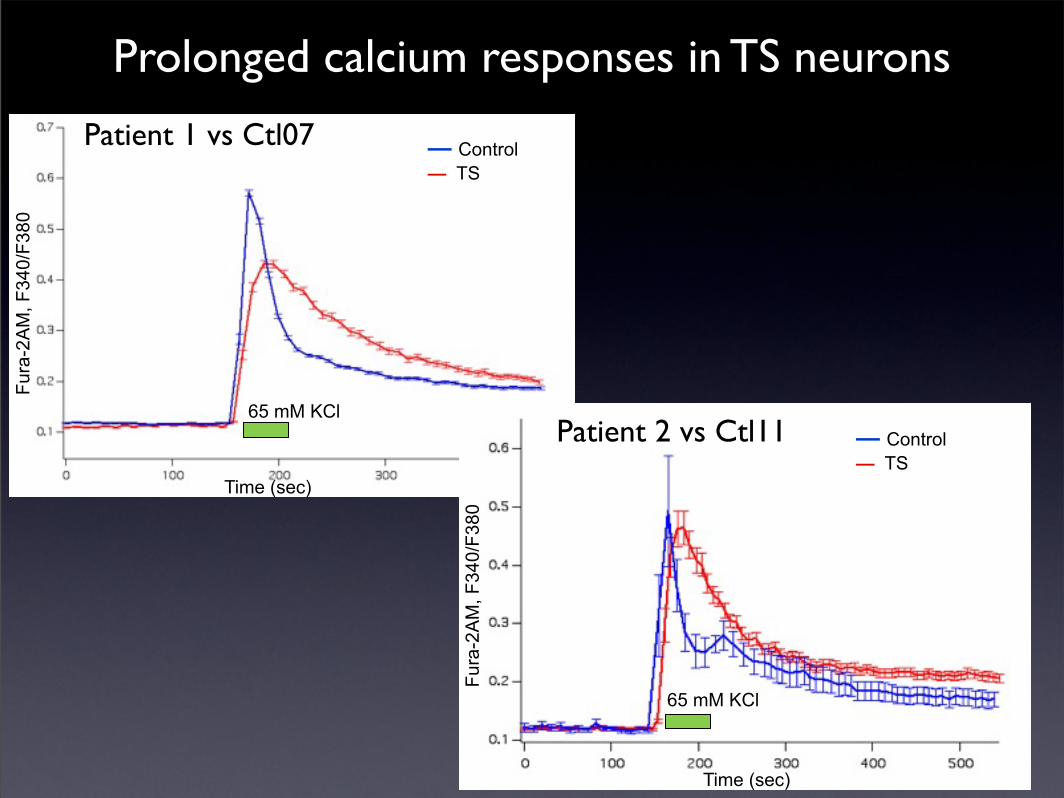
Prolonged calcium responses in TS neurons
Time (sec)
Fura
-2A
M, F
340/
F380
— Control— TS
65 mM KCl
TS (n=25)Ctrl (n=13)
Fura
-2A
M, F
340/
F380
Time (sec)
Patient 1 vs Ctl07
Patient 2 vs Ctl11
65 mM KCl
— Control— TS

Increased numbers of TH positive neurons in TS patients
TS
Control
0
4
8
12
16
20
TS 22q11 Control
Proportion of TH+ cells /Map2+ cells
Per
cent
age
of
TH
+

Are there differences in dendritic arborization?
TS Control

Prolonged AP and cardiac arrhythmia in TS cardiomyocytes
20 mV
3 s
Control
TS
WT
TS20 mV
3 s
Control
TS
Can we use iPS cells to study environmental triggers of autism?

Can we use iPS cells to study environmental triggers of autism?
Neuronal Precursor Cells
HTS Screening Phenotype?

Summary
• We have developed ways of recapitulating neuronal development in the lab using human cells
• We can generate neurons from patients with autism
• We can detect phenotypes in cells from autistic children

But...
• We are still uncovering the cellular correlates of autism.
• We don’t know how much of a chemical gets to the brain of a developing child and for how long
• Some types of autism will not be cell autonomous (i.e. not for auto-immune disease)

Where are we now?
Gardner’s cycle of innovation
2008
2009
2010?

Alex SchlegovitovMasayuki Yazawa
Sergiu PascaJocelyn KreySusanna WenKaren Chan
Chan Young ParkThomas Portmann
Georgia PanagiotakosMasoud Sandhaghiani
Odmara Barreto Chang
With support from NIGMS, NIMH, Fidelity Foundation, Simons Fund for Autism Research and the Mcknight Endowment for Neuroscience,
Mrs Linda Miller, Ben and Felicia Horowits and Mr and Mrs John Mcafferey
Dan Geschwind, UCLAJon Bernstein Stanford