doi: 10.1038/nmat3700 - nature · new jersey 08854, usa. 2university of ... 3rutgers university,...
TRANSCRIPT

Enhanced Catalytic Activity in Strained Chemically Exfoliated WS2 Nanosheets for Hydrogen Evolution
1
Enhanced Catalytic Activity in Strained Chemically Exfoliated WS2 for Hydrogen
Evolution
Damien Voiry1, Hisato Yamaguchi1, Junwen Li2, Rafael Silva3, Diego C B Alves1,
Takeshi Fujita4,5, Mingwei Chen4,5, Tewodros Asefa3,6, Vivek B Shenoy2, Goki Eda7,8,
and Manish Chhowalla1
1Rutgers University, Materials Science and Engineering, 607 Taylor Road, Piscataway,
New Jersey 08854, USA. 2University of Pennsylvania, Materials Science and Engineering, 3231 Walnut St.,
Philadelphia, PA 19104, USA. 3Rutgers University, Department of Chemistry and Chemical Biology, 610 Taylor Road,
Piscataway, New Jersey 08854, USA 4WPI Advanced Institute for Materials Research, Tohoku University, Sendai 980-8577,
Japan. 5JST, PRESTO, 4-1-8 Honcho Kawaguchi, Saitama 332-0012, Japan 6Rutgers University, Department of Chemical and Biochemical Engineering, 98 Brett
Road, Piscataway, New Jersey 08854, USA. 7National University of Singapore, Physics Department and Graphene Research Centre,
2 Science Drive 3, Singapore 117542. 8National University of Singapore, Chemistry Department, 3 Science Drive 3, Singapore
117543.
**To whom correspondence should be addressed: [email protected]
Supplementary Information
Materials Synthesis
Bulk WS2 was intercalated with lithium by reacting WS2 powder (0.3 g, Alfa Aesar) with
n-butyllithium in hexane (1.6 M, 4 ml, Sigma-Aldrich) at 100° under argon. After 2 days,
Enhanced catalytic activity in strained chemically exfoliated WS2 nanosheets for hydrogen evolution
SUPPLEMENTARY INFORMATIONDOI: 10.1038/NMAT3700
NATURE MATERIALS | www.nature.com/naturematerials 1
© 2013 Macmillan Publishers Limited. All rights reserved.

Enhanced Catalytic Activity in Strained Chemically Exfoliated WS2 Nanosheets for Hydrogen Evolution
2
the suspension was filtered over a 450µm pore size membrane (Millipore) and washed 3
times with 50 ml of hexane (Sigma-Aldrich) giving a black powder of intercalated
LixWS2. Exfoliation in water was achieved immediately after intercalation. Dissolution
starts spontaneously but the solution was ultra-sonicated to facilitate the exfoliation of
the WS2 crystals. The solutions were then centrifuged several times to remove lithium
cations as well as the unexfoliated materials. Finally the solution was sonicated with a
sonicator horn at 25 W (40% amplitude) for 6 min.
Electrode Preparation
The electrodes for HER measurements for the 1T phase were prepared by simply drop
casting the as-exfoliated solution onto the glass carbon electrodes. For 2H HER
measurements, films of 1T WS2 were prepared by vacuum filtering 0.5 ml of the solution
over a 3.5 cm diameter membrane with 25 nm pores (equivalent to 6.5 µg/cm2). Films
were delaminated on water and transferred on silicon wafer covered with a 300-nm oxide
overlayer and annealed at 300°C under vacuum with a 70 sccm flow of a N2/H2 mixture.
Poly(methyl methacrylate) (PMMA) was then spin coated on the top of WS2 and the
silicon oxide layer was etched by a 1M NaOH solution. The delaminated films
(PMMA/WS2) were finally washed in water and transferred on the glassy carbon
electrode and the PMMA layer was removed in acetone. No chemical
modification/degradation (such as oxidation) was observed during this process as
confirmed by XPS. Platinum nanoparticles (1%) on carbon (Sigma-Aldrich) were
2 NATURE MATERIALS | www.nature.com/naturematerials
SUPPLEMENTARY INFORMATION DOI: 10.1038/NMAT3700
© 2013 Macmillan Publishers Limited. All rights reserved.
Enhanced Catalytic Activity in Strained Chemically Exfoliated WS2 Nanosheets for Hydrogen Evolution
3
dispersed in ethanol at 2 mg/ml. 10 µl was deposited on the working electrode
(equivalent to 0.28 mg/cm2) and then was covered by 7 µl of the 5% Nafion solution.
Materials Characterization
AFM data were obtained with a Digital Instruments Nanoscope IV in tapping mode with
standard cantilevers with spring constant of 40 N/m and tip curvature <10 nm. The TEM
images were taken in a JEOL 2000X at 200 kV. HAADF STEM imaging was performed
using JEOL JEM-2100F TEM/STEM with double spherical aberration (Cs) correctors
(CEOS GmbH, Heidelberg, Germany). The lens aberrations were optimized by
evaluating the Zemlin tableau of an amorphous carbon. The acceleration voltage was set
to 120 kV and the collecting angle was between 100 and 267 mrad.
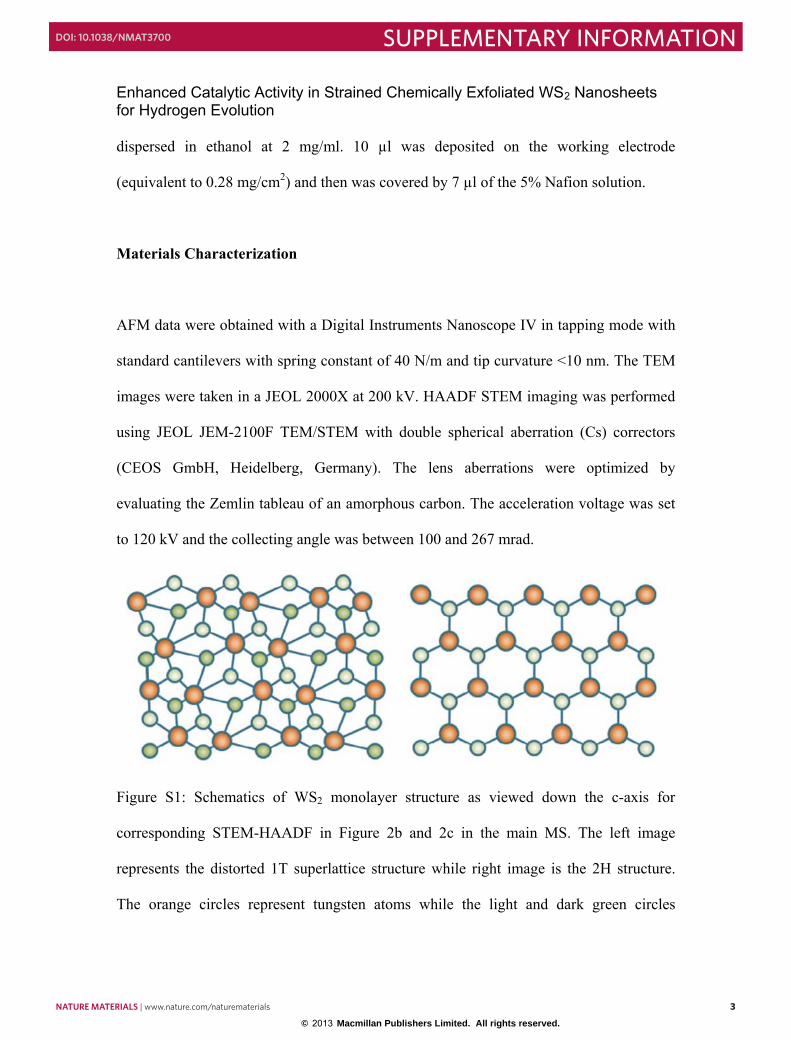
Figure S1: Schematics of WS2 monolayer structure as viewed down the c-axis for
corresponding STEM-HAADF in Figure 2b and 2c in the main MS. The left image
represents the distorted 1T superlattice structure while right image is the 2H structure.
The orange circles represent tungsten atoms while the light and dark green circles
NATURE MATERIALS | www.nature.com/naturematerials 3
SUPPLEMENTARY INFORMATIONDOI: 10.1038/NMAT3700
© 2013 Macmillan Publishers Limited. All rights reserved.
Enhanced Catalytic Activity in Strained Chemically Exfoliated WS2 Nanosheets for Hydrogen Evolution
4
represent S atoms in the upper and lower layers, respectively. In the 2H structure, the two
layers of S atoms overlap in position and only those in the upper layer are shown.
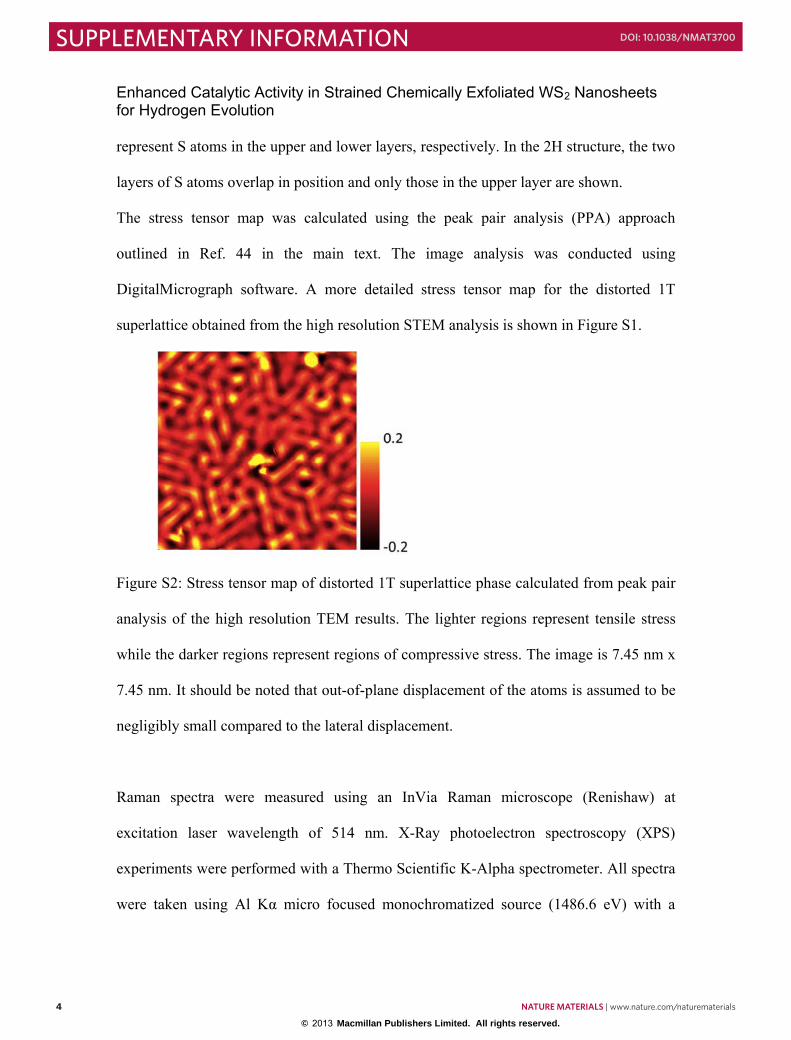
The stress tensor map was calculated using the peak pair analysis (PPA) approach
outlined in Ref. 44 in the main text. The image analysis was conducted using
DigitalMicrograph software. A more detailed stress tensor map for the distorted 1T
superlattice obtained from the high resolution STEM analysis is shown in Figure S1.
Figure S2: Stress tensor map of distorted 1T superlattice phase calculated from peak pair
analysis of the high resolution TEM results. The lighter regions represent tensile stress
while the darker regions represent regions of compressive stress. The image is 7.45 nm x
7.45 nm. It should be noted that out-of-plane displacement of the atoms is assumed to be
negligibly small compared to the lateral displacement.
Raman spectra were measured using an InVia Raman microscope (Renishaw) at
excitation laser wavelength of 514 nm. X-Ray photoelectron spectroscopy (XPS)
experiments were performed with a Thermo Scientific K-Alpha spectrometer. All spectra
were taken using Al Kα micro focused monochromatized source (1486.6 eV) with a
4 NATURE MATERIALS | www.nature.com/naturematerials
SUPPLEMENTARY INFORMATION DOI: 10.1038/NMAT3700
© 2013 Macmillan Publishers Limited. All rights reserved.

Enhanced Catalytic Activity in Strained Chemically Exfoliated WS2 Nanosheets for Hydrogen Evolution
5
resolution of 0.6 eV and a 400 µm spot size. The WS2 thin films were measured on
silicon dioxide wafer and Si2p3 was taken as a reference at 103.4 eV.
Raman and XPS Analysis
Raman shift of as-deposited and annealed WS2 films are shown in Figure S3a. Spectrum
of bulk 2H WS2 is also provided for comparison. Two prominent peaks corresponding to
the in-plane E12g and out-of-plane A1g modes of 2H WS2 are observed for all three
samples. However, the as-exfoliated samples exhibit small peaks in the lower frequency
region, similar to what occurs in chemically exfoliated MoS2, that correspond to the
distorted 1T phase Raman active modes that are not allowed in the 2H phase. The
fraction of each phase was quantified using XPS. The W peaks at ~ 31 and 36eV
correspond to the 4f7/2 and 4f5/2 components of the 2H-WS2 phase. Deconvolution of
these peaks reveals that they are shifted to slightly lower energies compared to the 2H
phase, as indicated by the curve fits in Figure S3b. In the as-exfoliated films, the two
primary peaks correspond to the 1T phase. The contribution of this phase decreases upon
annealing at 300°C, where the spectrum matches closely the bulk 2H phase WS2. Similar
peak shifts are found in the sulfur peaks, indicating the presence of 1T phase. The
quantification of the structure using XPS reveals that the ~80% of the as-exfoliated WS2
sheets consist of the metallic 1T phase, in contrast with similar analysis of as-exfoliated
MoS2 which contains only 50% 1T component (Ref 31 in the MS). Upon annealing, the
concentration of the 1T phase decreases and the nanosheets consist primarily (~80%) of
the 2H phase. The large fraction of 1T phase is also confirmed by electrical
NATURE MATERIALS | www.nature.com/naturematerials 5
SUPPLEMENTARY INFORMATIONDOI: 10.1038/NMAT3700
© 2013 Macmillan Publishers Limited. All rights reserved.

Enhanced Catalytic Activity in Strained Chemically Exfoliated WS2 Nanosheets for Hydrogen Evolution
6
measurements that show that the as-exfoliated WS2 nanosheets are electrically
conducting while the annealed material is semi-conducting.
Figure S3: a, Raman spectra of WS2 samples deposited on silicon dioxide. The J1, J2, and
J3 weak peaks in the shaded regions are only active in the as-exfoliated 1T WS2 phase.
The spectrum for WS2 nanosheets annealed at 300oC resembles that of 2H bulk phase that
is also shown. b, XPS spectra showing the W5p and W4f core level peak regions. W4f
peaks were deconvoluted with the 2H (light red) and 1T (light green) components. Based
on the deconvolutions, the 2H-1T content from the samples can be determined. As
deposited WS2 platelets are composed of ~ 80 % 1T phase whereas after annealing at
300oC 80% of the material is converted to 2H.
Structural Evolution of Chemically Exfoliated WS2 Nanosheets
The as-exfoliated WS2 nanosheets predominantly exhibit distorted 1T structure. This has
been verified with extensive TEM, Raman and XPS analysis. Raman and XPS were used
to monitor the evolution of the WS2 phase from the distorted 1T to 2H. It can be seen
from Figure S4a that the contribution of the 1T phase decreases with temperature while
6 NATURE MATERIALS | www.nature.com/naturematerials
SUPPLEMENTARY INFORMATION DOI: 10.1038/NMAT3700
© 2013 Macmillan Publishers Limited. All rights reserved.

Enhanced Catalytic Activity in Strained Chemically Exfoliated WS2 Nanosheets for Hydrogen Evolution
7
the contribution from the 2H phase increases, as indicated by the fitting the W 4f7/2 and
4f5/2 peaks in XPS. The 1T phase contribution in Figure S4a is indicated by the light
green curve fits while the light red curve fits represent the 2H phase. The ratio of the two
phases as a function of the annealing temperature is summarized in Figure S4b. The
transition from 1T to 2H occurs at a transition temperature of around 200oC, similar to
what has been reported previously (See Ref 39 in the main text). It can be seen that the
as-exfoliated samples consist of ~80% 1T phase while the annealed samples consist of ~
80% 2H phase.
Figure S4: (a) XPS spectra of chemically exfoliated WS2 nanosheets as a function of
annealing temperature. The light green curve fits represent 1T contribution while the light
red curve fits represent the 2H phase contribution. (b) Summary of 1T phase
concentration and thin film sheet resistance (see below for details) as a function of
annealing temperature.
The Raman spectra were also monitored as a function of the annealing temperature, as
shown in Figure S5. The spectra reveal that the intensities of the Raman active modes
NATURE MATERIALS | www.nature.com/naturematerials 7
SUPPLEMENTARY INFORMATIONDOI: 10.1038/NMAT3700
© 2013 Macmillan Publishers Limited. All rights reserved.

Enhanced Catalytic Activity in Strained Chemically Exfoliated WS2 Nanosheets for Hydrogen Evolution
8
from the 1T phase decrease with annealing temperature while the peaks corresponding to
the 2H phase become sharper. Spectrum of bulk 2H WS2 is also shown for comparison.
Figure S5: Raman spectra of chemically exfoliated WS2 nanosheets as a function of
annealing temperature.
Electrical Properties
Electrical and photoluminescence (PL) measurements were performed in order to monitor
the structural evolution during annealing. The current voltage (I-V) characteristics of thin
films of chemically exfoliated WS2 are shown in Figure S6a. The as-exfoliated material
exhibited linear I-V characteristics and low sheet resistance 430k�/sq. reflecting its more
conducting nature. Annealing leads to an increase in sheet resistance, especially above
200oC, consistent with the onset of transition from 1T to 2H phase. The resistance as a
8 NATURE MATERIALS | www.nature.com/naturematerials
SUPPLEMENTARY INFORMATION DOI: 10.1038/NMAT3700
© 2013 Macmillan Publishers Limited. All rights reserved.
Enhanced Catalytic Activity in Strained Chemically Exfoliated WS2 Nanosheets for Hydrogen Evolution
9
function of the annealing temperature (as well as the phase concentration) is shown in
Figure S4b. The transition to predominantly 2H phase was also corroborated by
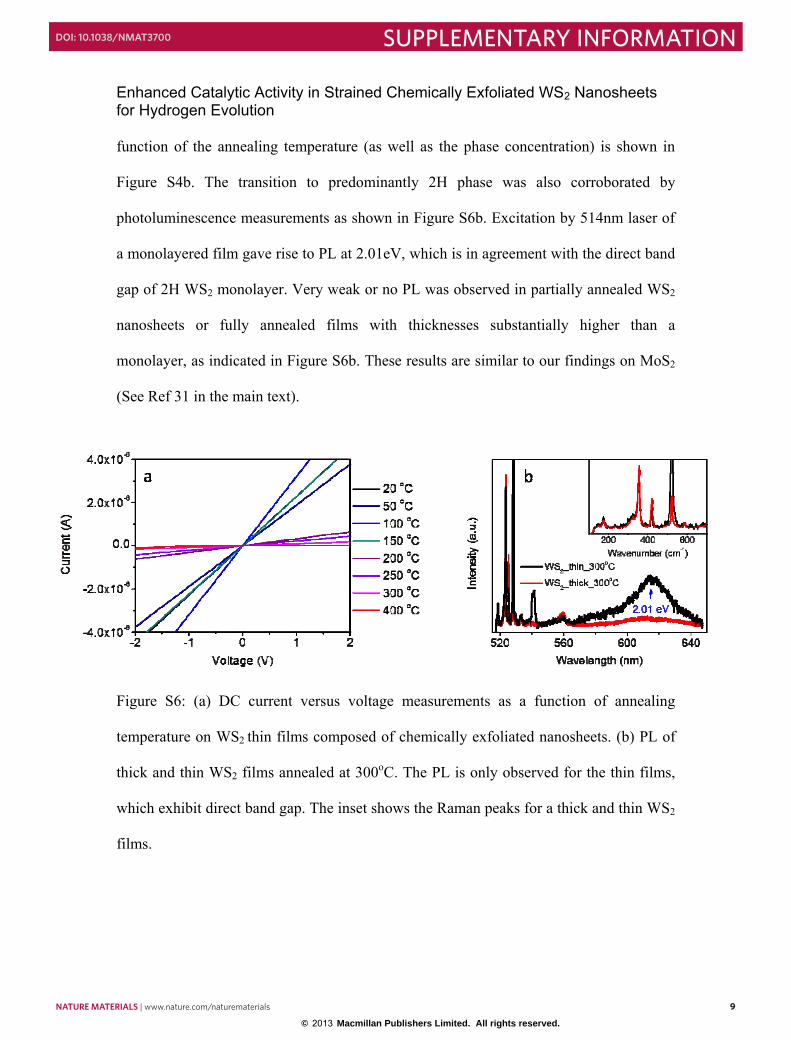
photoluminescence measurements as shown in Figure S6b. Excitation by 514nm laser of
a monolayered film gave rise to PL at 2.01eV, which is in agreement with the direct band
gap of 2H WS2 monolayer. Very weak or no PL was observed in partially annealed WS2
nanosheets or fully annealed films with thicknesses substantially higher than a
monolayer, as indicated in Figure S6b. These results are similar to our findings on MoS2
(See Ref 31 in the main text).
Figure S6: (a) DC current versus voltage measurements as a function of annealing
temperature on WS2 thin films composed of chemically exfoliated nanosheets. (b) PL of
thick and thin WS2 films annealed at 300oC. The PL is only observed for the thin films,
which exhibit direct band gap. The inset shows the Raman peaks for a thick and thin WS2
films.
NATURE MATERIALS | www.nature.com/naturematerials 9
SUPPLEMENTARY INFORMATIONDOI: 10.1038/NMAT3700
© 2013 Macmillan Publishers Limited. All rights reserved.

Enhanced Catalytic Activity in Strained Chemically Exfoliated WS2 Nanosheets for Hydrogen Evolution
10
1T and strain relationship:
We have correlated the strain values to the 1T phase concentration by measuring the
stress tensor maps in the TEM. We found that the strain is directly correlated with
annealing (i.e. decrease in 1T concentration). Our analysis suggests that 1T
concentrations of ~80%, ~50%, ~25%, and 0% would correspond to strains of ~ 3%,
~1%, ~ 0.3%, and 0%.
Figure S7: Stress tensor maps of WS2 nanosheets. Left most image represents as-
synthesized films containing maximum amount of 1T phase concentration. The images
represent decreasing 1T phase concentration with the right one representing 100% 2H
phase showing no strain.
Additional HER properties:
The key step in HER is the adsorption of the proton on the active site. To assess this, we
have varied the pH. We found that WS2 is active over a wide range of pH although the
activity decreases after pH=1 due to the strong diminution of the quantity of protons
available. Similar behavior has been reported in the case of amorphous molybdenum
sulfide with a strong decrease of the current density observed when increasing the pH
from 1 to 2 (Ref 16). Although the direct interpretation of the HER mechanism from the
10 NATURE MATERIALS | www.nature.com/naturematerials
SUPPLEMENTARY INFORMATION DOI: 10.1038/NMAT3700
© 2013 Macmillan Publishers Limited. All rights reserved.

Enhanced Catalytic Activity in Strained Chemically Exfoliated WS2 Nanosheets for Hydrogen Evolution
11
Tafel slope is limited to well-defined systems such as Pt, the dramatic increase of the
Tafel slope can be interpreted as decrease in hydrogen adsorption of WS2 as pH
increases.
Figure S8: Variation of current density versus the overpotential (RHE) as a function of
the pH. The highest current density is obtained for the lowest pH, consistent with the
solution having the highest proton concentration. The inset shows that the Tafel slope
also increases with pH indicating that the rate limiting proton adsorption step is strongly
influenced by the proton concentration. Overpotential = E (RHE) – (-0.059 x pH).
Active sites measurements:
The density of active sites was measured using underpotential deposition (UPD) of
copper using the method described by Green et al. in Ref 28 in the MS. Green et al. have
NATURE MATERIALS | www.nature.com/naturematerials 11
SUPPLEMENTARY INFORMATIONDOI: 10.1038/NMAT3700
© 2013 Macmillan Publishers Limited. All rights reserved.

Enhanced Catalytic Activity in Strained Chemically Exfoliated WS2 Nanosheets for Hydrogen Evolution
12
demonstrated that the surface activity of platinum or ruthenium can be determined by
measuring the charges exchanged during copper stripping after deposition at the
underpotenial regions. By comparing the charges exchanged during hydrogen adsorption
and copper stripping in sulfuric acid in absence and presence of cupric sulfate (CuSO4) at
various potentials, they found that when shifting the potential toward underpotential
regions, the charge ratio QCu/QH decreases and reaches a plateau for QCu/QH equal to 2.
This ratio of 2 is expected when monolayer cupper is deposited at the same site as
hydrogen since copper stripping involves 2 electrons versus one for hydrogen adsorption.
At higher potentials the ratio decreases indicating that less copper is deposited compared
to the quantity of adsorbed hydrogen. We found that exfoliated WS2 has the ability to
reduce copper at higher potentials (underpotential deposition, UPD) than its
thermodynamic potential (overpotential deposition, OPD) and the method of Green et al.
was applied to quantify the number of active sites.
Figure S9: Cycling voltammetry of the exfoliated WS2 in presence of cupric sulfate
reveals the presence of overpotential stripping and deposition signal (IA and Ic
respectively) and broad peaks (IIA and IIC) corresponding to the underpotential regions
12 NATURE MATERIALS | www.nature.com/naturematerials
SUPPLEMENTARY INFORMATION DOI: 10.1038/NMAT3700
© 2013 Macmillan Publishers Limited. All rights reserved.

Enhanced Catalytic Activity in Strained Chemically Exfoliated WS2 Nanosheets for Hydrogen Evolution
13
between 300 mV and 650 mV vs. RHE. Under the same condition bulk WS2 shows a
small UPD signal close to the OPD potential between 250 and 300 mV vs. RHE whereas
glassy carbon does not exhibit any underpotential deposition signal, as shown.
Experimentally, the charges associated with the copper stripping were measured in three
steps. In a 0.1 M of H2SO4 and 2mM of CuSO4 solution, the electrode surface was
thoroughly electrochemically cleaned prior to performing any deposition by applying a
potential of 673 mV vs. RHE for 120 seconds. Then the potential was lowered and kept
constant for 100s to deposit copper after which it was progressively increased to 673 mV
vs. RHE to oxidize the copper. The current associated with the copper stripping was
measured. Hydrogen adsorption was measured the same way using a 0.1 M H2SO4
solution in absence of copper ions. The results agree perfectly with the observations
reported by Green et al. and the QCu/QH reaches at plateau of 2 after 525 mV vs. RHE
(See Figure S9). This indicates that at this potential the same quantity of copper as
hydrogen is deposited on the surface of the electrode at the active sites. From the quantity
of charges generated during the Cu stripping at a potential of deposition of 573 mV vs.
RHE, it can be calculated that 3.21 x 10¹³ mol of Cu (QCu/96500/2) have been deposited.
From this, an active site density ranging from 4.5 x 10¹⁴ sites/cm2 – 2.0 x 10¹⁵ sites/cm2
(nCu/Aelectrode) is obtained for hydrogen adsorption on 1T WS2 nanosheets. Similar
analyses on the annealed samples reveal lower active site density of 1.5 x 10¹⁴ sites/cm2.
The current exchange density was calculated using the method described previously in
Ref. 4. From the Tafel plot, we measured the current density to be 6.2 x 10⁻⁶
NATURE MATERIALS | www.nature.com/naturematerials 13
SUPPLEMENTARY INFORMATIONDOI: 10.1038/NMAT3700
© 2013 Macmillan Publishers Limited. All rights reserved.

Enhanced Catalytic Activity in Strained Chemically Exfoliated WS2 Nanosheets for Hydrogen Evolution
14
A/cm2geometric. From the measured site density of 4.5 x 1014 cm-2, the exchange current
density per site is equal to 1.37 x 10⁻²⁰ A/sites. This value was then multiplied by the
density of sites in case of platinum (1.5 x 1015 cm-2) for a direct comparison. Based on
this method, the exchange current density of strained chemically exfoliated WS2 was
found to be 2 x 10⁻⁵ A/cm2.
Figure S10: QCu/QH reaches at plateau of 2 after 525 mV vs. RHE indicating that at this
potential the same quantity of copper as hydrogen is deposited on the surface of the
electrode at the active sites.
Experimental details for the active sites measurements:
Electrodes for active site measurements were prepared in the exact same manner as for
HER experiments.
0.45 0.50 0.55 0.6002468
10121416
QC
u/QH
Potential (V vs. RHE)
As-Deposited
14 NATURE MATERIALS | www.nature.com/naturematerials
SUPPLEMENTARY INFORMATION DOI: 10.1038/NMAT3700
© 2013 Macmillan Publishers Limited. All rights reserved.

Enhanced Catalytic Activity in Strained Chemically Exfoliated WS2 Nanosheets for Hydrogen Evolution
15
Active site measurements were performed using two 0.1 M H2SO4 solutions: one
containing only sulfuric acid, the second one containing the cupric sulfate at 2 mM.
Solutions were degassed with Ar prior the measurements and the measurement were done
under an Ar blanket. Cyclic voltamperometric were performed with a scan rate of 2 mV/s
and a saturated calomel electrode was used as the reference. Before each measurement,
electrodes were cleaned at 673 mV for 120 s and the potential of deposition was
maintained constant for 100 s. Stripping currents were measured by progressively
increasing the potential from the deposition potential up to 673 mV with a scan rate of 2
mV/s.
Discounting the presence of Lithium impurities:
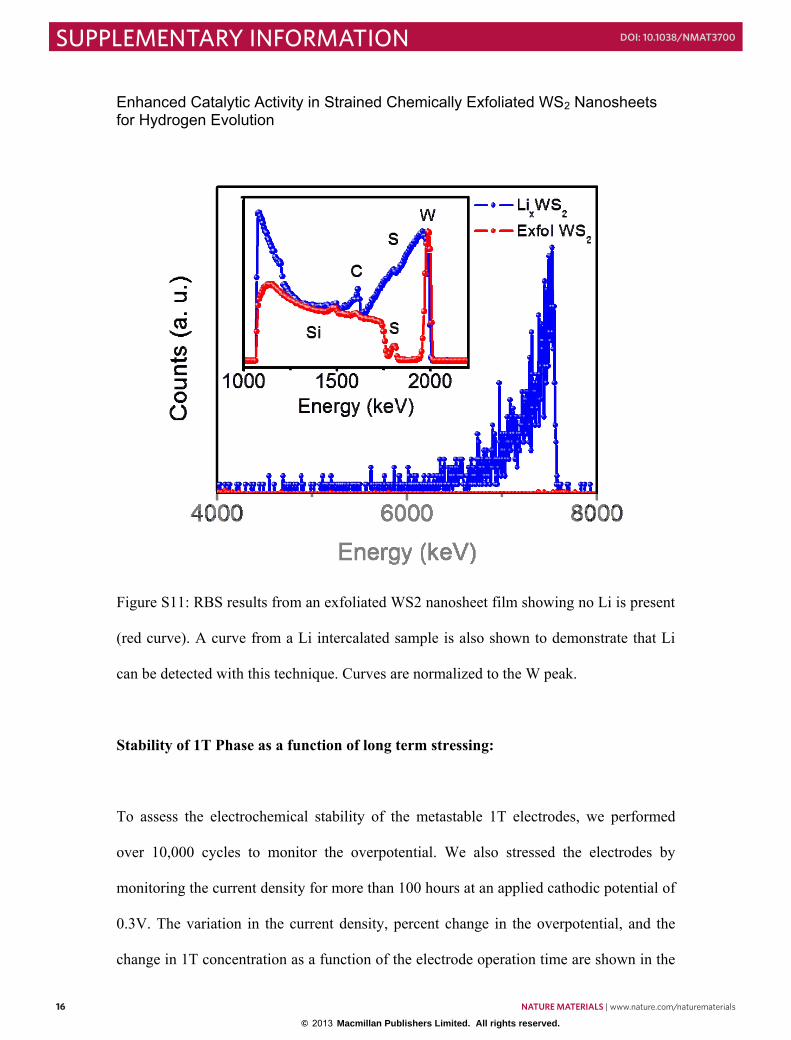
We have ruled out any possibility of Li in our exfoliated samples by performing highly
sensitive Rutherford backscattering spectroscopy (RBS) analysis. The results shown in
Figure S11 clearly demonstrate that Li is not present in our samples.
NATURE MATERIALS | www.nature.com/naturematerials 15
SUPPLEMENTARY INFORMATIONDOI: 10.1038/NMAT3700
© 2013 Macmillan Publishers Limited. All rights reserved.
Enhanced Catalytic Activity in Strained Chemically Exfoliated WS2 Nanosheets for Hydrogen Evolution
16
Figure S11: RBS results from an exfoliated WS2 nanosheet film showing no Li is present
(red curve). A curve from a Li intercalated sample is also shown to demonstrate that Li
can be detected with this technique. Curves are normalized to the W peak.
Stability of 1T Phase as a function of long term stressing:
To assess the electrochemical stability of the metastable 1T electrodes, we performed
over 10,000 cycles to monitor the overpotential. We also stressed the electrodes by
monitoring the current density for more than 100 hours at an applied cathodic potential of
0.3V. The variation in the current density, percent change in the overpotential, and the
change in 1T concentration as a function of the electrode operation time are shown in the
16 NATURE MATERIALS | www.nature.com/naturematerials
SUPPLEMENTARY INFORMATION DOI: 10.1038/NMAT3700
© 2013 Macmillan Publishers Limited. All rights reserved.
Enhanced Catalytic Activity in Strained Chemically Exfoliated WS2 Nanosheets for Hydrogen Evolution
17
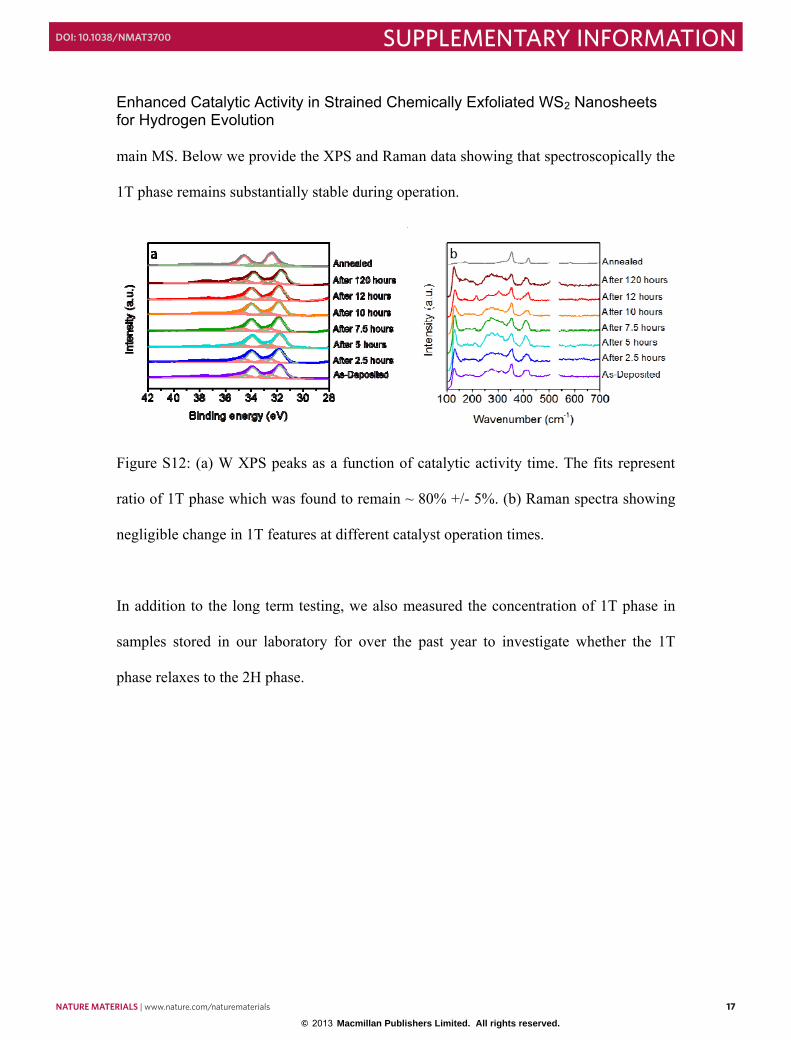
main MS. Below we provide the XPS and Raman data showing that spectroscopically the
1T phase remains substantially stable during operation.
Figure S12: (a) W XPS peaks as a function of catalytic activity time. The fits represent
ratio of 1T phase which was found to remain ~ 80% +/- 5%. (b) Raman spectra showing
negligible change in 1T features at different catalyst operation times.
In addition to the long term testing, we also measured the concentration of 1T phase in
samples stored in our laboratory for over the past year to investigate whether the 1T
phase relaxes to the 2H phase.
NATURE MATERIALS | www.nature.com/naturematerials 17
SUPPLEMENTARY INFORMATIONDOI: 10.1038/NMAT3700
© 2013 Macmillan Publishers Limited. All rights reserved.

Enhanced Catalytic Activity in Strained Chemically Exfoliated WS2 Nanosheets for Hydrogen Evolution
18
Figure S13: 1T phase concentration as a function of the number of days after exfoliation.
It can be seen that the 1T phase remains stable with time.
Impedance Measurements:
Impedance measurements were performed on electrodes consisting of 1T and 2H films,
bulk WS2 powder as well as glassy carbon reference.
0 100 200 3000
25
50
75
100
Films Solutions
1T c
onte
nt (a
t. %
)
Days
18 NATURE MATERIALS | www.nature.com/naturematerials
SUPPLEMENTARY INFORMATION DOI: 10.1038/NMAT3700
© 2013 Macmillan Publishers Limited. All rights reserved.

Enhanced Catalytic Activity in Strained Chemically Exfoliated WS2 Nanosheets for Hydrogen Evolution
19
Figure S14: Impedance spectra for glassy carbon electrode alone.
Comparison between Pt and carbon counter electrode:
Platinum contamination is a major risk in electrocatalysis since platinum would
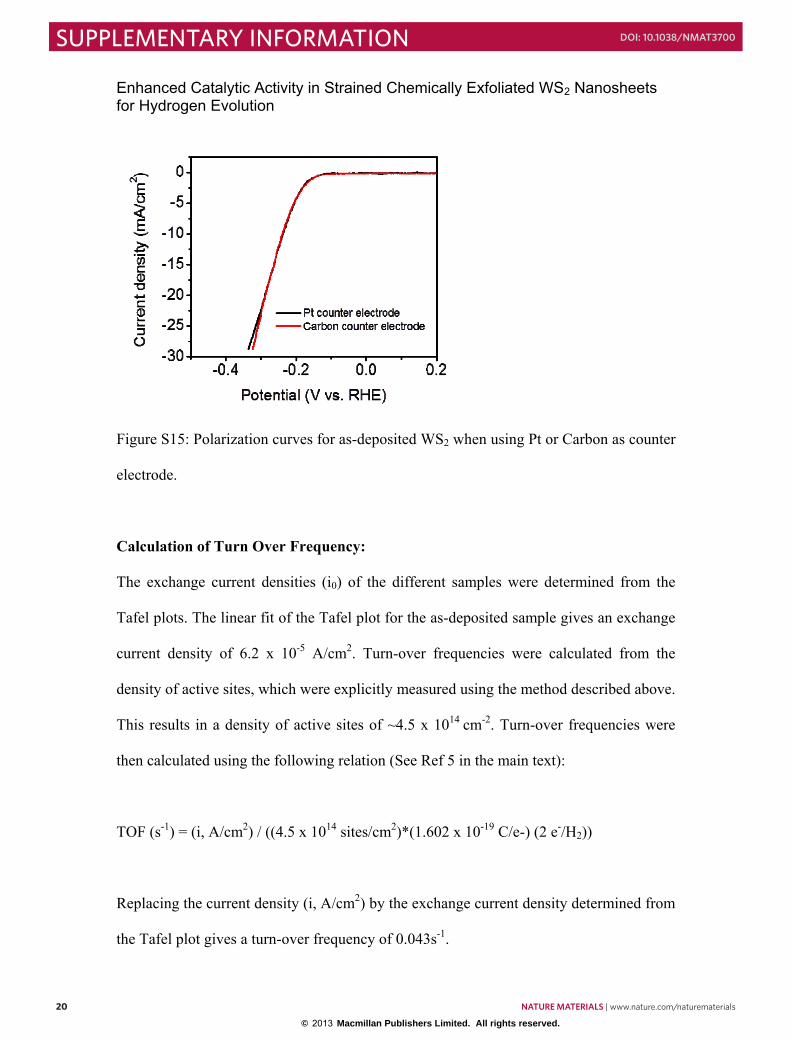
artificially increases the activity of WS2. Figure S15 shows the polarization curves
obtained from as-deposited WS2 using platinum and carbon counter electrode. No
difference is noticeable and this rules out any Pt contamination during the measurements
(Figure S15).
NATURE MATERIALS | www.nature.com/naturematerials 19
SUPPLEMENTARY INFORMATIONDOI: 10.1038/NMAT3700
© 2013 Macmillan Publishers Limited. All rights reserved.
Enhanced Catalytic Activity in Strained Chemically Exfoliated WS2 Nanosheets for Hydrogen Evolution
20
Figure S15: Polarization curves for as-deposited WS2 when using Pt or Carbon as counter
electrode.
Calculation of Turn Over Frequency:
The exchange current densities (i0) of the different samples were determined from the
Tafel plots. The linear fit of the Tafel plot for the as-deposited sample gives an exchange
current density of 6.2 x 10⁻⁵ A/cm2. Turn-over frequencies were calculated from the
density of active sites, which were explicitly measured using the method described above.
This results in a density of active sites of ~4.5 x 1014 cm-2. Turn-over frequencies were
then calculated using the following relation (See Ref 5 in the main text):
TOF (s-1) = (i, A/cm2) / ((4.5 x 10¹⁴ sites/cm2)*(1.602 x 10-19 C/e-) (2 e-/H2))
Replacing the current density (i, A/cm2) by the exchange current density determined from
the Tafel plot gives a turn-over frequency of 0.043s-1.
20 NATURE MATERIALS | www.nature.com/naturematerials
SUPPLEMENTARY INFORMATION DOI: 10.1038/NMAT3700
© 2013 Macmillan Publishers Limited. All rights reserved.
Enhanced Catalytic Activity in Strained Chemically Exfoliated WS2 Nanosheets for Hydrogen Evolution
21
Turn-over frequencies at the different potentials are calculated the same way using the
current density (i, A/cm2) instead of the exchange current, i0.
Computational approach
The density functional calculations were carried out by using the Vienna ab initio
simulation package (VASP), with exchange-correlation functional described by Perdew-
Burke-Ernzerhof generalized gradient approximation (PBE-GGA) and interaction
between core electrons and valence electrons by the frozen-core projector-augmented
wave (PAW) method. An energy cutoff of 600 eV was used for plane wave basis
expansion. The fully relaxed lattice constants are a = 3.18 Å, b = 3.18 Å and a = 3.19 Å,
b = 6.54 Å for 2H-WS2 and distorted 1T-WS2, respectively. W-W bond length in 2H-
WS2 is 3.18 Å. In the distorted 1T-WS2 the W-W can have bond lengths of 2.77 Å and
3.19 Å. These values compare well with our experimental measurements. The hydrogen
adsorption energies have been calculated with a 4x2x1 supercell shown in Figure S16 for
1T-WS2. Usually denser k points are required to achieve convergence for metals.
However, the bands of 1T-WS2 are rather flat as shown in Figure S17 such that we can
sample the Brillouin zone by using Monkhorst-Pack 4x4x1 k-point grid. Denser sampling
only gives rise to a total energy change less than 2.5 meV as shown in Figure S18 for the
unit cell of 1T-WS2. We also carried out spin-polarized calculations for different H
coverage of 0% strain which only show total energy changes smaller than 1 meV with
respect to the non-spin-polarized results as indicated in Figure S19. A vaccum region of
greater than 18.00 Å was added along the direction normal to the sheet plane to avoid the
interaction between periodic supercells. We carried out relaxation for all supercells and
NATURE MATERIALS | www.nature.com/naturematerials 21
SUPPLEMENTARY INFORMATIONDOI: 10.1038/NMAT3700
© 2013 Macmillan Publishers Limited. All rights reserved.

Enhanced Catalytic Activity in Strained Chemically Exfoliated WS2 Nanosheets for Hydrogen Evolution
22
all atoms in the supercells were allowed to move until the force on each atom is less than
0.02 eV/Å. Although the 2H-WS2 is more stable with total energy 0.537 eV lower than
that of the distorted 1T-WS2, there is a bigger energy barrier for the phase transformation.
The nudged elastic band [citation: H. Jonsson, G. Mills, and K.W. Jacobsen, in
Classical and Quantum Dynamics in Condensed Phase Simulations, edited by B. J.
Berne, G. Ciccotti, and D. F. Coker (World Scientific, Singapore, 1998)] was applied
to determine this energy barrier. Because of the lattice mismatch between 1T and 2H
structures, we employ the lattice constants of 1T phase for both 1T and 2H structures and
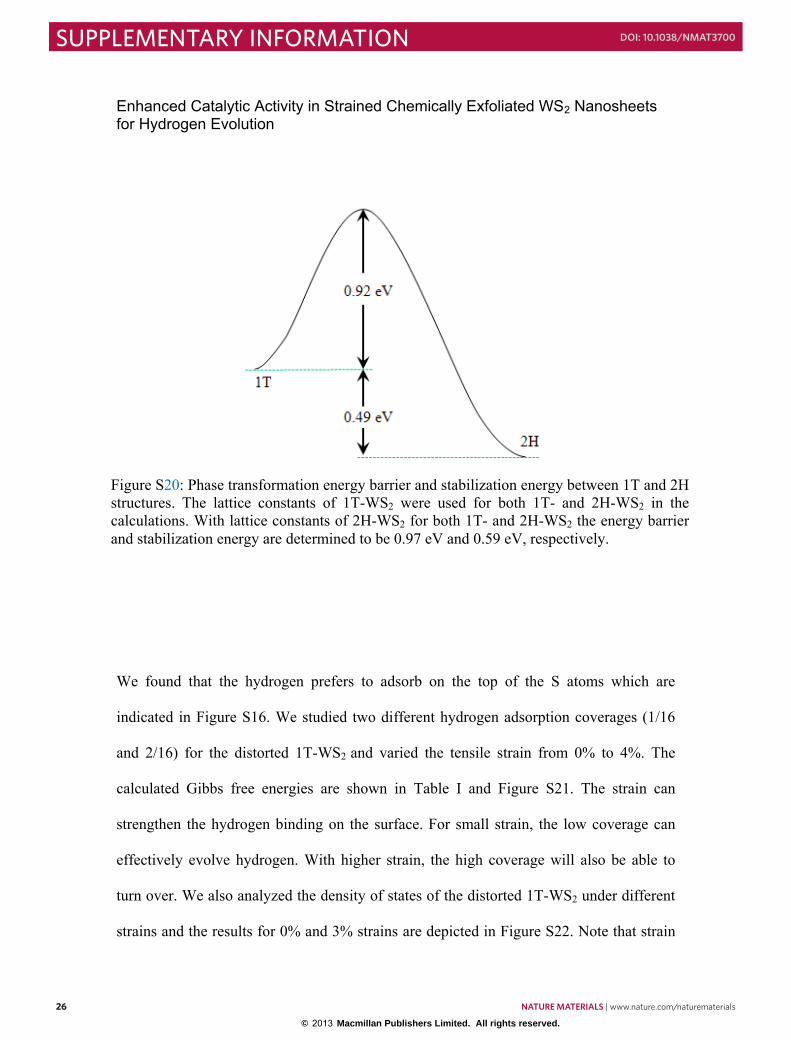
results are presented in Figure S20. The energy barrier is determined to be 0.92 eV. The
tensile strain experienced by the 2H structure makes the stabilization energy reduce to
0.49 eV. We also carried out calculations with lattice constants of 2H phase. The energy
barrier is 0.97 eV and the compressive strain experienced by the 1T structure increases
the stabilization energy to 0.59 eV.
The stability of hydrogen can be described by the differential hydrogen adsorption energy
ΔEH, which is defined as
ΔEH = EWS2 + nH - E WS2+(n-1)H – ��EH2,
Where EWS2+nH is the total energy for the WS2 system with n hydrogen atoms absorbed on
the surface, EWS2+(n-1)H is the total energy for (n-1) hydrogen atoms adsorbed on the
surface and EH2 is the energy for a hydrogen molecule in the gas phase. The ΔEH
obtained from the ground state calculations does not include the contributions from the
22 NATURE MATERIALS | www.nature.com/naturematerials
SUPPLEMENTARY INFORMATION DOI: 10.1038/NMAT3700
© 2013 Macmillan Publishers Limited. All rights reserved.

Enhanced Catalytic Activity in Strained Chemically Exfoliated WS2 Nanosheets for Hydrogen Evolution
23
vibrational motion and the entropy. The Gibbs free energy for hydrogen adsorption can
be calculated by including these corrections:
ΔGH = ΔEH + ΔEZPE - TΔSH
where ΔEH is the differential hydrogen adsorption energy, ΔEZPE is the difference in zero
point energy between the adsorbed hydrogen and hydrogen in the gas phase and ΔSH is
the entropy difference between the adsorbed state and the gas phase. The contribution
from the configurational entropy in the adsorbed state is small and is neglected. We can
take the entropy of hydrogen adsorption as ΔSH = 1/2SH2 where SH2 is the entropy of
molecule hydrogen in the gas phase at standard conditions[citation: NIST Chemistry
WebBook, NIST Standard Reference Database Number 69, edited by Linstrom, P. J.
& Mallard, W. G. (National Institute of Standards and Technology, Gaithersburg,
MD, 2009), http://webbook.nist.gov.] (1 bar of H2, pH = 0 and T = 300 K). We have
calculated the vibrational frequencies of H adsorbed on site 1 of the distorted 1T-WS2 by
using finite differences to determine the Hessian matrix. The calculated vibrational
frequencies are 2521 cm-1, 668 cm-1 and 562 cm-1. With these values the Gibbs free
energy is ΔGH = ΔEH + 0.28eV. Our calculations show that vibrational frequencies do not
exhibit sensitive dependence on strains studied in this paper, so we use the same value for
all corrections.
NATURE MATERIALS | www.nature.com/naturematerials 23
SUPPLEMENTARY INFORMATIONDOI: 10.1038/NMAT3700
© 2013 Macmillan Publishers Limited. All rights reserved.

Enhanced Catalytic Activity in Strained Chemically Exfoliated WS2 Nanosheets for Hydrogen Evolution
24
1 2 3 4
5 6 7 8
Figure S16 The supercell used in the calculations of hydrogen adsorption on thesurface of the distorted 1T-WS2. Gray and yellow spheres represent the W and Satoms, respectively. The numbers indicate the favorable sites of hydrogen binding.
Figure S17: Electronic band structure of distorted 1T WS2. The Fermi level is set to zeroand is indicated by blue solid line.
24 NATURE MATERIALS | www.nature.com/naturematerials
SUPPLEMENTARY INFORMATION DOI: 10.1038/NMAT3700
© 2013 Macmillan Publishers Limited. All rights reserved.
Enhanced Catalytic Activity in Strained Chemically Exfoliated WS2 Nanosheets for Hydrogen Evolution
25
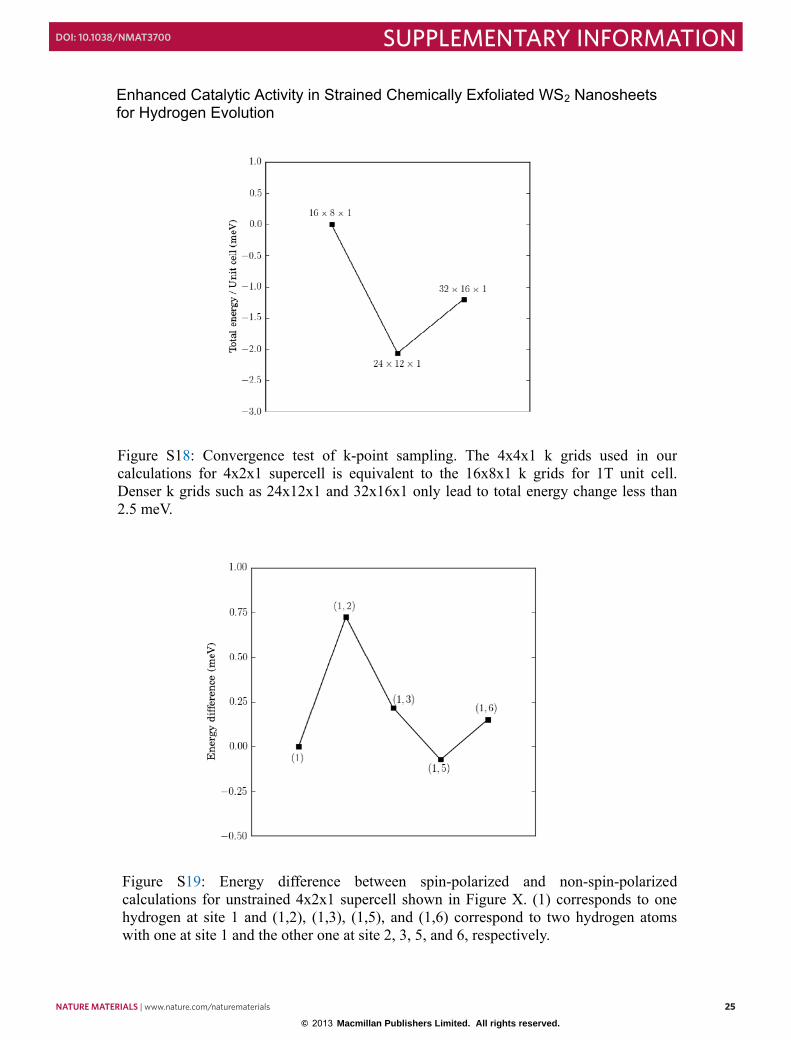
Figure S18: Convergence test of k-point sampling. The 4x4x1 k grids used in ourcalculations for 4x2x1 supercell is equivalent to the 16x8x1 k grids for 1T unit cell.Denser k grids such as 24x12x1 and 32x16x1 only lead to total energy change less than2.5 meV.
Figure S19: Energy difference between spin-polarized and non-spin-polarizedcalculations for unstrained 4x2x1 supercell shown in Figure X. (1) corresponds to onehydrogen at site 1 and (1,2), (1,3), (1,5), and (1,6) correspond to two hydrogen atomswith one at site 1 and the other one at site 2, 3, 5, and 6, respectively.
NATURE MATERIALS | www.nature.com/naturematerials 25
SUPPLEMENTARY INFORMATIONDOI: 10.1038/NMAT3700
© 2013 Macmillan Publishers Limited. All rights reserved.
Enhanced Catalytic Activity in Strained Chemically Exfoliated WS2 Nanosheets for Hydrogen Evolution
26
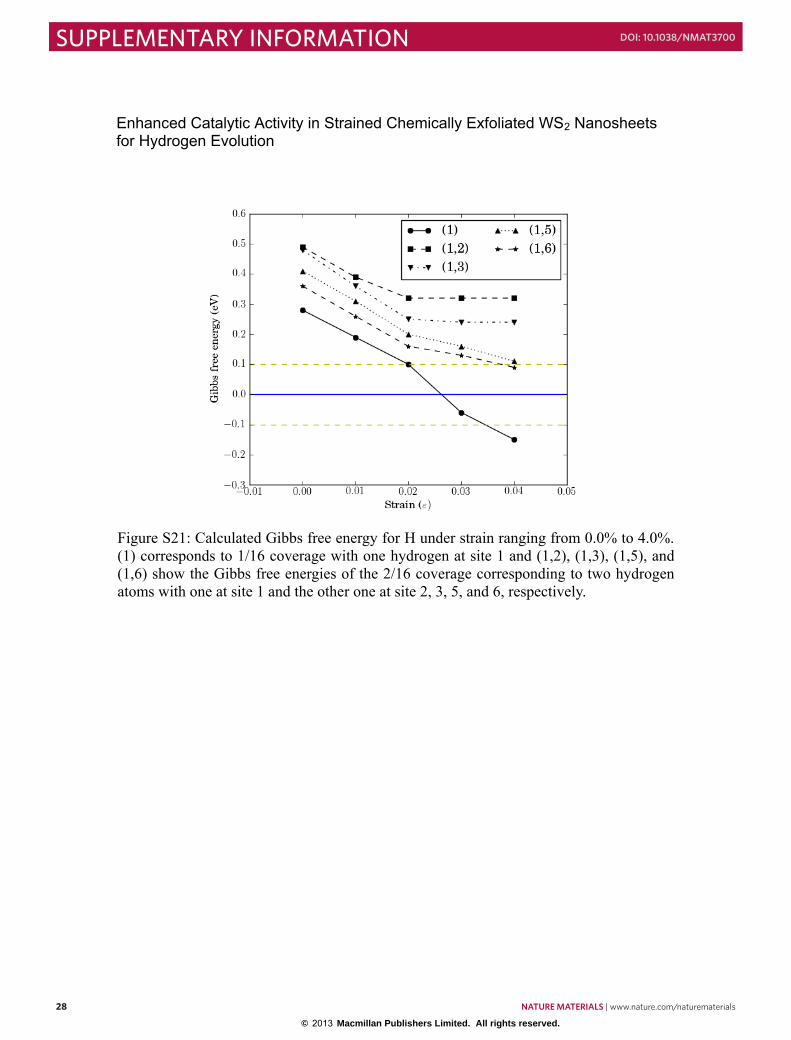
We found that the hydrogen prefers to adsorb on the top of the S atoms which are
indicated in Figure S16. We studied two different hydrogen adsorption coverages (1/16
and 2/16) for the distorted 1T-WS2 and varied the tensile strain from 0% to 4%. The
calculated Gibbs free energies are shown in Table I and Figure S21. The strain can
strengthen the hydrogen binding on the surface. For small strain, the low coverage can
effectively evolve hydrogen. With higher strain, the high coverage will also be able to
turn over. We also analyzed the density of states of the distorted 1T-WS2 under different
strains and the results for 0% and 3% strains are depicted in Figure S22. Note that strain
Figure S20: Phase transformation energy barrier and stabilization energy between 1T and 2Hstructures. The lattice constants of 1T-WS2 were used for both 1T- and 2H-WS2 in the calculations. With lattice constants of 2H-WS2 for both 1T- and 2H-WS2 the energy barrier and stabilization energy are determined to be 0.97 eV and 0.59 eV, respectively.
26 NATURE MATERIALS | www.nature.com/naturematerials
SUPPLEMENTARY INFORMATION DOI: 10.1038/NMAT3700
© 2013 Macmillan Publishers Limited. All rights reserved.

Enhanced Catalytic Activity in Strained Chemically Exfoliated WS2 Nanosheets for Hydrogen Evolution
27
significantly increases the density of states near the Fermi level. This may account for the
enhanced hydrogen binding and the catalytic performance.
We also studied the hydrogen adsorption on the surface of 2H-WS2 and a 4x4x1 supercell
is employed. The size of this supercell is close to that used in the study of distorted 1T-
WS2. Our calculations show that even under 4% tension, the Gibbs free energy for 1/16
coverage is still as high as 1.93 eV. This indicates that the tensile strain in the range
studied here can not make the surface of 2H-WS2 have good catalytic activity.
Table I: Calculated Gibbs free energy for H under strain ranging from 0.0% to 4.0%. The
1/16 coverage corresponds to one hydrogen at site 1 and the 2/16 coverage correspond to
two hydrogen atoms with one at site 1 and the other one at site 2, 3, 5, and 6, respectively.
Strain ΔGH (eV)
1
ΔGH (eV)
1, 2
ΔGH (eV)
1, 3
ΔGH (eV)
1, 5
ΔGH (eV)
1, 6
0.0% 0.28 0.49 0.48 0.41 0.36
1.0% 0.19 0.39 0.36 0.31 0.26
2.0% 0.10 0.32 0.25 0.20 0.16
3.0% -0.06 0.32 0.24 0.16 0.13
4.0% -0.15 0.32 0.24 0.11 0.09
NATURE MATERIALS | www.nature.com/naturematerials 27
SUPPLEMENTARY INFORMATIONDOI: 10.1038/NMAT3700
© 2013 Macmillan Publishers Limited. All rights reserved.
Enhanced Catalytic Activity in Strained Chemically Exfoliated WS2 Nanosheets for Hydrogen Evolution
28
Figure S21: Calculated Gibbs free energy for H under strain ranging from 0.0% to 4.0%.(1) corresponds to 1/16 coverage with one hydrogen at site 1 and (1,2), (1,3), (1,5), and(1,6) show the Gibbs free energies of the 2/16 coverage corresponding to two hydrogenatoms with one at site 1 and the other one at site 2, 3, 5, and 6, respectively.
28 NATURE MATERIALS | www.nature.com/naturematerials
SUPPLEMENTARY INFORMATION DOI: 10.1038/NMAT3700
© 2013 Macmillan Publishers Limited. All rights reserved.

Enhanced Catalytic Activity in Strained Chemically Exfoliated WS2 Nanosheets for Hydrogen Evolution
29
Figure S22: Density of states of the distorted 1T-WS2 without or with 3% strain. The
Fermi level is set to be zero and is indicated by the vertical line.
NATURE MATERIALS | www.nature.com/naturematerials 29
SUPPLEMENTARY INFORMATIONDOI: 10.1038/NMAT3700
© 2013 Macmillan Publishers Limited. All rights reserved.