does work impede child’s learning? the case of senegal · does work impede child’s learning?...
TRANSCRIPT

Does work impede child’s learning?
The case of Senegal ∗
Christelle Dumas†
April 9, 2008
Abstract
This paper assesses the impact of labor performed during childhoodon cognitive achievement of teenagers, measured by tests. Introductionof community fixed effects and use of multiple tests taken at the entry ofprimary school allows to control for unobserved heterogeneity and mea-surement error in the entry tests. We find no detrimental impact of par-ticipation of children to economic activities on their subsequent learningonce controlling for the number of years of education but rather a pos-itive, though small, impact. This could come from increased monetaryresources or from knowledge acquisition due to a higher frequentation ofthe parents. Working more than 17 hours a week though prevents thechild to learn as much as the other children.
JEL Classification: I21, J24, 012.Key-words: Child labor, Human capital, multiple-indicator, fixed effects.
∗Acknowledgement: I am grateful to Deborah de Graaf , Gregory Jolivet and Sylvie Lam-bert, for their very useful comments on this and earlier versions of this paper.
†University Cergy-Pontoise-Thema. 33, bd du Port. 95011 Cergy-Pontoise. France. Tel:(33-0) 1 34 25 72 76. [email protected]
1

1 Introduction
In Senegal, one child out of three is working1 while only half of the childrenreceive a full primary education. Children are often portrayed as being eitherenrolled in school or economically active but not both in the same time. Thisrepresentation is actually fallacious in most parts of the world and especiallyin Africa. In our Senegalese dataset, we find that 58% of working children areenrolled in school.2 The picture is thus not as clear-cut as it may seem atfirst glance. Given the very low levels of education, understanding how theytranslate into human capital and how work may impede learning is valuable.
An important body of literature discusses the causes of child labor in devel-oping countries; there is in comparison relatively little on the consequences ofchildren’s work on their future trajectories. While some people argue that everychild should be entitled to live a work-free childhood, others consider child laboracceptable as long as it does not harm their development. The InternationalLabor Organization’s position is a mix of these two options since the MinimumAge Convention (C138) stipulates that:3
National laws or regulations may permit the employment or work ofpersons 13 to 15 years of age on light work which is: (a) not likelyto be harmful to their health or development; and (b) not such as toprejudice their attendance at school [...] or their capacity to benefitfrom the instruction received.
The aim of this paper is thus to assess the impact of children’s participation toeconomic activities on their human capital accumulation. Research on this topichas so far mainly focused on the question of the impact of child labor on schoolattendance (Ravallion and Wodon, 2000; Boozer and Suri, 2001; Assaad et al.,2002; Canals-Cerda and Ridao-Cano, 2004; Beegle et al., 2004; Assaad et al.,2005)4. Most of these papers conclude to a fairly small effect of participating toeconomic activities on a range of educational outcomes related to enrollment.
However, in an environment where school quality is low, number of yearsspent in school may not be a very good indicator for future wages or productivity.Insofar as an important number of children are able to combine both schoolingand work, the last aspect mentioned in the convention, namely the impact ofparticipation to work on learning achievement, is particularly important andhas seldom been studied. It could well be that labor has seldom any effectson the amount of schooling a child receives, while it has a detrimental impacton their learning. We thus prefer to analyze cognitive achievement of childrenrather than their education level.
Labor is generally expected to be detrimental to learning since it reducestime available for resting, attending school or studying at home. Two points
1Source: Unicef, wwww.unicef.org/infobycountry, following ILO definition of child labor.215% of children combine both activities while 14% have none3Children below 12 should not work, even if it is not harmful, while children older than 13
may be allowed to under the conditions stipulated in the text.4Some authors also estimate the effect of having worked as a child on earnings in their
adult’s life (Emerson and Souza, 2008; Beegle et al., 2004).
2

need to be made readily: first, we will not address the question of how workdisrupts schooling, meaning we will only measure the impact of work on learningfor a given number of years of education. The only disruption that will be takeninto account is the one on attendance for a child enrolled in school since it maywell affect how much s/he gains from school. Second, this effect is potentiallyfairly small: in most cases, classes in primary school only last for half a day,leaving room for working during the other half. In addition, high agriculturalseason takes place during school holidays. It seems to be quite rare that childrenmiss school in order to work. Still, exhaustion and impossibility to do homeworkcould significantly slow down learning. On the other hand, working increasesthe available income and allows to pay for some expenses associated to educa-tion: transportation, lunches outside home, books or even tutorials. Moreover,working along with parents (since it is the prevalent working environment forchildren in Africa) may be an opportunity to learn from them. The sign ofthe effect of work on learning is thus ambiguous and needs to be empiricallyestimated.
To my knowledge, the only paper that estimates the impact of child labor onlearning achievement measured by tests is Heady (2003) on Ghana.5 He findsthat work has a substantial negative effect on learning achievement in readingand mathematics if it is performed outside the home (even when controlling foreducation level of the children). Several drawbacks need to be considered thoughin this paper: first, it only uses current information of children’s time allocationwhile the process of human capital accumulation is a long-term one. Currentstatus of the child regarding school and work is probably a poor proxy of thepast time allocation decisions especially since these choices depend highly on age.Second, human capital investments are likely to be affected by characteristicssuch as cognitive ability, preferences, school quality, working environment whichmay also determine learning achievement. While Heady attempts to control forthese characteristics with a Raven’s matrix, the strategy has some limitations:Raven’s matrices may not only capture innate cognitive ability but also beaffected by education as other tests scores have demonstrated to be (see, forexample, Hansen et al. (2004)). This is even the more so that these tests resultshave been collected at the same time than the other outcomes. In addition,using this variable in a control strategy assumes there is no measurement errorin abilities. Lastly, while it is argued to capture heterogeneity in innate abilities,other environmental factors such as school quality or labor market organizationsare unlikely to be captured by such a variable and, as such, is unobservedheterogeneity that could affect both investments decisions and results.
As a consequence, our paper tries to investigate a bit further the relation-ship between participation to economic activities and learning achievement. Toaddress the previously mentioned caveats, we use the EBMS data which pro-
5Other papers that incidentally address the question by using other indica-tors of achievement include Patrinos and Psacharopoulos (1995) (grade repetition) andAkabayashi and Psacharopoulos (1999) (parental assessment of the ability of the child toread and do written calculations). Both of them find virtually no effect of labor on cognitiveachievement.
3

vides tests results for a sample of Senegalese teenagers along with retrospectiveinformation on work and schooling. The number of years spent working and atschool should be more relevant for explaining children’s learning achievementthan their current status. In order to take into account the endogeneity issuefor time allocation decisions, we combine the following strategies: we introducecommunities’ fixed effects to control for heterogeneity such as differences inschool quality and working opportunities on the one hand and we control forresults obtained to tests taken at the entry of primary school on the other hand.These tests can be argued to capture true innate ability given the early age atwhich they are taken. Nevertheless, they still could be spoilt by measurementerror. Availability of other tests taken by the same pupils later in the yearallows us to deal with this issue and our strategy provides reliable estimates ofcausal impact of work on learning achievement.
We find that work is not detrimental to learning achievement per se: oncecontrolling for education level, the effect of one additional year of working issignificantly positive for 3 tests out of 4. Working more than 17 hours a weekthough depletes accumulation of human capital. On a more methodological as-pect, controlling for selection bias through measures of ability and communitiesfixed effects proves important and indicates that the naive estimate of the effectof work is downwardly biased, as expected.
Section 2 describes data and provides some statistics on the relationshipsbetween working and schooling decisions. Section 3 presents the empirical modeland section 4 offers the results.
2 Data description and time allocation of chil-dren in Senegal
2.1 Ebms and Pasec datasets
The data used in this paper comes from an original survey entitled ´Educationet Bien-Etre des Menages au Senegal (Ebms)6 conducted between April andJune 2003 and to which the author of this paper took part. This survey coversa national sample of 1800 households. It provides information on householdcomposition, household asset ownership and housing characteristics. At theindividual level, information was collected on education, health, employmentstatus and activities of every household member. We thus know the detail ofchildren’s schooling trajectories and their working starting date.
The sample includes households of children who participated in an earliersurvey conducted by the PASEC.7 These children, who were roughly aged be-tween 7 and 10 in 1995, were tested every year as long as they were still enrolled.
6This survey was designed by a team composed of Peter Glick, David Sahn, and LeopoldSarr (Cornell University, USA), and Christelle Dumas and Sylvie Lambert (LEA-INRA,
France), and implemented in association with the Centre de Recherche en Economie Ap-pliquee (Dakar, Senegal).
7Programme d’analyse des systemes educatifs des pays membres de la CONFEMEN.
4
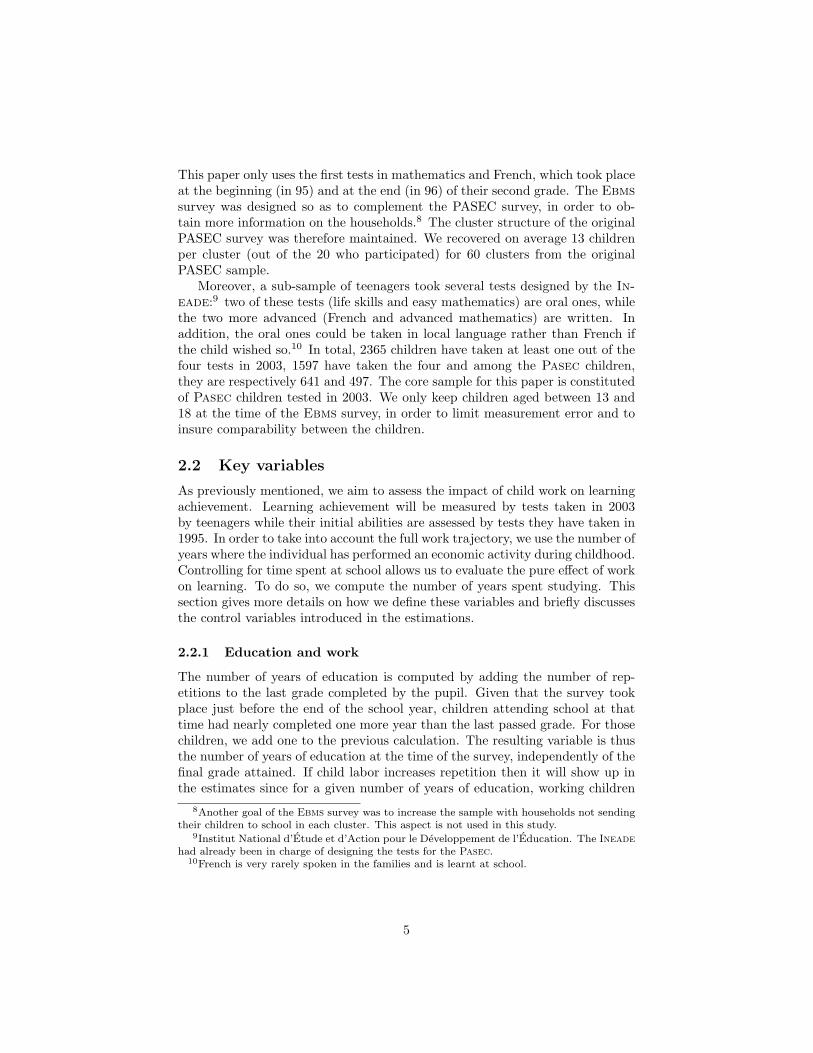
This paper only uses the first tests in mathematics and French, which took placeat the beginning (in 95) and at the end (in 96) of their second grade. The Ebmssurvey was designed so as to complement the PASEC survey, in order to ob-tain more information on the households.8 The cluster structure of the originalPASEC survey was therefore maintained. We recovered on average 13 childrenper cluster (out of the 20 who participated) for 60 clusters from the originalPASEC sample.
Moreover, a sub-sample of teenagers took several tests designed by the In-eade:9 two of these tests (life skills and easy mathematics) are oral ones, whilethe two more advanced (French and advanced mathematics) are written. Inaddition, the oral ones could be taken in local language rather than French ifthe child wished so.10 In total, 2365 children have taken at least one out of thefour tests in 2003, 1597 have taken the four and among the Pasec children,they are respectively 641 and 497. The core sample for this paper is constitutedof Pasec children tested in 2003. We only keep children aged between 13 and18 at the time of the Ebms survey, in order to limit measurement error and toinsure comparability between the children.
2.2 Key variables
As previously mentioned, we aim to assess the impact of child work on learningachievement. Learning achievement will be measured by tests taken in 2003by teenagers while their initial abilities are assessed by tests they have taken in1995. In order to take into account the full work trajectory, we use the number ofyears where the individual has performed an economic activity during childhood.Controlling for time spent at school allows us to evaluate the pure effect of workon learning. To do so, we compute the number of years spent studying. Thissection gives more details on how we define these variables and briefly discussesthe control variables introduced in the estimations.
2.2.1 Education and work
The number of years of education is computed by adding the number of rep-etitions to the last grade completed by the pupil. Given that the survey tookplace just before the end of the school year, children attending school at thattime had nearly completed one more year than the last passed grade. For thosechildren, we add one to the previous calculation. The resulting variable is thusthe number of years of education at the time of the survey, independently of thefinal grade attained. If child labor increases repetition then it will show up inthe estimates since for a given number of years of education, working children
8Another goal of the Ebms survey was to increase the sample with households not sendingtheir children to school in each cluster. This aspect is not used in this study.
9Institut National d’Etude et d’Action pour le Developpement de l’Education. The Ineadehad already been in charge of designing the tests for the Pasec.
10French is very rarely spoken in the families and is learnt at school.
5

would presumably have attained lower grades than the ones who do not workand as such would have lower outcomes measured by tests in 2003.
In the data set, we do know the age when the child started working but wedo not know if s/he has been working continually since. What we call “numberof years of work” is actually the number of years since the child started working.Consistently with the ILO definition of work, the study only takes into accountparticipation to economic activities. The rationale for focusing on work durationis that even if the child interrupted his/her activity, it should still be a goodproxy for past time allocations: children who already have performed an activityare more likely to do it again. Actually, only 3.24% of children who have everworked have not been performing any economic activity during the year of thesurvey. In addition, working very early in life may be particularly detrimentaland this should be captured when considering age when started working. Inaddition of age, we have some information on the working conditions whenthe child started, namely hours of work and employment status (employed,independent or familial worker). In the last section, we enquire into whetherthese various measures of work intensity matter for learning.
Participation to domestic work though could also have detrimental effects onlearning since it is time consuming. In addition, it is rarely seen as income gen-erating not allowing the child to acquire specific human capital unlike economicactivities. The lack of retrospective information in Ebms for the participationof children in housekeeping prevents us from studying such a mechanism, andin any case it would have been very prone to measurement error. and would inany case be very prone to measurement error. Some information on the childand his/her household was actually collected by the Pasec through an auto-administered survey but given the early age of the children and the fact that thequestions were in French, the answers are obviously spoilt with measurementerror. Among other things, children had to stipulate what domestic chores theywere performing. We use this information for robustness checks but do not en-deavor to estimate the impact of participation in housekeeping on subsequentlearning outcomes, and will only provide limited evidence on the question.
2.2.2 Tests
Tests in 1995 (and subsequent years) and then in 2003 have all been designedby the Ineade. In 1995, there were only two written tests, one of mathematics,the second of French; in 2003, four tests are available: easy and advanced math-ematics, French and life skills. They aim to assess cognitive acquisition due toschool. As such, they are focused on evaluation of schooling outcomes such asreading, vocabulary, conjugation for French tests and additions, subtractions,reading time, measures assessments, small problems for mathematics. Life skillstest is somewhat different: it aims to assess knowledge of the child on differentcommon topics, with a focus on hygiene (water purification, diarrhea, malaria,etc.). For most parts, tests take a multiple-choice questions format. Childrenwho do not answer to some questions but take the test are granted the pointscorresponding to a random answer (e.g., if they have to choose between three
6

answers, they get one-third of the points). This is equivalent to the standardprocedure of giving negative points to the ones who provided a wrong answer.Tests are marked from 0 to 100. For results measured in 2003, we normalizescores in order to interpret and compare coefficients: we divide the result bythe standard-error of the score on the population.11
All the Pasec children were attending the second grade of primary schoolin 1995-96. Since school is compulsory from age 7, they all should have beenaged 8 or 9 at that time. There was in fact considerable variance. First, a childcould have started school before (after) the legal age and thus be younger (resp.older). Second, he may already have repeated the first or second grade and thusbe older. Children may perform differently at tests in 1995-96 depending ontheir age or, to put it differently, assessment of their innate abilities must takeinto account this heterogeneity. For convenience, we use age in 2003 and giventhat it is a linear function of age in 95, the estimate captures the age differenceswhen in second grade. Older children in 1995 have in fact lower abilities fora given test level and as such are likely to perform worse at tests taken whenteenagers. We thus do expect a negative correlation between age and outcomesin 2003.
2.3 Sample and attrition
As previously mentioned, we wish to use observations for which both tests takenin 2003 and tests taken in 1995 are available. This raises the question of attritionsince not all Pasec children were tested again. Possible reasons for not havingbeen re-interviewed are the following:
• child’s household has not been found, generally because it has moved;
• the household has been found back but the child has not been tested. Thiscould either be due to the fact that the child does not live anymore in thehousehold or that he was not available for the tests.12
Among the 1054 Pasec children who have taken the two entry tests and livingin the 60 areas surveyed in the Ebms13,
• 846 (80%) belonged to a reinterviewed household;
• among which 594 (70% of the 846) have been tested.
In the end, only 56% of the original sample is tested again. This highattrition rate needs to be addressed. The Pasec survey includes a small ques-tionnaire which helps for describing the different attrition mechanisms since it
11Moments for the normalized test scores are reported in Table 9.12Given that we have adopted a fairly loose definition for the household and specifically on
whether a child belongs to it in order to increase the registered information on children awayfrom the household a large part of the year, we do not address this distinction.
131130 of them have taken at least one the two entry tests (3 areas have only started theirtests in 1996).
7

is available for the full sample.14 We first explain whether a household has beenfound back and then, for children whose household has been identified, whetherthey have taken at least one test. Results are provided in Table 15 in appendix.
The main results are the following: living in a rural area, with one’s motheror grand-parents and in a poor household increase the likelihood of findingthe household. When the child has been doing some agricultural work, pre-sumably when the household owned land, the household is more likely to bere-interviewed. For the matter of individual attrition in a re-interviewed house-hold, results are the following: children from wealthier households or those whohave not repeated their second grade are more likely to be successfully tracked.This may be due to the fact that some households choose to send their succeed-ing children away to attend lower secondary school. Scores in second grade andchildren’s activities though have no effect on attrition.
Given that we suspect this first survey to be very imprecise, we do not en-deavor to take selection into account in our estimation. The strategy offeredhereafter, namely controlling for usually unobserved characteristics, will clearlymitigate this issue but the conservative claim is that the results are only repre-sentative of the sample of children who have stayed in their household, whichitself has not moved.
2.4 Children’s education and labor in Ebms data
This section briefly describes the distribution of the previous variables for thesample of interest. Among Pasec children15, aged 13 to 18, half of them havemore than 9 years of education at the time of the survey (recall that it is timespent enrolled at school: half of children have only completed grade 6) and theaverage number of years of education is 8. The average number of worked years is2.46, while the median is 0. Consistently with the possible combination of bothactivities, the correlation between the two variables is -0.14 and is statisticallysignificant at the 5% level.
Two measures of work intensity are available: number of hours when thechild started working and the average between this and the work intensity atthe time of the survey. It turns out that the correlation between the two isquite high (0.9) and that their means reflect the fact that work intensity tendto increase with age (see Table 1). In the last part of the paper, we thus onlyuse the number of hours when the child started working. The average numberof hours at the beginning (0 if the child has never worked) is 5.9 hours per weekbut a working child performs on average 14.2 hours per week. Half of workingchildren were working less than 10 hours per week though when they startedtheir activity. These figures probably hide considerable discrepancies betweendifferent times of the year due to the agricultural cycle.
14We are reluctant to make an intensive use of these variables since they are reported byyoung children and are thus very prone to measurement error.
15We actually compute the statistics only for children who have effectively taken the entrytests.
8

Table 1: Annualized hours of work per week
Whole sample Working ChildrenHours at beginning Average 5.9 14.2
Median 0 9.7# Obs. 552 230
Average hours Average 6.4 15.0Median 0 8.7# Obs. 538 230
Note: Sample constituted of Pasec children between 13 and 18 years old, who have taken
at leats one test in 95 and the oral mathematics test.
Table 2: Employment status of children when they started their activity
Urban Rural TotalEmployed 17.9% 2.6% 6.2%Independant 4.8% 4.4% 4.5%Familial worker 40.5% 88.1% 76.8%Apprentice 36.9% 4.8% 12.5%
# Obs. 84 269 353
On the matter of the type of work, Table 2 reports the employment statusof children (again when they started working), by type of area. Family workeris by far the most important category and is more prevalent in rural areas thanin urban ones. Employed children and apprentices are on the contrary mainlyfound in urban zones. We should be cautious though when using this variablebecause of the low number of observations for each category.
Let us now turn onto the association between work and low results. Wecompare means between children who have worked and those who have not.Results are consigned in Table 3.16 The results are consistent throughout thetests offered to the children. Those who have worked during their childhood havesystematically lower results when they are teenagers; the difference varies from3 to 6 points out of 100 and is always significant at the 10% level. This conformsto the general view that work is detrimental to human capital accumulation. Onthe right panel of the Table, we run the same exercise by comparing children
16For consistency purposes, we provide the results for the same sample. With the largersample of children who have taken the tests in 2003, we get very similar results but the meandifferences are systematically significant at the 1% level.
9

Table 3: Past activities and mean test scores in 2003
Less than 8 yearsTest No work Some work p-value 8 years of edu or more p-valueLife skills 66.81
(330)59.96(284)
0.00 58.32(212)
66.09(411)
0.00
Oral maths 62.42(327)
59.38(271)
0.08 54.87(205)
64.00(401)
0.00
Written maths 77.62(294)
73.86(202)
0.04 64.03(114)
79.25(366)
0.00
Written French 80.45(292)
77.07(205)
0.05 69.33(116)
81.71(385)
0.00
Note: Sample constituted of Pasec children between 13 and 18 years old, who have taken at
least one test in 95 and the test of interest; the number of observations for each mean is in
parenthesis below the figure. ”No work” means that the child declares no work during his/her
childhood. The p-values give the statistical significance when testing the difference between
no work and some work for the third column and between children who have attended school
for more than 8 years and those who have not for the sixth one.
who have attended school for 5 years or more and children who failed to do so;as expected, more educated children get better scores and the difference is quiteimportant (around 8 points). The next section explains why this raw correlationmay not be very informative on the real impact of child work on his/her cognitiveachievement and how we can proceed to exhibit such an effect.
3 Estimation of a human capital production func-tion
The aim of the paper is to assess the impact of work on human capital accumu-lation. This can be formalized in the following way:
Tic = F (Wic, Sic, δc, Xic, uic) (1)
where Tic is a measure of cognitive achievement for child i living in community c,Wic and Sic respectively number of years spent working and enrolled in school,δc quality of education and working opportunities in community c, Xic personalcharacteristics such as gender, age and socioeconomic background of child iand u that may reflect any unobservable determinant of results (preferences,innate abilities) or measurement error. We concentrate on the estimation of alinear relationship between cognitive outcomes and child’s investments in humancapital since specification tests do not detect any nonlinear form of relationship.Sic is expected to have a positive sign, while sign for Wic has to be determinedempirically as discussed in introduction.
10

3.1 Issues to tackle in the estimation
The crucial point of our paper is to note that time allocation decisions (betweenwork, schooling and leisure) are likely to be endogenous in equation (1). Thiscould either come from the presence in uic of specific abilities of the child orfrom failure to control for all the relevant characteristics of the environment.
As for specific capacities of the child, more able pupils may spend more timein school/devote more energy and thus get better scores; the opposite may hap-pen if schooling time and innate abilities are somewhat substitutes rather thancomplements in the human capital production function. In the same vein, chil-dren with lower endowments for education may also devote more time to work inorder to loosen budget constraints and permit siblings’ schooling. The outcomeof the allocation decision depends on human capital production function andon parents’ preferences for equity as discussed by Becker and Tomes (1976) butin any case, we do expect to see a correlation between time allocation decisionsand unobservable heterogeneity such as innate abilities.
Moreover, living environment of the children affect both their choices andtheir cognitive achievements. Indeed, one unobserved factor in the human cap-ital production function is the effort made by the pupil to learn. This effort issurely correlated with what s/he expects to gain from learning. Good schools,high returns to education in the labor market will affect both how much edu-cation they demand and how much they strive to benefit from it. On labor’sside, places with working opportunities for the children might be places withlow returns to education. This is notably the case of agricultural areas, wheremost of child labor is found and where skilled jobs are rare. If this were to betrue, we would expect to find a downward bias when estimating the impact oflabor on learning.
Lastly, some household’s characteristics may both determine children’s timeallocation and have an effect on their cognitive achievement. Parental educa-tion , productive assets detention or gender, for instance, are likely to changehouseholds’ expectations of returns to education and, as such, may affect theeffort devoted to learning.
For all these reasons, Wic and Sic are likely to be correlated with uic. Theaim of the paper is thus to provide an estimation of the effect of one additionalyear of work on cognitive achievement of children, net of spurious correlations.
3.2 Empirical strategy for identification
The empirical strategy we propose is a control one. This is motivated by thefact that standard options such as finding appropriate instruments or relying onnatural experiments are very difficult to implement in this setting. A convincinginstrument could be a ban of child labor or a change in compulsory schoolinglaws but none of it exists in Senegal nor could be enforced in most developingcountries. Moreover, using a control strategy will allow us to try diverse speci-fications, which would not be the case if only a reduced set of instruments wasto be found.
11

Let us now detail our identification strategy. It is quite obvious from theprevious discussion that two sources of endogeneity coexist. The first one liesin unobserved environmental variables and common to all children of the areawhile the second lies in choices specific to children, either due to their abilitiesor to their (or their parents’) preferences towards education.
3.2.1 Communities fixed effect
Since households are clustered in 60 communities, we are in the position to con-trol for environment differences by introducing communities fixed effects. Thesefixed effects will capture school supply and its quality, but also working oppor-tunities and social norms prevailing in the area. Fixed effects are particularlyuseful for the last two aspects since social norms and expectations for returnsto education and work are very difficult to observe.
3.2.2 Results to tests taken at the entry of primary school
Controlling for heterogeneity in abilities of the individuals is a much more dif-ficult task. Since it is a recurrent issue in the returns to education literature,there is already a fair amount of contributions to the question (Griliches, 1977).Results to tests taken at the entry of primary school can be considered as prox-ies for innate abilities. They are measured after only one year of schooling andprobably reflect intrinsic capacities of the children as well as the learning envi-ronment in which they have lived when infant. Controlling for innate abilitiesof the children this way should leave in the residual term only measurement er-ror and other ”safe” unobserved determinants. However, failure to capture thewhole heterogeneity (also called ”measurement error” in the indicator) wouldlead to biased estimates, as shown by Hansen et al. (2004). We thus chose toexploit the repetition of tests within the same year in order to implement themultiple indicator solution offered in Wooldridge (2002). If two indicators of thesame unobserved variable (here, innate ability) are available, we can combineboth of them to get an estimate of the true innate ability indicator, even if bothare measured with error. This is done by instrumenting one of the indicators bythe other and allows us to consider that we control for the true value of innateabilities. More specifically, if abil stands for the true innate abilities, we assumethat:
T early 1 = δ0 + δ1abil + a1
T early 2 = ρ0 + ρ1abil + a2
where T early 1 and T early 2 are two proxies for abil and a1 uncorrelated withexplanative variables of the interest regression, δ1 6= 0, Cov(abil, a1) = 0 and thesame for the second equation. In addition, a crucial assumption is the absenceof common measurement error in the two indicators or, to put it differently,that the correlation between the two indicators arises only from their commondependence on the true indicator (Cov(a1, a2) = 0).
12

To sum up, we wish to use tests taken at the entry of primary school tocontrol for innate abilities of the children when explaining cognitive level in2003, but also exploit the fact that they are several to take into account themeasurement error imbedded in each of them. We actually have two options forimplementing this approach. Two tests are available for each session when thechild was enrolled in second grade of primary school: French and mathematics.We can thus either use:
• only tests taken in the same discipline, one being measured at the begin-ning and the other at the end of second grade (T 95 F and T 96 F whentrying to describe outcomes in French in 2003 for instance) or
• only tests taken at the entry (T 95 F and T 95 m) whatever the outcome.
Both strategies have their pros and cons that we detail later on.Let us start with some common considerations. All of these early tests are
very likely to capture the same information on schooling abilities at a very youngage, which can be seen as the latent variable. These tests were designed so asto evaluate the progression of children through school. Cognitive achievementis then measured by similar tests, designed by the same institute, which hadreceived instructions to produce comparable tests except that they were for ahigher level. As a consequence, the initial score as well as the final ones arefocused on the same specific abilities of the children. It is thus expected thatchildren who are faring well with the tests when they are in second grade are alsothe ones who do better later on. For this reason, the indicators can reasonablybe argued as capturing the relevant information: they may not do justice toall the dimensions of human capital but it would not be the case neither ofthe final cognitive achievement indicator. Note however that the life skills testdiffers from the other tests and that this argument may be less accurate in thiscase.
The first option consists in using only results obtained in French (both atentry and end of second grade) when we explain French outcomes in 2003 andresults obtained in maths when we explain math results in 2003. This strategyis legitimate if the relevant ability variable is specific to the discipline and wellpredicted by two successive tests in the same discipline(for life skills, given thatit is not obvious to guess which latent variable is the most likely to affect finaloutcomes, we try both). The main caveat of this approach is that the waychildren have progressed along the year may be affected by their learning effort.Another way to put it is that results measured at the end of the second gradeare more likely to be spoilt with other factors than true innate ability, as forinstance, capacity to learn and make progress, and that we do not fully control.
For these reasons, it may be worth focusing on abilities measured at theentry of second grade. In this case, our last point does not apply; unfortunately,this also implies that the tests may not capture information on abilities of thechildren to progress. This being said, the main caveat is that if we considerthat abilities for the children in terms of French and of mathematics are very
13

different and do not proxy for the same latent variable of capacities, then theapproach is not valid.
To conclude on the comparison between the methods, it is worth notingthat the data could give us some hints about what the relevant latent variablesare through correlations between indicators (a strong correlation between twoindicators reflect the fact that they tend to describe the same latent variable);unfortunately, Table 10 in appendix shows it is not the case and confirms thatthese indicators are prone to measurement error and that the multiple-indicatorsolution needs to be implemented.
Most of the criticisms (in the returns to education literature) of this tech-nique lied in the fact that tests that were used were collected at the end of theeducation span and thus could have been affected by it; in our case, tests usedas controls cannot demonstrate a reverse causality issue since they are collectedwhen the child has hardly started its education. This strategy provides esti-mates of the impact of one additional schooling or working year on cognitiveachievement for a given level of endowments. However, the latent variable ofability that we try to measure indirectly via tests is made of different compo-nents: true innate ability but also parental preferences for school versus workthat may have affected child’s cognitive achievement even with an early measurein second grade (Dumas and Lambert, 2007). We thus have to assume that themix of these ingredients does not change greatly over the school life course ofthe child and affects in the same way his/her outcomes when teenager.
3.2.3 Household’s characteristics
As we mentioned, growing environment of the child, as well as characteristicsthat may correlate with expected returns to education, can determine both timeallocation decisions and learning effort and hence cognitive achievement. Someof these differences may be captured by early test scores but there may remainsome heterogeneity. In a second stage, we thus introduce controls for parentaleducation, gender, number and composition by gender of the siblings, house-hold’s size, possession of productive assets, wealth and check whether the resultschange. This should be indicative of whether there remain some correlation be-tween u and S and W . Appendix 11 describe these variables.
3.2.4 In practice
The estimation method implied by these considerations is actually quite simple:it consists in running an IV estimation on
Tic = K0 + αWic + βSic + γXic +60∑
c=1
δc + ηT early 1ic + uic
where Tic stands for the various outcome variables (life skills, oral maths, writtenmaths and written French tests) and T early 1
ic is instrumented by T early 2ic .
14

The previous discussion suggests different options for the choice of T early 1
and T early 2, which can be freely exchanged; we sum up these options in Table4.
Table 4: Assumptions and control tests in the regressions
Assumptions Outcome test T early 1 T early 2
Option latent variable may be specific to discipline; LS, WF TFrench 95 TFrench 96
1 ability to progress taken into account LS, OM, WM Tmaths 95 Tmaths 96
Option2
maths and French tests reflect the same ability;ability to progress not taken into account LS, OM, WM, WF Tmaths 95 TFrench 95
Note: LS stands for life skills, OM for oral maths, WM for written maths and WF for written
French.
Depending on the implemented strategy, we need for each observation thetests results obtained in 2003 and some scores in mathematics and French ob-tained at the beginning and at the end of school year 1995-1996. In appendix,the reader will find the number of available observations for each test (Table13) and descriptive statistics of the outcomes (tests results in 2003) for varioussubsamples (Table 14).
The lower number of observations for written tests is due to the fact that chil-dren needed to be able to write in order to take that test. Given that we controlfor unobserved abilities, selection bias should not be an issue. Moreover, Table14 clearly shows that restriction to children having taken the tests at schoolentry is unlikely to bias the sample since they have fairly similar outcomes.
4 Results
4.1 Impact of time devoted to work and education on cog-nitive achievement
We discuss in detail the results based on a range of specifications, going fromOLS to the full model (communities fixed effects and early scores instrumented).Tables 5 and 6 only report estimates of interest, namely effect of one additionalyear of work/school respectively. For sake of simplicity, option 1 has beenretained for discussing the detail and results for option 2 are only delivered inthe last columns for comparison.
We first discuss the estimated impact of child labor on cognitive achievement(Table 5). It appears at first glance that coefficients are only negative for lifeskills, but never statistically significant in the final specification. Estimates ofthe impact of child labor are positive for mathematics results, be they basic or
15

Table 5: Estimated impact of child labor
Scores in 2003 1 2 3 4 5 6 7Life skills -0.035** -0.034** -0.012 -0.011 -0.008 0.001 -0.008
(0.013) (0.013) (0.016) (0.016) (0.017) (0.018) (0.017)Oral maths -0.001 0.000 0.033+ 0.034* 0.032+ 0.044* 0.035+
(0.013) (0.013) (0.017) (0.017) (0.017) (0.019) (0.018)Written maths 0.009 0.011 0.034* 0.032+ 0.029 0.033+ 0.033+
(0.014) (0.014) (0.017) (0.017) (0.018) (0.019) (0.018)Written French 0.011 0.014 0.036+ 0.034+ 0.026 0.032 0.032+
(0.015) (0.015) (0.019) (0.019) (0.017) (0.021) (0.019)
Fixed effects no no yes yes no yes yesScores in 95 no yes no yesScores in 95instrumented by 96 yes yes
Math scores in 95 instrumentedby French score in 95 yes
Note: Scores are normalized by their standard errors thus estimates are the impact of one
additional year of labor on scores in 2003 measured in standard errors. See Table 13 for the
number of observations. Control tests for specifications (2) and (4) to (6) are French in 95 for
written French and mathematics for all the other ones. **, * and + mean respectively that the
coefficient is significantly different from 0 at the 1%, 5% and 10% level.
advanced. We thus have little empirical support for a detrimental impact ofchild labor on learning, controlling for time spent enrolled in school. Second, ifwe compare specifications (1) and (3), we find that controlling for village fixedeffects leads to a higher positive impact of child labor on knowledge, or, toput it differently, that controlling for village fixed effects corrects for a negativebias in the estimates of child labor. This is consistent with the argument thatareas with child labor are also the ones where individuals invest less in learning.Third, when comparing specification (1) and (2), we observe that controlling forabilities has no effect on the estimates. Fourth, introducing abilities when weare controlling for fixed effects (switching from estimation (3) to (4)) has alsolittle effect. However, for reasons detailed before, this estimation may still bebiased. Instrumentation of scores (from estimation (2) to (5) or (4) to (6)) tendto increase the estimated effect of child labor on tests, showing that in mostof the cases not taking into account the measurement error imbedded in testswill bias the results. This is consistent with the fact that less skilled childrenare more often put to economic participation than the others. This being said,the change in the estimates is rarely significant at the 5% level. The mostconvincing estimation is thus the one provided in column (6) where we control
16

Table 6: Estimated impact of school attendance
Scores in 2003 1 2 3 4 5 6 7Life skills 0.124** 0.118** 0.114** 0.106** 0.077** 0.071** 0.101**
(0.020) (0.020) (0.019) (0.019) (0.028) (0.024) (0.020)Oral maths 0.122** 0.119** 0.138** 0.131** 0.075** 0.107** 0.122**
(0.020) (0.020) (0.020) (0.020) (0.028) (0.024) (0.022)Written maths 0.200** 0.196** 0.219** 0.216** 0.180** 0.207** 0.212**
(0.025) (0.025) (0.024) (0.024) (0.033) (0.028) (0.025)Written French 0.180** 0.173** 0.177** 0.171** 0.140** 0.137** 0.162**
(0.027) (0.027) (0.026) (0.026) (0.032) (0.032) (0.027)
Fixed effects no no yes yes no yes yesScores in 95 no yes no yesScores in 95instrumented by 96 yes yes
Math scores in 95 instrumentedby French score in 95 yes
Note: Scores are normalized by their standard errors thus estimates are the impact of one
additional year of labor on scores in 2003 measured in standard errors. See Table 13 for the
number of observations. Control tests for specifications (2) and (4) to (6) are French in 95 for
written French and mathematics for all the other ones. **, * and + mean respectively that the
coefficient is significantly different from 0 at the 1%, 5% and 10% level.
for communities fixed effects and instrument the score: we find that child laborhas no impact on life skills test and a positive impact on maths, larger on basicskills than the advanced ones. The estimated effect on written French is of thesame order of magnitude than for the written maths but fails to be significant,even at the 10% level. Specification (7), where the second option is implemented,confirms the results and identifies a positive effect of time devoted to labor oncognitive achievement that is significant at the 10% level for all tests except theone on life skills.
Table 6 indicates that an additional year of schooling leads to a significantincrease in cognitive achievement: the estimated impact varies roughly betweenone-fifteenth and one-fifth of a standard error and is thus higher than the impactof one year spent working. Controlling for scores leads to small variations inthe estimated effect for most of the tests. If we use the instrumented scores, wethen get lower estimates. The biases generated by individual heterogeneity werethus positive: this seems to show that parents do not compensate for unequalcapacities of their offspring. Controlling for village fixed effects does not correctfor biases of the same sign depending on the tests. Again, specification (7) isin keeping with that has been found with the first option. The estimated effect
17

of education is much smaller on life skills than on the other topics, while thewritten and thus advanced tests are more improved by increased education thanis oral maths, as could be expected.
Comparison of the estimated impacts between the different tests draws thefollowing picture: knowledge on life skills is likely to be gained out of schoolbut is not improved through work, knowledge on oral maths is gained throughschool but can be acquired through participation to economic activities (one yearspent working allows the children to learn as much as half what they would havelearned from school on that topic), while the discrepancy between what can belearnt at school and from work is higher for advanced (and written) tests. Bothtests in mathematics being quite comparable, except for their modalities (oralvs. written), it is quite likely that the main difference between the estimatescomes from the fact that less educated children are not able to read and write.
4.2 Controlling for social background variables
If the scores are insufficient to control for heterogeneity in abilities or otherfactors determining both human capital investments and results, then addingsome social background variables may alter the results if these variables are ableto pick up some heterogeneity. We now try to introduce such additional controls.It is also interesting per se since it will provide us with some estimations of theeffect of social background on learning.
We thus run the same specification with the following controls: age (as previ-ously), gender, father’s and mother’s education, wealth, detention of productiveassets, household’s size and whether the child has an older brother and an oldersister. Results are given in Table 7.
Estimates for the effect of the number of years of schooling are very similarto what we found before without control variables; results change a bit forthe effect of labor but not systematically in the same way. The most notablediscrepancy between this set of result and the previous one is for the impact ofchild labor on written French but in this case, we do not reject the hypothesisthat the coefficients of the new variables are jointly equal to zero. This isevidence for the fact that we ought to prefer the constrained model, which ismore precisely estimated. Father’s educational level and wealth tend to improvelearning. Otherwise, the control variables are rarely significant, even at the10% level, attesting that control for abilities also capture differences in socialbackground. The table also shows that, as expected, the point estimate for ageis negative.
4.3 Taking into account domestic work
The identification strategy we offer allows children’s time allocation and knowl-edge acquisition to be correlated with abilities, communities’ characteristics andsocial background variables. It does not prevent though from biases emergingfrom participation to domestic work. If children who perform economic work are
18
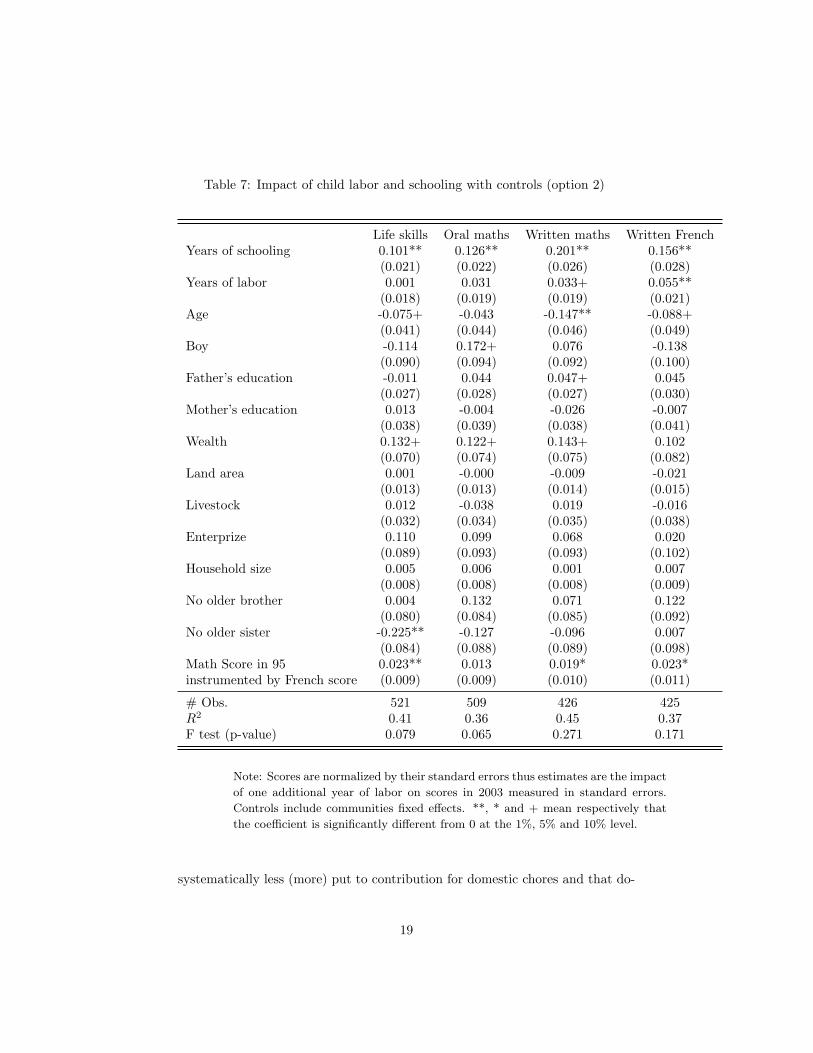
Table 7: Impact of child labor and schooling with controls (option 2)
Life skills Oral maths Written maths Written FrenchYears of schooling 0.101** 0.126** 0.201** 0.156**
(0.021) (0.022) (0.026) (0.028)Years of labor 0.001 0.031 0.033+ 0.055**
(0.018) (0.019) (0.019) (0.021)Age -0.075+ -0.043 -0.147** -0.088+
(0.041) (0.044) (0.046) (0.049)Boy -0.114 0.172+ 0.076 -0.138
(0.090) (0.094) (0.092) (0.100)Father’s education -0.011 0.044 0.047+ 0.045
(0.027) (0.028) (0.027) (0.030)Mother’s education 0.013 -0.004 -0.026 -0.007
(0.038) (0.039) (0.038) (0.041)Wealth 0.132+ 0.122+ 0.143+ 0.102
(0.070) (0.074) (0.075) (0.082)Land area 0.001 -0.000 -0.009 -0.021
(0.013) (0.013) (0.014) (0.015)Livestock 0.012 -0.038 0.019 -0.016
(0.032) (0.034) (0.035) (0.038)Enterprize 0.110 0.099 0.068 0.020
(0.089) (0.093) (0.093) (0.102)Household size 0.005 0.006 0.001 0.007
(0.008) (0.008) (0.008) (0.009)No older brother 0.004 0.132 0.071 0.122
(0.080) (0.084) (0.085) (0.092)No older sister -0.225** -0.127 -0.096 0.007
(0.084) (0.088) (0.089) (0.098)Math Score in 95 0.023** 0.013 0.019* 0.023*instrumented by French score (0.009) (0.009) (0.010) (0.011)
# Obs. 521 509 426 425R2 0.41 0.36 0.45 0.37F test (p-value) 0.079 0.065 0.271 0.171
Note: Scores are normalized by their standard errors thus estimates are the impact
of one additional year of labor on scores in 2003 measured in standard errors.
Controls include communities fixed effects. **, * and + mean respectively that
the coefficient is significantly different from 0 at the 1%, 5% and 10% level.
systematically less (more) put to contribution for domestic chores and that do-
19
ing some housekeeping prevents from fully benefiting of the received education,then coefficient for child labor will be upwardly (resp. downwardly) biased. Do-mestic chores for the children include fetching wood and water, cooking, laundryand can take long hours. We thus ought not to assume that its effect is nil.
In order to assess this issue, we rely on the declaration of activities madeby the children in 1995. We thus create a variable of participation to domestictasks if the child declares doing at least one of the following activities: cook-ing, laundry, dishwashing, cleaning. Fetching wood and water is unfortunatelyexcluded from the list but this activity is expected to be correlated with theothers. Correlation between number of years spent working and participationto domestic activity is as high as -0.25: children who carry out one of the ac-tivities are less likely to be put to contribution for the other. In this case andif housekeeping is detrimental to learning then estimate of the impact of childlabor is upwardly biased, which could explain our findings.
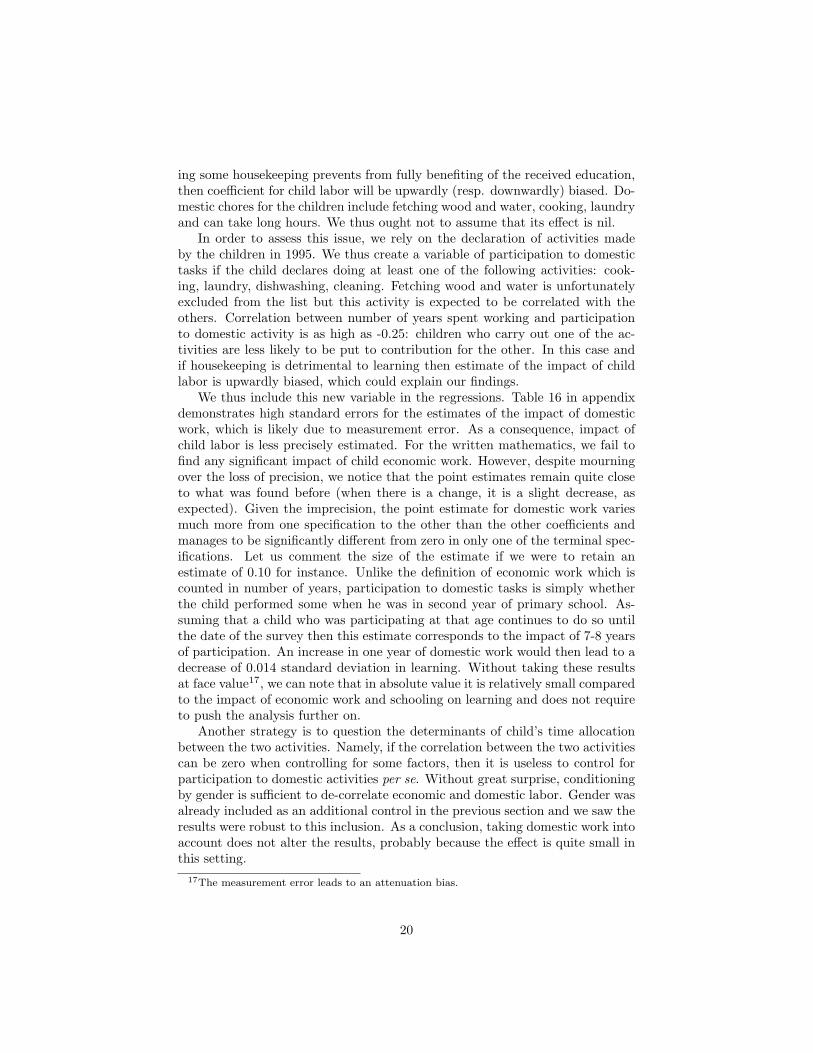
We thus include this new variable in the regressions. Table 16 in appendixdemonstrates high standard errors for the estimates of the impact of domesticwork, which is likely due to measurement error. As a consequence, impact ofchild labor is less precisely estimated. For the written mathematics, we fail tofind any significant impact of child economic work. However, despite mourningover the loss of precision, we notice that the point estimates remain quite closeto what was found before (when there is a change, it is a slight decrease, asexpected). Given the imprecision, the point estimate for domestic work variesmuch more from one specification to the other than the other coefficients andmanages to be significantly different from zero in only one of the terminal spec-ifications. Let us comment the size of the estimate if we were to retain anestimate of 0.10 for instance. Unlike the definition of economic work which iscounted in number of years, participation to domestic tasks is simply whetherthe child performed some when he was in second year of primary school. As-suming that a child who was participating at that age continues to do so untilthe date of the survey then this estimate corresponds to the impact of 7-8 yearsof participation. An increase in one year of domestic work would then lead to adecrease of 0.014 standard deviation in learning. Without taking these resultsat face value17, we can note that in absolute value it is relatively small comparedto the impact of economic work and schooling on learning and does not requireto push the analysis further on.
Another strategy is to question the determinants of child’s time allocationbetween the two activities. Namely, if the correlation between the two activitiescan be zero when controlling for some factors, then it is useless to control forparticipation to domestic activities per se. Without great surprise, conditioningby gender is sufficient to de-correlate economic and domestic labor. Gender wasalready included as an additional control in the previous section and we saw theresults were robust to this inclusion. As a conclusion, taking domestic work intoaccount does not alter the results, probably because the effect is quite small inthis setting.
17The measurement error leads to an attenuation bias.
20

4.4 Summary
The different strategies find very similar results (different options for score con-trols, control for other characteristics and control for domestic work). Whencontrolling for the time devoted to education, having worked during childhooddoes not hamper learning but the benefit it provides is quite small. This littlegain could arise from increased resources due to the participation of the childto economic activities or from learning due to a higher parents’ frequentation.By comparison, the effect of work is at best 1/3 the one for schooling and it isclear that if time allocated to work is taken on schooling time (meaning feweryears of education), work implies a lower cognitive achievement at the end ofthe day.
4.5 Including intensity at work and type of occupation
So far, we have implicitly assumed that all years of work were comparable;it is indeed not the case if some children perform economic activities only inevening or in the week-end while others do it more extensively. It is quitelikely that the small benefit of work we have identified could vanish if work isperformed during long spells. To put it differently, the impact of work could beheterogenous among workers depending on the intensity of their activity. Theeffect α of number of years spent working is decomposed as:
α = α0 + αI · Intensity.
This implies to re-estimate the model with intensity times number of years spentworking as an additional variable:
Tic = α0Wic + αIWic · Intensityic + βSic + γXic +∑
c
δc + uic.
The control strategy is particularly useful at this stage since we just have tointroduce this new variable in one of the agreed specifications. Given the previ-ous results, we expect α0 to be positive and we presume αI may be negative.18
As already said, we consider the number of hours spent working when the childstarted as a proxy for the intensity of work during childhood. The intensitymeasure is given in number of hours per week in order to be interpretable. Thisbeing said, this measure is likely to be spoilt with measurement errors and itsestimate might be biased towards zero. For the sake of simplicity, we just pro-vide the results when using the second strategy (as in column 7 of Table 5),given that the previous results were almost the same and that this estimationuses the largest number of observations.
18We also tried a model where α has a quadratic term in intensity in order to allow theeffect of intensity to be positive and then negative but in this case, none of the estimates issignificantly different from zero except α0. When plotting the estimated effect of child laboras a function of its intensity, we see that it readily starts by decreasing and that the estimatedconcavity is small. We thus focus on the results when the heterogenous effect is only linear inintensity.
21

Table 8: Impact of work’s intensity on results
Scores in 2003 Life skills Oral maths Written maths Written FrenchYears of schooling 0.095** 0.118** 0.188** 0.150**
(0.021) (0.022) (0.026) (0.027)Years of labor -0.009 0.038+ 0.062** 0.055*
(0.019) (0.021) (0.022) (0.023)Intensity x Years of labor -0.000 -0.000 -0.004** -0.003+
(0.001) (0.001) (0.001) (0.001)
# obs. 530 518 434 433R2 0.38 0.31 0.43 0.38
Note: Estimations include communities fixed effects, control for maths score in
95, which is instrumented by French score in 95 and control for child’s age. **,
* and + mean respectively that the coefficient is significantly different from 0 at
the 1%, 5% and 10% level.
Table 8 shows that, despite the imperfection of the measure, we do find anegative impact of long hours spent working for advanced tests; this is not thecase for the easier test of oral mathematics. With this specification, it appearsthat the effect of an additional year of work is 0.0615− 0.0035 · Intensity in thecase of written maths and 0.0553− 0.0025 · Intensity. As a consequence, if thenumber of hours spent working remains the same throughout childhood, workhas a detrimental effect when intensity of work exceeds 17 hours a week forwritten mathematics and 22 hours a week for French tests. 75% of children ofthe sample who have an activity work actually less than 15 hours per week; formost children then, the impact of participating to economic activities remainpositive for a given amount of education. Who are the children for whom theactivity is detrimental to their learning? Among those who work more than15 hours a week, 59% of them help their family in their activity; while 13% ofthem are employees and 21% apprentices. Nevertheless, if we compare thesefigures to the ones for the population of children aged 13 to 18, it appears thatemployees and apprentices are more often among the children who work longhours while familial workers are more often among the ones who work a lowernumber of hours. As a consequence, employees and apprentices are more at riskof not fully benefitting from their education. We check this by running similarregressions but including the occupation status of the child when he started towork (Table 17) and employee shows up as highly detrimental to the learningprocess: it decreases by half a standard error results to tests.19 While targeting
19The results should be taken with extreme caution since the number of children in each ofthe status categories are low (e.g. only 20 children in the sample are employed outside of thehousehold).
22

efforts to reduce prevalence of work on the children who are employed outsideof the household could be an option to decrease the harmful consequences ofchild labor, it would clearly not guarantee that other children are safe from suchconsequences since most of children who work during long spells are employedby their own family.
23

5 Conclusion
This paper offers an estimate of the impact of working during childhood on cog-nitive achievement. For a given amount of schooling and once heterogeneity inenvironment and abilities has been control for, children who have been workingdo not perform worse but even slightly better than the others. This could beeither due to an increase in resources that allow the child to learn better if theresources are allocated to schooling inputs, or to knowledge gained from work-ing with the parents. The positive impact of work vanishes though if the childworked more than 17 hours a week on average when he started his activity.
It would be of interest to check with other data whether the effect of per-forming domestic activities is really negligible on child’s learning at school sinceit is the prevalent activity for girls in most developing countries.
24
6 Appendix
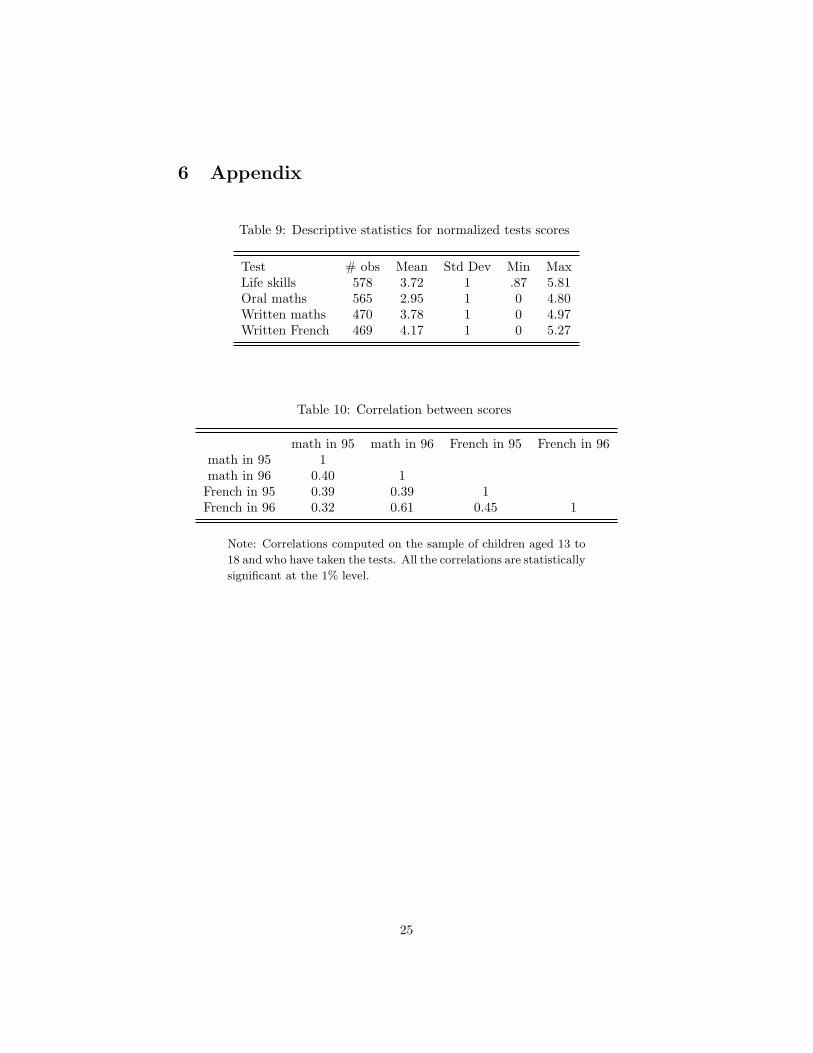
Table 9: Descriptive statistics for normalized tests scores
Test # obs Mean Std Dev Min MaxLife skills 578 3.72 1 .87 5.81Oral maths 565 2.95 1 0 4.80Written maths 470 3.78 1 0 4.97Written French 469 4.17 1 0 5.27
Table 10: Correlation between scores
math in 95 math in 96 French in 95 French in 96math in 95 1math in 96 0.40 1French in 95 0.39 0.39 1French in 96 0.32 0.61 0.45 1
Note: Correlations computed on the sample of children aged 13 to
18 and who have taken the tests. All the correlations are statistically
significant at the 1% level.
25

Table 11: Description of control variables
Name Description Min MaxAge Age of the child in 2003 13 18Boy 1 if a boy, 0 otherwise 0 1Father’s education 1, no education 1 8or 2, uncomplete primaryMother’s education 3, complete primary
... 8 universityWealth indicator of permanent income built -1.45 2.99
on information on durable goods and housingcentered, reduced (see Table 12)
Land area Land area owned by the household 0 13.5measured in ln(sq.meters)0 if the household does not own any land
Livestock indicator aggregating cattle, chicken... -1.62 5.61centered, reduced
Enterprize 1 if the household operates a firm, even informal, 0 10 otherwise
Household size number of persons living in the household 3 30No older brother 1 if the child has no older brother, 0 otherwise 0 1No older sister 1 if the child has no older sister, 0 otherwise 0 1
26

Table 12: Wealth indicator: weights given to the variables
Durable goods HousingCooker 0.310 Walls in concrete refFridge, freezer 0.691 Walls in bricks -0.140Coal oven, “gaz butane” 0.441 Walls in earth -0.356Electric, gas, micro-wave oven 0.166 Walls in bamboo, canvas, other -0.068Sewing machine 0.260 Walls in wood, galvanized iron 0.017Fan 0.688 Walls in stone -0.204Air conditioned 0.158 Floor in concrete, cement refRadio 0.004 Floor in sand, earth, bamboo -0.578Tape, record player 0.398 Floor in wood 0.012Television 0.775 Floor in stone, tile 0.445Video cassette recorder 0.445 Ceiling in galvanized iron refCD player 0.263 Ceiling in leaves, earth -0.526Camera, video 0.165 Ceiling in wood, canvas 0.043Computer 0.185 Ceiling in concrete, cement 0.531Bicycle 0.101 Ceiling in tile 0.244Motorcycle, scooter 0.115 Windows poorly protected (c) -0.557Car 0.340 Multi-storied house or apartment refCable TV 0.472 One-story house 0.273Electric iron 0.289 Apartment(s) 0.209Furniture 0.369 Number of rooms (c) 0.139
Well without pump refInside private tap 0.525Water seller 0.019Outside private tap 0.282Well with pump -0.107River, rain water, other -0.059Public standpipe -0.147Low hygienic toilets (c) -0.725Electricity 0.814Kitchen 0.129Remote telephone (c) -0.595
Note: (c) means that this variable take several ordered modalities.
27

Table 13: Number of observations
Test Life skills Oral maths Written maths Written FrenchScore in 2003 + Scores in 95 542 530 443 442Score in 2003 + Scores in French (95-96) 492 - - 405Score in 2003 + Scores in Maths (95-96) 520 506 425 -
Note: Number of children aged between 13 and 18 and for which number of years of education, age
when started to work are available.
Table 14: Descriptive statistics for the scores using different criteria
Criteria # obs. Mean Std Dev Min MaxLife skills scoreAll 2354 61.89 18.62 0 10013 ≤ age ≤ 18 2321 61.97 18.56 0 100+ has been to school 2040 63.44 18.21 0 100+ both tests avail. in 95 578 63.98 17.19 15 100+ both tests avail. in 96 517 64.36 16.95 15 100
Oral maths scoreAll 2200 59.18 22.20 0 10013 ≤ age ≤ 18 2177 59.19 22.19 0 100+ has been to school 1923 60.84 21.68 0 100+ both tests avail. in 95 565 61.51 20.82 0 100+ both tests avail. in 96 506 61.51 20.59 0 100
Written maths scoreAll 1641 76.32 20.42 0 10013 ≤ age ≤ 18 1624 76.33 20.45 0 100+ has been to school 1595 76.74 20.17 0 100+ both tests avail. in 95 470 76.01 20.11 0 100+ both tests avail. in 96 426 76.20 19.94 0 100
Written French scoreAll 1703 78.52 19.89 0 10013 ≤ age ≤ 18 1680 78.63 19.82 0 100+ has been to school 1647 79.01 19.53 0 100+ both tests avail. in 95 469 79.04 18.95 0 100+ both tests avail. in 96 424 79.83 18.25 0 100
28

Table 15: Predicting attrition in sample
Household reinterviewed Child testedBoy 0.252 0.222Lives with one’s father −0.052 0.143Lives with one’s mother 0.219+ 0.107Lives with one’s grand-parents 0.222∗ −0.018Wealth −0.056+ 0.055+Rural 0.424∗∗ −0.214CI repeated 0.191 −0.163CP repeated −0.113 −0.285∗Helped with homework 0.243+ −0.049Domestic work 0.193 0.139Agricultural work 0.226∗ 0.107Business activity 0.137 −0.012French score in 95 0.003 −0.003Math score in 95 −0.007+ −0.002
# Observations 982 790
Note: **, * and + mean respectively that the coefficient is significantly
different from 0 at the 1%, 5% and 10% level.
29

Table 16: Including domestic work
Scores in 2003 1 2 3 4 5 6 7Oral maths Eco. work -0.005 -0.004 0.025 0.027 0.033+ 0.039* 0.028
(0.013) (0.013) (0.017) (0.017) (0.018) (0.019) (0.018)Dom. work -0.162+ -0.153+ -0.221** -0.197* 0.047 -0.109 -0.188*
(0.084) (0.085) (0.083) (0.084) (0.113) (0.097) (0.093)Written maths Eco. work 0.002 0.005 0.025 0.025 0.027 0.028 0.026
(0.014) (0.014) (0.018) (0.017) (0.019) (0.020) (0.019)Dom. work -0.176* -0.165+ -0.184* -0.171* -0.048 -0.109 -0.142
(0.086) (0.086) (0.084) (0.083) (0.115) (0.098) (0.090)Written French Eco. work 0.009 0.013 0.035+ 0.034+ 0.030+ 0.034 0.033+
(0.015) (0.016) (0.020) (0.020) (0.018) (0.022) (0.020)Dom. work -0.005 0.018 0.002 0.014 0.107 0.042 0.026
(0.093) (0.093) (0.093) (0.093) (0.107) (0.107) (0.095)
Fixed effects no no yes yes no yes yesScores in 95 no yes no yesScores in 95instrumented by 96 yes yes
Math scores in 95 instrumentedby French score in 95 yes
Note: Scores are normalized by their standard errors thus estimates are the impact of one addi-
tional year of labor on scores in 2003 measured in standard errors. Control tests for specifications
(2) and (4) to (6) are French in 95 for written French and mathematics for all the other ones.
**, * and + mean respectively that the coefficient is significantly different from 0 at the 1%, 5%
and 10% level.
30

Table 17: Impact of occupation in childhood on results
Scores in 2003 Life skills Oral maths Written maths Written FrenchYears of schooling 0.094** 0.124** 0.197** 0.145**
(0.022) (0.023) (0.026) (0.028)Years of labor 0.020 0.020 0.027 0.033
(0.026) (0.028) (0.029) (0.031)Employee -0.344 -0.106 -0.472+ -0.577*
(0.236) (0.248) (0.272) (0.287)Self-employed 0.089 -0.108 0.070 0.392
(0.277) (0.290) (0.347) (0.367)Familial worker -0.254 0.123 0.037 -0.035
(0.172) (0.181) (0.186) (0.197)Apprentice -0.098 0.156 -0.343 -0.361
(0.199) (0.214) (0.250) (0.278)No occupation Ref Ref Ref Ref
# obs. 542 530 443 442R2 0.38 0.31 0.42 0.36
Note: Estimations include communities fixed effects, control for maths score in
95, which is instrumented by French score in 95 and control for child’s age. **,
* and + mean respectively that the coefficient is significantly different from 0 at
the 1%, 5% and 10% level.
31

References
Akabayashi, H., Psacharopoulos, G., 1999. The trade-off between child labourand human capital formation: A Tanzanian case study. Hournal of Develop-ment Studies 35, 120–140.
Assaad, R., Levison, D., Dang, H., 2005. How much work is too much? thresh-olds in the effect of child work on schooling - the case of Egypt.
Assaad, R., Levison, D., Zibani, N., 2002. The effect of child work on schoolenrollment in Egypt.
Becker, G., Tomes, N., 1976. Child endowments and the quantity and qualityof children. Journal of Political Economy 84, 143–162.
Beegle, K., Dehejia, R., Gatti, R., 2004. Why should we care about child labor?the education, labor market, and health consequences of child labor. WorkingPaper 10980, National Bureau of Economic Research.
Boozer, M., Suri, T., 2001. Child labor and schooling decisions in Ghana.
Canals-Cerda, J., Ridao-Cano, C., 2004. The dynamics of school and work inrural bangladesh. Policy Research Working Paper 3330, World Bank.
Dumas, C., Lambert, S., 2007. Educational achievement and socioeconomicbackground: causality and mechanisms in Senegal. Working Paper 0706, Lea-Inra.
Emerson, P., Souza, A., 2008. Is child labor harmful? the impact of starting towork as a child on adult earnings, mimeo.
Griliches, Z., 1977. Estimating the returns to schooling: some econometric prob-lems. Econometrica 45, 1–22.
Hansen, K., Heckman, J., Mullen, K., 2004. The effect of schooling and abilityon achievement test scores. Journal of econometrics 121, 39–98.
Heady, C., 2003. The effect of child labor on learning achievement. World De-velopment 31, 385–398.
Patrinos, H. A., Psacharopoulos, G., 1995. Educational performance and childlabor in Paraguay. Inetrnational Journal of Educational Development 15, 47–60.
Ravallion, M., Wodon, Q., 2000. Does child labor displace child schooling? ev-idence on behavioral responses to an enrollment subsidy. Economic Journal110, C158–C176.
Wooldridge, J., 2002. Econometric Analysis of cross section and panel data.MIT Press.
32