does the structure of banking markets affect economic growth
TRANSCRIPT

Research Division Federal Reserve Bank of St. Louis Working Paper Series
Does the Structure of Banking Markets Affect Economic Growth? Evidence from U.S. State Banking Markets
Kris James Mitchener and
David C. Wheelock
Working Paper 2010-004E
http://research.stlouisfed.org/wp/2010/2010-004.pdf
January 2010 Revised August 2012
FEDERAL RESERVE BANK OF ST. LOUIS Research Division
P.O. Box 442 St. Louis, MO 63166
______________________________________________________________________________________
The views expressed are those of the individual authors and do not necessarily reflect official positions of the Federal Reserve Bank of St. Louis, the Federal Reserve System, or the Board of Governors.
Federal Reserve Bank of St. Louis Working Papers are preliminary materials circulated to stimulate discussion and critical comment. References in publications to Federal Reserve Bank of St. Louis Working Papers (other than an acknowledgment that the writer has had access to unpublished material) should be cleared with the author or authors.

Does the Structure of Banking Markets Affect Economic Growth?
Evidence from U.S. State Banking Markets
Kris James Mitchener* Santa Clara University & NBER
Department of Economics Santa Clara University
500 El Camino Real Santa Clara, CA 95053 [email protected] office: 408.554.4340 fax: 408.554.2331
David C. Wheelock Research Division
Federal Reserve Bank of St. Louis St. Louis, MO 63166
JEL Codes: G21, G38, E44, N21, N22, N11, N12, O16, O47 Keywords: bank regulation, banking market concentration, economic growth, financial development This paper examines the impacts of banking market structure and regulation on economic growth using new data on banking market concentration and manufacturing industry-level growth rates for U.S. states during 1899-1929—a period when the manufacturing sector was expanding rapidly and restrictive branching laws segmented the U.S. banking system geographically. Unlike studies of developing and developed countries today, we find that banking market concentration generally had a positive impact on manufacturing sector growth in the early twentieth century United States, with a somewhat stronger impact on industries with smaller establishments, lower rates of incorporation, and less reliance on bond markets (and, hence, relatively more reliance on banks). Because regulations affecting bank entry varied considerably across states and the industrial organization of the U.S. banking system differs markedly from those of other countries, we consider the impact of other aspects of banking market structure and policy on growth. Even after controlling for differences in the prevalence of branch banking, deposit insurance, and other aspects of policy and market structure, we find that market concentration boosted industrial growth. *Corresponding author We thank the editor (William Collins) and two anonymous referees, as well as participants in the 2009 NBER Summer Institute workshop on the Development of the American Economy, the Federal Reserve System Research Committee on Financial Structure and Regulation, and the Cliometrics session at the 2010 Western Economic Association meetings for comments on previous versions of this paper, and Nilisha Agrawal, Craig Aubuchon, Lydia Fung, David Lopez and Daniel McDonald for excellent research assistance. Mitchener acknowledges the generous financial support of the Hoover Institution while in residence as the W. Glenn Campbell and Rita Ricardo-Campbell National Fellow.

Does the Structure of Banking Markets Affect Economic Growth? Evidence from U.S. State Banking Markets
I. Introduction
A long line of scholarship posits a causal relationship between finance and economic
growth. According to this view, well-developed capital markets—especially those imbued with
rights that protect investors—promote the efficient allocation of funds to projects with high rates
of return, in turn stimulating savings, investment, and economic growth.1 Evidence from both
single-country and cross-country studies suggests that economies with more developed financial
markets begin to grow earlier, attain higher growth rates, and achieve higher levels of per capita
income than economies with less developed financial markets.2
Many empirical studies have followed Rajan and Zingales (1998) in exploiting
differences across space and time to identify a causal link between finance and development, and
recent research has focused on the mechanisms underlying that relationship. The present paper
contributes to a growing body of literature that examines how banking institutions affect
economic activity. Financial intermediaries are thought to improve resource allocation and fund
projects with higher rates of return by matching borrowers and lenders efficiently and by
monitoring firm behavior (Allen, 1990; Boyd and Prescott, 1986; Greenwood and Jovanovic,
1990; Kashyap et al., 2002; King and Levine, 1993b). Researchers have found considerable
evidence that banking system structure and competition affect economic growth. For example,
based on a cross-section sample of 41 countries for 1980-90, Cetorelli and Gambera (2001) find
that increased concentration in banking markets depresses industrial growth in general, but
These findings have prompted
researchers to consider more carefully how financial markets affect economic activity in the long
run. For example, in an important paper that exploits cross-country and cross-industry
differences, Rajan and Zingales (1998) conclude that financial development helps firms
surmount moral hazard and adverse selection problems and thereby reduces the costs of external
finance.
1 Recent examples of this literature include Beck et al. (2000), Bekaert et al. (2005), King and Levine (1993a, b), Levine and Zervos (1998), and Rajan and Zingales (1998). La Porta et al. (1998, 2000) discuss the importance of legal traditions influencing financial development. 2 For surveys of this literature, see Levine (1997, 2006) and Demirgüç-Kunt and Levine (2001). For a within-country example, see Guiso, Sapienza, and Zingales (2004).

2
boosts the growth of industries that depend relatively heavily on external sources of finance.
Similarly, based on data for regional banking markets in Italy, Bonaccorsi di Patti and
Dell’Ariccia (2004) find that higher concentration promotes firm creation in industries where the
creditworthiness of entrepreneurs is difficult to assess.3 By contrast, Claessens and Laeven
(2005) find that more competition in banking markets raises the growth of industries that depend
relatively heavily on external financing, though Hoxha (2009) reaches the opposite conclusion
using a somewhat different model and dataset.4
With a few exceptions, most empirical studies of the impact of banking market structure
or competition on economic activity assume that each country consists of a single national
banking market. That assumption might be tenable for banking systems that are dominated by a
few large banks with nationwide branch networks. However, the banking systems of countries
with a tradition of unit banking, such as the United States, consist of more geographically
segmented banking markets. Long-standing legal restrictions on both interstate branching and
branching within the borders of most states left the United States with highly fragmented local
banking markets that only recently have become well integrated. Although most legal barriers to
branching within and across state lines were eliminated in the 1990s, the concentration of
deposits among banks in the United States remains low compared with most other countries.
5
Because of the unusual structure of the U.S. banking system, the findings of studies that examine
the impact of banking market structure on economic development using countries as the unit of
observation might not reflect the U.S. experience.6
To determine whether the findings of cross-country studies generalize to a geographically
segmented banking environment, the present paper investigates the impact of banking
3 Bonaccorsi di Patti and Dell’Ariccia (2004) also find that higher concentration raises the rate of entrepreneurship across all industries when banking markets are relatively unconcentrated ex ante, but reduces the overall rate of firm creation when banking markets are already highly concentrated. Cetorelli and Strahan (2006), however, find that the number of firms is larger and average firm size is smaller in less concentrated local U.S. banking markets. 4 Claessens and Laeven (2005) focus on the effects of banking market competition, which they estimate using data for individual banks, whereas Hoxha (2009) includes measures of both competition and concentration. Following Cetorelli and Gambera (2001), we focus here on the effects of concentration, in part because the bank-level data required to calculate alternative measures of competition are not available for U.S. banks in the early twentieth century. 5 The average three- and five-bank concentration ratios for the United States during 1989-96 were 0.15 and 0.20, respectively. Three-bank ratios for other countries ranged between 0.21 (Japan) and 0.87 (Jordan), and five-bank ratios ranged between 0.32 (Japan) and 0.99 (New Zealand) (Cetorelli and Gambera, 2001, Table 1). 6 In addition to Cetorelli and Gambera (2001), other studies that use countries as the unit of observation to examine the effects of banking market competition and structure include Barth, Caprio, and Levine (2004), Claessens and Laeven (2004; 2005), and Demirgüç-Kunt, Laeven, and Levine (2004).

3
concentration on the growth of manufacturing industries across U.S. states during the first three
decades of the twentieth century—a period when firms relied heavily on bank financing and U.S.
banking markets were geographically segmented by restrictive branching laws. Because the
structure of the U.S. banking system today is evolving rapidly in response to the removal of most
branching restrictions, as well as because of the recent financial crisis and recession, we focus on
a period when interstate branching was prohibited and many states restricted branching within
their borders. Further, in our investigation of the effects of banking concentration on growth, we
control explicitly for differences in state banking policies and other aspects of market structure
that may have affected the growth of manufacturing industries. It might be possible to carry out a
similar exercise by examining bank regulations in developing countries today; however, the best
available database on bank regulation is not retrospective in nature (Barth, Caprio, and Levine,
2001).
Even if one gathered historical information on bank regulation across developing
countries, unobserved heterogeneity is more likely to be a concern in a cross-country study of
developed and developing countries than in a study of U.S. states. Because banking institutions
and regulations differ considerably across countries, there is considerable scope for omitted
variables to be problematic in cross-country empirical studies, providing an additional reason
why the within-country setting (where such differences can be explicitly accounted for) may
shed additional light on these questions. By contrast, U.S. states, particularly in the era before the
removal of federal restrictions on interstate branching, represent a fertile environment for
studying the relationship among bank regulations, market structure, and economic growth. For
example, many studies have found that branching and interstate banking deregulation affected
rates of economic growth and entrepreneurship, as well as aspects of industrial structure across
U.S. states in the 1980s and 1990s.7
Our study exploits variation in growth rates of individual manufacturing industries across
U.S. states, as well as differences in the structure and regulation of state banking systems, to
We investigate whether differences in the prevalence of
branching and in other aspects of bank regulation and market structure affected the growth of
manufacturing industries during the first three decades of the twentieth century.
7 See, for example, Jayaratne and Strahan (1996), Black and Strahan (2002), Cetorelli and Strahan (2006), Freeman (2002) and Garrett, Wagner and Wheelock (2007). The Interstate Banking and Branching Efficiency Act of 1994 permitted interstate branching beginning in 1997. Before then, state laws determined the extent to which banks could branch within states. Several states eased restrictions on branching between 1900 and 1929 (see White, 1983). A second deregulation wave occurred in the 1970s and 1980s.

4
provide new evidence on the effects of banking market structure and regulation on U.S.
manufacturing growth in the early twentieth century. Our approach follows Rajan and Zingales
(1998), Cetorelli and Gambera (2001) and other cross-country studies of economic growth in
recent periods in exploring how banking market structure affected growth across industries that
differ in terms of technology or reliance on external funding sources.8
Our within-country finding that banking market concentration generally had a positive
effect on growth of manufacturing industries for the United States contrasts with evidence from
cross-country studies which find that concentration tends to retard growth (Cetorelli and
Gambera, 2001). The unique structure and regulation of U.S. banking historically may explain
this difference and, hence, we explore the impacts of other aspects of banking market structure
and regulation on industrial growth. For example, we find that more banks per capita and branch
banking increased growth rates among industries that relied relatively heavily on external
financing, and that state deposit insurance systems depressed growth of manufacturing
We find that concentration
in state banking systems generally had a positive impact on the growth of U.S. manufacturing
industries. Our results are robust to controlling for various bank regulations and other market
characteristics. Further, we find some evidence that the impact of concentration varied across
industries with different degrees of reliance on external financing. In particular, we find evidence
that banking market concentration had a smaller impact on the growth of industries with larger
average size establishments, higher percentages of incorporated firms, or that relied more heavily
on capital markets (as opposed to banks) for external financing, though the evidence for these
differential effects is less robust to specification and model than the overall positive effect of
concentration on the growth of manufacturing. These results suggest that firms that depended
more on banks than on capital markets for external finance benefited more from concentration of
banking markets. Our results are thus consistent with the view that market power encourages
banks to invest in information and monitoring technologies that increase lending to small
businesses and other firms for which information problems are especially acute (e.g., Petersen
and Rajan, 1995).
8 By contrast, most previous studies consider the effects of state banking policies only on aggregate growth rates. For example, Dehejia and Lleras-Muney (2007) examine the impact of branch banking and deposit insurance on economic performance at the state level during 1900-40. They find that branching had an unambiguously positive effect on bank loan growth, output of the agricultural and manufacturing sectors, and on educational attainment, whereas deposit insurance had mixed effects.

5
industries. These findings also appear robust to alternative measures of industry growth as well
as different measures of reliance on external financing.
II. Firm Finance and Unit Banking
The development of deep and liquid debt and equity markets is often cited as a key
institutional innovation that encouraged the efficient allocation of financial capital to investment
projects and in turn spurred high rates of economic growth in the United States (Goldsmith,
1969; Gurley and Shaw, 1955; Rousseau and Sylla, 2005; Rousseau and Wachtel, 1998; Wachtel
and Rousseau, 1995). Indeed, recent empirical scholarship relies on this fact and uses the United
States as a benchmark to assess the development of financial systems in other countries
(Cetorelli and Gambera, 2001; Masten, et al. 2008; Rajan and Zingales, 1998; Raddatz, 2006).
However, the widespread use of capital markets by U.S. business enterprises emerged
gradually. Circa 1900, the market for long-term business credit was limited in scale and scope.
Whereas railroads and telegraph companies had long issued bonds, electric utilities and firms
engaged in manufacturing or trade were just beginning to make use of debt and equity markets.
Moreover, only the largest enterprises tapped capital markets; most others relied on renewable
short-term funds provided by banks or trade credit—even to finance longer-term investment
(Jacoby and Saulnier, 1947). Consequently, as of 1900, commercial banks held two-thirds of the
assets of all financial intermediaries (White, 1997, p. 85).
In the United States, bank charters are issued by both the federal government and state
governments. Federally chartered (i.e., “national”) banks are subject to federal regulation and
supervision, whereas state-chartered banks are subject to state-based regulations and
supervision.9 At the beginning of the twentieth century, federal banking laws prohibited national
banks from operating branch offices. Similarly, the laws and practices of most states prohibited
branching by state-chartered banks. As a result, the U.S. banking system consisted of thousands
of small unit banks. In 1900, the United States had 12,427 commercial banks, of which 3,731
held federal charters and 8,696 held state charters. Only 87 banks operated any branches, and
most of those had only one branch office. The average national bank had $1.3 million of total
assets, whereas the average state bank had a mere $0.5 million.10
9 State-chartered banks that are members of the Federal Reserve System are subject to supervision by both the Federal Reserve and state banking authorities.
By contrast, the banking
10 Data on the number and total assets of banks are from Board of Governors (1959). Data on the number of banks with branch offices and the number of branches are from Board of Governors (1943, p. 297).

6
systems of most other early industrializing nations were dominated by a few large banks with
extensive nationwide branch networks.11
Federal and state banking regulations began to change during the first decades of the
twentieth century. The Gold Standard Act of 1900 lowered capital requirements for national
banks, which prompted several states to lower requirements for state-chartered banks. Several
states also established deposit insurance systems or eased restrictions on branching during this
period. The federal government responded by allowing national banks limited freedom to operate
branch offices in states that permitted branching by state banks.
12
III. Evidence on the Effects of Banking Market Concentration on Growth
By 1929, 751 banks, including
167 national banks, operated a total of 3,522 branches, although unit banking continued to
prevail in many states. Federal banking regulations applied nearly uniformly to national banks in
all states, but differences in state banking regulations and supervisory systems caused state
banking markets to vary widely in terms of entry opportunities and thus competitive
environment. Differences across states in branching laws, capital requirements, state deposit
insurance systems, and other banking market characteristics make the United States a
particularly interesting laboratory for understanding how banking market structure and policy
affect economic growth. Importantly, however, individual states changed their regulatory
systems during our sample period, and it is the changes within states that we exploit to gain
identification in our empirical exercises.
Standard theories of industrial organization suggest that deviations from perfect
competition introduce inefficiencies which, in turn, can limit firms’ access to funds and thus
hinder economic growth. On the other hand, recent research suggests that market power might
facilitate firms’ access to credit by giving banks an incentive to establish long-term relationships
with borrowers (Mayer, 1988; Petersen and Rajan, 1995). Further, Marquez (2002) argues that
banks are less capable of screening potential borrowers in competitive banking markets, which
11 The number of banks per capita and average size of banks illustrate the unusual structure of the U.S. banking system. As of 1902, the United States had some 18 banks per 100,000 persons, whereas Canada, Germany, and the United Kingdom had 0.51, 0.22, and 0.18 banks per 100,000 persons, respectively (Grossman, 2010, Table 3.3). As of 1930, U.S. banks held an average of $2.63 million of deposits, whereas banks in Canada, Germany, and the United Kingdom held an average of $225.67 million, $8.27 million, and $601.26 million, respectively (Grossman, 2010, Table 3.4). 12 The McFadden Act of 1927 permitted national banks to operate branches in states where state-chartered banks were allowed to branch. However, national banks were not permitted to participate in state deposit insurance systems. See White (1983) for information about the evolution of state and federal banking laws and practices during the first three decades of the twentieth century.

7
increases lending to low-quality borrowers. This inefficiency can cause equilibrium interest rates
to be higher in banking markets composed of many small banks than in markets dominated by a
few large banks. Because theory yields ambiguous answers, the effect of banking market
competition on economic growth is ultimately an empirical question.
Our empirical strategy exploits state-level differences in growth rates across a variety of
manufacturing industries to examine how banking market structure and regulation influence
economic growth in countries with geographically segmented banking markets. The U.S.
manufacturing sector grew rapidly during the first decades of the twentieth century. The total
real value added of the sector increased 2.5 times and real value added per worker increased by
27 percent between 1899 and 1929.13
We estimate the effects of bank concentration on the average annual growth rate in
manufacturing industry i between t–1 and t (where t is a subscript for time) as follows:
For comparison with earlier studies such as Cetorelli and
Gambera (2001), we first investigate the impact of banking market concentration on the growth
of manufacturing in general and across industries with different degrees of reliance on or access
to external financing. However, because concentration alone might not adequately reflect the
competitive environment, especially in a unit banking system, we subsequently augment our
regression models with various banking policies and other market characteristics that may have
also affected competition in state banking markets and growth rates in the manufacturing sector.
(1) %∆Outputijt = α1 + α2Bank Concentrationjt−1 + α3Industry Share of Output in Manufacturingijt−1 + γj + λt + ξi + εijt,
where j is a subscript for the state, ε is a white noise error term, and γ, λ., and ξ are fixed effects
for year, state, and industry, respectively. State and industry fixed effects capture unobserved
characteristics at the state and industry level that may influence output growth, and time fixed
effects control for any unobserved influences operating at the state level. State fixed effects also
enable us to account for factors, such as financial development, which have been included in
cross-country studies and that may vary across polities.14
13 Nominal value added in manufacturing increased from $5.5 billion in 1899 to $30.6 billion in 1929 and employment rose from 5.5 million to 10.7 million. The growth in manufacturing value added was similar to the growth in total U.S. gross national product. See Historical Statistics of the United States (2000), Series Dd10 (value added), Ba834 (employment), and Ca214 (gross national product).
Our identification thus comes from
examining within-state, within-industry changes. Values for banking market concentration are
14 We included an interaction of industry and year fixed effects in an alternative specification and obtained qualitatively identical results to those reported in the paper. Results are available from the authors on request.

8
from the beginning of the 10-year period over which we examine annualized growth rates of
manufacturing output (e.g., we use observations on the bank concentration ratio for 1899 when
considering manufacturing growth rates for 1899-1909). Since all the industries we consider are
in manufacturing, Equation 1 also controls for an industry-specific convergence effect using the
share of total manufacturing output accounted for by industry i in state j at the start of each 10-
year period over which we observe industry output. Following Cetorelli and Gambera (2001) and
Rajan and Zingales (1998), we include this in order to capture an effect that is similar to
including initial income per capita in standard growth regressions, except in this case it controls
for an industry-specific, time-varying effect, whereby industries that have grown relatively
rapidly in the past will likely grow slower in the future.
Sample Manufacturing Industries
We computed average annual state-level growth in real output for 18 industries, and the
share of total state manufacturing output accounted for by each industry, using data on value of
products from the 1899, 1909, 1919, and 1929 U.S. Census of Manufactures. The dependent
variable for each regression is thus defined in a panel context as the annual average output
growth rate between 1899-1909, 1909-1919, and 1919-1929.15
The U.S. Census of Manufactures has not been digitized; hence, we hand-collected data
for the 18 industries included in our study. In deciding which industries to include in our sample,
we attempted to balance the cost of inputting industry-state-year data with obtaining a
representative sample of industries. We included industries that constituted the largest share of
U.S. manufacturing employment in either 1899 or 1929 so that our sample would capture the
broad trends encompassing U.S. manufacturing during the first three decades of the twentieth
century, i.e. we included industries that were once large but declining after 1900 as well as
We converted all nominal dollar
amounts to inflation-adjusted values using a GNP deflator (Gordon, 2000). We end our study in
1929 because of the significant changes in federal banking and securities regulation, government
support for troubled banks, and innovations in bank lending and other sources of firm financing
that occurred as a result of the Great Depression, all of which dramatically reshaped the banking
environment.
15 We obtained qualitatively similar results using the annual average growth rate of real value added as the measure of growth. Results are available from the authors on request.

9
industries that grew quickly after 1900 and had become large employers by 1929.16
Our sample includes several established industries with high employment at the start of
our period, such as cotton goods, lumber and timber products, and boots and shoes, but which
subsequently grew slowly between 1899 and 1929. The sample also includes industries with
relatively small employment shares in 1899 but then expanded rapidly over the subsequent three
decades, such as electrical machinery and motor vehicles, which represent some of the “high-
tech” industries of the period. In addition, the sample includes some other historically important
industries, such as iron and steel and railroad cars, that were part of the first wave of U.S.
industrialization but may have had renewed importance with the expansion of industry in the
early twentieth century. Table I reports average annual growth rates of inflation-adjusted output
for each of the 18 industries in our sample at decade intervals and for 1899 to 1929 as a whole.
As shown in the table, growth rates varied considerably at the national level across industries and
over time. For example, from 1899 to 1909, the lumber industry grew at an annualized rate of
2.45 percentage points whereas motor vehicle assembly grew at a rate of 37.87 percentage
points. Over this period, growth rates differed considerably between industries, as reflected by a
standard deviation of 8.2 percentage points. For other intervals, growth rates also varied
considerably across industries, with standard deviations roughly as large or larger than the
means. The standard deviation of growth rates across states within a given industry was
approximately 4 percentage points over the entire sample period. The Data Appendix provides
Our sample
of 18 industries accounted for 20 percent of the total number of manufacturing establishments,
45 percent of total employment (wage earners), and 35 percent of total output and value added in
1899. In 1929, these 18 industries accounted for 47 percent of the total number of manufacturing
establishments, 54 percent of total employment (wage earners), 46 percent of total output, and 47
percent of value added in 1929. Although it would be possible to expand the sample to include
more industries, there are few additional industries for which data are available for many states.
Focusing on industries that were present in a large number of states enables us to take full
advantage of the cross-state variation in banking environments.
16 We started with the 20 largest industries in terms of employment in each year but were able to construct consistent definitions across time for only 18 industries.

10
additional information about the industries that comprise our sample and the compilation of the
data used in the econometric analysis.17
Banking Market Concentration
Table II provides summary statistics for new estimates of four-firm bank concentration
ratios for U.S. states based on total deposits for 1899, 1909, 1919, and 1929, which we computed
using data from Polk’s Bankers Encyclopedia.18 For 1899, the four-firm concentration ratio
ranges from 0.09 to 0.60, with a mean of 0.27. Mean (and median) concentration declined
somewhat between 1899, 1909, and 1919 and then increased during the 1920s as the banking
industry began to consolidate, especially in states that eased branching restrictions. Figure 1
shows state banking concentrations in 1899 and 1929. The rankings of states by the level of
concentration are highly correlated over time. However, changes in concentration across states
varied considerably over the decades covered in our sample. The rank orderings of states in
terms of changes in concentration are uncorrelated over time.19
In estimating the impact of banking market concentration on output growth for 18 U.S.
manufacturing industries, we use observations on concentration in the first year of the ten-year
intervals over which we observe output growth. Although our observations on concentration
precede (in time) those on output growth, it is conceivable that banking market concentration
was determined to a significant degree by future growth of manufacturing industries. However,
based on historical reasons and additional statistical tests we conducted, we are reasonably
confident in treating lagged concentration as exogenous with respect to the growth rates of
individual industries. We first examined the relationship between both levels and changes in
concentration and lagged growth in manufacturing output and found that the two are
uncorrelated. The correlation coefficients between state bank concentration in 1909, 1919, and
17 The motor vehicle parts and assembly industries are combined in the 1899 census. We use data for the combined industry throughout the sample period, and for automobile parts only for 1909-29. Data for some other sample industries are unavailable for some states in particular years. Across the 48 states, the number of industries with non-missing (or non-zero) observations average 8.4, 9.9, and 10.4 for 1899-1909, 1909-19, and 1919-29, respectively. For our econometric analysis, we treat all cases of non-reported data as missing observations. See the Data Appendix for additional information. 18 We constructed a four-firm commercial bank concentration ratio for each state based on total deposits using data for individual banks from Polk’s Bankers Encyclopedia (various years) and total deposits from Board of Governors of the Federal Reserve System (1959). Our measure excludes data for mutual savings banks and other mutual savings institutions that generally made few commercial loans. 19 The Spearman rank correlation coefficients for the levels of concentration in 1899, 1909, 1919, and 1929 range from 0.59 (for the correlation between ranks of 1899 and 1929) to 0.88 (for the correlation between ranks for 1909 and 1919), and are all statistically significant at the one-percent level. The correlation coefficients for changes in concentration between 1899-09, 1909-19, and 1919-29 range from -0.17 to 0.17 and none is statistically significant.
11
1929, and output growth during 1899-1909, 1909-19, and 1919-29, respectively are -0.05, -0.11,
and 0.00. None is statistically significant. The correlation coefficient between state changes in
concentration during 1909-19 with output growth during 1899-1909 is 0.20, and the correlation
coefficient between changes in concentration during 1919-29 with output growth during 1909-19
is 0.12. Neither is statistically significant (p-values of 0.17 and 0.43). In addition, using the
Durbin-Wu-Hausman test, we fail to reject the hypothesis that concentration is exogenous at
standard confidence levels in regressions based on the three estimation equations in the text.
These statistical results are consistent with the conclusions drawn from historical research
finding that U.S. bank regulation and market structure in the 19th and early 20th centuries
mainly reflected agricultural and other political interests outside of the manufacturing sector.
That research also finds that U.S. bank regulation and market structure hampered American
industrialization and did not begin to adjust significantly to the needs of an industrializing
economy before the 1920s (one reason that the final observations on concentration in our
analysis are for 1919).
The importance of politics, and especially of the interests and influence of agriculture, is
apparent in U.S. bank regulation and market structure in the nineteenth and early twentieth
centuries. The United States twice rejected national banks with extensive interstate branch
networks before the Civil War. Individual states established banking systems that best suited
local interests which, in most states at the time, were dominated by agricultural interests. In most
northern and midwestern states, land was the main form of wealth and collateral for bank loans
for farmers. Those states tended to prohibit or severely restrict branch banking so as to ensure
that banks would continue to lend to local farmers in bad times as well as good times (Calomiris,
2000b). Northern farm states also imposed very low, or even no, minimum capital requirements
on banks. As a result, those stated often had hundreds or thousands of small unit banks, high
numbers of banks per capita, and low levels of state banking market concentration.
Banking markets evolved somewhat differently in the antebellum South, but like northern
farm states, they largely reflected the interests of agriculture. In contrast with the North, where a
farmer’s wealth was predominantly in land, in antebellum southern plantation agriculture, slaves
and cotton were the primary forms of collateral for loans. The mobility of such forms of wealth
meant that southern plantation owners benefited less from tying banks to a particular locale by
branching restrictions or other means (Calomiris, 2000b). Moreover, branch banks better served

12
southern agriculture by reducing the cost of financing the movement of crops over long
distances. Thus, southern states were more likely to allow some branch banking, have fewer
banks per capita, and more concentrated banking markets.
State banking regulations and market structures evolved slowly over the 19th and early
20th centuries. Unit banking prevailed in most states after the Civil War and well into the 20th
century. Although the National Banking Acts of the Civil War established a federal banking
charter, and thus created the dual banking system, and interstate branching remained prohibited.
Most states restricted the ability of banks to operate branch offices. Although few states allowed
any branching at the end of the nineteenth century, several permitted at least limited branch
banking by the 1920s. Some states permitted banks to establish branches only within their home-
office city or county, but a few, such as California, allowed statewide branching. The easing of
restrictions on branching promoted consolidation in the banking industry during the 1920s via
mergers and voluntary liquidations (Carlson and Mitchener, 2006; Wheelock, 1993; White,
1985a).
The public remained distrustful of large banks and the concentration of banking capital in
general. Moreover, most bankers, especially the owners of small unit banks that predominated in
rural areas, strongly opposed any moves to relax branching laws or raise minimum capital
requirements. (State laws specified the minimum amount of paid-in capital required to receive a
banking charter.) The unit banking lobby was especially strong in midwestern farm states, and
effectively stalled moves to significantly ease restrictions on branching, either at the federal or
state levels, even in states with a rapidly growing manufacturing sectors such as Illinois (White,
1985b).
Restrictions on branch banking and other regulations constrained the growth of U.S.
banks and hampered their ability to serve larger firms or those with geographically-dispersed
operations or customers. Those firms turned increasingly to the capital markets for investment
funds. Although regulations that constrained the growth and geographical reach of U.S. banks
encouraged the development of capital markets, American industrial firms appear to have faced
higher financing costs than their counterparts in countries with banking systems dominated by
large universal banks (Calomiris, 2000a).20
20 Keay and Redish (2004) show that throughout the twentieth century, large U.S. steel firms relied less on bank loans and other short-term debt and more on long-term debt issued on capital markets, than large Canadian firms,
Despite the apparent costs imposed on American

13
industry, U.S. banking regulations and market structure continued to reflect the public’s long-
standing distrust of large banks and the political influence of agricultural interests well into the
second half of the twentieth century. Hence, both the absence of correlation between bank
concentration and lagged manufacturing output growth, and the political economy of nineteenth
and early twentieth century bank regulation suggest that treating lagged measures of the
concentration of state banking markets as exogenous to the growth of manufacturing industries is
a reasonable identifying assumption.
Estimation Results
The first column of Table III presents an estimate of Equation 1, where reported standard
errors are clustered by state and industry.21 As described above, the concentration variable
captures the average effect of banking market concentration on industrial growth across our
sample industries. The regression suggests that concentration had a positive and economically
meaningful impact on growth of manufacturing during our sample period. Based on the
coefficient estimate, an increase in concentration from the 25th to the 75th percentile of the
distribution would result in a 1.5 percentage point increase in average annual manufacturing
output growth. Our finding is broadly consistent with theoretical work by Petersen and Rajan
(1995), who argue that market power in banking could allow newer firms or those without access
to public capital markets to tap funds to finance new investment projects and grow more quickly
(with the bank sharing in the future profit stream of the company through its monopoly rents).
Our results are also consistent with Marquez (2002) who suggests that concentration in banking
markets reduces inefficiencies associated with evaluating creditworthy borrowers. Our results
differ from those of Cetorelli and Gambera (2001), however, who find in their cross-country
study that, in general, more concentrated national banking markets retard industrial growth.22
External Financial Reliance
which they argue reflected the differences in the banking market structures of the two countries. However, they find that on average the cost of capital for large steel firms was similar in the two countries. 21 We experimented with clustering at the state-year level as well as just at the state level in order to address concerns about Moulton’s sampling problem and serial correlation. The reported results were not sensitive to these alternatives. 22 We also estimated regressions of total state manufacturing output growth on state banking concentration, both with and without additional controls for branch banking and minimum capital regulations, the presence of a state deposit insurance system and the number of banks per capita, similar to the regressions reported in Dejia and Lleras-Muney (2007). The coefficients on concentration in these regressions are positive and similar in size to those reported in Table III, though less precisely estimated due to the smaller sample size.
14
As we noted in Section II, the impact of banking market structure on an industry’s growth
may depend on industry-specific characteristics, such as the size of firms in the industry, their
organizational form (e.g., corporations, partnerships, etc.), and other characteristics affecting
how reliant firms in the industry are on financing expansion through retained earnings versus
intermediated borrowing. For example, differences in industry-specific technology could affect
the size of projects, the time it takes for projects to mature and produce returns, and the need for
additional infusions of funds. Rajan and Zingales (1998) argue that such industry-level
characteristics can lead to differences across industries in dependence on external sources of
financing. Differences in technology or financial market frictions could also lead to differences
across industries in average firm size, organizational form, and in their relative reliance on banks
for external financing. Thus, our next empirical specification allows for the possibility that the
effect of bank concentration on growth varied across industries according to the extent of their
reliance on external financing.
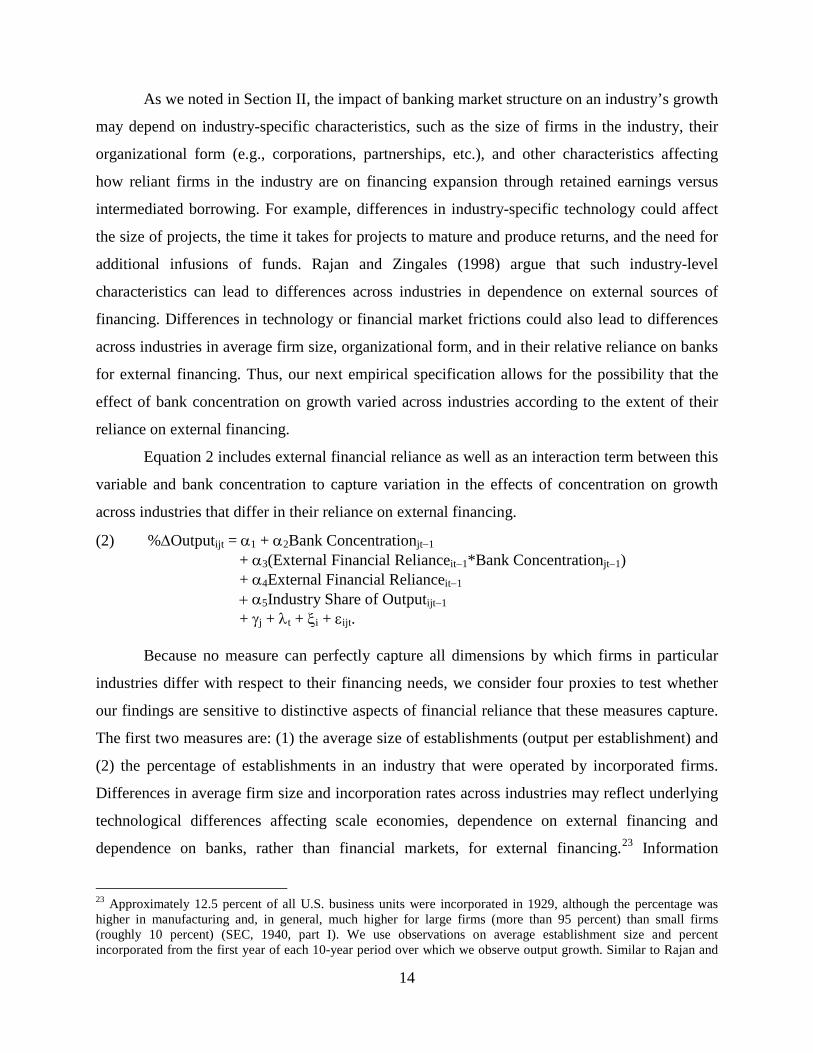
Equation 2 includes external financial reliance as well as an interaction term between this
variable and bank concentration to capture variation in the effects of concentration on growth
across industries that differ in their reliance on external financing.
(2) %∆Outputijt = α1 + α2Bank Concentrationjt−1 + α3(External Financial Relianceit−1*Bank Concentrationjt−1) + α4External Financial Relianceit−1 + α5Industry Share of Outputijt−1 + γj + λt + ξi + εijt.
Because no measure can perfectly capture all dimensions by which firms in particular
industries differ with respect to their financing needs, we consider four proxies to test whether
our findings are sensitive to distinctive aspects of financial reliance that these measures capture.
The first two measures are: (1) the average size of establishments (output per establishment) and
(2) the percentage of establishments in an industry that were operated by incorporated firms.
Differences in average firm size and incorporation rates across industries may reflect underlying
technological differences affecting scale economies, dependence on external financing and
dependence on banks, rather than financial markets, for external financing.23
23 Approximately 12.5 percent of all U.S. business units were incorporated in 1929, although the percentage was higher in manufacturing and, in general, much higher for large firms (more than 95 percent) than small firms (roughly 10 percent) (SEC, 1940, part I). We use observations on average establishment size and percent incorporated from the first year of each 10-year period over which we observe output growth. Similar to Rajan and
Information
15
problems are generally more acute with small firms, and thus small firms tend to face greater
difficulties in obtaining external funding for positive net present value projects than large firms.
Moreover, to the extent that they do tap outside sources of financing, small and unincorporated
firms generally obtain a greater share of their funding from banks, which specialize in
relationship lending, than from financial markets (Berger, 2010; Boot, 2000). Contemporary
sources suggest that smaller and unincorporated firms typically had fewer years of established
profitability, less-liquid assets, were tied more closely to local financial markets, and had credit
needs that were less well suited to standard appraisal than large and incorporated firms (Jacoby
and Saulnier, 1947). By contrast, larger firms and corporations were able to borrow on capital
markets at lower cost than small firms (SEC, 1940, part II, Table 15) and typically issued more
long-term debt than smaller or unincorporated firms (SEC, 1940, part II, Table 9). This suggests
that larger firms or corporations probably also received better terms from banks and had greater
access to outside funding sources than smaller and unincorporated firms. However, though small
and unincorporated firms may have relied less on external financing in total, they may have been
more sensitive to the structure of state banking markets than large and incorporated firms
because they were more dependent on banks for external financing than large firms. Hence, the
effect of banking concentration on growth rates across industries characterized by different size
firms or incorporation rates is ultimately an empirical question.
A third measure we consider is the par amount of outstanding bonds issued by an
industry scaled by the value of output of that industry.24
These three measures of external reliance vary over time, and do not assume that
industry-specific technologies are constant. On the other hand, because these measures might
Similar to industries with larger firms
and higher incorporation rates, industries with higher ratios of bonds to output likely relied more
on external financing in general than other industries, but perhaps relatively less on banks
specifically. Hence, industries with high ratios of bonds to output may have been less sensitive to
the market structure or regulation of banks.
Zingales (1998), we created benchmark industry values for average firm size and percent incorporated using data for the United States as a whole rather than for individual states to minimize potential endogeneity. The main difference is that our data are from a single nation, so we use the national average rather than a single country as the benchmark. 24 We use industry-level bond data from Hickman (1960) and output (value of product) data from the Census of Manufactures to construct this metric (Further details are described in the Data Appendix). As with our other measures, we use national-level data to construct bonds/output and observations are at 10-year intervals corresponding to 1899, 1909, and 1919 values.

16
proxy for broader and somewhat less identifiable credit constraints than an accounting-based
measure, we also employ Rajan and Zingales (1998) well-known, accounting-based measures of
external financial dependence using data for the 1980s (since equivalent accounting data are
unavailable during our sample period).25 Our use of the Rajan-Zingales (RZ) measures assumes
that industry-specific technologies determining relative dependence on external financing are
constant across time within the United States whereas Rajan and Zingales (1998) assume that
they are identical across countries.26
While our four measures likely capture somewhat different aspects of industry-specific
traits that relate to firms’ needs for external finance, or the sources of external finance they draw
most heavily upon, the measures are nevertheless correlated with one another. Specifically, as
shown in Table IV, average establishment size, percent incorporated, and the bonds-to-output
ratio are strongly positively correlated with each other; percent incorporated is also positively
correlated with the Rajan-Zingales measure of external financial dependence. Furthermore, as
shown in Table IV, all four measures are negatively correlated with a measure of the share of
bank credit in total firm liabilities in 1949, the first year for which such data are available
(Goldsmith 1958, Table 63).
27
25 Rajan and Zingales (1998) construct two measures of the extent to which firms in different industries depend on external sources of investment funding—one based on all firms and one based only on young firms (i.e., firms listed for less than 10 years) because young firms may be more dependent on external funds than mature firms. We present results for the all firms measure, but those using young firms are similar throughout.
This suggests further that larger firms, incorporated firms, and
firms that had higher ratios of bonds to output, as well as firms that relied more heavily on
external financing in general as reflected in the Rajan-Zingales measure, relied relatively less
26 Neither assumption is ideal, though differences in legal systems, property rights, culture, etc. that might introduce problems of unobserved heterogeneity in cross-country studies, especially ones that include developing as well as developed countries, such as Rajan and Zingales (1998) and Cetorelli and Gambera (2001), are less likely to be important for our study of a single country. An underlying assumption in Rajan and Zingales (1998) is that cross-country differences in industry growth rates reflect differences in financial development rather than differences in technologies or other conditions. They base their estimates of external dependence on the difference between investment and cash generated from operations for U.S. firms to investigate the impact of financial development on the growth rates of different industries in all countries. In their model, observed differences in reliance on external financing across U.S. industries reflect fundamental differences in technologies rather than distortions caused by underdeveloped capital markets or other frictions. Rajan and Zingales (1998) report dependence estimates for industrial groups defined by modern International Standard Industrial Classification groups. See the Data Appendix for the mapping of our 18 sample industries into these groups. For purposes of estimation, we normalize the RZ measures to have a mean of zero and standard deviation of unity. Although it would be possible to construct period-based estimates of the Rajan and Zingales (1998) measure for some firms during our sample period, as in Giedeman (2005), the Rajan-Zingales measure requires balance sheet and income statement information that are available only for large publicly traded firms and would not be representative of most firms that comprise the industries in our data. 27 The values for average establishment size, percent incorporated, and bonds/output used to calculate the correlations in Table III are averages of data for 1899, 1909 and 1919.

17
heavily on banks for external financing than did other firms. Thus, our measures reflect both the
extent of reliance on external financing as well as relative reliance on bank versus non-bank
sources of external financing, and thereby provide a richer examination of how the structure of
state banking markets affected industries with different characteristics.
Given these definitions and assumptions, we can now test the hypothesis that
characteristics of the banking sector had a greater impact on the growth of industries that rely
more heavily on external financing and financing by banks. Columns 2-5 of Table III present
estimates of Equation 2 where the four measures of industry-based reliance on external finance
are interacted with the measure of banking market concentration. As was the case with our
estimates of Equation 1, we find that bank concentration exerted an overall positive and
statistically significant effect on manufacturing growth. The size of the effect is similar to the
estimate for Equation 1, suggesting roughly a 1.5 percentage point increase in average annual
manufacturing output growth when one moves from a state with a bank concentration ratio in the
25th percentile to one in the 75th percentile. The coefficient on concentration interacted with
reliance on external finance is negative in all four specifications, though statistically different
from zero in only one of the four cases (using the bonds to output ratio). A negative sign
suggests that firms that were more reliant on external financing, or with better access to capital
markets, benefitted less from concentrated banking systems. The effect is especially pronounced
for industries that relied heavily on the bond market, and thus less so on banks for external
financing. Based on the coefficient on the interaction of concentration with the bonds-to-output
ratio, an increase in concentration from the 25th to the 75th percentile of the distribution would
reduce the average growth rate of the steel industry, which had the highest average par value of
bonds outstanding relative to output, by 1.25 percentage points. Hence, the net impact of such an
increase in banking concentration on growth would range from an increase of 0.5 percentage
points for the steel industry to 1.5 percentage points for the knits and women’s clothing
industries, which had no bond financing.
IV. Testing for the Effects of Unit Banking and Banking Policies
Our initial specifications indicate that banking market concentration had a positive effect
on manufacturing output growth in general, with weaker evidence that the impact varied across
industries according to their reliance on external financing. This section explores whether
additional features of state banking markets that may have influenced the competitiveness of

18
those markets and the ability of firms to borrow from banks also affected industrial growth, and
provides a robustness check on our initial findings. In addition to market concentration, in this
section we estimate an empirical model that controls for differences in three state banking
policies as well as the number of banks per capita, which helps to define how pervasive unit
banking was in a particular state.
Restrictions on entry may have influenced the provision of funds to firms, especially
since lending is often localized (Petersen and Rajan, 2002; Bofondi and Gobbi, 2004; Lerner,
1995). We therefore include two regulations that restricted entry as additional covariates: branch
banking and minimum capital laws. Because the removal of branching restrictions in some states
in the first part of the twentieth century unleashed competitive changes in state banking markets,
we include the number of branch offices per commercial bank at the beginning of each decade as
a covariate in our regressions.28 Minimum capital requirements act as a barrier to entry, and thus
may have influenced the growth rate of industries by limiting bank competition. We include each
state’s minimum capital requirement as an additional covariate.29
Deposit insurance is a third policy that affected the structure and competitiveness of state
banking markets during the first decades of the twentieth century. Eight states established
insurance systems to protect bank depositors in the years following the Panic of 1907. Insurance
premiums were low and unrelated to failure risk, which appears to have encouraged entry and
expanded bank lending initially, but at the expense of increased banking instability during the
1920s (Alston, et al., 1994; Calomiris, 1992; Dehejia and Lleras-Muney, 2007; Wheelock,
1992a, b). We include an indicator variable set equal to unity for states with an active deposit
insurance system.
Minimum capital requirements
varied widely across states during our sample period. For example, in 1929, the minimum capital
required to obtain a bank charter ranged from $10,000 in several states to $100,000 in
Massachusetts.
30
28 Some studies examine the impact of branching using dummy variables indicating whether branching was permitted by law (e.g., Dehejia and Lleras-Muney, 2007). However, we use a continuous variable that captures the actual prevalence of branching within a state because branching was limited by custom or by bank supervisors in some states that did not prohibit branching by statute.
We also include the number of banks per capita to account for significant
differences in unit banking and market structure across states. Researchers have suggested that
29 Some states had several tiers of minimum charter capital based on the size of the municipality in which a bank was located. Here we use the state requirement for the smallest municipalities. 30 The eight state deposit insurance systems were all established between 1908 and 1919. For purposes of estimation, we treat each state as having had a deposit insurance system in 1909 and 1919.

19
the number of banks per capita reflects other aspects of the structure and competitiveness of
banking markets, particularly in an environment of geographic restrictions and high
transportation costs, which help explain the relative performance and stability of state and
national banking systems.31 Table V reports summary statistics for branch banking, minimum
capital requirements, and banks per capita.32
The four new covariates enter our estimation equation as direct influences on output
growth and indirectly via interaction terms to test whether bank regulations had a differential
effect on industries that relied more heavily on external financing in general, or on banks in
particular for their external financing.
33
(3) %∆Outputijt = α1 + α2Bank Concentrationjt−1 + α3External Relianceit−1
To the extent that regulations affect bank competition,
banks’ incentives to take risks, their scale, etc., they could have different effects on the growth of
industries that differ in terms of their dependence on banks for external financing. Our new
estimation equation is as follows:
+ α4(External Relianceit−1*Bank Concentrationjt−1) + α5(Minimum Capitaljt−1) + α6(External Relianceit−1*Minimum Capitaljt−1) + α7(Deposit Insurancejt−1) + α8(External Relianceit−1*Deposit Insurancejt−1) + α9(Branch Banksit−1) + α10(External Relianceit−1*Branch Banksjt−1) + α11(Banks per Capitajt−1) + α12(External Relianceit−1*Banks per Capitajt−1) + α13Industry Share of Output in Manufacturingijt−1 + γj + λt + ξi + εijt.
Table VI reports estimates of Equation 3. The results again indicate that banking market
concentration exerted a positive influence on output growth in general (with the effect being
similar in size to earlier regressions), even after accounting for differences in regulation across
states. The positive coefficients on concentration are roughly equivalent or slightly larger than
31 For example, Rajan and Ramcharan (2009) find that a higher number of banks per capita increased the supply of credit across U.S. counties in the 1920s and 1930s but also contributed to higher bank failure rates during the Great Depression (see also Grossman, 2010; and Wheelock, 1993). 32 Banks per capita and our four-bank concentration ratio are not strongly correlated; they have a correlation coefficient of −0.31 and hence capture somewhat different aspects of banking market structure. For our regressions we define banks per capita as the log of the number of commercial banks divided by state populations. 33 As with our other independent variables, we observe data on the policy variables and banks per capita at the beginning of each 10-year period over which we observe industry growth rates. The Data Appendix provides additional detail about these variables and data sources.

20
those reported in Table III, again indicating that banking market concentration had generally a
positive impact on industry growth rates. As in our earlier specifications, we find some evidence
that the impact of concentration was somewhat less for industries with larger-size
establishments, a higher percentage of incorporated establishments, higher bonds to output ratios,
or greater dependence on external financing, as reflected in the Rajan-Zingales measure;
however, only the coefficient on the interaction of concentration with the bonds/output measure
is statistically significant (column 3). On balance, the results suggest that industries that relied
more on capital markets for external financing benefited less from concentrated banking systems
than did industries that relied more on banks for external financing. This seems consistent with
the view that U.S. banking regulation and market structure encouraged the development of U.S.
capital markets but may have hampered the growth of large-scale American enterprise (e.g.,
Calomiris, 2000a; Chandler, 1990; Davis, 1966; Giedeman, 2005).
In three of the four regressions reported in Table VI, we find evidence that branch
banking boosted the growth rate of industries that relied most heavily on external financing.
Based on the coefficients reported in column 1 of Table VI, an increase in the prevalence of
branching from the 25th to the 75th percentile of the distribution would cause a change in average
industry growth ranging from −0.3 percentage points for the marble and stone industry (the
industry with the smallest average firm size) to +1.9 percentage points for the steel industry (the
industry with the largest average firm size). We also find that a higher number of banks per
capita boosted the growth of industries that relied more heavily on external financing. These
results indicate that both more widespread branch banking and more banks per capita boosted
economic growth, especially for industries that relied more heavily on external financing. They
are also consistent with the view that relaxation of branching restrictions eased financing
constraints by enabling banks to expand their geographical reach as well as their size, and that
the effect was especially pronounced for industries with larger firms (Davis, 1966; Calomiris,
2000a; Giedeman, 2005).34
34 When we included average bank size as an additional control variable the coefficients on banking concentration were not qualitatively different from those reported here. Results are available from the authors on request.
In addition, for given levels of concentration and branching, an
increase in banks per capita appears to have spurred growth, perhaps by increasing the supply of
credit (Rajan and Ramcharan, 2009), which again benefited industries that relied relatively more
on external financing.

21
Deposit insurance is another policy that appears to have affected the growth of
manufacturing output. The coefficient estimate reported in Column (1) indicates that the
presence of a state deposit insurance system reduced average annual manufacturing sector
growth by approximately 4 percentage points. We find no evidence that the impact of deposit
insurance varied according to an industry’s reliance on external financing. As noted previously,
several studies have found that deposit insurance contributed to instability in state banking
markets during the 1910s and 1920s. Our results suggest that this instability had a detrimental
impact on growth in the manufacturing sector in the states that established insurance systems.35
V. Alternative Specifications and Robustness Checks
Further evidence of the effects of banking market structure and regulation on U.S.
manufacturing output growth is presented in Tables VII and VIII. First, we test whether the
impact of bank concentration differed in the South than in the rest of the United States. We
include a dummy variable for southern states interacted with concentration in specifications
similar to those reported in Table VI. As shown in Table VII, the coefficient on the South
intercept dummy is positive and statistically significant, indicating that, in general,
manufacturing industries grew faster in southern states than in the rest of the country. The
coefficient on the interaction of the South dummy with concentration is negative and fairly large,
suggesting that bank market concentration had a weaker impact on growth in the South.
However, the coefficient on the interaction term is not statistically significant and, thus, we
cannot reject the hypothesis that the impact of concentration was similar in the South as in the
rest of the country.36
Next, we explore further whether the impact of banking market concentration differed
across industries. Rather than specifying a model with interaction terms to test for differences
across industries, we instead estimated separate regressions for groups of industries characterized
by either low or high average establishment size, percent of incorporated establishments, levels
of bonds outstanding to total output, or Rajan-Zingales’ measure of dependence on external
35 Dehejia and Lleras-Muney (2007) find that deposit insurance had a positive impact on bank loan growth and manufacturing value added before 1920 and a negative impact after 1920, though the effects on loan growth and value added before 1920 are not statistically significant in a model that includes other time-varying controls. We replaced the deposit insurance variable in Equation 3 with separate variables to test whether the impact of deposit insurance on output growth differed between the decades of the 1910s and 1920s. We were unable to reject the hypothesis that the coefficients on the deposit insurance variables for the two decades are equal. 36 We found similar results in regressions that exclude the policy variables and banks per capita. Results are available from the authors on request.

22
financing.37
VI. Conclusion
Table VIII reports estimation results for industries in the lowest and highest one-
third of industries for each characteristic. The estimates indicate that bank market concentration
had a larger impact on industries characterized by smaller average size establishments and low
incorporation rates. Such industries would generally be more dependent on banks for external
financing and, hence, affected by the structure and regulation of banking markets. However, we
find no significant differences in the effect of banking concentration between industries grouped
by either bonds/output or the Rajan-Zingales measure.
The first three decades of the twentieth century witnessed both rapid growth of the U.S.
manufacturing sector and numerous changes in state banking policies and market structures. Our
research finds that banking market concentration generally exerted a positive influence on the
growth of U.S. manufacturing industries in this period. This result appears robust to alternative
measures of growth, reliance on external and bank finance, and to the inclusion of additional
characteristics of banking market structure and policy, which differed significantly across states.
We also find some evidence that the impact of banking market concentration on growth
was smaller for industries with larger firms, higher percentages of incorporated firms, and firms
that relied relatively heavily on bond markets for external funding. Industries with smaller firms
or less (or more costly) access to capital markets relied relatively more on banks for external
financing and thus were more directly affected by the concentration of banking markets.
Industries with larger amounts of bond financing, by contrast, benefited less from banking
concentration.
In addition, we find evidence that other banking system characteristics affected economic
growth. For a given level of concentration, both higher numbers of banks per capita and more
branch banking boosted output growth among industries whose firms relied relatively heavily on
external financing or tended to have larger establishments (or, in the case of banks per capita, a
higher percentage of incorporated firms). Thus, our results are consistent with Rajan and
Ramcharan (2009), who find that an increase in the number of banks per capita increases the
supply of credit in local banking markets, as well as with the many studies finding that the
37 We constructed “high” and “low” groups for each dependence measure. For average establishment size and percent of establishments in incorporated firms, groupings include the six industries with the highest (lowest) values of the financial dependence measure for 1899, 1909, and 1919. In the case of bonds/output, however, we included nine industries in the “low” group for 1899 because none had outstanding bonds in that year.
23
removal of state restrictions on branching in the 1980s and 1990s increased credit supply and
boosted economic growth (e.g., Jayaratne and Strahan, 1996). Our study also suggests that
deposit insurance may have retarded the growth of manufacturing output in general, a finding
consistent with prior research showing that deposit insurance contributed to instability in state
banking systems.
Our research thus contributes to a growing literature demonstrating that the structure and
regulation of banking markets can affect economic growth. In particular, we find that the
relationship between the concentration of national banking markets and industrial growth in
countries whose banking systems are dominated by large banks with nationwide branch networks
does not reflect the U.S. experience of unit banking. Although the removal of legal barriers to
branching in the 1980s and 1990s promoted consolidation within the U.S. banking industry and
the integration of formerly distant banking markets, the evidence presented here illustrates how
the institutions that determine the competitive landscape of banking markets can affect economic
growth.

24
References Allen, Franklin, 1990. “The Market for Information and the Origin of Financial Intermediaries.”
Journal of Financial Intermediation 1, 3-30.
Alston, Lee J.; Wayne A. Grove, and David C. Wheelock, 1994. “Why Do Banks Fail? Evidence from the 1920s.” Explorations in Economic History 31(4), 409-31.
Barth, James R., Gerard Caprio, and Ross Levine, 2001. “The Regulation and Supervision of Banks around the World: A New Database,” in Brookings-Wharton Papers on Financial Services, edited by Robert E. Litan and Richard Herring, pp. 183-240. Washington, DC: Brookings Institution Press.
Barth, James R., Gerard Caprio, and Ross Levine, 2004. “Bank Regulation and Supervision: What Works Best?” Journal of Financial Intermediation 13(2), 205-48.
Beck, Thorsten, Ross Levine, and Norman Loayza, 2000. “Finance and the Sources of Growth.” Journal of Financial Economics 58(1-2), 261–300.
Bekaert, Geert; Harvey Campbell R., and Christian Lundblad, 2005. “Does Financial Liberalization Spur Growth?” Journal of Financial Economics 77, 3-55.
Berger, Allen N. 2010. “Small Business Lending,” in The Oxford Handbook of Banking, edited by Allen N. Berger, Philip Molyneux, and John O.S. Wilson, pp. 531-64. Oxford: Oxford University Press.
Black, Sandra E. and Philip E. Strahan, 2002. “Entrepreneurship and Bank Credit Availability.” Journal of Finance 57(6), 2807-32.
Board of Governors of the Federal Reserve System, 1959. All Bank Statistics, United States, 1896-1955. Washington, DC.
Board of Governors of the Federal Reserve System, 1943. Banking and Monetary Statistics, 1914-41. Washington, DC.
Bonaccorsi di Patti, Emilia and Giovanni Dell’Ariccia, 2004. “Bank Competition and Firm Creation.” Journal of Money, Credit, and Banking 36(2), 225-52.
Bofondi, Marcello and Giorgio Gobbi, 2004. “Bad Loans and Entry into Local Credit Markets.”Temi di discussione (Economic working papers) 509, Bank of Italy, Economic ResearchDepartment.
Boot, Arnoud W. A., 2000. “Relationship Banking: What Do We Know?” Journal of Financial Intermediation 9, 7-25.
Boyd, John H. and Edward C. Prescott, 1986. “Financial Intermediary-Coalitions.” Journal of Economics Theory 38(April), 211-32.
25
Calomiris, Charles W. 2000a. “The Costs of Rejecting Universal Banking: American Finance in the German Mirror,” in Naomi Lamoreaux and Daniel Raff, eds., The Coordination of Activity Within and Between Firms. Chicago, University of Chicago Press, 1995. Reprinted in Calomiris, Charles W., U.S. Banking Deregulation in Historical Perspective. Cambridge: Cambridge University Press, 212-79.
Calomiris, Charles W. 2000b. “Regulation, Industrial Structure, and Instability in U.S. Banking:
An Historical Perspective,” in Michael Klausner and Lawrence J. White, eds., Structural Change in Banking. Business-One Irwin, 1993. Reprinted in Calomiris, Charles W., Banking Deregulation in Historical Perspective. Cambridge: Cambridge University Press, 1-92.
Calomiris, Charles W., 1992. “Do Vulnerable Economies Need Deposit Insurance? Lessons from U.S. Agriculture in the 1920s,” in If Texas Were Chile, A Primer on Banking Reform, edited by Philip L. Brock. San Francisco: Institute for Contemporary Studies, 237-314.
Carlson, Mark A. and Kris James Mitchener, 2006. “Branch Banking and Financial Stability.” Journal of Money, Credit, and Banking 38(5), 1293-1328.
Cetorelli, Nicola and Michelle Gambera, 2001. “Banking Market Structure, Financial Dependence, and Growth: International Evidence from Industry Data.” Journal of Finance 106(2), 617-48.
Cetorelli, Nicola and Philip E. Strahan, 2006. “Finance as a Barrier to Entry: Bank Competition and Industry Structure in Local U.S. Markets.” Journal of Finance 61(1), 437-61.
Chandler, Alfred D. 1990. Scale and Scope: The Dynamics of Industrial Capitalism. Cambrdige: Harvard University Press.
Claessens, Stijn and Luc Laeven, 2005. “Financial Dependence, Banking Sector Competition, and Economic Growth.” Journal of the European Economic Association 3(1), 179-207.
Claessens, Stijn and Luc Laeven, 2004. “What Drives Bank Competition? Some International Evidence.” Journal of Money, Credit, and Banking 36(3), 563-84.
Davis, Lance, 1966. “The Capital Markets and Industrial Concentration: The U.S. and U.K., a Comparative Study.” The Economic History Review, n.s., 19(2), pp. 255-72.
Dehejia, Rajeev and Adriana Lleras-Muney, 2007. “Financial Development and Pathways of Growth: State Branching and Deposit Insurance Laws in the United States, 1900-1940.” Journal of Law and Economics 50(May), 239-72.
Demirgüç-Kunt, Asli, Luc Laeven, and Ross Levine, 2004. “Regulations, Market Structure, Institutions, and the Cost of Financial Intermediation.” Journal of Money, Credit, and Banking 36(3 Pt 2), 593-622.

26
Demirgüç-Kunt, Asli and Ross Levine, 2001. Financial Structure and Economic Growth: A Cross-Country Comparison of Banks, Markets, and Development. Cambridge, MA: MIT Press.
Federal Deposit Insurance Corporation, 1956. Annual Report for 1956. Washington, DC: U.S. Government Printing Office.
Freeman, Donald G., 2002. “Did State Bank Branching Deregulation Produce Large Growth Effects? Economics Letters 75(3), 383-89.
Garrett, Thomas A., Gary A. Wagner, and David C. Wheelock, 2007, “Regional Disparities in the Spatial Correlation of State Income Growth, 1977-2002.” Annals of Regional Science 41(3), 601-18.
Giedeman, Daniel C., 2005. “Branch Banking Restrictions and Finance Constraints in Early-Twentieth-Century America.” Journal of Economic History 65(1), 129-51.
Goldsmith, Raymond W., 1969. Financial Structure and Development, New Haven: Yale University Press.
Goldsmith, Raymond W., 1958. Financial Intermediaries in the American Economy Since 1900. Princeton: Princeton University Press.
Gordon, Robert J., 2000. Macroeconomics. Reading, MA: Addison-Wesley.
Greenwood, Jeremy and Boyan Jovanovic, 1990. “Financial Development, Growth, and the Distribution of Income.” Journal of Political Economy 98(5), 1076-1107.
Grossman, Richard S., 2010. Unsettled Account: The Evolution of Banking in the Industrialized World Since 1800. Princeton: Princeton University Press.
Guiso, Luigi., Paula Sapienza, and Luigi Zingales, 2004. “Does Local Financial Development Matter?” Quarterly Journal of Economics, 119(3), 929-969.
Gurley, John G. and Edward S. Shaw, 1955. “Financial Aspects of Economic Development.” American Economic Review 45(September), 515-38.
Hickman, W. Braddock, 1960. Statistical Measures of Corporate Bond Financing Since 1900. Princeton: Princeton University Press.
Hoxha, Indrit, 2009. “Big Banks versus Small Banks: Good or Bad for Industries?” University of Houston working paper.
Jacoby, Neil H. and Raymond J. Saulnier, 1947. Business Finance and Banking. New York: National Bureau of Economic Research.
Jayaratne, Jith and Philip E. Strahan, 1996. “The Finance-Growth Nexus: Evidence from Bank Branch Deregulation.” Quarterly Journal of Economics 111(3), 639-70.

27
Kashyap, Anil K., Raguram G. Rajan, and Jeremy C. Stein, 2002. “Banks as Liquidity Providers: An Explanation for the Co-existence of Lending and Deposit-Taking.” Journal of Finance 57(1), 33-73.
Keay, Ian and Angela Redish, 2004. “The Mirco-Economic Effects of Financial Market Structure: Evidence from 20th Century North American Steel Firms.” Explorations in Economic History 41, 377-403.
King, Robert G. and Ross Levine, 1993a. “Financial Intermediation and Economic Development,” in Capital Market and Financial Intermediation, edited by C. Mayer and X. Vives. New York: Cambridge University Press, 156-96.
King, Robert G. and Ross Levine, 1993b. “Finance and Growth: Schumpeter Might Be Right.” Quarterly Journal of Economics 108, 717-38.
La Porta, Rafael, Florencia López de Silanes, Andrei Shleifer, and Robert W. Vishny, 2000. “Investor Protection and Corporate Governance.” Journal of Financial Economics 58(1-2), 3-27.
La Porta, Rafael, Florencia López de Silanes, Andrei Shleifer, and Robert W. Vishny, 1998. “Law and Finance.” Journal of Political Economy 106(6), 1113-55.
Lerner, Josh, 1995. “Venture Capitalists and the Oversight of Private Firms.” Journal of Finance 50(1), 301-18.
Levine, Ross, 1997. “Financial Development and Economic Growth: Views and Agenda.” Journal of Economic Literature 35(June), 688-726.
Levine, Ross, 2006.“Finance and Growth: Theory, Evidence, and Mechanisms,” in Handbook of Economic Growth, edited by P. Aghion and S. Durlauf. Amsterdam: Elsevier/North-Holland.
Levine, Ross and Sara Zervos, 1998. “Stock Markets, Banks, and Economic Growth.” American Economic Review, 88(3), 537-58.
Marquez, Robert, 2002. “Competition, Adverse Selection, and Information Dispersion in the Banking Industry.” Review of Financial Studies 15(3), 901-26.
Masten, Arjana B., Fabrizio Coricelli, and Igor Masten, 2008. “Non-Linear Growth Effects of Financial Development: Does Financial Integration Matter?” Journal of International Money and Finance 27(2), 295-313.
Mayer, Colin, 1988. “New Issues in Corporate Finance.” European Economic Review 32(5),
Petersen, Mitchell A. and Raghuram G. Rajan, 1995, “The Effect of Credit Market Competition on Lending Relationships.” Quarterly Journal of Economics 110(2), 407-43.
Petersen, Mitchell A. and Raghuram G. Rajan, 2002. “Does Distance Still Matter? The Information Revolution in Small Business Lending.” Journal of Finance 57(6), 2533-70.
28
Polk’s Bankers Encyclopedia Co. Polk’s Bankers Encyclopedia (various issues).
Raddatz, Claudio, 2006. “Liquidity Needs and Vulnerability to Financial Underdevelopment.” Journal of Financial Economics 80(3), 677-722.
Rajan, Raghuram G. and Rodney Ramcharan, 2009. “Land and Credit: A Study of the Political Economy of Banking in the United States in the Early 20th Century.” NBER Working paper no. 15083.
Rajan, Raghuram G. and Luigi Zinagales, 1998. “Financial Dependence and Growth.” American Economic Review 88(3), 559-86.
Rousseau, Peter L. and Richard Sylla, 2005. “Emerging Financial Markets and Early US Growth.” Explorations in Economic History 42(1), 1-26.
Rousseau, Peter and Paul Wachtel, 1998. “Financial Intermediation and Economic Performance: Historical Evidence from Five Industrialized Countries.” Journal of Money, Credit, and Banking 30(4), 657-78.
Securities and Exchange Commission, 1940. A Study of the Capital and Credit Needs of the Smaller Units of Business Enterprise (two volumes). A Report by the Investment Banking Section of the Securities and Exchange Commission to the Temporary National Economic Committee. Washington, DC.
Wachtel, Paul and Peter Rousseau, 1995. “Financial Intermediation and Economic Growth: A Historical Comparison of the United States, United Kingdom, and Canada,” in Anglo-American Financial Systems: Institutions and Markets in the Twentieth Century, edited by Michael D. Bordo and Richard Sylla. New York: Irwin, 329-81.
Wheelock, David C., 1993. “Government Policy and Banking Market Structure in the 1920s.” Journal of Economic History 53(4), 857-79.
Wheelock, David C., 1992a. “Deposit Insurance and Bank Failures: New Evidence from the 1920s.” Economic Inquiry 30(July), 530-43.
Wheelock, David C., 1992b. “Regulation and Bank Failures: New Evidence from the Agricultural Collapse of the 1920s.” Journal of Economic History 52(4), 806-25.
White, Eugene N., 1997. “Deposit Insurance,” in Reforming Financial Systems: Historical Implications for Policy, edited by Gerard Caprio, Jr. and Dimitri Vittas. Cambridge: Cambridge University Press, 85-100.
White, Eugene N., 1985a. “The Merger Movement in Banking, 1919-1933.” Journal of Economic History 45(2), June, 285-91.
White, Eugene Nelson. 1985b. “Voting for Costly Regulation: Evidence from Banking Referenda in Illinois, 1924.” Southern Economic Journal 51 (no. 4), 1084-98.

29
White, Eugene N., 1983. The Regulation and Reform of the American Banking System, 1900-1929. Princeton, NJ: Princeton University Press.

Table I: Annualized Growth Rate of Inflation-Adjusted Output for Sample Industries
Industry 1899 to 1909 1909 to 1919 1919 to 1929 1899 to 1929 Cotton 4.43% 5.76% -2.72% 2.49% Lumber 2.45% -0.81% -0.14% 0.50% Iron/Steel 3.28% 3.93% 2.11% 3.10% Cars, general repair, steam railroad 4.47% 4.87% -0.40% 2.98% Electric Machinery 7.00% 8.44% 8.73% 8.06% Motor Vehicle Assembly 37.87% 18.53% 5.73% 20.71% Auto Parts 18.64% 8.36% Knit Goods 5.63% 6.09% 2.70% 4.80% Boots and Shoes 3.96% 3.28% -1.38% 1.95% Baking 6.43% 4.04% 3.19% 4.55% Furniture 3.89% 2.52% 7.01% 4.47% Women's Clothes 7.08% 4.83% 3.84% 5.25% Printing and Publishing 4.51% 1.74% 6.15% 4.13% Silk/Rayon Goods 4.34% 5.90% 0.97% 3.74% Meatpacking 3.68% 4.80% -1.75% 2.25% Tobacco 2.84% 2.27% 2.44% 2.52% Woolen Goods 3.59% 3.52% -2.61% 1.50% Marble/Stone 4.10% -1.67% 4.04% 2.15% Mean 6.44% 5.37% 2.57% 4.42% Standard Deviation 8.21 5.37 3.65 4.55
Sources: Thirteenth Census of the United States, Manufacturers, Volume IX (1899-1909); Fourteenth Census of the United States, Manufacturers, Volume IX and X (1919); Fifteenth Census of the United States, Manufacturers, Volume II (1929).

Table II: Commercial Bank Four-Firm Concentration Ratio
Level of Bank Concentration 1899 1909 1919 1929 Mean 0.2673 0.2244 0.2063 0.2912 Median 0.2084 0.2057 0.1811 0.2629 Min 0.0908 0.0624 0.0620 0.0861 Max 0.6028 0.7267 0.6976 0.8190 Std Dev 0.1420 0.1222 0.1205 0.1502
Changes in Bank Concentration 1899-1909 1909-1919 1919-1929 Mean -0.0429 -0.0181 0.0850 Median -0.0397 -0.0083 0.0701 Min -0.2837 -0.1616 -0.1016 Max 0.1818 0.1087 0.2996 Std Dev 0.08 0.05 0.09
Source: Polk’s Bankers Encyclopedia (various issues) for data on deposits for individual banks; Board of Governors of the Federal Reserve System (1959) for data on deposits for states.

Table III: The Effects of Bank Concentration on Output Growth Across Manufacturing Industries Independent Variable (1) (2) (3) (4) (5) Bank Concentration 0.1204** 0.1218** 0.1607*** 0.1361*** 0.1195** (0.0493) (0.0502) (0.0511) (0.0511) (0.0490) Bank Concentration x External Reliance -0.0082 -0.0663 -0.3807** -0.0146 (0.0353) (0.0413) (0.1729) (0.0141) External Reliance 0.0016 0.0722*** 0.063 (0.0186) (0.0182) (0.0459) Industry Share of Output -0.0277 -0.0282 -0.0153 -0.0274 -0.027 (0.0210) (0.0212) (0.0189) (0.0211) (0.0209) R2 0.3714 0.3714 0.3608 0.3736 0.3719 Number of Observations 1378 1378 1368 1378 1378 Notes: The regression in column (1) corresponds to Equation 1 in the text; those in Columns (2) to (5) correspond to Equation 2. The measures of external reliance used to produce the results in columns (2)-(5) are, respectively, average establishment size, percentage of establishments incorporated, bonds outstanding divided by total output, and the Rajan-Zingales measure of external dependence for all firms. All regressions include a constant term and state, industry and year fixed effects. Standard errors (in parentheses) are clustered by state and industry. * indicates significance at the 10 percent level, ** significance at the 5 percent level, *** significance at the 1 percent level

Table IV. Correlations Among Measures of Reliance on External Finance and Bank Credit Average
Establishment Size
Percent Incorporated
Bonds/Output
Rajan-Zingales
Bank Credit Share in 1949
Average Establishment Size
1.0
Percent Incorporated
0.51 (0.03)
1.0
Bonds/Output 0.52
(0.03) 0.48
(0.04) 1.0
Rajan-Zingales
-0.03 (0.91)
0.42 (0.08)
0.16 (0.52)
1.0
Bank Credit Share in 1949
-0.31 (0.21)
-0.49 (0.04)
-0.45 (0.06)
-0.64 (0.00)
1.0
Notes: This table reports correlations and associated p-values (in parentheses) among alternative measures of reliance on external finance and bank credit. Values for average firm size, percent incorporated, and bonds/output are averages of data for 1899, 1909, and 1919. Rajan-Zingales refers to the Rajan-Zingales (1998) measure of external financial dependence for all firms. Sources: Thirteenth, Fourteenth, and Fifteenth Censuses of the United States, Manufacturers (average establishment size, percent incorporated and output); Hickman (1960, Table 44) (par value of bonds outstanding); Goldsmith (1958, Table 63) (bank credit share in 1949).

Table V: Summary Statistics for Minimum Capital Requirements, Branch Banking, and Number of
Banks per Capita
Minimum Capital Requirements ($000s) 1899 1909 1919 1929 Mean 19.27 18.23 19.00 22.19 Median 15.00 10.00 15.00 25.00 Min 0.00 0.00 2.00 10.00 Max 100.00 100.00 100.00 100.00 Std. Dev. 18.16 15.77 16.13 14.40
Branch Banking (branches per bank) 1899 1909 1919 1929 Mean 0.02 0.04 0.07 0.20 Median 0.00 0.01 0.01 0.01 Min 0.00 0.00 0.00 0.00 Max 0.13 0.32 0.42 2.00 Std. Dev. 0.04 0.07 0.11 0.38 Number of Banks per Capita (banks per 1000 persons) 1899 1909 1919 1929 Mean 0.18 0.32 0.36 0.23 Median 0.16 0.25 0.27 0.19 Min 0.06 0.04 0.04 0.03 Max 0.51 1.16 1.39 0.58 Std. Dev. 0.12 0.23 0.28 0.14
Notes: Minimum Capital Requirements refers to the minimum dollar amount of paid-in capital required to obtain a bank charter in the smallest municipality in a given state in a given year. Branch Banking is the ratio of the total number of bank branch offices to total commercial banks. Banks per capita is the number of commercial banks per 1000 persons. Sources: White (1983, Table 1.3) (minimum capital requirements, 1899-1909); Polk’s Bankers Encyclopedia (minimum capital requirements, 1919); Board of Governors of the Federal Reserve System (1943, Table 74) (branch banking laws); Board of Governors of the Federal Reserve System (1959) (number of banks).

Table VI: The Effects of Bank Concentration and Banking Policy on Output Growth Independent Variable (1) (2) (3) (4) Bank Concentration 0.1423*** 0.1686*** 0.1559*** 0.1380*** (0.0518) (0.0556) (0.0530) (0.0509) Bank Concentration x External Reliance -0.0307 -0.053 -0.6130*** 0.0012 (0.0400) (0.0417) (0.1961) (0.0168) Minimum Capital Requirement -0.0935 -0.0785 -0.1216 -0.0861 (0.2865) (0.2749) (0.2879) (0.2810) Minimum Capital x External Reliance 0.0875 -0.0513 1.1639 0.038 (0.2096) (0.2408) (0.7411) (0.0850) Branch Banking -0.0630* -0.0716* -0.0489 -0.024 (0.0362) (0.0398) (0.0360) (0.0362) Branch Banking x External Reliance 0.1799*** 0.1018 1.1527*** 0.0417* (0.0539) (0.0640) (0.4107) (0.0253) Deposit Insurance -0.0426*** -0.0497*** -0.0381*** -0.0415*** (0.0107) (0.0127) (0.0100) (0.0093) Deposit Insurance x External Reliance -0.0133 0.0069 -0.1593** 0.0135 (0.0108) (0.0161) (0.0773) (0.0094) Banks Per Capita 0.2561 -0.3272 0.5134 0.9515 (0.8272) (0.8748) (0.8357) (0.8224) Banks Per Capita x External Reliance 3.1002*** 2.1061*** 12.6710*** 1.4853*** (0.7316) (0.7337) (3.9277) (0.4048) External Reliance 0.0079 0.0922*** 0.2677*** (0.0185) (0.0211) (0.0730) Industry Share of Output -0.032 -0.0147 -0.024 -0.031 (0.0225) (0.0188) (0.0203) (0.0204) R2 0.3874 0.3753 0.3875 0.3979 Number of Observations 1378 1368 1378 1378 Notes: The regressions in columns (1)-(4) correspond to Equation 3 in the text. The measures of external reliance used to produce the results in columns (1)-(4) are, respectively, average establishment size, percentage of establishments incorporated, bonds outstanding divided by total output, and the Rajan-Zingales measure of external dependence for all firms. All regressions include a constant term and state, industry and year fixed effects. Standard errors (in parentheses) are clustered by state and industry. * indicates significance at the 10 percent level, ** significance at the 5 percent level, *** significance at the 1 percent level.

Table VII : Output Growth Regressions: Was the South Different? Independent Variable (1) (2) (3) (4) Bank Concentration 0.1519*** 0.1778*** 0.1651*** 0.1471*** (0.0532) (0.0571) (0.0544) (0.0523) Bank Concentration x External Reliance -0.0291 -0.0525 -0.6142*** 0.0009 (0.0397) (0.0417) (0.1961) (0.0168) Minimum Capital Requirement -0.061 -0.047 -0.0902 -0.0547 (0.2882) (0.2755) (0.2896) (0.2828) Minimum Capital x External Reliance 0.0929 -0.0481 1.162 0.0386 (0.2106) (0.2409) (0.7406) (0.0851) Branch Banking -0.0641* -0.0723* -0.0498 -0.0249 (0.0363) (0.0399) (0.0361) (0.0362) Branch Banking x External Reliance 0.1804*** 0.1013 1.1524*** 0.0419* (0.0542) (0.0642) (0.4106) (0.0253) Deposit Insurance -0.0422*** -0.0491*** -0.0378*** -0.0412*** (0.0107) (0.0126) (0.0100) (0.0093) Deposit Insurance x External Reliance -0.0135 0.0063 -0.1594** 0.0133 (0.0108) (0.0161) (0.0773) (0.0094) Banks Per Capita 0.1153 -0.4699 0.3853 0.8264 (0.8345) (0.8795) (0.8463) (0.8329) Banks Per Capita x External Reliance 3.1377*** 2.1443*** 12.7456*** 1.4943*** (0.7312) (0.7261) (3.9310) (0.4037) External Reliance 0.0077 0.0929*** 0.2690*** (0.0184) (0.0210) (0.0730) Industry Share of Output -0.032 -0.0148 -0.024 -0.031 (0.0225) (0.0188) (0.0203) (0.0204) South Region 0.0697*** 0.0726*** 0.0704*** 0.0709*** (0.0268) (0.0270) (0.0265) (0.0266) South Region x Bank Concentration -0.1149 -0.1108 -0.1077 -0.1075 (0.1036) (0.1010) (0.1039) (0.1017) R2 0.3879 0.3758 0.388 0.3984 Number of Observations 1378 1368 1378 1378 Notes: The regressions in columns (1)-(4) correspond to Equation 3 in the text. The measures of external reliance used to produce the results in columns (1)-(4) are, respectively, average establishment size, percentage of establishments incorporated, bonds outstanding divided by total output, and the Rajan-Zingales measure of external dependence for all firms. All regressions include a constant term and state, industry and year fixed effects. Standard errors (in parentheses) are clustered by state and industry. * indicates significance at the 10 percent level, ** significance at the 5 percent level, *** significance at the 1 percent level

Table VIII: Output Growth Regressions for Industry Groups
Lowest Third for Highest Third for
Average Firm
Size Percent
Incorporated Bonds-to-
Output R-Z All Firms Average Firm
Size Percent
Incorporated Bonds-to-
Output R-Z All Firms
Bank Concentration 0.2001*** 0.2027*** 0.0954 0.1535 0.075 0.1160** 0.0726 0.162 (0.0617) (0.0613) (0.0892) (0.1587) (0.0673) (0.0563) (0.0558) (0.2204) Minimum Capital Requirements -0.392 -0.2418 0.3069 0.518 0.1071 -0.2427 0.0104 -0.7258 (0.2486) (0.2694) (0.5926) (0.6665) (0.3794) (0.3834) (0.3572) (0.7642) Branch Banking -0.0182 -0.0335 -0.0656 -0.0218 0.0655 -0.0268 0.0437 -0.0787 (0.0425) (0.0462) (0.0609) (0.0837) (0.0803) (0.0769) (0.0666) (0.1519) Deposit Insurance -0.0507*** -0.0451*** -0.0173 -0.0571** -0.0358*** -0.0274** -0.0451*** -0.0157 (0.0121) (0.0130) (0.0145) (0.0229) (0.0125) (0.0137) (0.0160) (0.0265) Banks Per Capita 0.5271 -0.2116 1.1307 -0.3147 1.6214 -0.692 1.4371 3.6232 (0.9607) (1.0014) (1.3535) (1.5242) (1.6661) (1.4669) (1.4979) (2.7484) Industry Share of Output 0.0538* 0.0324 -0.1641*** 0.0552 -0.0322 0.0307 0.0435 -0.1292 (0.0301) (0.0298) (0.0476) (0.0651) (0.0268) (0.0322) (0.0394) (0.1199) R-Squared 0.4933 0.512 0.4135 0.3625 0.5095 0.5253 0.5019 0.5572 Number of Observations 687 649 495 438 388 395 428 232 Notes: The regressions in each column were run on a sample of a select group of industries that were in the lowest or highest third of dependence in each cross-sectional period. All regressions include a constant term and state, industry and year fixed effects. Standard errors (in parentheses) are clustered by state and industry. * indicates significance at the 10 percent level, ** significance at the 5 percent level, *** significance at the 1 percent level

Data Appendix Census of Manufacturers State-level data on output, value added, employment and number of establishments for various industries are from the Censuses of Manufacturers for 1899, 1909, 1919, and 1929. We identified the 20 largest industries in terms of employment for the United States as a whole in both 1899 and 1929 from the Census of Manufacturers for 1929, Vol. 2, Table 6, p. 34. We subsequently determined that we could obtain reasonably consistent state-level data for 1899, 1909, 1919, and 1929 for the following 18 industries or industry groups: 1. Cotton goods (including “cotton small wares”) 2. Lumber and timber products (including “planning mill products” and “boxes-wooden packing”) 3. Iron and steel works and mills 4. Cars, general construction and repair, steam railroad 5. Electrical machinery (apparatus and supplies) 6. Motor vehicles and motor vehicle bodies and parts 7. Motor vehicle bodies and parts only 8. Knit goods 9. Boots and shoes (including “cut stock” and “findings”) 10. Bread and bakeries 11. Furniture (including refrigerators) 12. Clothing, women’s 13. Printing and publishing (including book and job, newspaper, music publishing, bookbinding, engraving-steel and copperplate, and lithography) 14. Silk and rayon 15. Meat packing (including “sausage not prepared in slaughtering or meat-packing establishments”) 16. Tobacco products (including cigars and cigarettes and other tobacco products). 17. Woolen manufacturers (including woolen goods, worsted goods, carpets and rugs (other than rag), felt goods, and wool hats). 18. Masonry, brick and stone (including brick and tile, marble, granite, slate and other stone products and stone work, and clay products) State-level data for 1919 and 1929 aggregated across all industries, and U.S. aggregated data for individual industries are from the Census of Manufacturers for 1929, Volume 2. We adjusted the data reported for 1919 to exclude data for automobile repair shops, which are not included in the published data for 1899, 1909 or 1929. State-level data for 1899 and 1909 aggregated across all industries, and U.S. aggregated data for individual industries, are from the Census of Manufacturers for 1919, Volume 8, Tables 48 and 49. Reliance on External Financing Average size of establishments: Data on total output (value of produce) and number of establishments for 1899, 1909, and 1919 by industry from various volumes of the Census of Manufacturing.

Percentage of establishments operated by incorporated firms: Data for 1899, 1909, and 1919 by industry from various volumes of the Census of Manufacturing. Bonds outstanding divided by total output: Data on the par value of bonds outstanding by industry from Hickman (1960), Table 44. Data on total output (value of product) by industry are from the Census of Manufacturing. The following table shows our mapping of the industrial groups reported in Hickman (1960) to the groups represented in our data. Hickman Industry Corresponding Sample Industry textiles cotton goods lumber/timber products lumber/timber products iron/steel iron/steel transportation equipment railroad cars electrical machinery electrical machinery autos motor vehicles and parts apparel knit goods leather boots/shoes food bread/bakeries furniture furniture apparel clothing, womens printing/publishing printing/publishing textiles silk/rayon food meat packing tobacco tobacco textiles woolen mfg. stone/clay/glass masory/brick/stone Rajan and Zingales (1998) measure: We use the “all companies” and “young firms” measures of external dependence reported in Rajan and Zingales (1998) for different industrial groups. The following table shows our mapping of the industrial groups reported in Rajan and Zingales (1998) to the groups represented in our data. Rajan-Zingales Industry Corresponding Sample Industry textiles cotton goods wood products lumber/timber products iron/steel iron/steel transportation equipment railroad cars electrical machinery electrical machinery motor vehicles motor vehicles apparel knit goods footwear boots/shoes food products bread/bakeries furniture furniture apparel women’s clothing printing/publishing printing publishing textiles silk/rayon and woolen goods food products meat packing tobacco tobacco other non-metallic mineral products masonry/stone
Banking Data Concentration: For each state, we constructed ratios of the deposits in the four largest commercial banks to deposits in all commercial banks for 1900, 1910, and1919 using data in Polk’s Bankers Encyclopedia. Total deposits in all banks and all commercial banks are from All Bank Statistics, 1896-1955 (Board of Governors of the Federal Reserve System, 1959). Regulations: Branch banking restrictions: For each state, we computed the ratio of bank branches to total banks (total commercial banks) and the ratio of branches outside the head-office city to total banks (commercial banks) in 1900, 1910, and 1920. Source: Banking and Monetary Statistics, 1914-1941 (Board of Governors of the Federal Reserve System, 1943, Table 74). Deposit insurance: The following states operated a deposit insurance system (year operation began): Kansas (1909), Mississippi (1914), Nebraska (1911), North Dakota (1917), Oklahoma (1908), South Dakota (1916), Texas (1910), and Washington (1917). All of these systems collapsed during the early 1920s. Source: Federal Deposit Insurance Corporation, Annual Report for 1956. Minimum capital requirement for state chartered banks: smallest dollar amount of capital required to charter a bank. The source of these data are White (1983, Table 1.3) for 1899 and 1909, and Polk’s Bankers Encyclopedia for 1919.

1 0 : 2 9 T u e s d a y , A p r i l 1 0 , 2 0 1 2 1 Figure 1a: Commercial Bank Concentration Ratios 1899
0 = < Bank Concentration < 0 .2 00 .2 0 = < Bank Concentration < 0 .4 00 .4 0 = < Bank Concentration < 0 .6 00 .6 0 = < Bank Concentration < 1.0 0

1 0 : 2 9 T u e s d a y , A p r i l 1 0 , 2 0 1 2 1 Figure 1b: Commercial Bank Concentration Ratios 1929
0 = < Bank Concentration < 0 .200 .20 = < Bank Concentration < 0 .4 00 .4 0 = < Bank Concentration < 0 .6 00 .6 0 = < Bank Concentration < 1.0 0