does the 'race of places' influence police officer … · 2015-02-05 · proportion of...
TRANSCRIPT
The author(s) shown below used Federal funds provided by the U.S. Department of Justice and prepared the following final report: Document Title: Does the “Race of Places” Influence Police
Officer Decision Making? Author: Cynthia Lum, Ph.D. Document No.: 231931
Date Received: September 2010 Award Number: 2007-IJ-CX-0032 This report has not been published by the U.S. Department of Justice. To provide better customer service, NCJRS has made this Federally-funded grant final report available electronically in addition to traditional paper copies.
Opinions or points of view expressed are those
of the author(s) and do not necessarily reflect the official position or policies of the U.S.
Department of Justice.

Does the “Race of Places” Influence Police Officer Decision Making?
2007-2008 DuBois Fellowship Award #2007-IJ-CX-0032
Cynthia Lum, Ph.D. George Mason University
Administration of Justice Department Center for Evidence-Based Crime Policy
EXECUTIVE SUMMARY &
FINAL REPORT
December, 2009
This study was sponsored and funded through the 2007-2008 National Institute of Justice W.E.B. DuBois Fellowship (2007-IJ-CX-0032). The author wishes to acknowledge Karen Jensenius, George Fachner, Julie Willis, Cody Telep, Brittany Davenport and Troy Payne for their research assistance, as well as members of NIJ who have offered helpful comments in improving this study.
This document is a research report submitted to the U.S. Department of Justice. This report has not been published by the Department. Opinions or points of view expressed are those of the author(s)
and do not necessarily reflect the official position or policies of the U.S. Department of Justice.

ii
CONTENTS
ABSTRACT iii EXECUTIVE SUMMARY iv – vii FINAL REPORT 1 – 64 I. Introduction 1 II. A Place-Based Approach to Understanding Police Discretion 3 III. The Current Study 10 Study Location 10 Data Used 12 Building the Decision Pathway 14 The Places that Decision Pathways Occur 26 Factors Influencing Decision Pathways 30 IV. Results 33 Overall Decision Pathway Scores 33 Specific Scores at Decision Points 38 Did September 11th Matter? 41 V. Discussion: What Might Explain These Findings? 43 VI. Recommendations to Policing 52 VII. References 59 VIII. Appendix 64
This document is a research report submitted to the U.S. Department of Justice. This report has not been published by the Department. Opinions or points of view expressed are those of the author(s)
and do not necessarily reflect the official position or policies of the U.S. Department of Justice.

iii
ABSTRACT
Research on factors that influence police discretion usually focuses on individual or situational characteristics (e.g., an officer or citizen’s age, race or gender, or the seriousness of the incident). In contrast, this study examines whether characteristics of places influence police decisions to “upgrade” or “downgrade” their response to incidents. Earlier research is expanded in three ways: first, rather than examining an isolated decision within the series of decisions that make up an incident, a series of chronological decisions within a “decision making pathway” is derived and analyzed. Second, multiple categories of racial and ethnic composition of places and their influence on police decision-making pathways are examined. Third, decision pathways of a variety of incidents at small geographic places are compared across an entire jurisdiction. Findings indicate that, even when controlling for the level of violence, places with a greater proportion of Black or wealthy residents significantly influences officers’ decisions to downgrade crime classifications and actions taken on incidents reported to the police.
This document is a research report submitted to the U.S. Department of Justice. This report has not been published by the Department. Opinions or points of view expressed are those of the author(s)
and do not necessarily reflect the official position or policies of the U.S. Department of Justice.

iv
EXECUTIVE SUMMARY THE IMPACT OF PLACE ON POLICING Environmental sociologists, place-based criminologists, geographers, and social psychologists have long emphasized the significance that places have on behavior, especially criminality and victimization (Brantingham & Brantingham 1981; Eck & Weisburd 1995; McLafferty 2008; Taylor 1988; Weisburd 2002). Physical, social, and cultural aspects of places can influence or mediate the connection between an individual’s cognitions and their actions. Police officers who work in the same places everyday are certainly not immune from these environmental forces. Police officers, especially those patrolling these places, are certainly not immune from these environmental forces. Place-based cues, especially those most noticeable to an officer (e.g., socioeconomic status, poverty, racial and ethnic makeup, disorder, crime, pedestrian and traffic density, and land use), may significantly affect with an officer’s worldview and thereby his or her discretion. The place-based cues that dominate the existing literature in this area primarily focus on race, ethnicity, and socioeconomic status of an area (see Smith 1986; Smith & Klein 1984; Terrill & Reisig 2003). Of course, this is not coincidental; the focus on police treatment as it relates especially to race is a central challenge to democratic policing and is of constant concern to policing scholars. Yet, while many would agree on the importance of understanding the impact that race and ethnicity have on officer decision making, we are far from reaching a consensus on its answer, especially the role that places play in those decisions. The place-based research tends to compare large areas, examine only certain decision points (arrest or initial stop), and compares places using dichotomous racial divisions such as “Black” and “White” or “White” and “non-White”. Each of these approaches leaves much room for further understanding. Additionally, much of the existing research in this area is not place-, but individual-based, analyzing how the race and ethnicity of individuals influence specific outcomes. The lack of place-based research in the area of race and policing is also surprising for a number of more practical reasons that go beyond social-psychological explanations. Today’s policing environment is marked both by a push for officers to be more proactive and place-based in their strategies. New place-based approaches such as using proactive traffic and pedestrian stops, problem-oriented policing, zero-tolerance arrests, hotspot patrol, and anti-gang interventions have often been shown to be promising in reducing crime, but at the same time criticized for resulting in (or at least not being sensitive to) racially incongruent outcomes. Community-policing philosophies have also emphasized a place-based component to conceptualizations of fairness and legitimacy in policing, shifting both practitioner and researcher thinking from considerations about individual due process to community legitimacy and authorization.
RESEARCH QUESTIONS
This project adds to the research on race and discretion by examining how the racial, ethnic, and socioeconomic characteristics of very small places influence officer decision making
This document is a research report submitted to the U.S. Department of Justice. This report has not been published by the Department. Opinions or points of view expressed are those of the author(s)
and do not necessarily reflect the official position or policies of the U.S. Department of Justice.

v
at those places. In particular, the life course, or “decision making pathway” of incidents is examined, rather than a single decision point in that life course. Such an understanding could not only help build ecological theories of police behavior, but also serves as an opportunity to rethink community and organizational policies that address differential decision making or racial prejudice in policing. Three research questions are of specific interest to this study of decision making pathways:
1. Would places with greater concentrations of racial and ethnic minorities receive different
types of police service for similar incidents when controlling for other factors? 2. Would places with greater concentrations of racial and ethnic sub-groups – specifically,
foreign-born or linguistically isolated individuals – receive different types of police service?
3. If racial and ethnic disparities are discovered, can they be easily explained by the level of crime (specifically violence) at those places? Alternatively, is there perhaps an interaction effect between racial composition, concentrated poverty or violence that mediates the response of police?
DATA AND METHODS This project proceeds given these concerns of research and practice in exploring the relationship between characteristics of small geographic areas and the decision making process of officers. Of interest is how place-based cues which are most obvious to officers – particularly the racial and ethnic make-up of places as well as socioeconomic cues – might affect their behavior. To add to this research area, I expand on previous conceptualizations of officer discretion by creating “decision pathways” that reflect multiple and chronological decision points of a single incident. This differs from existing research that focuses on a single decision point such as an initial stop or an arrest. I developed these pathways for 267,937 crimes and disorders that occurred across 568 small places within a large, diverse, and metropolitan west coast U.S. city – Seattle, Washington – over the course of one year. These pathways can be characterized by “upgrading” or “downgrading” in either crime seriousness or in police action. I then analyzed whether a relationship exists between these upgrading and downgrading tendencies of these pathways and the characteristics of the small places in which they occur. Of special note is the use of multiple racial, ethnic, and immigrant measures at places in this study. I do not limit analysis to a comparison between White and Black composition, as has been traditionally done. Rather, police discretion for multiple racial, ethnic, language, and foreign-born place-based categories is explored.
The decision pathways were then geographically referenced to spatially connect them to Census block groups for analysis with other characteristics of that place. This allowed for analysis of predictors of upgrading and downgrading scores. Since the primary interest in this study was whether the race and ethnicity of places influences behavior as defined by upgrading and downgrading in the decision pathway, the percentage of Black, White, Asian, Hispanic and foreign-born residents as well as the proportion of households that were linguistically isolated were collected for each block group. However, many other demographic, socioeconomic, and crime attributes were also built into the predictive models, including measures of wealth, community needs, social disorganization, levels of violent crime, and population density.
This document is a research report submitted to the U.S. Department of Justice. This report has not been published by the Department. Opinions or points of view expressed are those of the author(s)
and do not necessarily reflect the official position or policies of the U.S. Department of Justice.

vi
FINDINGS After multiple models were run, it appears that in Seattle, three place-based cues seem to most consistently matter to decision making pathways: the proportion of residents that are Black, the level of wealth in that area, and the amount of violence in a block group. As expected, in places with more violence, there is evidence of more formal social control – more reports are written and arrests made. However, police show significant evidence of downgrading calls – handling them less formally (less likely to write reports or make arrests) and reducing the seriousness of crime classifications in places with higher proportion of wealthy residents or higher proportion of Black residents (which are more disadvantaged). But, while both wealthy and disadvantaged block groupings with high proportions of Black residents both evidence downgrading, there seems to be less downgrading in communities with high proportions of Black residents compared to communities representing the wealthiest areas of Seattle. Similar effects are not consistently seen for places with larger proportions of Asian, Hispanic, foreign-born, or linguistically isolated households, although there are significant upgrading and downgrading activities at particular points in an investigation for these other groups. The findings are compelling and add to a place-based theory of policing. This study indicates that it is not sufficient only to examine the individual racial characteristics of officers, suspects, victims, and witnesses in explaining officer decisions. The environment can also be correlated to behavior in important ways. Although this study does not examine which effect might be stronger (individual-level information was not available on these incidents), and motivations of upgrading and downgrading can only be offered as hypotheses, this and other studies indicate that environmental cues condition individual action and do not simply act as a passive context for those actions. In this study, these environmental cues consist of racial and ethnic makeup, levels of violence, and socioeconomic status of the very small places where officers patrol. But place-based cues do not have to be racial or socioeconomic (although arguably, these are the strongest place-based cues). A place-based theory of policing should also take into account other environmental characteristics that may influence police officer decision making. These might include the physical layout of streets and buildings, the proportion of places that are business establishments, or the presence of certain types of environmental markers that can be magnets for certain crimes and the level of physical or social disorder (e.g., parks, public swimming pools, bars, subway stations, abandoned homes, alleys). This study provides a new dependent variable—the decision pathway—with which to examine the influence of these place markers. Despite these steps forward, this study, like so many others examining whether disparities in police service exist, still cannot tell us why we see this differential response. This analysis cannot give us insight into the minds of officers as to whether racial bias influenced their decisions. This proves intent for prejudice is not only difficult short of admission, but such prejudice is intricately part of human behavior and can be hidden under layers of consciousness, organizational rules, symbolic interactions, and worldviews (Horowitz, 1985). Additionally, the origination of the disparities that emerge from this analysis may not unilaterally come from the police; they may arise from an interaction between officers’ supply of law enforcement and the
This document is a research report submitted to the U.S. Department of Justice. This report has not been published by the Department. Opinions or points of view expressed are those of the author(s)
and do not necessarily reflect the official position or policies of the U.S. Department of Justice.

vii
demand of services by the community. Expectations of this interaction, of course, are shaped by both historical forces and prejudices, but also by current interactions. The only way for us to understand the reasons for these differences is through further systematic and qualitative approaches, including social observations, ethnographic analyses, and in-depth interviews or longitudinal psychological examination of officer and citizen mentality. What we can say is that the race of a place matters to police decision making, especially if that race is Black. At specific decision points, composition of other racial groups at places also matters. RECOMMENDATIONS
This acknowledgment of differential interactions at places based on race and socioeconomic status may be difficult but important for both the police and the community. Police easily acknowledge that levels of crime and violence of a place, and even the socioeconomic status of a neighborhood can affect their style of service. But talking about race as a possible factor is almost taboo. This situation also affects the reception of research by the police, who may be willing to accept poorly conducted evaluations of an intervention’s effect on crime, but may be extremely suspicious of even the most highly rigorous studies on racial disparities. How then, can this and other research be used? In the Discussions and Recommendations section, three ideas are explored:
1. Police must openly acknowledge that officers treat neighborhoods differently. Prospects
and problems in differential treatment should be approached from a community-oriented and legitimacy-development perspective and should be discussed in training.
2. Awareness and acknowledgement must be supported by operational structures that counteract such forces.
3. The effect of places on policing and the mental health of officers should be a serious concern for police leaders. There is especially a need to counter inevitable changes in mental states, some that are affected by the places officers’ work, which may lead to further behavioral problems such as racially biased policing or the use of force.
The race of places matters in police behavior and does not just provide a context for police behavior; the race of places can shape police discretion, especially if those places have higher concentrations of Black residents. As scholars have long emphasized, ethnic conflict and prejudice are part of human nature, a nature to which police officers are certainly not immune. The more important question in police policy is how such prejudice affects decision making and what organizational, cultural, and deployment approaches can counteract such forces given the overall (and sometimes conflicting) goals of policing in modern democracies—to reduce crime and do so legitimately and fairly. Examining how race influences policing at the place- rather than individual-based level provides not only an additional approach to understanding this relationship, but also speaks directly to the place-based implications of new policing innovations and community-oriented mandates.
This document is a research report submitted to the U.S. Department of Justice. This report has not been published by the Department. Opinions or points of view expressed are those of the author(s)
and do not necessarily reflect the official position or policies of the U.S. Department of Justice.

1
Does the “Race of Places” Influence Police Officer Decision Making?1
Cynthia Lum, Ph.D.
George Mason University Administration of Justice Department
I. INTRODUCTION
Environmental sociologists, place-based criminologists, geographers, and social
psychologists have long emphasized the significance that places have on behavior, especially on
criminality and victimization (Brantingham & Brantingham, 1981; Eck & Weisburd, 1995;
McLafferty, 2008; Taylor, 1988; Weisburd, 2002). Early on, the Chicago School and scholars of
social disorganization (Park, Burgess and McKenzie, 1925; Shaw and McKay, 1942; Shaw,
Zorbaugh, McKay, & Cottrell, 1929) solidified attributes of places as one major anchor in the
explanation and study of crime and criminal justice. Since then, researchers have found that
physical, social, and cultural aspects of places can influence or mediate the connection between
an individual’s cognitions and their actions. Police officers, especially those patrolling these
places, are certainly not immune from these same environmental forces. Place-based cues,
especially those most noticeable to an officer (e.g., socioeconomic status, poverty, racial and
ethnic makeup, disorder, crime, pedestrian and traffic density, and land use), may significantly
affect an officer’s worldview and thereby his or her discretion. Indeed, the effect of
characteristics of places on police behavior has led scholars like Michael Banton (1964) to
observe that “in different neighborhoods police provide different services” (p.136; see also
Smith, 1986; Terrill & Reisig, 2003). The cues that have been of special concern in the study of
1 This study was sponsored and funded through the 2007-2008 National Institute of Justice W.E.B. DuBois Fellowship (2007-IJ-CX-0032). The author wishes to acknowledge Karen Jensenius, George Fachner, Julie Willis, Cody Telep, Brittany Davenport and Troy Payne for their research assistance, as well as members of NIJ who have offered helpful comments in improving this study.
This document is a research report submitted to the U.S. Department of Justice. This report has not been published by the Department. Opinions or points of view expressed are those of the author(s)
and do not necessarily reflect the official position or policies of the U.S. Department of Justice.

2
differences in area-level treatment, especially for democratic societies, have been race, ethnicity,
and socio-economic status (see Smith, 1986; Smith & Klein, 1984; Terrill & Reisig, 2003).
Despite the potential importance that places may have on officer behavior, much of the
existing research on officer discretion is not place-based but instead focuses on how
characteristics of individuals (e.g., officer, victim, suspect, or bystanders) and the specific nature
of crime situations and police-civilian exchanges matter. Most notable is the literature on how
the race of individuals influences traffic stops or arrests (see e.g., Alpert, Dunham, & Smith,
2007; Black, 1971; Farrell & McDevitt, 2006; Gaines, 2006; Novak, 2004; Schafer, Carter, Katz-
Bannister, & Wells, 2006; Smith & Petrocelli, 2001; Smith & Visher, 1981; Smith, Visher, &
Davidson, 1984; Warren, Tomaskovic-Devey, Smith, Zingraff, & Mason, 2006). Yet, analyzing
the impact that place-based cues have on officer decision making is fruitful for a number of
reasons. From a socio-psychological perspective, patrol officers, like residents, can be negatively
affected by their daily work environments, which may be unfamiliar to them, have abnormally
high levels of crime or disorder, or include individuals of race or status different from their own.
Such unfamiliarity could affect how they perceive those areas and residents in those areas, which
may in turn affect their response. If different responses are systematized across different places,
the legitimacy of a democratic police force might be questioned.
Additionally, the influence of places on police behavior is important because today’s
policing environment is marked both by a push for officers to consider more place-based,
proactive strategies, such as hot spot patrol, problem-oriented policing, zero-tolerance
enforcement, or anti-gang interventions (Weisburd and Braga, 2006). These innovations
reinforce the importance of viewing crime from a place-based perspective, as opposed to
focusing on reacting to individual calls. More broadly, community-policing philosophies have
This document is a research report submitted to the U.S. Department of Justice. This report has not been published by the Department. Opinions or points of view expressed are those of the author(s)
and do not necessarily reflect the official position or policies of the U.S. Department of Justice.
3
long emphasized a place-based component to conceptualizations of fairness and legitimacy in
policing. This has shifted both practitioner and researcher from considerations about individual
due process to that of community legitimacy and authorization—concepts very much anchored in
social geography. Thus, how environmental characteristics affect officer decision making is
important to understand not only from an officer behavioral perspective, but also because
contemporary changes in policing lend even further significance to “place” in the officer’s daily
work.
The current literature is not only marked by its individual emphasis but also by three
other characteristics that warrant more research. First, when studying the impact of race on
police behavior, often only two racial groups (Blacks and Whites) are compared. However,
police may respond differently to places with other ethnic or religious concentrations. Second,
studies have often examined only one decision point, such as an arrest or decision to initiate a
stop. However, multiple decisions contribute to final outcomes, including the initial decision to
stop a suspect or respond to an emergency call, to continue with an investigation, to write a
report, or to make an arrest. Finally, past studies have compared discrete and large jurisdictions
such as cities, neighborhoods or even Census tracts. However, this ignores the likely
heterogeneity in those large areas. Comparison within and across such areas may yield further
insight in the role that places play in officer discretion. This study expands the research in each
of these three areas to understand if places matter in police discretion.
II. A PLACE-BASED APPROACH TO UNDERSTANDING POLICE DISCRETION
The focus of this study is on how characteristics of places affect officer discretion.
However, directly related to this is the literature that examines how characteristics of individuals
This document is a research report submitted to the U.S. Department of Justice. This report has not been published by the Department. Opinions or points of view expressed are those of the author(s)
and do not necessarily reflect the official position or policies of the U.S. Department of Justice.
4
(offenders, victims, or officers) influence police decision making. After all, places are partly the
aggregation of the individuals within them. It seems reasonable to hypothesize that the service
provided by the police could be impacted by an officer’s global perceptions of an area as it
relates to their views of the people inside of those places. Foundational works examining
individual characteristics and officer discretion have discussed the existence and influences of
police discretion (see, e.g., Black, 1971; Manning, 1977; Mastrofski, 1981, 2004; Mastrofski,
Ritti, & Hoffmaster, 1987). These influences have included, the beliefs, behaviors, and attitudes
of the suspect, victim, and/or officer; the race, age, and gender of parties involved; how insistent
parties are in making complaints; and aspects of the incident itself (such as the seriousness of the
crime). The empirical work in this area is voluminous, and examples include Alpert, Dunham,
Stroshine, Bennett, & MacDonald (2004), Black & Reiss (1970), Brown & Frank (2005),
Mastrofski (1981; 1991), Paoline & Terrill (2005), Sherman (1980), Smith (1986), and Smith &
Visher (1981) (for reviews, see Brooks, 2004; National Research Council, 2004).
This individual-level research has primarily been concerned with the interplay of two
perspectives: whether legal factors, such as offense seriousness, solvability factors, or criminal
histories, are more dominant in the outcomes of police discretion than extralegal factors, such as
ethnicity or socioeconomic status. These two perspectives, respectively, reflect differences
between more legalistic models of discretion (see Black, 1976; Weber, 1954), and conflict
theories (Blalock, 1967; Chambliss and Seidman, 1971; Liska and Chamlin, 1984; Parker, Stults,
& Rice, 2005). A legalistic model, while not discounting these extralegal factors, emphasizes
that crime seriousness, or the presence of victims, witnesses, and evidence, are the primary
determinants of officer discretion. Alternatively, the conflict or racial threat perspectives point to
other factors that may influence discretion. According to conflict theories, when members of one
This document is a research report submitted to the U.S. Department of Justice. This report has not been published by the Department. Opinions or points of view expressed are those of the author(s)
and do not necessarily reflect the official position or policies of the U.S. Department of Justice.
5
community (usually the majority) feel their interests are being infringed, they will wield power
to exercise control over the “other.” This may include demanding more or harsher police activity
against the “other.” Such a perspective, which informs ethnic conflict literature more generally
(see Horowitz, 1985) implies that factors seemingly unrelated to the incident but more related to
characteristics of the “other,” such as a person’s ethnicity, age, or political affiliation, can
influence an officer’s discretion.
Early research findings with regard to the evidence of these two perspectives on an
officer’s discretion to arrest have been mixed (Black, 1971, 1976; Sherman, 1980; Smith &
Visher, 1981; see more generally the conclusions by the National Research Council, 2004).
Black (1976), for example, examined the “social distance” between officers and citizens,
suggesting that the greater difference in culture, ethnicity, or worldview between an officer and
suspect, the greater the risk that a negative police-citizen encounter would occur (see also Bayley
& Mendlesohn, 1969). In a study of thousands of police encounters, Smith and Visher (1981)
also focused on the race of individuals, finding Blacks were more likely to be arrested than
Whites, after controlling for other factors (see also National Council on Crime and Delinquency,
1978; Powell, 1990; Smith et al., 1984). However, other empirical work has shown that other
legal factors, such as the suspect’s behavior or the seriousness of the crime, could matter more
than race in the arrest decisions that police officers make (see e.g., Alpert et al., 2004; Black,
1971; Kleck, 1981; Sherman, 1980).
Recent research has challenged these mixed findings by turning attention away from just
examining arrest decisions or responses to violence (which may be naturally influenced by legal
factors) to earlier decision points and for more minor offenses such as the decision to initiate a
stop or the response to a call of disorder. Examining such decisions allows for an understanding
This document is a research report submitted to the U.S. Department of Justice. This report has not been published by the Department. Opinions or points of view expressed are those of the author(s)
and do not necessarily reflect the official position or policies of the U.S. Department of Justice.
6
of a wider range of discretionary options even before legal factors come into play. For example,
in studies of proactive decision making such as traffic stops, research has consistently found that
minorities, specifically Blacks and Hispanics, are stopped, ticketed, and searched at higher rates
than Whites (Gaines, 2006; see also Fagan & Davies, 2000; Lundman & Kaufman, 2003; Reitzel
& Piquero, 2006; Walker, 2001; Warren et al., 2006), even when they are at no greater risk for
carrying contraband (Engel & Calnon, 2004). In a systematic social observation analysis of arrest
decisions during traffic stops in Cincinnati, Brown and Frank (2006) found Blacks were more
likely to be arrested than cited in traffic stops, no matter the race of the officer (see also Brown,
2005). Evidence for disparities in traffic stops have created controversy (Lange, Johnson, &
Voas, 2005; Petrocelli, 2006; Smith & Petrocelli, 2001) leading to a number of statewide
investigations and further research (see e.g., Farrell & McDevitt, 2006; Gaines, 2006; Ridgeway
et al., 2009; Warren et al., 2006).
This dichotomy of the influence of legal and extralegal influences on police behavior
could also be extended to a theory of place-based influences on officer discretion. Places are
aggregations of individuals in physical settings, and attributes of an area may affect an officer’s
decision-making, just as evidence has indicated individual characteristics matter. A legalistic
model might suggest that levels and types of crime and disorder in an area are what determine
police service in that area. Places with high levels of violence, for example, could condition
police response to that type of crime and subsequently de-prioritize less serious crimes.
Reinforcing and systematizing this conditioning to crime types at places are traditional police
strategies that are primarily reactive and negative in nature. Further, even within their beats,
which can be quite large, police officers are also regularly drawn to the same smaller places,
since the distribution of crimes are extremely concentrated (Sherman, Gartin, & Buerger, 1989)
This document is a research report submitted to the U.S. Department of Justice. This report has not been published by the Department. Opinions or points of view expressed are those of the author(s)
and do not necessarily reflect the official position or policies of the U.S. Department of Justice.

7
and stable over time (Weisburd, Bushway, Lum & Yang, 2004). The reactive nature of the
traditional police response in combination with stable place-based crime characteristics could
reinforce systematic biases in responses that lead to legalistic, place-based variations.
On the other hand, extralegal characteristics, such as an area’s level of social
disorganization, wealth, racial heterogeneity, or residential mobility may also influence police
services. Research already points to place-based stereotyping, especially connecting places with
concentration of minority residents and crime (see Hurwitz & Peffley, 1997; Quillian & Pager,
2001; Rengert & Pelfrey, 1997), even though such relationships may not be supported
empirically (Frey, 1979; Liska, Lawrence, & Sanchirico, 1982; Logan & Stults, 1999; Lum,
forthcoming). Places with high proportions of Black residents may be treated differently by
officers than places that are predominantly White, even if both places have similar levels of
social disorganization or crime. Conflict theories speak to the notion that public services might
differ based on the racial composition or socioeconomic status of a place.
The relevance of the conflict perspective to police decision making at places is found in
David Klinger’s ecology of patrol approach (Klinger, 1997; see also Klinger, 2004). He argues
that social and ecological aspects of patrol beats could influence a patrol officer’s perceptions of
how “deserving” those places are of service and, in turn, influence outcomes of response.
Klinger’s perspective suggests that places can affect the norms that influence officer decisions,
making attributes of those places inseparable from the aspects of the legal or investigatory
situations. Moreover, these attributes may not only be racial and ethnic composition. Levels of
social disorganization or the wealth of an area, which may be correlated to racial composition,
may also influence officer mentality. Places that are run down, and have high residential
mobility, unemployment and poverty, could be considered less deserving than places in which
This document is a research report submitted to the U.S. Department of Justice. This report has not been published by the Department. Opinions or points of view expressed are those of the author(s)
and do not necessarily reflect the official position or policies of the U.S. Department of Justice.
8
residents own property or seem to have greater stake in their communities. All of these
characteristics may influence how an officer makes decisions in a particular place.
The few empirical studies examining the impact that places have on decision making
have focused on race, socioeconomic status, and crime levels of neighborhoods, and lends
support to Klinger’s ecology of patrol perspective. For example, Smith (1986) analyzed the
impact of neighborhood racial heterogeneity on approximately 5,700 police encounters. He
found that police initiated more contacts with suspicious persons in neighborhoods with greater
racial heterogeneity (although in these same communities he simultaneously found that officers
offered more assistance to residents). Smith also found that the socioeconomic status of a
neighborhood matters in officer discretion; the chance of being arrested increases in situations
that occur in neighborhoods with greater economic disadvantage (see also Fagan & Davies,
2000; Weitzer, 1999). In previous work, Smith and Klein (1984) found that while situational
aspects of a crime influence behavior, these aspects are conditioned by neighborhood racial
context.
Concerning police abuse, Terrill and Reisig (2003) found evidence that the use of force
and police abuse varied across neighborhoods in Indianapolis and St. Petersburg. Independent of
suspect behavior, police officers in their study were more likely to use higher levels of force in
neighborhoods with more crime and disadvantage (an effect also discovered by Ridgeway et al.,
2009 in Cincinnati). Further, the effects of race at the encounter level were mediated by a
neighborhood’s racial context.2
2 Mastrofski, Reisig, & McCluskey (2002) and Reisig, McCluskey, Mastrofski, & Terrill (2004) also found that, although not as powerful as individual factors, neighborhood disadvantage was still a significant predictor of police officer behavior toward suspects.
Kane (2003) found that the patterns of police abuses at the
precinct level could be predicted by structural disadvantage, population mobility, and increases
in the proportion of Latino residents.
This document is a research report submitted to the U.S. Department of Justice. This report has not been published by the Department. Opinions or points of view expressed are those of the author(s)
and do not necessarily reflect the official position or policies of the U.S. Department of Justice.

9
This scholarship, while not definitive, points to the continued importance of examining
whether neighborhood racial composition, social disorganization, and other attributes of places
affect police service. However, these empirical findings still do not tell us why differences occur.
Conflict theorists might argue that increased police service may indicate that police feel
compelled to act in neighborhoods of perceived racial group threat. But place-based variations
could also indicate more complex structures of community demands for service from the police.
Whatever the reason, research seems to indicate that more policing (whether in formality,
frequency, or force) seems to occur in places that are poorer or that exhibit attributes of social
disorganization, have greater percentages of minority residents, or are more crime-prone.
The lack of place-based research in this area and the strong possibility of the effects of
places on police officers warrant more research. Such an understanding could not only help build
ecological theories of police behavior but also could serve as an opportunity to rethink place-
based interventions that may foster incongruent outcomes across different places that may be
race-based (Rosenbaum et al., 2004; Tyler & Huo, 2002). In particular, more fleshing out of the
decision-making process at diverse places is needed. Police do not simply treat a situation, call,
or incident with a single decision such as an arrest or stop. Rather, officers may choose to
dismiss calls, carry them further, upgrade or downgrade their seriousness, write reports (or not),
or make arrests. Finding the differences in these decision points across places with varying
social, economic, and demographic attributes is the analysis to which I now turn.
This document is a research report submitted to the U.S. Department of Justice. This report has not been published by the Department. Opinions or points of view expressed are those of the author(s)
and do not necessarily reflect the official position or policies of the U.S. Department of Justice.

10
III. THE CURRENT STUDY
STUDY LOCATION
This study examines how characteristics of places relate to police officers’ discretionary
decisions for incidents to which officers responded in a West coast, metropolitan U.S. city –
Seattle, Washington. The site is ideal, as it is a large and urban city of approximately 80 square
miles of over 500,000 residents with a crime rate slightly higher than cities of comparable
populations. Further, Seattle has a highly diverse population of significant proportions of
multiple ethnicities and immigrant communities that are spatially concentrated, providing an
excellent opportunity to observe potential racial and ethnic composition effects on police
decision making across places. At the time of the 2000 U.S. Census, Seattle’s recorded racial and
ethnic mix was Caucasian (70%), African (8%), Asian (13%), Hispanic (5%) and Native (1%)
American. Approximately 17% of the population is foreign-born, and over 20% speak languages
other than English at home and are “linguistically isolated”.3
The spatial concentrations of Black,
Asian, and Hispanic populations are shown in Figure 1a, b, and c, respectively. The diversity in
this study is especially noteworthy given that most studies analyzing the relationship between
race and police discretion have only compared police service delivery between two
categorizations—Black and White, or White and non-White.
3 The Census defines linguistic isolation as a situation in which every adult in a household speaks a language other than English, and no adult speaks English “very well” (Seigel et al. 2001).
This document is a research report submitted to the U.S. Department of Justice. This report has not been published by the Department. Opinions or points of view expressed are those of the author(s)
and do not necessarily reflect the official position or policies of the U.S. Department of Justice.

11
Figure 1. Spatial patterns of Black (a), Asian (b), and Hispanic (c) populations in Seattle
(a) (b)
(c)
This document is a research report submitted to the U.S. Department of Justice. This report has not been published by the Department. Opinions or points of view expressed are those of the author(s)
and do not necessarily reflect the official position or policies of the U.S. Department of Justice.

12
DATA USED
Data was collected from Seattle Police Department for the year 2001. This year was
chosen because the most recent U.S. Census, which gathered characteristics of places used for
this analysis, took place in the year 2000.4
Prior to data cleaning, 421,269 recorded calls for service incidents were available for this
analysis. All records that could be discerned
The data used in this study was extensive. The goal of
this study was to expand existing research on the relationship between characteristics of places
and police discretion by examining many different types of incidents and the different decision
points in the life of each. To achieve this, a labor-intensive data manipulation effort was
undertaken by the author. Four large data sources were collected and connected: the police calls
for service database in which a dispatcher records the initial request for service (by either a
citizen or a police officer); another database that records the modification of that call upon initial
officer arrival; a database of computerized records of written reports; and an arrest database. As
with many police agencies, each data source was separately maintained by this agency but could
be linked by the unique identifying number assigned at the initial calls for service stage.
5 were retained, even if they were dismissed upon
officer initial response, as the dismissal themselves is a measurable action that may
systematically differ across place. I further excluded 153,332 incidents from the data. First, I
excluded events that were traffic-related (75%) because I could not discern differences among
them in terms of incident classification.6
4 Additionally, the author was interested in the effects of the terrorist attacks of September 11, 2001, on police decision making related to race. These findings will be reported in a separate article.
Additionally, I excluded routine administrative duties
5 In many cases, the record in the database indicated “duplicate” or “unknown,” where no information, including address or nature of the call was provided, nor did an officer respond. These were removed. 6 In this database, I was unable to discern whether initial calls for service labeled as “TRAFFIC” were traffic stops, parking tickets, or reports of accidents in which police did not respond. Because of the generic label in the calls for service database, this posed problems with the development of the decision pathways (as discussed shortly), which required a general determination of the seriousness of the offense. Thus, “TRAFFIC” could include a fender-bender for which no police action was initiated, or a driving-while-intoxicated hit-and-run incident in which someone had
This document is a research report submitted to the U.S. Department of Justice. This report has not been published by the Department. Opinions or points of view expressed are those of the author(s)
and do not necessarily reflect the official position or policies of the U.S. Department of Justice.

13
such as follow-ups, patrol vehicle maintenance service, assistance to other departments (14%);
responses to individuals who were sick, dead, or injured, that were not crime related or suicides
(4%); calls for service on missing individuals and runaways (3%); and reports of other hazards
that required another service provider (4%). Finally, I removed 590 events that involved the
delivery of special court orders. This left 267,937 incidents that were retained for this study.
These are categorized in Table 1 according to how they were first described in the calls for
service data.
Table 1. Types of incidents examined in the current study Description N %
Person, violence, and weapons crimes:
Homicide, rape, sex offenses, robberies, kidnappings, assaults, weapons, explosives, gunshots, domestic violence, child violence. Excluded from this analysis were suicides, unspecified injured persons or individuals who fell ill, and “dead-on-arrivals” that were not homicides.
15,933
6.0%
Property offenses: Auto theft, burglary, arson, fraud, theft, shoplifting.
68,467 25.6%
Crimes of drugs and vice: Possession, distribution, sale, manufacturing, conspiracy, or other drug abuse and sale offenses, prostitution, gambling, other vices.7
9,479 3.5%
Disorder incidents: Complaints of noise, the misuse of phones (pranks, threats), nuisance calls, dogs barking, general disturbances or harassments, abandoned cars, damage to property, unspecified miscellaneous misdemeanors, calls regarding mentally ill individuals, civil disorders/riots, civil disputes, liquor violations, public urination, littering, public indecencies, unspecified fighting in the street, fireworks, loitering, and non-violent family disturbances.
99,581 37.2%
Suspicious incidents: These incidents were more vague and involved citizens describing situations in which they believed something suspicious was happening. This category includes incidents related to alarms, prowlers, and any type of call coded as suspicious activity.
74,477 27.8%
been seriously injured. Because of this, traffic-denoted incidents will be analyzed in a separate study if more information can be obtained about them. 7 The total number of incidents that fell in this category was initially small due to a number of possible reasons. Drug and vice incidents are often generated from proactive activities by police officers. Further, this initial labeling is from calls for service data, where drug and vice crimes may also be initially recorded as “disorder” or “suspicion”.
This document is a research report submitted to the U.S. Department of Justice. This report has not been published by the Department. Opinions or points of view expressed are those of the author(s)
and do not necessarily reflect the official position or policies of the U.S. Department of Justice.
14
Total incidents: 267,937 100.0% BUILDING THE DECISION PATHWAY
By linking the four databases, I operationalized a more comprehensive measure of
discretion—the decision pathway. The decision pathway is a series of decision points that may
occur for every incident to which an officer responds. Such pathways can include decisions
about whether to initiate and/or respond to calls for service, stop an individual, dismiss a call,
investigate further, write a report, make an arrest, or increase or decrease the severity of a report
or arrest charge. The decision pathway gives a more complete picture of what happens across the
life of an incident, not just at the initiation of a stop or an arrest. Studying the life of an
investigation may be more advantageous, as single decision points may over- or underestimate
the impact that a legal or extralegal factor may have on discretion. Arrest for violent crimes, for
example, likely will be greatly influenced by legal factors related to that event. However, the
decision to stop someone for general questioning in a violent crime neighborhood may be more
heavily influenced by extralegal factors.
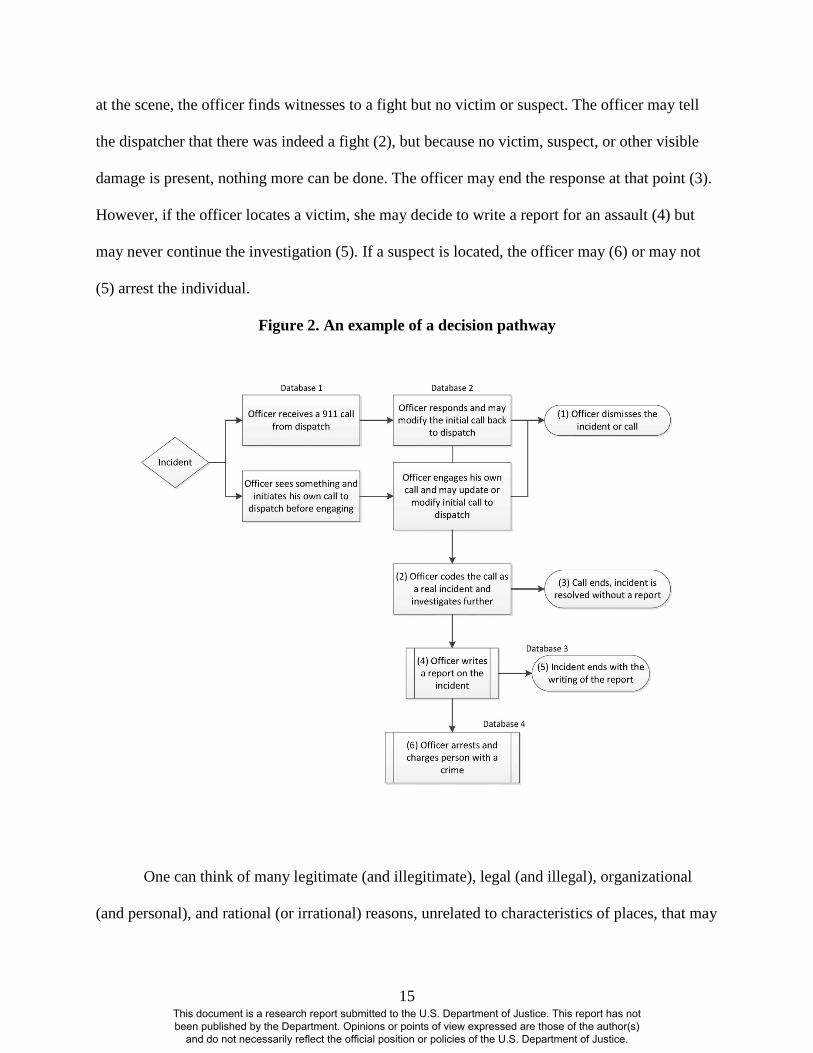
To illustrate the decision pathway, I present Figure 2. This figure displays the possible
decisions and outcomes that can occur once an officer receives a call from the dispatch or
initiates his or her own investigation proactively. The labels, "Database 1", "Database 2" and so
on, indicate which of the four databases in this project that the decision points were recorded. At
each turn, discretion is applied and an outcome occurs, which subsequently influences later
decisions and outcomes. Apply, for instance, a street fight to Figure 2. An officer may learn of a
street fight from the dispatcher who received a 911 call, or an officer may come upon a street
fight in progress. Upon arrival, there is no evidence of a fight, or, in the case of the officer-
initiated call, everyone disperses. The officer may dismiss the call entirely (1). Or, upon arriving
This document is a research report submitted to the U.S. Department of Justice. This report has not been published by the Department. Opinions or points of view expressed are those of the author(s)
and do not necessarily reflect the official position or policies of the U.S. Department of Justice.
15
at the scene, the officer finds witnesses to a fight but no victim or suspect. The officer may tell
the dispatcher that there was indeed a fight (2), but because no victim, suspect, or other visible
damage is present, nothing more can be done. The officer may end the response at that point (3).
However, if the officer locates a victim, she may decide to write a report for an assault (4) but
may never continue the investigation (5). If a suspect is located, the officer may (6) or may not
(5) arrest the individual.
Figure 2. An example of a decision pathway
One can think of many legitimate (and illegitimate), legal (and illegal), organizational
(and personal), and rational (or irrational) reasons, unrelated to characteristics of places, that may
This document is a research report submitted to the U.S. Department of Justice. This report has not been published by the Department. Opinions or points of view expressed are those of the author(s)
and do not necessarily reflect the official position or policies of the U.S. Department of Justice.

16
influence these decisions. For example, miscommunication between the dispatcher and citizen or
officer can occur, leading to an early misclassification of a crime, which requires modification
once an officer arrives. Officers may choose not to arrest an individual if the infraction is viewed
as minor. Other incidents may not warrant a report or arrest, just informal assistance by the
officer (for example, kids making noise in the street). Even further complications may result,
since dispatchers may change the nature of calls as they receive them from the caller. In some
cases, officers may themselves initiate a call for service. Whether a call is initiated (as opposed
to arising from a 911 caller) could also influence the discretion applied to that call and
subsequent actions taken.8
The linking of the four data sources essentially allowed for the rebuilding of Figure 2 for
each of the 267,937 incidents. Then, to characterize changes in officer discretion over the course
of an incident’s investigation, I use the terms “upgrading” and “downgrading” of officer actions
and crime classification. With regard to action upgrading or downgrading, officers can choose
whether to take, dismiss, or initiate a call, write a report, or make an arrest. When an officer
decides to arrest, for instance, that is an upgrade in action. Similarly, if an officer chooses to
dismiss a call, that would be considered a downgrade. With regard to a crime classification
upgrade or downgrade, officers can choose to change the labeling of an incident to one that is
more (or less) serious. In combination, these upgrades and downgrades (or no changes) quantify
the decision pathway for further analysis.
However, all else being equal, if race, ethnicity, or socioeconomic
status were not factors in these decisions, no matter the legitimacy of those reasons, we might
expect variations in these choices to be randomly dispersed.
8 This complication was pointed out by one of the anonymous reviewers. Unfortunately, in this data, officer initiated calls are not distinguishable from civilian-initiated calls.
This document is a research report submitted to the U.S. Department of Justice. This report has not been published by the Department. Opinions or points of view expressed are those of the author(s)
and do not necessarily reflect the official position or policies of the U.S. Department of Justice.

17
Quantifying these changes, however, has limitations and is obfuscated by both database
issues and normative concerns. With regard to database issues, the data source on which the
entire decision pathway begins is the initial calls for services database, as this is the first record
of an officer's discretion. Although this data is the most inclusive in terms of incidents, it is also
the most general with regard to how crimes are classified. Dispatchers quickly interpret
situations from callers or an officer’s curt radio transmission and then record them broadly. The
recording of police data tends to become more specific at later points in an incident (i.e., report
or arrest stage). For instance, if someone was later arrested for “aggravated assault with a
handgun,” the initial call for service might simply be labeled “assault.” If no standard crime
classification is used across the four databases, it might appear that there was an upgrade in
crime classification (from assault to aggravated assault with a handgun), when in fact no upgrade
occurred. Because of this, the simpler crime classifications reflected in the calls for service data
informed the coding of crime classifications across the four databases. Although this approach is
less specific to certain degrees of seriousness within a broad crime classification, it also reduces
unwarranted assumptions.
The difficulty of quantifying changes in how officers label or classify incidents is also
confounded by a normative concern of how to rank crime types that are qualitatively different
and potentially incomparable. Is an assault worse than a burglary? Is a drug crime more
problematic than petty theft? How much worse is one crime compared to another? These
questions are not easily reconciled in this study. In terms of ranking crimes, I created a simple
five-classification scheme guided by general conventions reflected in the Federal Bureau of
Investigation’s Uniformed Crime Reports, the jurisdiction’s state Sentencing Commission, and
norms of the county prosecuting office. Persons and weapons crimes are considered the most
This document is a research report submitted to the U.S. Department of Justice. This report has not been published by the Department. Opinions or points of view expressed are those of the author(s)
and do not necessarily reflect the official position or policies of the U.S. Department of Justice.

18
serious, followed by property crimes. Drugs and vice are ranked third not only because of the
social concerns that surround them generally, but in this city, as in many other jurisdictions,
these crimes are treated more seriously in terms of punishment than crimes of disorder. Disorder
and suspicion are then tied for fourth. Both are low-level incidents and often are not considered
crimes. “Other” incidents include 911 calls initially involving sick and non-crime injured people
or those who had an accident in vehicle, or calls for service for fallen trees, broken plumbing,
patrol vehicle maintenance, breaks, transporting evidence or persons, or children refusing to go
to school. Earlier, I mentioned some of these incidents were excluded from initial examination.
Those excluded were these incidents that remained these classifications throughout the life of an
incident. These incidents were included because later in the decision pathway, they were re-
classified into incidents that were included in this study. Given that crime classifications could
change across the decision pathway, each database was coded with these five general crime
classifications.
To quantify changes in these crime classifications from one point in an investigation to
the next, a score was assigned. The initial classification by the dispatcher was not given a starting
weight because the change in the classification of crime was of interest. Such distances between
how crimes are recorded are detailed as absolute values in Table 2. In effect, all incidents begin
at the score of “0” when received by a dispatcher and remain so until they experience an upgrade
or downgrade in classification or action. For crime classification upgrades, a positive value of the
point difference in Table 2 is recorded, and for downgrades, a negative value. All scores are
whole numbers between zero and four. The scoring is conducted at each decision point—the
change in crime classification at first response or investigation of an incident, the crime that was
written up in the report, and the crime on which the arrest was made.
This document is a research report submitted to the U.S. Department of Justice. This report has not been published by the Department. Opinions or points of view expressed are those of the author(s)
and do not necessarily reflect the official position or policies of the U.S. Department of Justice.

19
Table 2. Point system for changes in crime classifications Change (either direction)
Point Difference (in absolute values)
same ↔ same (e.g., person ↔ person) 0 person ↔ property 1 person ↔ drugs and vice 2 person ↔disorder/suspicion 3 person ↔non-crime “other” 4 property ↔drugs and vice 1 property ↔disorder/suspicion 2 property ↔non-crime “other” 3 disorder/suspicion ↔suspicion/disorder 0 disorder/suspicion ↔drugs and vice 1 disorder/suspicion ↔non-crime “other” 1 drugs and vice ↔non-crime “other” 2
It is important to note that these distances between adjacent crime types are arbitrary and
exploratory, as no precedent in police scholarship was found on which to base this analysis.
Options such as using sentencing schemes (for example, months of incarceration of that area
associated with crimes) are not obvious answers. Sentencing guidelines present not only large
ranges but also overlap and qualifiers between sentencing for incidents. The scoring system here
is only a start, and other types of scoring might be assigned. Using 0–4 allows some magnitude
to be given to drops in normative seriousness of crime classifications. However, the use of whole
number scores does not imply equal distance between crime type seriousness.
Scoring decision points on changes in crime type classification was only half of the final
score assigned to incidents. Additionally, scores were also generated for actions, such as
dismissing a call after first response (downgrade) or making an arrest (upgrade). Unlike changes
in crime classification, single point differentials would not be useful in adding weight to action
upgrades and downgrades. A one-point upgrade or downgrade for an action (±1) would be
“washed out” if a substantial change in crime classification also occurred. For example, if reports
are given a score of +1, then a decrease in crime classification from a persons to a disorder crime
yields a -3, essentially weighting the reclassification more heavily than the decision to write a
This document is a research report submitted to the U.S. Department of Justice. This report has not been published by the Department. Opinions or points of view expressed are those of the author(s)
and do not necessarily reflect the official position or policies of the U.S. Department of Justice.

20
report. This may not reasonable, as reports and arrests are arguably “stronger” upgrades than
changes in crime classification. Reports represent an official recording of the crime; they also
promise follow-up by the police agency and can result in arrest and trial. Similarly, an arrest
should also be weighed heavily, given the consequences of this official action. Thus, to weight
actions of report and arrest more heavily, reports and arrests were assigned four (+4) points,
given that four is the greatest point differential for changes in crime classification.
This combination of changes in crime categorizations and decisions to take actions which
occur simultaneously, help to create basic descriptions of change across the pathway. Table 3
provides examples of the direction of upgrading and downgrading that might occur in just
property calls for service examples (imagine these tables for all types of calls for service). In
each set of parentheses, upgrading is denoted by “+,” downgrading by “-,” and no action or
change in crime classification by “0.” In the first shaded row, an officer gets a call, for example,
about a stolen vehicle. Upon responding, she finds that no vehicle was stolen; rather, a teenager
had taken the family car to the grocery store without telling her parents. Not knowing this, the
parents thought the car was stolen and called the police. The officer dismisses the call upon
arrival. The (-) indicates that what began as a property offense was reclassified as a non-crime
and immediately dismissed, reflecting a downgrade. Since the officer’s initial response to the call
for service only reflects one decision (a change in the crime classification or simply dismissed),
only a single upgrade or downgrade is noted. Because no report was written, no arrest was made,
and no subsequent changes in crime classification occurred, we see zeros across all other
decision points. Note – this example represented a legitimate and rational downgrade, but one
could imagine illegitimate reasons why this might occur.
This document is a research report submitted to the U.S. Department of Justice. This report has not been published by the Department. Opinions or points of view expressed are those of the author(s)
and do not necessarily reflect the official position or policies of the U.S. Department of Justice.
21
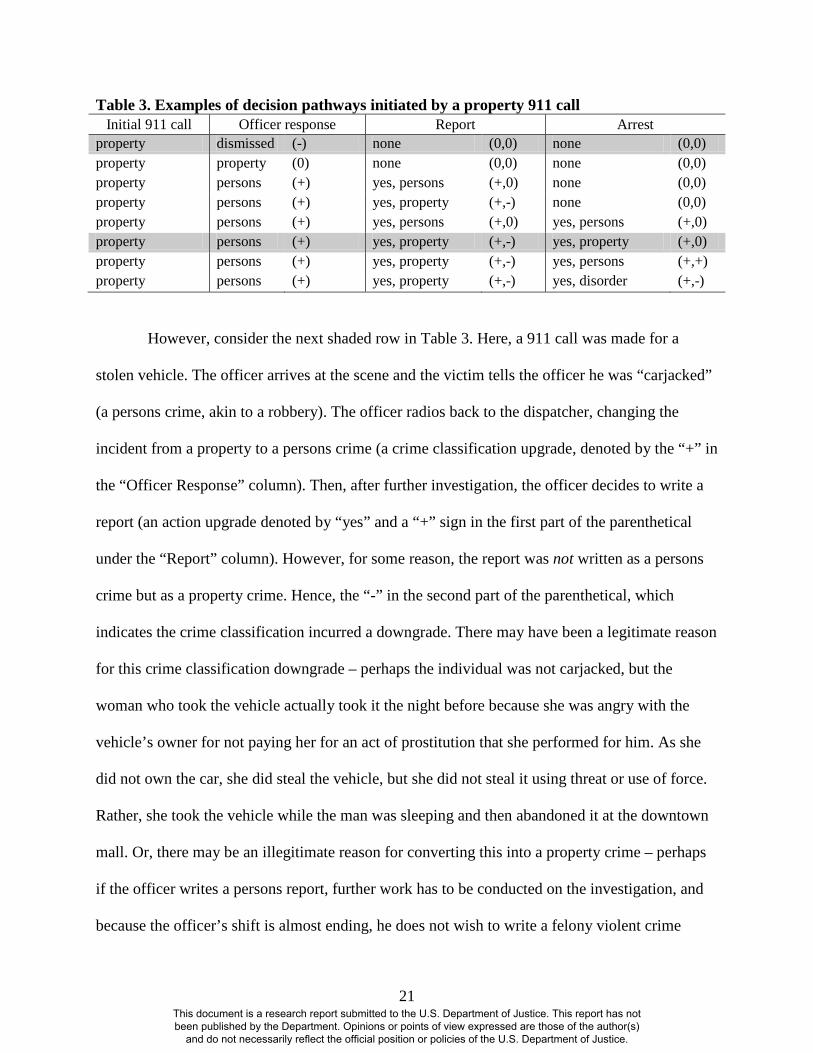
Table 3. Examples of decision pathways initiated by a property 911 call Initial 911 call Officer response Report Arrest
property dismissed (-) none (0,0) none (0,0) property property (0) none (0,0) none (0,0) property persons (+) yes, persons (+,0) none (0,0) property persons (+) yes, property (+,-) none (0,0) property persons (+) yes, persons (+,0) yes, persons (+,0) property persons (+) yes, property (+,-) yes, property (+,0) property persons (+) yes, property (+,-) yes, persons (+,+) property persons (+) yes, property (+,-) yes, disorder (+,-)
However, consider the next shaded row in Table 3. Here, a 911 call was made for a
stolen vehicle. The officer arrives at the scene and the victim tells the officer he was “carjacked”
(a persons crime, akin to a robbery). The officer radios back to the dispatcher, changing the
incident from a property to a persons crime (a crime classification upgrade, denoted by the “+” in
the “Officer Response” column). Then, after further investigation, the officer decides to write a
report (an action upgrade denoted by “yes” and a “+” sign in the first part of the parenthetical
under the “Report” column). However, for some reason, the report was not written as a persons
crime but as a property crime. Hence, the “-” in the second part of the parenthetical, which
indicates the crime classification incurred a downgrade. There may have been a legitimate reason
for this crime classification downgrade – perhaps the individual was not carjacked, but the
woman who took the vehicle actually took it the night before because she was angry with the
vehicle’s owner for not paying her for an act of prostitution that she performed for him. As she
did not own the car, she did steal the vehicle, but she did not steal it using threat or use of force.
Rather, she took the vehicle while the man was sleeping and then abandoned it at the downtown
mall. Or, there may be an illegitimate reason for converting this into a property crime – perhaps
if the officer writes a persons report, further work has to be conducted on the investigation, and
because the officer’s shift is almost ending, he does not wish to write a felony violent crime
This document is a research report submitted to the U.S. Department of Justice. This report has not been published by the Department. Opinions or points of view expressed are those of the author(s)
and do not necessarily reflect the official position or policies of the U.S. Department of Justice.

22
report. Given that the individual may even know the assailant, the officer may decide to write the
report as a car theft. Moving further down the decision pathway in this example, perhaps the
officer locates the woman and arrests her for the property crime. The decision to arrest is an
action upgrade, but keeping the crime classification as “property” leads to no change in crime
type (hence the “0” in the second parenthetical of the arrest).
One can imagine that hundreds of decision pathways are possible given the five different
crime classifications and the different action choices that police can make. To illustrate this, I
expand Figure 2 into a more detailed decision tree in Figure 3, with the possible point allocation
for each of the choices. Notice in the “Report” and “Arrest” columns, two scores are reflected—a
crime classification change score and an action change score. This scoring scheme allows for
each of the 267,937 incidents to receive four scores—three scores between each decision point in
the pathway and a total score across the pathway.
Figure 3. Decision Pathway Diagram
This document is a research report submitted to the U.S. Department of Justice. This report has not been published by the Department. Opinions or points of view expressed are those of the author(s)
and do not necessarily reflect the official position or policies of the U.S. Department of Justice.

23
An example of a score generation for a particular incident might be the following: A call
for loitering occurs, which is then reclassified as a drug call upon an officer’s initial response,
which increases the score by (+1). But then a report is written (+4), but for a loitering incident (-
1), equaling a +3 for this decision point. An arrest is made (+4), but the charge given is a drug
possession charge (+1), which leads to an increase in 5 points. The total pathway score is +9.
The distribution of the total scores for a few examples are shown in Table 4, and such
frequencies (although not shown here), can be generated at each point in the decision pathway.
Table 4. Examples of decision pathway scoring Initial 911 Call Officer Response Report Arrest Total
Score Noise complaint Dismissed (-1) No report (+0) No arrest (+0) -1 Stabbing Stabbing (+0) Report Stabbing (+4) No arrest (+0) +4 Loitering Drugs (+1) Report Loitering (+3) Arrest Drugs (+5) +9 Theft Theft (+0) Report Theft (+4) Arrest Theft (+4) +8 Prostitution Loitering (-1) Report Prostitution (+5) Arrest Loitering (+3) +7 Assault Disturbance (-3) No report (+0) No arrest (+0) -3
By connecting the four databases and scoring each decision point and the total pathway,
four outcome variables were created – upgrading/downgrading scores between the initial call and
the officer modification, change scores at the time of report, change scores at the time of arrest,
and a total score that gives the overall tendency of upgrading and downgrading across the
decision pathway. The distribution of total- and single-point scores of these pathways reflects
common patterns of crime incident reporting. Table 5 shows the distribution of the scores for the
first decision point in the pathway – whether to change the crime classification upon an officer’s
initial assessment or dismiss the call altogether. Almost 78% of the time, officers did not change
the crime classification of the calls as they were initially dispatched. Interestingly, if a change
was made, the distribution of this first decision point indicates a general tendency to downgrade
calls (17.4% of calls) as opposed to upgrading the seriousness of the call (4.6% of calls).
This document is a research report submitted to the U.S. Department of Justice. This report has not been published by the Department. Opinions or points of view expressed are those of the author(s)
and do not necessarily reflect the official position or policies of the U.S. Department of Justice.
24
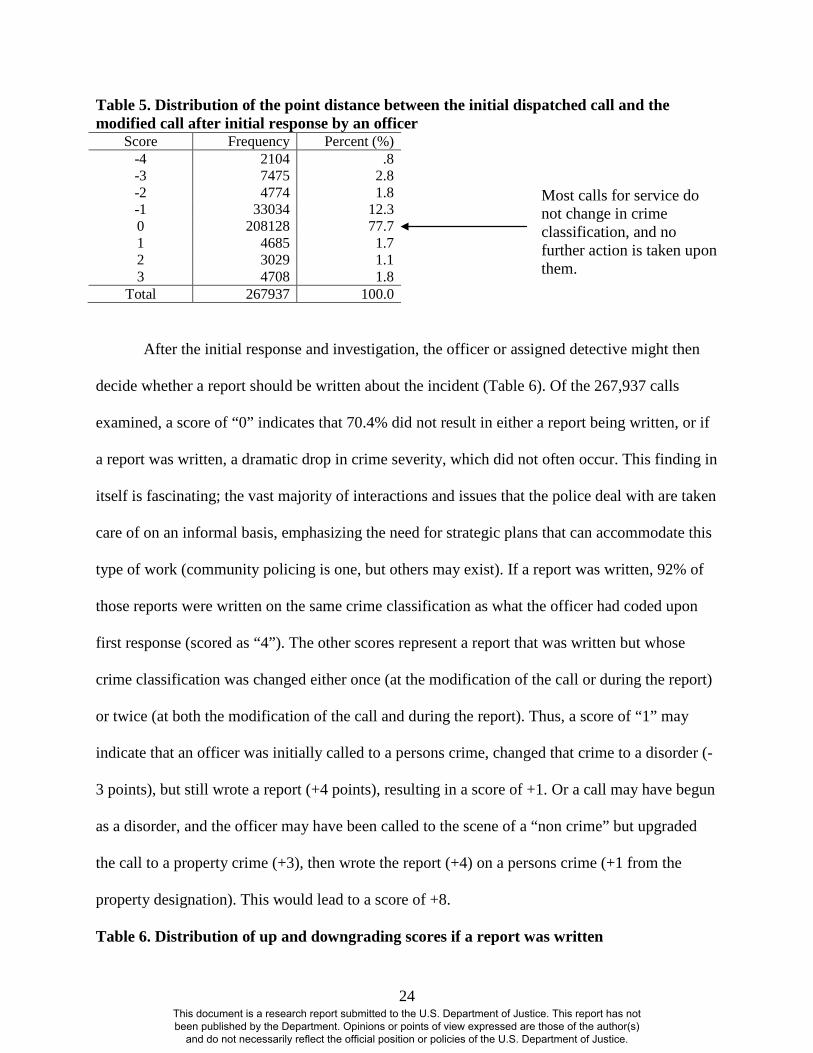
Table 5. Distribution of the point distance between the initial dispatched call and the modified call after initial response by an officer
Score Frequency Percent (%) -4 2104 .8 -3 7475 2.8 -2 4774 1.8 -1 33034 12.3 0 208128 77.7 1 4685 1.7 2 3029 1.1 3 4708 1.8
Total 267937 100.0
After the initial response and investigation, the officer or assigned detective might then
decide whether a report should be written about the incident (Table 6). Of the 267,937 calls
examined, a score of “0” indicates that 70.4% did not result in either a report being written, or if
a report was written, a dramatic drop in crime severity, which did not often occur. This finding in
itself is fascinating; the vast majority of interactions and issues that the police deal with are taken
care of on an informal basis, emphasizing the need for strategic plans that can accommodate this
type of work (community policing is one, but others may exist). If a report was written, 92% of
those reports were written on the same crime classification as what the officer had coded upon
first response (scored as “4”). The other scores represent a report that was written but whose
crime classification was changed either once (at the modification of the call or during the report)
or twice (at both the modification of the call and during the report). Thus, a score of “1” may
indicate that an officer was initially called to a persons crime, changed that crime to a disorder (-
3 points), but still wrote a report (+4 points), resulting in a score of +1. Or a call may have begun
as a disorder, and the officer may have been called to the scene of a “non crime” but upgraded
the call to a property crime (+3), then wrote the report (+4) on a persons crime (+1 from the
property designation). This would lead to a score of +8.
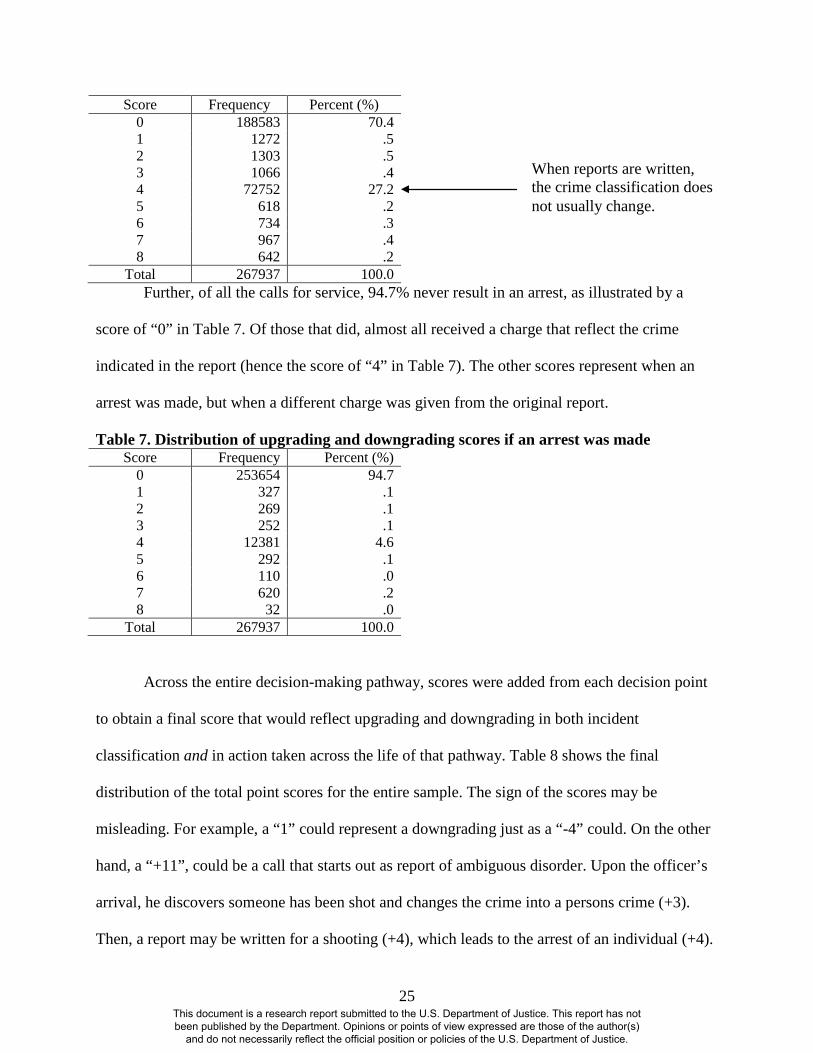
Table 6. Distribution of up and downgrading scores if a report was written
Most calls for service do not change in crime classification, and no further action is taken upon them.
This document is a research report submitted to the U.S. Department of Justice. This report has not been published by the Department. Opinions or points of view expressed are those of the author(s)
and do not necessarily reflect the official position or policies of the U.S. Department of Justice.
25
Score Frequency Percent (%) 0 188583 70.4 1 1272 .5 2 1303 .5 3 1066 .4 4 72752 27.2 5 618 .2 6 734 .3 7 967 .4 8 642 .2
Total 267937 100.0 Further, of all the calls for service, 94.7% never result in an arrest, as illustrated by a
score of “0” in Table 7. Of those that did, almost all received a charge that reflect the crime
indicated in the report (hence the score of “4” in Table 7). The other scores represent when an
arrest was made, but when a different charge was given from the original report.
Table 7. Distribution of upgrading and downgrading scores if an arrest was made Score Frequency Percent (%)
0 253654 94.7 1 327 .1 2 269 .1 3 252 .1 4 12381 4.6 5 292 .1 6 110 .0 7 620 .2 8 32 .0
Total 267937 100.0
Across the entire decision-making pathway, scores were added from each decision point
to obtain a final score that would reflect upgrading and downgrading in both incident
classification and in action taken across the life of that pathway. Table 8 shows the final
distribution of the total point scores for the entire sample. The sign of the scores may be
misleading. For example, a “1” could represent a downgrading just as a “-4” could. On the other
hand, a “+11”, could be a call that starts out as report of ambiguous disorder. Upon the officer’s
arrival, he discovers someone has been shot and changes the crime into a persons crime (+3).
Then, a report may be written for a shooting (+4), which leads to the arrest of an individual (+4).
When reports are written, the crime classification does not usually change.
This document is a research report submitted to the U.S. Department of Justice. This report has not been published by the Department. Opinions or points of view expressed are those of the author(s)
and do not necessarily reflect the official position or policies of the U.S. Department of Justice.
26
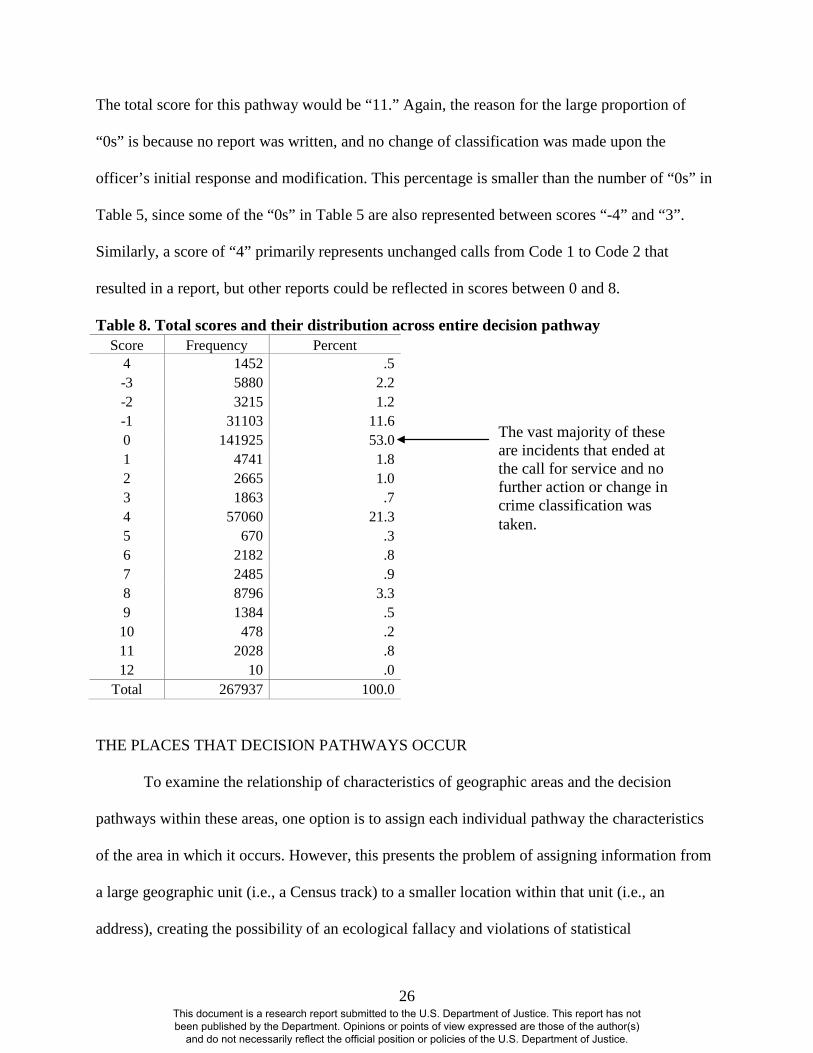
The total score for this pathway would be “11.” Again, the reason for the large proportion of
“0s” is because no report was written, and no change of classification was made upon the
officer’s initial response and modification. This percentage is smaller than the number of “0s” in
Table 5, since some of the “0s” in Table 5 are also represented between scores “-4” and “3”.
Similarly, a score of “4” primarily represents unchanged calls from Code 1 to Code 2 that
resulted in a report, but other reports could be reflected in scores between 0 and 8.
Table 8. Total scores and their distribution across entire decision pathway Score Frequency Percent
4 1452 .5 -3 5880 2.2 -2 3215 1.2 -1 31103 11.6 0 141925 53.0 1 4741 1.8 2 2665 1.0 3 1863 .7 4 57060 21.3 5 670 .3 6 2182 .8 7 2485 .9 8 8796 3.3 9 1384 .5
10 478 .2 11 2028 .8 12 10 .0
Total 267937 100.0
THE PLACES THAT DECISION PATHWAYS OCCUR
To examine the relationship of characteristics of geographic areas and the decision
pathways within these areas, one option is to assign each individual pathway the characteristics
of the area in which it occurs. However, this presents the problem of assigning information from
a large geographic unit (i.e., a Census track) to a smaller location within that unit (i.e., an
address), creating the possibility of an ecological fallacy and violations of statistical
The vast majority of these are incidents that ended at the call for service and no further action or change in crime classification was taken.
This document is a research report submitted to the U.S. Department of Justice. This report has not been published by the Department. Opinions or points of view expressed are those of the author(s)
and do not necessarily reflect the official position or policies of the U.S. Department of Justice.

27
independence. Hierarchical models are useful when both individual and place-based covariates
exist, where individual incidents are nested inside of larger areas. However, in this study, neither
individual co-variates are available, nor can characteristics of places be specified at the level of
an incident’s address. Yet, using large areas like neighborhoods, tracts, or police beats to
compare decision making trend, may also not be useful. Smith (1986), for example, examined
discrete neighborhoods, Petrocelli, Piquero, & Smith (2003) used Census tracts, and Liska and
Chamlin (1984) use cities). There may be high levels of spatial heterogeneity across these larger
geographic units in not only attributes of race, ethnicity, or economic characteristics of place, but
also officer decision making. This heterogeneity may be masked with aggregation (Weisburd,
Bernasco, & Bruinsma, 2009) or lost if only a few of these places are studied (Hipp, 2007;
Oberwittler & Wikström, 2009). Oberwittler and Wikström (2009) for instance, argue that
individuals tend to assess and be impacted by areas immediately surrounding their residence, and
that using smaller areas as geographic units of analysis is more advantageous because more
homogenous observations within those areas can be found (Oberwittler & Wikström call this
“homogenous heterogeneity,” p. 57).
A compromise for this study involved three actions: decreasing the size of the geographic
unit within which previous analysis had been conducted; comparing the entire field of these units
within a jurisdiction; and averaging total and specific decision pathway scores at these small
places to gain the tendencies of upgrading and downgrading at these places. At a practical level,
comparing decision making in smaller geographic units of analysis reinforces the reality that
police decision making occurs at much smaller and more specific places, even smaller than an
officer’s police beat. However, there is a tradeoff. As geographic units become smaller,
information at those places becomes less available. The smallest geographic area in which both
This document is a research report submitted to the U.S. Department of Justice. This report has not been published by the Department. Opinions or points of view expressed are those of the author(s)
and do not necessarily reflect the official position or policies of the U.S. Department of Justice.

28
socioeconomic and demographic information can be obtained for this study is the Census block-
group, of which there are 568 in this jurisdiction averaging 0.15 square miles. The block-group
can be conceptualized at the smaller geographic side of Brantingham and Brantingham’s (1981)
meso level of geography and is, on average, about one-sixth the size of the average patrol beat in
this city.
Thus, for this analysis, the decision pathway tendency within that block group, as
quantified by averages of upgrading and downgrading scores, is calculated for each of the 568
block groups. To achieve this, the location of the start of the decision pathway is geographically
referenced in ArcGIS9
Table 9 shows descriptive statistics of the average pathway scores for each decision
within the pathway for the 568 block groups in this jurisdiction. Each of the 568 block groups
contain, on average, approximately 471 decision pathways (standard deviation 823.80). The
mean in the row labeled “average score change from initial call to modification” reflects the
mean of the averages of the scores of the first decision point in the pathway across block groups.
Thus, -0.18 indicates that, on average, block groups had pathways experiencing a slight
downgrading of .18 points (s.d. = .069 points) when an officer initially responded and modified
the call. Similarly, the average upgrade from the modified call for service to the report writing
stage indicates that when averaging across block groups, the average scores of the decision to
so that each incident can be assigned to the specific Census block group
through a process of spatial joining of individual x-y coordinates to areas indicating block
groups. This allows for scores from decision pathways (specific scores at each decision point and
the total scores) to be averaged across each block group, and for those averages to be analyzed
with characteristics of that block group.
9 www.esri.com/software/arcgis
This document is a research report submitted to the U.S. Department of Justice. This report has not been published by the Department. Opinions or points of view expressed are those of the author(s)
and do not necessarily reflect the official position or policies of the U.S. Department of Justice.

29
make a report within those pathways was 1.23. This is less than 4, since the vast majority of
incidents did not result in a report.
Table 9. Mean Decision and Pathway Scores Across Block Groups
N Min. Max. Mean S.D. Average score change from initial call to modification 568 -.50 .12 -.184 .069
Average score change modification to report and report type 568 .50 2.29 1.23 .244
Average score change from report to arrest and arrest type 568 .00 .93 .15 .110
Average score of the total decision pathway score for each block group 568 .31 2.5 1.19 .308
The next step in this analysis was to use multivariate regression to determine what might
predict these upgrading and downgrading tendencies in block groups. However, including these
averages of upgrading and downgrading in multivariate regression may lead to misspecification
of the regression model due to spatial dependence in the data (see Chainey and Ratcliffe, 2005;
Ward and Gleditsch, 2008). Decision-making tendencies by officers in one block group may be
spatially dependent on tendencies in adjacent block groups. The possibility of this occurring with
police behavior within neighboring places is high; often the same officers are responding to
adjacent places, and spatial dependence is often found to exist among many socioeconomic
variables, including crime. Using a spatially lagged dependent variable regression model,
therefore, is appropriate in order to achieve more accurate model estimates. Indeed, for this
study, conducting regression using spatially lagged dependent variables always improved the fit
of each regression model. So, to create spatially lagged average decision score for each block
This document is a research report submitted to the U.S. Department of Justice. This report has not been published by the Department. Opinions or points of view expressed are those of the author(s)
and do not necessarily reflect the official position or policies of the U.S. Department of Justice.

30
group across the decision pathway and for the entire pathway, the software GeoDa10
was
employed (see Anselin, 2003; Anselin, Syabri, & Kho, 2006). All of the regression models
below use the spatially lagged average pathway scores for each block group.
FACTORS INFLUENCING DECISION PATHWAYS
For the covariates of the regression models, the initial literature review served as
guidance as to possible place-based factors that might influence police discretion. For example,
the level of violent crime as well as calls for service were recorded for each block group, as the
legalistic perspective (supported by Smith, 1986) emphasizes that both may influence police
discretion. Because the conflict perspective has traditionally focused on racial and ethnic
composition, the percentage of Black, White, Asian, Hispanic, and foreign-born residents, as
well as the proportion of households that were linguistically isolated were collected for each
block group. More broadly, however, a social disorganization perspective, in addition to racial
and ethnic composition, may lend salience to Klinger’s notion of how deserving of service police
view communities. A number of measures from the U. S. Census have been used by scholars to
indicate social disorganization, community needs, concentrated poverty, or levels of community
wealth at places (see Anderson, 1990; Gottfredson, McNeil, & Gottfredson, 1991; Gottfredson &
Taylor, 1986; Park et al., 1925; Shaw et al., 1929; Shaw & McKay, 1942; Wooldredge, 2002).
These commonly include residential mobility; population density; percentage of people in
poverty, unemployed, or receiving public assistance; and the median income, housing values,
and education levels of residents.
As these socioeconomic indicators are highly correlated, I use principle component
analysis to reduce these variables into three factors: “DISORG,” “NEEDS,” and “WEALTH” 10 See http://geodacenter.asu.edu .
This document is a research report submitted to the U.S. Department of Justice. This report has not been published by the Department. Opinions or points of view expressed are those of the author(s)
and do not necessarily reflect the official position or policies of the U.S. Department of Justice.

31
(see Table 10). The DISORG component groups several factors associated with social
disorganization, including high loads of measures of poverty, renter-occupied homes, and
population density. The NEEDS measure included percentage of households headed by females
with children, the percentage of unemployed individuals over the age of 16, and those receiving
public assistance. Finally, the WEALTH component includes high loads of median housing
values, income, and college education.
Table 10. Rotated Component Matrix for Socioeconomic Variables DISORG NEEDS WEALTH
% renting .834
Population density (people per square mile) .802
% under poverty level .682 .524
% receiving public assistance .838
Female-headed house w/children .791
% over age 16 and unemployed .459
Median housing value for owner-occupied units .908
Median household income in 1999 -.577 .720
% over 25 with 4-year college degree -.536 .686 The KMO=.758 indicating an adequate sample size. The total variance explained by the model was 72.6%. Varimax rotated principal component matrix in five iterations.
The descriptive statistics for all of the explanatory variables used, the three factors, and
other measures of interest (including statistics on the average number of persons, property, drugs
and vice, suspicions, and disorder calls for service across block groups) are included in Table 11.
The correlation matrix for these variables is in Appendix A. Multivariate regression models were
then ran to examine the relationship between upgrading and downgrading tendencies within
block groups and place characteristics.
This document is a research report submitted to the U.S. Department of Justice. This report has not been published by the Department. Opinions or points of view expressed are those of the author(s)
and do not necessarily reflect the official position or policies of the U.S. Department of Justice.

32
Table 11. Descriptive statistics for 568 block groups in Seattle Mean S.D. Min. Max.
Total calls for service 471.55 823.801 44.00 11,738.00 Calls for service per 100 peoplea 48.88 82.710 5.25 990.44
Proportion of calls indicating violence .05 .025 .00 .16 Land area in square miles .15 .172 .02 2.48 % Black .08 .119 .00 .6519 % White .72 .241 .00 1.0000 % Asian .12 .140 .00 .7317
% Hispanic .05 .055 .00 .4442
% Foreign-born .16 .123 .00 .62
% Linguistically isolated .05 .077 .00 .61
DISORG factorb .00 1.000 -1.44 6.98
% renting .4521 .268 .00 1.00
Population Density 10,104.45 8,486.996 208.48 97,444.95
% Under poverty level .11 .108 .00 .63
NEEDS factorb .00 1.000 -1.69 6.84
% receiving public assistance .03 .045 .00 .37
Female-headed household w/children .05 .053 .00 .42
% over age 16 and unemployed .0516 .06445 .00 1.00
WEALTH factorb .00 1.000 -2.33 5.80
Median housing value 269,318 135,455 0 1,000,001
Median household income in 1999 52,753 22,173 0 200,001
% over 25 w/ 4-year college degree .48 .191 .0159 1.00
Violent crimesc 23.98 38.624 1 468
Property crimesc 114.01 152.680 6 1799
Drugs and vice crimesc 25.26 106.845 1 1578
Disorder incidentsc 132.98 296.416 5 4762
Suspicious incidentsc 117.40 172.428 10 2072 a Excluding traffic incidents. b Factors have a mean of 0 and SD=1 and the variables that loaded most highly for each factor are listed below each factor. c As derived from the initial calls for service database, given that this is the starting point of each decision pathway.
This document is a research report submitted to the U.S. Department of Justice. This report has not been published by the Department. Opinions or points of view expressed are those of the author(s)
and do not necessarily reflect the official position or policies of the U.S. Department of Justice.

33
IV. RESULTS
OVERALL DECISION PATHWAY SCORES
The first set of analyses in Table 12 displays the regression of the total pathway score
average within block groups upon crime, race and ethnicity, and socioeconomic conditions. The
purpose for displaying the three alternate models in Table 12 is to emphasize how greater model
specification—especially with racial categories, but also with crime—can lead to different
findings. In all three models, the socioeconomic components representing disorganization, needs
and wealth, as derived by the principal component analysis, are included.
Table 12. Multivariate regression models of spatially lagged full decision pathway scores Model (1)
No specific racial group specified
Model (2) Racial groups specified
Model (3) Racial groups specified and violence included
Constant
1.205*** (.016)
1.216*** (.015)
1.167*** (.021)
Calls for Service per 100 people -5.32E-005 (.000)
-1.41E-006 (.000)
DISORG Component .021** (.008)
.022** (.007)
.020** (.007)
NEEDS Component .010 (.010)
.026** (.010)
.019+ (.010)
WEALTH Component -.084*** (.008)
-.087*** (.008)
-.079*** (.009)
% Non-white -.037 (.046)
% Black -.466*** (.073)
-.494*** (.073)
% Asian .207** (.059)
.170 (.004)
% Hispanic -.234 (.141)
-.231 (.139)
Proportion of calls indicating violence 1.149** (.355)
R squared Standard error of estimate Number of Observations
.196 (.169) 566
.271 (.161) 566
.285 (.160) 560
***p<.001, **p<.01, *p<.05, +p=.062. Estimates shown are unstandardized B coefficients, with standard errors of those estimates in parentheses.
This document is a research report submitted to the U.S. Department of Justice. This report has not been published by the Department. Opinions or points of view expressed are those of the author(s)
and do not necessarily reflect the official position or policies of the U.S. Department of Justice.

34
In Model (1) of Table 12, the general racial distinction “non-White” is used. Here,
describing race in this way does not lead to race being a statistically significant predictor in
explaining differences across pathway average scores in block groups. Further, while the call rate
does not affect upgrading or downgrading, it does appears that in places with evidence of
increased wealth and less disorganization, there is a tendency for officers to downgrade calls for
service (e.g., dismiss calls, not write reports or make arrests, or reduce crime seriousness).
However, “non-White” is an amorphous classification that does not reflect the diversity
of the location or interest of this study. This city has substantial Asian, Black, and Hispanic
populations, and it may be that police treat various minority communities differently, leading to a
nullifying or watering down of effects when groups are analyzed together. Compare Model (1) to
Model (2), when race and ethnicity of these places are more specified. Increased socioeconomic
advantage remains a significant finding – as places become less disadvantaged, police tend to
show downgrading tendencies in these areas. But here, more specific findings with regard to
racial composition emerge. The greater the proportion of Black residents in a block group, the
more likely police will also downgrade (or at least upgrade less) compared to other places. For
places with greater proportion of Asian residents, the effect is the opposite; police tend to show
upgrading tendencies in these places, or increasing the initial seriousness of the call, or taking
investigations one step further.
Studies have also indicated that the levels of violence in the area, not just the level of
crime, may increase police officer use of force (Terrill & Reisig, 2003) or decrease general
police service (Smith, 1986), thereby mediating the effects of neighborhood racial
characteristics. Model (3) includes a measure of the proportion of crime reported in the block
group that indicates violence occurred. The calls for service rate was removed to avoid
This document is a research report submitted to the U.S. Department of Justice. This report has not been published by the Department. Opinions or points of view expressed are those of the author(s)
and do not necessarily reflect the official position or policies of the U.S. Department of Justice.

35
multicollinearity, as the call rate was highly correlated to the proportion of calls that indicated
violence had occurred. Notice, the fit of the model (3) improves slightly over Model (2), and the
finding is strong: Greater levels of violence means more evidence of higher total pathway scores.
This is not surprising, given that violent crimes usually result in at least a report being written
and sometimes in an arrest. Writing reports and making arrests are heavily weighted actions in
the scoring scheme used here, which contributes to this significant finding and its relative
impact. However, even when including violent crime rates, the relationship between scores, %
Black, and the socioeconomic attributes of places continues to remain significant (although the
magnitudes of the effects of the socioeconomic variables decline). This first set of analysis
indicates not only that it is important to include other races and ethnicities in places that do show
a substantial mix of groups, but also that even with the inclusion of an expectedly powerful
variable (violence), the effects of race continues to be salient.
But studies have also indicated interactive and moderating effects between neighborhood
racial composition, socioeconomic characteristics, and policing outcomes (Terrill & Reisig,
2003; Weitzer, 1999; Wu et al., 2009). Indeed, there is at least a public perception that violence
and racial composition of a place are correlated. Although Lum (under review) has found
evidence that racial composition is not significantly related to spatial densities of violence and
drug offenses in Seattle, this public perception is undoubtedly strong. To test for this possibility,
two interaction terms were added to Model (3) and shown in Model (4) in Table 13 – an
interaction between the proportion of the block group population that was Black and the
proportion that was living in poverty, as well as between % Black and the violent crime rate. The
results in Table 13 indicate not only the non-significance of these interaction terms, but that their
inclusion does not affect the significance of the main effects of % Black. The effect of violence
This document is a research report submitted to the U.S. Department of Justice. This report has not been published by the Department. Opinions or points of view expressed are those of the author(s)
and do not necessarily reflect the official position or policies of the U.S. Department of Justice.

36
becomes weaker, however. There was an effect of the socioeconomic factors in this model,
however; only the WEALTH factor emerged as significant.
Table 13. Full model including interaction terms using spatially lagged total mean pathway scores Model (4)
Complete model with interaction terms
Constant
1.183*** (.023)
DISORG Component .018+ (.009)
NEEDS Component .015 (.011)
WEALTH Component -.081*** (.009)
% Black -.744*** (.184)
% Asian -.175 (.060)
% Hispanic -.228 (.139)
Violence proportion .773++ (.733)
% Black x DISORG .022 (.069)
% Black x Proportion of calls indicating violence
4.300 (2.77)
R squared Standard error of estimate Number of Observations
.289 (.160) 560
***p<.001, **p<.01, *p<.05, +p=.052, ++p=.070. Estimates shown are unstandardized B coefficients, with standard errors of those estimates in parentheses.
It might be the case, as the second research question above suggests, that overall scores
are affected by the percentage of foreign-born individuals or linguistically isolated groups.
Perceived communication difficulties between these groups and police, as well as either real or
stereotypically believed cultural barriers, may lead to systematically different outcomes in places
officers perceive as dominated by these special ethnic sub-groups. As the correlation matrix in
This document is a research report submitted to the U.S. Department of Justice. This report has not been published by the Department. Opinions or points of view expressed are those of the author(s)
and do not necessarily reflect the official position or policies of the U.S. Department of Justice.

37
Appendix A indicates, the percentage of foreign-born and linguistically isolated residents within
block groups is highly variable in this jurisdiction (from 0% to 62%) but also highly correlated to
the percentage of Asian and Hispanic. Because of their high correlation, they are analyzed
excluding the % Asian and Hispanic variables. The results in Table 14 indicate that places with
greater populations of foreign-born individuals (Model 5) or more linguistically isolated
households (Model 6) do not differ significantly from their counterparts in terms of the overall
decision pathway scores. However, what continues to remain a consistent finding in both of these
models is that police downgrade in places with more wealth and less disorganization and with
greater proportion of Black residents. The slightly significant effect found in % foreign born
could reflect the upgrading that is occurring in the Asian community, as indicated in Table 12.
Table 14. Foreign-born and linguistically isolated communities and spatially lagged pathway scores Model (5)
Including foreign-born in the model
Model (6) Including linguistically isolated in the model
Constant
1.149*** (.021)
1.160*** (.019)
DISORG Component .017* (.007)
.015* (.007)
NEEDS Component .016 (.010)
.017 (.010)
WEALTH Component -.074*** (.008)
-.077*** (.008)
% Black -.493*** (.074)
-.495*** (.074)
Proportion of calls indicating violence 1.255*** (.355)
1.280*** (.355)
% Foreign born .140+ (.073)
Linguistically isolated household .178 (.121)
R squared Standard error of estimate Number of Observations
.274 (.161) 560
.272 (.161) 560
***p<.001, **p<.01, *p<.05, +p=.056. Estimates shown are unstandardized B coefficients, with standard errors of those estimates in parentheses.
This document is a research report submitted to the U.S. Department of Justice. This report has not been published by the Department. Opinions or points of view expressed are those of the author(s)
and do not necessarily reflect the official position or policies of the U.S. Department of Justice.

38
SPECIFIC SCORES AT DECISION POINTS
The first set of results shown above in Models 1 through 6 examine the overall tendency
of the decision pathway using the average of the total pathway scores in a block group. However,
the vast majority of incidents that the police handle never result in an arrest. To see the predictive
effects of the model for each stage of the decision pathway, Table 15 displays four regressions.
Model (7) regresses the spatially lagged averages of the first decision point of the initially
dispatched call and the officer modification independent variables on place characteristics.
Model (8) regresses the decision to write the report and for what type of incident. Model (10)
uses the dependent variable of the score from the report to the arrest stage. Additionally, given
that arrest is so rare, Model (9) examines whether factors predict the spatially lagged pathway
score up to the report but not including arrest.
Table 15. Multivariate regression models of spatially lagged decision scores within the pathway
Model (7) From initial call to officer response
Model (8) From officer response to report
Model (9) From initial call to report stage
Model (10) From report to arrest stage
Constant
-.195*** (.004)
1.256*** (.018)
1.061 *** (.019)
.106*** (.006)
DISORG Component -.003 (.001)
.005 (.006)
.002 (.006)
.018*** (.002)
NEEDS Component .000 (.002)
.017+ (.014)
.017++ (.009)
.002 (.003)
WEALTH Component -.004* (.002)
-.061*** (.007)
-.064*** (.008)
-.014*** (.003)
% Black -.007 (.015)
-.577*** (.064)
-.583*** (.066)
-.090 (.026)
% Asian .077*** (.012)
-.024 (.051)
.053 (.054)
.116*** (.018)
% Hispanic .002 (.028)
-.352** (.120)
-.349** (.125)
.118 (.043)
This document is a research report submitted to the U.S. Department of Justice. This report has not been published by the Department. Opinions or points of view expressed are those of the author(s)
and do not necessarily reflect the official position or policies of the U.S. Department of Justice.

39
Proportion of calls indicating violence
.005*** (.073)
.855** (.307)
.860** (.320)
.289** (.109)
R squared Standard error of the estimate Number of Observations
.135 (.033) 560
.235 (.139) 560
.243 (.144) 560
.434 (.049) 560
***p<.001, **p<.01, *p<.05, +p=.054, ++p=.058. Estimates shown are unstandardized B coefficients, with standard errors of those estimates in parentheses.
When examining predictors of the initial decision to change the nature of the call upon
first arrival, an interesting finding emerges. First, the proportion of crime that is violent
continues to be a salient factor in explaining upgrading at all individual decision points.
However, for different decision points, there is variation in what influences spatially lagged
scores. At the early stage of the decision pathway, where most officer responses to incidents are
completed, the magnitude of the effect of violence at places is much weaker. This most likely
points to the effect of violence on pathway scores and its disproportionate effect on the decision
of the police to write reports or arrest suspects. Further, during this initial encounter, the
proportion of Black or Hispanic residents do not emerge as significant co-variates as they did
when predicting the total pathway score (and the wealth of an area is a weak predictor). The
downgrading connected to wealthy places and places with larger Black populations seems to be
occurring at the more formal and official stages of report writing.
For Asians and Hispanics, the effects seem to vary across the pathway. During the report
writing stage, a downgrading occurs in Hispanic communities, only to see the opposite effect
(upgrading) during the arrest stage. In other words, less reports are written and for less serious
crimes in Hispanic communities, but when an arrest is made, the arrest may be for a more serious
charge. Asian communities see an upgrading effect at the first response of the officer, and also at
the arrest stage, but findings are not significant at the report writing stage. In other words, at
places that have great percentage of Asian residents, police are getting to the scene and telling
This document is a research report submitted to the U.S. Department of Justice. This report has not been published by the Department. Opinions or points of view expressed are those of the author(s)
and do not necessarily reflect the official position or policies of the U.S. Department of Justice.

40
the dispatcher that the incident is more serious than what was initially called in. When making an
arrest, the arrest may be for a more serious charge than what was indicated in the report. Again,
one should be careful about the interpretation of this finding, as with the findings regarding %
Black or higher wealth without qualitative follow-up. We do not know the motivation of the
officers at these locations. It could be that among the Asian community there is systematically an
initial tendency to report incidents as less serious, or there might be differences in
communication styles that leads to the initial misinterpretation. It may also be the case that police
feel places with more Asians deserve more upgrading. But these are only guesses, based not on
science but on stereotypes; we need further empirical and qualitative analysis to better
understand motivations. The only conclusion that can be drawn here is that there is a significant
difference in police service, which occurs as block groups have greater proportions of Asian
residents.
However, when moving across the table through the decision pathway from the modified
call for service to report (Model 8), the impact of the % Asian variable declines and flips signs,
suggesting a significant downgrading at this stage of the pathway. The % Black and % Hispanic
variables emerge as significant in the negative direction as well. Here, at the report writing stage,
places that have an increase in any minority population will also experience a significant
downgrading effect (i.e., less report writing with the possibility of also reduction in the
seriousness of crime classifications). At this stage, the WEALTH factor is the only
socioeconomic variable that remains significant, also indicating downgrading in more wealthy
areas.
When examining the cumulative score of the initial response through the reporting stage
(Model 9), our initial findings begin to reemerge—with Wealth, % Black, % Hispanic, and
This document is a research report submitted to the U.S. Department of Justice. This report has not been published by the Department. Opinions or points of view expressed are those of the author(s)
and do not necessarily reflect the official position or policies of the U.S. Department of Justice.

41
violence significantly predicting tendencies to downgrade, although the effect of the Asian
variable disappears. The fact that % Hispanic doesn’t seem to predict the entire spatially lagged
mean score across the entire pathway is likely explained by the washing out effect of
downgrading in the report stage, but upgrading in the arrest stage.
Finally, Model (10) examines the impact of these block group characteristics on only the
decision to arrest (and for what charge) once a report has been written, disregarding earlier
upgrading and downgrading. At this decision stage, the % Black is no longer relevant in
upgrading or downgrading, although wealthier communities enjoy either less arrest or charges
that are less severe than what was indicated in the report. In Asian and Hispanic communities,
arrest is more likely, or the charges given are higher than what is indicated in the written reports.
Thus, the overall downgrading effect for places with more Black residents seems concentrated at
the official report writing stage, not at the arrest stage. This downgrading effect at the rport stage
is seen to a lesser extent with the Hispanic community and not at all in the Asian communities.
And, at the arrest stage, the greater wealth and less disorganization leads also to a significant
downgrading effect as well.
DID SEPTEMBER 11th MATTER?
Since the decision pathways analyzed here occur in 2001, I include a special analysis of
the effects of September 11th on the distribution of these decision pathways. One might
hypothesize that September 11th could affect how society and law enforcement perceive minority
communities, especially those who are (or appear) foreign born or linguistically isolated. Table
16 shows some descriptive statistics before and after September 11th in terms of the means and
standard deviations of activities within Seattle’s 568 block groups. Notice that the average rate of
This document is a research report submitted to the U.S. Department of Justice. This report has not been published by the Department. Opinions or points of view expressed are those of the author(s)
and do not necessarily reflect the official position or policies of the U.S. Department of Justice.

42
calls per 100 people dropped significantly after September 11th. However, the proportion of
reports and arrests remained the same, at approximately 31% for reports and 4% for arrests.
Further, the effects of September 11th did not seem to have, overall, significantly affected the
average pathway score in block groups.
Table 16. Descriptive statistics for block groups before and after September 11th (N=568) Before 9/11 After 9/11 Total calls in BG 329 (584.3) 142 (240.8) Rate of calls per 100 people 34 (58.4) 15 (24.4) Proportion of reports written .31 (.06) .32 (.08) Proportion of arrests made .04 (.03) .04 (.03) Mean of total pathway score 1.18 (.328) 1.21 (.410)
Standard deviations in parentheses. However, the question of interest is whether September 11th had a negative effect on
places with higher proportions of racial and ethnic minorities. Unfortunately, we do not have
information on the proportion of block groups of Arab descent, which would be the most
relevant ethnicity to examine in terms of differential effects from September 11th, given the
identity of the hijackers. However, we can look at the different racial and ethnic categories that
we have as well as at the foreign-born variable. Interestingly, as Table 17 shows, when
comparing models before and after September 11th the only racial group that continues to predict
significantly different pathway scores is Black. Also of note is the influence that Asian and
foreign born communities had on decision making before and after September 11th. While being
in an Asian or foreign born community would increase the likelihood of an officer upgrading a
call for service (either to a more serious crime, or exerting more formal social control through
reporting writing or arrest), this effect does not remain salient after September 11th.
This document is a research report submitted to the U.S. Department of Justice. This report has not been published by the Department. Opinions or points of view expressed are those of the author(s)
and do not necessarily reflect the official position or policies of the U.S. Department of Justice.

43
Table 17. Before-After September 11th Analysis of Spatially Lagged Total Pathway Scores
Before September 11th After September 11th
Model (11) Before 9-11 and all races
Model (12) Before 9-11 and foreign-born
Model (13) After 9-11and all races
Model (14) After 9-11 and foreign-born
Constant
1.154*** (.021)
1.134*** (.021)
1.197*** (.027)
1.185*** (.028)
DISORG Component .023** (.007)
.019** (.007)
.015 (.009)
.012 (.009)
NEEDS Component .015 (.010)
.013 (.010)
.028* (.013)
.027* (.013)
WEALTH Component -.084*** (.009)
-.079*** (.009)
-.071*** (.011)
-.066** (.011)
% Black -.484*** (.075)
-.485*** (.075)
-.529*** (.097)
-.526*** (.179)
% Asian .213*** (.060) .065
(.078)
% Hispanic -.197 (.141) -.299
(.183)
Proportion of calls indicating violence (for each time period)
1.049** (.361)
1.168** (.361)
1.336** (.463)
1.413*** (.466)
% Foreign Born .192* (.074) .006
(.096)
R squared Standard error of the estimate Number of Observations
.306 (.163) 560
.296 (.164) 560
.153 (.211) 560
.147 (.212) 560
***p<.001, **p<.01, *p<.05. Estimates shown are unstandardized B coefficients, with standard errors of those estimates in parentheses.
V. DISCUSSION: WHAT MIGHT EXPLAIN THESE FINDINGS?
The assertions of Banton (1964), Smith (1986), Terrill & Reisig (2003) and others are
generally strengthened with these findings. Police do respond differently in different
neighborhoods, which is even more evident when examining decisions made by officers at
different stages of an investigation. This finding is also robust for different crimes and across
different places. In this study, I examined all crime and disorder (excluding traffic incidents), all
This document is a research report submitted to the U.S. Department of Justice. This report has not been published by the Department. Opinions or points of view expressed are those of the author(s)
and do not necessarily reflect the official position or policies of the U.S. Department of Justice.

44
places, multiple racial and ethnic groups and subgroups, and three decision-making points across
the investigation of an incident. I also ran models to anticipate interactive effects between block
group racial composition, socioeconomic characteristics, violence, and policing outcomes. These
interactions were not statistically significant. Foreign-born or linguistically isolated groups
included in the models also did not result in consistently significant differences in officer
response at places. Even when examining these trends before and after the events of September
11th (thinking that perhaps officers may have changed their responses to foreign-born and
immigrant communities), the findings were the same. Wealthier communities or neighborhoods
with greater proportion of Black residents continued to experience an overall downgrading effect
in how crime and disorder incidents are handled by the police. Similar effects are not
consistently seen for places with larger proportions of Asian, Hispanic, foreign-born, or
linguistically isolated households, although there are significant upgrading and downgrading
activities at particular points in an investigation for these other groups.
Although many interesting questions arise from the above analysis, one consistently
arises: Why do officers exhibit this tendency to downgrade in both Black and wealthy
communities? The motivations behind the decision pathways cannot be deciphered here, and
extreme caution should be taken in guessing why this is occurring. Such conjectures are
dangerous and can be misinterpreted and misused. However, the correlation in the downgrading
of calls in places with greater wealth or in places with more Black residents for total pathway
scores provokes curiosity. This is especially interesting given Figure 4. Places of greater wealth
are not the same places that Black residents live, which rules out the possibility that both
communities experience downgrading because they are the same places. Other factors may be at
This document is a research report submitted to the U.S. Department of Justice. This report has not been published by the Department. Opinions or points of view expressed are those of the author(s)
and do not necessarily reflect the official position or policies of the U.S. Department of Justice.

45
play, and I only present ideas as proposals and hypotheses for further testing and qualitative
research, rather than definitive statements about motivations, which cannot be discerned.
Figure 4. Comparison of spatial distribution of Black population and wealth
To begin, one approach to probing this phenomenon with this data is to examine just
those places that would provide an officer with the strongest cues about the racial and economic
characteristics of those places and compare what the decision-making trends are within those
places. Such a “most different” comparative approach (see Przeworski and Teune, 1970) might
juxtapose the phenomena in a way that lends to revealing interesting nuances. To determine such
places, consider those block groups that fall within the top tenth percentile of the greatest
percentage of its category. For racial composition, this means those places with roughly 25% or
more Black residents. For wealthy areas, the top tenth percentile of the wealthiest of block
groups are those whose median household incomes are greater than $80,000. Going back to our
original 267,937 incidents, there were 33,637 incidents that took place in the block groups with
25% or more Black residents, and 11,107 incidents that took place in block groups with greater
than $80,000 median household income. The distribution of the mean of the transitions for each
This document is a research report submitted to the U.S. Department of Justice. This report has not been published by the Department. Opinions or points of view expressed are those of the author(s)
and do not necessarily reflect the official position or policies of the U.S. Department of Justice.

46
decision point is shown in Table 18. Notice, the differences in scores begin to become more
apparent later in the pathway, and there is a .27 point differential for the total pathway score
between places that have high proportions of Black and wealthy residents, suggesting greater
extent of downgrading in wealthier compared to Black-dominated communities.
Table 18. Mean decision pathway scores for block groups with greater than 25% Black residents and block groups with greater than $80,000 median household income
% Black >25% N= 33,637
Median income > $80K N=11,107
Initial call to modification -0.18 (0.952) -0.19 (0.705) Modification to report 1.15 (1.843) 1.03 (1.766) Report to arrest 0.23 (0.978) 0.09 (0.623) Total decision pathway score 1.20 (2.713) 0.93 (2.246)
Standard deviations in parentheses. Figure 5 maps the accumulation of scores from Table 10 across the decision pathway.
Although downgrading may occur in both wealthy areas and areas with a high proportion of
Black residents, there is a greater tendency to handle incidents less formally (without report or
arrest) in the top tenth percentile of medium incomes than in the top tenth percentile of Black
population, especially at the reporting stage.
Figure 5. Cumulative decision point scores of block groups with greater than 25% Black or more than $80K median income
-0.4
-0.2
0
0.2
0.4
0.6
0.8
1
1.2
1.4
Initial call tomodification
Initial call to Report Initial call to arrest(full pathway)
Cumulative Decision Point Scores
Ave
rage
Sco
re
>25%Black
>80K income
This document is a research report submitted to the U.S. Department of Justice. This report has not been published by the Department. Opinions or points of view expressed are those of the author(s)
and do not necessarily reflect the official position or policies of the U.S. Department of Justice.
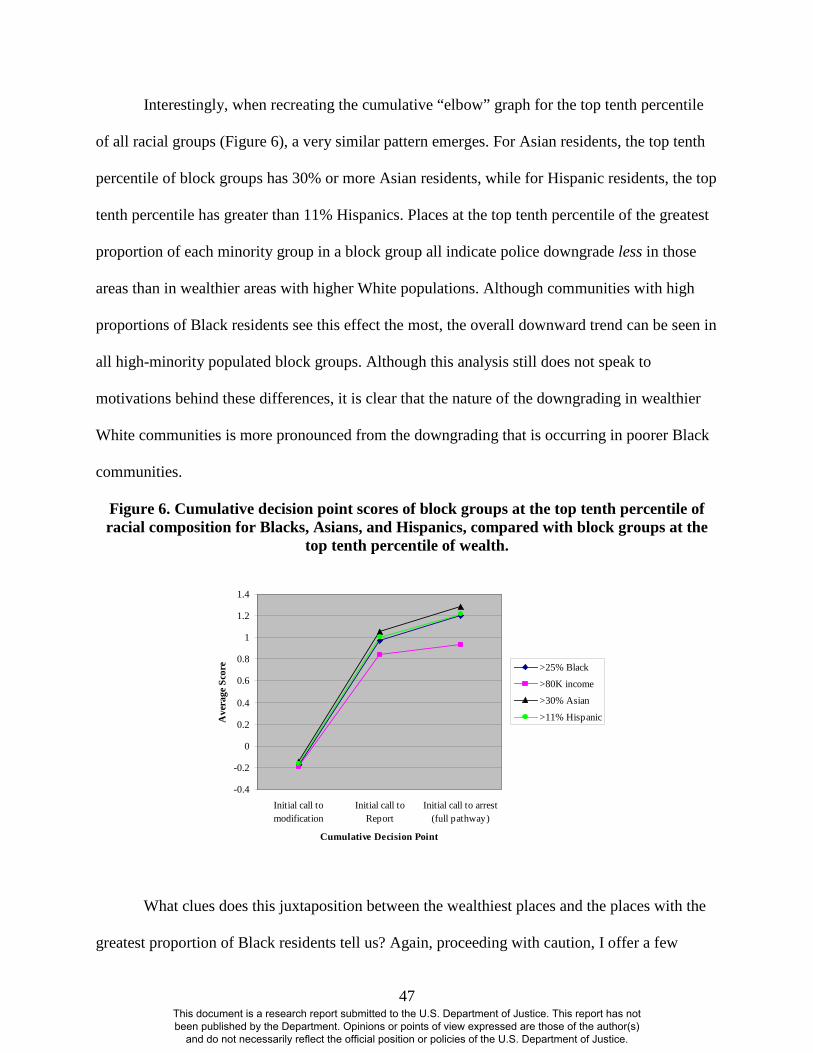
47
Interestingly, when recreating the cumulative “elbow” graph for the top tenth percentile
of all racial groups (Figure 6), a very similar pattern emerges. For Asian residents, the top tenth
percentile of block groups has 30% or more Asian residents, while for Hispanic residents, the top
tenth percentile has greater than 11% Hispanics. Places at the top tenth percentile of the greatest
proportion of each minority group in a block group all indicate police downgrade less in those
areas than in wealthier areas with higher White populations. Although communities with high
proportions of Black residents see this effect the most, the overall downward trend can be seen in
all high-minority populated block groups. Although this analysis still does not speak to
motivations behind these differences, it is clear that the nature of the downgrading in wealthier
White communities is more pronounced from the downgrading that is occurring in poorer Black
communities.
Figure 6. Cumulative decision point scores of block groups at the top tenth percentile of racial composition for Blacks, Asians, and Hispanics, compared with block groups at the
top tenth percentile of wealth.
What clues does this juxtaposition between the wealthiest places and the places with the
greatest proportion of Black residents tell us? Again, proceeding with caution, I offer a few
-0.4
-0.2
0
0.2
0.4
0.6
0.8
1
1.2
1.4
Initial call tomodification
Initial call toReport
Initial call to arrest(full pathway)
Cumulative Decision Point
Ave
rage
Sco
re >25% Black
>80K income
>30% Asian
>11% Hispanic
This document is a research report submitted to the U.S. Department of Justice. This report has not been published by the Department. Opinions or points of view expressed are those of the author(s)
and do not necessarily reflect the official position or policies of the U.S. Department of Justice.

48
suggestions. It is very possible that the discrepancy arises from the communities themselves.
Places with great wealth and places with minority homogeneity may both exert their own
informal social control for various reasons, and thus, before, or even after an officer’s arrival at
the scene, disputes are settled through these informal mechanisms. Wealthy neighbors can afford
to pay other neighbors for their children’s vandalism, for example, or more homogenous
minority communities may have internal systems of regulation they use if trust in the police is
low. On the other hand, discrepancies may result entirely on the officer’s side, due to lack of
care, concern, bias, or interest in either of these areas. At the initial response stage for all block
groups, for example, we see significant downgrading in wealthy areas, but not areas with great
proportions of Black residents.
However, the greater intensity of downgrading in wealthier (and usually White)
communities than Black (and usually poorer) communities overall suggests more than just
explanations that originate from only the community or the police sides. More likely at play is a
combination of police and citizen perceptions, and symbolic and real interactions that take place
between officers and civilians. For example, greater downgrading in wealthier communities
might suggest police trust people in these places to “handle things” more than they do in Black
communities, or that those in wealthier communities may more successfully exert pressure on the
police to discontinue an investigation. Officers from a predominantly white police force (which
this agency is), may be more comfortable in allowing for more informal social control in
communities which most closely resemble their own and take on a more paternalistic than
legalistic role. This hypothesis suggests that both community forces and how the police interact
with those forces are responsible for the resulting patterns of downgrading. There could be real
and perceived power differentials, expectations, and varied feelings between different
This document is a research report submitted to the U.S. Department of Justice. This report has not been published by the Department. Opinions or points of view expressed are those of the author(s)
and do not necessarily reflect the official position or policies of the U.S. Department of Justice.

49
communities, and the police that might cause this effect. Perhaps these findings offer enough
support for further testing of a community perspective of Black’s theory of discretion and power
differentials at more macro levels.
Or, the fact that Black communities are being downgraded, but at the same time, much
less so than their wealthier counterparts, may reflect complex dual and seemingly contradictory
forces: Police may exercise less social control overall in Black communities, but when they do
exercise it, are more likely to exert it more intensively. In other words, Donald Black’s idea of a
lack of worthiness afforded by officers to certain individuals perceived to be of lower status may
be salient enough to explain downgrading, but at the same time, these feelings are accompanied
by a heavier hand in Black-dominated communities, which explains less downgrading than in
wealthier places. This type of conflicting mentality might also explain why others have found
greater use of force in Black communities, accompanied by much lower levels of legitimacy
afforded to police by minorities. This relatively greater use of force (as indicated by relatively
less downgrading) may reflect feelings of anger towards these communities, rather than more
paternalistic feelings (which could lead to greater downgrading in wealthier communities).
One suggestion given by a reviewer was that downgrading in Black neighborhoods could
reflect the use of violence to enforce “no snitching” rules. These informal understandings in
communities, especially in ethnic minority communities, inhibit individuals from serving as
witnesses to crimes against themselves or others, leaving the police powerless to exercise formal
social control. The findings here do not support such a hypothesis. According to these findings, if
no snitching was salient, then wealthier White communities seem to exercise this better than
minority-dominant communities in which the no-snitching phenomenon seems to be most
This document is a research report submitted to the U.S. Department of Justice. This report has not been published by the Department. Opinions or points of view expressed are those of the author(s)
and do not necessarily reflect the official position or policies of the U.S. Department of Justice.

50
publicized. Further, if a "don’t snitch" situation were real, then downgrading would sharply
occur in the Black community at the report and arrest stage, which is not the case here.
Clearly, more digging is needed. However, the findings emphasize that it is not sufficient
only to examine the individual racial characteristics of officers, suspects, victims, and witnesses
in explaining officer decisions. The environment can also be correlated to behavior in important
ways. Although this study does not examine which effect might be stronger (individual-level
information was not available on these incidents), and motivations of upgrading and
downgrading can only be offered as hypotheses, this and other studies indicate that
environmental cues condition individual action and do not simply act as a passive context for
those actions. In this study, these environmental cues consist of racial and ethnic makeup, levels
of violence, and socioeconomic status of the very small places where officers patrol. Such cues
provide officers and others with a quick understanding of the types of people within a location,
which in turn may condition their responses to incidents at those places. Place-based cues do not
have to be racial or socioeconomic (although arguably, these are the strongest place-based cues).
A place-based theory of policing should also take into account other environmental
characteristics that may influence police officer decision making. These might include the
physical layout of streets and buildings, the proportion of places that are business establishments,
or the presence of certain types of environmental markers that can be magnets for certain crimes
and the level of physical or social disorder (e.g., parks, public swimming pools, bars, subway
stations, abandoned homes, alleys). This study provides a new dependent variable—the decision
pathway—with which to examine the influence of these place markers.
Despite these steps forward, this study, like so many others examining whether disparities
in police service exist, still cannot tell us why we see this differential response. This analysis
This document is a research report submitted to the U.S. Department of Justice. This report has not been published by the Department. Opinions or points of view expressed are those of the author(s)
and do not necessarily reflect the official position or policies of the U.S. Department of Justice.
51
cannot give us insight into the minds of officers as to whether racial bias influenced their
decisions. This proves intent for prejudice is not only difficult short of admission, but such
prejudice is intricately part of human behavior and can be hidden under layers of consciousness,
organizational rules, symbolic interactions, and worldviews (Horowitz, 1985). Additionally, the
origination of the disparities that emerge from this analysis may not unilaterally come from the
police; they may arise from an interaction between officers’ supply of law enforcement and the
demand of services by the community. Expectations of this interaction, of course, are shaped by
both historical forces and prejudices, but also by current interactions.
The only way for us to understand the reasons for these differences is through further
systematic and qualitative approaches, including social observations, ethnographic analyses, and
in-depth interviews or longitudinal psychological examination of officer and citizen mentality.
For example, it might be interesting to test new recruits and existing personnel using instruments
such as the Implicit Associations Test (Greenwald, McGhee & Schwartz, 1998)11
11 See
before and
after they are assigned to certain areas. Such tests may help participants answer questions in
which they might be too embarrassed or ashamed to answer truthfully. In theory, a randomized
controlled experiment could be conducted, assigning officers to locations and measuring scores
at different points in their careers, given that recruits usually have no choice as to where they are
assigned. Longitudinal ethnographies and studies of officers, like those undertaken by
Rosenbaum and Scrivner (2009) are also essential in understanding how officers’ worldviews
and behaviors change over time. Such studies are essential in improving training and support that
might counteract negative effects of the job that may reduce the quality of future service.
https://implicit.harvard.edu/implicit/demo/background/index.jsp. An anonymous peer reviewer suggested the use of this test, which the author agrees could be useful.
This document is a research report submitted to the U.S. Department of Justice. This report has not been published by the Department. Opinions or points of view expressed are those of the author(s)
and do not necessarily reflect the official position or policies of the U.S. Department of Justice.

52
Nevertheless, no matter the individual motivations behind such disparities, place-based
disparities can contribute to the deterioration of police legitimacy. As the National Research
Council (2004) emphasized, even with mixed research findings about whether race influences
officer decisions, what is equally important is that perceptions of differential treatment still exist
(see Durose, Schmitt, & Langan, 2005; Engel, 2005, 2008; Langan, Greenfield, Smith, Durose,
& Levin, 2001; Sampson & Bartusch, 1998; Weitzer, 1999; Weitzer & Tuch, 2002; Wu, Sun, &
Triplett, 2009). Such perceptions, even in the absence of overt prejudice, can lead to significant
reductions in police legitimacy—an important resource that the police require in order to fight
crime.
VI. RECOMMENDATIONS TO POLICING
Thus, the dilemma of research regarding the effects of race on decision making remains.
Researchers cannot overstate their findings or draw conclusions without evidence. At the same
time, people have real perceptions of disparity that can undermine police legitimacy and police-
citizen relations. Police mentality is scientifically difficult to discern, even though police
researchers and practitioners know that racial prejudice and anger does exist and can profoundly
affect decision-making. And, the nature of bias itself is complex, involving forces that may be
immeasurable or unable to be addressed. How then, can findings about differences in police
practices across places be used? I close with three general recommendations related to these
place-based findings.
This document is a research report submitted to the U.S. Department of Justice. This report has not been published by the Department. Opinions or points of view expressed are those of the author(s)
and do not necessarily reflect the official position or policies of the U.S. Department of Justice.

53
1. Police must openly acknowledge that officers treat neighborhoods differently. Prospects and problems in differential treatment should be approached from a community-oriented and legitimacy-development perspective and should be discussed in training.
Outsiders might believe, perhaps incorrectly, that police officers are trained to treat
everyone in every place they encounter lawfully and similarly. But this type of knowledge
acquisition is rare in police academies and in policing more generally, which focus more on
procedural and operational expectations and awareness when responding to individual calls for
service. For example, what is commonly taught are expectations about what officers might
encounter in responding to incidents (such as danger cues), awareness of the importance of rank
and hierarchy, or how the profession might affect family life. This is in contrast to training
officers how the cultural, environmental, and organizational aspects of the job might affect their
world views, prejudices, or personal health (for example, substance abuse, post traumatic stress
disorder, or physical well-being). With regard to how places and people may affect officer
mentality (and therefore their decision-making), officers are rarely explicitly told that policing
particular certain places, or the policing profession itself, may make them more cynical, racially
prejudiced, angry, or judgmental.
Furthermore, they are not given cognitive or operational tools or outlets to counteract
such effects. Information suggesting that police treat different races and ethnicities differently,
and that usually the poorest treatment occurs towards poor, Black communities. Indeed, they
might even be discouraged to discuss race entirely. Rather, police are sometimes informally
mentored by academy instructors or field training officers that it is natural to police certain areas
differently depending on the socioeconomic and ethnic makeup of an area. Interestingly, officers
may be specially (and openly) trained in how to respond to calls for service in non-Black,
minority communities, such as those which are Hispanic, Asian, or religiously dominant. Such
This document is a research report submitted to the U.S. Department of Justice. This report has not been published by the Department. Opinions or points of view expressed are those of the author(s)
and do not necessarily reflect the official position or policies of the U.S. Department of Justice.

54
specialized training is often built into formal curricula under the guise of “racial sensitivity” or
“diversity” training, and sometimes in officer safety modules. However, this specialized training
often ignores the treatment of Black communities. This is a serious flaw that can further
reinforce stereotypes for all minority groups, not just Asians or Hispanics.
“Diversity Training,” could be vastly improved in this regard. Such modules are dutifully
attended by officers, but are often viewed with disdain. While part of this negative attitude may
reflect prejudice, such training may also viewed with disdain because officers perceive them as
having little substantive value (and rather a political necessity). Being told that diversity leads to
a better working environment, or that officers need to be sensitive to religious or linguistically-
isolated communities does little to link the issues of race or religion directly with police
outcomes. An alternative would be to provide officers with concrete evidence, information, and
facts regarding racial disparities and policing, perhaps even specific to their agency as generated
through crime analysis. This in turn provides a basis by which discussion can be fostered in an
open environment. In other words, academies and in-service training should approach education
as not an opportunity to dole out directives, procedures, and train operational awareness, but as a
place where open discussion, critical thinking, and analytic thought can be explored.
2. Awareness and acknowledgement must be supported by operational structures that counteract such forces. Unfortunately, change does not simply occur through awareness of facts during training;
structural changes are required that allow for, and even force, alternatives to the way decision
making occurs at both the street and command levels. There are two operational areas that may
help counteract place-based biases in police – changes in the nature of supervision and in the
way patrol officers are deployed. In terms of supervision, I focus on first-line supervisors, who
have the most interaction, influence, and control over the daily decisions officers make in the
This document is a research report submitted to the U.S. Department of Justice. This report has not been published by the Department. Opinions or points of view expressed are those of the author(s)
and do not necessarily reflect the official position or policies of the U.S. Department of Justice.

55
places that they are made. Not only must first-line supervision increase, but the role of that
supervisor (and hence the interactions between that supervisor and the officer) needs to change in
order for discretion to be reshaped. Both of these recommendations can arise from a single
reform: First-line supervisors must be armed with different, more, and systematically collected
information and evidence about operations and effects of policing on officers. This is in sharp
contrast to the current situation in American policing. First-line supervisors have become
specialists in understanding and applying the rules and regulations of the agency as delineated in
the agency’s standard operating procedures manual which in turn has resulted in a style of
supervision that is passive and reactive. They tend to focus on applying the agency’s general
orders after an infraction has occurred. Thus, the role of the first-line supervisor is drastically
reduced to the personification of that order, rather than as a operational leader in crime
prevention and quality of service.
This in turn results in officers exercising wide-ranging, unstructured, and non-evidence-
based discretion in the complete absence of supervisor guidance or information related to crime
prevention. This unsupervised and wide-discretion not only indicates low levels of leadership
within the first line supervisory rank, but also can result in systematically biased response by
officers as they respond through their own worldviews and squad sub-cultures. While increasing
watchfulness might reduce such disparities, it may not structure discretion in ways that can
reduce bias and crime and increase legitimacy. Structured discretion does not simply come from
more supervision; first line supervisors have to be armed with information and evidence that
changes the way they direct their squads to address crime and quality of life concerns. This is
why police leaders should not just pay “lip service” to alternative deployment strategies such as
problem-oriented approaches to community problems. Problem-oriented strategies are by
This document is a research report submitted to the U.S. Department of Justice. This report has not been published by the Department. Opinions or points of view expressed are those of the author(s)
and do not necessarily reflect the official position or policies of the U.S. Department of Justice.

56
definition proactive, and specific to a targeted, small-scale, geographic area. Not only can such a
scheme increase the quality of response by a patrol squad to a particular area, but by doing so
especially in areas where downgrading is known to occur (particularly Black communities),
more specific, structured service is applied.
Further, awareness of racial bias, especially in places at high risk for this type of bias,
must constantly be reinforced on the street in the same way that awareness of danger or crime
prevention should be reinforced. Sergeants must be aware, and make their squads constantly
aware, that racial stereotyping and bias can become a subconscious and regular part of policing if
left unchecked. By reminding their squads of this problem, and by changing the nature of the
police response, officers can become more conscious of why they make certain decisions, and
also structure those decisions through clear directives based in crime prevention. First line
supervisors are also the connection between the community and their officers; they should take
charge of facilitating communication between minority community members and officers who
work in their neighborhoods, as well as sifting through and prioritizing community requests
during daily police activities.
This type of leadership also cannot be done half-heartedly or without conviction.
Leadership at this level often is weakened by the “parent-friend” effect; many first-line
supervisors in policing walk a fine line between being respected by their officers so that tasks get
done and wanting to be accepted as a “friend” by their squads. In sensitive discussions of race,
especially, supervisors have to assume the difficult but necessary role of talking to their officers
openly about race and racial prejudice, providing their officers with opportunities to interact
positively with members of groups who are different from that officer’s race or background, and
work with individual officers who have negative views that debilitate their function. This is a tall
This document is a research report submitted to the U.S. Department of Justice. This report has not been published by the Department. Opinions or points of view expressed are those of the author(s)
and do not necessarily reflect the official position or policies of the U.S. Department of Justice.
57
order for American policing. Changing the role of the first line supervisor to be more proactive,
more knowledge and evidence-based, and more active in counteracting officer problems
proactively is a complete paradigm shift of patrol supervision. The reader might see such
suggestions as a too much to ask for supervisors. But such is the nature of leadership and
supervision; it is not meant to be easy, and should be elevated (and financially) rewarded by the
organization if accomplished.
In addition to changing the approach of supervision at places, changing the fundamental
approach to deployment may also counteract place-based effects on officer mentality. For
example, more rational justification can be found in building crime prevention tactics based on
information about where crime is located, as well as in evidence of what works once such hot
spots are identified. This is more effective than academy training that teaches the need for special
response by some groups, or that leaves the individual officer to determine how to prioritize
work load. For example, if police knew that the consequences of a zero-tolerance or crackdown
approach might result in mild crime prevention gains, but only at the expense of reduced
legitimacy, greater ethnically based disparity, more technical violations for probations, and
court-clogging, then such information would be useful in prioritizing deployment.
3. The effect of places on policing and the mental health of officers should be a serious concern for police leaders. There is especially a need to counter inevitable changes in mental states, some that are affected by the places officers work, which may lead to further behavioral problems such as racially biased policing or the use of force. Third, there should be a real and systematic effort to counteract the often negative
mentalities that result from street patrol, which are no doubt influenced by the nature of the
places officers patrol. The term “negative mentality” encompasses a number of problems,
including racial and socioeconomic prejudice, cynicism, and hatred of anything deviating from
the “norm” of the officer’s own personal characteristics. Studies on officer mentality and the
This document is a research report submitted to the U.S. Department of Justice. This report has not been published by the Department. Opinions or points of view expressed are those of the author(s)
and do not necessarily reflect the official position or policies of the U.S. Department of Justice.

58
shaping of officer mentality are not new, but in some ways have been less prioritized than work
on police crime control effectiveness. Place-based attributes, when combined with high levels of
crime, can lead to a mentality and worldview that then results in negative behaviors and perhaps
even post traumatic stress disorders. Indeed, this might be helped by improving officer and
citizen relationships in these communities. Often the problem is not created from bad
relationships between the officer and individuals who do not commit crime, but rather from
negativity that stems from officers responding to crime in these neighborhoods and then
generalizing criminal behavior to everyone in the area.
***
The race of places matters in police behavior and does not just provide a context for
police behavior; the race of places can shape police discretion, especially if those places have
higher concentrations of Black residents. As Horowitz (1985) emphasizes, ethnic conflict and
prejudice are part of human nature, a nature to which police officers are certainly not immune.
The more important question in police policy is how such prejudice affects decision making and
what organizational, cultural, and deployment approaches can counteract such forces given the
overall (and sometimes conflicting) goals of policing in modern democracies—to reduce crime
and do so legitimately and fairly. Examining how race influences policing at the place- rather
than individual-based level provides not only an additional approach to understanding this
relationship, but also speaks directly to the place-based implications of new policing innovations
and community-oriented mandates.
This document is a research report submitted to the U.S. Department of Justice. This report has not been published by the Department. Opinions or points of view expressed are those of the author(s)
and do not necessarily reflect the official position or policies of the U.S. Department of Justice.

59
VII. REFERENCES
Alpert, G., Dunham, R., & Smith M. (2007). Investigating racial profiling by the Miami-Dade police department. Criminology & Public Policy, 6(1): 25–55.
Alpert, G., Dunham, R., Stroshine, M., Bennett, K., & MacDonald, J. (2004). Police officers’ decision making and discretion: Forming suspicion and making a stop. Washington, DC: National Institute of Justice.
Anderson, E. (1990). Streetwise: Race, class and change in an urban community. Chicago, IL: University of Chicago Press.
Anselin, L. (2003). GeoDa 0.9 User’s Guide. Urbana-Champaign, IL: Spatial Analysis Laboratory (SAL), Department of Agriculture and Consumer Economics, University of Illinois.
Anselin, L., Syabri, I., & Kho, Y. (2006). GeoDa: An introduction to spatial data analysis. Geographic Analysis, 38:5–22.
Bailey, T., and Gatrell, A. (1995). Interactive spatial data analysis. Harlow, England: Pearson Education Ltd.
Banton, M. (1964). The police in the community. New York: Basic Books. Bayley, D., & Mendelsohn, H. (1969). Minorities and the police: Confrontation in America.
New York: Free Press. Black, D. (1971). The social organization of arrest. Stanford Law Rev, 23, 63–77. Black, D. (1976). The behavior of law. New York: Academic Press. Black, D., & Reiss, A. (1970). Police control of juveniles. American Sociological Rev, 35, 63–
77. Blalock, H.M. (1967). Toward a theory of minority group relations. New York: John Wiley and
Sons. Brantingham, P., & Brantingham, P. (1981). Notes on the geometry of crime. In P. Brantingham
& P. Brantingham, (Eds.), Environmental criminology (pp. 27–55). Beverly Hills, CA: Sage. Brooks, L. (2004). Police discretionary behavior: A study of style. In R. Dunham, & G. Alpert,
(Eds.), Critical issues in policing: Contemporary readings (5th ed). Long Grove, IL: Waveland Press.
Brown, R. (2005). Black, white, and unequal: Examining situational determinants of arrest decisions from police-suspect encounters. Criminal Justice Studies: A Critical J. of Crime, Law and Society, 18(1): 51–68
Brown, R., & Frank, J. (2005). Police-citizen encounters and field citations: Do encounter characteristics influence ticketing? Policing: An International J. of Police Strategies and Management, 28(3): 435–454.
Brown, R., & Frank, J. (2006). Race and officer decision making: Examining differences in arrest outcomes between black and white officers. Justice Quarterly, 23(1): 96–126.
Chainey, S., & Ratcliffe, J. (2005). GIS and crime mapping. West Sussex, England: John Wiley and Sons.
Chambliss, W., & Seidman, R. (1971). Law, order, and power. Reading, MA: Addison-Wesley. Durose, M., Schmitt, E., & Langan, P. (2005). Contacts between police and the public: Findings
from the 2002 national survey. Washington, DC: Bureau of Justice Statistics. Eck, J., & Weisburd, D. (1995). Crime and place. Monsey, NY: Criminal Justice Press. Engel, R. (2008). A critique of the “Outcome Test” in racial profiling research. Justice
Quarterly, 25(1): 1–36.
This document is a research report submitted to the U.S. Department of Justice. This report has not been published by the Department. Opinions or points of view expressed are those of the author(s)
and do not necessarily reflect the official position or policies of the U.S. Department of Justice.
60
Engel, R., & Calnon, J. (2004). Examining the influence of drivers' characteristics during traffic stops with police: Results from a national survey. Justice Quarterly, 21(1): 49–90.
Engel, R. S. (2005). Citizens' perceptions of procedural and distributive injustice during traffic stops with police. Journal of Research in Crime and Delinquency, 42, 445–481.
Fagan, J., & Davies, G. (2000). Street stops and broken windows: Race and disorder in New York City. Terry Fordham Urban Law J., 28, 457–504.
Farrell, A., & McDevitt, J. (2006). Rhode Island traffic stop statistics data collection: Final report. Boston, MA: Northeastern University Institute on Race and Justice.
Frey, W. (1979). Central city white flight: Racial and nonracial causes. American Sociological Rev., 44, 425–448.
Gaines, L. (2006). An analysis of traffic stop data in Riverside, California. Police Quarterly, 9(2): 210–233.
Gottfredson, D., McNeil, R., & Gottfredson, G. (1991). Social area influences on delinquency: A multilevel analysis. J. of Research in Crime and Delinquency, 28(2): 197–226.
Gottfredson, S., & Taylor, R. (1986). Person-environment interactions in the prediction of recidivism. In J. Byrne & R. Sampson, (Eds.), The social ecology of crime. New York: Springer-Verlag.
Greenwald, A. G., McGhee, D. E., & Schwartz, J. L. K. (1998). Measuring individual differences in implicit cognition: The implicit association test. Journal of Personality and Social Psychology, 74, 1464–1480.
Hipp, J. (2007). Block, tract, and levels of aggregation: Neighborhood structure and crime and disorder as a case in point. American Sociological Review, 72, 659–680.
Horowitz, D. (1985). Ethnic groups in conflict. Berkeley, CA: University of California Press. Hurwitz, J., & Peffley, M. (1997). Public perceptions of race and crime: The role of racial
stereotypes. American J. of Political Science, 41(2): 375–401. Kane, R. (2003). Social control in the metropolis: A community-level examination of the
minority group-threat hypothesis. Justice Quarterly, 20(2): 265–295. Kleck, Gary. (1981). Racial discrimination in criminal sentencing: A critical evaluation of the
evidence with additional evidence on the death penalty. American Sociological Review, 46:783–805.
Klinger, D. (1997). Negotiating order in patrol work: An ecological theory of police response to deviance. Criminology, 35(2): 277–306.
Klinger, D. (2004) Environment and organization: Reviving a perspective on the police. Annals of the American Academy of Political and Social Science, 593, 119–136.
Langan, P., Greenfeld, L., Smith, S., Durose, M., & Levin, D. (2001). Contacts between police and the public: Findings from the 1999 national survey. Washington, DC: Bureau of Justice Statistics.
Lange, J., Johnson, M., & Voas, R. (2005). Testing the racial profiling hypothesis for seemingly disparate traffic stops. Justice Quarterly, 22(2): 193–223.
Liska, A., & Chamlin, M. (1984). Social structure and crime control among macrosocial units. The American J. of Sociology, 90(2): 383–395.
Liska, A., Lawrence, J. & Sanchirico, A. (1982). Fear of crime as a social fact. Social Forces, 60, 760–770.
Logan, J., & Stults, B. (1999). Racial differences in exposure to crime: The city and suburbs of Cleveland in 1990. Criminology, 37(2): 251–276.
This document is a research report submitted to the U.S. Department of Justice. This report has not been published by the Department. Opinions or points of view expressed are those of the author(s)
and do not necessarily reflect the official position or policies of the U.S. Department of Justice.

61
Lum, C. (forthcoming). Violence, drug markets, and racial composition: Challenging stereotypes through spatial analysis. Urban Studies.
Lundman, R., & Kaufman, R. (2003). Driving while black: Effects of race, ethnicity, and gender on citizen self-reports of traffic stops and police actions. Criminology, 41(1): 195–220.
Manning, P. (1977). Police work: The social organization of policing. Cambridge, MA: MIT Press.
Mastrofski, S. (1981). Policing the beat: The impact of organizational scale on patrol officer behavior in urban residential neighborhoods. J. of Criminal Justice, 9(5): 343–358.
Mastrofski, S. (1991). Organizational determinants of police discretion. In C. Klockars, & S. Mastrofski (Eds.), Thinking about police: Contemporary readings (2nd ed.). New York, NY: McGraw-Hill.
Mastrofski, S. (2004). Controlling street-level police discretion. Annals of the American Academy of Political and Social Science, 593(1): 100–118.
Mastrofski, S., Reisig, M., & McCluskey, J. (2002). Police disrespect toward the public: An encounter-based analysis. Criminology, 40(3): 519–551.
Mastrofski, S., Ritti, R., & Hoffmaster, D. (1987). Organizational determinants of police discretion: The case of drinking and driving. J. of Criminal Justice, 15(5): 387–402.
McLafferty, S. (2008). Placing substance abuse: Geographic perspectives on substance use and addiction. In Y. Thomas, D. Richardson, & I. Cheung, (Eds.), Geography and Drug Addiction (pp. 1–16). New York, NY: Springer.
National Council on Crime and Delinquency (1978). Race and the decision to arrest—An analysis of warrants issued. J. of Research in Crime and Delinquency, 15(1): 54–73.
National Research Council (NRC). (2004). Fairness and effectiveness in policing: The evidence. W. Skogan, & K. Frydl, (Eds.). Washington, DC: The National Academies Press.
Novak, K. (2004). Disparity and racial profiling in traffic enforcement. Police Quarterly, 7(1): 65–96.
Oberwittler, D., & Wikström, P. (2009). Why small is better: Advancing the study of the role of behavioral contexts in crime causation. In D. Weisburd, W. Bernasco, & G. Bruinsma, (Eds.), Putting crime in its place: Units of analysis in geographic criminology. New York, NY: Springer.
Paoline, E., & Terrill, W. (2005). Impact of police culture on traffic stop searches: An analysis of attitudes and behavior. Policing: An International J. of Police Strategies and Management, 28(3): 455–472.
Park, R., Burgess, E., & McKenzie, R. (1925). The city. Chicago: University of Chicago Press. Parker, K., Stults, B., & Rice, S. (2005). Racial threat, concentrated disadvantage, and social
control: Considering the macro-level sources of variation in arrests. Criminology, 43(4): 1111–1134.
Petrocelli, J. (2006). Racial profiling. Law and Order, 54(10): 25–26. Petrocelli, M., Piquero, A., & Smith, M. (2003). Conflict theory and racial profiling: An
empirical analysis of police traffic stop data. J. of Criminal Justice, 31(1): 1–11. Powell, D. (1990). A study of police discretion in six southern cities. J. of Police Science and
Administration, 17(1): 1–7. Przeworski, A., & Teune, H. (1970). The logic of comparative social inquiry. New York, NY: Wiley. Quillian, L., & Pager, D. (2001). Black neighbors, higher crime? The role of racial stereotypes in
evaluations of neighborhood crime. American J of Sociology, 107(3): 717–767.
This document is a research report submitted to the U.S. Department of Justice. This report has not been published by the Department. Opinions or points of view expressed are those of the author(s)
and do not necessarily reflect the official position or policies of the U.S. Department of Justice.
62
Reisig, M., McCluskey, J., Mastrofski, S., & Terrill, W. (2004). Suspect disrespect toward the police. Justice Quarterly, 21(2): 241–268.
Reitzel, J., & Piquero, A. (2006). Does it exist? Studying citizens’ attitudes of racial profiling. Police Quarterly, 9(2): 161–183.
Rengert, G., & Pelfrey, W. (1997). Cognitive mapping of the city center: Comparative perceptions of dangerous places. In D. Weisburd & T. McEwen, (Eds.), Crime mapping and crime prevention. Monsey, NY: Criminal Justice Press/Willow Tree Press.
Ridgeway, G., Schell, T. L., Gifford, B., Saunders, J., Turner, S., and Riley, K.J. (2009). Police-community relations in Cincinnati. Santa Monica, CA: RAND Corporation.
Rosenbaum, D. & Scrivner, E. (2009). Studying the “life course” of new officers. Presentation at the American Society of Criminology Conference, Philadelphia, PA.
Rosenbaum, D. P., Hawkins, D. F., Costello, S. K., Skogan, W. G., Schuck, A. M., Rivera, L. R., et al. (2004). Race and police: A matter of public trust. Unpublished final report to the National Institute of Justice, Office of Justice Programs. Washington, DC: U. S. Department of Justice.
Sampson, R., & Bartusch, D. (1998). Legal cynicism and (subcultural?) tolerance of deviance: The neighborhood context of racial differences. Law and Society Review, 32(4): 777–804.
Schafer, J., Carter, D., Katz-Bannister, A., & Wells, W. (2006). Decision making in traffic stop encounters: A multivariate analysis of police behavior. Police Quarterly, 9(2): 184–209.
Seigel, P., Martin, E., & Bruno, R. (2001). Language use and linguistic isolation: Historical data and methodological issues. Washington, DC: U. S. Census Bureau.
Shaw, C., & McKay, H. (1942). Juvenile delinquency and urban areas: A study of rates of delinquents in relation to differential characteristics of local communities in American cities. Chicago, IL: University of Chicago Press.
Shaw, C., Zorbaugh, F., McKay, H. & Cottrell, L. (1929). Delinquency areas. Chicago, IL: University of Chicago Press.
Sherman, L. (1980). Causes of police behavior: The current state of quantitative research, J. of Research in Crime and Delinquency, 17(1): 69–100.
Sherman, L., Gartin, P., & Buerger, M. (1989). Hot spots of predatory crime: Routine activities and the criminology of place. Criminology, 27, 27–56.
Smith, D. (1986). The neighborhood context of police behavior. In A. Reiss, & M. Tonry (Eds.), Communities and crime. Crime and Justice: A Review of Research. Chicago, IL: University of Chicago Press.
Smith, D. & Klein, J. (1984). Police control of interpersonal disputes. Social Problems, 31(4): 468–481.
Smith, D., & Visher, C. (1981). Street-level justice: Situational determinants of police arrest decisions. Social Problems, 29(2): 167–177.
Smith, D., Visher, C., & Davidson, L. (1984). Equity and discretionary justice—The influence of race on police arrest decisions. Journal of Criminal Law and Criminology, 75(1): 234–249.
Smith, M., & Petrocelli, M. (2001). Racial profiling?: A multivariate analysis of police traffic stop data. Police Quarterly, 4(1): 4–27.
Taylor, R. (1988). Human territorial functioning: An empirical evolutionary perspective on individual and small group territorial cognitions, behaviors, and consequences. New York: Cambridge University Press.
Terrill, W., & Reisig, M. (2003). Neighborhood context and police use of force. J. of Research in Crime and Delinquency, 40(3): 291–321.
This document is a research report submitted to the U.S. Department of Justice. This report has not been published by the Department. Opinions or points of view expressed are those of the author(s)
and do not necessarily reflect the official position or policies of the U.S. Department of Justice.

63
Tyler, T., & Huo, Y. (2002). Trust in the law: Encouraging public cooperation with the police and courts. New York, NY: Russell Sage.
Walker, S. (2001). Searching for the denominator: Problems with police traffic stop data and early warning system solution. Justice Research and Policy, 3(1): 63–95.
Ward, M., & Gleditsch, K. (2008). Spatial regression modeling. Sage Series on Quantitative Applications in the Social Sciences. Thousand Oaks, CA: Sage.
Warren, P., Tomaskovic-Devey, D., Smith, W. Zingraff, M., & Mason, M. (2006). Driving while black: Bias processes and racial disparity in police stops. Criminology, 44(3): 70–-738.
Weber, Max. (1954). On law in economy and society. Cambridge, MA: Harvard University Press.
Weisburd, D. (2002). From criminals to criminal contexts: Reorienting criminal justice research and policy. Advances in Criminological Theory, 10, 197–216.
Weisburd, D., Bernasco, W., & Bruinsma, G. (2009). Putting crime in its place: units of analysis in geographic criminology. New York, NY: Springer.
Weisburd, D., & Braga, A. (2006). Police innovation: Contrasting perspectives. New York, NY: Cambridge University Press.
Weisburd, D., Bushway, S., Lum, C. & Yang. S. (2004). Crime trajectories at places: A longitudinal study of street segments in the City of Seattle. Criminology, 44(2): 283–322.
Weitzer, R. (1999). Citizens’ perceptions of police misconduct: Race and neighborhood context. Justice Quarterly, 16(4): 819–846.
Weitzer, R., & Tuch, S. (2002). Perceptions of racial profiling: Race, class, and personal experience. Criminology, 40(2): 435–456.
Wooldredge, J. (2002). Examining the (ir)relevance of aggregating bias for multilevel studies of neighborhood and crime with an example comparing census tracts to official neighborhoods in Cincinnati. Criminology, 40(3): 681–709.
Wu, Y., Sun, I., & Triplett, R. (2009). Race, class or neighborhood context: Which matters more in measuring satisfaction with police? Justice Quarterly, 26(1): 125–156.
This document is a research report submitted to the U.S. Department of Justice. This report has not been published by the Department. Opinions or points of view expressed are those of the author(s)
and do not necessarily reflect the official position or policies of the U.S. Department of Justice.

64
VIII. APPENDIX A: Correlation Matrix of Key Variables
Total calls Total calls Violence Property Disorders Suspicions Drugs and Vice
Pathway score
People per mi2 % Black % White % Asian %
Hispanic
% Foreign-born
% Linguistically isolated
% violent calls DISORG NEEDS WEALTH
Total calls 1.000
Call rate .818(***) 1.000
Violence .939(***) .773(***) 1.000
Property .907(***) .833(***) .848(***) 1.000
Disorders .970(***) .733(***) .923(***) .813(***) 1.000
Suspicions .963(***) .834(***) .890(***) .905(***) .888(***) 1.000
Drugs and Vice .856(***) .627(***) .756(***) .640(***) .853(***) .788(***) 1.000
Pathway Score .053 .069 .134(**) .221(***) .022 -.006 -.029 1.000
People per mi2 .144(**) .003 .176(***) .112(**) .182(***) .088(*) .148(**) .087(*) 1.000
% Black .151(***) .139(**) .281(***) .123(**) .141(**) .167(***) .059 -.019 .038 1.000
% White -.165(***) -.155(***) -.315(***) -.165(***) -.139(**) -.197(***) -.056 -.122(**) -.015 -.730(***) 1.000
% Asian .075 .032 .178(***) .096(*) .047 .107(*) .005 .156(***) -.005 .293(***) -.804(***) 1.000
% Hispanic .183(***) .210(***) .255(***) .185(***) .168(***) .204(***) .071 .078 .038 .198(***) -.367(***) .178(***) 1.000
% Foreign born .137(**) .102(*) .257(***) .154(***) .113(**) .165(***) .042 .181(***) .040 .340(***) -.797(***) .884(***) .369(***) 1.000
% Ling. Isol. .206(***) .180(***) .337(***) .213(***) .183(***) .228(***) .110(*) .180(***) .149(***) .363(***) -.724(***) .750(***) .370(***) .832(***) 1.000
% violent calls .068 .041 .317(***) .053 .080 .037 -.018 .369(***) .071 .407(***) -.543(***) .419(***) .244(***) .433(***) .406(**) 1.000
DISORG .371(***) .302(***) .398(***) .380(***) .379(***) .325(***) .273(***) .125(**) .802(***) .044 -.077 .013 .124(**) .116(**) .277(***) .079 1.000
NEEDS .182(***) .188(***) .331(***) .147(***) .178(***) .184(***) .084 .068 -.115(**) .590(***) -.670(***) .446(***) .269(***) .484(***) .547(***) .425(***) .000 1.000
WEALTH -.079 -.075 -.134(**) -.112(**) -.060 -.085(*) .003 -.282(**) .028 -.196(**) .375(**) -.334(**) -.373(**) -.409(**) -.294(**) -.396(**) .000 .000 1.000
***. Correlation is significant at the .001 level (2-tailed).
**. Correlation is significant at the .01 level (2-tailed).
*. Correlation is significant at the .05 level (2-tailed).
This document is a research report submitted to the U.S. Department of Justice. This report has not been published by the Department. Opinions or points of view expressed are those of the author(s)
and do not necessarily reflect the official position or policies of the U.S. Department of Justice.