does the institution of state business relations matter
TRANSCRIPT
Munich Personal RePEc Archive
Does the institution of State Business
Relations matter for Firm Performance?
– A study of Indian Manufacturing
Kathuria, Vinish and Natarajan, Rajesh Raj and Sen, Kunal
Indian Institute of Technology Bombay, Centre for
Multi-Disciplinary Development Research, Dharwad, University of
Manchester, UK
3 June 2010
Online at https://mpra.ub.uni-muenchen.de/23053/
MPRA Paper No. 23053, posted 04 Jun 2010 20:26 UTC
1
����������������������� ������������� ������ ��������������
������� ������������������� �� � ������
Vinish Kathuria
SJMSOM, Indian Institute of Technology Bombay, India
email: [email protected]
Rajesh Raj S. N.∗
Centre for Multi-Disciplinary Development Research, Dharwad, Karnataka, India
email: [email protected]
Kunal Sen
IDPM, University of Manchester, UK
e-mail: [email protected]
�
�
�
�
∗ Corresponding author; mailing address: Assistant Professor, Centre for Multi-Disciplinary
Development Research, Dharwad, Karnataka, India; email: [email protected]. This paper
forms a part of a larger study examining the effect of state-business relations on the productivity of
Indian firms funded by IPPG-University of Manchester, UK (www.ippg.org.uk). We are thankful to
IPPG-University of Manchester and DFID-UK for financial support. We are also thankful to the
Central Statistical Organisation, for providing us access to the data, and to Nilachal Ray for his many
suggestions and comments. An earlier version of the paper was presented at the Quantitative Analysis
of Public Policy conference held at Indian Institute of Management Bangalore during August 10-12,
2009. The authors thank conference participants for helpful comments. The usual disclaimers apply.
2
�
�
�
����� ���
This paper examines the role of the external institutional environment captured by
effective state-business relations on firm performance. By effective state-business
relations, we mean a set of highly institutionalised, responsive and public interactions
between the state and the business sector. We find that effective state-business
relations have had a discernible positive impact on firm performance in Indian formal
manufacturing for the years 2000-01 and 2004-05. We also find internal and external
institutional factors are complementary to firm performance - smaller firms, firms in
urban areas, older firms and firms in simpler organizational forms benefit more.
��� ����!�State business relations, firm productivity, manufacturing sector, India.�
JEL Classification Codes: L25, O53, O43.

3
". �#$�%�&'$�%#�
Why are some firms more productive than others? Much of the previous literature on
the determinants of firm performance has highlighted the role of the institutional
factors that are internal to the firm such as the firm’s ownership structure (Boardman
and Vining 1989, Chhibber and Majumdar 1998, 1999, Khanna and Palepu 2000), the
ability of its managers (Shleifer and Vishny 1989), the investments that the firm’s
owners makes in human capital of its employees (Bates 1990, Becker and Barry 1996)
and the innovative capabilities of the firm (Penrose 1959, Nelson and Winter 1982,
Cimoli ��� ��. 2009). Less attention has been paid to the external institutional
determinants of firm performance, and in particular the relationship between the state
and the business sector.1 In this paper, we examine the role of effective state-business
relations in influencing firm performance using Indian manufacturing as a case-study.
By effective state-business relations, we mean a set of highly institutionalised,
responsive and public interactions between the state and the business elite. As has
been noted in the case of East Asia, strong industrial performance has occurred in
contexts where there were strong collaborative relations between the political and
economic elites (Aoki 2001, Amsden 2001).
Effective state-business relations occur when there is ‘the maintenance of benign
collaboration between the agents of the state and business’ (Harriss 2006). Benign
collaboration between agents of the state and business require strong, well organised
and representative business associations and effective and accountable governments
that have a strong interest in the growth of the private sector. Well organised business
associations can contribute to firm performance by providing both market-supporting
and market-complementing activities (Cammett 2007). Through market-supporting
activities, business associations can strengthen the overall functioning of markets by
4
supporting the provision of public goods such as electricity and roads which are
critical for productive investments to take place. Market-complementing activities, on
the other hand, address various types of market imperfections and involve ‘direct
coordination among firms to reconcile production and investment decisions’ (Doner
and Schneider 2000). Effective and accountable governments can deliver on the
services and public goods that are essential for robust private sector growth such as
infrastructure and law and order. Strong states can make credible commitments on
key policies such as future rates of corporate taxation and the likelihood of
nationalisation of private sector assets. Such commitments are essential for the firms
to invest in human capital and machinery and equipment that are likely to boost firm
performance (Sen and te Velde, 2009).
Our empirical context is India, which provides us a fertile empirical ground to
examine the relationship between effective state-business relations and economic
performance at the firm level. Given India’s federal political structure, we would
expect to see wide variations in the manner Indian state governments interact with the
business sector. Given the move from a command and control regime by Indian policy
makers since 1991 and the political space that economic reforms provided to state
governments to follow their own paths with specific economic policies (within certain
constraints), we would expect significant variation in effective state-business relations
across Indian states. We exploit these institutional differences of Indian states testing
for the impact of effective state-business relations (SBRs) on firm performance for the
Indian formal manufacturing sector. We first propose a way of quantifying the degree
of effectiveness of SBRs for fifteen Indian states, which has been developed by Calì,
Mitra and Purohit (henceforth, CMP, 2009). We then use this measure in augmented
production function estimates of firm performance using a rich firm-level data set
5
which covers all firms in the Indian formal manufacturing sector for the years 2000-
01 and 2004-05 to examine whether effective SBRs matter for firm performance. We
also explore whether institutional factors internal to the firm such as firm size, firm
age, location and organisational form influence the manner effective SBRs impact on
firm performance. We find that effective state-business relations have had a
discernible positive impact on firm performance in India. We also find effective state-
business relations particularly benefit smaller firms, firms in urban areas, older firms
and firms with simpler organisational forms such as sole proprietorships and family
firms (in contrast to firms with diffused ownership).
The rest of the paper is in five sections. In the next section, we set out the theoretical
argument why effective state-business relations matter for firm performance. In
Section III, we describe the measure of state-business relations in India, drawing from
the work of Cali, Mitra and Purohit (2009) (henceforth, CMP). Section IV describes
the firm-level data and the methodology. In Section V, we discuss the results of our
analysis. Section VI concludes.
��(�)*+��%� ,��,'$�-,� �$�$,.�&��#,��� �,/�$�%#����$$,�� �%��
������,��%���#',��
The literature on state-business relations takes the following elements as essential
characteristics of effective state-business relations (SBRs) (see Maxfield and
Schneider 1997, Chapter 1).
•� ���������� the flow of accurate and reliable information, both ways, between
business and government.
•� ���������� the capacity and autonomy of state actions to secure improved
performance in return for subsidies.

6
•� ����������� when capitalists are able to believe what state actors say.
Effective SBRs as characterised above can affect firm performance through fulfilling
a number of economic functions. Firstly, they can help to solve information related
market and co-ordination failures in areas such as skill development or infrastructure
provision (Amsden 1989). For instance, business associations or government
departments may co-ordinate and disperse information among stakeholders. Greater
transparency in the flow of information between state actors and the business sector
leads to a better allocation of investments by the business sector to their most
productive uses. Higher credibility of state actions lead to less problems of time and
dynamic inconsistency of government policies, providing a more favourable
environment for high quality investment to occur (Rodrik 1991, Ibarra 1995).
Reciprocity ensures improved performance by private sector actors in return for
subsidies and the provision of public goods, contributing to higher productivity
growth.
Secondly, effective SBRs provide a check and balance function on government
policies and tax and expenditure plans (te Velde 2006). Thus, effective SBRs may
help to ensure that the provision of infrastructure is appropriate and of good quality.
The design of effective government policies and regulations depends, among other
things, on input from and consultation with the private sector. Regular sharing of
information between the state and businesses ensures that private sector objectives are
met with public action and that local level issues are fed into higher level policy
processes (Evans 1995). The private sector can identify constraints, opportunities, and
possible policy options for creating incentives, lowering investment risks, and
reducing the cost of doing business. More efficient institutions and rules and
7
regulations might be achieved through policy advocacy which could reduce the costs
and risks faced by firms and enhance productivity.
In summary, effective state-business relations can mitigate both market failures and
government failures which are pervasive in most developing countries, and by doing
so, bring about an increase in the performance of firms.2
���(��,��&��#0��$�$,��&��#,����,/�$�%#���#��#����
te Velde (2006) was the pioneering study to develop measures of SBRs quality. He
argues that an SBR index should have four components, which reflect the main
aspects of effective SBRs:
1)� the way in which the private sector is organised vis-à-vis the public sector;
2)� the way in which the public sector is organised vis-à-vis the private sector;
3)� the practice and institutionalisation of SBRs;
4)� the avoidance of harmful collusive behaviour between the two sectors.
Each of the aspects mentioned above is captured through a SBR sub-index which in
turn is derived from data on variables reflecting the above mentioned aspects. The
various SBR sub-indices are then combined to arrive at an overall index of SBR.
CMP measure SBR along the above four dimensions for 15 Indian states using both
primary and secondary data. We describe below the manner CMP operationalise the
measurement of SBR in India.
�������������������������������������
CMP measure the role of the private sector via the quality and effectiveness of the
umbrella business association and two sector based business associations, as follows:
8
a)� Whether the private sector association has a ������ or not: The variable takes
a value of zero in any year in which the organisation does not have a website
and 1 otherwise. This is likely to proxy for the quality of the organisational
structure as well as its outside visibility. Evidence from their fieldwork
confirms that organisations appearing to be more structured and organised
have had an active website in place for a longer time.
b)� How frequently the website is updated: Again, this captures the efficiency of
internal processes (which makes frequent updates possible) as well as the level
of activity of the organisation. The need for updating the website more
frequently should increase with the intensity of the organisation’s activity.
�1� The variable ������������, takes the value of 1 if the office is owned and 0
otherwise. This variable proxies the level of the organisation’s resources as
well as the extent to which the association is willing to invest in costly
physical assets. �
�����������������������������������
CMP measure the role of the public sector in SBR by the presence of state owned or
state participated productive corporations, which are investment promotion agencies,
Financial, Infrastructure Development and Tourism Development Corporations.
These represent important types of pro-business engagements with benefits for all
sectors. They construct a cumulative sub-index ranging in value between 0 and 1
which is the average of four dummy variables, one for each organisation. At any point
of time the dummy for an organisation takes the value of 1 if it is in place and 0
otherwise.

9
CMP also assess the role of the public sector via the governments’ signalling of their
relative priorities through the allocation of public resources. In their work, they focus
on two types of state ��2�� �34�������!�expenditure on economic services as a
ratio of total government expenditures and expenditure on industries as a ratio of total
expenditures on economic services. �
����������������������������������������
CMP measure the interaction between state governments and the business sector in
two ways:
1� ���3� �� � ���� ���� ���!� This is the index constructed by Besley and
Burgess (2004). The authors score each state level act on labour regulation as anti-
worker (assigning -1), pro-worker (1) or neutral (0). In this way they produce a
yearly cumulative index which may proxy for the relative effectiveness of the
mentioned aspect of SBR. The argument is that more effective SBRs would allow
employers to be more influential affecting on government policies and would get
reflected in more pro-employer labour market regulation.
�1��� �4����!�CMP take state-wise stamp duties as proxies for the attitude of the state
governments towards business establishments and their expansion. These proxies are
valid because a stamp duty is a tax on the value of a transaction, most commonly on the
transfer of movable and immovable properties and instruments used in commercial and
business transactions.
��������������������������������������
CMP use the following measures to capture the transparency of SBRs:
a)� The gross output of firms belonging to ������������������ as a proportion
of total industrial GDP (data on delicensing from Aghion �����. 2006; data on
firms by sector in the Annual Survey of Industries): The License Raj was a
10
system of centralised controls regulating entry and production activity.
Delicensing introduced competition and reduced rent-seeking by corporations
entrenched with public powers. As the decision of which industries to
delicense was made at the central level, this effectively provides an exogenous
source of change in the possible extent of collusive behaviour at the state
level.
b)� Whether the private sector umbrella association has a ���� �� 4���� ���
informing its members. This measure proxies for the transparency of the
organisation’s activities. Higher transparency would be associated with lower
probability of collusive behaviour which may harm business not entrenched
with public authorities. As in the case of the organisation’s website, the
���5��� with which the publication is produced and distributed would also
determine the level of transparency in the association’s activities.
As CMP correctly argue, the indices constructed through these variables have two
main advantages over the traditional investment climate indicators. First, they cover a
larger time span (27 years from 1980 to 2006) than any other indicators on Indian
states. This allows one to examine the evolution of the relevant economic institution
over different periods. Second, by not being based on firms’ perceptions, they avoid
the measurement error problem typical of subjective survey response data. Bertrand
and Mullainathan (2001) argue that the likely causal correlation of this measurement
error with dependent variables may generate biased estimated coefficients. Carlin ���
��. (2009) explain along these lines the problem of interpreting the coefficients of
standard cross-country regressions where a productivity or income measure is
regressed on subjective constraints.

11
CMP normalize the data so as to make the variables vary over a common range and to
make the increase in a variable signal an improvement in the index. While CMP used
different weighting procedures in the construction of the SBR private variable, we use
the weighting procedure where the apex business association is assigned a value of
0.5 and the two sectoral associations are assigned a value of 0.25 each.3
In Figure 1, we present the period averaged SBR measures for 1994-2000 and 2001-
2005. As is clear, there are strong differences in the effectiveness of state-business
relations across Indian states. These differences seem to have persisted over time.
Bihar and Orissa, among the less industrialized states, have the least degree of
effectiveness of state-business relations while Andhra Pradesh and Tamil Nadu, the
more progressive states, have the highest degree of effectiveness as reflected in the
SBR measure. Assam has shown the highest improvement in the effectiveness of
state-business relations between 1994 and 2005.
Source: CMP (2009)
������"!��� ��.���������� ����6�"778.9:::� ��9::".9::;� ��������� ��� ����

12
�-(���$���#���,$*%�%/%0+�
�����
We use unit level data for the formal manufacturing sectors for two years – 2000-01
and 2004-05. Data are drawn from the Annual Survey of Industries (ASI) collected by
the Central Statistical Organisation (CSO). The ASI is the census survey of all the
formal manufacturing units for all the industries across all the states. The data is
collected every year from all the units registered under the Indian Factories Act of
1948.4 CSO is the agency that collects information on various aspects of the
functioning units. The information collected include - gross output, number of
workers, gross fixed assets, electricity and materials consumed, ownership, profit etc.
at the unit level. The data are in the form of repeated cross-sections, and not in panel
form.�This is because the CSO do not reveal the identity of the firm/plant in the unit
record data.5
������������
Our variable of interest is the measure of state-business relations that we described in
Section III and its effect on firm’s total factor productivity (TFP). To test the effect of
SBR on TFP, we estimate augmented production functions as follows:
� �� � � �����!�"��# +∂++++= 3210 (1)
where i is industry, s is state and j is firm. Y is gross value added, K is capital stock, L
is total number of employees, SBR is our measure of state-business relations, ∂i are
industry fixed effects and e is the error term. For the year 2000-01, we use SBR
averaged over 1994-2000 and for the year 2004-05, we use SBR averaged over 2001-
2005.

13
We would expect that a3 is positive and significant – i.e., more effective SBR (as
captured by a higher SBR score) should lead to improved total factor productivity. We
estimate equation 1 for both the years – 2000-01 and 2004-05. We also expect an
increase in value of a3 over the period, as economic reforms may have made an
effective SBR more conducive to stronger firm performance.
The industry fixed effects capture industry-specific differences in technology which
would be correlated with TFP. They also capture other industry specific differences
which would affect TFP such as differences in market structure and trade orientation.
Since we cover units of all sizes, we first estimate equation (1) using Ordinary Least
Squares, with robust heteroskedasticity constant standard errors. However, it is
possible that unobserved technology shocks may be correlated with both, capital stock
and output, leading to a bias in estimate of a1. In order to correct for this, we also
estimate equation (1) using two-stage least squares with materials as an instrument for
capital stock.
Equation (1) assumes that effective state-business relations would affect all firms
equally, regardless of their individual characteristics. However, as the literature on the
institutional determinants of firm performance makes clear, firm specific
characteristics such as firm size, location, age and organisational form are crucial in
explaining why some firms are better performers than others. We would expect that
for a given Indian state, some firms would be better positioned or more able to take
advantage of effective SBR, given their institutional characteristics. We investigate
the impact of effective SBRs on firm performance across various firm-specific
characteristics and explore four such characteristics – the size of the firm (�$%&), the
age of the firm ('(&), whether the firm is located in an urban area ()��'*) and the
14
organisational form of the form, captured by whether the firm is an individual
proprietorship or not (ORG).
With regard to firm size, we expect that smaller firms are more likely to benefit from
improved SBRs that lead to better provision of public goods and greater information
flows from government departments to the business associations small firms belong
to. Also, smaller firms would not have the individual capacities of the larger firms to
lobby for changes in policies and would benefit from stronger business associations
that can lobby on their behalf. With respect to firm age, we expect that older firms
would benefit more from effective SBRs as they are more likely to be members of
business associations than younger firms. With respect to location, firms in urban
areas are more likely to be members of business associations and may be able to
access the public goods that more effective SBRs may help provide.
Finally, with respect to organisational form, privately owned firms, especially those in
sole proprietorships, are more likely to benefit from effective SBRs, as compared to
firms having diffused ownership. For a country like India where regulations abound,
and many of the privately-owned firms often lack information for other key aspects of
business such as finance, taxation etc., the effective SBR fills this obvious
information gap. On the other hand, the information need from SBR is virtually
negligent for a public limited company. This is because for a public limited firm, this
information and other guidance comes from the outside directors, which hail from
varied spheres like banking, or former govt. officials or academics.6 Furthermore,
under clause 49 of listing agreement that came into effect after 2001 in the Indian
capital market, the composition of board of public limited companies should comprise
outside directors not less than 30 per cent. This implies that for public limited
15
companies since 2001 – there has been stronger presence of outside directors
substituting the need for information obtained through effective SBRs.
We measure firm size, firm location and firm age as binary variables – for firm size, a
value of one if the firm has more than 100 employees, zero if not; for firm location,
value of one if the firm is located in an urban area, a value of zero if not, and for firm
age, a value of one for firms which have completed more than 10 years since
inception, and a value of zero for those who have not. For measuring organisational
firm, we have used an ordered variable with five organisational types in the order of
increasing public involvement in these firms: the value ‘1’ is assigned to individual
proprietorship firms, ‘2’ to joint family firms, ‘3’ to partnership firms, ‘4’ to private
limited companies and ‘5’ to public limited companies.
The augmented specification with the interaction variables between SBR and firm
size, location, age and organisational form is presented in equation (2) below:
(2) *
* **
47
6543210
� ��
� � � � � �
�����+�(����
'(&����)��'*�����$%&��������!�"��#
+∂++
++++++=
Where we expect that a4 and a7 are negative, while a5 and a6 are positive.
We present the results of the estimates of equations (1) and (2) in the next section.
�
-(��,�&/$��
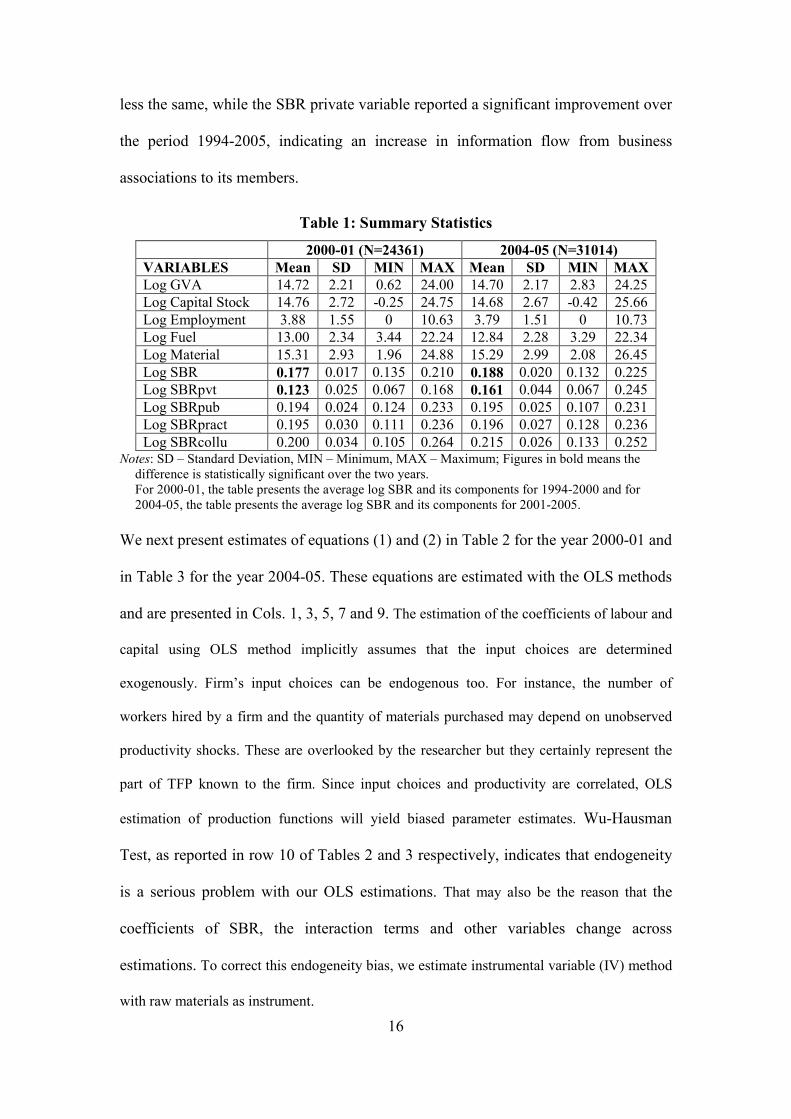
Table 1 summarises the descriptive statistics for 2000-01 and 2004-05. For the 2000-
01 round, we have data for 24,361 units and for the 2004-05 round, it is 31,014 firms.
There is variation in value added, capital stock and employment for the firms in our
sample for both the years, though the summary statistics on value added, capital stock,
employment, fuel and materials are not statistically very different for the two years.
The SBR public, SBR practice and SBR collusive variables have remained more or
16
less the same, while the SBR private variable reported a significant improvement over
the period 1994-2005, indicating an increase in information flow from business
associations to its members.
$ ����"!���� ����� ��������
� 9:::.:"�<#=98>?"1� 9::8.:;�<#=>":"81�
-�����/,�� �� � ��� ��#� ��@� �� � ��� ��#� ��@�
Log GVA 14.72 2.21 0.62 24.00 14.70 2.17 2.83 24.25
Log Capital Stock 14.76 2.72 -0.25 24.75 14.68 2.67 -0.42 25.66
Log Employment 3.88 1.55 0 10.63 3.79 1.51 0 10.73
Log Fuel 13.00 2.34 3.44 22.24 12.84 2.28 3.29 22.34
Log Material 15.31 2.93 1.96 24.88 15.29 2.99 2.08 26.45
Log SBR :("AA� 0.017 0.135 0.210 :("BB� 0.020 0.132 0.225
Log SBRpvt :("9>� 0.025 0.067 0.168 :("?"� 0.044 0.067 0.245
Log SBRpub 0.194 0.024 0.124 0.233 0.195 0.025 0.107 0.231
Log SBRpract 0.195 0.030 0.111 0.236 0.196 0.027 0.128 0.236
Log SBRcollu 0.200 0.034 0.105 0.264 0.215 0.026 0.133 0.252 *���: SD – Standard Deviation, MIN – Minimum, MAX – Maximum; Figures in bold means the
difference is statistically significant over the two years.
For 2000-01, the table presents the average log SBR and its components for 1994-2000 and for
2004-05, the table presents the average log SBR and its components for 2001-2005.
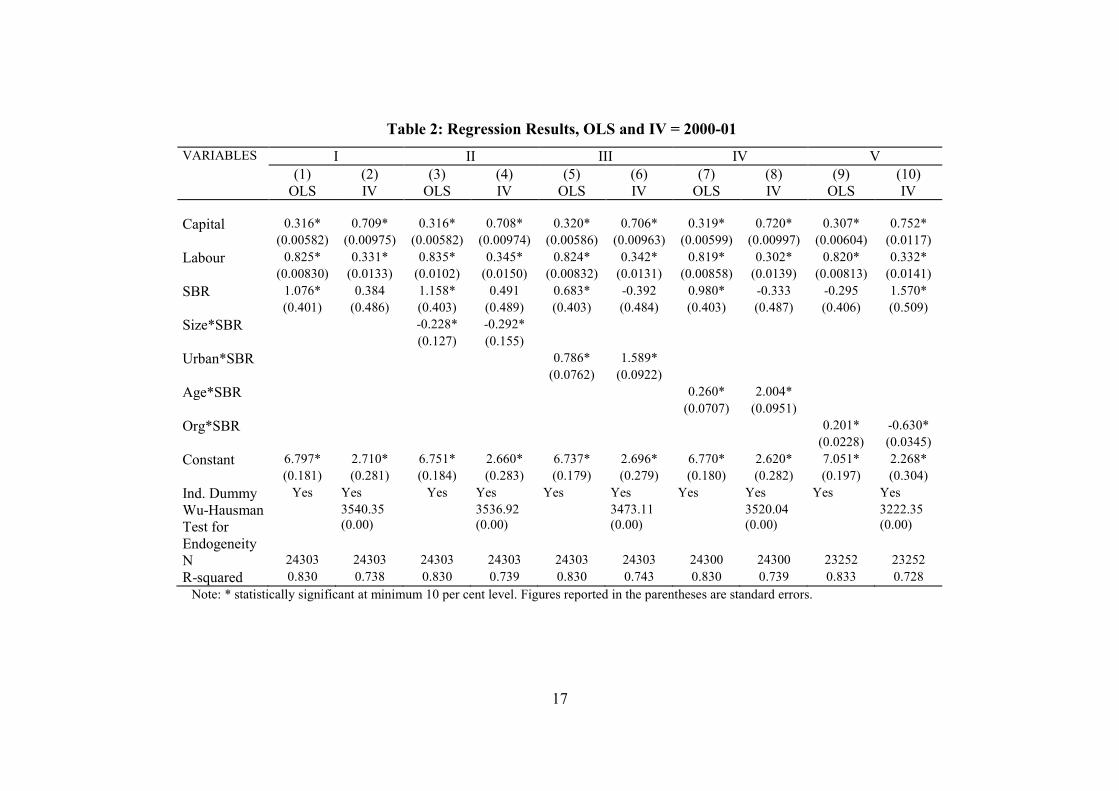
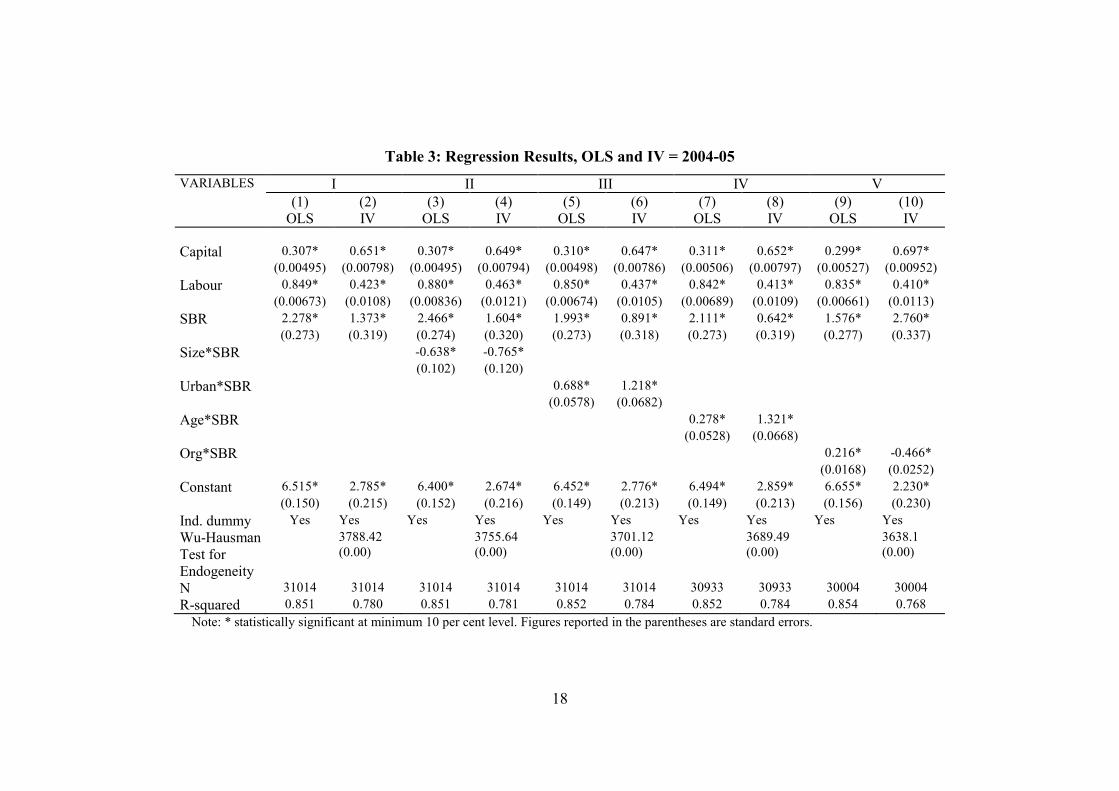
We next present estimates of equations (1) and (2) in Table 2 for the year 2000-01 and
in Table 3 for the year 2004-05. These equations are estimated with the OLS methods
and are presented in Cols. 1, 3, 5, 7 and 9. The estimation of the coefficients of labour and
capital using OLS method implicitly assumes that the input choices are determined
exogenously. Firm’s input choices can be endogenous too. For instance, the number of
workers hired by a firm and the quantity of materials purchased may depend on unobserved
productivity shocks. These are overlooked by the researcher but they certainly represent the
part of TFP known to the firm. Since input choices and productivity are correlated, OLS
estimation of production functions will yield biased parameter estimates. Wu-Hausman
Test, as reported in row 10 of Tables 2 and 3 respectively, indicates that endogeneity
is a serious problem with our OLS estimations. That may also be the reason that the
coefficients of SBR, the interaction terms and other variables change across
estimations. To correct this endogeneity bias, we estimate instrumental variable (IV) method
with raw materials as instrument.
17
We begin with OLS and IV estimates of equation (1) in Cols. (1) and (2) of Tables 2
and 3 respectively. We then present OLS and IV estimates of equation (2) in Cols. (3)
to (10) in Tables 2 and 3, interacting the SBR variable with each firm characteristic in
turn – firm size, location, age and firm organisation. Since the interaction variables
are very likely to be collinear, we enter these interaction variables one by one, rather
than jointly.
As is evident from Tables 2 and 3, the coefficients on labour and capital inputs have
the expected signs and are statistically significant at the 1 per cent level for both the
years. We find that the coefficient on the SBR measure is positive and significant in
the OLS estimates for 2000-01 and both the OLS and IV estimates when entered on
its own without any interaction terms (Cols. (1) and (2) of tables 2 and 3). When we
add interaction terms of firm characteristics with SBR, the SBR variable remains
positive whenever it is statistically significant. More over, the size of the coefficient
on the SBR variable is higher for 2004-05 (without interaction terms) than for 2000-
01. This suggests that the impact of effective SBR has increased with a more
favourable economic environment possibly brought about by reforms. Overall, our
results strongly support the proposition that effective state-business relations matter
for firm performance.
The results in Tables 2 and 3 also indicate that the effect of SBR differs across firm
size (Cols. (3) and (4) for Tables 2 and 3). It is observed that the interaction term
between firm size and SBR is negative and significant in all cases, suggesting that
smaller firms perform better with better SBR. It is possible that a good business
environment eases the growth constraints faced by small firms (Ayyagari and
Maksimovic 2008).7 A similar argument is also posed by Dollar ��� ��. (2005) that
smaller firms could benefit from more effective SBR, provided they have access to

18
better infrastructure. According to Hallward-Driemeier and Stewart (2004), smaller
firms stand to gain more from broad-based investment climate improvements than
larger firms.
As hypothesised in the previous section, we find from Cols. (5) and (6) of tables 2 and
3 that the effects of effective SBR is more pronounced in firms located in urban areas
than in those located in rural areas – the interaction term between URBAN and SBR
is positive and significant for both OLS and IV estimates, and for both the years 2000-
01 and 2004-05. We also observe that the impact of SBR on firm performance
increases with the age of the firm – the interaction term between AGE and SBR is
positive and significant in the OLS and IV estimates for 2000-01 and 2004-05. That
is, older firms derive more benefit from more effective SBR. With respect to
organisation type, as conjectured, we find that more effective SBR provides greater
benefits to firms with simpler organisational structures (i.e., individual
proprietorships) or firms with less public involvement. The interaction term between
ORG and SBR is negative and significant in the IV estimates for 2000-01 and 2004-
05 respectively.
�
17
�$ ����9!�����������������6�%/�� ���-�=�9:::.:"�
VARIABLES I II III IV V
(1) (2) (3) (4) (5) (6) (7) (8) (9) (10)
OLS IV OLS IV OLS IV OLS IV OLS IV
Capital 0.316* 0.709* 0.316* 0.708* 0.320* 0.706* 0.319* 0.720* 0.307* 0.752*
(0.00582) (0.00975) (0.00582) (0.00974) (0.00586) (0.00963) (0.00599) (0.00997) (0.00604) (0.0117)
Labour 0.825* 0.331* 0.835* 0.345* 0.824* 0.342* 0.819* 0.302* 0.820* 0.332*
(0.00830) (0.0133) (0.0102) (0.0150) (0.00832) (0.0131) (0.00858) (0.0139) (0.00813) (0.0141)
SBR 1.076* 0.384 1.158* 0.491 0.683* -0.392 0.980* -0.333 -0.295 1.570*
(0.401) (0.486) (0.403) (0.489) (0.403) (0.484) (0.403) (0.487) (0.406) (0.509)
Size*SBR -0.228* -0.292*
(0.127) (0.155)
Urban*SBR 0.786* 1.589*
(0.0762) (0.0922)
Age*SBR 0.260* 2.004*
(0.0707) (0.0951)
Org*SBR 0.201* -0.630*
(0.0228) (0.0345)
Constant 6.797* 2.710* 6.751* 2.660* 6.737* 2.696* 6.770* 2.620* 7.051* 2.268*
(0.181) (0.281) (0.184) (0.283) (0.179) (0.279) (0.180) (0.282) (0.197) (0.304)
Ind. Dummy Yes Yes Yes Yes Yes Yes Yes Yes Yes Yes Wu-Hausman
Test for
Endogeneity
3540.35
(0.00)
3536.92
(0.00)
3473.11
(0.00)
3520.04
(0.00)
3222.35
(0.00)
N 24303 24303 24303 24303 24303 24303 24300 24300 23252 23252
R-squared 0.830 0.738 0.830 0.739 0.830 0.743 0.830 0.739 0.833 0.728
Note: * statistically significant at minimum 10 per cent level. Figures reported in the parentheses are standard errors.
18
�
$ ����>!�����������������6�%/�� ���-�=�9::8.:;�
VARIABLES I II III IV V
(1) (2) (3) (4) (5) (6) (7) (8) (9) (10)
OLS IV OLS IV OLS IV OLS IV OLS IV
Capital 0.307* 0.651* 0.307* 0.649* 0.310* 0.647* 0.311* 0.652* 0.299* 0.697*
(0.00495) (0.00798) (0.00495) (0.00794) (0.00498) (0.00786) (0.00506) (0.00797) (0.00527) (0.00952)
Labour 0.849* 0.423* 0.880* 0.463* 0.850* 0.437* 0.842* 0.413* 0.835* 0.410*
(0.00673) (0.0108) (0.00836) (0.0121) (0.00674) (0.0105) (0.00689) (0.0109) (0.00661) (0.0113)
SBR 2.278* 1.373* 2.466* 1.604* 1.993* 0.891* 2.111* 0.642* 1.576* 2.760*
(0.273) (0.319) (0.274) (0.320) (0.273) (0.318) (0.273) (0.319) (0.277) (0.337)
Size*SBR -0.638* -0.765*
(0.102) (0.120)
Urban*SBR 0.688* 1.218*
(0.0578) (0.0682)
Age*SBR 0.278* 1.321*
(0.0528) (0.0668)
Org*SBR 0.216* -0.466*
(0.0168) (0.0252)
Constant 6.515* 2.785* 6.400* 2.674* 6.452* 2.776* 6.494* 2.859* 6.655* 2.230*
(0.150) (0.215) (0.152) (0.216) (0.149) (0.213) (0.149) (0.213) (0.156) (0.230)
Ind. dummy Yes Yes Yes Yes Yes Yes Yes Yes Yes Yes Wu-Hausman
Test for
Endogeneity
3788.42
(0.00)
3755.64
(0.00)
3701.12
(0.00)
3689.49
(0.00)
3638.1
(0.00)
N 31014 31014 31014 31014 31014 31014 30933 30933 30004 30004
R-squared 0.851 0.780 0.851 0.781 0.852 0.784 0.852 0.784 0.854 0.768
Note: * statistically significant at minimum 10 per cent level. Figures reported in the parentheses are standard errors.

19
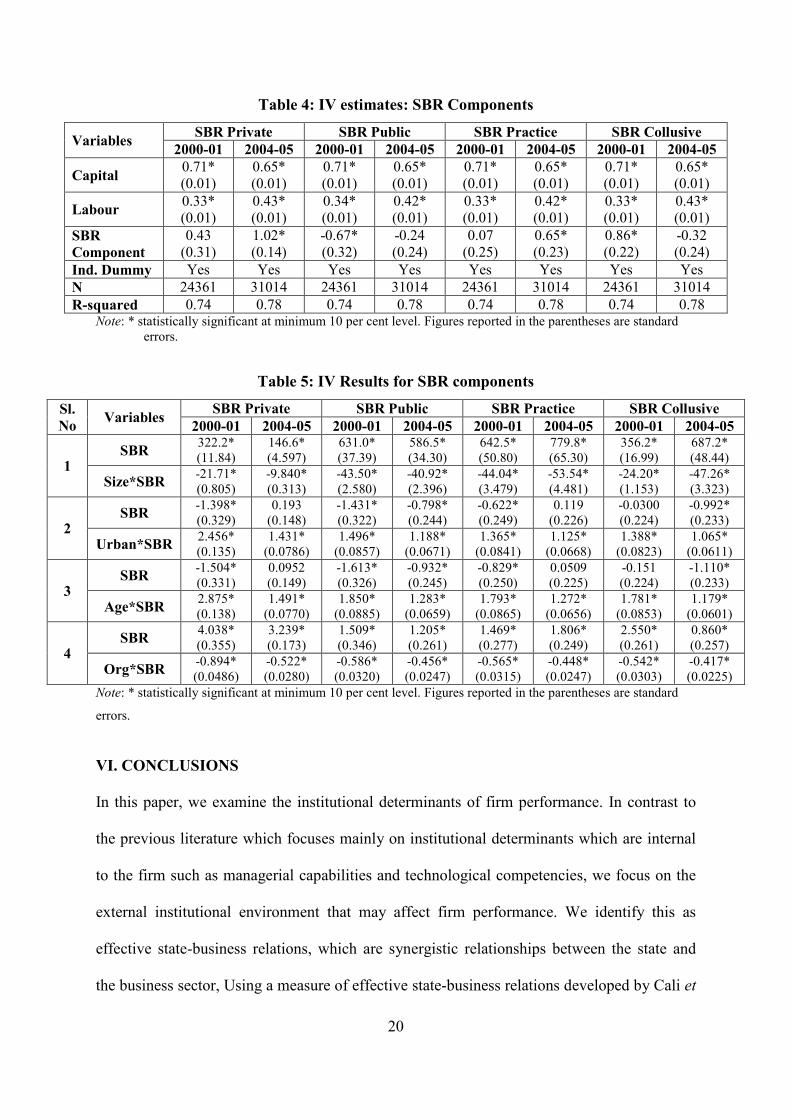
��4 �������������4�����
We have also examined the impact of four components of SBR (SBR private, SBR public,
SBR practice and SBR collusive) on firm performance by estimating the IV regression model
(equation 1). Results in Table 4 indicate that the SBR private and SBR practice components
have a positive and significant effect on TFP for 2004-05, while the SBR collusive
component has a similar effect on TFP for 2000-01. However, the SBR public dimension
seems to have a negative and significant effect on TFP for the year 2000-01. This latter
finding may possibly reflect the fact that setting up of corporations by the state and public
expenditure on economic sectors has not led to the provision of high quality public goods that
matter for private sector performance (Panagariya 2008). Nevertheless, it is clear that the
private, practice and collusive dimensions of the overall SBR measure have contributed to the
overall positive impact of effective SBR on firm performance.
In addition, we have looked at whether our findings with regard to the control variables are
consistent across SBR components. We find that the interaction effect of SBR and the control
variables are similar across these components (Table 5). That is, small sized firms, firms in
urban areas, older firms and firms with simpler organisational structures (less public
participation) do better across all dimensions of SBR. The results with the interaction terms
between SBR and firm location and between SBR and age are somewhat surprising with the
SBR coefficients becoming negative across almost all dimensions of SBR. However, this can
be explained by the fact that the effective SBR primarily indicates effectiveness of business
associations, most being urban focused and more applicable to older firms. Furthermore, we
noticed that the net effect of SBR captured in the summation of the SBR term on its own and
the interaction of SBR with firm location on one hand and the age on the other is always
positive across all the dimensions of SBR.
�
20
$ ����8!��-������ ���!�����'��4�����
- �� ������������2 ��� ���������� ������ ������ ����'�����2��
9:::.:"� 9::8.:;� 9:::.:"� 9::8.:;� 9:::.:"� 9::8.:;� 9:::.:"� 9::8.:;�
' 4�� ���0.71*
(0.01)
0.65*
(0.01)
0.71*
(0.01)
0.65*
(0.01)
0.71*
(0.01)
0.65*
(0.01)
0.71*
(0.01)
0.65*
(0.01)
/ ����0.33*
(0.01)
0.43*
(0.01)
0.34*
(0.01)
0.42*
(0.01)
0.33*
(0.01)
0.42*
(0.01)
0.33*
(0.01)
0.43*
(0.01)
����
'��4����
0.43
(0.31)
1.02*
(0.14)
-0.67*
(0.32)
-0.24
(0.24)
0.07
(0.25)
0.65*
(0.23)
0.86*
(0.22)
-0.32
(0.24)
��(������ Yes Yes Yes Yes Yes Yes Yes Yes
#� 24361 31014 24361 31014 24361 31014 24361 31014
�.�5 ���� 0.74 0.78 0.74 0.78 0.74 0.78 0.74 0.78 *���: * statistically significant at minimum 10 per cent level. Figures reported in the parentheses are standard
errors.�
�
$ ����;!��-�������������������4�����
��(�
#��- �� �����
�������2 ��� ���������� ������ ������ ����'�����2��
9:::.:"� 9::8.:;� 9:::.:"� 9::8.:;� 9:::.:"� 9::8.:;� 9:::.:"� 9::8.:;�
"�����
322.2*
(11.84)
146.6*
(4.597)
631.0*
(37.39)
586.5*
(34.30)
642.5*
(50.80) 779.8*
(65.30)
356.2*
(16.99) 687.2*
(48.44)
��C�D����-21.71*
(0.805)
-9.840*
(0.313)
-43.50*
(2.580)
-40.92*
(2.396)
-44.04*
(3.479) -53.54*
(4.481)
-24.20*
(1.153) -47.26*
(3.323)
9�����
-1.398*
(0.329)
0.193
(0.148) -1.431*
(0.322)
-0.798*
(0.244)
-0.622*
(0.249) 0.119
(0.226)
-0.0300
(0.224) -0.992*
(0.233)
&�� D����2.456*
(0.135)
1.431*
(0.0786)
1.496*
(0.0857)
1.188*
(0.0671)
1.365*
(0.0841) 1.125*
(0.0668)
1.388*
(0.0823) 1.065*
(0.0611)
>�����
-1.504*
(0.331)
0.0952
(0.149)
-1.613*
(0.326) -0.932*
(0.245)
-0.829*
(0.250) 0.0509
(0.225) -0.151
(0.224) -1.110*
(0.233)
���D����2.875*
(0.138) 1.491*
(0.0770)
1.850*
(0.0885) 1.283*
(0.0659)
1.793*
(0.0865) 1.272*
(0.0656) 1.781*
(0.0853) 1.179*
(0.0601)
8�����
4.038*
(0.355) 3.239*
(0.173)
1.509*
(0.346) 1.205*
(0.261)
1.469*
(0.277) 1.806*
(0.249) 2.550*
(0.261) 0.860*
(0.257)
%��D����-0.894*
(0.0486) -0.522*
(0.0280)
-0.586*
(0.0320)
-0.456*
(0.0247)
-0.565*
(0.0315)
-0.448*
(0.0247) -0.542*
(0.0303)
-0.417*
(0.0225) *���: * statistically significant at minimum 10 per cent level. Figures reported in the parentheses are standard
errors.�
�
-�(�'%#'/&��%#��
In this paper, we examine the institutional determinants of firm performance. In contrast to
the previous literature which focuses mainly on institutional determinants which are internal
to the firm such as managerial capabilities and technological competencies, we focus on the
external institutional environment that may affect firm performance. We identify this as
effective state-business relations, which are synergistic relationships between the state and
the business sector, Using a measure of effective state-business relations developed by Cali ���

21
��. (2009) and firm-level data for the entire Indian formal manufacturing sector for 2000-01
and 2004-05, we show that effective state-business relations have had a significant positive
effect on total factor productivity for formal manufacturing sector firms in India. We also
find that the effect of the external institutional environment on firm performance is dependent
on specific firm characteristics – firms with certain characteristics are more likely to benefit
from effective state-business relations than others. We find that smaller firms, firms in urban
areas, older firms and firms with simpler organisation structures (less public participation) do
better with more effective state-business relations. This suggests that both internal and
external institutional factors matter for firm performance and the effects of external and
internal institutional determinants on firm performance are strongly complementary.
Our disaggregated analysis of which dimension of state-business relations matter most for
firm performance suggest that the private, practice and collusive components contribute to
the overall impact of effective SBR on firm performance. However, the public dimension of
effective state-business relations seems to have a negative effect on TFP. Thus our results
suggest that it is important to improve the quality of public goods provided by the sub-
national state governments which can further enhance the impact of other sub-components.
Overall, our finding suggests that there is a need to strengthen the collaborative relationships
between the state and the business sector to enhance the performance of firms in the
manufacturing sector. As has been witnessed in the cases of South Korea and Taiwan, the
formalisation of interactions between the state and the business sector can occur through
public-private dialogues on issues having direct implications for firms’ growth.

22
�,�,�,#',��
Aghion, P. Burgess R., Redding S. and F. Zilibotti (2006), The Unequal Effects of
Liberalization: Evidence from Dismantling the License Raj in India, CEP Discussion
Paper No 728.
Amsden, A. (1989), '��,� *�-�� (���� � ������ "����� ���� !���� $��������������. Oxford
University Press: New York.
Amsden, A. (2001), ����������� ������� ����������� ��� ����.��� �����!���/$���������0����
��������. Cambridge University Press: Cambridge.
Aoki, M. (2001), ��������������������$������������'�����. The MIT Press: Cambridge.
Ayyagari, M. and Maksimovic, V (2008), ‘Industry Growth, Firm Size and the Business
Environment’, Micro Report No. 127, USAID, Washington.
Bates, T. (1990), ‘Entrepreneur Human Capital Inputs and Small Business Longevity,, ����
����������&��������������������1�A9, 551-559.
Becker, B. and Barry, G. (1996), ‘The Impact of Human Resource Management on
Organizational Performance: Progress and Prospects’, '���������������������2������1�
>7, 779–801.
Besley, T. and Burgess, R. (2004), ‘Can Labour Regulation Hinder Economic Performance?
Evidence from India’, 3���������2����������&�������, ""7, 91-134.
Bertrand, M. and Mullainathan, S. (2001), ‘Do People Mean What They Say? Implications
for Subjective Survey Data’, '��������&��������������, 7", 67-72.
Boardman, A. E., and Vining, A. R. (1989), ‘Ownership and Performance in Competitive
Environments: A Comparison of the Performance of Private, Mixed, and State-Owned
Enterprises’, 2����������!�������&�������1�>91 1-33.
Cali, M., Mitra, S. and Purohit, P. (2009), ‘State-Business Relations in Indian States: Paper
towards Constructing an Effective SBR Index for Indian States’, Discussion Paper No.
25, IPPG: Manchester.
Cammett, M. (2007), “Business-Government Relations and Industrial Change: The Politics of
Upgrading in Morocco and Tunisia”, .���������������, >;, 1889-1903.
Carlin, W. and Seabright, P. (2009), ‘Bring Me Sunshine: Which Parts of the Business
Climate Should Public Policy Try to Fix?’, in J. Lin and Pleskovic, B. (eds.) '������
23
���4��������������������������&������� �5����������������������������. World
Bank: Washington D.C.
Chhibber, P. K. and Majumdar, S. K. (1998), ‘State as Investor and State as Owner:
Consequences for Firm Performance in India’, &�������� ����������� ���� ���������
������6 8?, 561-580.
Chhibber, P. K. and Majumdar, S. K. (1999), ‘Foreign Ownership and Profitability: Property
rights, Control and the Performance of Firms in Indian Industry’, 2������� ��� !�������
&�������6 ?9, 209-238.
Cimoli M., G. Dosi, J.E. Stiglitz (2009), $���������5������ ��������������6� ����5���������
&���������������������'�����������, Oxford University Press: USA.
Dollar, D., Hallward-Driemeier, M. and Mengistae, T. (2005), ‘Investment Climate and Firm
Performance in Developing Countries’, &�������� ����������� ���� ��������� ������,
;8, 1-31.
Doner, R.F and Schneider, M.R. (2000), ‘Business Associations and Economic Development:
Why Some Associations Contribute More than Others’, ������ ����5������, 9, 261-
288.
Evans, P. (1995), &�������� '�������6� ������ ���� $��������� �������������. Princeton
University Press: Princeton.
Hallward-Driemeier, M. and Stewart, D. (2004), ‘How Do Investment Climate Conditions
Vary Across Countries, Regions and Types of Firms?’, Background paper, World
Development Report 2005.
Harriss, J. (2006) ‘Institutions and State-Business Relations’, Briefing Note 2, IPPG: London.
Ibarra, L.A. (1995), ‘Credibility of trade policy reform and investment: The Mexican
experience’, Journal of Development Economics, 8A, 39-60.
Jackling, B. and Johl, S. (2009), ‘Board Structure and Firm Performance: Evidence from
India’s Top Companies’, ���������(��������� �'��$�������������������, "A, 492-509.
Khanna, T. and K. Palepu (2000), ‘Is Group Affiliation Profitable in Emerging Markets? An
Analysis of Diversified Indian Business Groups’, 2����������7������, 8:, 867-891.
Maxfield, S. and B.R. Schneider (1997), ������ ���� ���� ������ ��� ���������� ��������.
Cornell University Press: Ithaca.

24
Moore, M. and Schmitz, H. (2008), ‘Idealism, Realism and the Investment Climate in
Developing Countries’, Working Paper No. 307, Institute of Development Studies.
Nelson, R. R. and S.G. Winter (1982), '�� &������������ ������� ��� &�������� ������.
Harvard University Press: Cambridge.
Panagariya, A. (2008), $���� �����&��������(����, Oxford University Press: Oxford.
Penrose, E. T. (1959), ������������������(�������������7���, Basil Blackwell: Oxford.
Qureshi, M. and te Velde, D.W. (2007), ‘State-Business Relations and Firm Performance in
Zambia’, Discussion Paper No. 5, IPPG: London.
Rodrik, D. (1991), ‘Policy uncertainty and private investment in developing countries’,
2���������������������&�������, >?, 229-243.
Sen, K. and te Velde, D. W. (2009), ‘State Business Relations and Economic Growth in Sub-
Saharan Africa’, 2���������������������������, 8;, 1-17.
Shleifer, A. and R. Vishny (1989), ‘Managerial Entrenchment: The Case of Manager-specific
Investments’, 2����������7���������&�������, 9;, 123-139.
te Velde, D.W. (2006), ‘Measuring State Business Relations in Sub-Saharan Africa’,
Discussion Paper No. 4, IPPG: London.

25
,��#�����
1 An alternate set of arguments on the external institutional determinants of firm performance, propounded by
the World Bank, among others, is that the investment climate – understood to be the institutional, policy and
regulatory environment in which firms operate – has a strong impact on firm performance. However, as Moore
and Schmitz (2008, p. 10) have argued, “the core conceptual problem with (this view) is that government and
political power are viewed primarily as persistent threats to capital, investment and economic growth. From that
perspective, the policy mission is to curtail the influence of political power through formal rules, laws and
institutions. If that mission fails, politicians are expected at least to maltreat the private economy, and possibly
to loot it, and thus, undercut economic growth.” Thus, there is a strong assumption in this literature that the
state, by its very nature, is always predatory, and cannot be developmental in most instances of its
manifestations. In this paper, we take an opposite view: that ‘good growth-enhancing relations between
business and government elites are possible’ (Maxfield and Schneider 1997) and that effective state-business
relations are the core external institutional determinants of firm performance. 2 See Qureshi and te Velde (2007) and Sen and te Velde (2009) for evidence that improvements in state-business
relations improve economic performance both at the micro and macro levels, for Sub Saharan Africa.
3 We have experimented with different weights for the apex and the two sectoral business associations in the
construction of the SBR private variable with no change in the results.
4 The enterprises which employ less than 20 workers without the use of electricity or 10 workers with the use of
electricity or are not producing hazardous substances (such as chemicals) fall under the unorganized/informal
sector, as these are firms that are not required to register with the authorities under the Indian Factories Act of
1948.
5 We cleaned the data in following two steps - omitted units reporting zero or negative capital stock, zero output
and zero employment; and as in 2000, the states of Bihar, Madhya Pradesh and Uttar Pradesh were bifurcated to
form new states Uttrakhand, Chattisgarh and Jharkhand, these three states were merged with their parent states
so as to have consistency with SBR variable.
6 There is strong evidence that in case of India the presence of outside directors on boards are associated with
improved firm performance (Jackling and Johl, 2009).
7 Ayyagari and Maksimovic (2008) demonstrate that a good business environment improves the growth of
industries that are naturally composed of small firms more than large-firm industries. In their view, small firm
dominated industries gain from less stringent and more business friendly regulations associated with starting and
closing a business, licensing requirements, exporting and importing, employment hiring and firing decisions,
paying taxes, protecting investors and obtaining credit.