does the bsc improve performance? a review of the empirical...
TRANSCRIPT
Aarhus University
School of Business and Social Sciences
1st of August 2015
Does the BSC improve performance?
A review of the empirical literature
Author:
Anca Ichim
Academic Supervisor:
Rainer Lueg
Program:
MSc. Management Accounting and Control
Number of characters without spaces: 126.027
Page | 2
Abstract
The Balanced Scorecard is a well known and widely used strategic performance management
system. The evidence of the BSC’s influence on performance is claimed to be both ambiguous
and limited to financial measures. By using a systematic review of empirical literature, this paper
identifies a total of 266 studies published between 1992 and March 2015, out of which only 53
specifically address the performance effects of the BSC. Based on these studies, the author seeks
to offer some insights into how the adoption of the BSC can bring economic and intangible
benefits to organizations, considering, among others, the implementation stage, how the actors
are influenced by the implementation and the way performance is reported. The findings suggest
that a successful BSC implementation leads to a wide variety of performance improvements,
both financial and non-financial. Based on the findings and knowledge gathered from the paper,
some recommendations are also suggested for future research.

Page | 3
Table of contents
1. Introduction ……………………………………………………………………… 5
2. Theoretical background …………………………………………………………... 6
2.1. The balanced scorecard and organizational performance…………………….. 6
2.2. Types of BSC ………………………………………………………………… 7
3. Methodology …………………………………………………………………….. 9
3.1. Planning the review …………………………………………………………... 9
3.2. Conducting the review ……………………………………………………….. 10
3.3. Reporting and dissemination …………………………………………………. 11
4. The literature review ……………………………………………………………… 12
4.1. A brief description of the identified categories ……………………………… 12
4.2. The general context of the studies …………………………………………… 17
4.2.1. The evolution of research over time …………………………………... 17
4.2.2. Sectors of activity and industry settings ……………………………… 18
4.2.3. The geographic location ………………………………………………. 20
4.3. The Author’s Perspective …………………………………………………….. 22
4.3.1. Publication patterns …………………………………………………… 23
4.3.2. Research method and type of data …………………………………… 24
4.3.3. Sizes and types of organizations ……………………………………… 25
4.3.4. The BSC’s implementation status …………………………………….. 26
4.3.5. The research topic …………………………………………………... 26
4.3.6. Key informants ……………………………………………………….. 26
4.4. The organization’s perspective ………………………………………………. 27
4.4.1. The BSC’s time frame ………………………………………………… 28
4.4.2. The BSC’s implementation phase ……………………………………. 28
4.4.3. The BSC’s implementation status ……………………………………. 29
4.4.4. Linked incentives …………………………………………………….. 29
4.4.5. Reasons behind BSC adoption ……………………………………….. 30
4.4.6. The performance effects of the BSC …………………………………. 30
4.4.7. Motivated/ influenced actors …………………………………………. 31
5. Discussion ………………………………………………………………………… 33
Page | 4
5.1. Findings regarding the impact of the BSC on organizational performance …... 33
5.1.1. Non-representative studies ……………………………………………. 33
5.1.2. Representative studies ………………………………………………… 36
5.1.3. Comparison of the representative studies …………………………….. 41
5.2. Recommendations for future research ……………………………………….. 43
6. Limitations and conclusion ……………………………………………………….. 45
6.1. Limitations …………………………………………………………………… 45
6.2. Conclusion …………………………………………………………………… 45
7. References ………………………………………………………………………… 47
8. Appendices ………………………………………………………………………72
Page | 5
1. Introduction
The Balanced Scorecard (BSC) was first introduced in 1992 as a framework for performance
measurement, eventually being transformed and developed into a strategic management tool,
suited for today’s highly competitive, complex and continuously changing business environment,
a performance management system which “provides managers with the instrumentation they
need to navigate to future competitive success” (Kaplan & Norton, 1996a). The framework is
constructed by translating the company’s strategy and mission into objectives and
comprehensive performance measures across four perspectives: financial, customers, internal
business processes and learning and growth.
There are many researchers claiming that evidence of the BSC’s impact on organizational
performance is limited and ambiguous in the literature, focusing mostly on financial performance
improvements (Capelo and Dias, 2009; Tapinos et al., 2008; Chenhall, 2005).
In their third book on the BSC, Kaplan and Norton tracked the performance of many companies
implementing the BSC, companies that they observed achieving breakthrough performance,
especially through alignment and focus. According to them, “many other organizations now have
adopted the Balanced Scorecard and achieved remarkable results”(Kaplan & Norton, 2001). This
paper seeks to investigate Kaplan and Norton’s performance claim of the BSC, to see how the
BSC implementation and use influence the organizational performance. Therefore, the main
research question (RQ) of the paper is: Does the BSC implementation positively impact the
organizational performance within the empirical BSC literature?
Answering the RQ will also imply investigating the way the effects on performance are assessed
and reported, in what stage of implementation they appear and how the BSC motivates its actors
to improve performance.
The paper approaches a systematic literature review focused on empirical research from January
1992 to March 2015 considered relevant for the purpose of this paper, namely 266 worldwide
studies, across all sectors. Even if the main focus will be on the studies that provide evidence of
performance improvement using the BSC, the other empirical studies dealing with the BSC will
be dealt with as well, in order to offer a more insightful view of how the BSC is actually used in
practice.
Page | 6
The paper seeks to contribute to the body of knowledge on the BSC by providing practitioners
with guidance, examples and insights of how the BSC use influences organizational performance
and informing the research community on the up-to-date empirical literature on the BSC and its
effects on performance.
The remainder of this paper is organized as follows: Section 2 presents the theoretical
background for the paper, Section 3 details the methodology used in selecting the empirical
studies, Section 4 covers the literature review, Section 5 is dedicated to the discussion part and
recommendations for future research, while the last part, Section 6, outlines the limitations of the
studies and the conclusion.
2. Theoretical background
2.1. The Balanced Scorecard and organizational performance
The BSC was first introduced in 1992. What started as a performance measurement system soon
became a strategic performance management tool that goes beyond just being a set of financial
and non financial measures. It uses four perspectives to translate the strategy into a linked set of
measure across four perspectives: financial, customers, internal business processes and learning
and growth. In order to achieve performance improvements, the scorecard should have leading
and lagging indicators specific to each organization, linked together by cause-and-effect
relationships (Kaplan and Norton, 1996a, 2001a).
To lead to enhanced organizational performance, a BSC should become the corner stone of the
management system (Kaplan and Norton, 1996c), which “wires every part of the organization to
the strategy” (Kaplan and Norton, 2001b, p. 64).
The BSC has rapidly become a widely used management tool around the world. Since its
appearance, a lot of studies have been conducted to attest its popularity. A more recent example
is a study by Bain and Company, Management Tools and Trends 20131, conducted on more than
12.000 respondents around the world, which shows that the BSC is the 5th most used
1 See http://www.bain.com/publications/articles/management-tools-and-trends-2013.aspx
Page | 7
management tool in the world. The same study also positions the BSC at the top of the list in
Europe, Middle East and Africa.
Besides its wide use and increasing popularity, the BSC faces also considerable critique
regarding its effectiveness and lack of clear evidence in regards to organizational performance.
For example, Nørreklit (2005, p. 611) claims that Kaplan and Norton present no sound
arguments to prove that the BSC actually give the results they claim, creating nothing more than
an illusion by using metaphors and other stylistic devices. She goes even forward in describing
the BSC as being part of the “genre of the management guru text”. Otley (1999, p. 375, 376)
argues ambiguity in target setting, in reward structures, the role of feedback or when analytically
linking leading and lagging indicators, claiming that the chain of events that would lead to
performance improvement is merely a simplified reality.
Even though Kaplan and Norton suggest that “the BSC clearly reveals the value drivers for
superior long-term financial and competitive performance” (Kaplan and Norton, 1996a, p.8),
they also state that it takes sustained effort and time – two to three years from implementation -
for the actual breakthrough performance to be achieved (Kaplan and Norton, 2001c).
Kaplan, in a journal article written in 2012, expressed his concern about the “narrow perspective
on the implications of the BSC for management theory on practice” (Kaplan, 2012, p. 540),
surprised by the fact that the critiques and commentaries regarding the BSC are only focusing on
the BSC as a measurement system, as first described in 1992, and not on the BSC they have been
focusing their attention on for the last 16 years (see Kaplan, 2012 p. 540). This concern is also in
line with the findings of Lawrie and Cobbold (2004, p. 618), that suggest the academic
contributions tend to focus more on the BSC as a management tool for control. On the same
subject, Braam and Nijssen (2004, p. 345) concluded their study by stating that “a focus on
performance measurement instead of performance management will impede the realization of
organizational objectives and may even prove counterproductive by hurting company
performance”.
2.2. Types of BSC
Based on the BSC concept developed by Kaplan and Norton over time, Speckbacher et al. (2003,
p. 363) identified three main types of BSC. Type I BSC is the “minimum standard BSC”
Page | 8
(Speckbacher et al., 2003, p. 362), a performance measurement system using financial and non-
financial measures and linking tangible and intangible assets.
Type II BSC takes the Type I BSC to the next step by describing the strategy using clear cause-
and-effect linkages between objectives and introducing the strategy map. The BSC is still a
performance measurement system, only with measures linked to strategy.
Lastly, Type III BSC is the “fully-developed BSC” (Speckbacher et al., 2003, p. 362) and it goes
from a measurement system to a strategic management system, using defined objectives and
action plans to describe and implement the strategy. It also ties the incentives to the BSC for
positive motivation, which leads, along with communication and action plans, to strategy
implementation.
In the same note, Lawrie and Cobbold (2004) identified 3 generations of BSC. The first
generation BSC was described as a vague control tool for managers, used merely for
measurement and reporting.
The second generation BSC introduced some key innovations like strategy maps, strategic
objectives and causality that helped the process of identifying, filtering and weighting the
measures of the scorecard.
Finally, the third generation scorecard is described as a more functional second generation BSC,
with enhanced strategic relevance. The strategic objectives and target settings are now revised
and validated, identifying the inconsistencies.
Both Type III and the 3rd generation BSC fully fit Kaplan and Norton’s strategic performance
management system, who suggest that “a successful BSC should be a change project, not a
metrics project” (Kaplan and Norton, 2001b, p.64). The cases where the incentives are not yet
linked to the BSC must not be overlooked, following Kaplan and Norton’s (1996a, p. 283)
advice that organizations might need to “get some experience in managing the BSC before
explicitly tying compensation to it”. This way, the value creation that might occur in the earlier
stages of implementation will be also captured.
Page | 9
3. Methodology
In order to investigate and answer the research questions of this paper, the systematic review
methodology will be used - a methodology that has its roots in medical research and consists of a
replicable and transparent process that gathers existing studies and leads to identifying key
contributions to a specific topic or problem (Tranfield et al., 2003, p. 209).
This type of research should not seek to “provide answers or to replace judgment and experience,
but instead […] to inform decision making and action” (Denyer and Tranfield, 2009, p. 686).
Denyer and Tranfield (2009, p. 671) define the systematic review as being “a specific
methodology that locates existing studies, selects and evaluates contributions, analyses and
synthesizes data, and reports the evidence in such a way that allows reasonably clear conclusions
to be reached about what is and what is not known”. The outcomes of the systematic review can
consist either of robust and dependable evidence or incongruent findings that identify knowledge
gaps and areas that need more research (Denyer and Tranfield, 2009, p. 672).
The systematic review can be a rigorous and powerful tool, at the same time raising some
challenges when it comes to synthesizing the results (Denyer et al., 2008, p. 304). In order to
tackle some of these challenges, Rousseau et al. (2008, p. 485) propose not to favor one research
method over another but to that all methods have limitations, consider the cultural and political
implications of evidence, by acknowledging the differences among geographical locations and
considering different theoretical and methodological perspectives.
The systematic review process comprises three main stages: planning the review, conducting the
review and reporting and dissemination (Tranfield et al., 2003, p. 214). All stages will be dealt
with in the following part of the paper, to ensure transparency and understanding of the empirical
literature selection process.
3.1. Planning the review
This first stage of the review helps delimiting the subject area and assessing the relevance and
size of the literature (Tranfield et al., 2003, p.214).
With the research problem in mind, the initial search started with deciding upon the databases
that will be used to identify the studies. The author first employed EBSCO, one of the largest
Page | 10
known scientific databases that provide a broad coverage of research studies. The search was
then extended to ABI Inform (ProQuest) database, in order to consider more relevant studies and
to include also interdisciplinary and alternative perspectives on the topic.
The next inclusion criteria were the language of the studies, set to English, and the time frame,
which has been set from 1992 to March 2015, 1992 being the year when Kaplan and Norton
published their first article on the BSC, and March 2015 being the time this research started. The
search was also limited to studies containing the string “Balanced Scorecard” anywhere in the
articles’ title, key words or abstract. The decision of including also the abstract was based on the
fact that the abstract announces the key themes and main points of the study (Booth et al., 2008,
p. 211).
The last inclusion criterion established on this stage involves the searching source, which was set
to journal contributions. Studies published in journals offer the warranty of a certified, worth
reading contribution (Davis, 2014, p. 200).
A total of 1378 studies resulted from the search within EBSCO database and 960 from ABI
Inform.
3.2. Conducting the review
This second stage of the review consists primarily of assessing the quality of the selected studies,
which is a relatively subjective and challenging process. The bias can be reduced by selecting the
studies based on the implicit quality rating of the journals and by using data extraction forms to
document the entire process (Tranfield et al., 2003, p.217).
To make sure the review considers high quality, relevant studies, only the peer reviewed articles
have been included, published in journals that scored at least 2 in the Academic Journal Guide
20152, the rating 2 being assigned to journals of an acceptable standard. Journals that scored less
than 2 were excluded because they are considered of a “more modest standard […] and few
journals in this category carry a citation impact factor” (Academic Journal Guide 2015, p. 7).
This set of constrains reduced the number of studies to 449 in EBSCO database. ABI Inform
2 See Appendix 1 – The Academic Journals and Subject Areas. See http://www.bizschooljournals.com/academic-
journal-guide-2015/ for more information.
Page | 11
added 90 more studies. A total of 539 relevant articles were revealed after this step of the review
process.
To further decrease the risk of excluding relevant articles, the VHB 20153 journal ranking of the
German Academic Association for Business Research has been used. This ranking “has become
the most influential journal evaluation approach in German-speaking countries” (Schrader and
Hennig-Thurau, 2009, p. 180). Only articles published in journals ranking from A+ (world
leading journals) to C (recognized journals) were considered (Harzing, 2015, p.10). This added
14 extra studies, making a total of 553 articles.
The next step on this stage consisted of examining the abstracts and introductions of all the
articles in order to identify only the empirical studies focusing on the BSC. As a result, 287
articles have been removed from the review.
This was also the step where the data extraction forms were employed, classifying all empirical
studies resulted so far from the search, according to their general information like title, authors,
publication year and publication journal, but also study features and specific information like
industry, geographic location, topic and themes, research methods and key results. At this point,
all information needed to summarize and synthesize the data in a comprehensible and
documented manner is gathered, the final data set basis for this research comprising a total of
266 studies.
3.3. Reporting and dissemination
Reporting and dissemination is the last stage of the review and starts with synthesizing and
organizing all 266 identified empirical studies, based on the main research topic and findings
specified in the data extraction forms, in order to provide an overall up-to-date picture of the
BSC research. To capture all relevant information from the studies, both Excel and the
qualitative research tool Atlas.ti have been used. Seven main categories have been identified
after reading the studies, as it can be observed in Table 1 below. All seven categories for the
classification have been subjectively established by the author after reading the studies and based
on the normative theory of the BSC to ensure the reliability of the process. They will be
3 See Appendix 1 – VHB JOURQUAL 3 ranking. See http://vhbonline.org/service/jourqual/vhb-jourqual-
3/gesamtliste/ and http://www.harzing.com/download/jql_subject.pdf for more information.
Page | 12
described and analyzed in the following part of the paper, with a greater focus on the last
category, which represents the main data set considered for answering the research question.
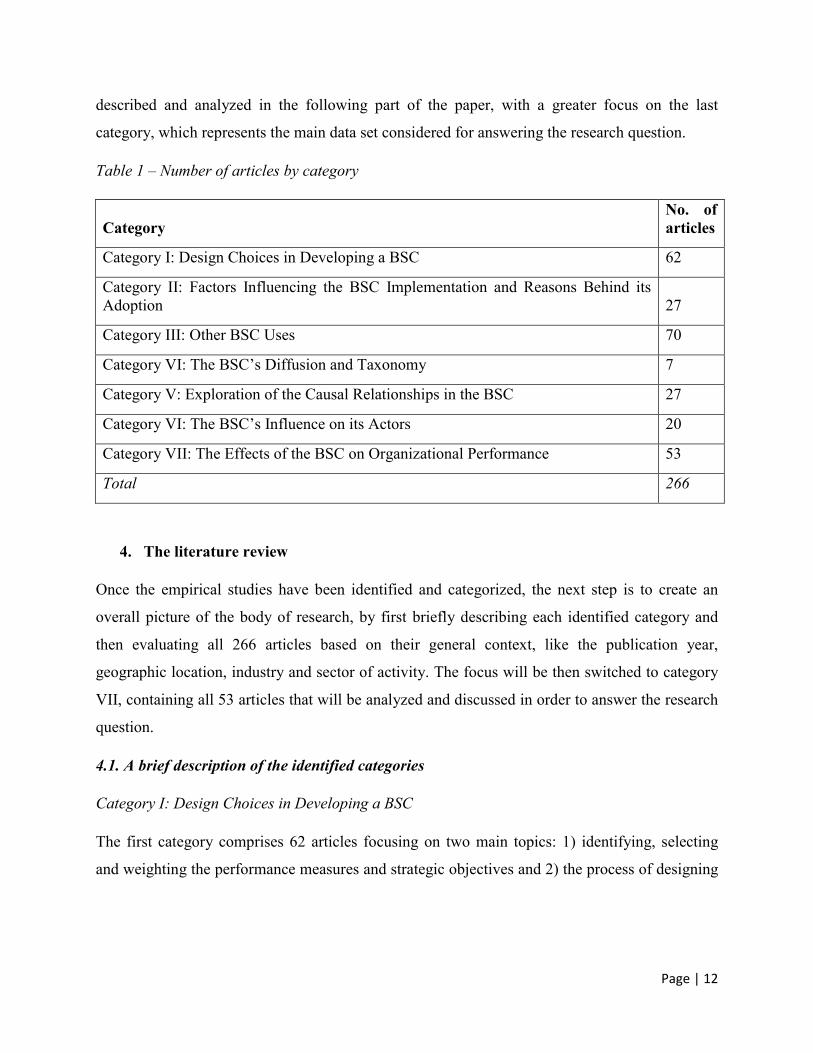
Table 1 – Number of articles by category
Category No. of articles
Category I: Design Choices in Developing a BSC 62
Category II: Factors Influencing the BSC Implementation and Reasons Behind its Adoption 27
Category III: Other BSC Uses 70
Category VI: The BSC’s Diffusion and Taxonomy 7
Category V: Exploration of the Causal Relationships in the BSC 27
Category VI: The BSC’s Influence on its Actors 20
Category VII: The Effects of the BSC on Organizational Performance 53
Total 266
4. The literature review
Once the empirical studies have been identified and categorized, the next step is to create an
overall picture of the body of research, by first briefly describing each identified category and
then evaluating all 266 articles based on their general context, like the publication year,
geographic location, industry and sector of activity. The focus will be then switched to category
VII, containing all 53 articles that will be analyzed and discussed in order to answer the research
question.
4.1. A brief description of the identified categories
Category I: Design Choices in Developing a BSC
The first category comprises 62 articles focusing on two main topics: 1) identifying, selecting
and weighting the performance measures and strategic objectives and 2) the process of designing
Page | 13
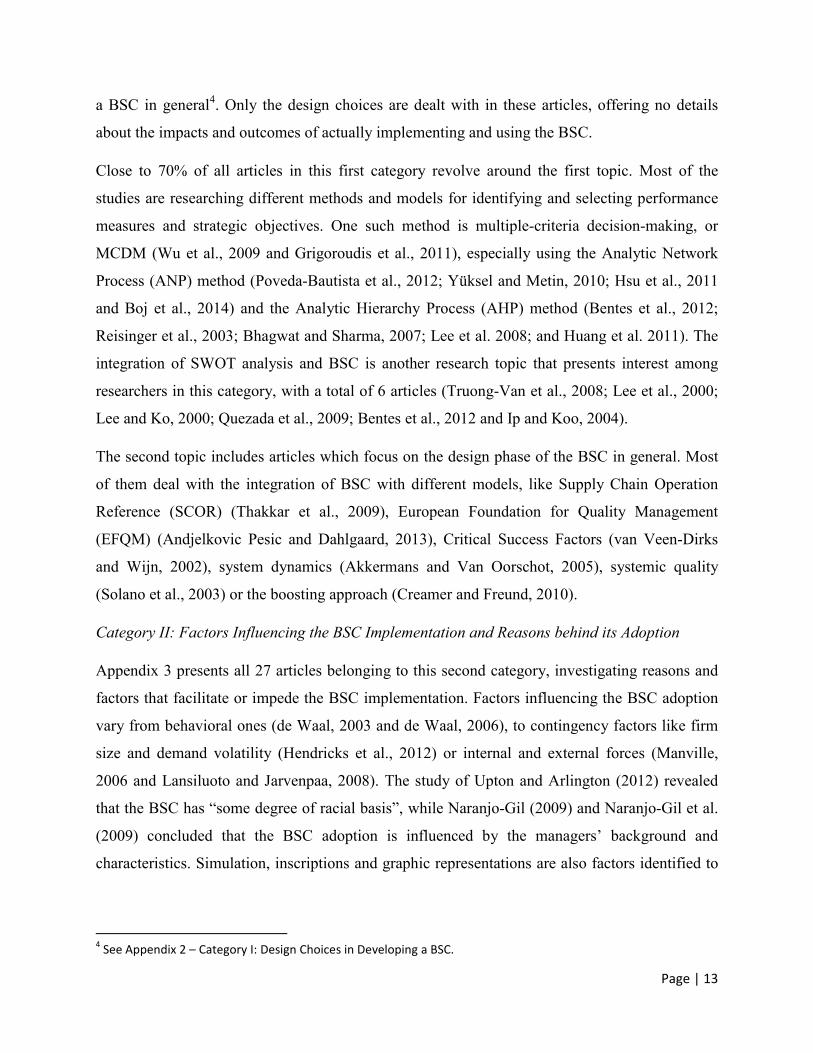
a BSC in general4. Only the design choices are dealt with in these articles, offering no details
about the impacts and outcomes of actually implementing and using the BSC.
Close to 70% of all articles in this first category revolve around the first topic. Most of the
studies are researching different methods and models for identifying and selecting performance
measures and strategic objectives. One such method is multiple-criteria decision-making, or
MCDM (Wu et al., 2009 and Grigoroudis et al., 2011), especially using the Analytic Network
Process (ANP) method (Poveda-Bautista et al., 2012; Yüksel and Metin, 2010; Hsu et al., 2011
and Boj et al., 2014) and the Analytic Hierarchy Process (AHP) method (Bentes et al., 2012;
Reisinger et al., 2003; Bhagwat and Sharma, 2007; Lee et al. 2008; and Huang et al. 2011). The
integration of SWOT analysis and BSC is another research topic that presents interest among
researchers in this category, with a total of 6 articles (Truong-Van et al., 2008; Lee et al., 2000;
Lee and Ko, 2000; Quezada et al., 2009; Bentes et al., 2012 and Ip and Koo, 2004).
The second topic includes articles which focus on the design phase of the BSC in general. Most
of them deal with the integration of BSC with different models, like Supply Chain Operation
Reference (SCOR) (Thakkar et al., 2009), European Foundation for Quality Management
(EFQM) (Andjelkovic Pesic and Dahlgaard, 2013), Critical Success Factors (van Veen-Dirks
and Wijn, 2002), system dynamics (Akkermans and Van Oorschot, 2005), systemic quality
(Solano et al., 2003) or the boosting approach (Creamer and Freund, 2010).
Category II: Factors Influencing the BSC Implementation and Reasons behind its Adoption
Appendix 3 presents all 27 articles belonging to this second category, investigating reasons and
factors that facilitate or impede the BSC implementation. Factors influencing the BSC adoption
vary from behavioral ones (de Waal, 2003 and de Waal, 2006), to contingency factors like firm
size and demand volatility (Hendricks et al., 2012) or internal and external forces (Manville,
2006 and Lansiluoto and Jarvenpaa, 2008). The study of Upton and Arlington (2012) revealed
that the BSC has “some degree of racial basis”, while Naranjo-Gil (2009) and Naranjo-Gil et al.
(2009) concluded that the BSC adoption is influenced by the managers’ background and
characteristics. Simulation, inscriptions and graphic representations are also factors identified to
4 See Appendix 2 – Category I: Design Choices in Developing a BSC.
Page | 14
influence the understanding and adoption of the BSC (Capelo et al., 2015; Rachman-Moore and
Kenett, 2006; Kunc, 2008 and Qu and Cooper, 2011).
Category III: Other BSC Uses
70 articles are included in this category5, making it the most popular one and demonstrating that
the BSC is widely used in different domains and for different purposes compared to its original
one, as a strategic performance management tool.
More than 15% of articles in this category explore using the BSC in ranking and rating
companies in different industries, based on their performance (Zhigang et al., 2013; Bai et al.,
2014; Rabbani et al., 2014; Rotchanakitumnuai, 2013; Dias-Sardinha and Reijnders, 2005; Eom
et al., 2008; Huang, 2008; Douglas and Mills, 2004; MacKerron et al., 2015; Kline et al., 2004
and Jamshed et al., 2014).
Other popular research topics in this category is the use of the BSC in assessing and selecting
investment portfolios (Hanafizadeh et al., 2009; Tsai et al., 2009; Meadows and Pike, 2010;
Tavana et al., 2014 and Hanafizadeh and Moayer, 2008), assessing and selecting information
systems (Martinsons and Davidson, 1999; Loukis and Charalabidis, 2013; Chang et al., 2011;
Tsai et al., 2012; Cebeci, 2009 and Chand et al., 2005) or measuring the performance of
knowledge management (Valmohammadi and Ahmadi, 2015; Chen et al., 2009 and Möller and
Schaltegger, 2003), supply chain management (Bhagwat and Sharma, 2007; Kim and Rhee,
2012; Chang, 2009 and Bhattacharya et al., 2014) and customer management (Shafia et al., 2011;
Kim et al., 2003 and Wu and Hung, 2008).
This category comprises also a number of 5 articles that that explore the BSC used only for
measurement and reporting, without any clear links to strategy (Hoque and Adams, 2011; Malmi,
2001; Länsiluoto and Järvenpää, 2010; Askim, 2004 and Griffith and Neely, 2009).
Category IV: The BSC’s Diffusion and Taxonomy
The fourth category includes only 7 studies, dealing with the classification and spreading of the
BSC6. The study of Speckbacher et al. (2003) investigates the use of BSC in German speaking
countries, identifying 3 types of BSC, while Soderberg et al. (2011) distinguish a five-level BSC
5 See Appendix 4- Category II: Other BSC Uses
6 See Appendix 5 – Category IV: The BSC’s diffusion and taxonomy.
Page | 15
classification by researching the BSC use in Canadian companies. Two of the articles carry out
research on the BSC’s diffusion in Nepal and Nordic countries: the study of Kald and Nilsson
(2000) provides evidence of a wide BSC adoption in Nordic companies, with 27% of
respondents already using it and 61% considering using it in the future, while in Nepal, 40% of
the surveyed companies claimed to use a BSC (Upadhaya et al., 2014).
Category V: Exploration of the Causal Relationships in the BSC
The validity of the causal relationships in the BSC has been contested and criticized over time.
For example, Nørreklit (2000, p. 71) finds the cause-and-effect relationships between the
performance measures in the BSC to be problematic, failing to consider the time dimension. She
also states that the relationships between measures are unclear and “ambiguously defined”
(Nørreklit, 2000, p. 72). Despite the criticism, empirical research brings contrasting evidence,
with more than 44% of the 27 articles7 grouped in this category attesting the validity of the
causal relationships between measures in the BSC perspectives. The study of Huang et al. (2007)
validates the causal model of the BSC in the hospitality industry in China, while in Greece a
sequential positive correlation resulted among the BSC perspectives (Cohen et al., 2008). On the
same note, Chareonsuk and Chansangavej (2010) concluded their study by stating that "the
commonly assumed causal relationships are confirmed". Only one article did not validate the
cause-and-effect relationships, due to a conflict of indicators in the case organization’s BSC
(Patel et al., 2008).
Besides the articles attesting the causal relationships validity, this fifth category includes also
empirical studies that investigate the use of different models and methods to assess the causality,
like Analytic Hierarchy Process (AHP) and linear programming (Quezada and López-Ospina,
2014) or system dynamics (Bernabè, 2011 and Nielsen and Nielsen, 2012).
Category VI: The BSC’s Influence on its Actors
Appendix 7 presents all 20 articles included in this category and exploring the effects the BSC
implementation have on employees, managers and other stakeholders.
The BSC strategy maps are found to positively influence the manager’s mental models and their
performance (Capelo and Dias, 2009) and to reduce the managers’ causal ambiguity regarding 7 See Appendix 6 – Category V: Exploration of the Causal Relationships in the BSC.
Page | 16
the pursued objectives (González, 2012). In line with these findings, we learn from the study of
Cheng and Humphreys (2012) that the strategy maps “enhances both managers' information
relevance and strategy appropriateness judgments” (p.899).
Another topic of research in this fifth category revolves around the influence of common vs.
unique measures in the BSC. Results from Lipe and Salteiro (2000) suggest that common
measures have a higher influence on managers’ performance evaluations than unique measures.
The same results are also confirmed in the study of Banker et al. (2004).
Molina et al. (2014) concluded that BSC implementation and the active involvement of
employees leads to motivation, satisfaction and higher commitment. On the contrary, from
Antonse (2014) we learn that the BSC “strengthens formal control and reduces employees’ scope
for contributing new ideas […] and inhibits the communication of new ideas” (p.49)
The Effects of the BSC on Organizational Performance is the last identified category, covering a
total of 53 articles that represent the main data set which will be thoroughly analyzed in the
remaining of the paper. A detailed presentation of all 53 identified empirical studies can be found
in Appendix 8.
Page | 17
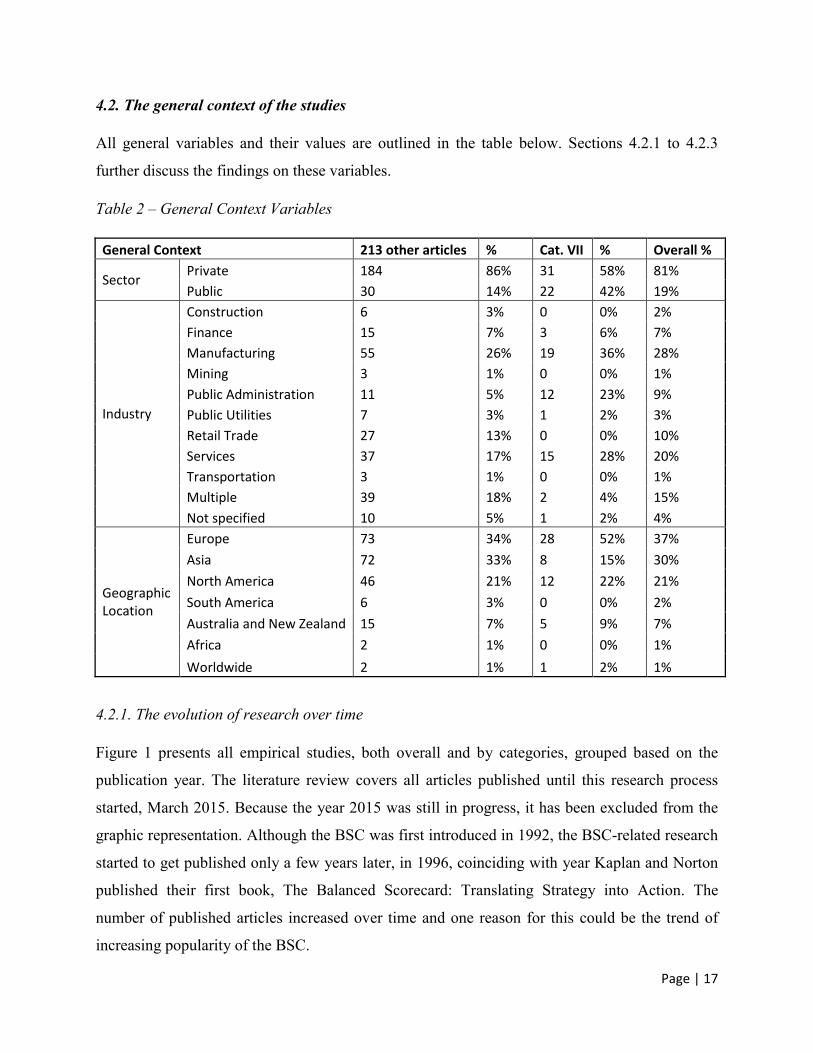
4.2. The general context of the studies
All general variables and their values are outlined in the table below. Sections 4.2.1 to 4.2.3
further discuss the findings on these variables.
Table 2 – General Context Variables
General Context 213 other articles % Cat. VII % Overall %
Sector Private 184 86% 31 58% 81%
Public 30 14% 22 42% 19%
Industry
Construction 6 3% 0 0% 2%
Finance 15 7% 3 6% 7%
Manufacturing 55 26% 19 36% 28%
Mining 3 1% 0 0% 1%
Public Administration 11 5% 12 23% 9%
Public Utilities 7 3% 1 2% 3%
Retail Trade 27 13% 0 0% 10%
Services 37 17% 15 28% 20%
Transportation 3 1% 0 0% 1%
Multiple 39 18% 2 4% 15%
Not specified 10 5% 1 2% 4%
Geographic Location
Europe 73 34% 28 52% 37%
Asia 72 33% 8 15% 30%
North America 46 21% 12 22% 21%
South America 6 3% 0 0% 2%
Australia and New Zealand 15 7% 5 9% 7%
Africa 2 1% 0 0% 1%
Worldwide 2 1% 1 2% 1%
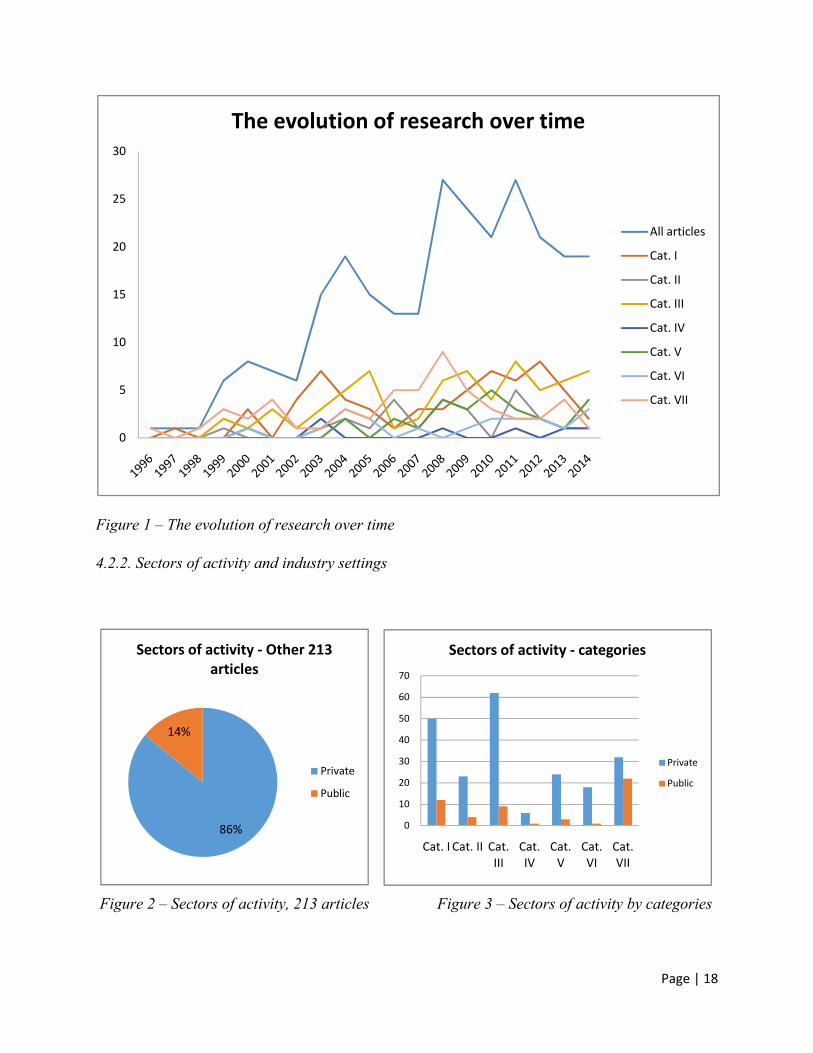
4.2.1. The evolution of research over time
Figure 1 presents all empirical studies, both overall and by categories, grouped based on the
publication year. The literature review covers all articles published until this research process
started, March 2015. Because the year 2015 was still in progress, it has been excluded from the
graphic representation. Although the BSC was first introduced in 1992, the BSC-related research
started to get published only a few years later, in 1996, coinciding with year Kaplan and Norton
published their first book, The Balanced Scorecard: Translating Strategy into Action. The
number of published articles increased over time and one reason for this could be the trend of
increasing popularity of the BSC.
Page | 18
Figure 1 – The evolution of research over time
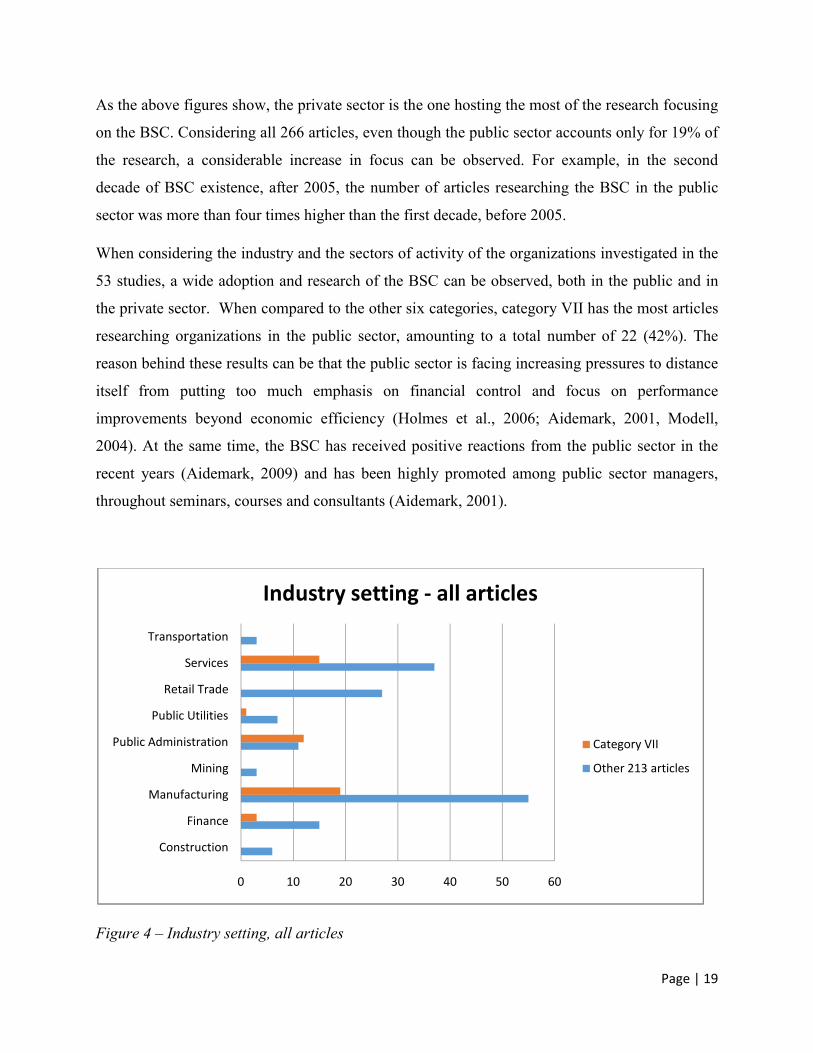
4.2.2. Sectors of activity and industry settings
Figure 2 – Sectors of activity, 213 articles Figure 3 – Sectors of activity by categories
0
5
10
15
20
25
30
The evolution of research over time
All articles
Cat. I
Cat. II
Cat. III
Cat. IV
Cat. V
Cat. VI
Cat. VII
0
10
20
30
40
50
60
70
Cat. I Cat. II Cat. III
Cat. IV
Cat. V
Cat. VI
Cat. VII
Sectors of activity - categories
Private
Public
86%
14%
Sectors of activity - Other 213 articles
Private
Public
Page | 19
As the above figures show, the private sector is the one hosting the most of the research focusing
on the BSC. Considering all 266 articles, even though the public sector accounts only for 19% of
the research, a considerable increase in focus can be observed. For example, in the second
decade of BSC existence, after 2005, the number of articles researching the BSC in the public
sector was more than four times higher than the first decade, before 2005.
When considering the industry and the sectors of activity of the organizations investigated in the
53 studies, a wide adoption and research of the BSC can be observed, both in the public and in
the private sector. When compared to the other six categories, category VII has the most articles
researching organizations in the public sector, amounting to a total number of 22 (42%). The
reason behind these results can be that the public sector is facing increasing pressures to distance
itself from putting too much emphasis on financial control and focus on performance
improvements beyond economic efficiency (Holmes et al., 2006; Aidemark, 2001, Modell,
2004). At the same time, the BSC has received positive reactions from the public sector in the
recent years (Aidemark, 2009) and has been highly promoted among public sector managers,
throughout seminars, courses and consultants (Aidemark, 2001).
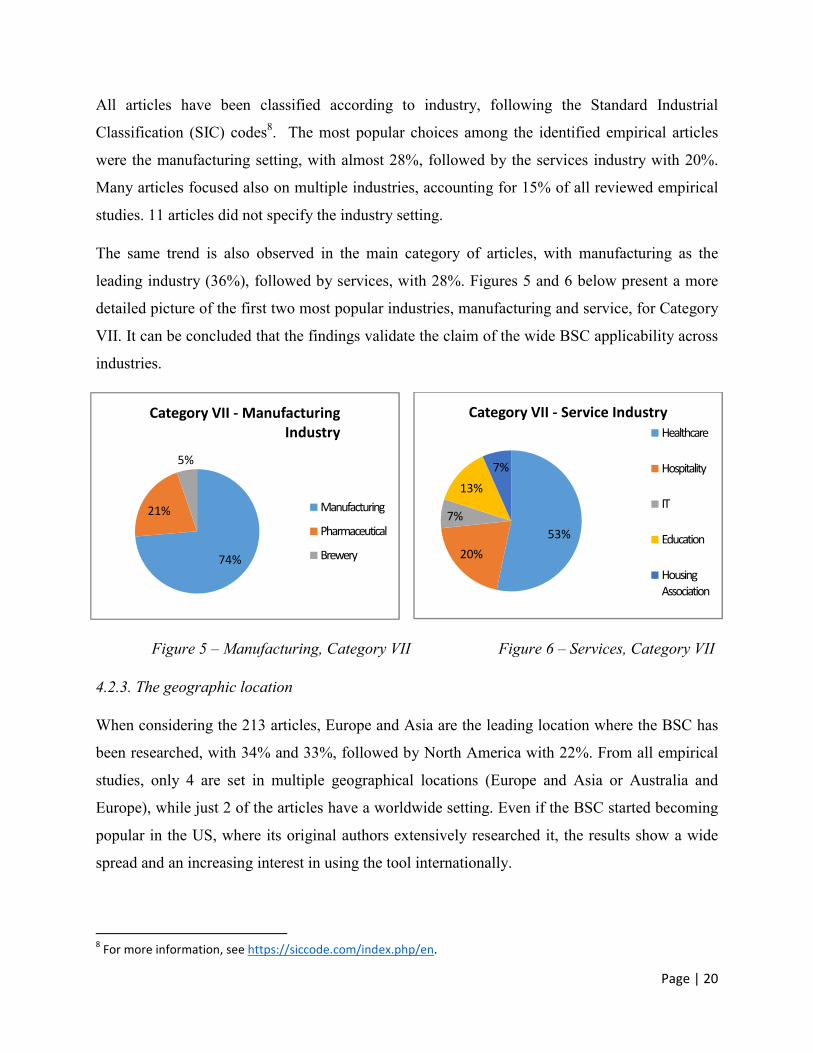
Figure 4 – Industry setting, all articles
0 10 20 30 40 50 60
Construction
Finance
Manufacturing
Mining
Public Administration
Public Utilities
Retail Trade
Services
Transportation
Industry setting - all articles
Category VII
Other 213 articles
Page | 20
All articles have been classified according to industry, following the Standard Industrial
Classification (SIC) codes8. The most popular choices among the identified empirical articles
were the manufacturing setting, with almost 28%, followed by the services industry with 20%.
Many articles focused also on multiple industries, accounting for 15% of all reviewed empirical
studies. 11 articles did not specify the industry setting.
The same trend is also observed in the main category of articles, with manufacturing as the
leading industry (36%), followed by services, with 28%. Figures 5 and 6 below present a more
detailed picture of the first two most popular industries, manufacturing and service, for Category
VII. It can be concluded that the findings validate the claim of the wide BSC applicability across
industries.
Figure 5 – Manufacturing, Category VII Figure 6 – Services, Category VII
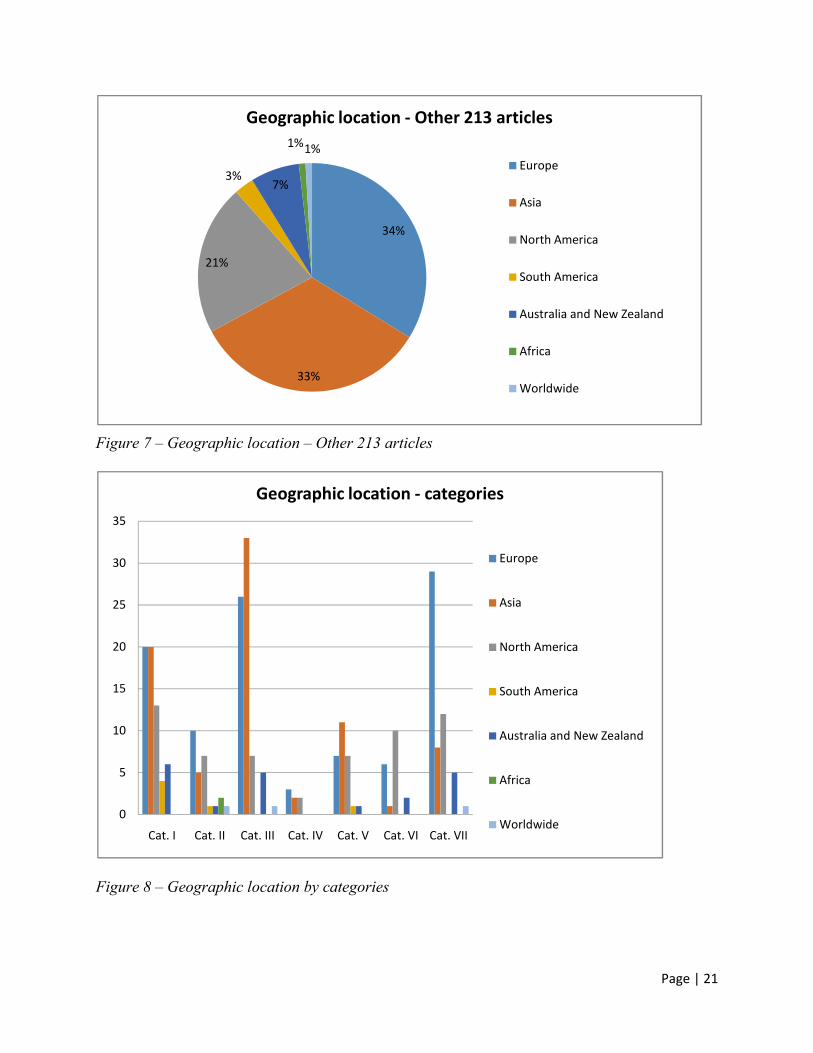
4.2.3. The geographic location
When considering the 213 articles, Europe and Asia are the leading location where the BSC has
been researched, with 34% and 33%, followed by North America with 22%. From all empirical
studies, only 4 are set in multiple geographical locations (Europe and Asia or Australia and
Europe), while just 2 of the articles have a worldwide setting. Even if the BSC started becoming
popular in the US, where its original authors extensively researched it, the results show a wide
spread and an increasing interest in using the tool internationally.
8 For more information, see https://siccode.com/index.php/en.
53%
20%
7%
13%
7%
Category VII - Service IndustryHealthcare
Hospitality
IT
Education
Housing Association
74%
21%
5%
Category VII - Manufacturing Industry
Manufacturing
Pharmaceutical
Brewery
Page | 21
Figure 7 – Geographic location – Other 213 articles
Figure 8 – Geographic location by categories
34%
33%
21%
3%7%
1%1%
Geographic location - Other 213 articles
Europe
Asia
North America
South America
Australia and New Zealand
Africa
Worldwide
0
5
10
15
20
25
30
35
Cat. I Cat. II Cat. III Cat. IV Cat. V Cat. VI Cat. VII
Geographic location - categories
Europe
Asia
North America
South America
Australia and New Zealand
Africa
Worldwide
Page | 22
Regarding the geographic location of the 53 studies in the main data base, Europe is the leading
setting, with 52%, followed by North America with 22% and Asia with 15%. Only one study
(Tapinos et al., 2011) conducts the research worldwide, while Africa and South America are not
considered at all as a research setting, contrary to the BSC usage rate of 39% in Latin America
found by Bain & Co for the year 20149. Except for Cooper and Ezzamel (2013), no other study
considers multiple locations across continents.
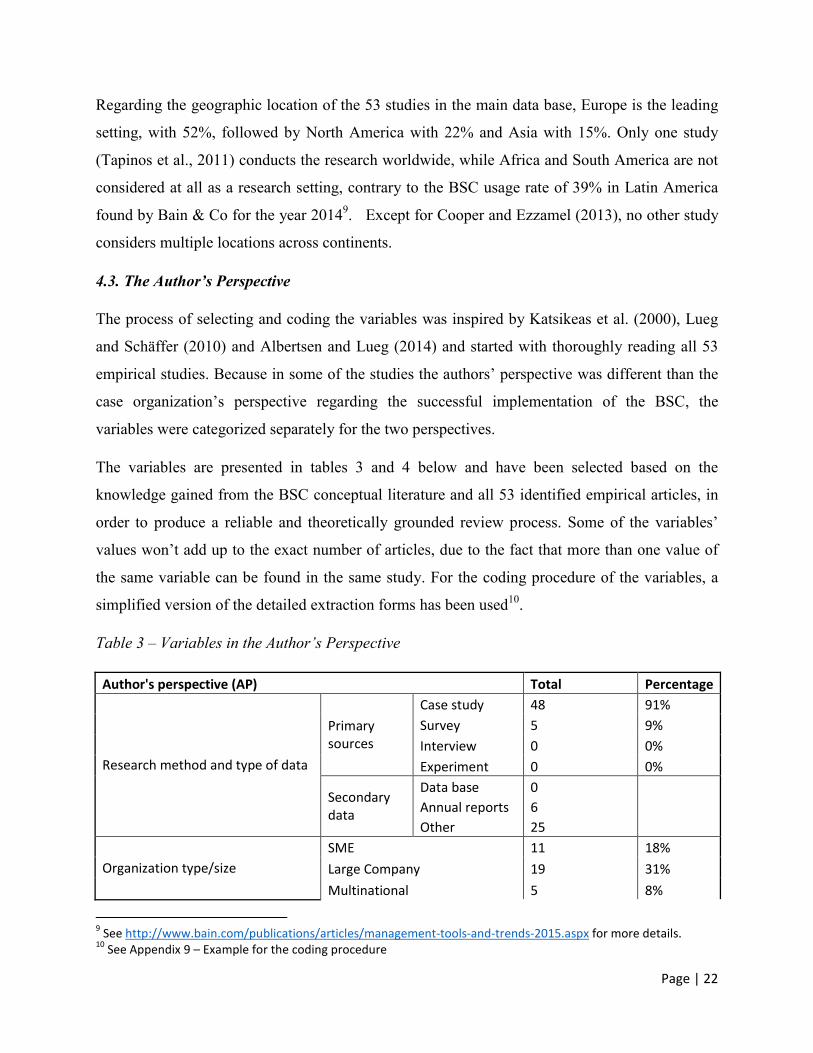
4.3. The Author’s Perspective
The process of selecting and coding the variables was inspired by Katsikeas et al. (2000), Lueg
and Schäffer (2010) and Albertsen and Lueg (2014) and started with thoroughly reading all 53
empirical studies. Because in some of the studies the authors’ perspective was different than the
case organization’s perspective regarding the successful implementation of the BSC, the
variables were categorized separately for the two perspectives.
The variables are presented in tables 3 and 4 below and have been selected based on the
knowledge gained from the BSC conceptual literature and all 53 identified empirical articles, in
order to produce a reliable and theoretically grounded review process. Some of the variables’
values won’t add up to the exact number of articles, due to the fact that more than one value of
the same variable can be found in the same study. For the coding procedure of the variables, a
simplified version of the detailed extraction forms has been used10.
Table 3 – Variables in the Author’s Perspective
Author's perspective (AP) Total Percentage
Research method and type of data
Primary sources
Case study 48 91%
Survey 5 9%
Interview 0 0%
Experiment 0 0%
Secondary data
Data base 0
Annual reports 6
Other 25
Organization type/size
SME 11 18%
Large Company 19 31%
Multinational 5 8%
9 See http://www.bain.com/publications/articles/management-tools-and-trends-2015.aspx for more details.
10 See Appendix 9 – Example for the coding procedure
Page | 23
Hospitals and Schools 12 20%
Local Government 13 21%
Not for Profit 1 2%
BSC implementation status AP
Successful (AP) 50 86%
Partly successful (AP) 4 7%
Unsuccessful (AP) 4 7%
Research topic relevance
Central 28 53%
Coequal 18 34%
Secondary 7 13%
Actors involved in research
Top management (AP) 34 38%
Middle management (AP) 32 36%
Employees (AP) 16 18%
Other (AP) 3 3%
Not mentioned (AP) 4 4%
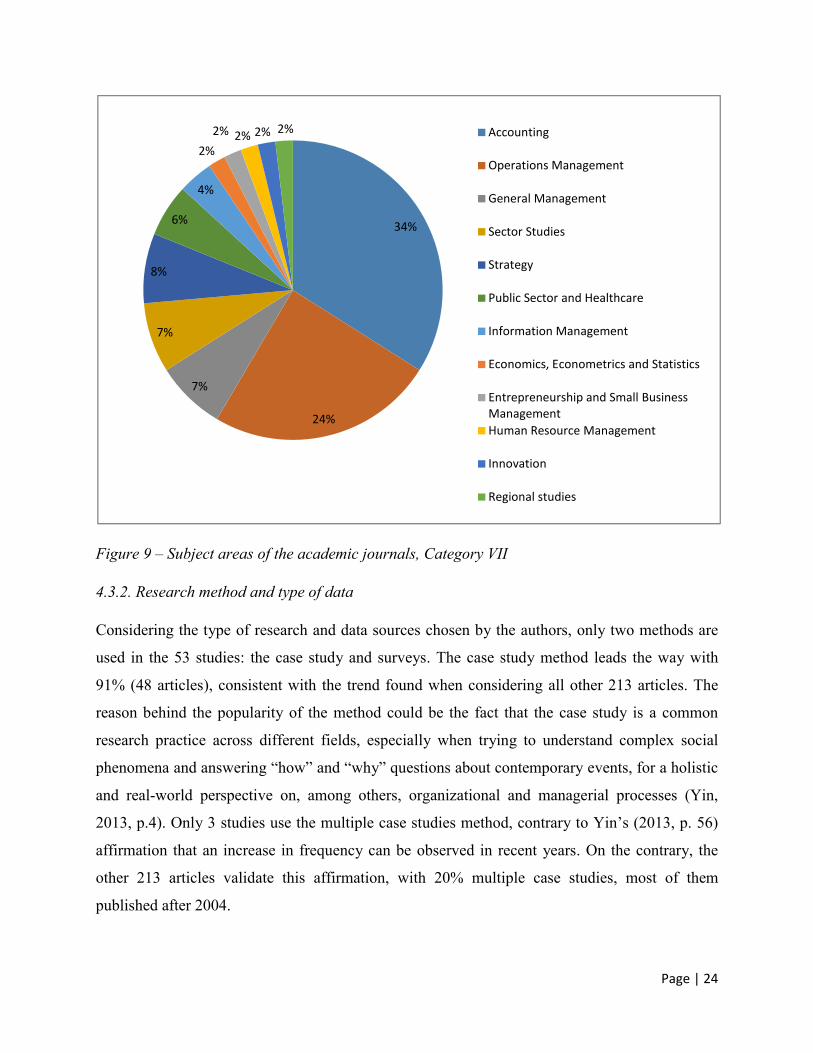
4.3.1. Publication patterns
Figure 9 below provides an overall picture of the publication patterns for the 53 identified
articles, distributed across the subject areas, which have been defined according to the Academic
Journal Guide 201511.
Accounting journals are the preferred ones, in terms of publication setting, with a total of 18
articles (33%). Operations research is also a field that presents interest among researchers, since
it closely follows with a total of 13 articles (24%). The same trend of publication is also revealed
when considering all 266 articles overall. Although with a much smaller frequency distribution,
other non-accounting research fields are present, like general management, strategy or sector
studies.
11
See Appendix 1 – The Academic Journals and Subject Areas.
Page | 24
Figure 9 – Subject areas of the academic journals, Category VII
4.3.2. Research method and type of data
Considering the type of research and data sources chosen by the authors, only two methods are
used in the 53 studies: the case study and surveys. The case study method leads the way with
91% (48 articles), consistent with the trend found when considering all other 213 articles. The
reason behind the popularity of the method could be the fact that the case study is a common
research practice across different fields, especially when trying to understand complex social
phenomena and answering “how” and “why” questions about contemporary events, for a holistic
and real-world perspective on, among others, organizational and managerial processes (Yin,
2013, p.4). Only 3 studies use the multiple case studies method, contrary to Yin’s (2013, p. 56)
affirmation that an increase in frequency can be observed in recent years. On the contrary, the
other 213 articles validate this affirmation, with 20% multiple case studies, most of them
published after 2004.
34%
24%
7%
7%
8%
6%
4%
2%
2% 2% 2% 2% Accounting
Operations Management
General Management
Sector Studies
Strategy
Public Sector and Healthcare
Information Management
Economics, Econometrics and Statistics
Entrepreneurship and Small Business Management
Human Resource Management
Innovation
Regional studies
Page | 25
Only 2 articles use interviews as a research method, in addition to surveys (Wu and Chen, 2011
and Said, 2013), and they belong to the other 213 articles. One reason for this can be that
interviews take a long time and are harder to interpret and analyze (Ghauri and Groenhaug, 2010,
p. 127).
5 studies conducted their research based on surveys. The number of respondents varies from 41
to 593, with an average response rate of 35.2% (de Geuser et al., 2009 – 14.5%; Hoque and
James, 2000 – 35.1%; Tapinos et al., 2011 – 11.5%; Braam and Nijssen, 2004 – 41% and Lin et
al., 2014 – 74.2%). The findings are consistent with Van der Stede et al. (2005), who reported a
48% average response rate of surveys in leading academic journals. All surveys were sent by
regular mail, except for Tapinos et al. (2011) that used online surveys. They obtained the lowest
response rate among the five studies, validating the findings of Crawford et al. (2001) that online
surveys are more exposed to a lower response rate.
As for the data sources, the articles use interviews and observations as primary data sources,
while only 26 articles use secondary data, in the form of either annual reports or other types like
archival data, internal documents, satisfaction surveys and the internet. Many of these articles
follow a longitudinal case study research, where secondary sources present the advantage of
“excellent historical data” (Ghauri and Groenhaug, 2010, p. 94).
4.3.3. Sizes and types of organizations
As for the size and type of the organizations, when it comes to exploring the effects of the BSC
on organizational performance, most of the research is conducted in large companies, with 31%.
This is not a surprise, since research over time proved that larger companies tend to use more
sophisticated management control systems (Libby and Waterhouse, 1996; Chenhall, 2003) and
are more likely to opt for a BSC than smaller companies (Hoque and James, 2000; Speckbacher
et al., 2003). Considerable research is also conducted in local government and hospitals and
schools, with 21% and 20% respectively, for the same reasons mentioned above, when
discussing the public sector preference. Some researchers found some degree of difficulty when
involving SMEs in performance measurement projects (Garengo et al., 2005 and Tenhunen et al.,
2001) and this can justify the relatively low number of articles that research the effects of the
BSC on organizational performance in SMEs. Only one not-for-profit organization is present
Page | 26
among the articles, in spite of Kaplan’s (2001) statement that “the opportunity for the scorecard
to improve the management of nonprofits should be even greater” (p.354).
4.3.4. The BSC’s implementation status
The implementation status of the BSC, in the author’s perspective, shows a high percentage of
successful implementations: 86% of the investigated organizations, while 7% had only a partly
successful implementation. Only 4 companies failed in implementing the BSC, according to the
author’s perspective (Umashev et al. 2008, Decoene and Bruggenman, 2006; Carmona and
Grölund, 2003 and one of the two companies researched by Kasperskaya, 2008). In the study of
Kasperskaya (2008) the BSC was eventually suspended due to lack of human resources, time and
problems with the collection and interpretation of information, while in the other three studies
the researched organizations failed in implementing the BSC due to ineffective strategy
translation because of lacking flexibility when cascading strategic goals, while in the case of
Kasperskaya (2008), the reason was. These findings validate the findings of Kaplan and Norton
(2001a) that bad strategy execution is the main reason of strategy failure. Surprisingly, in all
three studies the organizations perceived the BSC implementation as being partly successful.
4.3.5. The research topic
From the research topic perspective, more than half of the articles revolve their research around
the BSC’s effects on performance as a central topic, 34% consider it a coequal topic and only 7
studies (13%) treat it as a secondary research topic. Cooper and Ezzamel (2013) explores the role
of BSC in globalization discourses as a central topic, Hu and Huang (2006) and Huang and Hu
(2007) research the use of the BSC in aligning IT initiatives, Hansen et al. (2010) reports on the
integration of corporate community, Phillips (2007) investigates the BSC for strategic control
and finally, the researches of Liu et al. (2012) and Abo-Hamad and Arisha (2013) is centered
around a new framework that incorporates the BSC.
4.3.6. Key informants
The last variable in the author’s perspective concerns the actors involved in research. Top
managers are the preferred key informants (38%), closely followed by middle management with
36%. The employees are also considered key informants in 16 studies (18%), together with top
and middle management, supporting Kaplan and Norton’s opinion that even though the strategic
Page | 27
vision starts at the executive level, the strategy formulation should eventually be an emerging
process, with both top-down and bottom-up feedback and analysis (Kaplan and Norton, 2006,
p.192).
4.4. The organization’s perspective
This section will briefly describe the variables in the organization’s perspective (OP) and the
reasons behind selecting them, with the mention that the correlations between the variables and
the effects the BSC has on organizational performance will be covered later on, in the part of the
paper involving the discussion.
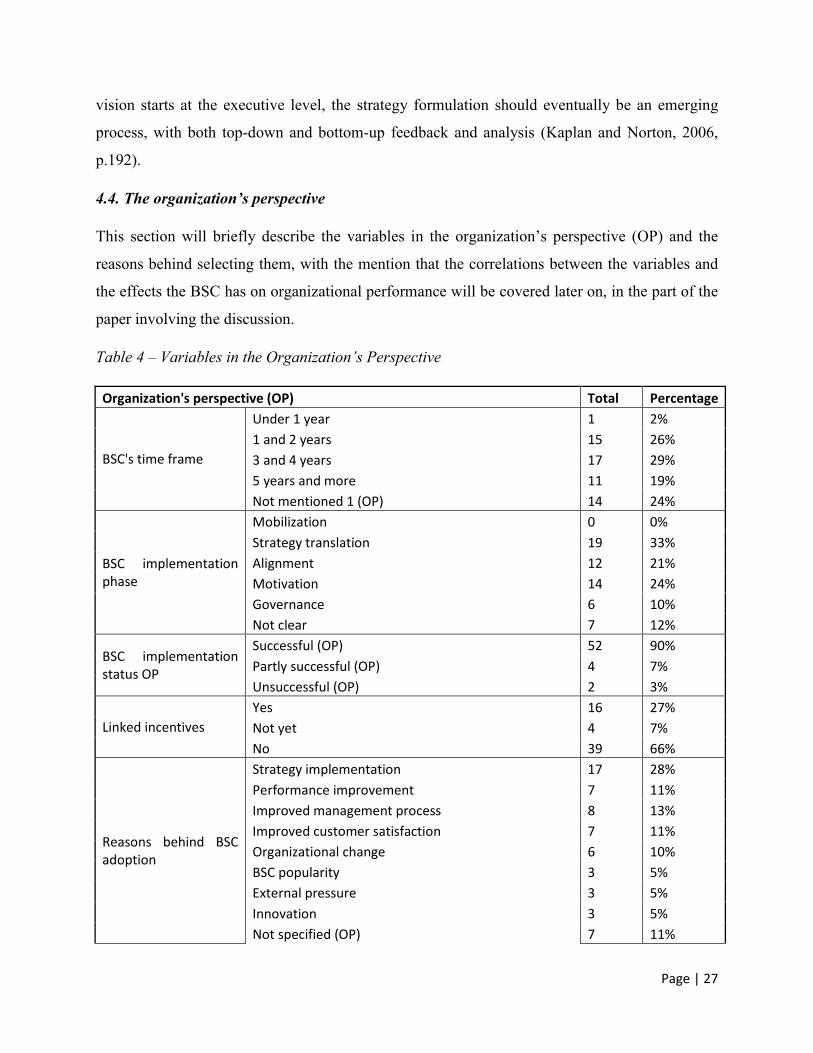
Table 4 – Variables in the Organization’s Perspective
Organization's perspective (OP) Total Percentage
BSC's time frame
Under 1 year 1 2%
1 and 2 years 15 26%
3 and 4 years 17 29%
5 years and more 11 19%
Not mentioned 1 (OP) 14 24%
BSC implementation phase
Mobilization 0 0%
Strategy translation 19 33%
Alignment 12 21%
Motivation 14 24%
Governance 6 10%
Not clear 7 12%
BSC implementation status OP
Successful (OP) 52 90%
Partly successful (OP) 4 7%
Unsuccessful (OP) 2 3%
Linked incentives
Yes 16 27%
Not yet 4 7%
No 39 66%
Reasons behind BSC adoption
Strategy implementation 17 28%
Performance improvement 7 11%
Improved management process 8 13%
Improved customer satisfaction 7 11%
Organizational change 6 10%
BSC popularity 3 5%
External pressure 3 5%
Innovation 3 5%
Not specified (OP) 7 11%
Page | 28
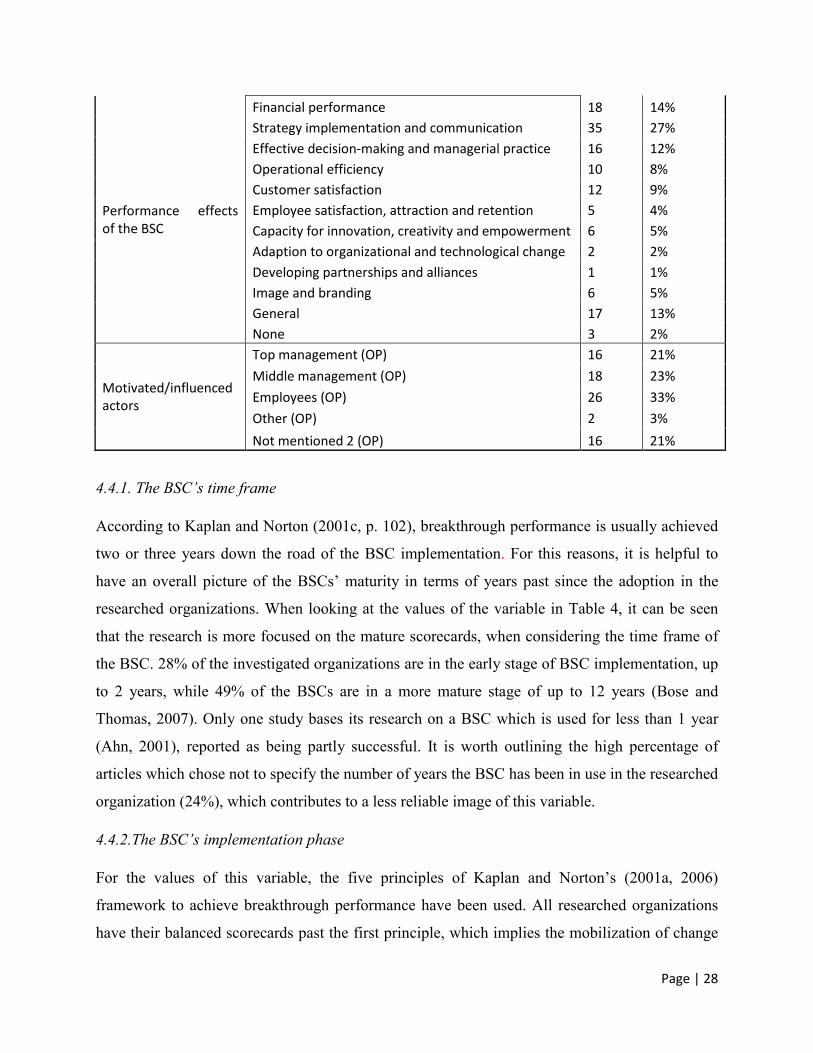
Performance effects of the BSC
Financial performance 18 14%
Strategy implementation and communication 35 27%
Effective decision-making and managerial practice 16 12%
Operational efficiency 10 8%
Customer satisfaction 12 9%
Employee satisfaction, attraction and retention 5 4%
Capacity for innovation, creativity and empowerment 6 5%
Adaption to organizational and technological change 2 2%
Developing partnerships and alliances 1 1%
Image and branding 6 5%
General 17 13%
None 3 2%
Motivated/influenced actors
Top management (OP) 16 21%
Middle management (OP) 18 23%
Employees (OP) 26 33%
Other (OP) 2 3%
Not mentioned 2 (OP) 16 21%
4.4.1. The BSC’s time frame
According to Kaplan and Norton (2001c, p. 102), breakthrough performance is usually achieved
two or three years down the road of the BSC implementation. For this reasons, it is helpful to
have an overall picture of the BSCs’ maturity in terms of years past since the adoption in the
researched organizations. When looking at the values of the variable in Table 4, it can be seen
that the research is more focused on the mature scorecards, when considering the time frame of
the BSC. 28% of the investigated organizations are in the early stage of BSC implementation, up
to 2 years, while 49% of the BSCs are in a more mature stage of up to 12 years (Bose and
Thomas, 2007). Only one study bases its research on a BSC which is used for less than 1 year
(Ahn, 2001), reported as being partly successful. It is worth outlining the high percentage of
articles which chose not to specify the number of years the BSC has been in use in the researched
organization (24%), which contributes to a less reliable image of this variable.
4.4.2.The BSC’s implementation phase
For the values of this variable, the five principles of Kaplan and Norton’s (2001a, 2006)
framework to achieve breakthrough performance have been used. All researched organizations
have their balanced scorecards past the first principle, which implies the mobilization of change
Page | 29
through executive leadership. The majority of the organizations (33%) are in the phase of
implementing the second principle, strategy translation, which implies defining strategy maps,
setting targets and selecting initiatives. Principles 3 and 4 are also consistently represented
among the studies, with 12 organizations in the alignment phase, where business and support
units are aligned with strategy, and 14 organizations in the motivation phase, where target
setting, communication, training and incentives are used to motivate employees in achieving
strategic goals. Only 6 companies reached the last phase, governance, which involves
redesigning the planning, budgeting and control systems in order to integrate strategy (Kaplan
and Norton, 2008). The findings on this matter point out that some organizations have already
started to take steps towards moving forward with the principles, like the study of Aidemark
(2001) where even if the BSC is in the alignment phase, the author informs us about the goal and
target setting (motivation) and about the integration of strategy in the planning and control
system of the organization. Other examples are found in the study of Ahn (2001) and Farneti
(2009) where the organization has its BSC in the strategy translation phase, but has taken also
some initiatives for governance phase, by taking basic steps toward integrating the BSC with the
planning system. The organization researched by Ahn (2001) was also implementing programs
to communicate the strategy to the employees (motivation phase). Kollberg and Elg (2010) is
another example in which a company has taken steps for the next implementation phase, by
integrating the planning system with the BSC.
4.4.3. The BSC’s implementation status
As mentioned before, this variable is present in both the author’s and the organization’s
perspective, because in some studies they differ from one another. The values are the same:
successful, partly successful and unsuccessful. The BSC was seen as successful in its
implementation in 90% of the cases, compared to only 86% in the author’s perspective. Two
organizations deemed the implementation unsuccessful: the one researched by Lorden et al.
(2008) and one company in Kasperskaya’s (2008) study. Lorden et al. (2008) found the BSC to
be partly successful.
4.4.4. Linked incentives
Kaplan and Norton (2007) call for precaution when tying incentives to the BSC, as it carries
considerable risks, especially when the measures are not properly selected. They also consider
Page | 30
the linkage to be powerful and attractive. This variable considers whether the incentives are
linked to the BSC and informs us that the majority of the investigated companies (66%) does not
have this link, although 4 of them (6%) were considering it by the time of research (Sundin et
al., 2010; Huang and Hu, 2007; Rhodes et al., 2008 and Ahn, 2001). Half of the companies with
linked incentives have the BSC in place for more 3 years, following Kaplan and Norton’s
(1996a) advice for patience when making the link, while 7 organizations (30%) decided to tie the
incentives to the BSC, despite the early implementation stage (1 to 2 years). One of these 7
organizations, researched by Decoene and Bruggeman (2006), informs us about the risks
mentioned above and the consequences of tying the incentives too early: de-motivating the
middle managers in achieving strategic goals.
4.4.5. Reasons behind BSC adoption
Strategy implementation is the main reason for implementing the BSC among the researched
organizations, with 28%. This result corresponds with the BSC’s main role as a strategic
management system, to communicate and implement the strategy (Kaplan and Norton, 2001a).
Improvement in the management process is the second most mentioned reason for the
implementation (13%), in line with the findings of Kaplan and Norton (2007, p. 161) that the
BSC is also known as having the advantage of enabling the alignment of the management
process. The next two reasons for implementation follow closely, with 11%: performance
improvement and improved customer satisfaction. Again according to Kaplan and Norton (2007,
p. 161), the BSC is “most effective when it's part of a major change process in an organization”,
which can justify why organizational change (8%) is chosen as another popular reason to
implement the scorecard. Only 3 of the organizations adopted the BSC due to its popularity:
because its endorsement by Harvard Business School (Carmona and Grölund, 2003), after
reading an article (Gumbus and Lussier, 2006) and because it was “in vogue” (Woods and
Grubnic, 2008). External pressures also motivate the BSC adoption, as demonstrated in 3 studies:
Hansen et al., 2010 mentions pressures for community involvement, while legislative
requirements were identified by Rhodes et al.(2008) and Farneti (2009).
4.4.6. The performance effects of the BSC
The values of the variable performance effects of the BSC have been established based on the
BSC conceptual literature and the organizational effectiveness factors identified by Sink (1985).
Page | 31
After the BSC implementation, the majority of the organizations reported performance
improvements in strategy implementation and communication, which includes effective
information sharing, strategic learning and strategic alignment. The management process is
another area that has been improved after the BSC, according to 12% of the case organizations.
Many articles (17) mentioned general improvements and among them, 4 limited their results only
to general statements about performance effects of the BSC, like:
“BSC use […] positively influences overall company performance” (Braam and Nijssen, 2004).
“Use of BSC […] has led to better results” (Cooper and Ezzamel, 2013).
"Organization B achieved 86% of its targeted strategic objectives and 87% of its actions […] a
6% improvement with respect to 2003" (Kasperskaya, 2008).
"BSC usage is positively and significantly correlated with organizational performance" (Hoque
and James, 2000).
One reason for the general statements mentioned above can be that, except for Braam and
Nijssen (2004), all studies had the topic of BSC’s effects on performance as a secondary or
coequal one.
Kaplan and Norton (1996a) suggest that all improvements in the non-financial areas after the
BSC implementation should be eventually linked to economic performance; based on their
findings, it usually takes two, three years for the breakthrough performance to be achieved
(Kaplan and Norton, 2001c). This corresponds to the findings of 18 studies, which reported
improvements in the financial performance measures after the BSC adoption. The majority of the
organizations in these 18 studies had a BSC in place for more than 3 years.
The 3 studies that didn’t report any performance effects of the BSC are the ones researching the
unsuccessful BSCs, from the author’s perspective.
4.4.7. Motivated/ influenced actors
The last variable is considered relevant in identifying the BSC’s propagators and key change
agents, as well as all other influenced stakeholders – either in a positive or a negative way. The
values in Table 4 show a mostly even distribution across employees, top and middle
management when it comes to the impact of BSC implementation, confirming that a BSC
Page | 32
implementation requires more than just leadership commitment. The entire organization should
be focused and everyone should have an active contribution in strategy implementation (Kaplan
and Norton, 1996c, 2001b).
The findings regarding this variable provide evidence of the fact that BSC propagators and
change agents can be found at all levels in the organization. Modell (2009) found that employees
saw the BSC as a “fresh start” and middle management as a “born again experience”, while the
BSC in the case organization of Huang and Hu (2007) made the employees proud of contributing
to strategic goals. High commitment among both employees and management was also reported
in the studies of Kollberg and Elg (2010), Hu and Huang (2006), Rhodes et al. (2008) and
O’Connor and Feng (2005).
Even though in the majority of the organizations with a successful BSC implementation the
actors were positively influenced, some of the studies provide also evidence of resistance among
management and employees. In a Swedish hospital, Aidemark (2001) found that even if the BSC
was “extremely attractive” for the head of the clinic, not all doctors were as enthusiastic. This
changed over time, as proved by a later study (Aidemark, 2006). On the same note, Kasperskaya
(2008) reported some resistance among department managers and a decline in the top
management’s enthusiasm due to “technical difficulties” with the BSC, while inconsistency in
staff support across the organization was found by Woods and Grubnic (2008). The BSC
implementation in the case organization researched by Papalexandris et al. (2004) improved
employee morale while in the same time led to conflicts between divisional managers, while in
the case of Fernandes et al. (2006), although 90% of employees were convinced of the BSC’s
benefits, “the rest were skeptical or negative”.
In one the two studies with an unsuccessful BSC from the organization’s perspective (Lorden et
al., 2008), the implementation of the scorecard was only actively supported by 2 of the 5 vice
presidents, while in the other one (Kasperskaya, 2008) the enthusiasm of the management team
decreased when encountering technical problems, making them not act upon the collected
information through the BSC. These aspects coincide with Kaplan and Norton’s (2001a, p. 361)
findings that lack of senior management commitment is a common cause in BSC failure. As for
the unsuccessful balanced scorecards from the author’s perspective, one case study (Decoene and
Bruggeman, 2006) reports negative impact of the BSC on the intrinsic motivation of middle
Page | 33
managers, while the BSC in the case of Carmona and Grölund (2003), besides of being non
relevant and time consuming at the local police level, a positive attitude is also found among the
central officers when considering the usefulness of the tool.
5. Discussion
Based on the knowledge gained from analyzing all 53 identified studies researching the impacts
of the BSC on organizational performance, the first part of this section will seek to offer some
insights into positively associating the BSC implementation with improved performance beyond
just the economic dimension. The discussion will also focus on the way performance is assessed
and reported and how the actors are motivated by the BSC, identifying in the same time some of
the best-practice representative studies. The reasons for excluding some of the articles from the
representative group will also be tackled, ending with some recommendations future research
based on the main findings of this paper.
5.1. Findings regarding the impact of the BSC on organizational performance
5.1.1. Non-representative studies
The effects the BSC has on organizational performance in all 53 identified studies have different
degrees of explicitness and relevancy and are different in regards to the way they are assessed
and reported. This last part of the paper will mainly focus on discussing the representative
studies and, in order to identify them, I started with excluding the ones that do not contribute to
the best-practice body of research. The exclusion is based on the knowledge gained from each
article, focusing especially on the methodology of the study, its limitations and details of the
BSC implementation, from both author’s and organization’s perspective.
All studies which reported an unsuccessful implementation of the BSC were excluded, since they
didn’t provide any evidence of performance improvement.
Articles which based their research on surveys (Lin et al., 2014; Braam and Nijssen, 2004;
Tapinos et al., 2011; Hoque and James, 2000 and De Geuser et al., 2009) were also excluded,
since they didn’t capture the implementation, use and development stages of the BSC. All studies
Page | 34
suggested a positive correlation between the use of the BSC and improved organizational
performance.
The overly long development process of the BSC is identified as a common reason for the BSC
failure (Kaplan and Norton, 2001a, p. 361), therefore another exclusion criterion considers the
correlations between the BSC’s maturity and its implementation phase. The organization in
Cooper and Ezzamel’s (2013) study has its BSC in the alignment phase, despite using it for 10
years. The authors rendered the BSC partly successful. The same situation is present also in the
study of Aidemark (2009), where “The BSC remained as a tool on the ward level for a decade"
(p. 264). Even if some general performance improvements in the case companies are reported,
the one successful scorecard investigated in Kasperskaya’s (2008) article is still in the translation
phase after 4 years of implementation. The same author reports that the organization is not
mature enough for strategy maps and causal linkages. Grando and Belvedere (2008) claim the
BSC to be useful in supporting decision-making and information sharing, while their
investigated company, despite using the BSC for 4 years, didn’t complete the alignment phase in
the department where it was introduced. In the same time, the organization decided not to extend
the scorecard to the other departments yet.
Studies like Joseph (2009) and Davis (1996), presenting success stories without giving any
details on the theory used, methodology and data collection, have been also included in the “non
representative” category. Huckestein et al. (1999), Ashton (1998), Irwin (2002) and Denton and
White (2000) are other examples of such studies. Lack of consistent evidence and clarity in data
collection is also observed in the study of Bose and Thomas (2007) and Fottler et al. (2006),
where evidence of performance effects due to BSC implementation is hard to trace, being only
presented as quotes from annual reports in the first study, while the second one only speculates
the outcomes: “"Results to date indicate that the HR Balanced Scorecard […] will result in
improved performance in a number of HR indices (i.e., staff retention) and customer service (i.e.,
patient satisfaction) indices (p. 72)". The study of Mooraj and Oyon (1999) is the last one
excluded here, since it only gives general observations about the BSC in Tetra Pak and gives no
details about data collection.
A final criterion concerns again the maturity of the BSC, only this time only organizations with a
BSC in a very early stage of implementation are considered, since more time can be required to
Page | 35
validate the BSC’s effectiveness. Three of the cases are found in the public sector; the
implementation of the BSC in the study of Kampschroer and Heerwagen (2005) led to improved
customer satisfaction and effective communication and information sharing but it was positioned
in its early stages of development due to its complexity, despite being adopted for 2 years.
Bianchi and Montemaggiore (2008) and Cugini et al. (2011) are two other studies in the public
sector, which investigated a BSC implemented for 1 year in Italy, in a local government agency
and a university department. The BSC implementation impacted the performance by improving
communication and enhancing management learning in the first case, and by clarifying the
strategy and improving the resource allocation in the second one. Finally, the article of Chesley
and Wenger (1999) was also excluded due to insufficient time to validate the effectiveness of the
BSC. Here, even though the BSC implementation improved employee and customer satisfaction
and improved the strategic management process, it was still reported as “partly successful” by
the authors, because "at the time this study ended, the executives were struggling with
fundamental questions [on strategy development]" (p.57).
As for the private sector, the article of Ahn (2001) has been excluded due to focusing on a pilot
project of BSC introduction (only 4 months of use). O’Connor and Feng (2005) didn’t fully
validate the effectiveness of the implemented BSC, claiming that “more time is required to
determine the effectiveness of the scorecard" (p. 29), in spite of the 3 years of BSC use in the
case organization and performance improvements in the form of a more effective management of
intangible assets, better value for customers and higher profits. The study of Hansen et al.(2010)
is also excluded, based on the statement of the authors: “Considering that the case study covers
the time briefly after implementation, a judgment on its ultimate success requires further
longitudinal research" (p.397). It is worth mentioning that the BSC was effective in developing
strategic alliance and was also "considered a significant step towards responsible leadership
systems" (p.397). Malina and Selto (2001) are exploring a BSC implemented for 1.5 years,
which facilitated strategy implementation and communication, a more effective management
process and a “modest but observable” financial performance. It is still considered too early to
validate the true effects on performance, since the authors reported some of the measures to be
inaccurate and imposed down to the distributors without using strategy maps. The same authors
inform us about the company changing its BSC in regards to selecting and identifying the
measures, right after the data collection.
Page | 36
Besides the criteria mentioned above, some of the articles have been excluded based on different
information and limitations mentioned by the authors. For example, Liu et al. (2012) and Abo-
Hamad and Arisha (2013) do not explore the effects of the BSC on organizational performance
as a central or coequal topic, but are focusing instead on the benefits of integrating the BSC with
soft system methodology and simulation respectively. Huang and Hu (2007) also treat the
performance impacts of the BSC as a secondary topic, mainly focusing their research on the
integration of IT with the BSC. Wisniewski and Dickson (2001), Farneti (2009) and Dreveton
(2013) are focusing only on the early development process of BSC and its impact on the
organization, while Davis and Albright (2004) captured only the financial dimension of
performance. Papalexandris et al., (2004) focused more on the 3 months development process of
the BSC, reporting the performance improvements only by comparing targets with actual results
after 1 year of BSC use. Lastly, Woods and Grubning (2008) explored a local government
agency in UK which found the BSC useful in making them “appear innovative”. Even if the
authors found the BSC implementation successful, reporting continuous performance
improvement in general and in strategy implementation, they also reported cultural issues in
cascading the BSC and mixed results, sustaining that translating the strategy "may not be enough
in itself to guarantee performance improvement", making the article suitable for exclusion.
5.1.2. Representative studies
A total number of 12 articles have been identified as best-practice representative studies. This
section will include the outlining of the main characteristics of each study, followed by a
comparison which will highlight their similarities and differences.
The first representative article belongs to Modell (2009) and explores the case of Swedish
National Board of Student Aid and their experience with the BSC implementation, which
succeeded after a second trial and a change in leadership. Data is collected between 2004 and
2007, through semi structured interviews, group discussions and secondary data like archival
data and internal documents. The first attempt to adopt the BSC failed due to “little effort […] on
analyzing or mapping causal relationships between various focus areas” (p. 76). The new
strategic management system was seen both as a balanced scorecard and as “something in
between TQM and the balanced scorecard” (p.79) by the new general manager, who was
perceived as an example of great leadership. The BSC adoption was seen as a “fresh start” and a
Page | 37
“born again experience” by employees and middle management, improving performance in
customer satisfaction and strategy implementation and communication.
Jazayeri and Scapens (2008) is the second study, investigating the multinational British company
BAE Systems, with an 8 month data collection process based on open-ended interviews with
senior and divisional managers in the Customer Solutions and Support division and secondary
data like internal documents, archival data and a book published about the company. The
organization has a mature BSC in place (8 years since the implementation and in the last stage of
implementation, governance, with linked incentives) and was implemented due to a need of a
change in the company’s culture. The performance effects associated with the use of the BSC are
in the form of improvements in financial performance like a higher stock price, better sales and
profits, as well as a better strategy formulation and improved management ability. The author
argues the difficulty of isolating the BSC’s effect on performance, an opinion shared also at the
management level of the organization: “I find it difficult to actually say there’s particular benefit
from only the business value scorecard” (p. 67), especially due to the time lag in the cause and
effect relationships of the BSC, as one manager puts it: “You would probably see the impact
over a longer time period. I think poor performance you tend to notice quicker than you notice
good performance” (p. 65). According to the authors, the BSC used in this case differs from the
original approach of Kaplan and Norton by using coherence instead of cause and effect
relationships.
The study of Sundin et al. (2010) has also been selected as a representative one. It explores the
impacts of the BSC on performance in a large Australian electricity company, where data was
collected in a two and a half years period, in the form of direct observations at all levels and
involving more than 100 employees, semi-structured interviews at top management level and
archival data. The BSC had been in place for 3 years, in the implementation phase of principle 5
(govern to make strategy a continual process), even though the incentives were not yet linked:
“The management of Energyco has considered formally linking remuneration to BSC
performance indicators – although there are significant concerns about the effects of this” (p.
230). The performance effects of the BSC implementation were reported in the form of effective
information sharing and strategy implementation and a more balanced and systematic decision-
making process. The scorecard mobilized everyone in the company, making people “passionate
Page | 38
about their own patch and […] go to extraordinary lengths to make sure the customer is happy"
(p. 230).
Rhodes et al. (2008) researched the central bank of Indonesia, which had a BSC in place for 3
years and in the alignment phase of implementation. The reason for adopting the BSC was
external pressure in the form of legislative requirements. The incentives are not linked, as the
company "has yet to design a reward system around the BSC" (p. 1182). Performance
improvements are reported in the managerial process, by increasing the support in leadership and
transparency, as well as in strategy implementation, by realigning the thinking and initiatives
with strategic directions. The image of the company was improved in the eyes of external
stakeholders after the BSC implementation and enhanced financial performance is achieved
through a better cost management. All these evidence of performance impacts is gathered
through staff and external stakeholder surveys and public statements. The top management is
significantly committed to the BSC.
The study of Greatbanks and Tapp (2007) explores the BSC implementation in a New Zealand
city council call center department. The research adopted a longitudinal case study method,
based on semi-structured interviews with staff and managers and internal documents. The
company was in the phase of implementing the fourth principle, motivate to make strategy
everyone’s job, with a BSC in place for 4 years and linked incentives. The BSC led to
performance improvement immediately after its implementation, in the form of increased call
center performance and decreased waiting time and abandoned calls. The managers claimed the
BSC led to high, sustainable performance, although, when challenged, they also argued that
“performance was always ‘pretty good’” (p. 864). Management has also recognized the BSC’s
contribution to some awards winnings in the department, which led to an improved performance
in image and branding. Concerning the effects the BSC has on its actors, the authors provide the
opinion of one manager: “most staff seemed to accept the scorecards. There were a few that had
an issue. It wasn’t the structure of the scorecards; more the change in culture to a top-down
approach where they could be measured on particular aspects of their performance, but most
were happy to see where this idea would lead” (p.856).
Page | 39
Gumbus and Lussier (2006) research the benefits of using the BSC in three SMEs in the US,
through interviews at the executive level. All three companies have incentives linked to their
BSCs.
The first SME has implemented the BSC for a shift in strategy, due to a new product design and
has been using it for 2 years. According to the CEO, the BSC adoption significantly improved
the profits of the company and enabled strategic focus “on how to run the business in a period of
tumultuous change” (p.411).
The second SME reported improvement in strategic focus, as well as in attracting and retaining
skilled employees. Tying the incentives to the BSC led to an improvement in operational
efficiency (20% increases in productivity).
The third company implemented the BSC for 7 years, after the general manager read an article
on it. According to him, “the Balanced Scorecard has been the key to our organization’s success
[and] it provides a perfect framework for achieving positive business results” (p.419). These
results are reported in the form of improved financial performance (the company becoming the
lowest cost supplier in industry), improved operational efficiency (better production levels and
productive maintenance), as well as improved customer satisfaction.
The study of Chang et al. (2008) explores the BSC adoption in a large Taiwanese hospital. After
4 years of implementation, the BSC improved patient satisfaction, resource allocation and
decision making, as well as improved operational efficiency and improvements in image and
branding (more research paper and higher citation index). Regarding the way the BSC influenced
its actors, the study is only focused on the management level, offering no information about the
other actors. Even if the authors provide details about the hospital focusing on the 5th principle of
implementation (governance), the motivation phase is not dealt with at all.
Manville (2013) used the longitudinal case study method to research the BSC implementation in
a charity housing association in UK. Semi-structured interviews with top and middle
management, direct observation, annual reports and company documents were the methods of
data collection, which lasted from 2006-2010. The BSC implementation led to a better decision-
making process and increased savings, as well as an improvement in image and branding through
several award winnings. After 6 years of use, the BSC is in the motivating phase of
Page | 40
implementation, with linked incentives, both in the form of financial and non-financial
recognition. As for the influence of BSC on its actors, the author informs us that “during the
interviews there were skeptical views about the scorecard, but overall the consensus was
cautiously optimistic” (p. 1003). One operation manager, who eventually left the company,
stated that “I had doubts about the long-term value of the balanced scorecard and nobody has
addressed that with me”, while another had an opposite view: “I was scared about what I didn’t
understand but I thought it was a good idea” (p. 1003). The author concludes by stating that “the
relationship between the implementation of the scorecard and the improved performance may be
coincidental” (p. 1005).
Phillips (2007) adopts a 3 years longitudinal approach with semi-structured interviews conducted
at the management level, archival and company data to research the BSC adoption in a large
hotel company in UK. The company has been using the BSC for 9 years, being in the last phase
of implementation, with linked incentives. The implementation of the BSC acted as a “change
management tool, which had some success” (p. 743), while in the same time enabled strategic
thinking and emerging strategies. Performance improvements were also reported in customer
satisfaction, by improving service quality, and financial performance through a higher spend per
customer. Regarding the influenced actors, the BSC moved “strategy out of the boardroom into
the ‘hearts and minds’ of all staff, [making] strategy a living, dynamic process that all staff
sought to implement” (p. 742). The return on capital employed in the case organization was
below group average, which motivated the author to conclude that “the sole use of the balanced
scorecard does not automatically lead to organizational success” (p. 743).
The research of Kollberg and Elg (2010) uses interviews, annual reports and company
documents to assess the use of the BSC in three healthcare organizations in Sweden. The
incentives are not tied to the BSC. The first company has its BSC in the motivating phase, and its
implementation led to a better and more structured management process. The second
organization has been using the BSC for 6 years, also in the motivation phase of implementation,
and reported improvements in personal development and communication between units. The
third company reported, after 4 years of BSC implementation, an improvement in employees
participation in achieving strategic goals and a better management process. All three companies
reported a better communication and information sharing between management and employees.
Page | 41
As for the influenced actors, a genuine interest on the BSC is seen among managers, who are
seen as important change agents, and a high involvement among employees. The authors
concluded by stating that the BSC is “a tool for improvements and knowledge creation on an
operational level” (p. 441).
Fernandes et al. (2006) researched the implementation of the BSC in a manufacturing SME in
UK. The researchers acted as facilitators in the implementation process, collecting data in the
form of interviews, employee surveys and reports on company performance. After the
implementation, the authors reported the BSC “enhanced the stability and operability of the
company [which] have dramatically increased the company’s income” (p. 632). Other suggested
benefits were a 12-18% decrease in inventory levels, lower stock turnover, as well as higher
information flow in the supply chain, improved communication and cooperation between
departments. The leadership strongly supported the BSC implementation, while when “realizing
the benefits of BSC all departments cooperated with each other and were soon on-board” (p.
633). At the beginning, some of the managers and employees were skeptical in regards to the
benefits of the implementation.
The last to be included in the representative category of the identified studies, Garengo and
Biazzo (2012) developed a 2 years research project on a steadily and fast growing manufacturing
SME in Italy, where they acted as facilitators. Data was gathered mainly from interviews with
top and middle management, internal documents and the company’s information system. The
positive impact of the BSC implementation was reported in the form of a more effective
decision-making and an improvement in image and branding by receiving EFQM “Committed to
Excellence” recognition. Leadership was committed to the BSC and the employees were also
involved in its development.
5.1.3. Comparison of the representative studies
Appendix 10 presents an overview of the 12 selected representative studies.
The representative studies are found both in the private sector (large companies and SMEs) and
the public sector (local government, healthcare and not for profit), most of them being published
in journals belonging to the accounting and operations field. Data is collected using both primary
and secondary sources in the majority of cases, except three studies (Gumbus and Lussier, 2007;
Page | 42
Chang et al., 2008 and Fernandes et al., 2006), showing that even if the researchers rely heavily
on information reported by top and middle management, triangulation is also used to check the
results and make the information reliable. Regarding the role of the researcher, most of the
authors are visitors, not being directly involved in the researched issues (Ryan et al., 2002, p.
152). Only the authors of two studies (Manville and Broad, 2013 and Garengo and Biazzo, 2012)
act as facilitators of the BSC implementation in the case companies, while studies like
Greatbanks and Tapp (2007), Chang et al. (2008) and Fernandes et al. (2006) research the effects
of the BSC on organizational performance as scholar – practitioner teams. Most of the
organizations have their BSCs in a mature stage, except the case companies of Garengo and
Biazzo (2012) and Gumbus and Lussier (2007). Even though these two organizations have been
using the BSC for only 2 years, they reported effects on performance improvement. These
improvements can be regarded as sustainable, since the two companies are SMEs and according
to Andersen et al. (2001, p.4), “the key difference [between large companies and SMEs] is the
duration of the process [of BSC implementation] - it is quicker in small organizations as there are
fewer people and generally less complex organizational structures”
Regarding the implementation phase, the maturity of the BSC and the leadership commitment in
the case organizations, findings are mostly in line with Kaplan and Norton’s (2008) view that “a
strong leader using the tools of Principle 1, 2 and 3 could mobilize, focus and align the
organization to achieve excellent performance”. Even if only one study specifically outlines the
outstanding quality of the general manager (Modell, 2009), the vast majority of the studies report
significant management commitment and employees involvement in the implementation of the
BSC.
As for the incentives, more than half of the organizations decided to link them to the BSC, while
two studies (Sundin et al., 2010 and Rhodes et al., 2008) inform us that the case companies are
considering the link.
Only three organizations (Garengo and Biazzo, 2012; Kollberg and Elg, 2010 and Chang et al.,
2008) are found to have a BSC design similar to the classic four-perspectives one described by
Kaplan and Norton, while the majority adopted different kinds of perspectives and hierarchies,
validating the findings of Bedford et al (2008) that including other perspectives than the
traditional ones is a quite common practice. As for the cause-and-effect relationships, a
Page | 43
surprisingly high number of articles do not mention them at all (Rhodes et al., 2008; Greatbanks
and Tapp, 2007; Gumbus and Lussier, 2007; Manville and Broad, 2013 and Kollberg and Elg,
2010). Jazayeri and Scapens (2008) claim to use coherence and finality instead of cause-and-
effect relationships (Nørreklit and Mitchell, 2007), while Fernandes et al. (2006) applies an
“organic approach to strategy clarification” (p. 628). All the other studies are only assuming the
cause-and-effect relationships.
According to Kaplan and Norton (1996), the BSC’s final goal should be improved financial
performance, and a failure in translating the operational performance to economic benefits
should make the organization redesign the strategy. The findings of this research are
corresponding to Kaplan and Norton’s opinion, as the vast majority of the case companies report
also improvements in financial performance after implementing the BSC. Exceptions are found
both in the public sector, where organizations are not focused on financial pay-offs but on
achieving their mission, and in the private sector: Garengo and Biazzo (2012) do not suggest any
explicit financial improvements, except stating that “Over the last 10 years, [the company] has
grown steadily and fast” (p. 86), while Sundin et al. (2010) does not mention at all the financial
perspective. Looking at all other effects, one can see that the BSC implementation impacts a
wide range of non-financial performance dimensions: from the most common one, strategy
implementation, to customer and employee satisfaction, decision-making, operational efficiency
and image and branding. Although most of the studies support the positive impact the BSC
adoption has on performance, there are also some skeptical views among them:
"the relationship between the implementation of the scorecard and the improved performance
may be coincidental" (Manville and Broad, 2013, p. 1005)
“performance was always ‘pretty good’” (Greatbanks and Tapp, 2007, p. 864).
"it is difficult to isolate and attribute the promising results to the introduction of the Balanced
Scorecard" (Rhodes et al., 2008, p.1180).
5.2. Recommendations for future research
Using the information gathered so far, some suggestions for future research can be outlined.
Some of the studies have been excluded from the representative ones due to poor methodology
or lack of details regarding the theory used. Therefore, an advice for future research could be to
Page | 44
make the research more meaningful to others, by making the theory explicit and using a more
rigorous methodological approach. One should find in a study “an ongoing relationship between
theory and observation” (Ryan et al., 2002, p. 150).
Even if the majority of the representative studies used both primary and secondary sources, when
considering all 53 articles that research the performance impacts of the BSC, only half of them
used additional secondary sources. A second advice would therefore be to focus also on
secondary sources in order to probe and make the information more reliable, especially since
most of the studies rely heavily on information provided by managers in their interviews,
exposing the research to a higher subjectivity bias.
One of the exclusion criteria from the representative studies was concerning the assessment of
the BSC use in a relative short time after its implementation. In order to prove the efficiency of
the BSC and to make sure the system does not fail, the organization must take the time to “use
and act upon the information produced” in the implementation phase (Kaplan, 1998, p, 112). To
achieve this, the researchers could use the longitudinal case study approach.
The maturity of the BSC is found to be an important factor in achieving breakthrough
performance (Kaplan and Norton, 2001a, 2008; Evans, 2004). Unfortunately, 24% of the 53
identified studies do not give any details about the time frame of the BSC and in 15% of the
cases the implementation phase is not clear. Future researchers could focus more on this matter.
Only two of the authors acted as facilitators, while in three other cases the research was
conducted by academic-practitioner teams. Future research could make more use of this
participatory research or innovation action research, as Kaplan calls it in one of his articles
(Kaplan, 1998), since it sustains the “feedback loop from theory to practice and back to theory”
(Kaplan, 1998, p. 103). Even though the method raises some tensions, the scholar-practitioner
teams can be a solution to address some of them (Kaplan, 1998, p. 115).
The last suggestion concerns the cause-and-effect relationships. Even if they have been widely
disputed in the literature (Nørreklit, 2000, 2003; Nørreklit and Mitchell, 2007; Malina et al.
2007), the researchers in the representative studies chose either not to mention them at all, or to
just assume their emergence in regards to performance improvements. More empirical validation
Page | 45
of the cause-and-effect relationships in the performance management context could be called for
as a future research area.
6. Limitations and Conclusions
6.1. Limitations
All the articles in this systematic literature review of empirical studies were selected based on
specific quality ratings of journals, which is contrary to Denyer and Tranfield’s (2009, p.680)
advice to “guard against using […] the quality rating of journals as a basis for exclusion”. They
also suggest including also unpublished studies, not only the published ones, this being
considered outside the scope of this research. Some of the exclusion criteria, like the language
restriction or the search strings, might have led to overlooking some relevant work.
The risk of excluding relevant work exists also due the long process of publication in academic
journals. As Davis (2014) points out: “optimistically, papers are likely to take up to a year from
submission to appearing in print” and “the format of traditional journals seems out of sync with
the rhythms of knowledge production” (p. 194).
One final limitation should consider the fact that the examination of the empirical studies was
subjectively done, based on the author’s own judgment. Therefore, the interpretation may differ
from the original author of the study. The process of synthesis and coding may have led to a
number of important factors and findings being excluded from the original studies.
This paper has only one researcher, which leads to a higher degree of subjectivity in the
inclusion/ exclusion decisions for the identified studies (Tranfield et al., 2003, p. 215), as well as
in selecting the variables for the evaluation and coding process (Katsikeas et al., 2000, p. 495).
6.2. Conclusion
This paper uses a systematic review of empirical literature to address the research question:
Does the BSC implementation positively impact the organizational performance within the
empirical BSC literature? 53 studies have been identified to research the implementation of the
BSC and its effects on performance, from which only 12 have been highlighted, based on
different criteria, as being representative for best-practice. The overall findings are answering the
research question by confirming a positive influence of the BSC adoption on organizational
Page | 46
performance. The reported performance improvements are not limited to financial measures, but
researchers show an equal focus and interest also in the non-financial ones, contrary to other
findings in the literature (Capelo and Dias, 2009; Tapinos et al., 2008; Chenhall, 2005).
Aligned with the findings of Kaplan and Norton (2001c), Speckbacher et al. (2003) and Ukko et
al. (2007), the findings of the research suggest that tying incentives to the BSC contributes
positively to performance improvement, by motivating the employees to understand and achieve
strategic goals. A positive correlation is also found between the maturity of the implemented
BSC and performance, as suggested also by other studies (Evans, 2004; Ukko et al., 2007).
Leadership support and employees involvement are also found to be important success factors in
BSC implementation and performance improvements.
The research provides clear evidence on the benefits that a company can gain after implementing
a BSC, both financial and non-financial. It must be mentioned though that much of the research
focuses more on the implementation phase of the BSC, and less on the subsequent evaluation of
its use. Another factor that should be kept in mind is the way performance is reported,
considering some of the researchers in the review are skeptical when tracing the performance
improvements to the BSC. Caution should be called for when relying on self-reported
performance results without using other data sources for triangulation.
A properly implemented and successful BSC, having the commitment and involvement of both
employees and managers and being used as a strategic management system that aligns the entire
organization to achieve its strategic goals, will eventually lead to a wide variety of performance
improvements, both financial and non-financial: effective strategy implementation and
communication, operational efficiency, improved financial performance, effective decision-
making, increased customer and employee satisfaction and improved image and branding.
Page | 47
7. References
The 53 articles that explore the impact of BSC on performance are marked with *, while the
other 266 articles are marked with **.
*Abo-Hamad, W. and Arisha, A. (2013), "Simulation-based framework to improve patient
experience in an emergency department", European Journal of Operational Research,
224(1):154–166
**Agostino, D. and Arnaboldi, M. (2012), "Design issues in Balanced Scorecards: The “what”
and “how” of control", European Management Journal, 30(4):327–339
*Ahn, H. (2001), "Applying the Balanced Scorecard Concept: An Experience Report", Long
Range Planning, 34(4):441–461
*Aidemark, L.-G. and Funck, E. K. (2009), "Measurement and health care management",
Financial Accountability & Management, 25(2):253-276
*Aidemark, L.-G.. (2001), "The Meaning of Balanced Scorecards in the Health Care
Organisation", Financial Accountability & Management, 17(1):23–40
**Akkermans, H. A. and Van Oorschot, K. E. (2005), "Relevance assumed: a case study of
balanced scorecard development using system dynamics", Journal of the Operational Research
Society, 31(3):169 - 188
**Al-Ashaab, A.; Flores, M.; Doultsinou, A. and Magyar, A. (2011), "A balanced scorecard for
measuring the impact of industry-university collaboration", Production Planning & Control,
22(5-6):554-570
Albertsen, O.A. and Lueg, R. (2014), "The balanced scorecard’s missing link to compensation. A
literature review and an agenda for future research", Journal of Accounting & Organizational
Change, 10(4):431-465.
**Alolah, T.; Stewart, R.A.; Panuwatwanich, K. and Mohamed, S. (2014), "Determining the
causal relationships among balanced scorecard perspectives on school safety performance: Case
of Saudi Arabia", Accident Analysis & Prevention, 68:57–74
**Amado, C.A.F.; Santos, S.P. and Marques, P.M. (2012), "Integrating the Data Envelopment
Analysis and the Balanced Scorecard approaches for enhanced performance assessment", Omega,
40(3):390–403
**Andjelkovic Pesic, M. and Dahlgaard, J.J. (2013), "Using the Balanced Scorecard and the
Page | 48
European Foundation for Quality Management Excellence model as a combined roadmap for
diagnosing and attaining excellence", Total Quality Management & Business Excellence, 24(5-
6):652-663
**Antonsen, Y. (2014), "The downside of the Balanced Scorecard: A case study from Norway",
Scandinavian Journal of Management, 30(1):40–50
**Asan, Š.S. and Tanyas, M. (2007), "Integrating Hoshin Kanri and the Balanced Scorecard for
Strategic Management: The Case of Higher Education", Total Quality Management & Business
Excellence, 18(9):999-1014
*Ashton, C. (1998), "Balanced scorecard benefits NatWest Bank", International Journal of Retail
& Distribution Management, 26(10):400-407
**Askim, J. (2004), "Performance management and organizational intelligence: adapting the
balanced scorecard in Larvik municipality", International Public Management Journal, 7(3):415-
438
**Asosheh, A.; Nalchigar, S. and Jamporazmey, M. (2010), "Information technology project
evaluation: An integrated data envelopment analysis and balanced scorecard approach.", Expert
Systems with Applications, 37(8):5931–5938
**Assiri, A.; Zairi, M. and Eid, R. (2006), "How to profit from the balanced scorecard",
Industrial Management & Data Systems, 106(7):937-952
**Bai, C.; Dhavale, D. and Sarkis, J. (2014), "Integrating Fuzzy C-Means and TOPSIS for
performance evaluation: An application and comparative analysis.", Expert Systems with
Applications, 41(9):4186–4196
**Banker, R.D..; Chang, H. and Pizzini, M. (2011), "The judgmental effects of strategy maps in
balanced scorecard performance evaluations", International Journal of Accounting Information
Systems, 12(4):259–279
**Banker, R.D.; Chang, H. and Pizzini, M.J. (2004), "The Balanced Scorecard: Judgmental
Effects of Performance Measures Linked to Strategy", Accounting Review, 79(1):1-23
**Banker, R.D.; Chang, H.; Janakiraman, S.N. and Konstans, C. (2004), "A balanced scorecard
analysis of performance metrics", European Journal of Operational Research, 154(2):423–436
**Barnabè, F. (2011), "A "system dynamics-based Balanced Scorecard"to support strategic
decision making", International Journal of Productivity and Performance Management,
60(5):446-473
Page | 49
**Bartlett, G; Johnson, E. and Reckers, P. (2014), "Accountability and Role Effects in Balanced
Scorecard Performance Evaluations When Strategy Timeline Is Specified", European Accounting
Review, 23(1):143-165
**Bassioni, H. A.; Price, A. D. F.; Hassan, T. M (2005), "Building a conceptual framework for
measuring business performance in construction: an empirical evaluation", Construction
Management & Economics, 23(5):495-507
**Basuroy, S.; C. Gleason, K. and Kannan, Y.H. (2014), "CEO compensation, customer
satisfaction, and firm value", Review of Accounting & Finance, 13 (4):326 - 352
Bedford, D. S., Brown, D. A. and Malmi, T. (2008), "Balanced Scorecard content, use, and
performance impacts: some Australian evidence", Journal of Applied Management Accounting
Research, 6(2):17–36
**Bentes, A.V.; Carneiro, J.; da Silva, J.F. and Kimura, H. (2012), "Multidimensional assessment
of organizational performance: Integrating BSC and AHP", Journal of Business Research,
65(12):1790–1799
**Bhagwat, R. and Sharma, M. K. (2007), "Performance measurement of supply chain
management using the analytical hierarchy process", Production Planning & Control, 18(8):666-
680
**Bhagwat, R. and Sharma, M.K. (2007), "Performance measurement of supply chain
management: A balanced scorecard approach", Computers & Industrial Engineering, 53(1):43–62
**Bhattacharya, A.; Mohapatra, P.; Kumar, V.; Dey, P.K.; Brady, M.; Tiwari, M.K. and
Nudurupati, Sai S. (2014), "Green supply chain performance measurement using fuzzy ANP-
based balanced scorecard: a collaborative decision-making approach", Production Planning &
Control, 25(8):698-714
*Bianchi, C. and Montemaggiore, G.B. (2008), "Enhancing strategy design and planning in public
utilities through “dynamic” balanced scorecards: insights from a project in a city water company",
System Dynamics Review, 24(2):175-213
**Boj, J.J.; Rodriguez-Rodriguez, R. and Alfaro-Saiz, J.-J. (2014), "An ANP-multi-criteria-based
methodology to link intangible assets and organizational performance in a Balanced Scorecard
context", Decision Support Systems, 68:98–110
Booth, W.C.; Colomb, G.G. and Williams, J.M. (2008), "The Craft of Research", Third Edition,
The University of Chicago Press
Page | 50
*Bose, S. and Thomas, K. (2007), "Applying the balanced scorecard for better performance of
intellectual capital", Journal of Intellectual Capital, 8(4):653 - 665
*Braam, G.J.M. and Nijssen, E.J. (2004), "Performance effects of using the Balanced Scorecard:
a note on the Dutch experience", Long Range Planning, 37(4):335–349
**Bryant, L.; Jones, D.A. and Widener, S.K. (2004), "Managing Value Creation within the Firm:
An Examination of Multiple Performance Measures", Journal of Management Accounting
Research, 16(1):107-131
**Burney, L.L. and Swanson, N.J. (2010), "The Relationship Between Balanced Scorecard
Characteristics and Managers' Job Satisfaction", Journal of Managerial Issues, 22(2):166-181
**Butler, A.; Letza, S.R. and Neale, B. (1997), "Linking the Balanced Scorecard to Strategy",
Long Range Planning, 30:242-253
**Capelo, C. and Dias, J.F. (2009), "A system dynamics-based simulation experiment for testing
mental model and performance effects of using the balanced scorecard", System Dynamics
Review, 25(1):1–34
**Capelo, C.; Lopes, A. and Mata, A. (2015), "A Simulation-Based Approach for Teaching the
Systems Perspective of Strategic Performance Management", Accounting Education, 24(1):1-26
**Cardinaels, E.; van Veen-Dirks, P.M.G (2010), "Financial versus non-financial information:
The impact of information organization and presentation in a Balanced Scorecard", Accounting,
Organizations & Society, 35(6):565–578
*Carmona, S. and Grölund, A. (2003), "Measures vs actions: the balanced scorecard in Swedish
Law Enforcement", International Journal of Operations & Production Management,
23(11/12):1475-97
**Cebeci, U. (2009), "Fuzzy AHP-based decision support system for selecting ERP systems in
textile industry by using balanced scorecard", Expert Systems with Applications, 36(5):8900–8909
**Chalmeta, R.; Palomero, S. (2011), "Methodological proposal for business sustainability
management by means of the Balanced Scorecard", Journal of the Operational Research Society,
62(7):1344-1356
**Chand, D.; Hachey, G.; Hunton, J.; Owhoso, V. and Vasudevan, S. (2005), "A balanced
scorecard based framework for assessing the strategic impacts of ERP systems", Computers in
Industry, 56(6):558–572
Page | 51
**Chang, H.H. (2009), "An empirical study of evaluating supply chain management integration
using the balanced scorecard in Taiwan", Service Industries Journal, 29(2):185-202
**Chang, O.H.; Chow, C.W. (1999), "The Balanced Scorecard: A Potential Tool for Supporting
Change and Continuous Improvement in Accounting Education", Issues in Accounting Education,
14(3):395-412
**Chang, S.-i.; Yen, D.C.; Ng, C.S.-P.; Chang, I-C. and Yu, S.-Y. (2011), "An ERP system
performance assessment model development based on the Balanced Scorecard approach",
Information Systems Frontiers, 13(3):429-450
*Chang, W.-C. ; Tung, Y.-C. ; Huang, C.-H. and Yang, M.-C. (2008), "Performance improvement
after implementing the Balanced Scorecard: A large hospital's experience in Taiwan", Total
Quality Management & Business Excellence, 19(11):1143-1154
**Chareonsuk, C. and Chansa-ngavej, C. (2010), "Intangible asset management framework: an
empirical evidence", Industrial Management & Data Systems, 110(7):1094 - 1112
**Chen, D.-N. and Liang, T.-P. (2011), "Knowledge evolution strategies and organizational
performance: A strategic fit analysis", Electronic Commerce Research & Applications, 10(1):75–
84
**Chen, H.-L. and Huang, Y. (2004), "The Establishment of Global Marketing Strategic
Alliances by Small and Medium Enterprises", Small Business Economics, 22(5):365-377
**Chen, M.-Y.; Huang, M.-J. and Cheng, Y.-C. (2009), "Measuring knowledge management
performance using a competitive perspective: An empirical study", Expert Systems with
Applications, 36(4):8449–8459
**Cheng, M.M. and Humphreys, K.A. (2012), "The Differential Improvement Effects of the
Strategy Map and Scorecard Perspectives on Managers' Strategic Judgments", Accounting
Review, 87(3):899-924
Chenhall, R.H. (2003), “Management control systems design within its organizational context:
findings from contingency-based research and directions for the future”, Accounting,
Organizations and Society, 28(2/3):127-168.
Chenhall, R.H. (2005), "Integrative strategic performance measurement systems, strategic
alignment of manufacturing, learning and strategic outcomes: an exploratory study", Accounting,
Organizations and Society, 30(5):395–422
Page | 52
*Chesley, J.A. and Wenger, Mike S. (1999), "Transforming an Organization: USING MODELS
TO FOSTER A STRATEGIC CONVERSATION", California Management Review, 41(3):54
**Chiang, C.-Y. and Lin, B. (2009), "An integration of balanced scorecards and data
envelopment analysis for firm's benchmarking management", Total Quality Management &
Business Excellence, 20(11):1153-1172
**Cianci, A.M.; Kaplan, S.E. and Samuels, J.A. (2013), "The Moderating Effects of the Incentive
System and Performance Measure on Managers' and Their Superiors' Expectations about the
Manager's Effort", Behavioral Research in Accounting, 25(1):115-134
**Cohen, S.; Thiraios, D and Kandilorou, M. (2008), "Performance parameters interrelations
from a balanced scorecard perspective: An analysis of Greek companies", Managerial Auditing
Journal, 23(5):485 - 503
*Cooper, D. J. and Ezzamel, M. (2013), "Globalization discourses and performance measurement
systems in a multinational firm", Accounting, Organizations & Society, 38(4):288–313
**Costa, R. and Menichini, T. (2013), "A multidimensional approach for CSR assessment: The
importance of the stakeholder perception", Expert Systems with Applications, 40(1):150–161
**Craig, J. and Moores, K. (2005), "Balanced Scorecards to Drive the Strategic", Family Business
Review, 18(2):105-122
**Cravens, K.S. and Goad Oliver, E. (2006), "Employees: The key link to corporate reputation
management", Business Horizons, 49(4):293–302
Crawford, D.; Couper, M.P. and Lamias, M.J. (2001), "Web surveys perceptions of burden",
Social Science Computer Review, 19(2):146–162.
**Creamer, G. and Freund, Y. (2010), "Learning a board Balanced Scorecard to improve
corporate performance", Decision Support Systems, 49(4):365–385
*Cugini, A. ; Michelon, G. and Pilonato, S. (2011), "Performance measurement in academic
departments: the strategy map approach", Public Money & Management, 31(4):271-278
Davis, G.F. (2014), "Editorial Essay: Why Do We Still Have Journals?", Administrative Science
Quarterly, 59(2):193-201
*Davis, S. and Albright, T. (2004), "An investigation of the effect of Balanced Scorecard
implementation on financial performance", Management Accounting Research, 15(2):135–153
*Davis, T.R.V. (1996), "Developing an employee balanced scorecard: Linking frontline
performance to corporate objectives", Management Decision, 34(4):14 - 18
Page | 53
*De Geuser, F. ; Mooraj, S. and Oyon, D. (2009), "Does the Balanced Scorecard Add Value?
Empirical Evidence on its Effect on Performance", European Accounting Review, 18(1):93-122
**de Waal, A.A. (2003), "Behavioural factors important for the successful implementation and
use of performance management systems", Management decision, 41(8):688-697
**de Waal, A.A. (2006), "The Role of Behavioral Factors and National Cultures in Creating
Effective Performance Management Systems", Systemic Practice & Action Research, 19(1):61-79
**DeBusk, G.K.; Brown, R.M. and Killough, L.N. (2003), "Components and relative weights in
utilization of dashboard measurement systems like the Balanced Scorecard", British Accounting
Review, 35(3):215–231
*Decoene, V and Bruggeman, W. (2006), "Strategic alignment and middle-level managers'
motivation in a balanced scorecard setting", International Journal of Operations & Production
Management, 26(4):429 - 448
*Denton, G.A. and White, B. (2000), "Implementing a Balanced-scorecard Approach to
Managing Hotel Operations", Cornell Hotel & Restaurant Administration Quarterly, 41(1):94–
107
Denyer, D. and Tranfield, D. (2009), “Producing a systematic review”, in Buchanan, D. and
Bryman, A. (Eds), The Sage Handbook of Organizational Research Methods, Sage, London, 671-
689.
**Dias-Sardinha, I. and Reijnders, L. (2005), "Evaluating environmental and social performance
of large Portuguese companies: a balanced scorecard approach", Business Strategy & the
Environment, 14(2):73–91
**Dilla, W.N. and Steinbart, P.J. (2005), "The effects of alternative supplementary display
formats on balanced scorecard judgments", International Journal of Accounting Information
Systems, 6(3):159–176
**Dilla, W.N.; Steinbart, P.J. (2005), "Relative Weighting of Common and Unique Balanced
Scorecard Measures by Knowledgeable Decision Makers", Behavioral Research in Accounting,
17(1):43-53
**Ding, S. and Beaulieu, P. (2011), "The Role of Financial Incentives in Balanced Scorecard-
Based Performance Evaluations: Correcting Mood Congruency Biases", Journal of Accounting
Research, 49(5):1223–1247
Page | 54
**Douglas, A. and Mills, J.E. (2004), "Staying Afloat in the Tropics: Applying a Structural
Equation Model Approach to Evaluating National Tourism Organization Websites in the
Caribbean", Journal of Travel & Tourism Marketing, 17(2-3):269-293
*Dreveton, B. (2013), "The advantages of the balanced scorecard in the public sector: beyond
performance measurement", Public Money & Management, 33(2):131-136
**Dyball, M.C.; Cummings, L. and Yu, H. (2011), "Adoption of the concept of a balanced
scorecard within NSW Health: an exploration of staff attitudes", Financial Accountability &
Management, 27(3):335–361
**Eaglen, A.; Lashley, C. and Thomas, R. (2000), "The benefits of training in leisure retailing: a
case study of Mc Donald's restaurants", Strategic Change, 9(6):333–345
**Eilat, H.; Golany, B. and Shtub, A. (2006), "Constructing and evaluating balanced portfolios of
R&D projects with interactions: A DEA based methodology", European Journal of Operational
Research, 172(3):1018–1039
**Elbanna, S. (2013), "Processes and Impacts of Strategic Management: Evidence From the
Public Sector in the United Arab Emirates", International Journal of Public Administration,
36(6):426-439
**El-Jardali, F.; Saleh, S.; Ataya, N. and Jamal, D. (2011), "Design, implementation and scaling
up of the balanced scorecard for hospitals in Lebanon: Policy coherence and application lessons
for low and middle income countries", Health policy, 103(2-3):305-14
**Emsley, D. (2003), "Multiple goals and managers' job-related tension and performance",
Journal of Managerial Psychology, 18(4):345-356
**Eom, C.S.J.; Yun, S.H. and Paek, J.H. (2008), "Subcontractor Evaluation and Management
Framework for Strategic Partnering", Journal of Construction Engineering & Management,
134(11):842-851
Evans, J.R. (2004), "An exploratory study of performance measurement systems and relationships
with performance results", Journal of Operations Management, 22(3):219-232
**Fältholm, Y. and Nilsson, K. (2010), "Business Process Re-Engineering and Balanced
Scorecard in Swedish Public Sector Organizations: Solutions for Problems or Problems for
Solutions?", International Journal of Public Administration, 33(6):302-310
*Farneti, F. (2009), "Balanced scorecard implementation in an Italian local government
organization", Public Money & Management, 29(5):313-320
Page | 55
*Fernandes, K.J. ; Raja, V. and Whalley, A. (2006), "Lessons from implementing the balanced
scorecard in a small and medium size manufacturing organization", Technovation, 26(5-6):623–
634
*Fottler, M.D. ; Erickson, E. and Rivers, P.A. (2006), "Bringing Human Resources To the Table:
Utilization of An HR Balanced Scorecard At Mayo Clinic", Health Care Management Review,
31(1):64-72
**Fu, C. and Yang, S. (2012), "The combination of dependence-based interval-valued evidential
reasoning approach with balanced scorecard for performance assessment", Expert Systems with
Applications, 39(3):3717–3730
**García-Valderrama, T. and Mulero-Mendigorri, E. (2009), "Relating the perspectives of the
balanced scorecard for R&D by means of DEA", European Journal of Operational Research,
196(3):1177–1189
Garengo, P.; Biazzo, S. and Bititci, U. (2005), "Performance measurement systems in SMEs: A
review for a research agenda", International Journal of Management Reviews, 7(1):25-47
*Garengo, P. and Biazzo, S. (2012), "Unveiling strategy in SMEs through balanced scorecard
implementation: A circular methodology", Total Quality Management & Business Excellence,
23(1):79-102
**Glykas, M. (2013), "Fuzzy cognitive strategic maps in business process performance
measurement", Expert Systems with Applications, 40(1):1–14
**González, J.M.H.; Calderón, M.Á. and González, J.L.G. (2012), "The alignment of managers’
mental models with the balanced scorecard strategy map", Total Quality Management & Business
Excellence, 23(5-6):613-628
**Gonzalez-Padron, T.L.; Chabowski, B.R.; Hult, G.T.M. and Ketchen, D.J. (2010), "Knowledge
Management and Balanced Scorecard Outcomes: Exploring the Importance of Interpretation,
Learning and Internationality", British Journal of Management, 21(4):967–982
**Gosselin, M. (2011), "Contextual factors affecting the deployment of innovative performance
measurement systems", Journal of Applied Accounting Research, 12(3):260-277
*Grando, A. and Belvedere, V. (2008), "Exploiting the balanced scorecard in the Operations
Department: the Ducati Motor Holding case", Production Planning & Control, 19(5):495-507
**Greasley, A. (2004), "Process improvement within a HR division at a UK police force",
International Journal of Operations & Production Management, 24(3):230-240
Page | 56
*Greatbanks, R. and Tapp, D. (2007), "The impact of balanced scorecards in a public sector
environment", International Journal of Operations & Production Management, 27(8):846 - 873
**Griffith, R. and Neely, A. (2009), "Performance Pay and Managerial Experience in Multitask
Teams: Evidence from within a Firm", Journal of Labor Economics, 7(1):49-82
**Grigoroudis, E.; Orfanoudaki, E. and Zopounidis, C. (2012), "Strategic performance
measurement in a healthcare organisation: A multiple criteria approach based on balanced
scorecard", Omega, 40(1):104–119
**Guimarães, B.; Simões, P. and Marques, R.C. (2010), "Does performance evaluation help
public managers? A Balanced Scorecard approach in urban waste services", Journal of
Environmental Management, 91(12):2632–2638
*Gumbus, A. and Lussier, R.N. (2006), "Entrepreneurs Use a Balanced Scorecard to Translate
Strategy into Performance Measures", Journal of Small Business Management, 44(3):407-425
**Hanafizadeh, P. and Moayer, S. (2008), "A methodology to define strategic processes in
organizations: An exploration study in managerial holding companies", Business Process
Management Journal, 14(2):219-227
**Hanafizadeh, P; Rezaei, M. and Ghafouri, A. (2009), "Defining strategic processes in
investment companies: An exploration study in Iranian Investment Companies", Business Process
Management Journal, 15(1):20 - 33
*Hansen, E.G. ; Sextl, M. and Reichwald, R. (2010), "Managing strategic alliances through a
community-enabled balanced scorecard: The case of Merck Ltd, Thailand", Business Strategy &
the Environment, 19(6):387–399
Harzing, A.-W. (2015), "Journal quality list", 54th Ed.
**Hendricks, K.; Hora, M.; Menor, L. and Wiedman, C. (2012), "Adoption of the Balanced
Scorecard: A Contingency Variables Analysis", Canadian Journal of Administrative Sciences,
29(2):124–138
Holmes, J.S.; Gutiérrez de Piñeres, S.A. and Kiel, L.D. (2006), "Reforming Government
Agencies Internationally: Is There a Role for the Balanced Scorecard?", International Journal of
Public Administration, 29(12):1125-1145
**Hoque, Z. and Adams, C. (2011), "The rise and use of balanced scorecard measures in
Australian government departments", Financial Accountability & Management, 27(3):308-334
Page | 57
*Hoque, Z. and James, W. (2000), "Linking Balanced Scorecard Measures to Size and Market
Factors: Impact on Organizational Performance", Journal of Management Accounting Research,
12: 1-17
**Hsu, C.-W.; Hu, Allen, H.; Chiou, C.-Y. and Chen, T.-C. (2011), "Using the FDM and ANP to
construct a sustainability balanced scorecard for the semiconductor industry", Expert Systems with
Applications, 38(10):12891–12899
*Hu, Q. and Huang, C.D. (2006), "Using the balanced scorecard to achieve sustained it-business
alignment: a case study", Communications of the Association for Information Systems, 17: 2
*Huang, C.D. and Hu, Q. (2007), "Achieving IT-Business Strategic Alignment via Enterprise-
Wide Implementation of Balanced Scorecards", Information Systems Management, 24(2):173-184
**Huang, H.-C.; Chu, W. and Wang, W.-K. (2007), "Strategic Performance Measurement and
Value", Service Industries Journal, 27(7/8):1111-1128
**Huang, H.-C.; Chu, W.; Lai, M.-C. and Lin, L.-H. (2009), "Strategic linkage process and value-
driven system: A dynamic analysis of high-tech firms in a newly-industrialized country", Expert
Systems with Applications, 36(2):3965-3974
**Huang, H.-C.; Lai, M.-C. and Lin, L.-H. (2011), "Developing strategic measurement and
improvement for the biopharmaceutical firm: Using the BSC hierarchy", Expert Systems with
Applications, 38(5):4875–4881
**Huang, H.-C.; Lai, M.-C. and Lin, T.-H. (2011), "Aligning intangible assets to innovation in
biopharmaceutical industry", Expert Systems with Applications, 38(4):3827–3834
**Huang, L. (2008), "Strategic orientation and performance measurement model in Taiwan's
travel agencies", Service Industries Journal, 28(10):1357-1383
*Huckestein, D. and Duboff, R. (1999), "Hilton Hotels", Cornell Hotel & Restaurant
Administration Quarterly, 40(4):28-38
**Hughes II, K. E. and Pate, G.R. (2013), "Moving Beyond Student Ratings: A Balanced
Scorecard Approach for Evaluating Teaching Performance", Issues in Accounting Education,
28(1):49
**Humphreys, K.A. and Trotman, K.T. (2011), "The Balanced Scorecard: The Effect of Strategy
Information on Performance Evaluation Judgments", Journal of Management Accounting
Research, 23(1):81-98

Page | 58
**Ip, Y.K. and Koo, L.C. (2004), "BSQ strategic formulation framework: A hybrid of balanced
scorecard, SWOT analysis and quality function deployment", Managerial Auditing Journal,
19(4):533-543
*Irwin, D. (2002), "Strategy mapping in the public sector", Long Range Planning, 35(6):637–647
**Iselin, E.R.; Mia, L. and Sands, J. (2008), "The effects of the balanced scorecard on
performance: the impact of the alignment of the strategic goals and performance reporting",
Journal of General Management, 33(4):71-85
**Ishino, Y. and Kijima, K. (2005), "Project management methodology for stimulating strategic
communication in Japan", Systems Research & Behavioral Science, 22(3):209 - 221
**Ismail, T.H. (2007), "Performance evaluation measures in the private sector: Egyptian
practice", Managerial Auditing Journal, 22(5):503-513
**Ittner, C.D.; Larcker, D.F. and Meyer, M.W. (2003), "Subjectivity and the Weighting of
Performance Measures: Evidence from a Balanced Scorecard", Accounting Review, 78(3):725–
758
**Ittner, C.D.; Larcker, D.F. and Randall, T. (2003), "Performance implications of strategic
performance measurement in financial services firms", Accounting, Organizations & Society, 28:
715-741
**Janeš, A. (2014), "Empirical verification of the balanced scorecard", Industrial Management &
Data Systems, 114(2):203-219
**Jassbi, J.; Mohamadnejad, F. and Nasrollahzadeh, H. (2011), "A Fuzzy DEMATEL framework
for modeling cause and effect relationships of strategy map", Expert Systems with Applications,
38(5):5967–5973
*Jazayeri, M. and Scapens, R.W. (2008), "The Business Values Scorecard within BAE Systems:
The evolution of a performance measurement system", British Accounting Review, 40(1):48–70
**Jin, Z.; Deng, F.; Li, H. and Skitmore, M. (2013), "Practical Framework for Measuring
Performance of International Construction Firms", Journal of Construction Engineering &
Management, 139(9):1154–1167
**Johnson, E.N.; Reckers, P.M.J. and Bartlett, G.D. (2014), "Influences of Timeline and
Perceived Strategy Effectiveness on Balanced Scorecard Performance Evaluation Judgments",
Journal of Management Accounting Research, 26(1):165-184
Page | 59
*Joseph, G. (2009), "Mapping, Measurement and Alignment of Strategy using the Balanced
Scorecard: The Tata Steel Case.", Accounting Education, 18(2):117-130
**Jusoh, R. and Parnell, J.A. (2008), "Competitive strategy and performance measurement in the
Malaysian context: An exploratory study", Management Decision, 46(1):5 - 31
**Kald, M. and Nilsson, F. (2000), "Performance measurement at Nordic companies", European
Management Journal, 18(1):113–127
**Kamhawi, E.M. (2011), "IT and non-IT factors influencing the adoption of BSC systems: a
Delphi study from Bahrain", International Journal of Productivity and Performance
Management, 60(5):474-492
*Kampschroer, K. and Heerwagen, J.H. (2005), "The strategic workplace:
development and evaluation", Building Research & Information, 33(4):326-337
Kaplan, R.S. (2001), "Strategic Performance Measurement and Management in Nonprofit
Organizations", Nonprofit Management & Leadership, 11(3):353-370
Kaplan, R. S. and D. P. Norton (1992), “The Balanced Scorecard--Measures That Drive
Performance”, Harvard Business Review, Harvard Business School Publication Corp. 70: 71-79.
Kaplan, R. S. and D. P. Norton (1996a), “The balanced scorecard: translating strategy into
action”, Boston, Mass., Harvard Business School Press.
Kaplan, R. S. and D. P. Norton (1996b), “Linking the balanced scorecard to strategy”, California
Management Review, 39(1): 53-79.
Kaplan, R. S. and D. P. Norton (1996c), “Using the Balanced Scorecard as a strategic
management system”, Harvard Business Review: 75-85.
Kaplan, R. S. and Norton, D.P. (2001a), "The strategy-focused organization: how balanced
scorecard companies thrive in the new business environment", Harvard Business School Press,
Boston, Mass.
Kaplan, R.S. and Norton, D.P. (2001b), “Leading change with the balanced scorecard”, Financial
Executive, 64-66.
Kaplan, R. S. and D. P. Norton (2004a), “Strategy maps: converting intangible assets into tangible
outcomes”, Boston, Harvard Business School Press.
Kaplan, R. S. and D. P. Norton (2004b), “How Strategy Maps frame an organization's
objectives”, Financial Executive, 40-45.
Page | 60
Kaplan, R. S. and D. P. Norton (2006), “Alignment: using the balanced scorecard to create
corporate synergies”, Boston, Mass., Harvard Business School Press.
Kaplan, R. S. and D. P. Norton (2008). “The execution premium: linking strategy to operations
for competitive advantage”, Boston, Mass., Harvard Business Press.
**Kaplan, S.E. and Wisner, P.S. (2009), "The Judgmental Effects of Management
Communications and a Fifth Balanced Scorecard Category on Performance Evaluation",
Behavioral Research in Accounting, 21(2):37-56
**Kaplan, S.E.; Petersen, M.J. and Samuels, J. (2012), "An Examination of the Effect of Positive
and Negative Performance on the Relative Weighting of Strategically and Non-Strategically
Linked Balanced Scorecard Measures", Behavioral Research in Accounting, 24(2):133-151
*Kasperskaya, Y. (2008), "Implementing the balanced scorecard: a comparative study of two
Spanish city councils - an institutional perspective", Financial Accountability & Management,
24(4):363–384
**Kasurinen, T. (2002), "Exploring management accounting change: the case of balanced
scorecard implementation", Management Accounting Research, 13(3):323–343
Katsikeas, C.S.; Leonidou, L.C. and Morgan, N.A. (2000), "Firm level export performance
assessment: review, evaluation and development", Journal of the Academy of Marketing Science,
28(4):493–511
**Khalifeh, C.J. and Sivabalan, P. (2014), "An Experimental Study on the Effect of Budget
Information on Balanced Scorecard Preparer Individual Learning", Australian Accounting
Review, 24(1):39–52
**Kim, J. and Rhee, J. (2012), "An empirical study on the impact of critical success factors on the
balanced scorecard performance in Korean green supply chain management enterprises",
International Journal of Production Research, 50(9):2465-2483
**Kim, J.; Suh, E. and Hwang, H. (2003), "A model for evaluating the effectiveness of CRM
using the Balanced Scorecard", Journal of Interactive Marketing, 17(2):5–19
**Kline, S.F.; Morrison, A.M. and St. John, A. (2004), "Exploring Bed & Breakfast Websites: A
Balanced Scorecard Approach", Journal of Travel & Tourism Marketing, 17(2-3):253-267
**Kloot, L. and Martin, J. (2000), "Strategic performance management: A balanced approach to
performance management issues in local government", Management Accounting Research,
11(2):231–251
Page | 61
**Knechel, W.R.; Salterio, S.E. and Kochetova-Kozloski, N. (2010), "The effect of benchmarked
performance measures and strategic analysis on auditors’ risk assessments and mental models",
Accounting, Organizations & Society, 35(3):316–333
*Kollberg, B. and Mattias, E. (2010), "The practice of the Balanced Scorecard in health care
services", International Journal of Production and Performance Management, 60(5):427-445
**Kraus, K. and Lind, J. (2010), "The impact of the corporate balanced scorecard on corporate
control—A research note", Management Accounting Research, 21(4):265–277
**Kumru, M. (2012), "A balanced scorecard-based composite measuring approach to assessing
the performance of a media outlet", Service Industries Journal, 32(5):821-843
**Kunc, M. (2008), "Using systems thinking to enhance strategy maps.", Management Decision,
46(5):761-778
**Kuo, Y.-F. and Chen, P.-C. (2008), "Constructing performance appraisal indicators for mobility
of the service industries using Fuzzy Delphi Method", Expert Systems with Applications,
35(4):1930–1939
**Landin, A. and Nilsson, C.-H. (2001), "Do quality systems really make a difference?", Building
Research & Information, 29(1):12-20
**Lansiluoto, A. and Jarvenpaa, M. (2008), "Environmental and performance management
forces Integrating “greenness” into balanced scorecard", Qualitative Research in Accounting &
Management, 5(3):184-206
**Länsiluoto, A. and Järvenpää, M. (2010), "Greening the balanced scorecard", Business
Horizons, 53(4):385–395
**Lau, C.M. and Sholihin, M. (2005), "Financial and nonfinancial performance measures: How
do they affect job satisfaction?", British Accounting Review, 37(4):389–413
**Lawrence, S. and Sharma, U. (2002), "Commodification of Education and Academic
LABOUR—Using the Balanced Scorecard in a University Setting", Critical Perspectives on
Accounting, 13(5-6):661–677
**Lazzarotti, V.; Manzini, R. and Mari, L. (2011), "A model for R&D performance
measurement", International Journal of Production Economics, 134(1):212–223
**Lee, A.H.I.; Chen, W.-C. and Chang, C.-J. (2008), "A fuzzy AHP and BSC approach for
evaluating performance of IT department in the manufacturing industry in Taiwan", Expert
Systems with Applications, 34(1):96–107
Page | 62
**Lee, S.; Park, S.B. and Lim, G.G (2013), "Using balanced scorecards for the evaluation of
“Software-as-a-service”", Information & Management, 50(7):553–561
**Lee, S.F.; Lo, K.K.; Leung, R.F.; Sai On Ko, A. (2000), "Strategy formulation framework for
vocational education: integrating SWOT analysis, balanced scorecard, QFD methodology and
MBNQA education criteria", Managerial Auditing Journal, 15(8):407 - 423
**Li, Y.-L.; Chin, K.-S. and Luo, X.-G. (2012), "Determining the final priority ratings of
customer requirements in product planning by MDBM and BSC", Expert Systems with
Applications, 39(1):1243–1255
**Li, Y.-L.; Huang, M.; Chin, K.-S.; Luo, X.-G. and Han, Y. (2011), "Integrating preference
analysis and balanced scorecard to product planning house of quality"other BSC uses - assessing
the IGPV", Computers & Industrial Engineering, 60(2):256–268
**Liang, C.-J.; Wang, W.-H. (2008), "How managers in the financial services industry ensure
financial performance", Service Industries Journal, 28(2):193-210
Libby, T. and Waterhouse, J.H. (1996), "Predicting change in management accounting systems",
Journal of Management Accounting Research, 8:137–150
**Libby, T.; Salterio, S.E. and Webb, A. (2004), "The Balanced Scorecard: The Effects of
Assurance and Process Accountability on Managerial Judgment", Accounting Review, 79(4):
1075-1094
**Liedtka, S.L.; Church, B.K. and Ray, M.R. (2008), "Performance Variability, Ambiguity
Intolerance, and Balanced Scorecard-Based Performance Assessments", Behavioral Research in
Accounting, 20(2):73-88
**Lin, Q.-L.; Liu, L.; Liu, H.-C. and Wang, D.-J. (2013), "Integrating hierarchical balanced
scorecard with fuzzy linguistic for evaluating operating room performance in hospitals", Expert
Systems with Applications, 40(6):1917–1924
*LIN, Z. ; YU, Z. and ZHANG, L. (2014), "Performance outcomes of balanced scorecard
application in hospital administration in China", China Economic Review, 30: 1–15
**Lipe, M.G. and Salterio, S. (2002), "A note on the judgmental effects of the balanced
scorecard's information organization", Accounting, Organizations & Society, 27(6): 531–540
**Lipe, M.G. and Salterio, S.E. (2000), "The Balanced Scorecard: Judgmental Effects of
Common and Unique Performance Measures", Accounting Review, 75(3):283-298

Page | 63
*Liu, W.B. ; Meng, W. ; Mingers, J. ; Tang, N. and Wang, W. (2012), "Developing a
performance management system using soft systems methodology: A Chinese case study",
European Journal of Operational Research, 223(2):529–540
**Lohman, C.; Fortuin, L. and Wouters, M. (2004), "Designing a performance measurement
system: A case study", European Journal of Operational Research, 156(2):267–286
*Lorden, A. ; Coustasse, A and Singh, K.P. (2008), "The balanced scorecard framework-A case
study of patient and employee satisfaction: What happens when it does not work as planned?",
Health Care Management Review, 33(2):145-55
**Loukis, E.N. and Charalabidis, Y.K. (2013), "An empirical investigation of information
systems interoperability business value in European firms", Computers in Industry, 64(4):412–
420
Lueg, R. and Schäffer, U. (2010), "Assessing empirical research on value-based management:
Guidelines for improved hypothesis testing", Journal of Business Administration, 60(1):1–47.
**Luo, C.-M.A; Chang, H.-F. and Su, C.-H. (2012), "‘Balanced Scorecard’ as an operation-level
strategic planning tool for service innovation.", Service Industries Journal, 32(12):1937-1956
**Luu, T.-V.; Kim, S.-Y.; Cao, H.-L. and Park, Y.-M. (2008), "Performance measurement of
construction firms in developing countries", Construction Management & Economics, 26(4):373-
386
**MacKerron, G.; Kumar, M.; Benedikt, A. and Kumar, V. (2015), "Performance management of
suppliers in outsourcing project: case analysis from the financial services industry", Production
Planning & Control, 26(2):150-165
**Maiga, A.S. and Jacobs, F.A. (2003), "Balanced Scorecard, Activity-Based Costing And
Company Performance: An Empirical Analysis", Journal of Managerial Issues, 15(3):283-301
*Malina, M.A. and Selto, F.H. (2001), "Communicating and Controlling Strategy: An Empirical
Study of the Effectiveness of the Balanced Scorecard", Journal of Management Accounting
Research, 13: 47-90
**Malmi, T. (2001), "Balanced scorecards in Finnish companies: A research note", Management
Accounting Research, 12(2):207–220
**Maltz, A.C.; Shenhar, A.J. and Reilly, R.R. (2003), "Beyond the Balanced Scorecard: Refining
the Search for Organizational Success Measures", Long Range Planning, 36(2):187–204
Page | 64
**Manville, G. (2006), "Implementing a balanced scorecard framework in a not for profit SME",
International Journal of Production and Performance Management, 56(2):162-169
*Manville, G. and Broad, M. (2013), "Changing times for charities. Performance management in
a Third Sector Housing Association", Public Management Review, 15(7):992-1010
**Martinsons, M. and Davidson, R. (1999), "The balanced scorecard: a foundation for the
strategic management of information systems", Decision Support Systems, 25(1):71–88
**Mathrani, S. and Mathrani, A. (2013), "Utilizing enterprise systems for managing enterprise
risks", Computers in Industry, 64(4): 476–483
**Meadows, M. and Pike, M. (2010), "Performance Management for Social Enterprises",
Systemic Practice & Action Research, 23(2):127-141
**Mistry, J.; Sarkis, J. and Dhavale, D.G. (2014), "Multi-criteria analysis using latent class
cluster ranking: An investigation into corporate resiliency", International Journal of Production
Economics, 148:1–13
Modell, S. (2004), "Performance measurement myths in the public sector: a research note",
Financial Accountability & Management, 20(1):39-55.
*Modell, S. (2009), "Bundling management control innovations", Accounting, Auditing &
Accountability Journal, 22(1):59-90
**Mohamed, S. (2003), "Scorecard Approach to Benchmarking Organizational Safety Culture in
Construction", Journal of Construction Engineering & Management, 129(1):80-88
**Molina, M.Á.C.; González, J.M.H.; Florencio, B.P. and González, J.L.G. (2014), "Does the
balanced scorecard adoption enhance the levels of organizational climate, employees'
commitment, job satisfaction and job dedication?", Management Decision, 52(5):983-1010
**Möller, A. and Schaltegger, S. (2003), "Measuring the benefits of knowledge management at
the Financial Services Authority: a case study", Journal of Information Science, 29(6):475-487
*Mooraj, S. and Oyon, D. (1999), "The Balanced Scorecard: a Necessary Good or an
Unnecessary Evil?", European Management Journal, 17(5):481–491
Nørreklit, H. (2000), "The balance on the balanced scorecard critical analysis of some of its
assumptions", Management Accounting Research, 11:65-88
Nørreklit, H. and Mitchell, F. (2007), "The Balanced scorecard", in Hopper, T., Northcott, D.,
Scapens, R. (Eds.), Prentice-Hall, pp. 175–198.
Page | 65
**Naranjo-Gil, D. (2009), "Strategic performance in hospitals: The use of the balanced scorecard
by nurse managers", Health Care Management Review, 34(2):161-70
**Naranjo-Gil, D.; Maas, V.S. and Hartmann, F.G.H. (2009), "How CFOs Determine
Management Accounting Innovation: An Examination of Direct and Indirect", European
Accounting Review, 18(4):667-695
**Naro, G. and Travaille, D. (2011), "The role of the balanced scorecard in the formulation and
control of strategic processes", Journal of Applied Accounting Research, 12(3):212 - 233
**Nielsen, S. and Nielsen, E.H. (2012), "Discussing feedback system thinking in relation to
scenario evaluation in a balanced scorecard setup", Production Planning & Control, 23(6):436-
451
**Nielsen, S. and Sorensen, R. (2004), "Motives, diffusion and utilisation of the balanced
scorecard in Denmark", International Journal of Accounting, Auditing and Performance
Evaluation, 1(1):103-124
**Nilsson, K. (2010), "Expectations from Administrative Reforms: An Attempt to Implement the
Balanced Scorecard in a Public Sector Organization", International Journal of Public
Administration, 33(14):822-831
*O'Connor, N.G. and Feng, E. (2005), "Using the Balanced Scorecard to Manage Intangible
Assets in A Sino-Foreign Joint Venture", Australian Accounting Review, 15(36):22–29
**Olson, E.M. and Slater, S.F. (2002), "The balanced scorecard, competitive strategy, and
performance", Business Horizons, 45(3):11-16
**Othman, R. (2006), "Balanced scorecard and causal model development: preliminary findings",
Management Decision, 44(5):690-702
**Palmatier, R.W.; Miao, C.F. and Fang, E. (2007), "Sales channel integration after mergers and
acquisitions: A methodological approach for avoiding common pitfalls", Industrial Marketing
Management, 36(5):589–603
*Papalexandris, A. ; Ioannou, G. and Prastacos, G.P. (2004), "Implementing the Balanced
Scorecard in Greece: a Software Firm's Experience", Long Range Planning, 37(4):351–366
**Patel, B.; Chaussalet, T. and Millard, P. (2008), "Balancing the NHS balanced scorecard!",
European Journal of Operational Research, 185(3):905–914
Pervez, G. and Groenhaug, K. (2010), "Research Methods in Business Studies", 4th Ed., Prentice
Hall
Page | 66
**Phillips, P. and Louvieris, P. (2005), "Performance Measurement Systems in Tourism,
Hospitality, and Leisure Small Medium-Sized Enterprises: A Balanced Scorecard Perspective",
Journal of Travel Research, 44(2):201-211
*Phillips, P.A. (2007), "The Balanced Scorecard and Strategic Control: A Hotel Case Study
Analysis", Service Industries Journal, 27(6):731-746
**Pimentel, L. and Major, M.J. (2014), "Quality management and a balanced scorecard as
supporting frameworks for a new management model and organisational change", Total Quality
Management & Business Excellence, 25(7-8):763-775
**Poveda-Bautista, R.; Baptista, D.C. and García-Melón, M. (2012), "Setting competitiveness
indicators using BSC and ANP", International Journal of Production Research, 50(17):4738-
4752
**Qi, J.; Li, L. and Ai, H. (2009), "A system dynamics approach to competitive strategy in
mobile telecommunication industry", Systems Research & Behavioral Science, 26(2):155-168
**Qu, S.Q. and Cooper, D.J. (2011), "The role of inscriptions in producing a balanced scorecard",
Accounting, Organizations & Society, 36(6):344–362
**Quezada, L.E. and López-Ospina, H.A. (2014), "A method for designing a strategy map using
AHP and linear programming", International Journal of Production Economics, 158:244–255
**Quezada, L.E.; Cordova, F.M.; Palominos, P.; Godoy, K. and Ross, J. (2009), "Method for
identifying strategic objectives in strategy maps", International Journal of Production Economics,
122(1):492–500
**Rabbani, A.; Zamani, M.; Yazdani-Chamzini, A. and Zavadskas, E.K. (2014), "Proposing a
new integrated model based on sustainability balanced scorecard (SBSC) and MCDM approaches
by using linguistic variables for the performance evaluation of oil producing companies", Expert
Systems with Applications, 41(16):7316–7327
**Rachman-Moore, D. and Kenett, R.S. (2006), "The use of simulation to improve the
effectiveness of trainning in performance management", Journal of Management Education,
30(3):455-476
**Ravi, V.; Shankar, R. and Tiwari, M.K. (2005), "Analyzing alternatives in reverse logistics for
end-of-life computers: ANP and Balanced Scorecard Approach", Computers & Industrial
Engineering, 48(2):327–356
Page | 67
**Reisinger, H.; Cravens, K.S. and Tell, N. (2003), "Prioritizing Performance Measures Within
the Balanced Scorecard Framework", Management International Review, 43(4):429-437
*Rhodes, J ; Walsh, P. and Lok, P. (2008), "Convergence and divergence issues in strategic
management – Indonesia’s experience with the Balanced Scorecard in HR management",
International Journal of Human Resource Management, 19(6):1170-1185
**Roberts, M.L.; Albright, T.L. and Hibbets, A.R. (2004), "Debiasing Balanced Scorecard
Evaluations", Behavioral Research in Accounting, 16(1):75-88.
**Rotchanakitumnuai, S. (2013), "Assessment of e-procurement auction with a balanced
scorecard", International Journal of Physical Distribution & Logistics Management, 43(1):39-53
Ryan, B.; Scapens, R. W. and Theobald, M. (2002) "Research Method and Methodology in
Finance and Accounting", 2nd Ed., Cengace Learning.
**Sai On Ko, A. and Lee, S.F. (2000), "Implementing the strategic formulation framework for the
banking industry of Hong Kong", Managerial Auditing Journal, 15(9):469 - 477
**Sandhu, R.; Baxter, J. and Emsley, D. (2008), "The Balanced Scorecard and its Possibilities:
The Initial Experiences of a Singaporean Firm", Australian Accounting Review, 18(1):16-24
**Sandström, J. (2001), "The problem of managing product development engineers: Can the
balanced scorecard be an answer?", International Journal of Production Economics, 78(1):79–90
Schrader, U. and Hennig-Thurau, T. (2009), "VHB-JOURQUAL2: Method, Results, and
Implications of the German Academic Association for Business Research’s Journal Ranking",
Business Research, 2(2):180-204.
**Shafia, M.A.; Mazdeh, M.M.; Vahedi, M. and Pournader, M. (2011), "Applying fuzzy balanced
scorecard for evaluating the CRM performance", Industrial Management & Data Systems,
111(7):1105-1135
Sink, D.S. (1985), "Productivity Management: Planning, Measurement and Evaluation, Control
and Improvement", Wiley, New York
**Soderberg, M.; Kalagnanam, S.; Sheehan, N.T. and Vaidyanathan, G. (2011), "When is a
balanced scorecard a balanced scorecard?", International Journal of Productivity and
Performance Management, 60(7):688-708
**Sohn, M.H.; You, T.; Lee, S.-L. and Lee, H. (2003), "Corporate strategies, environmental
forces, and performance measures: a weighting decision support system using the k-nearest
neighbor technique, Expert Systems with Applications, 25(3):279-292
Page | 68
**Solano, J.; de Ovalles, M.P.; Rojas, T.; Padua, A.G. and Morales, L.M. (2003), "Integration of
systemic quality and the Balanced Scorecard", Information Systems Management, 20(1):66-81
**Speckbacher, G.; Bischof, J. and Pfeiffer, T. (2003), "A descriptive analysis on the
implementation of Balanced Scorecards in German-speaking countries", Management Accounting
Research, 14(4):361–388
*Sundin, H. ; Granlund, M. and Brown, D.A. (2010), "Balancing Multiple Competing Objectives
with a Balanced Scorecard", European Accounting Review, 19(2):203-246
*Tapinos, E. ; Dyson, R.G. and Meadows, M. (2011), "Does the Balanced Scorecard make a
difference to the strategy development process?", Journal of the Operational Research Society,
62(5):888-899
**Tavana, M.; Khalili-Damghani, K. and Rahmatian, R. (2014), "A hybrid fuzzy MCDM method
for measuring the performance of publicly held pharmaceutical companies", Annals of Operations
Research, 226(1):589-621
**Tayler, W.B. (2010), "The Balanced Scorecard as a Strategy-Evaluation Tool: The Effects of
Implementation Involvement and a Causal-Chain Focus", Accounting Review, 85(3):1095-1117
Tenhunen, J.; Rantanen, H. and Ukko, J. (2001), "SME-oriented implementation of a performance
measurement system", Proceedings of the 13th International Society for Professional Innovation
Management Conference, Finland, Lappeenranta
**Thakkar, J.; Kanda, A. and Deshmukh, S.G. (2009), "Supply chain performance measurement
framework for small and medium scale enterprises", Benchmarking, 16(5):702-723
**Tsai, W.-H.; Chou, W.-C. and Hsu, W. (2009), "The sustainability balanced scorecard as a
framework for selecting socially responsible investment: an effective MCDM model", Journal of
the Operational Research Society, 60:1396-1410
**Tsai, W.-H.; Lee, P.-L.; Shen, Y.-S. and Lin, H.-L. (2012), "A comprehensive study of the
relationship between enterprise resource planning selection criteria and enterprise resource
planning system success", Information & Management, 49(1):36–46
**Ukko, J. and Tenhunen, J. and Rantanen, H. (2007), "Performance measurement impacts on
management and leadership: Perspectives of management and employees", International Journal
of Production Economics, 110(1–2):39–51
**Ullrich, M.J. and Tuttle, B.M. (2004), "The Effects of Comprehensive Information Reporting
Systems and Economic Incentives on Managers' Time-Planning Decisions", Behavioral Research
Page | 69
in Accounting, 16(1):89-105
*UMASHEV, C. and WILLETT, R. (2008), "Challenges to Implementing Strategic Performance
Measurement Systems in Multi-Objective Organizations: The Case of a Large Local Government
Authority", Abacus, 44(4):377-398
**Upadhaya, B.; Munir, R. and Blount, Y. (2014), "Association between performance
measurement systems and organisational effectiveness", International Journal of Operations &
Production Management, 34(7):853 - 875
**Upton, D.R. and Arlington, C.E. (2012), "Implicit racial prejudice against African-Americans
in balanced scorecard performance evaluations", Critical Perspectives on Accounting, 23(4-
5):281–297
**Valmohammadi, C. and Ahmadi, M. (2015), "The impact of knowledge management practices
on organizational performance: A balanced scorecard approach", Journal of Enterprise
Information Management, 28(1):131-159
**Valmohammadi, C. and Servati, A. (2011), "Performance measurement system implementation
using Balanced Scorecard and statistical methods", International Journal of Productivity and
Performance Management, 60(5):493-511
Van der Stede, W.A., Young, S.M. and Chen, C.X. (2005), “Assessing the quality of evidence in
empirical management accounting research: the case of survey studies”, Accounting,
Organizations and Society, 30(7/8):655-684.
**van der Woerd, F. and van den Brink, T. (2004), "Feasibility of a Responsive Business
Scorecard-a pilot study", Journal of Business Ethics, 55(2):173-186
**van der Zee, J.T.M. and de Jong, B. (1999), "Alignment Is Not Enough: Integrating Business
and Information Technology Management with the Balanced Business Scorecard", Journal of
Management Information Systems, 16(2):137-156
**Van Veen-Dirks, P. andWijn, M. (2002), "Strategic Control: Meshing Critical Success Factors
with the Balanced Scorecard", Long Range Planning, 35(4):407–427
**Wang, C.-H.; Lu, I.-Y. and Chen, C.-B. (2010), "Integrating hierarchical balanced scorecard
with non-additive fuzzy integral for evaluating high technology firm performance", International
Journal of Production Economics, 128(1):413–426
**Wang, W. (2005), "An evaluation of the Balanced Scorecard® in equity valuation: The case of
Page | 70
exchange ratio in the M&As of Taiwan's financial industry", Journal of Intellectual Capital,
6(2):206-221
**Waweru, N.M.; Hoque, Z. and Uliana, E. (2004), "Management accounting change in South
Africa: case studies from retail services", Accounting, Auditing & Accountability Journal,
17(5):675-704
**Wei, T.L.; Davey, H. and Coy, D. (2008), "A disclosure index to measure the quality of annual
reporting by museums in New Zealand and the UK", Journal of Applied Accounting Research,
9(1):29-51
**Wiersma, E. (2009), "For which purposes do managers use Balanced Scorecards?: An
empirical study", Management Accounting Research, 20(4):239–251
*Wisniewski, M. and Dickson, A. (2001), "Measuring performance in Dumfries and Galloway
Constabulary with the Balanced Scorecard", Journal of the Operational Research Society,
52(10):1057-1066
**Witcher, B.J. and Chau, V.S. (2008), "Contrasting uses of balanced scorecards: case studies at
two UK companies", Strategic Change, 17(3-4):101–114
**Wong-On-Wing, B.; Guo, L.; Li, W. and Yang, D. (2007), "Reducing conflict in balanced
scorecard evaluations”, Accounting, Organizations & Society, 32(4–5):363–377
*Woods, M. and Grubnic, S. (2008), "Linking comprehensive performance assessment to the
balanced scorecard: evidence from Hertfordshire county council", Financial Accountability &
Management, 24(3):343–361
**Wu, A. (2005), "The integration between Balanced Scorecard and intellectual capital", Journal
of Intellectual Capital, 6(2):267 - 284
**Wu, C.-R.; Lin, C.-T. and Tsai, P.-H. (2010), "Evaluating business performance of wealth
management banks", European Journal of Operational Research, 207(2):971–979
**Wu, H.-Y.; Tzeng, G.-H. and Chen, Y.-H. (2009), "A fuzzy MCDM approach for evaluating
banking performance based on Balanced Scorecard", Expert Systems with Applications,
36(6):10135–10147
**Wu, I.-L. and Chang, C.-H. (2012), "Using the balanced scorecard in assessing the performance
of e-SCM diffusion: A multi-stage perspective", Decision Support Systems, 52(2):474–485
**Wu, J.C.-T.; Tsai, H.-T.; Shih, M.-H and Fu, H.-H. (2010), "Government performance
evaluation using a balanced scorecard with a fuzzy linguistic scale", Service Industries Journal,

Page | 71
30:449-462
**Wu, S.-I. and Chen, J.-H. (2011), "Comparison between manufacturing companies that are ISO
certified and those that are not certified using performance measurement model", Total Quality
Management & Business Excellence, 22(8):869-890
**Wu, S.-I. and Hung, J.-M. (2008), "A performance evaluation model of CRM on non-profit
organisations", Total Quality Management & Business Excellence, 19(4):321-342
**Wu, W.-Y. and Liao, Y.-K. (2014), "A balanced scorecard envelopment approach to assess
airlines' performance", Industrial Management & Data Systems, 114(1):123-143
**Wynder, M.; Wellner, K.-U. and Reinhard, K. (2013), "Rhetoric or Reality? Do Accounting
Education and Experience Increase Weighting on Environmental Performance in a Balanced
Scorecard?", Accounting Education, 22(4):366-381
**Xian, S.; Qiu, D. and Zhang, S. (2013), "A Fuzzy Principal Component Analysis Approach to
Hierarchical Evaluation Model for Balanced Supply Chain Scorecard Grading", Journal of
Optimization Theory & Applications, 159(2):518-535
**Xu, Y. and Yeh, C.-H. (2012), "An integrated approach to evaluation and planning of best
practices", Omega, 40(1):65–78
**Yang, C.-C. and Yeh, T.-M. (2009), "An integrated implementation model of strategic
planning, BSC and Hoshin management", Total Quality Management & Business Excellence,
20(9):989-1002
**Yang, M.-C. and Tung, Y.-C. (2006), "Using Path Analysis to Examine Causal Relationships
Among Balanced Scorecard Performance Indicators for General Hospitals: The Case of a Public
Hospital System in Taiwan", Health Care Management Review, 31(4):280-8
Yin, R.K. (2013), "Case Study Research: Design and Methods", 5th Ed., Sage
**Yüksel, İ. and Dağdeviren, M. (2010), "Using the fuzzy analytic network process (ANP) for
Balanced Scorecard (BSC):A case study for a manufacturing firm", Expert Systems with
Applications, 37(2):1270–1278
**Zeng, K. and Luo, X. (2013), "The balanced scorecard in China: Does it work?", Business
Horizons, 56(5):611–620.