does social capital matter? evidence from a five-country group lending experiment · 2014-03-27 ·...
TRANSCRIPT

Does Social Capital Matter? Evidence from a Five-Country Group Lending Experiment
JEL Classifications: O12, O16, C92, Z13
Alessandra Cassar and Bruce Wydick
Department of Economics University of San Francisco
2130 Fulton St. San Francisco, CA 94117
e-mail: [email protected], [email protected]
Abstract: Does social capital matter to economic decision-making? We address this broad question through an artefactual field experiment carried out in five countries: India, Kenya, Guatemala, Armenia, and the Philippines. From these experiments we obtain data on 10,662 contribution decisions on simulated group loans from 1,554 participants in 259 experimental borrowing groups. We carry out treatments for social homogeneity, group monitoring, and self-selection. Our results show the influence of different types of social capital to vary depending on context, and that certain treatments, such as peer monitoring, can have perverse as well as beneficial effects on group performance. We also distinguish between spiritual capital and social capital among Christian, Hindu, and Muslim groups in our five countries, finding modest evidence for the effect of spiritual capital on individual repayment performance, controlling for the influence of religion on social capital.
Both authors wish to thank Luke Crowley, Jean-Paul Petraud, Jason Trimiew, David Thompson, Ill Hong Yoo, Justus Shoyero and Chris Wendell for outstanding help in the field with experiments and data collection, along with … for valuable comments and input on this research. Grant funding from the Jesuit Foundation and the McCarthy Foundation is gratefully acknowledged.

1
1. Introduction In recent years, economists have become increasingly fascinated by the role that social capital plays
in facilitating economic transactions. Particularly in communities that are relatively homogeneous
and close-knit, social capital may facilitate a general sense of trust and goodwill surrounding
economic exchange. Social capital may also facilitate the flow of information, serving a screening
function that curtails adverse selection. Further, it may help hold people more accountable for
their actions, mitigating moral hazard as economic decisions are placed within the context of long-
term relationships, and where reputation is important.
Understanding the effect of social capital on economic decision-making has been the
subject of a broad literature. This literature has pointed to the positive effects of social capital
on economic growth (Knack and Keefer, 1997), reducing corruption (LaPorta et. al., 1997),
community governance (Bowles and Gintis, 2002), preventing crime (Case and Katz, 1991),
curtailing moral hazard in the workplace (Ichino and Maggi, 2000), and financial development
(Guiso, Sapienza, and Zingales, 2004).
Yet it is often the case that social capital variables are endogenous to outcome variables,
presenting a challenge to causal inferences. Some rigorous studies on the economic effects of
social capital have used instrumental variables to address problems of correlated unobservables
(e.g. Knack and Keefer (1997) or exploited differences in regional social capital within a country to
identify its effects (e.g. Putnam, 1993; Ichino and Maggi, 2000). Our study addresses the challenge
of causal inference through experimental methods. We carry out a group lending experiment in
five countries with five very different cultural contexts to test the effect that different types of
social capital have on an individual's propensity to contribute to a joint liability loan.
Our experiments were carried out in Armenia, Guatemala, Kenya, India, and the
Philippines among a total of 1,554 participants in 259 simulated borrowing groups across these
five countries. In our group lending experiment, each subject in a group is given a "loan" and then

2
must choose a ball at random from a black bag that contains five green balls and one red ball.
Drawing a green ball means a successful investment from which the subject earns a positive
return, giving the subject the opportunity to contribute to the repayment of the group loan.
Drawing the red ball implies a negative shock to the borrower in which the borrower is unable to
pay her share of the group loan. Subjects choose balls with replacement, so that there is a one-
sixth probability that any of the subjects draws the red ball, even after it has already been drawn.
If at least half of the subjects in a group contribute, group lending continues for a subsequent
round with each member receiving an additional loan. This process of group repayment, if
sustained for more than a few rounds, can make each member better off relative to non-
repayment, if their non-repayment triggers group loan termination. Consequently, each individual
faces a trade-off between contributing to the group loan (to help the group to continue to receive
loans) and withholding her contribution (increasing her individual payoff for a particular round).
Because each group lasted an average of 6.86 rounds before breakdown from insufficient
repayment occurred, our study generated 10,662 observations from which to draw in our analysis.
Our five-country experiment is designed to examine the more general question of the
effect of social capital on economic decision-making, but also to test some hypotheses in the
literature that are germane to microfinance and group lending. A number of theories have been
advanced in the field of microfinance seeking to explain why group lending is often associated
with high repayment rates. In short, these theories posit that a significant measure of the success
of group lending is derived from its ability to harness the social capital that is pervasive within
traditional societies in order to overcome credit market failures.1 Leading theories argue that
(1) Self-selection of borrowing groups implies an assortative matching process, based on local
information, in which safe borrowers join with other safe borrowers, while risky borrowers are
1 Some of the original work showing that the informational flows and close-knit relationships within traditional societies could overcome information asymmetries in credit markets was undertaken by Udry's (1994) study on credit relationships in Nigeria. Udry showed that the implicit terms of credit contracts were designed to accommodate shocks to both borrowers and lenders during the term of a loan, making them less sensitive to asymmetric information issues than credit contracts in more developed economies.

3
culled from the portfolio or are forced to internalize the consequences of their behavior, thus
mitigating adverse selection problems (Van Tassel, 1999; Ghatak, 1999); (2) Peer monitoring
between jointly liable borrowing group members helps mitigate the hidden action that spawns
moral hazard in credit transactions (Stiglitz, 1990; Banerjee, Besley, and Guinnane, 1994; Wydick,
2001); (3) Social ties and the resulting potential for sanctions between members may also help
mitigate moral hazard problems in joint liability lending contracts when borrowers enjoy a social
leverage with one another that extends beyond the lending contract (Floro and Yotopolous, 1991;
Besley and Coate, 1995).
Information about other people, about what they are doing, and the potential to
influence their behavior, each represent a different facet of social capital. Accordingly, we
designed our treatments in our group lending experiment around these phenomena. We
implemented group self-selection treatments as part of our work in three of our countries,
allowing subjects to bring a self-selected group of six to the experiment site with who then
formed their partners in the experiment. These self-selected groups comprised 16.1% of the
groups in Guatemala, 50% in Kenya, and 34.5% in the Philippines. In two of our countries,
some of our groups were comprised of actual self-selected group borrowers from a local
microfinance institution (MFI), in India (52.8%) and the Philippines (10.9%).
In two countries we implemented a monitoring treatment, comprising 14.5% of the
groups Guatemala and 25.4% in the Philippines. In our normal set-up, chairs were facing away
from the other subjects around a circle, so that subjects chose balls and made contributions
choices privately with the experimenter. In the monitoring treatments, subjects performed both
of these tasks in front of the group so that others could observe not only what color ball each
drew, but whether or not another member drawing a green ball was choosing to use her good
fortune to contribute to the group loan. After observing contributions of the other members,

4
we allowed subjects to alter their decisions by flipping contribution decision cards until subject
decisions converged to a Nash equilibrium.
To test for the importance of social ties, social homogeneity, and the potential for social
sanctions on economic behavior, we exogenously formed the remaining groups in terms of
homogeneity and heterogeneity over key social reference groups. In our 26 groups in Armenia,
we formed groups exogenously over a main source of social conflict in that country, between
pre-Perestroika and post-Perestroika generations. In Guatemala we formed homogeneous and
heterogeneous groups based on subjects' residence in one of two rival towns adjacent to one
another. Because evangelical Protestants now make up nearly half of the country's population,
we also purposely formed homogeneous and heterogeneous groups of evangelicals and of
Catholics, with each subject announcing his or her residence and religion to the others as part of
a personal introduction before the experiment. In 23 of our 46 groups in Kenya we did the
same with Muslims and Christians, and similarly in 30 of our 55 groups in the Philippines with
homogeneous and heterogeneous groups of Muslims and Christians. Our Indian site was the
most religiously diverse, and in 33 of our 70 groups in Chennai we created homogeneous groups
of Hindus, Muslims, and Christians along with groups of half Hindus and Christians and half
Hindus and Muslims.
In each of our country sites we had subjects fill out a survey in which they answered
questions about the depth of their relationship with others in the group, how long they had lived
in the area, questions regarding the depth of their religious commitment, their views of people
from other groups, answers to the three standard questions on societal trust from the General
Social Survey, and information on other standard control variables.
We will summarize briefly some of the main results from our study, providing more
results and more details of these results in the main body of the paper. In general we find some
basic factors to influence contribution decisions in virtually every context. For example, we find

5
widespread evidence of reciprocity: Subjects who have been victim to a greater number of
negative shocks (red balls) contribute more often when they draw a green ball and have the
opportunity to contribute. In virtually all of our countries we find a positive correlation between
a person being more trusting of others in society (based on their answers to the standard GSS
questions) and group loan contribution decisions. Across countries, we generally find age to
facilitate the rate of contribution, and education level to be irrelevant. We also find in our group
self-selection treatments that when subjects self-selected with borrowers with whom they knew,
contribution rates increased. But there are also a number of surprising results, some of which
yield new insights into the relationship between social capital and economic decision-making.
One of the starkest results from our study regards the dramatically lower rates of
individual contribution rates and lending group duration in the Nairobi, Kenya experiments
relative to the other country sites. While the average individual contribution rate (contributions
to the group loan after drawing a green ball) for the 1,278 subjects in the other four countries
was 87.5%, among the 276 subjects in Nairobi it was only 41.8% (p =0.000). While contribution
rates in the other four countries were sufficiently high that the average experimental borrowing
group was able to continue to receive loans for 7.95 rounds, in Nairobi the average group
duration was only 1.80 rounds (p =0.000). The explanation for this substantial difference
became clear from the exit interviews carried out with subjects after game play. Subjects in
Nairobi began the experiment with the belief that others would fail to contribute to the group
loan. We demonstrate that given this belief a decision not to contribute is rational, but in Kenya
such priors created a self-fulfilling prophecy in which lending was terminated at an early stage,
and final payoffs to the subject/borrowers were much lower than in the other countries.
One of the most important findings from our study is that the effects of different types
of social capital are highly contextualized. Furthermore, much of the evidence from our study
points to the danger of over-generalizing about the nature of social capital in developing

6
countries and its effect on economic behavior. That different aspects of social capital appear to
exhibit diverse effects across cultures suggests the external validity of work in behavioral
economics and social capital carried out in a single context may be quite limited. In this respect
our results support existing research such as Henrich et. al. (2001), in which the authors found
substantial differences in plays of the ultimatum game when carried out in 15 different small-
scale societies across Africa, Asia, and Latin America.
Our data indicate that the importance of social homogeneity to economic decision-
making is fairly weak, and seems to depend on context. In certain areas of our study
homogeneity seems to matter significantly to group loan contribution, in other areas only a little,
and in most contexts it doesn't seem to matter much at all. For example in Guatemala, in some
of our estimations belonging to a borrowing group that was homogeneous in religion was
significantly influential in inducing subject contributions to the group loan, but in India and the
Philippines homogeneity of religion played no significant role.
We find moreover, that certain facets of social capital may exhibit surprising effects,
which may generate unanticipated Nash equilibria when isolated for study in group interaction.
An example from our study concerns the effects of monitoring. Unlike our normal treatments
in which subject shocks and contributions were hidden information, in our monitoring
treatments subjects observed the color of the ball drawn by each member of the group in each
round as well as their contribution decision. Our prior, based on standard theory, was that we
would find little if any instances of defection with perfect monitoring. Yet what we find is that
mutual monitoring did not improve repayment rates in the experiment, and in the Philippines
resulted in lending being terminated an average of three rounds earlier than without monitoring.
Indeed there appear to be two counteracting effects from monitoring: a "shame" effect, which
tends to encourage members to contribute (especially when others in the group are
contributing), and a "retaliation" effect, in which other members were observed to flip their

7
cards en masse towards non-repayment when observing a defecting member drawing a green ball
and choosing not to repay.2 Because the latter typically resulted in immediate termination of
lending to the group, we find that the retaliation effect at least counteracts the shame effect, and
if anything outweighs it.
Another finding from the study that is perhaps less surprising is that real-world
microfinance borrowers are different from the general population in important ways: In both
India and the Philippines, where we included real-world microfinance borrowers in a large
fraction of our experimental population, their rates of contribution were significantly higher than
our remaining sample of subjects who fit the external profile of microfinance borrowers based
on observable characteristics, but were not actual microfinance borrowers. Moreover, we find
that subjects from real borrowing groups who had already taken loans contributed at a higher
rate than borrowing groups in our study who were formed, but hadn't yet taken loans, evidence
that group lending seems to not only harness social capital, but create social capital in the process
of joint borrowing and repayment. Such results give us reason to think this phenomenon may
apply in other contexts as well; economic activity may very likely create social capital rather than
just simply harness existing social capital to facilitate transactions.
In this study we try to test for the importance of spiritual capital as opposed to strictly
social capital. The direct effect of religion on economic behavior (while setting aside its effect on
creating greater social cohesion) has been the source of an increasing body of work in
economics.3 The subjects in our group come from five distinct religious categories: Hindu,
Muslim, Catholic, Evangelical/Protestant and secular non-religious persons living in a post-
communist state (Armenia). Most of our country sites were chosen in part because they
contained some degree of religious diversity, allowing us to examine associations between
2 The retaliation effect witnessed in our experiment can be compared to that which has been documented repeatedly in experiments using the Ultimatum game, in which players often reject a positive offer from an initial player at a cost to themselves. See, for example, Guth and Tietz (1990). 3 For an excellent review, see McClearly and Barro (2006).

8
religious affiliation, depth of religious practice, trust, and implicit trustworthiness of others when
religion is common knowledge between subjects. What we find is that controlling for other
variables, evangelical Protestant borrowers appear to exhibit higher group loan contribution
rates in Guatemala and Kenya, although the overall effect across countries is not significant due
to a lack of significance in India. However, contribution rates do not seem to increase among
evangelical Protestants with greater religious commitment. In Mann-Whitney tests for simple
differences in means, we find Catholic and Hindu subjects to exhibit significantly higher
repayment rates than others, but we find that these higher repayment rates are primarily a
function of religion adding to social capital. Because regression results control for other factors
such as education, gender, generalized social trust, and so forth, social variables absorb some of
the variation that may embody important characteristics of those pertaining to these religious
categories. We also find that Muslim subjects to exhibit significantly lower contribution rates in
our sample both in OLS estimations and in Mann-Whitney tests against non-Muslims.
Following this introduction, Section 2 of our paper presents a description of our group
lending experiment, experimental settings in our five country sites, and an analysis of the
strategic interdependence characterizing the experiment. Section 3 examines our main results
across our five country sites, focusing on the social homogeneity, monitoring, and self-selection
treatments carried out in the experiments. In Section 4 we add variables to our basic framework
that include religion and depth of religious commitment to try to separately analyze the effect of
religious belief and the perceived belief of others as factors in group loan contribution. Section
5 summarizes and concludes.
2. The Experiment 2.1 Experimental Design
The group lending experiment that we employ in each of the five country sites is the group
lending game originally developed by Abbink, Irlenbusch, and Renner (2006) with some

9
modifications and adjustments for particular treatments. We favor the game because it
contains three important properties that capture key aspects of group lending: The first is that
it incorporates dynamic incentives. Field research has indicated that a major reason borrowers
repay group loans is to maintain access to future loans.4 The second is that it incorporates a
key form of moral hazard: difficultly in eliciting repayment even when a project yields a
sufficient return. The third is that the structure of the game allows for private information;
investment shocks are private information in the standard execution of the game, but the game
can easily be adapted to allow for a peer monitoring treatment.
Our experimental setup consisted of a circle of chairs facing away from the center of
the circle (except for the monitoring treatments, in which the chairs faced inward.) Each
member of the group introduced him or herself to the other five members of the borrowing
group, giving a short introduction which included his or her religion.5 The experimenter read
directions, answered clarifying questions, and carried out three pre-determined trial runs of the
experiment with the group, asking questions to the subjects after the trial runs to ascertain
their knowledge of how the experiment worked.
In the experiment each of the six subjects is given a "loan" equal to approximately
US$0.50. For example, in India the initial loan to each subject was 20 rupees. This creates a
jointly liable loan for 120 rupees that must be repaid at 20 percent interest for a total of 144
rupees. The experimenter then passes a black bag with six colored ping-pong balls to each
subject, who draws one ball, notes the color of the ball with the experimenter, and then returns
the ball to the bag. The color of the ball is then marked with ink on a card held by the subject.
There are five balls in the bag, five green and one red. Except in the case of the monitoring
treatment, only the experimenter and the subject know the color of the ball each has randomly
chosen. After the subjects have chosen balls, the experimenter makes another trip around the
4 See for example, Wydick (2001) which reports that 86% of microfinance borrowers when asked why they choose to repay their share of a group loan respond that they do so to maintain access to MFI credit. 5 Religious introductions were performed in Guatemala, Kenya, India, and the Philippines.

10
circle to record the contribution of each group member to the joint liability loan. If the subject
draws a red ball, the subject receives a negative shock on her investment; she loses her principal
and cannot repay her share of the group loan. If she receives a green ball, then must choose
whether or not to contribute to repayment of the loan by displaying a decision card privately to
the experimenter. For example in India (the Philippines), the payoff to a successful investment
was 48 rupees (pesos). With all six members contributing to a loan in India, each member would
contribute 24 rupees to pay off the 144 due on the loan and keep 24 rupees. However, if the
number of contributors is smaller, as with real-world group lending, the contribution of the
other members must increase.
For example, in India if the number of contributors ended up being four, each would
have to contribute 36 rupees, while keeping only 12 rupees as a payoff from that round. Since it
requires 144 rupees to pay off the group loan, full repayment is impossible if fewer than three
borrowers contribute to repayment. Thus if three or more borrowers contribute, the group
receives another loan in a subsequent round, but if less than three contribute, lending ceases and
the experiment ends with subjects receiving their payoffs accrued from each round. Subsequent
to each round, the experimenter informed players about the total number of contributors (but
not their identities), and if repayment was sufficient to foster another loan. After the
experiment, subjects filled out a questionnaire with approximately 50 questions pertaining to
demographic, social, and religious variables, including the three standard General Social Survey
questions gauged to ascertain an individual's level of societal trust.6
There were minor differences in the way our research team implemented the group
lending experiment in the different country sites. We attempted to create similar payoffs
6 We used three GSS questions in each country that included the question on trust “Generally speaking, would you say that most people can be trusted or that you can't be to careful in dealing with people?”, the question on fairness, "Do you think most people would try to take advantage of you if they got the chance, or would they try to be fair?", and the question on helpfulness, "Would you say that most of the time people try to be helpful, or that they are mostly just looking out for themselves?". Because these questions are highly related, in our estimations we create a composite index equal to the number of answers reflective of a positive level of societal trust from the three questions.

11
between countries such that if a group was moderately successful (say, lasting six or seven
rounds), the net payoff to each subject would equal approximately one day's wages in the course
of less than two hours. Members of groups lasting more than ten rounds, however, earned up
to two or even three days wages in some cases, but cross country differences were not exact.
Moreover, the experiment is most easily carried out when using numerical payoffs easily divisible
by as many small integers as possible, such that an exact cross-country conversion was infeasible
in any respect given the use of five different currencies.
Secondly, our research team was divided across countries, so that at each country site,
the experiment was carried out by two or three different experimenters (with some overlap), so
that while we made every effort to minimize differences in execution between countries through
uniform training sessions, small differences in presentation undoubtedly exist.
Another difference concerned our effort to minimize the tendency toward end-game
defections manifest in any finitely repeated game. After the 10th round (sixth round in
Armenia), slightly different devices were used to bring the experiment to a close in different
countries. In Armenia and Guatemala, a coin was flipped so that there was only a one-half
probability of continuing to the next round. In the Philippines and India, the probability of a
negative shock to a borrower's experiment increased from 1/6 to 1/2 after the tenth round,
generating approximately the same probability of termination. In Kenya, lending groups
collapsed sufficiently in early pilot testing that no such device was deemed necessary. All of
these end-game implementations were unannounced to borrowers at the beginning of the game,
except in Armenia where borrowers knew that the probability of continuation would be one-half
beginning in the seventh round. Interestingly, while the theory of finitely repeated games would
predict higher rates of defection in such a setting, group loan contribution rates in Armenia were
91.8%, second only to Guatemala.

12
While any significant impact from these differences should be absorbed by the country
fixed effect, any specifically cross-country analyses should take these caveats into consideration.
2.1 Sites and Subjects
In each of our country sites our subjects were borrowers who fit the typical profile of a
microfinance borrower: living in a relatively poor neighborhood with relatively low levels of
formal schooling, average age about 34 years old, and disproportionately women (80.8 percent).
Subjects were typically recruited in collaboration with local NGOs (non-government
organizations). In India and the Philippines we ran a large fraction of our experiments on actual
microfinance borrowers who were current borrowers with a local MFI, such that real
microfinance borrowers make up 16.6 percent of our subjects in the study as a whole. Some of
the non-microfinance borrowers had participated in programs of the local NGO or were
recruited off the street for the experiment. When we ran treatments allowing for self-selection
of borrowers, we spread the word generally among a segment of the local population fitting our
profile, giving a rough description of the activity, and encouraged subjects to arrive at the
experiment site in self-selected groups of six.
Our study provides a rich variation of contexts to study the effects of social capital on
economic decision-making:
2.1.1 Berd, Armenia
The data from our 26 groups in Armenia, which formed the basis for our initial study
using the group lending experimental methodology (Cassar, Crowley, and Wydick, 2007),
comprises only 6.25 percent of the observations used in the present five-country study.
In Armenia we carried out our experiment at the Artig Business Company in Berd, Armenia
(population. 8,700) in April, 2005. All of the subjects in Armenia were women, and in Armenia
as in the other country sites, subjects were required to be at least eighteen years old. Because of
the strident changes in Armenian culture since the collapse of the old Soviet Union, the biggest
13
social division between local residents was generational: pre- versus post- Perestroika
generations, where the difference in social outlook and social values was said to differ between
the two considerably. We therefore randomly assigned subjects to groups to exogenously
generate measures of generational diversity.
2.1.2 San Pedro Atitlan, Guatemala
Our 62 group experiments in Guatemala were carried out in the adjacent towns of
San Pedro Atitlan and San Juan Atitlan (population of both approximately 4,000) in June-July,
2006. In Guatemala 90.1 percent of our subjects were women, none being recipients of
microfinance loans. All of our subjects were of Mayan ancestry, typically speaking the native
Tzutujil as a first language and Spanish as a second language. Many female subjects earned income
from weaving traditional clothing and selling it to local buyers. Other occupations for female
subjects included selling bread on the streets to tourists or operating small, family stores. Men in
the area typically make a living harvesting coffee, in construction, or in the local tourist industry.
In Guatemala, 10 of the groups were self-selected, but in the remainder we formed groups that
were purposely homogeneous and heterogeneous by religion, since a major social division in
Guatemala lies between Evangelicals and Catholics, who each make up about 50 percent of the
population in the Western Highlands. There is also considerable rivalry between the two
neighboring towns due to conflicts over ownership of coffee-growing land. Therefore we also
created groups that were homogeneous and heterogeneous by town of residence so that in each
group we had two parameters of possible heterogeneity, by religion and by town. Among nine of
the groups in Guatemala we randomly carried out the monitoring treatment, in which subjects
could observe positive and negative investment shocks and the contribution decisions of others.
2.1.3 Chennai, India
We carried out the experiment on 70 groups in Chennai, India (formerly known as
Madras, population 4.3 million) in coordination with Growing Opportunity Finance, a local MFI

14
affiliated with Opportunity International, a major worldwide microlender. The experiments
were carried out in December 2006 and January, 2007. Out of the 70 experimental groups, 37 of
them were groups of six borrowers taken from actual microfinance borrowing groups. Because
borrowing groups with the institution averaged 15-20 members, we often created two or three
experimental groups from a single real-world borrowing group. The remaining 33 groups were
made up of non-MFI subjects, but who fit the general microfinance borrower profile. From
these we created exogenously formed groups that were homogeneous and heterogeneous with
respect to the three major religious groups in Chennai: Hindus, Christians, and Muslims. In
Chennai itself, the distribution of the population by religion is approximately 82 percent Hindu,
9 percent Muslim, and 8 percent Christian, the most notable social division in local culture. The
distribution of groups we formed based on religion was as follows: 10 homogeneous groups of
all Hindus, 6 homogeneous groups of all Christians, 9 heterogeneous groups of three Christians
and three Hindus, 3 homogeneous groups of all Muslims, and 5 heterogeneous groups of
Muslims with either Hindus, Christians or both.
2.1.4 Nairobi, Kenya
In Nairobi (population 2.9 million), our experiment was carried out on 46 experimental
groups at two experimental sites, one in Kibera, an inner-city slum of Nairobi and another site
on the outskirts of the city, in Ongata Rongai. The experiments took place July-August 2006
and January-February 2007. Nairobi has experienced a tremendous amount of population
inflow from outlying areas in Kenya, and even from neighboring countries where there has been
civil unrest. Estimates of the percentage of Muslims in Kenya vary, but the consensus seems to
be that approximately 10% of the population is Muslim, where in some areas tensions run high
between the two groups. To test for the effects of social homogeneity, Muslims were over-
represented in our sample. With exactly half (23) of our groups, we created groups that were
either all-Muslim or all-Christian or half of each. The remaining 23 groups were self-selected,

coming to the site together to participate in the experiment. The Nairobi experiment had the
highest percentage of male subjects (58.7 percent), and while we ensured that all of the subjects
fit the general microfinance borrower profile, none had participated in a microlending program.
2.1.5 Davao, Panabo, and Cotabato Cities, the Philippines
Each of the three sites for our 55 groups from the Philippines was located on the island
of Mindanao, a region of the Philippines well-known for tensions between Muslim and Catholic
social groups. From decades of fighting between Muslim separatist groups and the Philippine
army, religion has become a transparent social distinction on the island. Experiments were
conducted on sites in Davao City (population 1.4 million), Panabo City (population 134,000) and
Cotabato City (population 162,000). Participating in the study were 11 (exogenously formed)
homogeneous Catholic groups, 10 homogeneous Muslim groups, and 9 heterogeneous groups
with three Muslims and three Catholics. There were also 25 self-selected groups, 14 of which
received the monitoring treatment. Of the 11 self-selected groups without the monitoring
treatment, six were new microfinance borrowers involved with the Panao Multi-Purpose
Cooperative, an MFI, while the remaining self-selected groups were taken from local vendor's
market associations. The subjects in the Philippines were 70.1 percent female.
2.2 Understanding the Incentive Structure of the Group Lending Game
15
}
A brief analysis of the experiment helps to understand the incentives faced by subjects,
which, as we will demonstrate, replicate some of the important aspects of the strategic
interdependence involved with actual group lending. Let represent a borrowing
group of N members denoting as a representative member. Further, let p represent the
probability of a successful investment by any member, a probability that is constant and
independent across i. R is the gross return on an individual investment, and D is the collective
amount due on the group loan between the N members. Note that the game is always calibrated
{ NG ,...2 ,1=
Gi ∈

such that 2
RND = , i.e. that at least half of the group must contribute for the loan to be repaid,
and for lending to continue for another round. Further, let n represent i’s expectation about the
number of the other N -1 members ~i in G who will contribute to the loan given a successful
investment, and let k be the actual number of contributors in a round given the probability (1 – p)
of a failed investment.
The Contribute strategy yields a lower payoff to a subject for the immediate round, but
results in an expected probability δC that at least 2N members contribute to the group loan
repayment in that round. The Withhold strategy results in a higher (per round) payoff of pR, but
reduces the likelihood of a subsequent loan to δN < δC. Given these probabilities δN and δC of
continuation, the Contribute strategy will yield a higher payoff than a Withhold strategy if
( )NC
pRRp
pn
NR
δδ −>
−
⎟⎟⎠
⎞⎜⎜⎝
⎛ −+
1112
, where given N = 6 we have (1)
( ) ( )( ) ( ) ( ) ( ) ( )
( ) ( ) 1211011
2
0
11
!2 !1!11
!1 !!11
!0 !1!11 1 −+−+
−
=
+−
−++−++−
++=−−= ∑ nnnknk
N
k
n
kC pp
nnpp
nnpp
nnppδ
and ( ) ( ) ( ) ( ) ( ) ( ) 221101
2
01
!2 !2!1
!1 !1!1
!0 !!1 1 −−−
−
=
−−
+−−
+−=−−= ∑ nnnknk
N
k
n
kN pp
nnpp
nnpp
nnppδ .
By substituting in our probability p = 5/6, we can use (1) to obtain the optimal strategy
for subject i given the number of the remaining five players she expects will contribute to the
group loan when they are able. What becomes clear from this exercise is that as n grows, the
optimal strategy of member i switches from Withhold to Contribute. Clearly when beliefs are
such that n ≤ 2, it is optimal for i to play Withhold. Because the game will end after the current
round, the payoff from contributing is zero and the expected payoff to Withhold is pR, or,
normalizing R to unity, 0.833. When three other players contribute, using (1) we find that the
expected whole-game payoff from Contribute is 0.90 and from Withhold it is 1.98; thus with
16

17
n = 3 it still pays to Withhold. With n = 4, however, Contribute begins to edge ahead of
Withhold, yielding 7.22 versus 6.32. At n = 5, Contribute yields an expected whole-game payoff
substantially greater than Withhold, 40.16 versus 23.48. This creates an incentive structure in
which optimal strategies are governed by expectations about others. Consequently, trust
between members is thus crucial to cooperative play, sustainability of the exercise, and,
ultimately, payoffs.
But like real-world group lending, beliefs about the motives and strategies of other
members are likely to change as the exercise progresses. Group members will update their
priors about others’ play based on the number of contributors k announced at the end of each
round. If, for example, the number of contributors is consistently averages less than five out of
six, then a prior that all of the other members are playing the Contribute strategy may be revised
downward.7 A large number of non-contributors in a particular round (which plausibly could
have been caused by the bad luck of several negative shocks to investments) may quickly trigger
a subsequent round in which group members revise their priors over n downward, inducing
them to play the Withhold strategy, and thus ending the game abruptly.
3. Results: Does Social Capital Matter? 3.1 Subject Backgrounds
Figure 1 shows group duration by round for each country. We present data on
experimental outcomes, personal characteristics of subjects, treatments, social capital and
religion variables for each country and for the entire study in Table 1. The mean age of our
subjects varied little between the five countries, ranging from 31.4 years in Kenya to 36.1 years
in Armenia with a standard deviation equal to approximately 10 in all countries. Education,
however, very substantially with the average subject lacking middle school education in
Guatemala, but having middle school education in Armenia and somewhat beyond this in the
7 This would hold true, of course, if member i is playing the Contribute strategy.

18
Philippines. The fraction of female subjects ranged from 0.45 in Kenya, 0.70 in the Philippines,
and 0.90 in Guatemala, to entirely female in Armenia and India.
The average fraction of a subject's life lived in the region of the experiment varied from
0.41 in Kenya, where many slum dwellers had relocated to Nairobi from outlying areas, to 0.946
in Guatemala, in which there is traditionally very little mobility between rural towns. In Armenia
the average number of other subjects in the six-person experimental group known by a subject
was only 1.43, in the other four countries it ranged between 3.20 and 3.54 out of five. Roughly
half of our subjects operated their own enterprises in the sample (about two-thirds in India), and
about one quarter were wage workers (just over a third in the Philippines).
The fraction who had experience taking a formal loan varied substantially between the
five countries: 0.051 in Armenia, 0.100 in Kenya, 0.176 in India, 0.339 in Guatemala, and 0.423
in the Philippines. We compiled a simple index of societal trust for each subject based on the
number of "yes" (trusting) answers to the three standard GSS questions. The level of societal
trust varied somewhat between countries, but not overwhelmingly, ranging from 1.33 (lowest
trust) in Kenya to 1.87 in the Philippines. Overall Hindu subjects made up 18.8% of our total
sample (coming only from India), Muslims made up 18.5% of our sample (coming from India,
Kenya, and the Philippines), Catholics 31.2% (in Guatemala and the Philippines), and
Evangelical Protestants 27.9% (in Guatemala, India, and Kenya).
3.2 Influence of Social Capital on Repayment Decisions
We present here three basic sets of estimations: (1) On individual contributions by
round8 given that a subject had a successful investment and had the opportunity to contribute;
(2) On the total number of contributions by each subject divided by the number of
opportunities to contribute; and (3) On the duration of groups in the experiment in terms of
8 The number of rounds on which we take estimations in Table 2 excludes the first round because we incorporate lagged shock variables; we also exclude all rounds after 10 in all estimations because of the diminished probability of continuation after this point and subjects' then-realization of this fact.

19
number of lending rounds, where higher contribution rates generally lead to more rounds of
borrowing. Each offers distinct advantages in yielding insight into the effects of social capital
variables and group interaction on group loan contributions. The advantage of pooled logit
estimations on individual contributions by round (given in Table 2) is that they are able to
incorporate situation-specific attributes in the experiment such as responses to previous period
shocks to self and others. The disadvantage with these estimations is that they overweight the
contribution decisions of individuals in "successful" groups that were able to receive loans for
more rounds. For this reason we view the OLS estimations on average individual contribution
rates (given in Table 3) as perhaps the best measure of individual responses to social variables.
Table 4 shows regressions based on group longevity in the experiment. The advantage with
these estimations is that in some sense they do capture the "success" of a group based on
individual and social characteristics and treatments. However, because a random confluence of
negative shocks may play a leading role in terminating lending in any particular round, the
estimated effect of social capital variables on decision-making is less precise.
3.3 Country Differences
As seen in Table 1, there are substantial country differences in outcomes between our
country sites. Contribution rates were 94.4% in Guatemala, 91.2% in Armenia, 88.0% in India,
78.7% in the Philippines, but only 41.8% in Kenya. These differences seem to be consistent
with the expectations that group members took into the experiment about the behavior of other
members. Based on (1) group members should contribute to the loan if they believe at least
four of the other five members will contribute to the loan when they draw a green ball. In four
of the five countries, this appeared to be the case, although at any point in the experiment, a
confluence of red balls drawn in one round may have caused those expectations to be revised
downward. However, in each country we randomly carried out exit interviews with subjects
asking them to tell us to explain their repayment strategy for the game. It was clear from these

20
interviews in the Nairobi sites that subjects frequently played the Withhold strategy from the
onset of the game because they believed other group members would do likewise. These priors
coming into the group lending game created a set of self-fulfilling prophesies that resulted in 32
of the 46 groups terminating after the first round. The lack of confidence in fellow group
members greatly reduced the whole-game payoffs for all members in the Kenya experiment
relative to the other countries. Subjects playing Withhold in groups that failed in the first round
earned 100 Kenyan shillings. In contrast, group members in the solitary group that reached 10
rounds in Kenya earned about 450 shillings, comparable to what subjects earned in the other
countries with higher contribution rates.
3.4 Response to Negative Shocks
As seen in Table 4, negative shocks to investment (random drawings of red balls) have a
strong and significant effect on the longevity of groups. Especially when a random cluster of
red balls are drawn in a single round it can either terminate the game by its own accord
(especially when combined with one or more group members playing Withhold), or result in a
downward revision of priors about the rate of contribution among other members. Based on
the latter phenomenon, we would expect the propensity to play Contribute to decline based on
the number of shocks to others in previous rounds. We observed a remarkable example of this
in India, where, by random bad luck, three of the six members of the group drew red balls in the
first round (an unlikely event with probability 0.0046), while the other three drew green balls and
chose to repay. Since this was a normal run of the experiment without monitoring, of course
each member had reason to believe such an event was caused by a large number of other
members playing Withhold in the first round. In the second round, four members then chose to
play Withhold, ending the game. As seen in the individual and round-level logit estimations in
Table 2, this phenomenon is manifest in Guatemala, but not significantly in the other country
sites. This phenomenon may be counteracted in some instances, where to some subjects it may

21
seem increasingly important to contribute when the game is teetering on the brink of
termination.
We find some evidence of reciprocity in the data. The more negative shocks a subject
receives, the more likely she is to contribute to the group loan when she has an opportunity to
contribute. In Table 3 the coefficient on "Mean Shocks Received--Self" is positive in every
country (except Kenya), significant at p < 0.05 in Armenia and India and p < 0.01 in the entire
five-country estimation. We were surprised, however, at the rationale some subjects used to
justify their decisions in exit interviews. One subject in India maintained that she played
Withhold subsequent to receiving a negative investment shock to make up for the lost income
from the previous round.
3.5 Personal Characteristics
We generally found personal characteristics to have relatively little bearing on a subject's
decision to play Contribute or Withhold. A possible exception is age, which was positively and
significantly associated with higher contribution rates in Kenya in the individual and group
estimations in Tables 2, 3, and 4, and of borderline significant in the Philippines and in Kenya in
the group estimations. The measured effect, however, appears fairly large in the group
estimations, where a one-standard-deviation increase in the mean age of a group (5.08 years in
Kenya, 6.36 years in the Philippines) is associated with a 1.03 and 0.87 increase in the number of
rounds a group was able to sustain loan repayment.
We find little effect on group loan contribution from additional years of education
among our subjects across countries. The coefficients on education carry roughly equal positive
and negative (insignificant) signs across countries, positively significant only in group estimations
in Kenya at just the 10% level.
Just over 80% of our 1,554 subjects were women. Table 7 shows overall mean
contribution rates of women in the study to be dramatically higher than men, 79.7% to 57.3%, a

22
finding entirely consistent with the established wisdom in microfinance that women repay
microfinance loans at higher rates than men. Interestingly, however, while the coefficient on
gender has a positive sign in virtually every estimation, it is significant only in the logit
estimations in Table 2 in Guatemala, and only at the 10% level, the reason being that control
variables such as trust measures absorb some of the higher repayment performance of women.
3.6 Economic Characteristics
Our prior coming into the experiment was that business owners might display higher
contribution rates than wage earners. But the data from our experiment not display any
systematic associations between general labor force delineations (wage earners and business
owners) and contribution rates in the group lending game as seen in Tables 2, 3, and 4.
Contribution rates were generally insignificant for business owners across countries. For wage
workers we find no identifiable pattern of significance across countries.
Previous experience with formal borrowing also displays no consistent effect across
countries on individual contribution rates. While in Guatemala the association is positive at the
5% level, the Philippines yields the opposite result. For the other countries the relationship is
insignificant. In the estimations on group longevity, there appears to be a weakly positive
relationship between previous borrowings in India, but it remains negative in the Philippines.
3.7 Social and Trust Variables
Three of our control variables attempted to capture very general aspects of social capital
amongst our subjects: fraction of a subject's life lived in the region of the experiment, number of
acquaintances within the experimental borrowing group, and general societal trust as measured
by responses to three standard questions from the General Social Survey (GSS). Results from
the estimations yields no identifiable pattern across countries for the first two variables, although
personal acquaintance matters to contribution rates in Guatemala (p < 0.01), and the fraction of
life lived in the region seems to have some special contextual effect unique to the Philippines

23
with p ≤ 0.10 in both the individual estimations in Tables 2 and 3 as well as the group
estimations in Table 4.
We do, however, find responses to the GSS questions to have a highly significant effect
on contribution rates. The variable we create is a simple index of the number of affirmative
answers to the three GSS questions that concern whether they generally believe that others in
society are (1) trustworthy, (2) fair, and (3) helpful. The GSS coefficients have the expected
positive sign for every country in every estimation, and are significant on the individual round
estimations at the 1% level in Guatemala, Kenya, and the Philippines, and for the five-country
estimations on individual contribution in Tables 2 and 3.
The significance of general social trust within one's societal context yields some general
insights for economic development: Across our five experiment sites, subjects were acquainted
with about 2/3 of the other subjects. Even if a subject were to believe every subject whom she
knows to be a contributor, a subject must possess some degree of trust in the contributions of the
unknown remaining 1/3 to rationalize her own decision to play Contribute. Here we uncover
some evidence in the links between trust, trustworthiness, risk, cooperation, and prosperity.
Kenya and Guatemala have the lowest reported scores on the GSS questions (affirmative answers
on 44.5 and 44.7% of the three questions compared with an average of 58.4% in the other three
countries). In Guatemala personal acquaintance with other group members appears to
compensate for a lack of general societal trust, helping to foster a 94.4% contribution rate.
However, in Kenya the number of acquaintances carries an (insignificant) negative sign; personal
acquaintance in the Nairobi slums fails to make up for a lack of general trust.
3.8 Group Homogeneity Treatments
While Cassar, Crowley, and Wydick (2007) found that clan homogeneity displayed a
significant effect on group loan repayment, we cannot find consistent evidence, controlling for
other factors, that group homogeneity fosters contribution rates in our five-country study. Our

24
treatments for homogeneity focused around what were perceived as the greatest social divisions
within each particular societal context. In Armenia and our treatments concerned the significant
societal tensions between the pre- and post- Perestroika generations. In Guatemala one of the
treatments concerned subject residency between one of two rival towns, San Pedro Atitlan and
San Juan Atitlan. Serious conflict has emerged over recent decades between these two small towns
over religious differences, specifically the larger number of Catholics in San Juan, and problems
associated with tourism and drug trafficking in San Pedro. Moreover, income from tourism in San
Pedro has been used to purchase coffee farms in San Juan, such that some of the workers of these
fields are no longer owners, but employees of the plantation owners in San Pedro.
Most of our heterogeneity treatments were implemented across religious boundaries, a
critical social delineation in four of our five countries. In Guatemala, we formed experimental
borrowing groups which were homogeneously Catholic, homogeneously Evangelical, and three
of each, with similar homogeneous and heterogeneous borrowing group treatments among
Muslims, Hindus, and Christians in India, Muslims and Christians in Kenya, and Muslims and
Christians in the Philippines. We did not take specific denominational data on Christians in
India, Kenya, and the Philippines, but the overwhelming majority of Christians in our subject
pool were Evangelical/Protestant in the former two countries and in Catholic in the latter, and
are classified as such in our estimations. We also included a variable for homogeneity of groups
by gender although this was not carried out as a specific treatment.
While we expected to find significant associations between our homogeneity treatments
and contribution rates/group longevity, we cannot find any consistent pattern of significance
across countries for groups homogeneous by religion, age, residence, or gender. Although in
Table 2 our Guatemalan individual estimations by round on religious homogeneity and town
homogeneity are statistically significant, the significance disappears in Table 3 for individual
contribution rates. This leads us to believe that their significance in Table 2 is inflated by a

25
disproportionate weight in these estimations placed on successful groups. The results are not
robust to an alternative specification that equally weights all groups.
3.9 Self-Selection Treatment
In Guatemala, Kenya, and the Philippines, we allowed subjects to form their own self-
selected experimental borrowing groups. These are distinct from the actual borrowing groups that
took part in the experiment in India and the Philippines. Our desire was to test whether self-
selection would be likely to increase contribution rates (Ghatak, 1999; Van Tassel, 1999). An
original implementation of the group lending game, among a population of university students,
showed that self-selected groups displayed greater volatility in outcomes, higher contribution rates in
early rounds, but with contribution rates falling (and groups collapsing) more rapidly in later rounds
(Abbink et. al., 2006).
What we find in our self-selection treatments is that self-selection alone does not yield an
improvement in contribution rates or group performance, and in fact by itself seems to have a
significantly negative effect (p < 0.01 in all five-country estimations). However, when we
interact the self-selection treatment with acquaintance between individuals, we find a strongly
significant and positive association with contribution rates and group performance from this
interaction: When subjects select others whom they know to become their fellow group
members, rather than randomly selecting strangers off the street, it matters. Because the latter is
what we would expect in a real-world group borrowing self-selection process, our results seem
to provide some evidence that self-selection is helpful to group lending repayment rates.
3.10 Monitoring Treatment
We believe one of the most interesting findings from our study is the effect of monitoring.
About 15% of our groups in Guatemala and 25% of our groups in the Philippines were
characterized by a monitoring treatment, in which the chairs of the subjects were re-directed
inward so that information about investment shocks (the color of balls drawn by subjects) and

26
contribution choices were observable to all. After subjects took turns drawing balls, the
experimenter elicited contributions simultaneously from group members by having them flip their
cards to Contribute or Withhold. Subjects were allowed to change their cards in response to the
decisions of others until the group converged to a Nash equilibrium, a process that usually took
less than one minute. Our prior before implementing the monitoring treatment was that no-one
would dare to play Withhold after publicly drawing a green ball. Our prior was incorrect.
First, we observed numerous instances of defections, even with public monitoring. As
Table 7 shows, the contribution rate of 73.8% with the monitoring treatment was insignificantly
different from the rate of the standard non-monitoring treatment in Mann-Whitney tests. We
observed two types of behavioral responses. In some groups, the contributing subjects appeared
to take a "grin-and-bear-it" approach with a solitary non-contributor, faithfully maintaining their
contributions to the group loan despite the brash actions of the non-contributor. This behavior
was maintained in several cases as non-contributors doggedly played Withhold throughout
experiments lasting seven rounds or more.
The other clear pattern both in the data and observed during the experiment was that a
Withhold decision by a group member would trigger a reciprocating response by a former
contributor, who would flip her sign to Withhold, which would generate a chain reaction of
Withhold plays by other players to end the game. It is somewhat unclear whether either the initial
reactions or subsequent reactions to a Withhold play were retaliatory or strategic in nature,
Withhold of course being the optimal strategy when it is clear decisions are being made in a final
round. The data clearly show contribution rates to be significantly lower in the final round of a
monitoring treatment, 0.528, than in the standard non-monitoring treatment, 0.576, (p < 0.01).
The estimations in Tables 2, 3, and 4 on the monitoring treatment dummy are mostly
insignificant, with a positive sign in Guatemala and a negative sign in the Philippines. However,

27
the overall effect in estimations on the five-country data reveals a significantly negative
relationship (p < 0.10) between monitoring and group longevity.
This finding contrasts with the literature on microfinance, which has often underscored
the importance of peer monitoring (Stiglitz, 1990; Besley, Banerjee and Guinnane, 1993).
However, what we observe in our experimental results is that the effects of peer monitoring are
not universally positive for individual contribution and group performance. Consider any
scenario in which players have an incentive to match strategies in effort or contribution when
there is imperfect information about the actions of peers. Perfect information may validate
members' claims of an inability to repay, preventing a cascade of non-repayment. But with
perfect information individual defections can quickly induce a downward spiral, especially when
revenge adds a non-economic motive for responding to defection with defection. With
imperfect information about true contribution decisions, a negative decision by one member
may not trigger a downward spiral of defections in response because other players may attribute
the defection to unavoidable mishap (the proverbial red ball). In the context of group lending,
coordination on the non-repayment equilibrium may ultimately yield the greatest disadvantage to
the lender, a point originally made by Besley and Coate (1995) about group lending in a full
information context.
3.11 Effect of Actual Microfinance Borrowing
We included a dummy variable in our estimations for experiments in India and the
Philippines that were carried out with actual microfinance borrowing groups. These borrowers
were affiliated with Panao Multi-Purpose Cooperative and Growing Opportunity Finance, respectively,
two well-established microfinance institutions in the respective countries. In estimations on
individual contribution rates, we find the coefficient on a subject being an actual microfinance
borrower to be positive in all cases and significant at the 5% level in India, indicating a
contribution rate that is 10.1 percentage points higher. We ask the question then, does this

28
positive effect appear to come from some type of self-selection into microfinance, or from the
cumulative experience of repaying actual microfinance loans together in a borrowing group, i.e.
does group borrowing activity harness existing social capital or create social capital?
To probe this question, we intentionally carried out some of our estimations on nascent
groups, who were newly formed, but in various stages of their eight-week orientation course.
They had not yet received actual loans. Other groups were veteran microfinance borrowing
groups with between one and five six-month loans under their belts. Mann-Whitney tests for
differences in contribution rates in Table 7 show contribution rates to be higher for experienced
borrowers relative to inexperienced borrowers 93.5% to 82.1% (p = 0.079).9 Including a
dummy variable for "experienced group" in an estimation of all experiments carried out on
actual microfinance borrowers in India, we find the contribution rates of the experienced group
members to consistently carry a positive sign in alternative specifications, significant at roughly
the 10% level in estimations that include our variables on religion, but not significant in all
specifications. (We do not include these results here for space concerns, but they are available
upon request.)
A likely reason for this result is that experienced members may have developed a
stronger sense of societal trust, and this greater level of trust was picked up by a higher rate of
positive response to the three GSS questions in the survey. In their responses, experienced
borrowers had an average of 1.82 positive responses while the average among the experienced
borrowers was 2.00. Thus while our regression results yield borderline results as to whether
social capital is created though the process of group borrowing and collective repayment, we do
uncover some evidence that microfinance lending is able to build social capital within borrowing
groups over time. The results of our experiments are consistent, for example, with those of
9 One possible explanation for this result would be that nascent borrowing groups include those that have not yet failed due to non-repayment, while veteran groups survive because they have been able to repay. However, borrowing groups in the area surveyed have exhibited virtually perfect repayment rates and very low levels of attrition, ruling out a difference caused by borrowing group failure or dropout.

29
Charness, Rigotti, and Rustichini (2007), who demonstrate in a series of experiments that group
membership and group identity have powerful effects on economic behavior, especially when
play is manifest to the relevant group, leading subjects to select options that favor the group.
These results are important for microfinance because they suggests that the all of the benefits of
microfinance may not be found simply through impact studies on individual household
consumption and welfare, but that there are externalities from group lending in the creation of
social capital that spill over into the larger community.
4. Spiritual Capital vs. Social Capital
Does religion have a measurable outside effect distinguished from its social effects? Questions
about the effect of religious beliefs on economic behavior have been the subject of inquiry since
Weber's famous Protestant Ethic (1905). Recently there has been a resurgence of interest in the
influence of religion on economic behavior. For example, McCleary and Barro (2006) carry out
empirical estimations on cross-country data to explore the relationship between religion and
economic growth. While they fail to find any positive and significant correlation between
religious attendance and economic growth, they do find beliefs in heaven (and particularly hell)
to have a positive influence on work ethic and, to some extent, economic growth. One aspect of
their study that seems particularly important is their attempt to distinguish the effect of religious
beliefs from the social capital associated with religious activity. Summarizing their research by
maintaining that “beliefs related to an afterlife appear to be crucial as economic influences,” they
conclude that the direct effect of spiritual beliefs appear to be greater than the social networks
that are part of religious activity.
This kind of attempt to distinguish spiritual capital from purely social capital is an
important step in trying to disentangle the many faceted influences of religion on economic
behavior. While religion may contribute to the creation of social capital through fostering
closer ties within a community, it may also create spiritual capital, the propensity to act

30
honestly or altruistically as motivated by religious beliefs irrespective of the social rewards or
punishments that accrue from such behavior via peers.
There are serious methodological challenges faced by researchers in trying to
understand the relationship between religion and economic variables. First, in some cultures
where genuine religious belief has fostered any kind of positive distinction in the ethical
behavior of adherents, incentives arise for others to claim religious affiliation if these claims
are a relatively inexpensive signal. Thus genuine belief that yields a more honest or ethnical set
of behaviors among adherents will naturally lead to a social equilibrium characterized by
hypocrisy of fraction who claim the faith (Wydick, 2008). Because there remain incentives to
claim adherence to that particular faith until the average behavior within the pool is sufficiently
watered down to equal that of the general population, naïve regression estimates that seek to
explain economic or behavioral variables from stated religious affiliation will underestimate the
true impact of genuine religious belief on behavior.
Second, however, there are serious problems with endogeneity issues in trying to identify
the relationship even between genuine religious belief and economic behavior. Wealth and
poverty may influence spiritual beliefs (perhaps justifying certain economic behaviors that have
led to the accumulation of wealth, or blaming outside factors for the perpetuation of poverty) or
it may be that both belief and a given type of economic behavior are caused by a third variable
such as non-religious culture or geography.
We make no claim in this study to be able to fully address these two problems, and
we know of no research which has been able to do so. Here we add a set of religious
variables to our estimations in Tables 2, 3, and 4 to our social capital variables. In an
attempt to address some of the issues related to the first concern, we not only include
religious dummy variables for Catholic, Evangelical/Protestant, Hindu, and Muslim, but also
a variable reflecting stated religious commitment (time spent in meetings, religious

31
attendance, etc.) and an interaction term between the two. Furthermore, we include a
variable for the number of other members from the perspective of subject i of the different
religious groups. Our aim from this exercise is to try to obtain a measure of trustworthiness
of those in a given religious group based on the judgment of peers within their community
who have a financial stake in the accuracy of their judgment. With respect to the
endogeneity issue, we believe that the use of experimental data overcomes the reverse
causality problem because unlike regular income, monetary payoffs from the experiment
should have no effect on belief. However, it is still conceivable that a missing third variable
could influence both contribution rates and beliefs not picked up via our controls for
personal characteristics, pure social capital, or country fixed-effects.
We carryout these estimations using Catholic as our base religious category, and we
exclude Armenia from our estimations because our survey there did not track religious variables.
What we discover in the OLS estimates given in Tables 5 and 6 is that the sign on the dummy
for Evangelical/Protestant is uniquely positive across our three countries where evangelicals
took part in experiments. The positive coefficients are significant at the 5% level in the
estimations on individual contribution rates given in Table 5 in Kenya and in the group longevity
estimations in Table 6 in Guatemala. In Kenya, these effects as we measure them are quite
substantial, where the contribution rate of a subject classified as Evangelical/Protestant is higher
by 35.6 percentage points off a base contribution rate of 41.8% in Kenya. Increasing religious
commitment among evangelicals, however, does not have a discernable effect on individual
contributions or group longevity and group members don't seem to increase their contribution
rates when more evangelicals are in their group.
Muslim subjects participated in our experiments in Kenya, India, and the Philippines.
Our estimations for our Muslim variables show the Muslim dummy to be negative and
significant in the overall estimations on individual contribution at the 5% level in Table 5. Much

32
of this significance comes from their lower contribution rates in Kenya relative to evangelicals,
which is not clearly manifest in the Kenyan country estimation because Muslim is used as the
base category. Interestingly, while Muslim contribution rates are lower, trust of Muslims actually
seems to be higher shown by the significant increase in contribution rates based on the number
of other Muslims in the group, yielding the virtually the reverse of our finding for evangelicals.
In the group longevity estimations in Table 6, the Muslim variables carry positive signs but are
all statistically insignificant.
Coefficients on our dummy variable for Hindu in Table 5 and the number of Hindus in
a borrowing group in Table 6 and their accompanying variables are all insignificant. This is also
true for the same variables identifying Catholic subjects. But a look at simple Mann-Whitney
tests in Table 7 for differences in individual contribution rates between each of our four
religious groups shows that Catholic and Hindu subjects actually contributed at a rate
significantly higher than non-Catholics and non-Hindus. These apparently contradictory
findings are reconciled by the fact that the OLS results control for other variables that may be
characterize followers of different religions, such that they only yield the additional explanatory
power of being Catholic given an expressed level of societal trust, knowledge of fellow group
members, age, gender, education, etc.
The results do seem to suggest that much of the higher repayment rate observed by
Catholic and Hindu group members is embodied in the social capital variables. In contrast, that
a subject is an evangelical Protestant appears in some estimations to offer some explanatory
power over and above the religion's effect on the purely social capital variables. Given the lack
of corroborating evidence from the effect of additional religious commitment (and
trustworthiness reflected by the decisions of other group members), we cannot from these
results draw firm conclusions on the effects of spiritual capital apart from religion's contribution
to social capital, although we appear to find very modest evidence in favor of such.

33
5. Summary and Conclusion
Does social capital matter? Results from our five-country group lending experiment suggest that
it does, though occasionally in unexpected ways. We present international results from an
experiment in which subjects have an incentive to contribute to a joint-liability loan so that the
group is more likely to continue to receive additional loans. However, any member can fair
better individually by withholding contribution in a given round. The stakes were high in our
game relative to the income earned in our five countries; subjects could earn between half and
day and two to three days' wages in less than two hours depending on their own performance
and their group's performance in the experiment. We show that trust is important in the group
lending game: A subject has an incentive to contribute if she believes a critical number of other
group members will also contribute, at least four out of five other members in a group of six.
We believe that there are several main findings from our research in five countries with this
experiment:
(1) Trust matters. Individuals with greater trust in their society (as revealed by their
responses to GSS questions) displayed higher contribution rates, yielding benefits that spilled
over to other members of their group.
(2) When people lack confidence in the economic behavior of others, bad outcomes for
all are likely to result. This we observed in Kenya, where the average contribution rate was only
41.8% and where lending was terminated with borrowing groups after only 1.8 rounds, and low
contribution rates were explained by low expectations of contribution rates by others.
(3) The effects of social and religious homogeneity as defined by specific categories are
not as strong as one might expect, are difficult to generalize, and are very context-specific. We
find very mild evidence that, controlling for other variables, religious homogeneity fosters trust
and group contribution in some countries such as Guatemala and India, but overall the evidence
is underwhelming.
34
(4) The ability of people to monitor one other in group lending environments, and
possibly in other situations such as work in teams, can yield negative as well as positive effects
on individual behavior. When information is imperfect, non-contributions of capital (or effort)
are not as contagious within a group because they can be attributed to unavoidable shocks.
However, with perfect information, such behavior may trigger either retaliation or optimal
defections by other agents, quickly yielding an inferior outcome for the group.
(5) Social capital does not just exist innately in developing countries, but can be created
through repetitive and cooperative group effort. We present evidence that among our real-
world borrowing groups that contribution rates were higher among experienced borrowing
groups relative to real borrowing groups that had been formed and were in orientation, but had
not yet taken an actual loan.
(6) We attempt to empirically distinguish between the effects of religion on economic
behavior into its contribution to social capital and spiritual capital, finding that within our
sample Catholic and Hindu adherents are characterized by a higher contribution rate that
appears to operate through their effect on creating higher levels of trust and social capital.
The additional explanatory power yielded by Evangelical/Protestant variables on contribution
rates suggests an effect that is not manifest as strongly in the creation of added social capital as
Hindu and Catholic adherents but more in the creation of spiritual capital.
Finally, our research finds large and significant differences between the five countries in
economic behavior and the effect of identical treatments on economic behavior. This cannot
help but re-emphasize the caveats regarding the external validity of experiments and drawing
general inferences from experimental and non-experimental results on economic behavior
obtained from a single cultural context, especially in research devoted to understanding the
relationship between social variables and economic outcomes.
35
References
Abbink, Klaus; Irlenbusch, Bernd; Renner, Elke (2006) "Group Size and Social Ties in Microfinance Institutions" Economic Inquiry, Volume 44, Number 4, pp. 614-628(15)
Banerjee, Abhijit., Besley, Timothy. and Guinnane, Timothy. (1994). "Thy Neighbor’s Keeper: Design of a Credit Cooperative with Theory and a Test." Quarterly Journal of Economics, vol. 102 (9), pp. 491-515.
Besley, Timothy. and Coate, Stephen. (1995). "Group lending, repayment incentives and social collateral." Journal of Development Economics, vol. 46 (1), pp. 1-18.
Bowles, Samuel and Herbert Gintis (2002) "Social Capital And Community Governance" Economic Journal, 112 (483), F419–F436.
Cassar, Alessandra, Luke Crowley, and Bruce Wydick "The Effect of Social Capital on Group Loan Repayment: Evidence from Field Experiments" Economic Journal 117, F85-106.
Case, Anne. and Lawrence Katz (1991) "The Company You Keep: The Effect of Family and Neighborhood on Disadvantaged Youth," NBER Working Paper No. 3705.
Charness, Gary, Luca Rigotti, and Aldo Rustichini (2007) "Individual Behavior and Group Membership" American Economic Review, 97 (4), pp.1140-1360.
Floro, Maria and Pan Yotopoulos (1991). Informal Credit Markets and the New Institutional Economics, Boulder: Westview Press.
Fukuyama, Francis (1996) Trust: The Social Virtues and the Creation of Prosperity, New York: Free Press, pp.26-28
Ghatak, Maitreesh. (1999). "Group Lending, Local Information and Peer Selection." Journal of Development Economics, vol. 60 (1), pp. 27-50.
Giné, Xavier., Jakiela, Pamela., Karlan, Dean. and Morduch, Jonathan (2005). "Microfinance Games" Working Paper.
Glaeser, E., B. Sacerdote, J. Scheinkman (1996) "Crime and Social Interactions" Quarterly Journal of Economics, 111: 508-548.
Guiso, Luigi, Paola Sapienza, and Luigi Zingales (2004) "The Role of Social Capital in Financial Development" American Economic Review, Vol. 94, No. 3, pp. 526-556.
Guth, Werner, and Reinhard Tietz (1990) "Ultimatum Bargaining Behavior: A Survey and Comparison of Experimental Results." Journal of Economic Psychology Vol. 11, pp.417-449.
Ichino, A., and G. Maggi (2000) "Work Environment and Individual Background: Explaining Regional Shirking Differentials in a Large Italian Firm" Quarterly Journal of Economics 115(3)
Karlan, Dean. (2005) "Using experimental economics to measure social capital and predict financial decisions." American Economic Review, vol. 95, pp.1688-1699.
Karlan, Dean. (2006). ‘Social connections and group banking.’ ECONOMIC JOURNAL, current issue.
Knack, Stephen and Philip Keefer (1997). “Does Social Capital Have an Economic Payoff?: A Cross-Country Regression” Quarterly Journal of Economics, Vol.112, pp.1251-588.
LaPorta, R., Lopez-de-Salanes, F., Shleifer, A. and Vishny, R. (1997). ‘Trust in Large Organizations" American Economic Review Papers and Proceedings, vol. 87, pp. 333–8.

36
McCleary, Rachel and Robert Barro (2006) “Religion and Economy” Journal of Economic Perspectives, Vol.20, No.2, p.49-72.
Putnam, Robert (1993). Making Democracy Work: Civic Traditions in Modern Italy. Princeton: Princeton University Press.
Stiglitz, Joseph (1990). ‘Peer Monitoring and Credit Markets.’ The World Bank Economic Review, vol. 4 (3), pp. 351-366.
Udry, Christopher (1994). “Risk and Insurance in a Rural Credit Market: an Empirical Investigation in Northern Nigeria” Review of Economic Studies, Vol.61, No.1, pp.495-526.
Van Tassel, E. (1999). "Group Lending under Asymmetric Information." Journal of Development Economics, vol. 60 (1), pp. 3-25.
Woolcock, Michael (1998). "Social Capital and Economic Development: Toward a Theoretical Synthesis and Policy Framework" Theory and Society 27: 151-208.
Wydick, Bruce (2001). "Group lending under dynamic incentives as a borrower discipline device." Review of Development Economics, vol. 5 (3), pp. 406-420.
Wydick, Bruce (2008). Games in Economic Development. New York: Cambridge University Press.
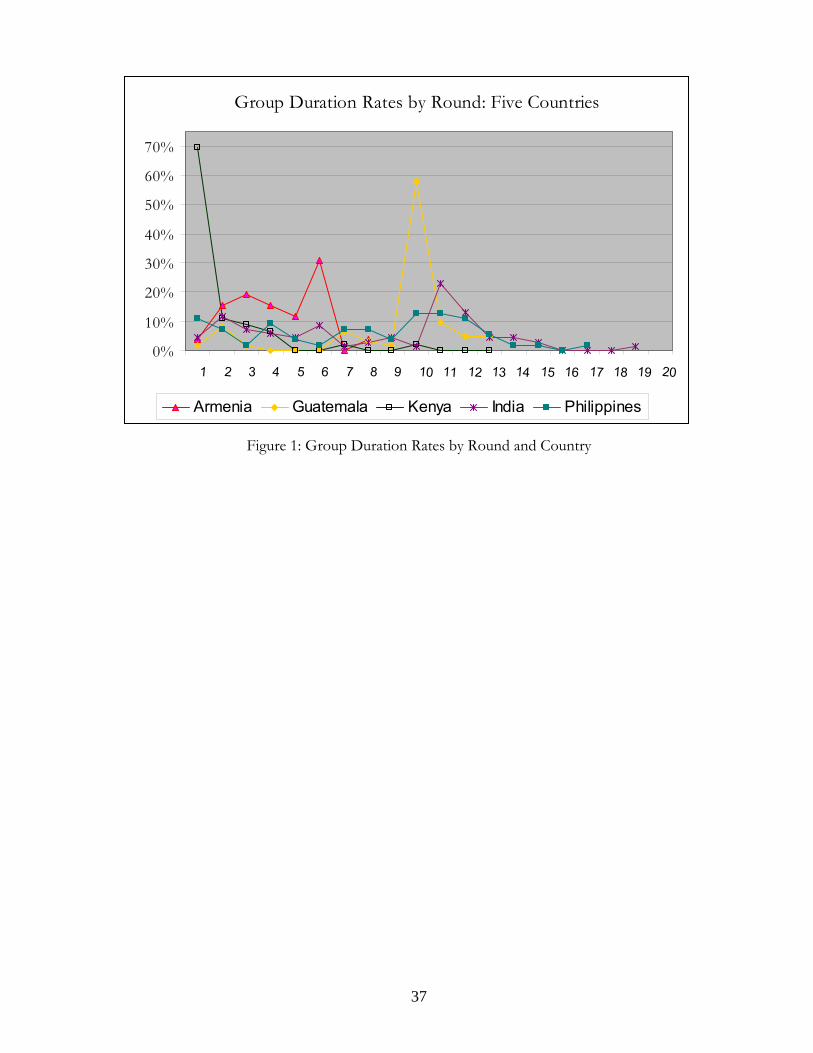
Group Duration Rates by Round: Five Countries
0%
10%
20%
30%
40%
50%
60%
70%
1 2 3 4 5 6 7 8 9 10 11 12 13 14 15 16 17 18 19 20
Armenia Guatemala Kenya India Philippines
Figure 1: Group Duration Rates by Round and Country
37
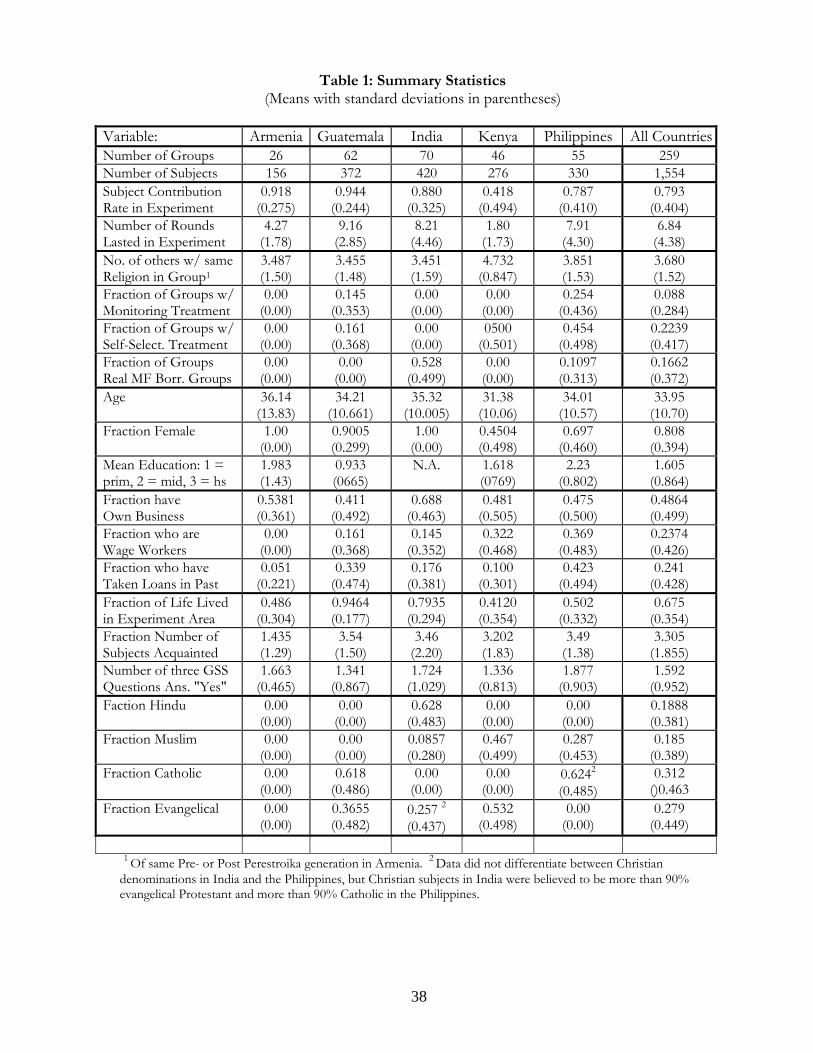
38
Table 1: Summary Statistics (Means with standard deviations in parentheses)
Variable: Armenia Guatemala India Kenya Philippines All CountriesNumber of Groups 26 62 70 46 55 259 Number of Subjects 156 372 420 276 330 1,554 Subject Contribution Rate in Experiment
0.918 (0.275)
0.944 (0.244)
0.880 (0.325)
0.418 (0.494)
0.787 (0.410)
0.793 (0.404)
Number of Rounds Lasted in Experiment
4.27 (1.78)
9.16 (2.85)
8.21 (4.46)
1.80 (1.73)
7.91 (4.30)
6.84 (4.38)
No. of others w/ same Religion in Group1
3.487 (1.50)
3.455 (1.48)
3.451 (1.59)
4.732 (0.847)
3.851 (1.53)
3.680 (1.52)
Fraction of Groups w/ Monitoring Treatment
0.00 (0.00)
0.145 (0.353)
0.00 (0.00)
0.00 (0.00)
0.254 (0.436)
0.088 (0.284)
Fraction of Groups w/ Self-Select. Treatment
0.00 (0.00)
0.161 (0.368)
0.00 (0.00)
0500 (0.501)
0.454 (0.498)
0.2239 (0.417)
Fraction of Groups Real MF Borr. Groups
0.00 (0.00)
0.00 (0.00)
0.528 (0.499)
0.00 (0.00)
0.1097 (0.313)
0.1662 (0.372)
Age 36.14 (13.83)
34.21 (10.661)
35.32 (10.005)
31.38 (10.06)
34.01 (10.57)
33.95 (10.70)
Fraction Female 1.00 (0.00)
0.9005 (0.299)
1.00 (0.00)
0.4504 (0.498)
0.697 (0.460)
0.808 (0.394)
Mean Education: 1 = prim, 2 = mid, 3 = hs
1.983 (1.43)
0.933 (0665)
N.A. 1.618 (0769)
2.23 (0.802)
1.605 (0.864)
Fraction have Own Business
0.5381 (0.361)
0.411 (0.492)
0.688 (0.463)
0.481 (0.505)
0.475 (0.500)
0.4864 (0.499)
Fraction who are Wage Workers
0.00 (0.00)
0.161 (0.368)
0.145 (0.352)
0.322 (0.468)
0.369 (0.483)
0.2374 (0.426)
Fraction who have Taken Loans in Past
0.051 (0.221)
0.339 (0.474)
0.176 (0.381)
0.100 (0.301)
0.423 (0.494)
0.241 (0.428)
Fraction of Life Lived in Experiment Area
0.486 (0.304)
0.9464 (0.177)
0.7935 (0.294)
0.4120 (0.354)
0.502 (0.332)
0.675 (0.354)
Fraction Number of Subjects Acquainted
1.435 (1.29)
3.54 (1.50)
3.46 (2.20)
3.202 (1.83)
3.49 (1.38)
3.305 (1.855)
Number of three GSS Questions Ans. "Yes"
1.663 (0.465)
1.341 (0.867)
1.724 (1.029)
1.336 (0.813)
1.877 (0.903)
1.592 (0.952)
Faction Hindu 0.00 (0.00)
0.00 (0.00)
0.628 (0.483)
0.00 (0.00)
0.00 (0.00)
0.1888 (0.381)
Fraction Muslim 0.00 (0.00)
0.00 (0.00)
0.0857 (0.280)
0.467 (0.499)
0.287 (0.453)
0.185 (0.389)
Fraction Catholic 0.00 (0.00)
0.618 (0.486)
0.00 (0.00)
0.00 (0.00)
0.6242
(0.485) 0.312
()0.463 Fraction Evangelical 0.00
(0.00) 0.3655 (0.482)
0.257 2
(0.437) 0.532
(0.498) 0.00
(0.00) 0.279
(0.449)
1 Of same Pre- or Post Perestroika generation in Armenia. 2 Data did not differentiate between Christian denominations in India and the Philippines, but Christian subjects in India were believed to be more than 90% evangelical Protestant and more than 90% Catholic in the Philippines.
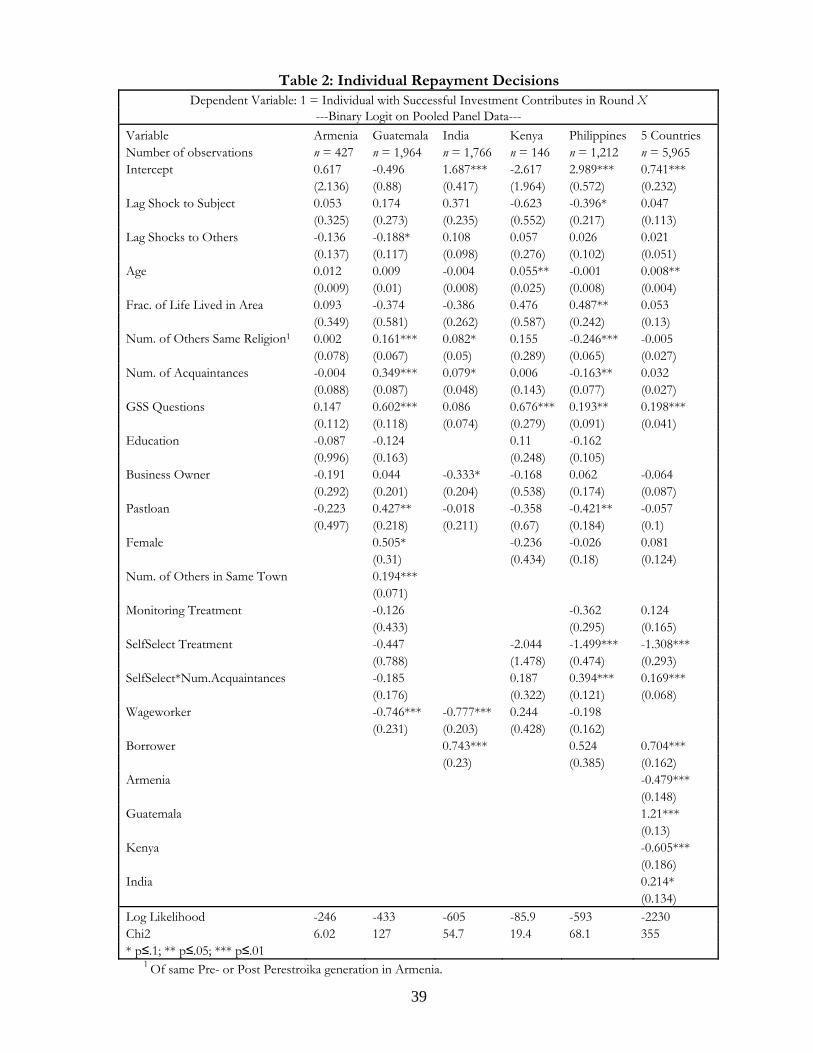
39
Table 2: Individual Repayment Decisions Dependent Variable: 1 = Individual with Successful Investment Contributes in Round X
---Binary Logit on Pooled Panel Data--- Variable Armenia Guatemala India Kenya Philippines 5 Countries Number of observations n = 427 n = 1,964 n = 1,766 n = 146 n = 1,212 n = 5,965 Intercept 0.617 -0.496 1.687*** -2.617 2.989*** 0.741*** (2.136) (0.88) (0.417) (1.964) (0.572) (0.232) Lag Shock to Subject 0.053 0.174 0.371 -0.623 -0.396* 0.047 (0.325) (0.273) (0.235) (0.552) (0.217) (0.113) Lag Shocks to Others -0.136 -0.188* 0.108 0.057 0.026 0.021 (0.137) (0.117) (0.098) (0.276) (0.102) (0.051) Age 0.012 0.009 -0.004 0.055** -0.001 0.008** (0.009) (0.01) (0.008) (0.025) (0.008) (0.004) Frac. of Life Lived in Area 0.093 -0.374 -0.386 0.476 0.487** 0.053 (0.349) (0.581) (0.262) (0.587) (0.242) (0.13) Num. of Others Same Religion1 0.002 0.161*** 0.082* 0.155 -0.246*** -0.005 (0.078) (0.067) (0.05) (0.289) (0.065) (0.027) Num. of Acquaintances -0.004 0.349*** 0.079* 0.006 -0.163** 0.032 (0.088) (0.087) (0.048) (0.143) (0.077) (0.027) GSS Questions 0.147 0.602*** 0.086 0.676*** 0.193** 0.198*** (0.112) (0.118) (0.074) (0.279) (0.091) (0.041) Education -0.087 -0.124 0.11 -0.162 (0.996) (0.163) (0.248) (0.105) Business Owner -0.191 0.044 -0.333* -0.168 0.062 -0.064 (0.292) (0.201) (0.204) (0.538) (0.174) (0.087) Pastloan -0.223 0.427** -0.018 -0.358 -0.421** -0.057 (0.497) (0.218) (0.211) (0.67) (0.184) (0.1) Female 0.505* -0.236 -0.026 0.081 (0.31) (0.434) (0.18) (0.124) Num. of Others in Same Town 0.194*** (0.071) Monitoring Treatment -0.126 -0.362 0.124 (0.433) (0.295) (0.165) SelfSelect Treatment -0.447 -2.044 -1.499*** -1.308*** (0.788) (1.478) (0.474) (0.293) SelfSelect*Num.Acquaintances -0.185 0.187 0.394*** 0.169*** (0.176) (0.322) (0.121) (0.068) Wageworker -0.746*** -0.777*** 0.244 -0.198 (0.231) (0.203) (0.428) (0.162) Borrower 0.743*** 0.524 0.704*** (0.23) (0.385) (0.162) Armenia -0.479*** (0.148) Guatemala 1.21*** (0.13) Kenya -0.605*** (0.186) India 0.214* (0.134) Log Likelihood -246 -433 -605 -85.9 -593 -2230 Chi2 6.02 127 54.7 19.4 68.1 355 * p≤.1; ** p≤.05; *** p≤.01
1 Of same Pre- or Post Perestroika generation in Armenia.

40
Table 3: Individual Repayment Decisions
Dependent Variable: Fraction of Times Repaid Divided by Opportunities to Repay ---OLS Estimations---
Variable Armenia Guatemala India Kenya Philippines 5 Countries Num. of Observations n = 152 n = 313 n = 346 n = 202 n = 241 n = 1332 Intercept 0.803* 0.694*** 0.879*** -0.3 0.797*** 0.621*** (0.434) (0.127) (0.087) (0.207) (0.143) (0.054) Mean Shocks Received---Self 0.274** 0.077 0.215** -0.015 0.088 0.186*** (0.143) (0.092) (0.095) (0.268) (0.149) (0.058) Mean Shocks Received---Others -0.033 -0.134*** -0.016 0.076 0.042 -0.005 (0.047) (0.035) (0.028) (0.05) (0.036) (0.016) Age 0.001 0.002 -0.001 0.014*** 0.002 0.002*** (0.002) (0.001) (0.002) (0.004) (0.002) (0.001) Fraction of Life Lived in Area 0.055 0.017 -0.062 -0.018 0.103* 0.008 (0.087) (0.074) (0.051) (0.092) (0.061) (0.03) Num. of Others Same Religion -0.002 -0.002 0.008 0.024 -0.016 0.004 (0.018) (0.009) (0.01) (0.027) (0.015) (0.006) Num. of Others in Same Town 0.003 (0.011) Num. of Acquaintances 0.005 0.034*** -0.019* -0.016 -0.025 -0.001 (0.021) (0.011) (0.01) (0.026) (0.022) (0.006) GSS Questions 0.033 0.041*** 0.011 0.06 0.027 0.027*** (0.027) (0.015) (0.015) (0.04) (0.023) (0.009) Education -0.086 0.000 0.064 -0.017 (0.197) (0.022) (0.044) (0.027) Business Owner -0.043 0.032 0.023 -0.002 0.026 0.006 (0.076) (0.027) (0.042) (0.069) (0.045) (0.019) Loan in Past 0.046 0.049* 0.028 -0.003 -0.139*** -0.001 (0.129) (0.028) (0.04) (0.11) (0.046) (0.022) Female 0.043 0.056 0.022 0.019 (0.052) (0.068) (0.046) (0.027) Monitoring Treatment 0.017 -0.105 -0.045 (0.042) (0.071) (0.034) SelfSelect Treatment 0.084 -0.261* -0.289** -0.198*** (0.149) (0.144) (0.125) (0.06) SelfSelect*Num.Acquaintances -0.028 0.037 0.059* 0.024* (0.032) (0.037) (0.032) (0.014)
Wageworker -0.03 -0.142*** 0.052 -0.026
(0.04) (0.045) (0.071) (0.042) Borrower 0.101** 0.024 0.045 (0.045) (0.092) (0.036) Armenia -0.045 (0.037) Guatemala 0.139*** (0.031) Kenya -0.302*** (0.032) India 0.017 (0.034) Adj R-Squared -0.0132 0.110 0.0425 0.0439 0.100 0.250 * p≤.1; ** p≤.05; *** p≤.01

41
Table 4: Borrowing Group Longevity
Dependent Variable: Number of Rounds Reach by Group in Microfinance Game, m = ---OLS Estimates---
Variable Armenia Guatemala India Kenya Philippines 5 Countries Num. of Observations n=26 n=62 n=70 n=46 n=52 n=259 Intercept -0.077 2.326 14.148*** -4.342 3.805 9.586*** (11.321) (6.844) (3.794) (3.984) (5.372) (1.448) Mean Shocks Received---Group -1.48*** -3.828*** -2.133*** -0.232 -1.07 -1.811*** (0.494) (0.749) (0.578) (0.407) (0.697) (0.258) Proportion Female 2.465 -0.766 0.934 -0.039 (4.266) (1.452) (1.699) (0.95) Mean Age in Group -0.018 0.036 -0.083 0.134* 0.154 -0.008 (0.038) (0.071) (0.091) (0.074) (0.1) (0.028) Mean Education 3.33 0.512 1.514* 0.682 (5.518) (0.909) (0.939) (0.954) Mean Fr. of Life Lived in Area -1.758 4.19 -0.723 1.909 3.680* 1.000 (2.318) (5.161) (2.327) (1.861) (1.949) (0.998) Mean Business Owner 2.975 0.314 -2.532* 0.505 0.059 -0.716 (2.39) (1.318) (1.4) (1.212) (1.815) (0.633) Mean Wageworker 0.323 -3.796* 0.432 -1.959 (2.101) (2.302) (1.425) (1.453) Mean Loan in Past -2.288 -1.052 2.648* 0.112 -3.175* 0.298 (3.461) (1.662) (1.373) (2.808) (1.674) (0.733) Borrower 1.952 -1.852 0.841 (1.428) (2.461) (0.792) Mean GSS Questions 0.174 1.538* 0.059 0.356 0.266 0.288 (0.727) (0.852) (0.654) (0.992) (1.001) (0.339) Mean Num. of Acquaintances 0.02 0.312 -0.129 -0.56 -0.746 -0.154 (0.425) (0.509) (0.389) (0.575) (0.683) (0.181) Mean SelfSelect*Num.Acq. 0.549 1.031 2.443** 1.242*** (1.667) (0.769) (1.174) (0.449)
SelfSelect Treatment -1.698 -4.216* -9.674** -6.191***
(7.616) (2.506) (4.161) (1.84) Gender Homogeneity -0.465 -0.991 -1.127 -0.512 (1.202) (0.959) (1.129) (0.486) Town Homogeneity -0.455 (0.856) Religious Homogeneity 0.508 0.028 0.384 0.765 0.873 0.373 (0.776) (0.713) (0.769) (0.747) (0.983) (0.339) Monitoring Treatment 0.633 -2.504 -1.206* (1.019) (1.598) (0.69) Armenia -3.223*** (0.83) Guatemala 1.412** (0.725) Kenya -5.303*** (0.642) India -0.362 (0.765) Adj R-Squared 0.194 0.342 0.26 -0.054 0.423 0.542 * p≤.1; ** p≤.05; *** p≤.01

42
Table 5: Individual Repayment Decisions--Including Spiritual Capital
Dependent Variable: Fraction of Times Repaid Divided by Opportunities to Repay† ---OLS Estimations---
Variable Guatemala India Kenya Philippines 5 CountriesNum. of Observations n=307 n=342 n=192 n=226 n=1140 Intercept 0.755*** 0.836*** -0.401* 0.732*** 0.620*** (0.142) (0.111) (0.234) (0.171) (0.07) Mean Shocks Received---Self 0.052 0.196** -0.039 0.088 0.158*** (0.095) (0.097) (0.269) (0.16) (0.065) Mean Shocks Received---Others -0.144*** -0.019 0.059 0.047 -0.006 (0.036) (0.029) (0.051) (0.038) (0.017) Age 0.002 -0.001 0.014*** 0.003 0.002*** (0.001) (0.002) (0.004) (0.002) (0.001) Fraction of Life Lived in Area 0.002 -0.07 0.021 0.094 -0.011 (0.075) (0.052) (0.098) (0.067) (0.033) GSS Questions 0.043*** 0.018 0.046 0.031 0.027*** (0.016) (0.016) (0.042) (0.025) (0.01) Female 0.031 0.069 0.025 0.017 (0.053) (0.069) (0.051) (0.029) Monitoring Treatment 0.008 -0.109 -0.037 (0.044) (0.074) (0.036) SelfSelect Treatment 0.075 -0.266* -0.292* -0.192*** (0.152) (0.146) (0.153) (0.062) Num. of Acquaintances 0.034*** -0.019* -0.008 -0.028 0.00 (0.011) (0.011) (0.027) (0.028) (0.007) SelfSelect*Num.Acquaintances -0.029 0.022 0.062* 0.021 (0.032) (0.038) (0.037) (0.014) Education 0.003 0.039 -0.016 (0.023) (0.047) (0.029) Business Owner 0.034 0.044 -0.041 0.023 0.005 (0.028) (0.045) (0.07) (0.049) (0.021)
Wageworker -0.034 -0.144*** 0.031 -0.016 -0.044**
(0.041) (0.045) (0.072) (0.044) (0.023) Loan in Past 0.05* 0.033 0.012 -0.158*** 0.001 (0.029) (0.041) (0.116) (0.05) (0.023) Borrower 0.123*** -0.01 0.062* (0.047) (0.099) (0.037) Num. of Others in Same Town 0.002 (0.011) Num. of Others Same Religion -0.001 0.019* 0.024 -0.012 0.009 (0.01) (0.011) (0.027) (0.016) (0.007) Religion Frequency -0.013 -0.025 0.075 0.004 -0.008 (0.019) (0.024) (0.05) (0.028) (0.018) Evangelical Dummy 0.136 0.071 0.356** 0.091 (0.103) (0.143) (0.181) 0.077 Num. of Other Evangelical -0.005 0.003 -0.032 -0.005 (0.011) (0.012) (0.026) 0.011 EvanD*RelFreq -0.054 0.003 -0.055 -0.027 (0.04) (0.057) (0.076) 0.03 Muslim Dummy -0.144 -0.102 -0.176** (0.163) (0.134) (0.073)

43
Num. of Other Muslim 0.05* 0.018 0.027** (0.022) (0.027) (0.013) MuslD*RelFreq 0.039 0.07 0.042 (0.058) (0.068) (0.028) Hindu Dummy 0.003 (0.087) Num. of Other Indu -0.012 (0.015) HundD*RelFreq -0.02 (0.032) Guatemala 0.155*** (0.038) Kenya -0.321*** (0.047) India 0.081 (0.057) Adj R-Squared 0.112 0.0513 0.044 0.0836 0.276 * p≤.1; ** p≤.05; *** p≤.01

44
Table 6: Borrowing Group Longevity---Including Spiritual Capital
Dependent Variable: Number of Rounds Reach by Group in Microfinance Game, m = ---OLS Estimates---
Variable Guatemala India Kenya Philippines 5 Countries Num. of Observations n = 62 n = 70 n = 46 n = 50 n = 231 Intercept -4.494 13.831*** -6.003 -2.905 8.226*** (7.507) (4.692) (5.127) (6.843) (2.152) Mean Shocks Received---Group -3.869*** -2.225*** -0.368 -1.325* -1.885*** (0.756) (0.61) (0.419) (0.735) (0.283) Proportion Female 4.551 -0.279 1.951 -0.079 (4.105) (1.626) (1.794) (1.001) Mean Age in Group 0.067 -0.083 0.137* 0.203* 0.019 (0.067) (0.097) (0.077) (0.118) (0.037) Mean Education 0.514 1.491 1.023 (0.861) (0.978) (0.981) Mean Fr. of Life Lived in Area 4.722 -1.184 2.796 2.755 0.724 (4.916) (2.43) (2.007) (2.321) (1.142) Mean Business Owner -0.189 -1.877 0.175 -0.773 -0.689 (1.288) (1.564) (1.243) (2.083) (0.69) Mean Wageworker -0.881 -4.307* 0.509 -1.599 -1.707** (2.145) (2.422) (1.44) (1.526) (0.83) Mean Loan in Past -0.955 2.46 -0.498 -3.448* 0.337 (1.638) (1.518) (2.903) (1.773) (0.799) Borrower 2.151 -1.49 1.103 (1.526) (2.589) (0.847) Mean GSS Questions 2.051** 0.28 -0.377 0.807 0.554 (0.827) (0.709) (1.098) (1.077) (0.379) Mean Num. of Acquaintances 0.352 -0.098 -0.258 0.279 -0.058 (0.488) (0.407) (0.611) (0.902) (0.202) Mean SelfSelect*Num.Acq. 0.401 0.671 1.002 1.059** (1.581) (0.824) (1.42) (0.472) SelfSelect Treatment -0.01 -3.438 -3.34 -5.011*** (7.239) (2.594) (5.415) (1.937) Monitoring Treatment 1.148 -3.036* -0.865 (0.995) (1.722) (0.716) Gender Homogeneity -0.807 -1.184 -0.606 -0.286 (1.142) (1.055) (1.202) (0.518) Town Homogeneity -0.441 (0.829) Religious Homogeneity 0.434 0.557 0.886 0.489 0.373 (0.692) (0.814) (0.76) (1.093) (0.385) Mean Religious Freqency 0.73 -0.35 0.436 -0.767 -0.37 (0.961) (1.131) (1.474) (1.371) (0.734) Num. Evangelical 1.228* -0.135 0.423 0.474 (0.729) (1.14) (0.539) (0.415) Num. Evan*ReligiousFreq. -0.296 0.158 -0.099 -0.066 (0.281) (0.47) (0.295) (0.176) Num. Muslim 0.236 0.581 0.349 (0.621) (0.547) (0.31) Num. Musl*ReligiousFreq. 0.094 -0.045 -0.047 (0.286) (0.294) (0.16) Num. Hindu -0.166
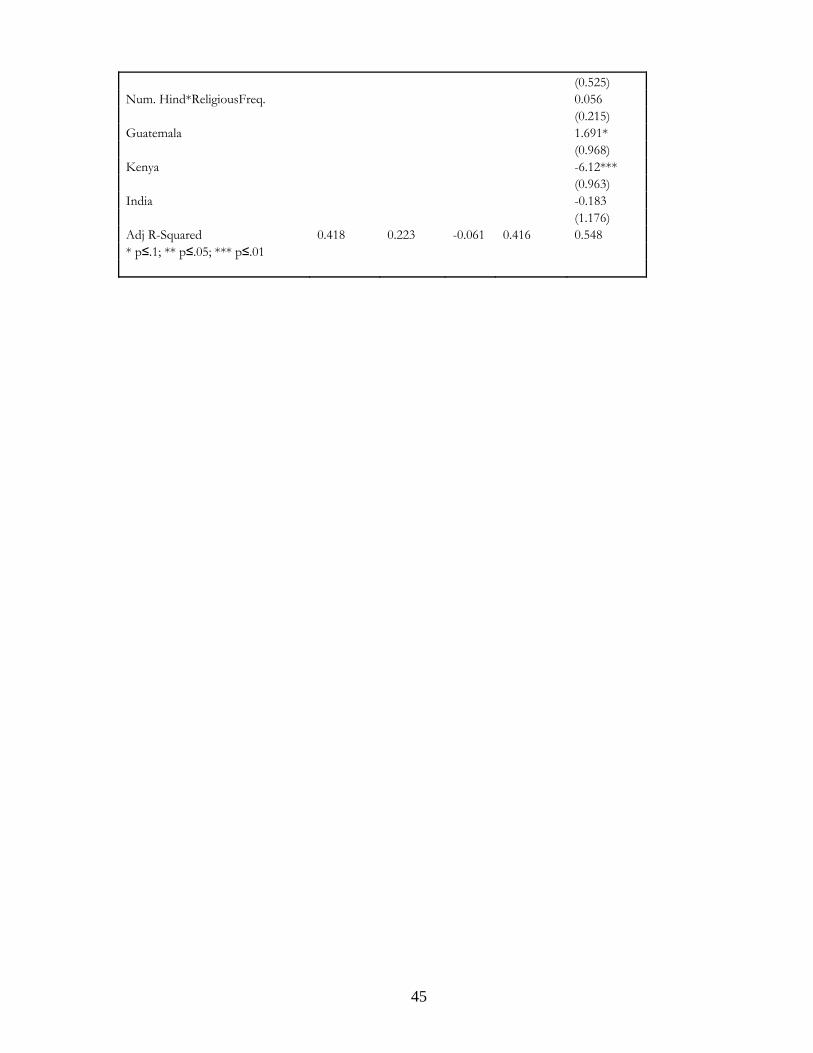
45
(0.525) Num. Hind*ReligiousFreq. 0.056 (0.215) Guatemala 1.691* (0.968) Kenya -6.12*** (0.963) India -0.183 (1.176) Adj R-Squared 0.418 0.223 -0.061 0.416 0.548 * p≤.1; ** p≤.05; *** p≤.01
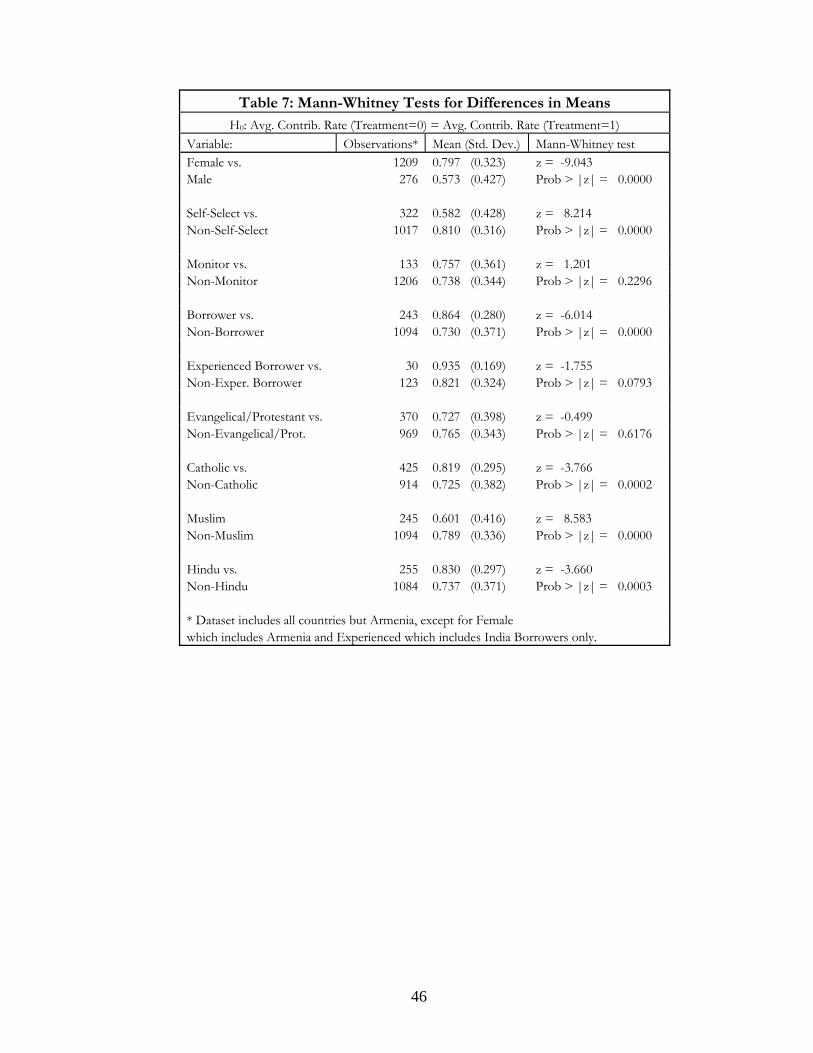
46
Table 7: Mann-Whitney Tests for Differences in Means
H0: Avg. Contrib. Rate (Treatment=0) = Avg. Contrib. Rate (Treatment=1) Variable: Observations* Mean (Std. Dev.) Mann-Whitney test Female vs. 1209 0.797 (0.323) z = -9.043 Male 276 0.573 (0.427) Prob > |z| = 0.0000 Self-Select vs. 322 0.582 (0.428) z = 8.214 Non-Self-Select 1017 0.810 (0.316) Prob > |z| = 0.0000 Monitor vs. 133 0.757 (0.361) z = 1.201 Non-Monitor 1206 0.738 (0.344) Prob > |z| = 0.2296 Borrower vs. 243 0.864 (0.280) z = -6.014 Non-Borrower 1094 0.730 (0.371) Prob > |z| = 0.0000 Experienced Borrower vs. 30 0.935 (0.169) z = -1.755 Non-Exper. Borrower 123 0.821 (0.324) Prob > |z| = 0.0793 Evangelical/Protestant vs. 370 0.727 (0.398) z = -0.499 Non-Evangelical/Prot. 969 0.765 (0.343) Prob > |z| = 0.6176 Catholic vs. 425 0.819 (0.295) z = -3.766 Non-Catholic 914 0.725 (0.382) Prob > |z| = 0.0002 Muslim 245 0.601 (0.416) z = 8.583 Non-Muslim 1094 0.789 (0.336) Prob > |z| = 0.0000 Hindu vs. 255 0.830 (0.297) z = -3.660 Non-Hindu 1084 0.737 (0.371) Prob > |z| = 0.0003 * Dataset includes all countries but Armenia, except for Female which includes Armenia and Experienced which includes India Borrowers only.