does oil price uncertainty transmit to stock market...
TRANSCRIPT
Does Oil Price Uncertainty Transmit to Stock Market Activities in Nigeria? 361
* Professor of Finance, Department of Banking & Finance, University of Benin, Benin City. Nigeria, E-mail:[email protected]
** Department of Economics, University of Benin, Bening City, Nigeria, E-mail: [email protected]
Asian-African Journal of Economics and Econometrics, Vol. 12, No. 2, 2012: 361-375
DOES OIL PRICE UNCERTAINTY TRANSMIT TOSTOCK MARKET ACTIVITIES IN NIGERIA?
Ifuero Osad Osamwonyi* and Clement Ighodaro**
ABSTRACT
The paper considered an empirical study of uncertainty in oil prices spillover to stock marketactivities in Nigeria within the VEC framework using data for 1979 to 2007. We tested therelationship among the variables by using the modern time series technique in a cointegratingframework. It was found that long run relationship exists among the variables used for theestimation. The result shows that oil price uncertainty does not fully account for strong predictivebehaviour of stock market activities and there is high unpredictability of stock market activitiesin Nigeria. It is suggested that policy makers should take caution in implementing policy asregards stock market activities as this may have strong impact on oil prices in Nigeria.
Keywords: VEC framework, Granger causality, oil prices.
JEL classification: E44, G17
1. INTRODUCTION
Stock market and crude oil market have developed a mutual relationship over the past fewyears, with virtually every production sector in the international economy relying heavily onthis source of energy. As a result of such dependence, fluctuations in crude oil prices are likelyto have significant and unavoidable affects on the production sector. The direct effect of an oilprice shock may be considered as an input-cost effect, with higher energy costs leading tolower oil usage and decreases in productivity of capital and labour (Tansuchat, et. al 2010).
When the crude oil price (Bonny Light) declined precipitously from US$147 per barrel inJuly 2008 to $47 per barrel in January 2009 as a result of the global financial crisis, thisprompted the government to seek other sources of financing for the 2009 fiscal year (Ajakaiyeand Fakiyesi, 2009). Since the Nigerian economy heavily depends on oil exports for runningits economic machinery, oil price shocks may have destabilizing effects on domestic financialmarkets. This implies that changes in oil prices may have an impact on stock market activitiesin Nigeria. Apart from that, changes in oil prices may affect earnings of companies, particularlyif crude oil product (petrol or diesel) is a direct or indirect cost of operation. Therefore, anincrease in oil prices will cause expected earnings of companies to decline, hence an immediatedecrease in stock prices due to fall in demand. This implies that oil being one of the most

362 Ifuero Osad Osamwonyi and Clement Ighodaro
important export products, its variability will have strong linkages with the stock market inNigeria.
Previous studies have been carried out on the impact of oil price shock on somemacroeconomic variables particularly since the oil price shocks of 1973 – 1974 and 1970 -1980. Such macroeconomic variables are real GDP growth rate, exchange rates, unemploymentrate, and inflation among others. Most of the results found that increase in major energy priceincrease may be followed by economic recession, implying causality from higher energy pricesto economic recession. It is well documented that increases in major energy prices may lead tohigher unemployment rate and most likely higher inflation (see, for example, Kilian (2008),Cologni and Manera (2008), and Park and Ratti (2008). In the Nigerian context, several studiesrelating to stock market activities have been carried out. However, it is basically on therelationship between stock prices and macroeconomic variables. For example, Olomola andAdejumo (2006) examined oil price shock and macroeconomic activities in Nigeria using theVAR method. They found that oil price shocks do not have substantial effects on output andinflation rate in Nigeria. In a similar study, Maku and Atanda (2009) in their study ofmacroeconomic indicators and the Nigerian capital market employed the Error CorrectionModel (ECM). They found that macroeconomic variables exert significant short-term shockon stock prices as a result of the stochastic error term mechanisms.
This paper unlike previous papers deviates from the conventional study of macroeconomicvariables and oil price volatility. The main objective of this paper is to examine the relationshipbetween oil price uncertainty and stock markets activities in Nigeria. This paper tries to profferanswer the following questions. Is there any long-run relationship between oil price movementsand stock market activities in Nigeria? What is the direction of causality between oil price andstock market activities in Nigeria? What is the level of predictive power of oil prices on stockmarket activities in Nigeria? Following section 1, section two reviewed related literature onthe subject while section 3 relate stock market activities in Nigeria. Section 4 deals onmethodology, estimation techniques, results and interpretation. Section 5 provides the policyimplications of the results and conclusion.
2. REVIEW OF RELATED LITERATURE
Earlier studies in this area are related to studies done for the USA and Canada and other developedeconomy with only few on some developing economies while studies done for Nigeria aremostly related to stock market activities and its relationship with macroeconomic variables.However, in recent times, the global financial crisis and volatility of oil price shock rather thanoil price shock and stock prices were prominent.
Kaneko and Lee (1995) used VAR model to test the pricing influence of economic factorson U.S. and Japanese stock market returns and in identifying their relative importance in adynamic context. They found that the average values of excess stock returns, rates of inflation,risk premiums and term premiums are higher for the United States than for Japan. Studying theU.S., Canadian, Japanese, and U.K. stock markets, Jones and Kaul (1996) initially showedthat all the markets respond negatively to oil shocks. A cash-flow valuation model was thenapplied; it was found that U.S. and Canadian stock indices fully accounted for oil shocks via

Does Oil Price Uncertainty Transmit to Stock Market Activities in Nigeria? 363
the effects on dividends. In contrast, stock markets in Japan and the U.K. displayed largervariation, following an oil shock, than can be explained by changes in dividends.
Sadorsky (1999) found a negative relationship between shocks in oil prices and realstock returns for the US economy and a negative impact of shocks to real stock returns oninterest rates and industrial production. In a subsequent study, Sadorsky (2001) found asignificant and positive relationship between oil and gas equity index and the price of crudeoil in Canada. In addition, the author found a positive relationship between the return on theindex and the return on the stock market as a whole and a negative association was foundbetween the stock market index value and both the premium on 3-month versus 1-monthgovernment debt and the US/Canadian Dollar exchange rate. Ciner (2001) in similar studyused linear and nonlinear causality tests to examine the dynamic relationship between oilprices and stock markets, and concluded that a significant relationship between real stockreturns and oil futures price is non-linear. Furthermore, Papapetrou (2001) study onGreece revealed that the oil price is an important factor in explaining stock price movements,and that a positive oil price shock depresses real stock returns by using impulse responsefunctions.
Hammoudeh and Aleisa (2002) found spillovers from oil markets to the stock indices ofsome oil exporting countries; Bahrain, Indonesia, Mexico and Venezuela. Hammoudeh andAleisa (2004) in small emerging markets, especially in the Gulf Cooperating Council (GCC)countries showed that the Saudi market is the leader among GCC stock markets, and can bepredicted by oil futures prices. For emerging stock markets, Maghyereh (2004) found that oilshocks have no significant impact on stock index returns in 22 emerging economies.Hammoudeh and Li (2005) showed that oil price growth leads to stock returns of oil-exportingcountries and oil-sensitive industries in the USA.
On the other hand, Basher and Sadorsky (2006) showed strong evidence that oil price riskhas a significant impact on stock price returns in emerging markets. Zarour (2006) showedthat, for the sub-period 27 May 2003 to 24 May 2005, oil prices can predict all GCC stockmarkets, except for Abu Dhabi. From the impulse response functions, and for the sub-period25 May 2001 to 23 May 2003, the responses of GCC markets to oil returns shocks are small, ingeneral, and decrease very slowly whereas, during a later regime, the GCC market responsesseem to be large and decrease quickly, especially for the Saudi, Kuwaiti and Abu Dhabi stockmarkets. Ågren (2006) presents strong evidence of volatility spillovers from oil prices to stockmarkets using the asymmetric BEKK model for Japan, Norway, UK and US stock markets, butquite weak evidence for Sweden.
Malik and Hammoudeh (2007) found that Gulf equity markets receive volatility from theoil markets, but only in the case of Saudi Arabia is the volatility spillover from the Saudimarket to the oil market significant, underlining the major role that Saudi Arabia plays in theglobal oil market. Nandha and Faff (2007) examined the adverse effects of oil price shocks onstock market returns using global industry indices. The empirical results indicated that oilprice changes have a negative impact on equity returns in all industries, with the exception ofmining, and oil and gas. Cong et al. (2008) argued that oil price shocks do not have a statisticallysignificant impact on the real stock returns of most Chinese stock market indices, except for
364 Ifuero Osad Osamwonyi and Clement Ighodaro
the manufacturing index and some oil companies. An increase in oil volatility does notaffect most stock returns, but may increase speculation in the mining and petrochemicalindexes, thereby increasing the associated stock returns. From simulations using a VARmodel, Henriques and Sadorsky (2008) showed that shocks to oil prices have little impacton the stock prices of alternative energy companies. Gogineni (2009) indicated that, as theirmain customers are impacted by oil price changes, the stock returns of industries are sensitiveto oil price changes. The magnitude of the correlations between industry returns and oilprice changes depends on both the cost-side and demand-side dependence on oil, and thatthe effects of these factors vary across industries. Arouri and Fouquau (2009) found asignificant positive relation between oil prices and the stock index of Qatar, Oman andUAE. For Bahrain, Kuwait and Saudi Arabia, there no evidence of a relationship betweenoil price changes and stock market returns.
Tansuchat et al. (2010) examined the conditional correlations and volatility spilloversbetween crude oil and stock index returns. The result made it clear that the assumption ofconstant conditional correlations is not supported empirically. On the other hand, the empiricalresults from the VARMA-GARCH and VARMA-AGARCH models provided little evidenceof volatility spillovers between the crude oil and financial markets. The evidence of asymmetriceffects of negative and positive shocks of equal magnitude on the conditional variancessuggested that VARMA-AGARCH is superior to VARMA-GARCH and CCC. Masih et al.(2010) studied Oil Price Volatility and Stock Price Fluctuations in South Korea using a VECmodel. The result indicated the dominance of oil price volatility on real stock returns andemphasized how this has increased over time. They found that oil price volatility can haveprofound effect on the time horizon of investment and firms need to adjust their risk managementprocedures accordingly.
3. THE NIGERIAN STOCK MARKET
The Nigerian stock exchange was established in 1960 as the Lagos Stock Exchange. In December1977, it became known as the Nigerian Stock Exchange with currently thirteen branchesexcluding the Head Office in Lagos which was established in 1961. Each of the branches has anelectronic trading floor. The exchange started operations in Lagos in 1961 with nineteen securitieslisted for trading. The Trading System on the NSE is fully automatic. It recorded its annualmarket capitalization of N5.1billion in 1988 and ever since has continued to increase until 1997when it dropped to N276.3 billion from N79.8 billion in 1996 and reduced further by N19.5billion in 1998 (CBN Bulletin, 2008).
Since the year 2000, Nigerian equity market has grown at a compound rate of 11.1%,recording positive returns in seven out of the nine years as shown in figure one below. Accordingto NSE, Meristem Research (2009), the growth feat was largely driven by buoyantmacroeconomic condition and financial sector reforms. However, after the strong uptrend,Nigerian equity market retracted violently in 2008 culminating into an unprecedented loss of46% and yet another 32% in 2009. The downward trend on equity prices in 2009 has beenlargely fueled by deteriorating macroeconomic indicators which probably results from theglobal financial crisis as shown in figure 1 below.

Does Oil Price Uncertainty Transmit to Stock Market Activities in Nigeria? 365
As regards the Nigerian Stock Exchange All Share Index 2009 monthly returns, this hasshown a decreasing rate of decline over the period of 2009 probably resulting also from theglobal financial crisis as shown in the figure 2 below.
Figure 1: Nigeria Stock Exchange ASI (2000 – 2009)
Figure 2: Nigerian Stock Exchange All Share Index (January – November 2009)
Ajakaiye and Fakiyesi (2009) also noted that All Share Index of the 233 listed equities hasbeen growing over the years from a value of 12,137 in 2002 to 66,371 in March 2008, with amarket capitalization of about N12.640 trillion. However, the values fell precipitously to 22,349points in January 2009 with a market capitalization of N4,998 trillion because of the globalfinancial meltdown. By the end of the first week of March 2009, the values had declined to21,893 points, with a market capitalization of 4900 trillion. This value had further declined to21,608 points, with a market capitalization of 4836 trillion, by the end of the second week ofMarch 2009. This reveals that between March 2008 and March 2009, the all share index hadlost a total share of 67%, while market capitalization had lost 62% of its value.

366 Ifuero Osad Osamwonyi and Clement Ighodaro
As at August 2009, the market value of the 292 listed securities closed at N7.92 trillion,down by 6.62% from N8.48 trillion recorded in July. The fall in market capitalization can bethe result of the fall in the price of equities and the delisting of FGN Bonds. Furthermore, the210 listed equities accounted for N5.3 trillion or 66.53% of total market capitalization downby 9.23% from the N5.8 trillion or 68.45% recorded in July (http://www.nigeriastockexchange.com/downloads/august2009.pdf). Furthermore, as at October 21st
2009, the market capitalization of the listed 197 first tier equities decreased by 3.13% to closeat N5.25 trillion on weekly evaluation while it fell by 0.98% on daily analysis (The Nation,2009).
4. THE METHODOLOGY, ESTIMATION TECHNIQUES AND RESULTS
The Data
The data (1979 – 2007) used for the paper were sourced from the Central Bank of NigeriaStatistical Bulletin 2007, volume 18. The variables estimated in their log form are LSTMrepresenting stock market activities. Market capitalization is used as proxy for stock marketactivities. It is the annual market capitalization on the Nigerian Stock exchange in Billion. It isthe sum of government securities, debts and equities. Another variable used is the log of industrialproduction represented as LINDP. The index of industrial production; total for manufacturing,mining and electricity consumption with 1985 as a base year is used as proxy for this. LOPR isthe log of oil prices. The international spot price for Bonny Light in US$ per barrel is used herewhile log of interest rate is represented as LINTR. It used as proxy for monetary policy.
Descriptive Statistics
The diagnostic statistical tests of the variables are first undertaken to check the characteristics ofthe aforementioned data. The summary of descriptive statistics is shown in Table 1. From theresult, all the variables are positively skewed except the log of industrial production. This showsthat they are not very asymmetrical. Kurtosis values of all variables also show that the data is notnormally distributed because values of kurtosis are deviated from 3. So the descriptive statisticsshows that the values are not normally distributed about its mean and variance. For normallydistributed return series the skewness coefficient is zero and Kurtosis is 3. In a Gaussian distribution,it would expect that the kurtosis coefficient would be 3. Kurtosis generally either much higher orlower indicates extreme leptokurtic or extreme platykurtic (Parkinson, 1987). The coefficients ofKurtosis are less than 3 in all the variables, an indication that the series is slim and has long tail.Jarque-Bera test shows more clearly about the normal distribution of series. If it is zero it indicatesthat series are normally distributed which is however not the case with the result below.
Unit Root Tests and Results and Interpretation
For univariate time-series, analyses involving stochastic trends, Augmented Dickey-Fuller (ADF)unit root tests are calculated for the individual series to provide evidence on whether the variablesare integrated. Augmented Dickey-Fuller unit root tests are calculated for individual series toprovide evidence of the variables being stationary and integrated of the same order. The testinvolves the estimation of one of the following equations (1) – (3) respectively:

Does Oil Price Uncertainty Transmit to Stock Market Activities in Nigeria? 367
Table 1Descriptive Statistics
LSTM LINDP LOPR LINTR
Mean 1.975066 2.107699 1.424454 0.886590Median 1.821514 2.115943 1.404834 0.875061Maximum 4.123672 2.201124 1.856124 1.274158Minimum 0.698970 1.961895 1.107210 0.495544Std. Dev. 1.057096 0.062389 0.201020 0.240668Skewness 0.335645 -0.672139 0.530735 0.098124Kurtosis 1.875057 2.846594 2.514715 1.604374Jarque – Bera 1.930644 2.211996 1.646015 2.400096Probability 0.380861 0.330881 0.439109 0.301180Observations 27 29 29 29
t t-11
X = X +p
j t j tj
X ��
� � � � � �� (1)
t 0 t-11
X = + X +p
j t j tj
X ��
� � � � � � �� (2)
t 0 1 t-11
X = + t+ X +p
j t j tj
X ��
� � � � � � � �� (3)
Note that the additional lagged terms are also included to ensure that the errors areuncorrelated.
Table 2ADF Result
Variable ADF result Level of Conclusion ADF result Level of Conclusionwith only significance with intercept significanceIntercept and trend
LSTM -4.526361 1% I(2) -4.414818 5% I(2)(-3.7497) (-3.6219)
LOPR -5.104126 1% I(1) -5.794322 1% I(1)(-3.7076) (-4.3552)
LINTR -3.170513 5% I(1) -3.816842 5% I(1)(-2.9798) (-3.5943)
LINDP -3.741935 1% I(1) -3.715885 5% I(1)(-3.7076) (-3.5943)
*Figures in parenthesis indicate the critical level
The null hypothesis defines that the variable Xt is a non-stationary series (H
0 : � = 0) and is
rejected when � is significantly negative (Ha: ��< 0). If the calculated ADF statistic is higherthan McKinnon’s critical values, then the null hypothesis (H
0) is not rejected and the series is
non-stationary or not integrated of order zero. Alternatively, rejection of the null hypothesis

368 Ifuero Osad Osamwonyi and Clement Ighodaro
implies stationarity. Failure to reject the null hypothesis leads to conducting the test on thedifference of the series, so further differencing is conducted until stationarity is reached andthe null hypothesis is rejected (Dickey and Fuller 1979). Table 2 revealed that none of thevariable is stationary at level at 1%, 5% and even 10% level of significance. While the log. ofstock market operation (LSTM) is integrated of order two, I(2), all the other variables areintegrated of order one i.e. I(1).
Johansen Cointegration Test
Once a unit root has been confirmed for a data series, the question is whether there exists along-run equilibrium relationship among variables. Cointegration tests in this paper are conductedusing the method developed by (Johansen and Juselius, 1990); (Johansen, 1988). The Johansenmethod applies the maximum likelihood procedure to determine the presence of cointegratedvectors in non-stationary time-series. Two test statistics are stated by Johansen and Juselius(1990) and Johansen (1988) are used to test the number of cointegrating vector, also known asrank of �. They are the trace statistic (�
trace) and the maximum Eigenvalue (�
max) statistic. The
likelihood ratio statistic (LR) for the trace test (�trace
) as suggested by Johansen (1988) is givenby equation (4) as below:
1
( ) ln(1 )p
trace il r
r T�
� �
� � � � �� (4)
Where i
�
� is the largest estimated value of ith characteristic root i.e. Eigenvalue obtained fromthe estimated � matrix, r = 0, 1, 2, ..., p–1 and T is the number of observations used.
Furthermore, the maximum Eigenvalue (�max
) statistic is given by equation (5) below:
1max ( , 1) ln(1 )rr r T�
�� � � � � � (5)
From (4), the null hypothesis that the number of distinct characteristic roots is less than orequal to r is tested by the �
trace statistics. Where r in this case is 0, 1 or 2 against the general
alternative. On the other hand, from (5), the null hypothesis that the number of r co-integratedvectors is r against the alternative of r + 1 co-integrated vectors. The result as shown in table
Table 3Johansen Cointegration Result
Sample: 1979 2007Included observations: 27Test assumption: Linear deterministic trend in the dataSeries: LSTM LINDP LINTR LOPRLags interval: 1 to 1
Likelihood 5 Per cent 1 Per cent HypothesizedEigenvalue Ratio Critical Value Critical Value No. of CE(s)
0.643182 55.44879 47.21 54.46 None **0.522079 27.62451 29.68 35.65 At most 10.242329 7.690157 15.41 20.04 At most 20.007288 0.197499 3.76 6.65 At most 3
*(**) denotes rejection of the hypothesis at 5%(1%) significance levelL.R. test indicates 1 cointegrating equation(s) at 5% significance level
Does Oil Price Uncertainty Transmit to Stock Market Activities in Nigeria? 369
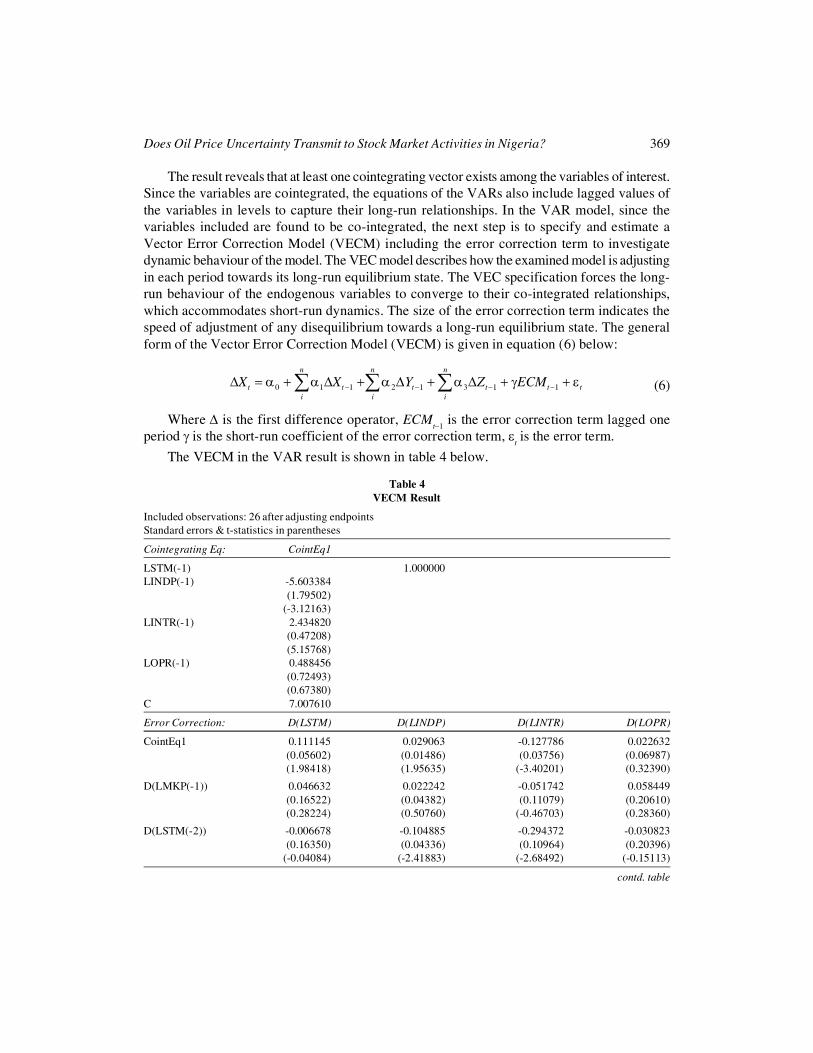
The result reveals that at least one cointegrating vector exists among the variables of interest.Since the variables are cointegrated, the equations of the VARs also include lagged values ofthe variables in levels to capture their long-run relationships. In the VAR model, since thevariables included are found to be co-integrated, the next step is to specify and estimate aVector Error Correction Model (VECM) including the error correction term to investigatedynamic behaviour of the model. The VEC model describes how the examined model is adjustingin each period towards its long-run equilibrium state. The VEC specification forces the long-run behaviour of the endogenous variables to converge to their co-integrated relationships,which accommodates short-run dynamics. The size of the error correction term indicates thespeed of adjustment of any disequilibrium towards a long-run equilibrium state. The generalform of the Vector Error Correction Model (VECM) is given in equation (6) below:
0 1 1 2 1 3 1 1
n n n
t t t t t ti i i
X X Y Z ECM� � � �� � � � � � � � � � � � � � � �� � � (6)
Where � is the first difference operator, ECMt–1
is the error correction term lagged oneperiod � is the short-run coefficient of the error correction term, �
t is the error term.
The VECM in the VAR result is shown in table 4 below.
Table 4VECM Result
Included observations: 26 after adjusting endpointsStandard errors & t-statistics in parentheses
Cointegrating Eq: CointEq1
LSTM(-1) 1.000000LINDP(-1) -5.603384
(1.79502)(-3.12163)
LINTR(-1) 2.434820(0.47208)(5.15768)
LOPR(-1) 0.488456(0.72493)(0.67380)
C 7.007610
Error Correction: D(LSTM) D(LINDP) D(LINTR) D(LOPR)
CointEq1 0.111145 0.029063 -0.127786 0.022632 (0.05602) (0.01486) (0.03756) (0.06987) (1.98418) (1.95635) (-3.40201) (0.32390)
D(LMKP(-1)) 0.046632 0.022242 -0.051742 0.058449 (0.16522) (0.04382) (0.11079) (0.20610) (0.28224) (0.50760) (-0.46703) (0.28360)
D(LSTM(-2)) -0.006678 -0.104885 -0.294372 -0.030823 (0.16350) (0.04336) (0.10964) (0.20396)(-0.04084) (-2.41883) (-2.68492) (-0.15113)
contd. table

370 Ifuero Osad Osamwonyi and Clement Ighodaro
D(LINDP(-1)) -0.081310 -0.069985 -0.209706 -0.849262 (0.72593) (0.19252) (0.48678) (0.90554)(-0.11201) (-0.36352) (-0.43080) (-0.93785)
D(LINDP(-2)) 0.094427 -0.022562 0.010258 0.759490 (0.73545) (0.19504) (0.49317) (0.91742) (0.12839) (-0.11567) (0.02080) (0.82786)
D(LINTR(-1)) -0.002898 0.000615 -0.165904 0.339281 (0.25397) (0.06735) (0.17030) (0.31681)(-0.01141) (0.00912) (-0.97417) (1.07093)
D(LINTR(-2)) -0.032125 0.097226 -0.013827 -1.152767 (0.25695) (0.06814) (0.17230) (0.32052)(-0.12503) (1.42678) (-0.08025) (-3.59654)
D(LOPR(-1)) 0.088539 -0.028260 -0.008985 -0.401685 (0.15526) (0.04118) (0.10411) (0.19368) (0.57026) (-0.68632) (-0.08630) (-2.07398)
D(LOPR(-2)) 0.072570 0.004448 0.056706 -0.098693 (0.14989) (0.03975) (0.10051) (0.18697) (0.48416) (0.11189) (0.56419) (-0.52785)
C 0.124214 0.017149 0.036315 0.005090 (0.04113) (0.01091) (0.02758) (0.05131) (3.01982) (1.57203) (1.31662) (0.09921)
R-squared 0.302460 0.451984 0.593452 0.637002
Adj. R-squared -0.089907 0.143725 0.364769 0.432815Sum sq. resids 0.235641 0.016574 0.105958 0.366673
S.E. equation 0.121357 0.032185 0.081378 0.151384
F-statistic 0.770860 1.466249 2.595088 3.119706
Log likelihood 24.25364 58.76218 34.64412 18.50555
Akaike AIC -1.096434 -3.750937 -1.895701 -0.654273
Schwarz SC -0.612551 -3.267053 -1.411818 -0.170390Mean dependent 0.131719 0.005314 -0.008766 0.006353
S.D. dependent 0.116244 0.034781 0.102104 0.201010
Determinant Residual Covariance 2.02E-10
Log Likelihood 142.6171
Akaike Information Criteria -7.585934
Schwarz Criteria -5.456848
The result shows that in the long run, though, the lag value of industrial production is significantin the determination of stock market activities, it has a negative sign contrary to expectation. Forexample, an increase in industrial production is a strong indication of economic growth, hencemay lead to more investment tendencies in the Nigerian stock market. The negative sign may beas a result poor production base of the Nigerian industrial production which may also result frominfrastructure failure. On the other hand, oil price appears not to be significant in the determinationof stock market activities in the long run, though, it is properly signed. An increase in oil prices,ceteris paribus, will lead to boom in economic activities in Nigeria. This may also lead to a boomin stock market activities since Nigeria is predominantly an oil exporting country and earns morethan 90% of foreign exchange from here. Though, interest rate is significant, it also has a contrary

Does Oil Price Uncertainty Transmit to Stock Market Activities in Nigeria? 371
sign. In the short run, the error correction term of market capitalization is not properly signed andtherefore does not show an adjustment to equilibrium.
Impulse Response Function
The impulse response in the stock market activities over a five – year period are presented in table5 below. The result shows the coefficients of stock market activities are relatively large implyingthat there is high unpredictability of stock market activities. This unpredictability becomes largeras the time horizon increases. The coefficients of interest rate and oil prices are reported to havepositive signs implying that the higher the level of uncertainty in the oil market, the more the stockmarket is affected. Furthermore, the result shows that no matter the interest on savings, individualswill still wish to invest in the stock market. The second segment of the table shows the response ofinterest rate to changes in the other variables while the third and the fourth segments show responseof industrial production and oil prices to changes in the other variables. The variations that occurredin the coefficients over the time horizon imply that the responses may be very sensitive to time.
Table 5Impulse Response Function
Response of LSTM:Period LSTM LINTR LINDP LOPR
1 0.095200 0.000000 0.000000 0.0000002 0.123675 0.011532 -0.013826 0.0165603 0.137311 0.018185 -0.023562 0.0263434 0.136828 0.011433 -0.028582 0.0283905 0.145549 0.012196 -0.033850 0.032605
Response of LINTR:Period LSTM LINTR LINDP LOPR
1 0.036885 0.052104 0.000000 0.0000002 -0.000200 0.028962 0.010727 -0.0082783 -0.040169 0.023624 0.025234 -0.0055564 -0.040965 0.024184 0.030658 -0.0198485 -0.056504 0.017199 0.040609 -0.022594
Response of LINDP:Period LSTM LINTR LINDP LOPR
1 -0.003943 0.003274 0.024722 0.0000002 0.004413 0.006242 0.018613 -0.0016313 0.000759 0.012373 0.016453 0.0018064 -0.002895 0.010093 0.016669 5.86E-055 -0.008229 0.007335 0.018506 -0.000198
Response of LOPR:Period LSTM LINTR LINDP LOPR
1 0.005625 -0.000786 0.025069 0.1159402 0.029542 0.016874 -0.008854 0.0706503 -0.044528 -0.056165 0.026913 0.0778514 0.021728 -0.007100 0.004570 0.0867215 0.049556 -0.007029 -0.007705 0.078873
Ordering: LSTM LINTR LINDP LOPR
372 Ifuero Osad Osamwonyi and Clement Ighodaro
Forecast Error Variance Decomposition in VAR
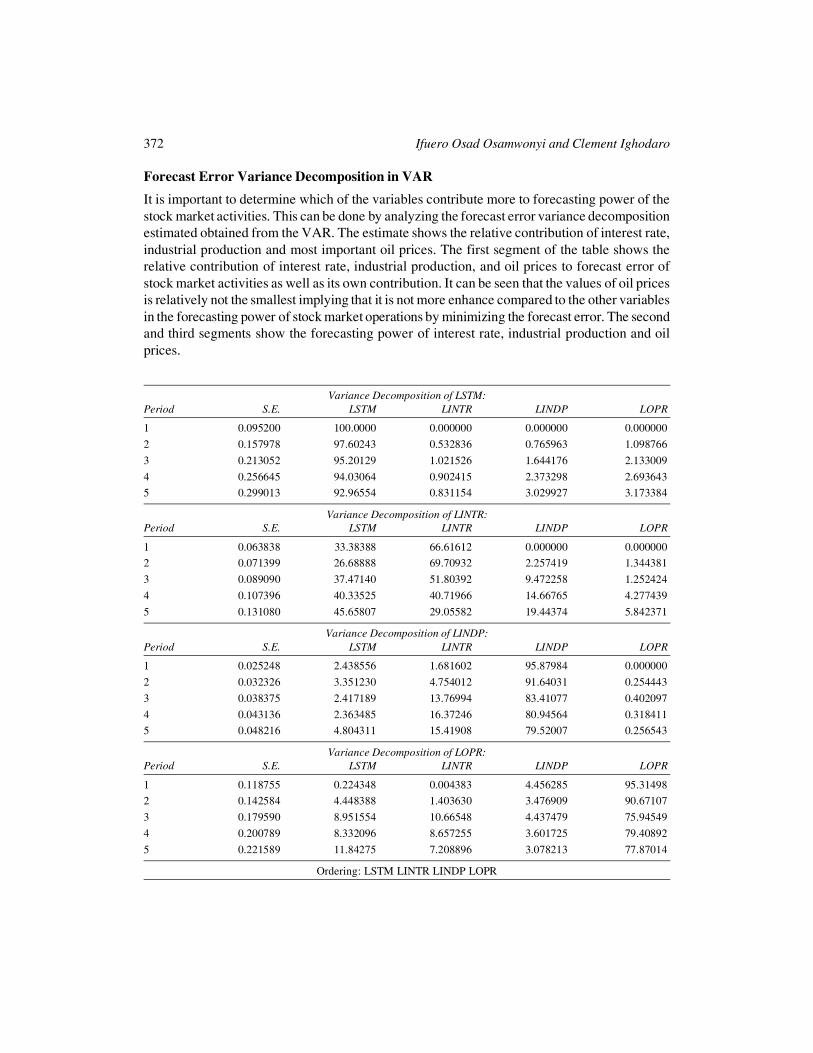
It is important to determine which of the variables contribute more to forecasting power of thestock market activities. This can be done by analyzing the forecast error variance decompositionestimated obtained from the VAR. The estimate shows the relative contribution of interest rate,industrial production and most important oil prices. The first segment of the table shows therelative contribution of interest rate, industrial production, and oil prices to forecast error ofstock market activities as well as its own contribution. It can be seen that the values of oil pricesis relatively not the smallest implying that it is not more enhance compared to the other variablesin the forecasting power of stock market operations by minimizing the forecast error. The secondand third segments show the forecasting power of interest rate, industrial production and oilprices.
Variance Decomposition of LSTM:Period S.E. LSTM LINTR LINDP LOPR
1 0.095200 100.0000 0.000000 0.000000 0.000000
2 0.157978 97.60243 0.532836 0.765963 1.098766
3 0.213052 95.20129 1.021526 1.644176 2.133009
4 0.256645 94.03064 0.902415 2.373298 2.6936435 0.299013 92.96554 0.831154 3.029927 3.173384
Variance Decomposition of LINTR:Period S.E. LSTM LINTR LINDP LOPR
1 0.063838 33.38388 66.61612 0.000000 0.0000002 0.071399 26.68888 69.70932 2.257419 1.344381
3 0.089090 37.47140 51.80392 9.472258 1.252424
4 0.107396 40.33525 40.71966 14.66765 4.277439
5 0.131080 45.65807 29.05582 19.44374 5.842371
Variance Decomposition of LINDP:Period S.E. LSTM LINTR LINDP LOPR
1 0.025248 2.438556 1.681602 95.87984 0.000000
2 0.032326 3.351230 4.754012 91.64031 0.254443
3 0.038375 2.417189 13.76994 83.41077 0.402097
4 0.043136 2.363485 16.37246 80.94564 0.3184115 0.048216 4.804311 15.41908 79.52007 0.256543
Variance Decomposition of LOPR:Period S.E. LSTM LINTR LINDP LOPR
1 0.118755 0.224348 0.004383 4.456285 95.314982 0.142584 4.448388 1.403630 3.476909 90.67107
3 0.179590 8.951554 10.66548 4.437479 75.94549
4 0.200789 8.332096 8.657255 3.601725 79.40892
5 0.221589 11.84275 7.208896 3.078213 77.87014
Ordering: LSTM LINTR LINDP LOPR
Does Oil Price Uncertainty Transmit to Stock Market Activities in Nigeria? 373
Granger Causality
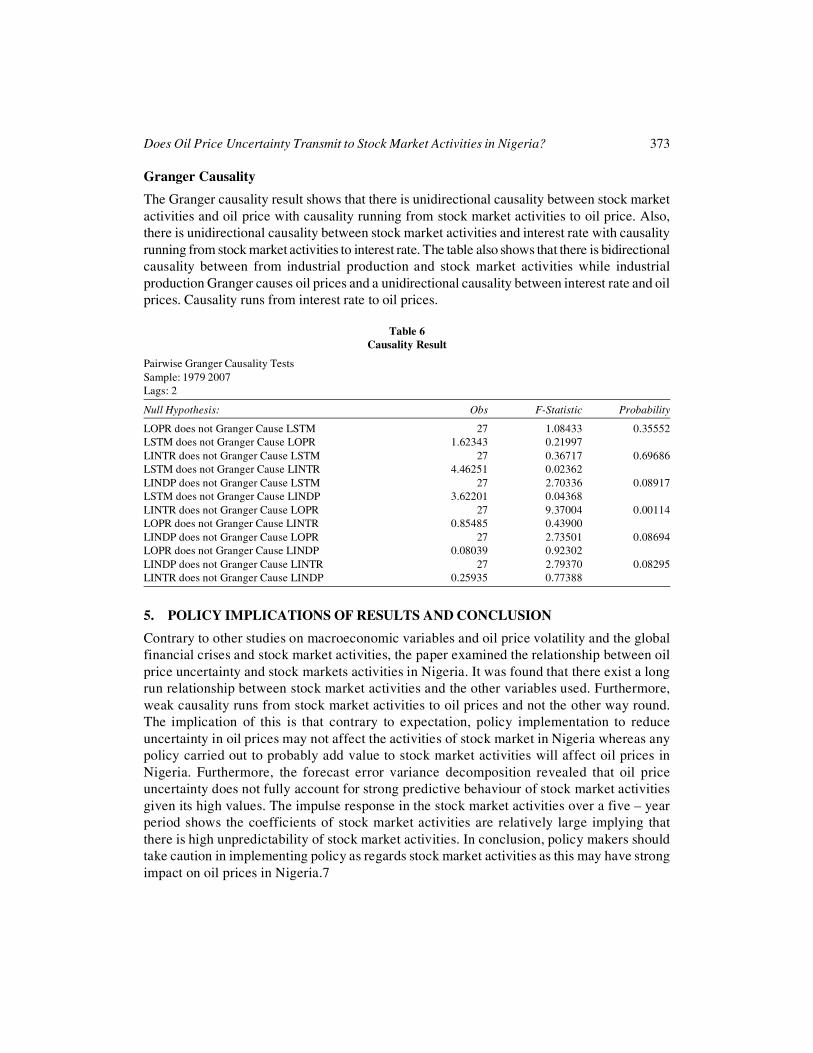
The Granger causality result shows that there is unidirectional causality between stock marketactivities and oil price with causality running from stock market activities to oil price. Also,there is unidirectional causality between stock market activities and interest rate with causalityrunning from stock market activities to interest rate. The table also shows that there is bidirectionalcausality between from industrial production and stock market activities while industrialproduction Granger causes oil prices and a unidirectional causality between interest rate and oilprices. Causality runs from interest rate to oil prices.
Table 6Causality Result
Pairwise Granger Causality TestsSample: 1979 2007Lags: 2
Null Hypothesis: Obs F-Statistic Probability
LOPR does not Granger Cause LSTM 27 1.08433 0.35552LSTM does not Granger Cause LOPR 1.62343 0.21997LINTR does not Granger Cause LSTM 27 0.36717 0.69686LSTM does not Granger Cause LINTR 4.46251 0.02362LINDP does not Granger Cause LSTM 27 2.70336 0.08917LSTM does not Granger Cause LINDP 3.62201 0.04368LINTR does not Granger Cause LOPR 27 9.37004 0.00114LOPR does not Granger Cause LINTR 0.85485 0.43900LINDP does not Granger Cause LOPR 27 2.73501 0.08694LOPR does not Granger Cause LINDP 0.08039 0.92302LINDP does not Granger Cause LINTR 27 2.79370 0.08295LINTR does not Granger Cause LINDP 0.25935 0.77388
5. POLICY IMPLICATIONS OF RESULTS AND CONCLUSION
Contrary to other studies on macroeconomic variables and oil price volatility and the globalfinancial crises and stock market activities, the paper examined the relationship between oilprice uncertainty and stock markets activities in Nigeria. It was found that there exist a longrun relationship between stock market activities and the other variables used. Furthermore,weak causality runs from stock market activities to oil prices and not the other way round.The implication of this is that contrary to expectation, policy implementation to reduceuncertainty in oil prices may not affect the activities of stock market in Nigeria whereas anypolicy carried out to probably add value to stock market activities will affect oil prices inNigeria. Furthermore, the forecast error variance decomposition revealed that oil priceuncertainty does not fully account for strong predictive behaviour of stock market activitiesgiven its high values. The impulse response in the stock market activities over a five – yearperiod shows the coefficients of stock market activities are relatively large implying thatthere is high unpredictability of stock market activities. In conclusion, policy makers shouldtake caution in implementing policy as regards stock market activities as this may have strongimpact on oil prices in Nigeria.7
374 Ifuero Osad Osamwonyi and Clement Ighodaro
References
Ågren, M. (2006), Does Oil Price Uncertainty Transmit to Stock Markets? Department of Economics, UppsalaUniversity, Working Paper 2006: 23.
Ajakaiye, O. and T. Fakiyesi (2009), Global Financial Crisis, Discussion Series Paper 8: Nigeria. OverseasDevelopment Institute, London.
Arouri, M. and J. Fouquau (2009), “On the Short-Term Influence of Oil Price Changes on Stock Markets inGCC Countries: Linear and Nonlinear Analyses. See: http://arxiv.org/abs/0905.3870.
Basher, S.A. and P. Sardosky (2006), “Oil Price Risk and Emerging Stock Markets” Global Finance Journal,17, 224-251.
Central Bank of Nigeria, CBN (2008), Annual Report and Financial Statements for the Year Ended 31st December,2008. CBN.
Ciner, C. (2001), “Energy Shocks and Financial Markets: Nonlinear Linkages” Studies in Nonlinear Dynamics& Econometrics, 5(3), 203-212.
Cologni, A. and M. Manera (2008), “Oil Prices, Inflation and Interest Rates in a Structural Cointegrated VARModel for the G-7 Countries” Energy Economics, 38, 856–888.
Cong, R. G., Y. M. Wei, J. L. Jiao and Y. Fan, (2008), “Relationships between Oil Price Shocks and StockMarket: An Empirical Analysis from China’ Energy Policy, 36, 3544-3553.
Dickey D. and W. Fuller (1979): “Distribution of the Estimators for Autoregressive Time Series with UnitRoot”. Journal of American Statistical Association, 74: 427-431.
Gogineni, S. (2009), Oil and the Stock Market: An Industry Level Analysis, Working Paper, University of Oklahoma.
Hammoudeh, S. and E. Aleisa (2002), “Relationship between Spot/Futures Price of Crude Oil and EquityIndices for Oil-Producing Economies and Oil-Related Industries” Arab Economic Journal, 11, 37-62
Hammoudeh, S. and E. Aleisa (2004), “Dynamic Relationships among GCC Stock Markets and NYMEX OilFutures” Contemporary Economics Policy, 22, 250-269.
Hammoudeh, S. and H. Li (2005), “Oil Sensitivity and Systematic Risk in Oil-Sensitive Stock Indices” Journalof Economics and Business, 57, 1-21.
Henriques, I. and P. Sadorsky (2008), “Oil Prices and the Stock Prices of Alternative Energy Companies”Energy Economics, 30, 998-1010.
Johansen, S (1988), “Statistical Analysis of Cointegration Vectors” Journal of Economic Dynamics and Control,12: 231-254.
Johansen, S. and K. Juselius (1990), “Maximum Likelihood Estimation and Inference on Cointegration withApplications to the Demand for Money” Oxford Bulletin Economics Statistics 52: 169 -210.
Jones, C. M. and G. Kaul (1996), “Oil and the Stock Markets” Journal of Finance, 51(2), 463- 491.
Kaneko, T. and B. S. Lee (1995), “Relative Importance of Economic Factors in the U.S. and Japanese StockMarkets” Journal of the Japanese and International Economics, 9, 290-307.
Kilian, L. (2008), “A Comparison of the Effects of Exogenous Oil Supply Shocks on Output and Inflation in theG7 Countries” Journal of the European Economic Association, 6(1), 78–121.
Maghyereh, A. (2004), “Oil Price Shocks and Emerging Stock Markets: A Generalized VAR Approach”International Journal of Applied Econometrics and Quantitative Studies, 1(2), 27-40.
Maku, O. E. and A, Atanda (2007), “Does Macroeconomic Indicators Exert Shock on the Nigerian CapitalMarket?” Munich Personal RePEc Archive MPRA. http://mpra.ub.uni-muenchen.de/17917/MPRA PaperNo. 17917,

Does Oil Price Uncertainty Transmit to Stock Market Activities in Nigeria? 375
Malik, F. and S. Hammoudeh (2007), “Shock and Volatility Transmission in the Oil, US and Gulf EquityMarkets” International Review of Economics and Finance, 16, 357-368.
Masih, R., P. Sanjay, and L. De Mello (2010), “Oil Price Volatility and Stock Price Fluctuations in an EmergingMarket: Evidence from South Korea”
Meristem Research of Nigerian Stock Excjange, (2009). “Portfolio Restructuring: Proactive Strategy in VolatileMarket” Sunday Punch 17(19,563). 23.
Nandha, M. and R. Faff (2007), “Does Oil Move Equity Prices? A Global View” Energy Economics, 30, 986-997.
Olomola, P. A.,and Dejumo, A. V. (2006), “Oil Price Shock and Macroeconomic Activities in Nigeria”International Research Journal of Finance and Economics http://www.eurojournals.com/finance.htm
Papapetrou, E. (2001), “Oil Price Shocks, Stock Markets, Economic Activity and Employment in Greece”,EnergyEconomics, 23, 511-532.
Park, J. and R. A. Ratti (2008), Oil Price Shocks and Stock Markets in the U.S. and 13 European Countries,Energy Economics, 30, 2587-2608.
Sadorsky, P. (1999), “Oil Price Shocks and Stock Market Activity” Energy Economics, 21, 449- 469.
Sadorsky, P. (2001), “Risk Factors in Stock Returns of Canadian Oil and Gas Companies” Energy Economics,23, 17-28.
Tansuchat, R. and McAleer M (2010), Conditional Correlations and Volatility Spillovers between Crude Oiland Stock Index Returns CIRJE Discussion Papers http://www.e.u-tokyo.ac.jp/cirje/research/03research02dp.html
The Nation (2009). “Nigerian Stock Loses N46b as Global Crisis Deepens” Tuesday 24th November.


�����������������������������������������������������������������������������������������������������������������������������������������������������������������������������������������������������������������