does microfinance reach the poorest? empirical evidence of programme outreach · pdf...
TRANSCRIPT

DOES MICROFINANCE REACH THE POOREST? EMPIRICAL EVIDENCE OF PROGRAMME
OUTREACH FROM RURAL PAKISTAN
Asad K. Ghalib
Abstract
Microfinance has emerged on the global scale as a key strategy to reduce poverty and promote development. Most of the relevant literature however, tends to concentrate on breadth as opposed to depth of programme outreach. This paper is based on a primary household survey of 1,132 respondents in the Punjab Province of Pakistan to assess which category of the poor is being served by microfinance institutions. Are they the very poor, middle poor or less poor ones? In order to make comparisons, borrower (treatment) and non-borrower (control) households are interviewed and by employing Principal Component Analysis (PCA), each household is allocated a specific poverty score, in relation to all other households in the sample. Once the poverty index is obtained, sampled households are ranked in order of varying poverty levels. Comparisons are later made between borrower and non-borrower households to estimate programme outreach. The paper concludes with findings that the depth of poverty outreach is significantly lower than what has been hitherto proclaimed by service providers and reflects on policy implications to enhance depth (as opposed to breadth) of programme outreach to address the needs of the poorest of the poor in order to contribute meaningfully and effectively towards combating poverty.
Keywords: Microfinance, poverty alleviation, depth of programme outreach, Pakistan
Asad Ghalib is Research Associate at the Brooks World Poverty Institute, The University of Manchester,
UK.

2
1 Introduction
Improving access to financial services in developing countries has become a major policy objective, as it is widely believed that economic growth can be accelerated substantially by both deepening and widening outreach of financial services (Chandrasekhar 2004; Honohan 2006; Demirguc-Kunt, Beck et al. 2008). Financial services outreach is associated with giving access to capital and providing job opportunities to the poor. Despite efforts to provide access to financial services, it has often been argued that both formal and informal sectors in the developing world have failed the people in rural communities (Chowdhury 2008), primarily because limited access to such services in the developing world is one of the main obstacles not only to income generation (Beck, Demirguc-Kunt et al. 2005; Ghalib and Hailu 2008) but also towards social protection (Barrientos 2010a, b), and as conversed by Barrientos and Hulme (2008:15) “finance is rightly perceived as one of the main constraints on the expansion of social protection, especially in low-income countries”.
The rural poor in developing economies have two main sources of access to financial services: institutional (such as cooperatives, commercial banks, regional rural banks, etc.) and non-institutional, which may include moneylenders, landlords, traders, friends and relatives (Gupta and Chaudhuri 1997). Conventional banks face a series of problems in extending services to the rural poor, as they come from outside the communities in which they seek to serve and lack adequate and efficient systems to disburse and collect funds profitably in poor areas (Armendariz and Morduch 2005). Since the typical borrower in the unorganized credit market has no, or very limited access to the organized market (Sundrum 1992; Gupta and Chaudhuri 1997), he resorts to private money lenders in order to finance his immediate needs. Consequently, such lenders have traditionally been among the primary source of finance at rural levels (Bhaduri 1977; Rao 1980).
Unfortunately, credit market isolation coupled with an inelastic demand for credit, allows the private moneylender to decide freely what interest rate to charge (Sundrum 1992; Gupta and Chaudhuri 1997). Moreover, due to multiple types of credit arrangements, there is a wide range in interest rates (Germidis, Kessler et al. 1991). Since informal moneylenders tend to operate under conditions of monopolistic competition, their low-income borrowers generally pay much higher interest for credit than would be necessary if commercial microfinance were widely available through financial institutions with broad outreach (Robinson 2001). Studies by Dowla (1998) reveal that interest rates being charged by the informal sector are simply exorbitant and may vary anywhere from 10 to 120 percent per annum for initial investment, and up to 240 percent for working capital financing. Apart from the usurious rates charged, the highly personalized relations between lender and borrower, through a system that is usually deeply embedded in the social structures (Robinson 2001) permit the lender to secure from the borrower the collateral which the latter cannot employ in the organized market (Bhaduri 1977; Rao 1980). Robinson (2001) argues that given the large share of credit market which moneylenders hold in many developing countries, the high interest that borrowers pay can have a substantial negative effect on development efforts, as it tends to impede the growth and progress of borrowers’ microenterprises.
3
The restraints and inadequacies in the formal as well as informal financial sectors, as noted above, have led not only to the evolution of Microfinance (Chowdhury 2008; 2009), but also towards its immense popularity all over the developing world as a key tool in development-related programs (Germidis, Kessler et al. 1991; De Aghion and Morduch 2000; Cheston and Kuhn 2002; Gallardo 2003; Brau and Woller 2004; Dunford 2006; Chowdhury 2009). The underlying premise of microcredit is to provide credit without the borrower having to surrender his assets as security in case of non-payment. Yunus criticizes collateral provisions for depriving poor people of credit facilities within the formal financial sector institutions, stating that it constitutes a form of ‘financial apartheid’ (Yunus 1997). Despite the absence of collateral, repayment rates are even higher than collateralized lending by the traditional banking sector, and microfinance institutions now reach well over 100 million clients and achieve impressive repayment rates on loans (Cull, Demirguc-Kunt et al. 2009).
This paper assesses the depth of microfinance program outreach in rural Pakistan and consists of five main sections: following this brief introduction that looked into the underlying factors that led to the evolution of microfinance, its fundamental principles and how the model endeavors to challenge and defy the age-old, established practice of private, collateralized money-lending to the rural poor, section two briefly explores current literature on poverty targeting and outreach. It examines how, why and to what extent microfinance providers extend services to the ‘poorest of the poor’ and how such depth (as opposed to breadth) of program outreach impacts both service providers and consumers alike. Section three leads a discourse on Pakistan’s poverty profile and the current state of the microfinance industry in the country. Section four pertains to empirical work carried out that measures the depth of program outreach by means of an extensive household survey carried out across the rural parts of the Punjab province of Pakistan, in order to gauge how successful are various programs in reaching the bottom poor. Finally, the concluding section draws together the major points of the paper, comments on its findings, and discusses policy implications to target the poor and deepen outreach.
2 Financial Services Outreach Poverty Targeting and Sustainability: Concepts, Measures and Dimensions
Development policies are either targeted at certain specific individuals or segments of the society (‘targeting’), or are designed to influence the entire population (‘universalism’). Mkandawire (2005) argues that there is hardly ever pure universalism or targeting, however; policy regimes are often hybrid and tend to lie between these two extremes. Since the 1980s, however, the balance has tilted from universalistic policies towards targeting (ibid.). The principles, cost-related potential benefits, as well as ethical and political problems of targeting versus broad or universal services have been extensively discussed in literature (Besley and Kanbur 1993; Sen 1995; Johannsen 2006). Historically, during the late seventies and early eighties, economists devoted considerable attention to the distributional effects of projects. This attention reflected long-standing concerns of applied welfare economists about the
4
distributive implications of prescriptive judgements (Little 1950; Londero 2001). The outcome, according to Johannsen (2006) is that ‘both our understanding of poverty and the measurement approaches have considerably improved the targeting efforts of diverse types during the last decades’. Londero (2001) asserts that concerns about the ability of reaching the poor have led to promoting the design of poverty targeted interventions, in some cases leading to the dichotomous classification of projects into poverty targeted and the rest. To that effect, two definitions of poverty targeted projects seem to be in use: the first common definition describes a project as poverty targeted ‘whose design includes specific instruments to channel to the poor more benefits than would otherwise have been the case’, while the second definition pertains to headcount impact: ‘for a project to be poverty targeted, it is normally asked that the percentage of poor beneficiaries exceeds a certain pre-established threshold, for example, the headcount poverty incidence in the country or region’ (Londero 2001:3). Weiss (2005) classifies measures to reach the poor in four different ways: targeting by activity such as primary healthcare and education; targeting by indicators such as lack, or size of, ownership of land, form of dwelling, and sex of family head; targeting by location or geographical targeting; and targeting by self-selection such as employment creation where payment is either in cash or kind and subsidization of low quality food stuffs, etc. Outreach is one of three operational policy objectives for building inclusive financial systems. The other objectives, as noted by Zeller and Johannsen (2006) are financial sustainability of the microfinance institution and impact on poverty reduction. According to Daley-Harris (2006), microcredit outreach is still small despite the enormous increase in services to poor borrowers. In 2004, only 6 per cent of borrowers with an income below $ 365 per annum were able to borrow from microfinance institutions. Matin (2005), however asserts that despite the general consensus that microfinance does not reach the poorest; recent evidence suggests that nearly 15 percent of microfinance clients in Bangladesh are among the poorest. Despite such claims, there are still hundreds of millions of potential clients not being served.
As the field of microfinance has diversified and matured over the years, the dual goals of outreach and sustainability have led to considerable debate. While some argue that both are complementary, others contend that they are, in fact a trade-off, as the pursuit of institutions to become sustainable undermines their ability to reach and serve the poor, because as they gradually move towards profitability, they shift away from those poor clients that they had previously served with subsidies. According to Stephens and Clark (2002), those who contend that there is a trade-off between sustainability and outreach argue that the push for MFIs to cover operating costs, gradually become sustainable and wean themselves from donor financing, moves them away from targeting and reaching the very poor clients. Consequently, over the longer term, the poorest clients cannot afford to pay for the full cost of services. The argument follows that the push for sustainability and the ensuing demands that it places on institutions will result in a decrease in outreach, thereby leaving the poor underserved by new MFIs and abandoned by those who once counted the poor among their clients when they were subsidised by donor funding.

5
Cohen (2003) suggests that donors should invest in a range of promising financial institutions to ensure that diverse clients at many income levels are reached, extending outreach both outwards and downwards as far as possible. In practice, however, this might be arduous to achieve. This might be due to a number of reasons. Martin (2001:18), for instance identifies one major concern in efforts to fight poverty as identifying the poor since ‘it is difficult, time consuming and costly to measure poverty on a nationwide scale’. The success of poverty alleviation efforts typically depends on their ability to properly identify and target the objective population, i.e. the very poor. Churchill, Hirschland et al. (2002:3-4) describe why serving the extreme poor or those in remote areas is costly: ‘reaching the poor implies delivering services near their homes, which requires more staff time and greater internal controls. Furthermore, the extreme poor may need to be actively recruited, exclusively targeted, or offered different or more flexible products. These strategies increase operating costs. The extreme poor or persons in remote areas may not be able to afford products priced to cover the associated risks and transaction costs. Managing a range of customized services can also drive up costs, making it difficult to viably serve the very poor. In particular, customized services will require field staff with a higher level of skills’. Higher operating costs imperil sustainability of service providers and the debate over institutional sustainability and depth of programme outreach amongst academics and practitioners continues, as some argue that institutions have to be – first and foremost – financially stable, that is, they are able to cover their operating costs. Some analysts have maintained that increasing the depth of outreach and financial sustainability are compatible objectives in the sense that increasing scale of operations will also increase the absolute number of poor people amongst clients: ‘It is scale, not exclusive focus, that determines whether significant outreach to the poor will occur’ (Zeller and Johannsen 2006:2). Several other authors presented analyses (see Hulme and Mosley 1996; Conning 1999; Lapenu and Zeller 2002; Paxton and Cuevas 2002; cited in Zeller and Johannsen 2006) that support the notion of a trade-off between improving depth of outreach, i.e. reaching relatively poorer people, and achieving financial sustainability.
2.1 Poverty Targeting and Outreach: Findings from Empirical Studies
Experiential work dedicated exclusively to poverty targeting and depth of outreach of microcredit programmes is relatively less. This is mostly because a majority of the work on programme outreach is usually found as being merely a part of larger and more comprehensive impact assessment studies that investigate economic poverty, household assets, household income and expenditure, community and social capital formation and gender empowerment, etc. While such studies highlight issues concerned with outreach, they often tend to overlook in-depth analysis and are generally more inclined towards discourses on economic and social impact on borrower livelihoods at a broader scale.
Despite dearth of dedicated research, there are instances of empirical work focused exclusively on poverty targeting and outreach. In an extensive study carried out in Western Cape Province in South Africa, for example, Adato and Haddad (2001) examine the targeting performance of seven programs and analyze the role of government, community-based organizations, trade unions, and the private sector in explaining targeting outcomes. The findings concluded that

6
the programs were not well-targeted geographically in terms of poverty, unemployment, or infrastructure and within localities; jobs went to the poor and unemployed, though not always the poorest. Srivastava (2004) addresses two broad questions related to poverty targeting programmes with particular reference to India: how much in aggregate does the government spend on poverty-targeted programs and how effective have these programs been in targeting the poor and in alleviating poverty. Martin (2001), in a study based in Mozambique, suggests that the most efficient method to identify and target the poor would be ‘geographic targeting’, which can be achieved by first generating a disaggregated map of poverty and living conditions by combining data from both a nationwide standards of living survey and a national population and housing census. Zeller and Johannsen (2006) use data from nationally- representative household expenditure surveys undertaken in 2004 in Bangladesh and Peru and examine the poverty status of clients of different types of microfinance institutions in both countries. The analyses show that microfinance institutions are able to reach the poor, but that also a large share of their clients belongs to the non-poor population.
2.2 The Effectiveness of Poverty Targeting and Programme Outreach in Poverty Reduction
Since microfinance programmes by nature and design rely on targeting mechanisms at the individual or household levels, they are often preceded by some categorical targeting towards geographic or demographic sub-groups (Johannsen 2006). Such ‘inherent targeting design’ of microfinance makes it more convenient to formulate policies towards effective and efficient programme outreach. The success of poverty alleviation efforts typically depends on their ability to properly identify and to target the objective population, i.e. the very poor. Ideally, one would like to identify such population at the individual level, and to design targeting programmes that reach them adequately (Martin 2001). This level of accuracy and efficiency obviously requires large amounts of resources for gathering information and administering the targeting programmes. With scarce resources and under time pressures for finding solutions for the large shares of the population living in poverty conditions, most countries have put aside the ‘ideal’ scheme and instead try to find alternative, but more practical approaches (ibid.). One of these approaches, ‘geographic targeting’, is recognized as one possible solution to the dilemma to identify the poor. Instead of aiming to identify and target the poor individuals and the households where they belong, it is administratively easier and cheaper to orient poverty alleviation efforts to the geographic areas where the poor actually live (Martin 2001).
How effective is targeting towards poverty alleviation? Goldberg (2005) cites two major studies pertaining to ASA and Grameen Bank that strongly suggest that microfinance works better for the poorest than the less-poor. Both organizations established their own programs to reach the hardcore poor. Neither involves grain handouts, but they offer very small loans with flexible repayment schedules (Goldberg 2005; Hulme 2008). Grameen’s ‘Struggling Members’ or ‘Beggars Program’ constitutes a typical loan to a beggar member amounting to Tk. 500 (US$ 9.00). It is both collateral and interest-free. The repayment schedule is flexible and decided by the struggling members themselves. The instalments are to be paid according to their convenience and earning capability. As of July 2009, about 111,645 beggars have already joined the programme. The total amount disbursed stands at Tk. 136.56 million (approx. US$ 2

7
million), out of which Tk. 102.26 million (US$ 1.48) has already been paid off (Grameen Bank 2009). BRAC’s own assessment of its impact found that while landless clients benefited least from the programme, while those with 1-50 decimals of land (‘the poor’) benefited most (Goldberg 2005). In a study that looked into inequality and the polarizing impact of microcredit in Zambia, Copestake (2002) found that clients below the poverty line benefited significantly more from access to credit. A study by Hossain and Diaz (1997) that evaluated a Grameen Bank replication in the Philippines found that income from older borrowers’ microenterprises was 3.5 times higher than newer borrowers’ enterprises, and older borrowers also increased income from other sources. On the contrary, however, a study on community-driven rural development projects carried out by the Inter-American Development Bank concurred that the poorest and the most vulnerable generally are not necessarily reached by targeting (Dahl-Ostergaard, Moore et al. 2003). Certain projects of The World Bank have tried to reach the poor through targeting, but there is limited evidence to show that they have done this more successfully than any other Bank investment. It is not surprising, therefore, that a recent literature review (Mansuri and Rao 2004; cited in The World Bank 2005) found that projects that rely on community participation have not been particularly effective at targeting the poor (The World Bank 2005). Despite results of studies noted above, the question of which group benefits most from microfinance is probably misguided. Evidence shows that the very poor do benefit from microfinance, and this justifies the decision of many programmes to recruit them (the ultra poor) and to develop products and services that suit their needs (Goldberg 2005). Some microcredit advocates argue that microfinance services should reach the ‘poorest of the poor’ as access to credit is a human right in the fight against economic exclusion and therefore narrow targeting of the poorest is necessary (in-depth targeting) (Aguilar 2006). Some studies have also shown that most poor people have benefited from microfinance programmes but that narrow targeting is not necessarily a condition for reaching the poorest while some large-scale non-targeted schemes have proven to reach the poorest (ibid.). 3 A Poverty Profile of Pakistan
According to the Government of Pakistan’s Population Census Organization (GoP 2010), the estimated population stood at 170 million in September 2010. With an average annual growth rate of 1.5 percent, it is expected to reach almost 200 million by 2015, the year to achieve the Millennium Development Goals (MDGs). Despite falling growth rates, Pakistan is still the sixth most populous country in the world; 36 percent of the total population is urbanised, with an estimated 113 million still living in rural areas (CIA 2010). Given an area of 796,095 square kilometres, the population density is 214 persons per square kilometre, with 2 percent of the world’s population living on less than 0.7 percent of the world’s land (The Library of Congress 2005). According to the projections of the United Nations, Pakistan will become the world’s third most populous country by 2050.

8
Despite considerable efforts through various poverty alleviation programmes, widespread social and economic poverty still remains a core problem in the country. The country’s economy is based predominantly on agriculture. Almost 65 percent of the population resides in rural areas (CIA 2010), and FAO (2009) estimates that around 66 percent of the population in Pakistan depends on agriculture for its livelihood. Although the agricultural sector showed high growth rates during the 1960s, the country witnessed high levels (about 40 percent) of poverty, which was particularly severe in the rural areas. Such high rates, however, continued to decline after 1970, with the trend continuing till 1987-1988 when poverty was recorded at 17.32 percent. Foreign remittances, increased private investment and good performance of the agricultural sector can be pinpointed as the primary factors for the declining trend in poverty (ibid.). After 1987-88, however, this trend reversed, and poverty in the country rose in the 1990s, peaking at an estimated 35 percent during 2001-02. Poverty estimates showed a downward trend in subsequent years and was recorded at around 24 percent in 2004-05, which coincided with the high levels of GDP growth rates during the same period (recorded at 9 and 5.8 percent respectively). According to The World Bank (2006), however, while provisional poverty estimates suggest that poverty declined between 2001 and 2005, the proportion of the population below the poverty line remains high, and despite recent indications of improvement, social and living standards remain well below those of countries with similar incomes and growth rates. The situation has worsened subsequently and it is expected to rise by at least 8 percentage points, to touch almost 30 percent, according to the latest available government statistics.
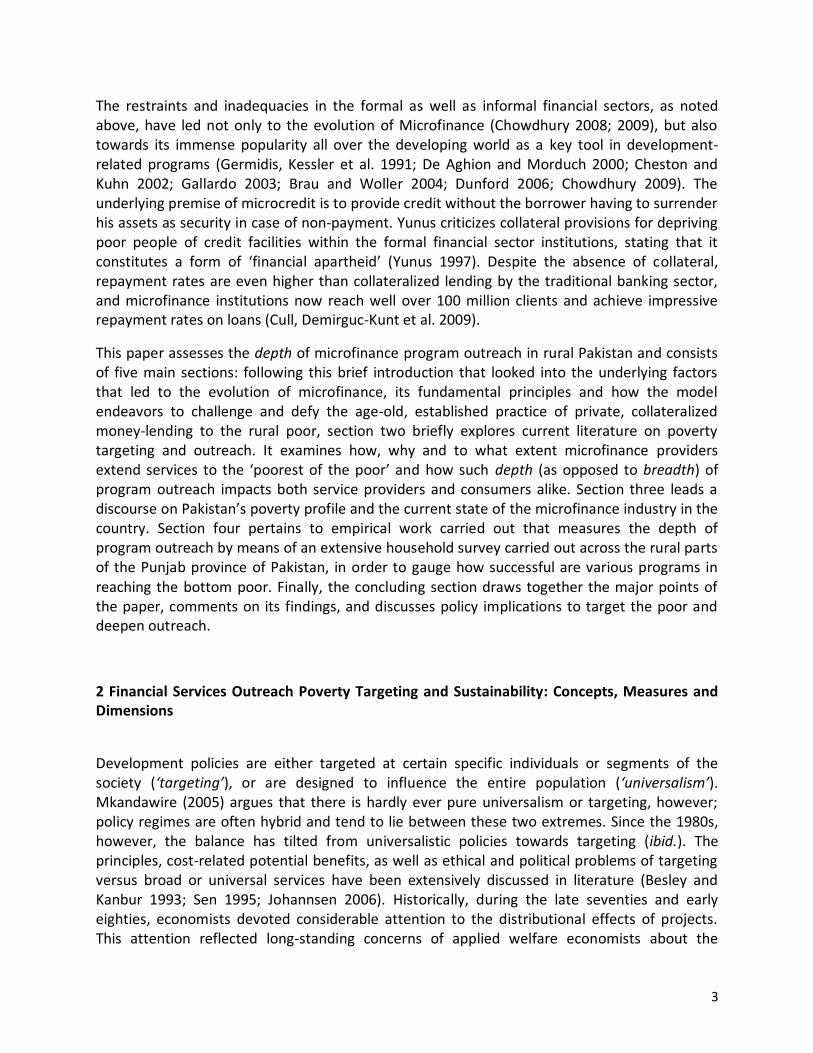
9
Figure 1. Poverty trend in Pakistan – percentage of population living below the official poverty line (1987-2009)
Sources: Compiled from GoP 2008, 2009, 2010; IMF 2010a; Ahmed and Donoghue 2010
A long-term trend of poverty in Pakistan over a period of 22 years, from 1987-2009, is shown in Figure 1 above. Poverty, measured in terms of the headcount of the poor (the proportion of the population with consumption below the official poverty line) shows how it has fluctuated over the period, as discussed above. The Government’s Mid-Term Development Framework (MTDF) aims to reduce poverty to 21 percent during 2009/10. The Millennium Development Goal of eradicating extreme poverty and hunger and halving (between 1990 and 2015) the proportion of people earning less than $1.25 a day is also given in order to put the current status in perspective. As shown in the figure, if Pakistan is to meet the target, poverty will have to be reduced at least to 13 percent by 2015. If estimates put poverty figures at around 40 percent for 2009, the targets set forth for the medium term are unlikely to be achieved.
At the time of writing, there were no officially published poverty figures for Pakistan for 2009, and researchers have estimated these at various levels. Ahmed and Donoghue (2010) for instance, estimate poverty to have climbed to as much as 40 percent, an increase of almost 80 percent from the 22 percent recorded in 2006. Given the poor performance that the country showed in terms of GDP growth rate (only 1.2 percent in 2009), coupled with the high inflation experienced during 2008-09 (22 percent) and the country’s involvement in internal and external conflicts, estimates such as these cannot be regarded as excessive. The recent flooding in the
0
5
10
15
20
25
30
35
40
45
Pe
rce
nta
ge
Period in years
% of Population living below the official poverty line

10
country will place an additional burden on the already fragile and dwindling economy and, as analysts say, will drag the country back by many years. Given these signs, poverty levels are set to rise in the coming years, and the targets set forth seem over- ambitious.
Table 1. Poverty profile of Pakistan
Poverty Band Ranking Range
Percentage of Population
Difference between
2001-02 and 2005-06
Estimated Head Count
(million) 2001-02 2005-06
Extremely poor <50% of poverty line 1.1 0.5 -0.6 0.81
Ultra poor >50% and <75% of poverty line
10.8 5.4 -5.4 8.69
Poor >75% and <100% of poverty line
22.5 16.4 -6.1 26.39
Vulnerable >100% and <125% of poverty line
22.5 20.5 -2 32.99
Quasi Non-poor >125% and <200% of poverty line
30.1 36.3 6.2 58.41
Non-poor > 200% of poverty line
13.0 20.9 7.9 33.63
Total Population 100 100 N/A 160.9
Sources: Compiled from Pakistan Economic Survey 2007-08, Finance Division, Ministry of Finance and PMN estimates, GoP 2008, 2009
As shown in Table 1 and Figure 2, 22.3 percent of the country’s population lives below the poverty line, with another 20.5 percent living in vulnerable conditions (Haq 2008). The table also shows a detailed breakdown of the 2005-06 statistics for the poor across four major groups (extremely poor, ultra poor, poor, and vulnerable) along with a comparison of data from 2001-02. There are some positive signs of reduction across all categories between the two time periods, as discussed in the section above.

11
Figure 2. Distribution of the Poor in Pakistan
Sources: Compiled from Pakistan Economic Survey 2007-08, Finance Division, Ministry of Finance and PMN estimates, GoP 2008, 2009
Poverty has multidimensional characteristics in Pakistan, due to which the poor not only have low levels of income, they simultaneously lack access to basic services such as clean drinking water, adequate sanitation, proper education, access to financial services, sufficient and timely health facilities, employment opportunities, efficient market access etc. (The World Bank 2009). A primary factor that contributes to rising poverty levels is the lack of access to basic services and facilities, which ultimately ‘undermines the capabilities of the poor, limits their opportunities to secure employment, results in their social exclusion and exposes them to exogenous shocks, and to make matters worse, the vicious cycle of poverty is accentuated when the governance structures exclude the most vulnerable from the decision making process’ (GoP 2009:43).
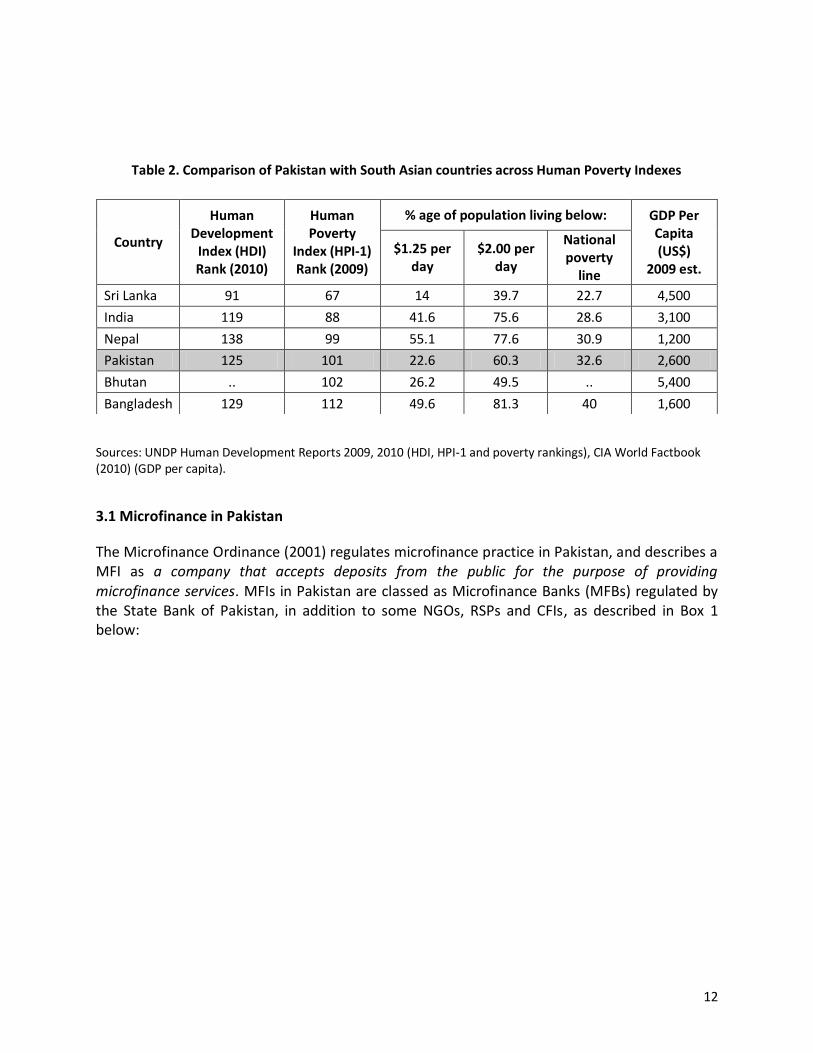
Table 2 below presents Pakistan’s poverty profile in a different context, in relation to other countries in the region. Based on the UNDP’s Annual Human Development Reports (2009 and 2010), countries in the region are ranked according to their Human Poverty Indexes (HPI-1). Each country’s percentage of population that lives below the standard measures (of less than $ 1.25 and $ 2.00 per day) and below the national poverty line are also given along with their GDP per capita. Although Pakistan ranks below Nepal and India, it fares better in terms of the percentage of population that lives below $1.25 and $2.00 per day. In comparison with Nepal, this can be attributed to the relatively better standing in terms of GDP per capita ($ 2,600 compared with $1,200).
Extremely poor1%
Ultra poor5%
Poor16%
Vulnerable21%
Quasi Non-poor36%
Non-poor21%
12
Table 2. Comparison of Pakistan with South Asian countries across Human Poverty Indexes
Sources: UNDP Human Development Reports 2009, 2010 (HDI, HPI-1 and poverty rankings), CIA World Factbook (2010) (GDP per capita).
3.1 Microfinance in Pakistan
The Microfinance Ordinance (2001) regulates microfinance practice in Pakistan, and describes a MFI as a company that accepts deposits from the public for the purpose of providing microfinance services. MFIs in Pakistan are classed as Microfinance Banks (MFBs) regulated by the State Bank of Pakistan, in addition to some NGOs, RSPs and CFIs, as described in Box 1 below:
Country
Human Development
Index (HDI) Rank (2010)
Human Poverty
Index (HPI-1) Rank (2009)
% age of population living below: GDP Per Capita (US$)
2009 est.
$1.25 per day
$2.00 per day
National poverty
line
Sri Lanka 91 67 14 39.7 22.7 4,500
India 119 88 41.6 75.6 28.6 3,100
Nepal 138 99 55.1 77.6 30.9 1,200
Pakistan 125 101 22.6 60.3 32.6 2,600
Bhutan .. 102 26.2 49.5 .. 5,400
Bangladesh 129 112 49.6 81.3 40 1,600

13
Box 1: Microfinance institutions defined
Source: GoP (2009).
Microfinance in Pakistan dates back to the 1960s when initiatives such as the Comilla Project experimented with microcredit. The first large scale microfinance projects in the country were the Orangi Pilot Project in Karachi and the Agha Khan Rural Support programme (AKRSP), while the Agricultural Development Bank of Pakistan (ADBP) was established primarily for lending to poor farmers during crop seasons (Haq 2008). The AKRSP model was subsequently replicated throughout the country during the 1990s with the establishment of National Rural Support Programme (NRSP) and the Sarhad Rural Support Programme (SRSP). These Rural Support Programmes (RSPs) were general support institutions that provided a wide variety of social services, including financial services (State Bank of Pakistan 2001; Duflos, Latortue et al. 2007). The microfinance sector did not gain momentum until the late nineties, when a number of specialized MFIs were incorporated. Kashf Foundation, one of the largest MFIs in the country, was established in 1996, while in 2000, the Pakistan Poverty Alleviation Fund (PPAF) started disbursements to the rural poor. A leap forward was made when the Microfinance Ordinance came in force in 2001. The State Bank of Pakistan established a specialized Microfinance unit and laid the foundations to stimulate the development of an inclusive financial system. This strategy was driven mainly by the pretext that Microfinance Banks (MFBs) can play an
Microfinance Institutions
Microfinance Ordinance (2001) defines a Microfinance Institution (MFI) as a company that
accepts deposits from the public for the purpose of providing microfinance services. MFIs in
Pakistan include: Microfinance Banks (MFBs) regulated by the State Bank of Pakistan, in
addition to some NGOs, RSPs and CFIs as detailed below:
Non-government Organizations (NGOs): These include NGOs operating as microfinance
institutions as well as those running microfinance operations as part of their multi-
dimensional development programme. Specifically, Kashf, Sind Agricultural and Forestry
Workers Coordination Organization (SAFWCO), Akhuwat, Orangi Pilot Project (OPP), and
Asasah are operating as MFIs. Development Action for Mobilization and Emancipation
(DAMEN), Taraqee Foundation and Sungi are proving microfinance services as a part of their
overall integrated development services.
Rural Support Programmes (RSPs): These programmes are running microfinance operations
as part of their multi-dimensional rural development programme.
Commercial Financial Institutions (CFIs): These are financial institutions in the mainstream
financial sector, providing microfinance services as a separate function within the broader
organizational context. Two such CFIs are Orix Leasing and The Bank of Khyber.

14
important role in increasing the outreach of financial services. To this effect, by 2007, six MFBs had received licenses (Duflos, Latortue et al. 2007; Haq 2008).
The sector has been slow to scale up in the country and outreach to women has been especially limited. It is estimated that only about 8 percent of poor households receive credit from formal sources (The World Bank 2007). As shown in Table 3, in March 2009 outreach stood at approximately 1.7 million active borrowers and 2 million active savers, with a gross loan portfolio of Rs. 19.2 billion and Rs. 5.8 billion in savings respectively. The size of Pakistan's population and number of poor imply that there is a large potential market for microfinance in Pakistan. According to PMN estimates, and as indicated in the table, this is close to 27 million individuals (Haq 2008; Pakistan Microfinance Network 2009).
Table 3. Summary of Microfinance Outreach in Pakistan (As on March 2010)
Offices
Fixed Mobile
1,593 6
Microcredit
Number of Active Borrowers Gross Loan Portfolio (PKRs. Millions)
1,909,100 23,354
Micro-Savings
Number of Active Savers Value of Savings (PKRs. Millions)
2,720,967 8,346
Micro-Insurance
Number of Policy Holders Sum Insured (PKRs. Millions)
3,913,516 54,823
Potential Microfinance Market 27,407,048
Penetration Rate (%) 6.97
Source: Compiled from Pakistan Microfinance Network (2009)
Pakistan's microfinance sector was amongst one of the fastest growing globally, with an expansion of nearly 47 percent during 2007 (Haq 2008). Despite the huge growth in the financial sector over than last few years, financial outreach seems to be very poor in the country. Demirguc-Kunt, Beck et al., at the World Bank (2008) use a composite measure of access to an account with a financial intermediary, to assess outreach. In the case of Pakistan, this is estimated to be just 12 percent, compared to 48 percent in India, 59 percent in Sri Lanka, and 32 percent in Bangladesh (Haq 2008).

15
According to a World Bank report (2007) on promoting rural growth and poverty reduction in Pakistan, following recent legislations, Pakistan’s microfinance policy environment now appears to be quite conducive to efficient delivery of microfinance to poor households. The challenge, according to the report, is now for the various actors to seek out efficiency and scale. Despite various significant subsidies in various forms to the sector (largely related to low interest rates), microfinance projects generally have failed to lead towards long-term institutional development (ibid.). A possible explanation of which may be that in almost all of the country’s development plans, microfinance has hitherto been presented and treated as merely a tool and a part of a broader framework of development-related national strategies. To work at its best, microfinance should not ideally be combined with other areas such as literacy and health related campaigns, but should receive the specialized attention that it deserves and must be addressed independently (Council on Foreign Relations 2003).
Apart from issues surrounding efficiency, scale and sustainability as noted above, another area that warrants greater attention is to take pragmatic steps towards removing barriers that poor people face in attempting to access (the already limited) financial services available. Economic growth can be accelerated substantially if the financial sector’s outreach is both deepened and widened (Chandrasekhar 2004; Beck, Demirguc-Kunt et al. 2005; Honohan 2006). The State Bank of Pakistan (SBP) also recognizes barriers that the masses face while endeavouring to access financial services and classifies them as shown in Box 2 below MFIs could perhaps pay special attention to such aspects while formulating policies for both widening and deepening outreach particularly across the rural landscape.
Box 2: Barriers to Access of Financial Services in Pakistan
Sources: Akhtar (2007) and Haq (2008)
Barriers to Accessing Financial Services in Pakistan
1. Geographical constraints: a large proportion of population lives in rural areas
and there are pockets of areas with low population density and difficult remote
terrain.
2. Provincial-level environment weaknesses: lack of an enabling environment at
the provincial level due to poor land records and weak law enforcement.
3. Banking practices: banking sector's stagnation in terms of target market,
traditional modes and products, and high transaction costs.
4. Illiteracy and/or poverty of clients: low financial literacy of clients or cultural
linguistic barriers due to which the awareness and understanding of financial
services is low.
5. Regulatory barriers: regulatory requirements such as money laundering
guidelines require proof of identification that the poor may not have.

16
Pakistan has an estimated target population of 25-30 million poor clients but PMN members have yet reached only 5% of this target population. There is a long way to go with an urgent step required to accelerate growth, in order to achieve the first millennium development goal of halving poverty by 2015 (Akhtar 2009).
Figure 3. Pakistan Microfinance Potential and Current Market
Source: Compiled from Pakistan Microfinance Network (2009)
4 Assessing Depth of Outreach: Methodology Overview
The principal objective of the survey was to assess the extent to which various Microfinance programmes target and actually reach the poor across the rural areas of the province of Punjab in the North Eastern part of Pakistan. The underlying impetus of this research is to assess and contrast the poverty levels of MFI clients to non-clients within the area being surveyed. The methodology applied is not designed and does not intend to provide information on the households’ absolute levels of poverty but to develop a poverty index of all the households that are contained by the sample. The ensuing poverty index provides a tool to calibrate relative poverty – the extent to which a household is worse off or better off compared to the other households within the surveyed sample frame (Henry, Lapenu et al. 2003). Once relative poverty levels are ascertained, the poverty index can be constructed, with which the depth of outreach can be subsequently determined. This procedure is discussed in detail in section 4.3, but first the section that follows provides an overview of the region that forms the backdrop for this study and discusses the selection and choice of the dimensions along with the associated indicators that were employed to capture households’ relative well-being.
27.40
3.0 1.75
0.00
5.00
10.00
15.00
20.00
25.00
30.00
Potential Microfinance Market
Target (2010) Actual (March 2009)
Mill
ion
s o
f B
orr
ow
ers
17
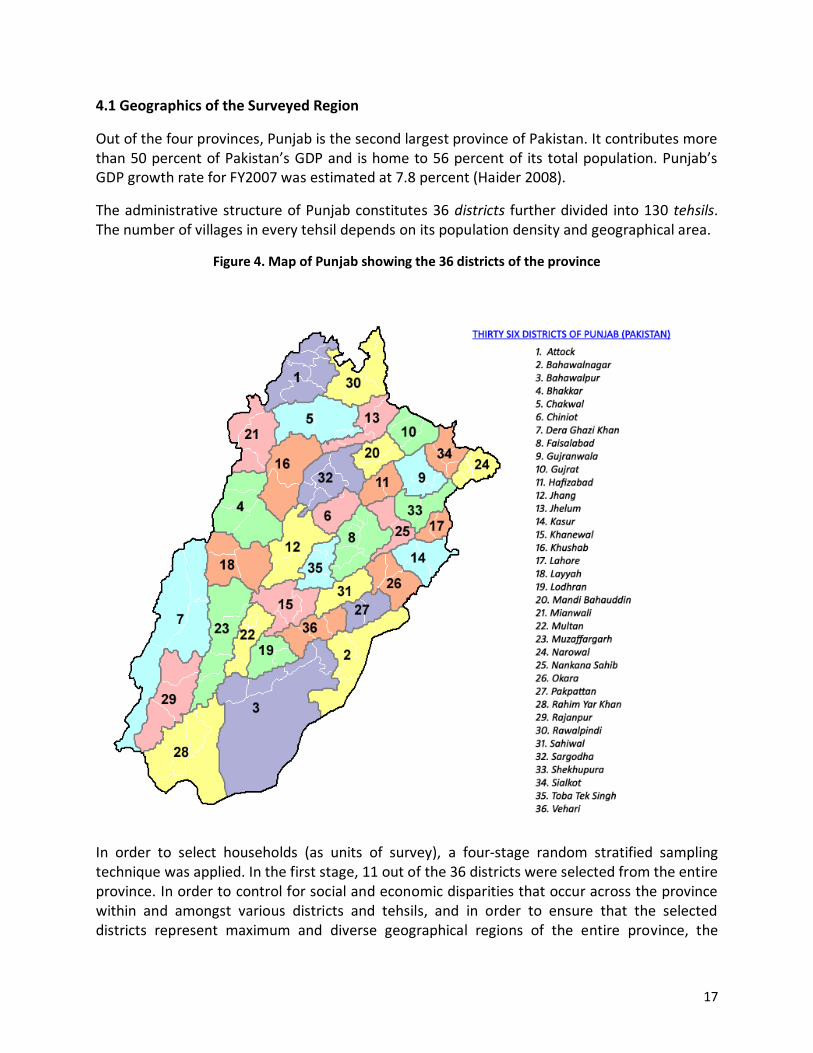
4.1 Geographics of the Surveyed Region
Out of the four provinces, Punjab is the second largest province of Pakistan. It contributes more than 50 percent of Pakistan’s GDP and is home to 56 percent of its total population. Punjab’s GDP growth rate for FY2007 was estimated at 7.8 percent (Haider 2008).
The administrative structure of Punjab constitutes 36 districts further divided into 130 tehsils. The number of villages in every tehsil depends on its population density and geographical area.
Figure 4. Map of Punjab showing the 36 districts of the province
In order to select households (as units of survey), a four-stage random stratified sampling technique was applied. In the first stage, 11 out of the 36 districts were selected from the entire province. In order to control for social and economic disparities that occur across the province within and amongst various districts and tehsils, and in order to ensure that the selected districts represent maximum and diverse geographical regions of the entire province, the
18
selection of districts was done systematically as opposed to being done randomly. Starting from the North of the province, districts were selected towards the East, West and South of the province (see Figure 4 and Table 4 for selected districts). In the second stage, at least one tehsil was randomly selected from each identified district. In the third stage, at least two villages were subsequently selected randomly from amongst the selected tehsils and in the fourth and final stage; participating and non-participating households were selected at random for conducting surveys.
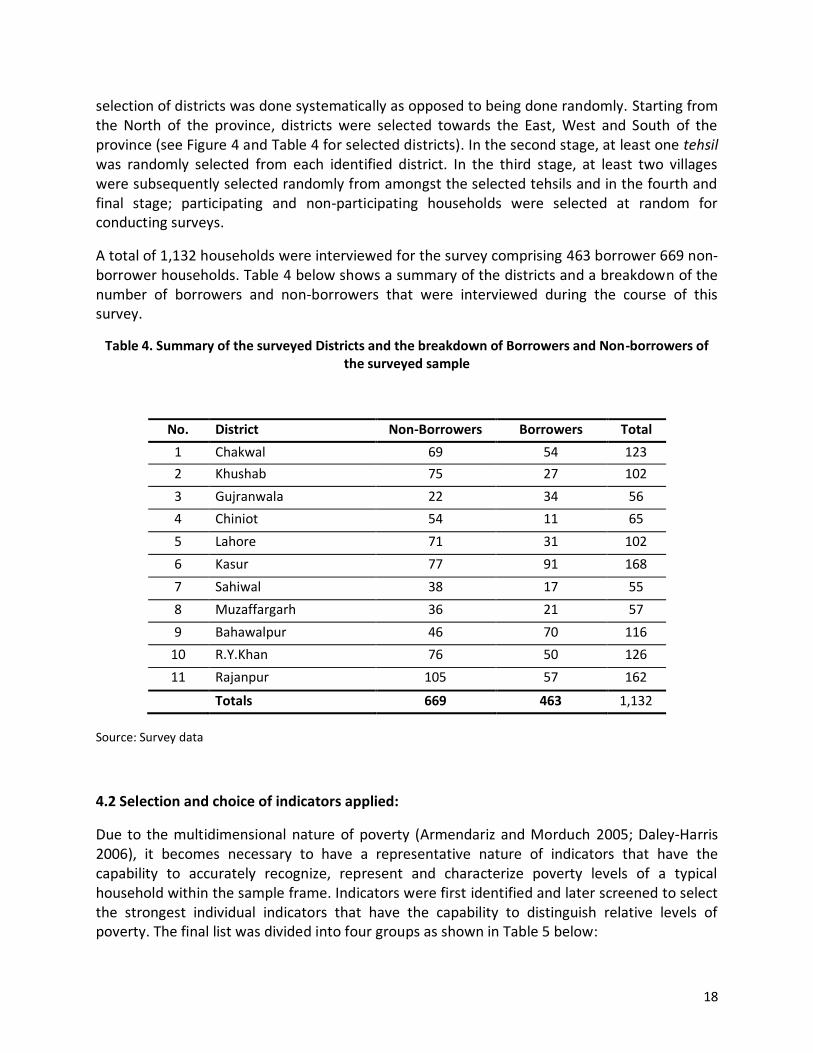
A total of 1,132 households were interviewed for the survey comprising 463 borrower 669 non-borrower households. Table 4 below shows a summary of the districts and a breakdown of the number of borrowers and non-borrowers that were interviewed during the course of this survey.
Table 4. Summary of the surveyed Districts and the breakdown of Borrowers and Non-borrowers of the surveyed sample
No. District Non-Borrowers Borrowers Total
1 Chakwal 69 54 123
2 Khushab 75 27 102
3 Gujranwala 22 34 56
4 Chiniot 54 11 65
5 Lahore 71 31 102
6 Kasur 77 91 168
7 Sahiwal 38 17 55
8 Muzaffargarh 36 21 57
9 Bahawalpur 46 70 116
10 R.Y.Khan 76 50 126
11 Rajanpur 105 57 162
Totals 669 463 1,132
Source: Survey data
4.2 Selection and choice of indicators applied:
Due to the multidimensional nature of poverty (Armendariz and Morduch 2005; Daley-Harris 2006), it becomes necessary to have a representative nature of indicators that have the capability to accurately recognize, represent and characterize poverty levels of a typical household within the sample frame. Indicators were first identified and later screened to select the strongest individual indicators that have the capability to distinguish relative levels of poverty. The final list was divided into four groups as shown in Table 5 below:

19
Table 5. Final list of variables used to construct poverty index
Human resources Dwelling related
indicators Food security and
vulnerability Ownership of
household assets
Age and sex of adults in household
Adult literacy
Number of children
Occupations of adults in household
Number of children below the age of 15 in household
Annual expenditure on clothing and footwear for all members in household
House ownership
Type of floor
Material used for exterior walls? Roof
Number of rooms in the house
Source of water supply
Type of toilet
Bathroom waste disposal
Energy for lighting in the house
Type of fuel used for cooking
Structural condition of house
Number of days when staple foods were served
Number of days when vegetables were served
Number of days when meat was served
Livestock (Cattle and buffalo, sheep and goats, poultry, horses and donkeys, etc.)
Transportation-related assets (Motorcycle, bicycle, carts)
Appliances and Electronics (television, VCR, refrigerator, washing machine, radio/tape/stereo, mobile phone, sewing machine, etc.)
The choice of these variables for the calculation of the poverty scores is due to their global acceptability as indicators of poverty based on the CGAP poverty assessment tool (Henry, Lapenu et al. 2003). Due to the multi-dimensional nature of poverty, this approach is very sensitive in discriminating among different levels of poverty amongst both borrower and non-borrower households. The use of multiple indicators tends to capture a more comprehensive description of household poverty and well-being, but at the same time, complicates the task of drawing comparisons, since the wide array of indicators has to be summarized in a logical manner, underlining the importance of combining information from indicators into a single index. The creation of this index requires finding a method of weighting that can be meaningfully applied to different indicators so as to reach an overall conclusion. (Zeller, Sharma et al. 2001).
20
The questionnaire was initially field-tested and a number of indicators were consequently altered in order to meet research objectives, to control for local specificities, and to ensure that they fully capture and reflect relative poverty levels of both groups of households. Indicators such as those relating to highly contextual and subjective responses were subsequently dropped from the final field instrument.
4.3 Procedure for Calculating the Poverty Index
The assessment tool that this research applies develops a relative poverty index by applying Principal Component Analysis (PCA), which is a typical multi-variable statistical method that helps to reveal a simpler pattern from a complex set of variables (Lian, Lai, et al. 2002; Márquez and García-Pardo 2009). Shlens (2005) describes results generated from PCA as one of the most valuable from applied linear algebra, and maintains that PCA is used abundantly in all forms of analysis – from neuroscience to computer graphics – because of its simple, non-parametric method of extracting relevant information from confusing data sets and also provides a roadmap to reduce a complex dataset to a lower dimension, to reveal the sometimes hidden, simplified structure that often underlies it.
Developing an objective measure of poverty requires first identifying the strongest individual indicators that distinguish relative levels of poverty and then pooling their explanatory power into a single index (Henry, Lapenu et al. 2003). Prior to running the PCA model, the poverty indicators first undergo a series of filters to ensure that relative well-being is reflected accurately, and do not present a distorted picture due to too much emphasis on a particular indicator or group of indicators. In order to achieve this, the linear correlation coefficient procedure is applied to determine which of the variables best appear to capture differences in relative household poverty levels. A coefficient value at or near -1 indicates a negative relationship, while a value at or near +1 indicates a positive relation of the variable with the selected poverty benchmark indicator (per capita expenditure on clothing and footwear). The strength of the poverty indicators is determined by calculating the level and direction of each variable in the questionnaire. Variables are then selected from each of the four main poverty dimensions to avoid over-emphasising any one aspect of poverty. The end result of the PCA model is a single index of relative poverty that assigns to each sample household a specific value, called a poverty score, representing the poverty status of that particular household relative to all other households in the sample (ibid.) Relative comparisons between poverty levels can then made based on this index.
With the PCA method, each underlying component that is calculated represents a linear combination of the indicator variables used in the model. The first component is the combination that accounts for the largest amount of variance in the sample. The second component accounts for the next largest amount of variance and is uncorrelated with the first. Successive components explain progressively smaller portions of total sample variance and all components are uncorrelated with one another (Zeller, Sharma et al. 2001; Henry, Lapenu et al. 2003). The end result of running the PCA model is a poverty score assigned to every household

21
in the data set. This score signifies the poverty of every household relative to all others that have been interviewed. A lower poverty score signifies greater relative household poverty and vice versa.
The resulting poverty index is estimated from standardised indicator values. Standardisation of the variables strips away the units in which the variables are measured (ibid.). The standardised variable has a mean of zero and a standard deviation of one, as shown in the histogram in Figure 5 below, illustrating the distribution of the poverty scores in a standardised form. The scores derived from the PCA range from -1.599 to 4.863.
Figure 5. Histogram showing poverty scores of respondents’ households
Source: Survey data
Out of the total 1,132 households in the dataset, 667 (about 60 per cent) fall below zero, that is, those with negative scores, reflecting greater levels of poverty. Out of these, 413 (about 36 percent) belong to the non-borrower category, while 254 (22 percent) are clients of various MFIs.

22
4.4 Forming Relative Poverty Groups (terciles)
The preceding section discussed the complete process of calculating the poverty scores of each household in the surveyed sample. Once these scores have been obtained, a number of analyses can be carried out. As the empirical study ascertains the depth of microfinance programme outreach, a foremost measure would be to rank all households in the surveyed sample in order of ascending poverty levels (the poverty score obtained in the steps above will be used for this purpose) and then allocate them across a grouping such as low, medium and high levels of poverty. In a similar framework for classifying clients’ poverty status put forth by Woller, Simanowitz, et al. (2004), various socio-economic indicators, such as labour market participation, physical assets, savings and credit, social and cultural resources and vulnerability, are viewed across three classifications: high, medium and lower levels of poverty. In the descriptions that have been stated (see Table 6 below), it becomes apparent that as the status shifts towards greater levels of poverty, there is a proportional rise in incidences of inconsistency in labour activities accompanied by lower levels of asset ownership, whereas the reliance on informal credit and financial services increases as opposed to making use of the formal banking and financial services sector. Moreover, households who live in a higher state of poverty are also classed as being highly vulnerable whereas those who are relatively better-off have a diversified portfolio and enhanced capacity to manage shocks.
Table 6: Framework for Classifying Clients’ Poverty Status
Dimensions Higher Poverty Middle Poverty Lower Poverty
Labour market participation
Casual and/or unskilled Limited employment; limited formal education
Limited employment but secure claims on other household members with stable employment
Stable, salaried employment or good employment prospects
Physical assets Very few — hand-to-mouth existence
Some — including household goods and business capital
Diverse — especially own dwelling
Savings and credit Unbanked; reliant on informal services
Maybe a savings account; but saving has a high opportunity cost
Direct access to regulated savings and credit services
Social and cultural resources
Dependent on informal sources of patronage as security against shocks often on exploitative terms
Intermediate — scope for diversification away from, dependence on a single patron
Diversified social networks; forms of security against shocks
Vulnerability
Medium/high — but at cost of losing autonomy (“security through servitude”)
High — overwhelming fear of falling back into low group (e.g., through resources through separation or illness)
Low — diversified portfolio of which to manage shocks
Source: Woller, Simanowitz, et al. (2004)

23
In order to classify respondents of this survey in a similar pattern, the entire dataset is first filtered to select the non-borrower sample. These respondents are then sorted in ascending order according to the poverty score. Finally, they are divided into three equal parts: terciles, each consisting of 223 households, as shown in Table 7 below.
Table 7. Distribution of non-borrowers across three groups
After classification, the bottom tercile households (lowest) are the very poor ones, followed by the moderately poor (second tercile, middle) and then the less poor (third tercile, highest). The cut-off scores that are thus obtained for each tercile define the limits of each poverty group as shown in Table 8 below.
Table 8. Cut-off scores for each category
Once the cut-off scores have been obtained, borrower households are allocated to the three terciles on the basis of poverty scores. This will show how many households of the borrower sample fall in each of the three poverty groupings.
Poverty Group
Relative Tercile Category Frequency of
Non-Borrower Households
Percentage of Non-Borrower
Households
1 Very Poor (Lowest) 223 33.33
2 Moderately Poor (Middle) 223 33.33
3 Less Poor (Highest) 223 33.34
Totals 669 100.00
Poverty Groups Minimum
Poverty Score
Maximum
Poverty Score
Very Poor (Lowest) -1.599 -0.630
Moderately Poor (Middle) -0.631 0.112
Less Poor (Highest) 0.113 4.863
24
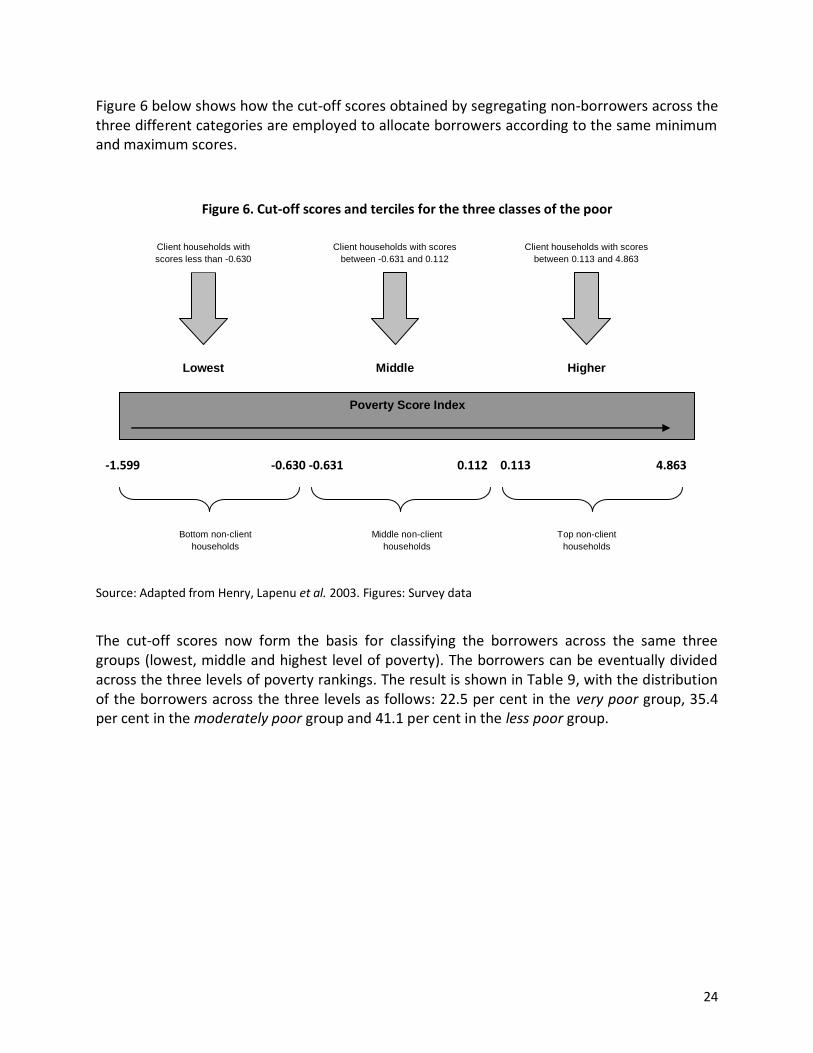
Figure 6 below shows how the cut-off scores obtained by segregating non-borrowers across the three different categories are employed to allocate borrowers according to the same minimum and maximum scores.
Figure 6. Cut-off scores and terciles for the three classes of the poor
Source: Adapted from Henry, Lapenu et al. 2003. Figures: Survey data
The cut-off scores now form the basis for classifying the borrowers across the same three groups (lowest, middle and highest level of poverty). The borrowers can be eventually divided across the three levels of poverty rankings. The result is shown in Table 9, with the distribution of the borrowers across the three levels as follows: 22.5 per cent in the very poor group, 35.4 per cent in the moderately poor group and 41.1 per cent in the less poor group.
Poverty Score Index
Client households with
scores less than -0.630
Client households with scores
between -0.631 and 0.112
Client households with scores
between 0.113 and 4.863
Bottom non-client
households
Middle non-client
households
Top non-client
households
Lowest Middle Higher
-1.599 -0.630 0.112 4.863 -0.631 0.113

25
Table 9. Cut-off scores of the three terciles used to allocate borrowers
Poverty Group
Relative Tercile Category Frequency of
Borrower Households
Percentage of Borrower
Households
1 Very Poor (Lowest) 104 22.50
2 Moderately Poor (Middle) 164 35.40
3 Less Poor (Highest) 195 41.10
Totals 463 100.00
The entire dataset can now be distributed across the three terciles as shown in Table 10 below. This table is graphically represented in Figure 7 showing that there is an unequal distribution of borrowers across the three categories, with 42.8 percent in the less poor (highest category) and 20.3 in the very poor category.
Table 10. Summary of distribution of the entire dataset across the three poverty levels
Poverty Groups
Frequency (N)
Total
Poverty Scores
Borrower Households
% age
Non-Borrower Households
% age Minimum Maximum
Lowest 104 22.50 223 33.33 327 -1.599 -0.630
Middle 164 35.40 223 33.33 387 -0.631 0.112
Highest 195 41.10 223 33.34 418 0.113 4.863
Totals 463 100.00 669 100.00 1132
26
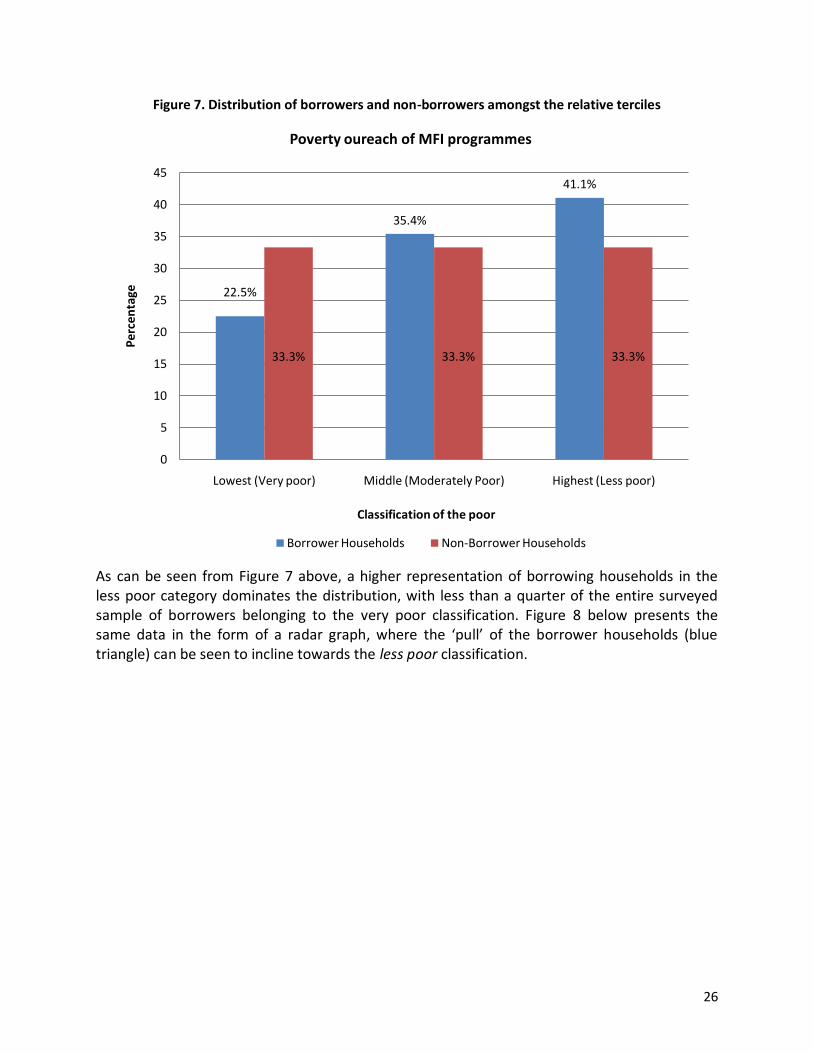
Figure 7. Distribution of borrowers and non-borrowers amongst the relative terciles
As can be seen from Figure 7 above, a higher representation of borrowing households in the less poor category dominates the distribution, with less than a quarter of the entire surveyed sample of borrowers belonging to the very poor classification. Figure 8 below presents the same data in the form of a radar graph, where the ‘pull’ of the borrower households (blue triangle) can be seen to incline towards the less poor classification.
22.5%
35.4%
41.1%
33.3% 33.3% 33.3%
0
5
10
15
20
25
30
35
40
45
Lowest (Very poor) Middle (Moderately Poor) Highest (Less poor)
Pe
rce
nta
ge
Classification of the poor
Poverty oureach of MFI programmes
Borrower Households Non-Borrower Households

27
Figure 8. Radar graph showing the distribution of borrowers and non-borrowers in survey areas
5 Concluding remarks and policy implications
Ever since microcredit was introduced formally in the late 1970s, it has been hailed as a major poverty reduction tool across the developing world. Where its positive impact has been lauded by many in lifting millions out of poverty, it has, on the flipside, been a major theme for criticism amongst many academics and practitioners alike (see for instance: Dignard and Havet 1995; Mallick 2002; Brau and Woller 2004; Khuwaja 2009). Hermes and Lensink (2007) conclude after reviewing the debate on microfinance and poverty that it is still unclear whether microfinance contributes substantially to a reduction of world poverty and if microfinance is the most efficient method to reduce poverty. Lucarelli (2005) however, takes a more cautious approach and warns that although microcredit does have an important role to play in the development process and in overcoming poverty traps, it should not be relied upon too much as a panacea for complex development problems. Even Yunus, deemed amongst the pioneers of the model, reiterates that microfinance ‘is not a miracle cure that can eliminate poverty in one swoop, but it can end poverty for many and reduce its severity for others. Combined with other innovative programmes that unleash people’s potential, microcredit is an essential tool in our search for a poverty-free world’ (Yunus and Jolis 1999:171).
0%
10%
20%
30%
40%
50%Lowest (Very poor)
Middle (Moderately Poor)
Highest (Less poor)
Borrower Households Non-Borrower Households
28
In order to be truly effective, however, services offered by MFIs have to be made available to those segments of the society that lie at the bottom of the pyramid. Despite universal acceptance and recognition that the poorest need greater flexibility in the financial services, there has not been any such innovation so far that can successfully address their needs on a large scale (Barua and Sulaiman 2006), and outreach has been substantially low than what is actually required to lift the very poor out of poverty through microfinance.
This paper has focused primarily on the empirics of one of the most important factors that surround microfinance: poverty targeting and depth of programme outreach. The geographical areas explored were districts across rural Punjab in Pakistan and data was collected by means of a detailed household survey. Poverty was evaluated on the basis of a series of poverty dimensions and associated indicators that were designed and filtered to capture relative well-being across households. The strength of these poverty indicators was determined by calculating the level of significance and direction of each variable to the benchmark indicator: per capita expenditure on clothing and footwear. Once the level of association of various indicators to the benchmark indicator was determined, households were ranked using the Principal Component Analysis (PCA) model. The result was a single index of relative poverty that assigned a specific value to each sample household, called a poverty score. This score represented the poverty status of that particular household relative to all other households within the survey (Henry, Lapenu et al. 2003.). The households’ resulting poverty score enabled ranking of all surveyed cases, eventually grouping them across three poverty levels (terciles), to ascertain which category of the poor the MFIs in the province had been able to reach. Relative comparisons between households’ poverty levels were finally made based on this index.
Survey results reveal that the poorest households amongst the surveyed sample are not being reached to the desired extent. Given that the sample has been drawn at random across different districts located throughout the province, it seems that various MFIs operating in the province do not seem to be targeting the poorest households and the outreach to this segment of the society remains low. As shown in Table 10 and Figure 8 above, a large portion (over 41 percent) of total outreach is focused on the least poor, as opposed to 22 percent of the middle poor category, whereas outreach to the poorest people is considerably low, which was measured to be less than a quarter (22 percent) of all surveyed households.
Most discussions about outreach argue that there is a trade-off between depth of programme outreach and institutional sustainability: if MFIs focus on achieving depth, they have to sacrifice breadth, as the poor are more difficult and costly to reach and generate lower revenues. Lending to the poor is therefore not considered to be financially viable because serving them entails higher processing costs and generates little income; moreover, they do not have a good credit history and are more prone to default (Pischke 1991; Tyhs 2000; Churchill, Hirschland et al. 2002; Ivatury 2005). Maes and Foose (2006a, b), on the other hand, claim that despite the high risk, high transaction costs, and other challenges described above, a number of microfinance organisations, NGOs, and multilateral agencies are already specifically targeting microfinance services at very poor people, while other microfinance programmes, realising that they are not reaching very poor people, are interested in finding new approaches.
29
How can the extremely poor be reached? Matin and Hulme (2002) recommend three ways of making MFI services more poverty focused: identifying and reaching the poor, attracting the poor, and discouraging or excluding the non-poor. On top of these, a fundamental driving force towards achieving greater depth of outreach is rooted in visionary leadership and organisational commitment, a fact that several studies have highlighted (see Hulme and Mosley 1996; Johnson and Rogaly 1996). If the top management is strongly committed with a social mission towards reaching the very poor (even if this means foregoing revenues, as discussed above), organisational procedures will ultimately be designed and implemented around this objective. Maes and Foose (2006a) argue that while buy-in from top management is essential, this commitment needs to be accompanied by an overall institutional culture dedicated to providing continued microfinance services to very poor people. Staff incentives (that take into account client-outreach and impact) can be introduced to target the very poor as opposed to selecting the relatively better-off. Apart from these measures, simplified and decentralized branch-level operations and reduced paperwork in the field can assist towards cost reduction, and can also help in encouraging the very poor from joining such programmes by making products more approachable and congenial to clients.
Diversifying the product mix and considering services and features that may better suit the extreme poor can also assist towards deepening programme outreach. Grameen Bank and BRAC for example, in addition to regular microcredit programmes offer tailored products that specifically target very poor people. BRACs Income Generation for Vulnerable Groups Development (IGVGD) programme, for instance, ‘provides food subsidies and intensive skills training to vulnerable women, as well as a standard package of microcredit, healthcare and social services; and another recent programme, Challenging the Frontiers of Poverty Reduction/Targeting the Extreme Poor (CFPR/TUP), abandons loans altogether and offers enterprise asset grants instead, to the same target group’ (Maes and Foose 2006a:11). Other helpful measures can be small initial loan sizes over a short term with frequent and flexible repayment options and tailored financial products that correspond with seasonal income streams. Apart from offering customised products, proximity is also vital and if services are delivered close to homes and clients are served in the form of groups rather than individually in offices, the intended ultra-poor will be in a better position to access services with greater convenience and flexibility. Borrowers should also be assisted in managing and spreading risk by providing tailored insurance services, voluntary savings and emergency loans, etc. If such targeted products can be sustainable and various forms have proven beneficial across diverse parts of the world, they can be replicated with modifications across rural Pakistan in order to achieve greater depth of programme outreach.
An important aspect to be considered here is that targeting alone is not enough to reach the poor and according to The World Bank (2005), even strong NGO interventions such as the Pakistan Aga Khan Rural Support Program, most recently evaluated in 2001 and operating for nearly 20 years, have found it difficult to reach the poorest, the reason for which is that the process involves not just economic change, but also a series of social and cultural changes. Effecting such fundamental transformation requires considerable time and sustained effort.

30
REFERENCES Adato, M. and L. Haddad (2001). Targeting Poverty through Community-Based Public Works Programs: A Cross-Disciplinary Assessment of Recent Experience in South Africa. FCND Discussion Papers. Washington, D.C. 20006 U.S.A., International Food Policy Research Institute, Food Consumption and Nutrition Division. Aguilar, V. G. (2006). "Is Micro-Finance reaching the Poor? An Overview of Poverty Targeting Methods " Retrieved September 12, 2009, 2009, from: http://www.globenet.org/archives/web/2006/www.globenet.org/horizon-local/ada/c18.html Ahmed, V. and C. O. Donoghue (2010). "Global Economic Crisis and Poverty in Pakistan " International Journal of Microsimulation 3(1): 127-129 Akhtar, N. (2009). Microsavings: Missing Link to Poverty Reduction. Social and Economic Sciences. Graz, Austria, Karl-Franzens University of Graz. Unpublished PhD thesis. Akhtar, S. (2007). State Bank of Pakistan Governor's speech. Financial Inclusion Conference. London. Armendariz, B. and J. Morduch (2005). The Economics of Microfinance, MIT Press. Barrientos, A (2010a). Social Protection and Poverty. Social Policy and Development Programme Paper Number 42, January 2010. United Nations Research Institute for Social Development, Geneva. Barrientos, A (2010b). The Boundaries of Social Protection, in Poverty in Focus. International Policy Centre for Inclusive, Growth (IPC-IG), Poverty Practice, Bureau for Development Policy, UNDP. Esplanada dos Ministérios, Bloco O, 7º andar, 70052-900 Brasilia, DF Brazil. Barrientos, A and Hulme, D (2008). Social Protection for the Poor and Poorest in Developing Countries: Reflections on a Quiet Revolution. BWPI Working Paper 30. Brooks World Poverty Institute, School of Environment and Development, University of Manchester. Barua, P. and M. Sulaiman (2006). Targeting the Poorest in Microfinance: Poverty Outreach of BDP Ultra Poor Programme. CFPR/TUP Working Paper Series No. 13. BRAC: 75 Mohakhali, Dhaka 1212, Bangladesh and Aga Khan Foundation Canada 360 Albert Street, Suite 1220 Ottawa, ON K1R 7X7, Canada, BRAC Research and Evaluation Division and Aga Khan Foundation Canada. Bateman, M. (2008). Microfinance’s ‘Iron Law’ - Local Economies Reduced to Poverty. The Financial Times. London.
31
Beck, T., A. Demirguc-Kunt, et al. (2005). Reaching out: Access to and use of banking services across countries. World Bank Policy Research Working Paper 3754. Washington D.C, The World Bank. Besley, T. and R. Kanbur (1993). The Principles of Targeting in M. Lipton and J. Van Der Gaag (Eds): Including the Poor - Proceedings of a symposium organized by the World Bank and the International Food Policy Research Institute (IFPRI). Washington D.C: 67-90. Bhaduri, A. (1977). "On the formation of usurious interest rates in backward agriculture." Cambridge Journal of Economics (December). Brau, J. C. and G. M. Woller (2004). "Microfinance: A Comprehensive Review of the Existing Literature." Journal of Entrepreneurial Finance and Business Ventures 9(1): 1-26. Chandrasekhar, C. P. (2004). Financial Liberalization and the Macroeconomics of Poverty Reduction. Thematic Summary on Financial Liberalization for the Asia-Pacific Programme on the Macroeconomics of Poverty Reduction, UNDP. Cheston, S. and L. Kuhn. (2002). "Empowering Women through Microfinance." Women’s Opportunity Fund Retrieved January 05, 2007, from: http://www.microcreditsummit.org/papers/+5cheston_kuhn.pdf Chowdhury, M. J. A. (2008). "Poverty and Microfinance: An Investigation into the Role of Microcredit in Reducing the Poverty Level of Borrowing Households in Bangladesh and the Philippines." The Whitehead Journal of Diplomacy and International Relations(Summer/Fall 2008). Chowdhury, M. J. A. (2009). Microcredit, micro-enterprises, and self-employment of women: experience from the Grameen Bank in Bangladesh. Rome, FAO-IFAD-ILO Workshop on Gaps, trends and current research in gender dimensions of agricultural and rural employment: differentiated pathways out of poverty. Churchill, C., M. Hirschland, et al. (2002). New Directions in Poverty Finance Village Banking Revisited. 1825 Connecticut Avenue NW, Washington, D.C. 20009., The Small Enterprise Education and Promotion Network.
CIA (2010). "Country Factsheet - Pakistan." The World Fact Book. Retrieved August 1, 2010,
from https://www.cia.gov/library/publications/the-world-factbook/geos/pk.html.
Cohen, M. (2003). Helping to Improve Donor Effectiveness in Microfinance: The Impact of Microfinance. Donor Brief. 1818 H Street, NW Washington, DC 20433, CGAP Conning, J. (1999). "Outreach, sustainability and leverage in monitored and peer-monitored lending." Journal of Development Economics 60: 51-77.
32
Copestake, J. (2002). "Inequality and the polarizing impact of microcredit: evidence from Zambia's copperbelt." Journal of International Development 14(6): 743-755. Council on Foreign Relations (CFR) (2003). Microfinance in Pakistan: A Silver Bullet for Development? . New York, Council on Foreign Relations. Cull, R., A. Demirguc-Kunt, et al. (2009). Does Regulatory Supervision Curtail Microfinance Profitability and Outreach? World Bank Policy Research Working Paper Series. Washington D.C, The World Bank: 41. Dahl-Ostergaard, T., D. Moore, et al. (2003). Community-Driven Rural Development: What Have We Learned?, Inter-American Development Bank. Daley-Harris, S. (2006). "State of the Microcredit Summit Campaign Report, 2006." The Microcredit Summit Campaign’, 440 First Street, NW, Suite 460 Washington, DC 20001. De Aghion, B. A. and J. Morduch (2000). "Microfinance Beyond Group Lending." Economics of Transition 8(2): 401-420. Demirguc-Kunt, A., T. Beck, et al. (2008). Finance For All? : Policies and Pitfalls in Expanding Access. 1818 H Street NW, Washington DC 20433, USA., The International Bank for Reconstruction and Development/The World Bank. Dignard, L. and J. Havet (1995). Women in Small Enterprise Development. Boulder, Colorado, Westview Press. Dowla, A. (1998). "Micro Leasing: The Grameen Bank Experience." St. Mary’s City, Maryland: St. Mary’s College of Maryland., U.S.A. Duflos, E., A. Latortue, et al. (2007). Country-Level Effectiveness and Accountability Review with a Policy Diagnostic-Pakistan. Aid Effectiveness Initiative. 1818 H Street, NW, MSN P3-300, Washington, DC 20433 USA, The Consultative Group to Assist the Poor (CGAP) Dunford, C. (2006). "Evidence of Microfinance’s Contribution to Achieving the Millennium Development Goals." Freedom from Hunger, USA September 2006. FAO (2009). Helping to build a world without hunger. Islamabad, Food and Agriculture
Organization of The United Nations. NARC Premises, Park Road, Chak Shahzad, P.O. Box 1476,
Islamabad.
Gallardo, J. (2003). "Leasing to Support Micro and Small Enterprises." Policy Research Working Paper: The World Bank, Washington, D.C. 1857.

33
Germidis, D., D. Kessler, et al. (1991). Financial Systems and Development: What role for the formal and informal financial sectors? Paris, Organisation for Economic Cooperation and Development. Ghalib, A. K. and D. Hailu (2008). Banking the Un-Banked: Improving Access to Financial Services. Policy Research Brief. 70076-900 Brasilia DF, Brazil, UNDP International Poverty Centre. Goldberg, N. (2005). Measuring the Impact of Microfinance: Taking Stock of What We Know. Grameen Foundation USA Publication Series. Washington, DC 20001, Grameen Foundation, USA. Government of Pakistan (2008). Pakistan Economic Surveys FY 2001/02 & FY 2007/08. Islamabad, Finance Division, Government of Pakistan. Government of Pakistan (2009). Poverty Reduction Strategy Paper - (PRSP) - II. Islamabad, Government of Pakistan, Finance Division.
Government of Pakistan (2010). "Population Clock of the Population Census Organization."
Retrieved July 31, 2010, from http://www.statpak.gov.pk/depts/pco/.
Grameen Bank. (2009). "Grameen Bank At A Glance: Beggars As Members." Retrieved August 22, 2009, from: http://grameen-info.org/index.php?option=com_content&task=view&id=26&Itemid=175. Gupta, M. R. and S. Chaudhuri (1997). "Formal Credit, Corruption and the Informal Credit Market in Agriculture: A Theoretical Analysis." Economica 64: 331-43. Haider, M. (2008). Punjab contributes over 50pc to GDP growth. The News International. Lahore. Haq, A. (2008). Microfinance Industry Assessment: A Report on Pakistan. Islamabad Pakistan Microfinance Network (PMN). Henry, C., C. Lapenu, et al. (2003). Microfinance Poverty Assessment Tool. 1818 H Street, NW. Washington, DC 20433 USA, The World Bank. Hermes, N. and R. Lensink (2007). "Impact of Microfinance: A Critical Survey." Economic and Political Weekly 462-465. Honohan, P. (2006). Household Financial Assets In The Process Of Development. World Bank Policy Research Working Paper 3965, July 2006. 1818 H Street NW, Washington DC 20433, USA., The World Bank.

34
Hossain, M. and C. P. Diaz (1997). Reaching the Poor with Effective Microcredit: Evaluation of a Grameen Bank Replication in the Philippines. Los Baños, Philippines, International Rice Research Institute. Hulme, D. (2008). The Story of the Grameen Bank: From Subsidised Microcredit to Market-based Microfinance. BWPI Working Paper Series. Manchester, Brooks World Poverty Institute, University of Manchester. Hulme, D. and P. Mosley (1996). Finance against poverty (Volumes I & II). London, Routledge. International Monetary Fund (IMF) (2010a). IMF Country Report No. 10/183: Pakistan: Poverty Reduction Strategy Paper. Washington, International Monetary Fund, Publication Services, 700 19th Street, N.W., Washington, D.C. 20431, U.S.A.
Ivatury, G. (2005). Foreword to: Electronic Banking with the Poor: Increasing the Outreach and
Sustainability of Microfinance through ICT Innovation. Edited by Stuart Mathison. 137
Melbourne Street, South Brisbane. Brisbane QLD 4101 The Foundation for Development
Cooperation www.fdc.org.au.
Johannsen, J. (2006). Operational Poverty Targeting in Peru – Proxy Means Testing With Non-Income Indicators. Working Paper. 70076 900 Brasilia DF, Brazil, UNDP International Poverty Centre.
Johnson, S. and B. Rogaly (1997). Microfinance and Poverty Reduction. Oxford, UK., Oxfam
Actionaid.
Khuwaja, A. A. (2009). Is microcredit working, or is something missing? Dawn. Karachi, DAWN Media Group. Lapenu, C. and M. Zeller (2002). "Distribution, growth, and performance of the microfinance institutions in Africa, Asia and Latin America: A Recent Inventory." Savings and Development 1(XXVI): 87 -111. Lian, J., X. M. Lai, et al. (2002). "Application of data mining and process knowledge discovery in sheet metal assembly dimensional variation diagnosis." Journal of Materials Processing Technology 129(1-3): 315-320. Little, I. (1950). A Critique of Welfare Economics. Oxford, Clarendon. Londero, E. (2001). Poverty Targeting Classifications and Distributional Effects, Inter-American Development Bank. Lucarelli, B. (2005). "Microcredit: A Cautionary Tale." Journal of Contemporary Asia 35(1): 78-86.

35
Maes, J. and L. Foose (2006a). Microfinance Services for Very Poor People: Promising
Approaches from the Field and The US Law's Mandate to Reach Very Poor People: What
Strategies are MFIs Developing, and What do they Mean for the Rest of the Field? -A
Practitioner Survey. 2006 Global Summit of The Microcredit Summit Campaign. Commissioned
Papers on Microcredit, The Microcredit Summit Campaign, Halifax, Canada.
Maes, J. and L. Foose (2006b). Microfinance and Non-Financial Services For Very Poor People: Digging Deeper to Find Keys to Success. The SEEP Network Poverty Outreach Working Group. K. Hunter. Washington, DC, The SEEP Network. 1825 Connecticut Avenue, NW Washington, DC 20009-5721 USA. Mallick, R. (2002). "Implementing and Evaluating Microcredit in Bangladesh." Development in Practice 12: 153-163. Mansuri, G. and V. Rao (2004). Community- Based and -Driven Development: A Critical Review. World Bank Research Observer 19(1): 1-39.
Márquez, F. and I. P. García-Pardo (2009). "Principal component analysis applied to filtered
signals for maintenance management." Quality and Reliability Engineering International: n/a.
Martin, O. S. (2001). Reaching the Poor: Fine Tuning Poverty Targeting Using a ‘Poverty Map’ — The Case of Mozambique. Discussion Paper Katajanokanlaituri 6 B, 00160 Helsinki, Finland, UNU World Institute for Development Economics Research (UNU/WIDER). Matin, I. (2005). "The very poor who participate in microfinance and those who never have." Small Enterprise Dev J 16(3): 51-7.
Matin, I., D. Hulme, et al. (2002). "Finance for the poor: from microcredit to microfinancial
services." Journal of International Development 14(2): 273-294.
Mkandawire, T. (2005). Targeting and Universalism in Poverty Reduction. Social Policy and Development Programme Geneva, United Nations Research Institute for Social Development. Pakistan Microfinance Network (2009). Microwatch - A Quarterly Update on Microfinance in Pakistan. Islamabad, Pakistan Microfinance Network. Issue 11: Quarter 1 (Jan-Mar 2009).
Pakistan Microfinance Network (2009). Microwatch - A Quarterly Update on Microfinance in
Pakistan. Issue 11: Quarter 1 (Jan-Mar 2009). Islamabad, Pakistan Microfinance Network.
Paxton, J. and C. Cuevas (2002). Outreach and Sustainability of Member-Based Rural Financial Intermediaries. The triangle of microfinance: Financial sustainability, outreach, and impact. M. Zeller and R. L. Meyer (eds). Baltimore and London, Johns Hopkins University Press.

36
Pischke, J. D. (1991). Finance at the Frontier: Debt Capacity and the Role of Credit in the Private
Economy. Washington, D. C, World Bank Economic Development Institute.
Rao, M. (1980). "Interest rates in backward agriculture: Notes and Comments." Cambridge Journal of Economics 4: 159-167. Robinson, M. S. (2001). The Microfinance Revolution: Sustainable Finance for the Poor - Lessons From Indonesia, the Emerging Industry Washington, D.C., World Bank Publications. Sen, A. (1995). The political economy of targeting in D.van de Walle, and K. Nead (Eds.): Public spending and the poor - theory and evidence. Washington, D.C., The World Bank. Shlens, J. (2005). A Tutorial on Principal Component Analysis. San Diego La Jolla, CA 92093-0402, Institute for Nonlinear Science, University of California. Srivastava, P. (2004). Poverty Targeting in Asia: Country Experience of India. Discussion Paper Series. Tokyo, ADB Institute. State Bank of Pakistan (2001). Report of the committee on rural finance. Karachi, State Bank of Pakistan. Stephens, B and Clark, H (2002). Microfinance distance Learning Course. Special Unit for
Microfinance (SUM), United Nations Capital Development Fund (UNCDF), Two United Nations
Plaza, 26th Floor, New York, NY 10017.
Sundrum, R. M. (1992). Income Distribution in Less Developed Countries. 11 New Fetter Lane, London, Routledge.
The Library of Congress (2005). Country Profile: Pakistan. F. R. Division, The Library of Congress,
101 Independence Ave, SE. Washington, DC 20540.
The World Bank (2005). The Effectiveness of World Bank Support for Community-Based and -Driven Development an OED Evaluation. Operations Evaluation Department. 1818 H Street, NW. Washington, DC 20433, The International Bank for Reconstruction and Development / The World Bank. The World Bank (2006). Country Assistance Strategy for the Islamic Republic of Pakistan for the Period FY 06-09 Country Assistance Strategy Series. Washington D.C, The World Bank Group. The World Bank (2007). Pakistan: Promoting Rural Growth and Poverty Reduction. Washington D.C, The World Bank.
Thys, D. (2000). Depth of Outreach: Incidental Outcome or Conscious Policy Choice? Editorial.
Washington D.C, Consultative Group to Assist the Poor.

37
UNDP (2009). Human Development Report (2009). 1 UN Plaza, New York, NY 10017, USA,
United Nations Development Programme.
UNDP (2010). Human Development Report (2010). 1 UN Plaza, New York, NY 10017, USA,
United Nations Development Programme.
Weiss, J. (2005). Poverty Targeting in Asia: Experiences from India, Indonesia, the Philippines, People’s Republic of China and Thailand. Tokyo, Asian Development Bank Institute. Woller, G., A. Simanowitz, et al. (2004). Integrating Poverty Assessment into Client Assessment. PROGRESS NOTE. 1825 Connecticut Avenue, NW Washington, DC 20009-5721, The Client Assessment Working Group The Seep Network. Yunus, M. (1997). Opening Plenary Washington, D.C., February 2-4, Microcredit Summit. Yunus, M. and A. Jolis (1999). Banker to the Poor: Micro-Lending and the Battle Against World Poverty. New York, Perseus Books Group. Zeller, M. and J. Johannsen (2006). Is There a Difference in Poverty Outreach by Type of Microfinance Institution? The Case of Peru and Bangladesh. The Global Conference on Access to Finance: Building Inclusive Financial Systems, organized as part of the annual conference series of The World Bank and the Brookings Institution in Washington, D.C., May 30 and 31, 2006. Zeller, M., M. Sharma, et al. (2001). An Operational Tool for Evaluating Poverty Outreach of Development Policies and Projects. Discussion Paper BRIEFS. 2033 K Street, N.W. Washington, D.C. 20006 U.S.A., Food Consumption and Nutrition Division of the International Food Policy Research Institute.