does media concentration lead to biased …sdellavi/wp/movieratings11-10-20.pdfdoes media...
TRANSCRIPT

Does Media Concentration Lead to Biased Coverage? Evidence
from Movie Reviews∗
Stefano DellaVigna
UC Berkeley and NBER
Alec Kennedy
San Francisco Federal Reserve Bank
October 20, 2011
Abstract
Fueled by the need to cut costs in a competitive industry, media companies have be-
come increasingly concentrated. But is this consolidation without costs for the quality of
information? Concentrated media companies generate a conflict of interest: a media outlet
can bias its coverage to benefit companies in the same group. We test empirically for bias
by examining movie reviews by media outlets owned by News Corp.–such as the Wall
Street Journal–and by Time Warner–such as Time. We find a statistically significant, if
small, bias in the review score for 20th Century Fox movies in the News Corp. outlets. We
detect no bias for Warner Bros. movies in the reviews of the Time Warner outlets, but find
instead some evidence of bias by omission: the media in this group are more likely to review
highly-rated movies by affiliated studios. Using the wealth of detail in the data, we present
evidence regarding bias by individual reviewer, and also biases in the editorial assignment
of review tasks. We conclude that reputation limits the extent of bias due to conflict of
interest, but that nonetheless powerful biasing forces are at work due to consolidation in
the media industry.
∗Preliminary, do not cite without permission. Ivan Balbuzanov, Tristan Gagnon-Bartsch, and Xiaoyu Xiaprovided excellent research assistance. We thank Marianne Bertrand, Saurabh Bhargava, Lucas Davis, Matthew
Gentzkow, Austan Goolsbee, Jesse Shapiro, Noam Yuchtman, and audiences at Brown University, Boston
University, Chicago Booth, and UC Berkeley for very helpful comments. We also thank Bruce Nash for access
to data from the-numbers, as well as helpful clarifications about the industry.

1 Introduction
On Dec. 13, 2007, News Corp. officially acquired Dow Jones & Company, and hence the Wall
Street Journal, from the Bancroft family. The acquisition was controversial in part because of
concerns about a conflict of interest. Unlike the Bancroft family whose holdings were limited
to Dow Jones & Company, Murdoch’s business holdings through News Corp. include a movie
production studio (20th Century Fox), cable channels such as Fox Sports and Fox News, and
satellite televisions in the Sky group, among others. The coverage in the Wall Street Journal
of businesses in these sectors may be biased to benefit the owner of the Journal, Newscorp.
The Wall Street Journal case is hardly unique. Media outlets are increasingly owned by
large corporations, such as Comcast, which owns NBC and Telemundo, the Hearst Corporation,
which owns a network of magazines and newspapers as well as ESPN, and Time Warner, which
owns AOL, Time, and other newspapers and magazines. Indeed, in the highly competitive
media industry, consolidation with the ensuing economies of scale is widely seen as a necessary
condition for survival. But is this consolidation without cost for the quality of coverage given
the ensuing conflicts of interest?
Addressing this question is important, since the potential biases in coverage can translate
into a serious policy concern in the presence of sizeable persuasion effect from the media
(e.g., DellaVigna and Kaplan, 2007; Gerber, Karlan, and Bergan, 2009; Enikolopov, Petrova,
and Zhuravskaya, forthcoming). Based on these and other studies, DellaVigna and Gentzkow
(2010) suggest as a benchmark estimate that on average 5 to 10 percent of the audience is
persuaded by messages of the media. In the presence of such sizeable persuasion, distortions
in media coverage can lead to significant welfare losses.
Yet should we expect coverage to be biased due to consolidation? Economic theory provides
no obvious response. If consumers can detect the bias in coverage due to cross-holdings and if
media reputation is paramount, no bias should necessarily occur. If consumers instead do not
detect the bias perhaps because they are unaware of the cross-holding, as in a simple model
we present, coverage in the conglomerate will be biased.
Despite the importance of this question, we know of no systematic evidence on distortions
in coverage induced by cross-holdings. In this paper, we provide such evidence. We focus on
two groups–News Corp. and Time-Warner–and measure how media outlets in these groups
review movies distributed by an affiliate in the group–20th Century Fox and Warner Bros.
Pictures, respectively. The advantage of focusing on movie reviews is that they are frequent,
easily quantifiable, and are believed to influence ticket sales (Reinstein and Snyder, 2005), with
clear monetary benefits to the studio distributing the movie. As such, they are a target of
potential distortion by the media company.
The identification of bias is transparent. We compare the review of, say, Avatar (distributed
by 20th Century Fox) by theWall Street Journal to the reviews by outlets not owned by News
1

Corp. Since theWall Street Journal may have a different evaluation scale from other reviewers,
we use as a further control group the reviews of movies distributed by a different studio, such
as Paramount. If the Wall Street Journal provides systematically more positive reviews for
20th Century Fox movies, but not for Paramount movies, we conclude that conflict of interest
induces a bias. In short, the empirical strategy is a difference-in-difference comparison.
We use a data set of over half a million reviews for movies released from 1985 (year in
which Newscorp. acquired 20th Century Fox) until 2011. The data sources for the reviews
are two online aggregators, Metacritic and RottenTomatoes. We compare the movie reviews
by 327 outlets with no conflict of interest (known to us) to the movie reviews issued by nine
media outlets with cross-holdings. Six media outlets are owned by News Corp. during at least
part of the sample–the U.S. newspapers Chicago Sun-Times (owned until 1986), New York
Post (owned from 1993), and Wall Street Journal (owned from 2008), the U.K. newspapers
News of the World and Times, and the weekly TV Guide (from 1988 until 1999). Three media
outlets are owned by Time-Warner–the weekly magazines Entertainment Weekly and Time
and the website CNN.com. For these outlets we compare the reviews for movies distributed by
an affiliated studio (including also distributors of independent movies, such as Fox Searchlight
and New Line) to reviews of movies by other studios.
We find differing results for the two media groups on the impact of conflict of interest. For
the media outlets owned by News Corp., in the more comprehensive empirical specification we
find that these media outlets give a more positive review to the 20th Century Fox movies by
2.6 points out of 100. The effect is relatively small, the equivalent of raising the review score
by one star (on a zero-to-four scale) for one out of ten movies. Still, it is a statistically and
economically significant difference, and the effect is larger in the specification with controls than
in the specification without, suggesting that unobservables may bias the estimates, if anything,
downward (Altonji, Elder, Taber, 2006). The effect is statistically significant, and economically
larger, on the ‘freshness’ indicator employed by Rottentomatoes to classify reviews.
For the media outlets owned by Time Warner, we find no evidence of bias due to cross-
holdings. The finding of no bias is not due to lack of power, since we can reject any bias in
the reviews larger than 0.7 out of 100 points. In fact, we reject the hypothesis that the bias
due to conflict of interest is the same for the two conglomerates. We also find no evidence of
bias using the ‘freshness’ indicator.
The unusually detailed information embedded in movie reviews allows us to provide some
evidence on the most likely channels through which bias may occur: (i) an explicit editorial
policy conveyed to the journalists; (ii) bias by a journalist ultimately due to the conflict of
interest, but lacking editorial pressure; (iii) correlation in taste between the media reviewer
(or the media audience) and the affiliated studio. To test for the different explanations, we
present evidence on clustering of bias within a conglomerate, on editorial policies, on selective
bias by type of movie, and on omission of reviews.
2

First, in the presence of an editorial policy or correlated tastes, but less so if bias represents
idiosyncratic behavior, the bias should be similar in most media outlets within a conglomerate.
Given that each outlet employs only a small number of reviewers, we go further and test for
bias by journalist for the media with sufficient reviews in the data.
Within the Newscorp. media, the bias is statistically significant only for the New York
Post, but is similar in size (though less precisely estimated) for Chicago Sun-Times, News of
the World, and TV Guide. There is marginally significant evidence of bias on the ‘freshness’
score for the Wall Street Journal, though not on the 0-100 score. In addition, we detect
statistical evidence of bias for 3 out of the 4 main New York Post reviewers, and for 1 of the 2
main TV Guide reviewers. Within the Time Warner media, we find no evidence of bias when
considering separately Entertainment Weekly, Time and CNN.com, nor for any of the major
reviewers in these outlets. The commonality of bias in the Newscorp. outlets, but not in the
Time Warner outlets, suggests the possibility of a common factor within one conglomerate but
not the other, such as editorial policies. The results could also be due to correlated tastes,
although it is not obvious why this would not apply to the Time Warner outlets.
Second, we test directly for editorial policies to implement bias, both with regard to the
dismissal of reviewers who turn out to be too independent, and assignment of movies to different
reviewers. There is no evidence that in media which changed ownership, reviewers are dismissed
or new reviewers are hired. We also find no evidence that affiliated movies are more likely to
be assigned to reviewers who are on average less critical, despite significant differences across
reviewers. Similarly, there is no evidence of selective assignment to reviewers who display
more (estimated) bias. These results suggest that the observed bias is unlikely to represent an
institutionalized editorial policy, of which we find no evidence. The results so far thus support
either the possibility of a (correlated) journalistic decision, or correlated tastes.
Third, we provide evidence to separate these two explanations. As we illustrate in a simple
model, if bias is due to a journalistic decision, bias should be larger for movies for which
the marginal benefit of bias is larger, holding constant the (reputational) marginal cost. If
bias reflects correlated tastes, it would presumably instead be similar across different affiliated
movies. While we do not have direct evidence on the marginal return to a higher score, the
return is likely to be lowest for movies that are rated negatively by other reviewers, since the
bias would have to be very significant to induce movie attendance. Indeed, in the New York
Post, the bias is concentrated among the movies which reviewers in other media rate positively,
with qualitative evidence of such pattern also for the Wall Street Journal. This suggests that
the bias in these outlets is more likely due to intentional bias, rather then correlated tastes.
We do not find this same pattern in the other Newscorp. media outlets (though the samples
are small) or in the Time Warner outlets.
Fourth, we present further evidence on these two explanations by examining bias by omis-
sion. A reviewer that intends to benefit an affiliated studio may selectively review only above-
3

average movies by this studio; this pattern is unlikely instead to be generated by correlated
tastes. Interestingly, we find no consistent evidence of bias by omission for the News Corp.
outlets, but we find evidence for two of the Time Warner outlets: CNN.com and Time mag-
azine. We also examine, using a smaller data set, a related form of omission bias, whether
media outlets write longer reviews and are less likely to delay a review for high-quality affiliated
movies. We find that Time Warner outlets write longer earlier reviews for the Warner Bros.
movies; however, this pattern does not depend on the movie quality, unlike for the omission of
review. This evidence suggests that some journalistic bias due to conflict of interest also takes
place within the Time Warner outlets, and that bias by omission and bias by commission are
substitutes, rather than complements.
We conclude the empirical analysis by providing one last piece of evidence on conflict of
interest due to cross-holdings. While the results so far focus on conflict of interest for movie
reviewers, the conflict of interest induced by consolidation hardly stops there. Indeed, one of
the review aggregators which we use in this study–Rottentomatoes–is itself at risk of conflict
of interest: independent when launched in 1998, it was acquired by News Corp. in September
2005 and then divested in January of 2010. This ownership structure generates an incentive for
RottenTomatoes to assign more positive reviews (its ‘freshness’ indicator) of 20th Century Fox
movies during the period of Newscorp. ownership. Interestingly, we find no evidence of such
distortion. The test of distortion has high power because we can compare the Rottentomatoes
rating to the Metacritic score for the same movie review. Most tellingly, we find no bias even
when bias would be hardest to detect (and hence presumably most likely), for unscored reviews
which are evaluated qualitatively by the Rottentomatoes staff.
Overall, these results have two main implications. On the one hand, reputation-based
incentives are quite effective at limiting the occurrence of bias: we find no evidence of explicit
editorial bias, such as in the assignment of movies to reviewers, no evidence of bias among the
aggregators, and quantitatively small (if statistically significant) evidence of reviewer bias. On
the other hand, bias does occur on situation, and that biasing strategies can be sophisticated,
such as in the case of seemingly strategic bias for the New York Post, or the omission bias
for Time magazine and CNN.com. This suggests that the potential for bias is always lurking,
were reputational concerns not strong enough. As we discussed, while several of the results
are consistent with the observed bias being due simply to correlated tastes, the findings of
selective bias and omission bias are best explained by conflict of interest.
We use the estimated impact of media bias on movie reviews to compute a back-of-the-
envelope bound for the value of a reputation. We assume that an extra star (our of 4) persuades
1 percent of readers to watch a movie. This persuasion rate is in the lower range of the
estimated persuasion rates (DellaVigna and Gentzkow, 2010) and is significantly smaller than
the estimated impact of media reviews of Reinstein and Snyder (2005), though admittedly we
have no direct evidence. Under this assumption, an extra star in a single movie review for a
4

20th Century Fox in a newspaper like the New York Post with a circulation of about 500,000
readers would add approximately $40,000 in profits for Newscorp. If the New York Post had
biased by one star all reviews for the 481 20th Century Fox movies released since 1993, the
increased profit could have been nearly $20m. The fact that such systematic bias did not take
place indicates that the value of the New York Post reputation is larger. We do, however, find
a bias of one star every ten reviews, for an overall estimated benefit to Newscorp. of $2m.
This paper relates to the literature on conflict of interest. Analysts employed by investment
banks which recently undertook an IPO or SEO for the company covered display significantly
biased recommendations (Hong and Kubik, 2003; Richardson et al., 2004; Malmendier and
Shanthikumar, 2007). Compared to these papers, we find more nuanced evidence of bias.
Interestingly, this occurs despite the fact that the conflict of interest is typically not disclosed1
(Cain, Loewenstein, and Moore, 2005). Turning to conflict of interest in the media, Reuter
and Zitzewitz (2006) find evidence that media outlets bias their coverage to earn advertising
revenue. While the conflict of interest with advertisers is unavoidable for media outlets, we
investigate the additional conflict of interest due to cross-holdings.
A small number of papers considers bias in the media due to consolidation, as we do. Gilens
and Hertzman (2008) provide some evidence that the coverage of the debate on deregulation
of TV is biased by conflict of interest. Goolsbee (2007) and Chipty (2001) examine the extent
to which vertical integration in the entertainment industry affect the network programming
and cable offering. Rossman (2003) and Ravid, Wald, and Basuroy (2006) examine the extent
of bias in movie reviews, including due to conflict of interest. Both papers use only a small
sample of hand-coded reviews–about 1,000 reviews for the years 1996-97 for Russman (2006)
and about 5,000 reviews for the years 1991-93 for Ravid et al. (2006). Relative to these
papers, the granularity of information embedded in half a million movie reviews allows us to
more precisely measure and decompose the extent of the impact of consolidation.
This paper also relates to the economics of the media (Stromberg 2004; George and Wald-
fogel, 2006; Gentzkow 2006; DellaVigna and Kaplan 2007; Gerber, Karlan, and Bergan 2009;
Snyder and Stromberg 2010; Knight and Chiang forthcoming; Enikolopov, Petrova, and Zhu-
ravskaya forthcoming), and in particular to papers measuring the extent of media bias (Grose-
close and Milyo, 2005; Gentzkow and Shapiro, 2010; Larcinese, Puglisi and Snyder, 2010;
Durante and Knight forthcoming). Within the context of movie reviews we address questions
that have arisen in this literature–such as whether bias occurs by omission or commission and
the role of journalists versus that of editors–about which prior evidence was very limited.
The remainder of the paper is as follows. In Section 2 we introduce a simple model of the
biasing decision. In Section 3 we introduce the data and the institutional context. In Section
4 we present the results of the test of whether media outlets bias movie reviews as a result of
a conflict of interest. In Section 5 we conclude.
1The results are from an analysis of a random sample of over 100 reviews for affiliated studios.
5

2 Framework
We consider the decision by a media to assign a review score to a movie. The true quality of
a movie is given by which is unknown, but it is common knowledge that has a normal
distribution with mean 0 and precision : ∼ ¡0
−1¢ Each media source receives a noisysignal of quality given by = + where is i.i.d. with a known distribution, also normal:
∼ ¡0 −1
¢
For simplicity, we consider the case of a single media source. The standard normal learning
model implies that, upon observing signal the media updates the expected quality to
[|] = +
+
After observing signal the media chooses a rating to announce to its readers. We
consider first the case of an unbiased media news source with no conflict of interest, then the
case of a media source which is biased by the conflict of interest, and finally the case of a media
source which receives a biased signal.
Unbiased media source. We assume that the media source minimizes the expected
squared deviation of the review from the true movie quality:
= argmax− 2 [ − ]2 (1)
This cost function can be interpreted as the expected reputational cost 0 of detection of
bias, which occurs with a probability which is increasing in the square of the bias (for small
enough bias). It can also be interpreted as the desire to comply with reader preferences. The
solution to problem (1) is
∗ = [|] = +
+ (2)
The media will release as its review ∗ the updated expected quality of the movie, given thesignal
The potential movie-goers are of two types, readers of the media review and non-
readers. We do not endogenize the decision to read the review, which could be due for example
to the decision to subscribe to the media because of its sport section.2 Neither type observes
the signal , but the readers use the review to update the prior on the quality of the
movie, while the non-reader have to rely on the prior.
Using the review, the readers decide whether movie attendance is preferable to an alterna-
tive option yielding utility The utility of watching the movies equals the expected quality
of the movie plus a random utility term , with c.d.f. and an absolutely continuous p.d.f.
. We impose two mild conditions on (): (i) that () is bounded, that is, () ≤ for all
2Endogenizing the decision to read the newspaper would not affect the solution as long as we assume (as we
do below) that readers do not realize the presence of conflict of interest.
6

for some finite , and (ii) that () is single-humped with mode at 0, that is 0 () 0 for
0 and 0 () 0 for 0 Readers watch the movie if
+ ≥
which occurs with probability 1 − (− ), which is increasing in . The movie-goers
who do not observe the movie review rely on their priors and watch a movie with proba-
bility 1 − (− 0) The expected total movie attendance hence equals [1− (− )] +
[1− (− 0)]
Conflict of interest. A media source with conflict of interest, while still wanting to appear
unbiased, also aims to increase the sales of movies produced by affiliated studios. For each
ticket sold for an affiliated movie, the media outlet owner earns 0 dollars. The optimal
review for movies distributed by other studios is still represented by expression (2), but for
affiliated movies the media maximizes
= argmax− 2 [ − ]2 + [1− (− )] + [1− (− 0)] (3)
The key assumption used for (3) is that the readers of the movie reviews are naive about
the conflict of interest, and hence take the review as the best measure of expected quality,
neglecting the fact that the conflict of interest induces a bias in the reviews. We make this
assumption for simplicity, but we also think that most readers are likely unaware of the conflict
of interest, especially given that the conflict is not reveled in the reviews.
The maximization problem (3) leads to the first-order condition
− (∗ − ∗ ) + (− ∗) = 0 (4)
and the second order condition
−− 0 (− ∗) 0 (5)
The first-order condition makes clear that the bias will always be positive (∗ ∗ ) sincefor ∗ ≤ ∗ the expected utility of the media is strictly increasing in ∗ The existence of asolution for ∗ is guaranteed by the assumption that () is bounded, and hence for a largeenough ∗ the left-hand side of (4) turns negative; hence, any optimum is given by a solution
to (4). The second-order condition indicates that at the optimum 0 cannot be too negative;notice that uniqueness of ∗ is not guaranteed in general.Biased Draws. A third case which we consider is that a media source does not have a
conflict of interest (or is not affected by it), but receives biased draws + where is drawn
as above and is a scalar indicating the bias; we set 0 to fix ideas. While biased draws
from the signal distribution can occur for many reasons, an important case for our analysis is
one in which journalists employed in a conglomerate share the tastes of the affiliated studio
7

distributing movies. For example, reviewers at the New York Post may (genuinely) like more
the movies produced by 20th Century Fox studios, apart from any effect of conflict of interest.
To simplify, we assume that the media itself is not aware of this bias term, nor are readers.3
Hence, the media still maximizes problem (1), but the solution now for the review ∗ under
biased draws is
∗ = + ( + )
+ (6)
which leads to a bias ∗ − ∗ = ( + ) in the review.
We summarize these results in the following proposition.
Proposition 1. With no conflict of interest, the optimal media review ∗ will be perfectlyinformative of the expected quality of the movie given the information available: ∗ = [|] With conflict of interest or with biased draws, the optimal review will be biased upward: ∗ ∗and ∗ ∗Next, we consider comparative statics properties, summarized in the next proposition.
Proposition 2. With conflict of interest, (i) the bias in the review ∗ − ∗ is (locally)
increasing in the number of readers in the revenue per ticket , and is decreasing in the
reputation cost ; (ii) the bias in the review ∗− ∗ is increasing in the unbiased review ∗ fora low-enough quality movie: (∗ − ∗ )
∗ 0 for ∗ . With biased draws, the
bias ∗ − ∗ is insensitive to the above parameters.Proof. Using the implicit function theorem, the optimal review ∗ is increasing locally in
the number of readers :
∗
= − (− ∗)−− 0 (− ∗)
0
while ∗ does not vary with and hence ∗ − ∗ is increasing in Similarly, one shows
∗ 0 and ∗ 0. Turning to (∗ − ∗ ) ∗ the implicit function theorem
implies (∗ − ∗ )
∗=
−−− 0 (− ∗)
− 1 = 1
1 + () 0 (− ∗)− 1
which is positive for 0 (− ∗) 0 Using the property that () is bounded by , notice thatthe first-order condition (4) implies that ∗ − ∗ is bounded above by ≡ . Hence,
if we consider ∗ − it follows that − ∗ ≥ − ∗ − 0 Given the assumptions
about − ∗ 0 implies 0 (− ∗) 0 and hence the desired condition. Q.E.D.The first set of comparative statics is intuitive: the distortion due to conflict of interest
is increasing in the marginal return of distortion, determined by the revenue per ticket and
the number of readers and is decreasing in the marginal cost of distortion, the reputa-
tion cost The second property explores the impact on distortion of the distribution of the
3We could alternatively assume that this bias is common knowledge, and that it is shared by the readers.
To keep the framework simple, we do not model the horizontal differentiation implied in this version.
8

random utility term . The first-order condition in (4) indicates that the bias is increasing
in the density (− ∗) which implies a higher persuasion rate since more types are at themargin. Proposition 2(ii) states that for movies of low enough quality, given the hump-shape
of the distribution of , the bias is increasing in the quality of the movie, since the density of
persuadable types (− ∗) is increasing in the movie quality. In comparison, instead, thebias in review due to biased draws is constant with respect to any of these parameters.
To illustrate the general shape of bias with respect to the movie quality, in Figure 1 we
plot the optimal reviews for the three cases–∗ ∗ and ∗– as a function of the signal .
We assume a normal distribution for ∼ (0 23) we set = equal to 1, the bias equal
to 1, equal to 1 and equal to 10. As Figure 1 illustrates, the review for the conflict
of interest case ∗ and for the biased draws case ∗ are both above the unbiased review ∗
However, while the bias in review is constant for case of biased draws, it is hump-shaped for
the case of conflict of interest: it first increases monotonically, as predicted by Proposition
2.(ii), and then decreases monotonically.
3 Data
Metacritic and Rottentomatoes. The data used in this paper comes from the publicly-
available information collected from two review aggregator websites, www.metacritic.com and
www.rottentomatoes.com. Both websites collect movie reviews from a variety of media and
publish snippets of those reviews.
The two websites differ in how they summarize reviews. Metacritic assigns a score for each
movie review on a scale from 0 to 100, and then averages such scores across all reviews of a
movie to generate an overall score. For reviews with a numeric evaluation, such as for the
New York Post (out of 4 stars), the score is a straightforward renormalization on a 0-100 scale.
For reviews without a numerical score, such as for Time magazine, Metacritic staffers read
the review, evaluate its general tone and assign a score on the same 0-100 scale (typically in
increments of 10).
In contrast, Rottentomatoes does not use a 0-100 score, though it does report the underlying
summary assessment for reviews with a quantitative score. For each review, Rottentomatoes
instead classifies a movie as ‘fresh’ or ‘rotten’ based on the review, and then computes an ag-
gregate score for each movie — the tomatometer — as the share of reviews which are ‘fresh’. For
reviews that are quantitative, the binary indicator for ‘freshness’ is built relatively straight-
forwardly as a function of the underlying score: for example, movies with 2 stars or fewer are
classified as ‘rotten’, while movies with 3 or more stars are classified as ‘fresh’, with movies
with 2.5 stars split based on a subjective judgment. For the reviews with no quantitative score,
the movie is rated as ‘fresh’ or ‘rotten’ using a subjective evaluation by the staff, like in the
Metacritic case (though the final evaluation is a 0/1 indicator, not a 0-100 score).
9

The two data sets have different advantages for our purposes. Metacritic contains more
information on each review, since a review is coded on a 0-100 scale, rather than just using a
binary indicator. Rottentomatoes, however, is a much more comprehensive data set, containing
about five times as many reviews as Metacritic, due both to coverage of many more media
(over 500 compared to less than 100) and to a longer time span. To take advantage of the
strength of both data sets, we combine all reviews in the two data sets for movies produced
since 1985 and reviewed up until July 2011 in the Metacritic website and until March 2011 on
the Rottentomatoes website. We eliminate earlier reviews because the review data for earlier
years is quite sparse, and before 1985 there is no conflict of interest: Newscorp. acquired
20th Century Fox in 1985 and the conglomerate Time Warner was created in 1989. We also
eliminate a small number of duplicate reviews by the same reviewer in a given media.
We merge the reviews in the two data sets (134,129 reviews in MetaCritic and 583,783
reviews in RottenTomatoes ) by title, year of production of the movie (since some movie titles
are repeated in the data), media of review, and name of the reviewer. Out of the resulting
sample of 640,042 reviews, we excluded all movies with fewer than 5 reviews, and all media
with fewer than 400 reviews, for a final sample of 548,764 movie reviews.4
To make the two data sets compatible, we then apply the Metacritic conversion into a 0-100
scale also to all the reviews in the Rottentomatoes data which report an underlying quantitative
score. To do so, we use the reviews present in both Metacritic and Rottentomatoes and assign
to each Rottentomatoes score the corresponding median 0-100 score in the Metacritic data,
provided that there are at least 10 reviews present in both samples with that score. For a
small number of other scores which are common in Rottentomatoes but not in Metacritic we
assign the score ourselves following the spirit of the Metacritic scoring rules (e.g., a score of 25
to a movie rated ‘2/8’).
Media Sources. Table 1, Panel A reports summary statistics on the combined data set
of 548,764 reviews covering a total of 12,999 movies reviewed in 336 different media outlets.
The data set includes reviews from six media with a conflict of interest within the News Corp.
group with 20th Century Fox movies: the American newspapers Chicago Sun-Times (owned by
News Corp. only up until 1986), New York Post (owned by News Corp. from 1993), and Wall
Street Journal (owned by News Corp. since December 2007), the British newspapers News of
the World and Times (both owned throughout the period) and the magazine TV Guide (owned
by News Corp. from 1988 until 1999). The number of reviews, and the data source, differs
across these seven media. The British newspapers are represented only in Rottentomatoes and
have less than 1,000 reviews each in the data. The New York Post is represented in both data
sets and has the most reviews (6,278, all while owned by Newscorp.). TV Guide and Wall
4While we edited to the extent possible the title of movies and the name of the reviewer to match the names
in the two data sets, some reviews in the merged data are duplicates because they were not exact matches. To
increase the match rate, we allow for the year of the movies in the two data sets to differ by one year.
10

Street Journal have a relatively high number of reviews, but only a minority while owned by
Newscorp.. All but one of these seven media (the Wall Street Journal) have a quantitative
scoring rule for the reviews. The average quantitative score ranges between 56 and 70 (out
of 100), with an standard deviation of about 20, while the share of ‘fresh’ reviews varies
between 48 percent and 62 percent. Finally, these media employ as reviewers a small number
of journalists who stay on for several years, and often for the whole time period. Therefore,
within each media the two most common reviewers (three for the New York Post) cover the
large majority of the reviews, with two media using essentially only one reviewer: Chicago
Sun-Times (Roger Ebert) and the Wall Street Journal (Joe Morgenstern).
The lower part of Table 1, Panel A reports the information on the three media owned
by Time Warner: the website CNN.com, and the weekly magazines Time and Entertainment
Weekly (both owned by Time Warner from 1990 on). The reviews in these three publications
are at conflict of interest with Warner Bros. movies, since the studio was acquired in 1989 by
Time, Inc. Two of the three outlets — CNN.com and Time — use only qualitative reviews; since
the reviews from CNN.com are only in the RottenTomatoes data set, there is no 0-100 score
for these reviews, but only a freshness rating. Most of the observations are from Entertainment
Weekly, with nearly 5,000 reviews. These outlets, like the Newscorp. outlets, employ only one
or two reviewers.
Studios. Table 1, Panel B presents information on the studios distributing the 12,999
movies reviewed in our data set. Among the distributors owned by News Corp., 20th Century
Fox movies are the largest group (449 movies), followed by Fox Searchlight which distributes
movies in the ‘indie’ category. Among the studios owned by Time Warner, the largest distrib-
utor is Warner Bros., followed by a number of distributors of ‘indie’ movies: Fine Line, New
Line, Picturehouse, and Warner Independent. In most of the following analysis, we group all
the studios into those that are owned by Newscorp., which we call for brevity 20th Century
Fox, and those that are owned by Times Warner, which we call Warner Bros.
4 Bias in Movie Reviews
4.1 Bias by Conglomerate
Graphical Evidence. As a first step in the analysis, we examine whether the conflict of
interest induces a bias on average in the reviews, that is, whether, say, theWall Street Journal
provides a more positive review to 20th Century Fox movies when owned by Rupert Murdoch.
Appendix Figure 1 provides preliminary evidence in this regard for movies reviewed by the
Wall Street Journal on a quantitative review score between 0 and 100.
The top panel presents the information for reviews for the period in which Newscorp. owns
the Journal (2008 on), while the bottom panel presents the earlier data. The first quadrant
11

focuses on the 20th Century Fox movies produced from 2008 which were reviewed by theWall
Street Journal, and compares the reviews by the Journal to reviews by other media for the same
movies.5 The Journal reviews are more negative than other reviews. The second quadrant does
a similar comparison for movies produced by other studios and finds a similar, if somewhat
smaller, difference. The bottom panel shows similar statistics for movies produced before News
Corp. owned the Wall Street Journal, that is, pre-2008. Overall, this comparison produces no
obvious evidence of bias due to cross-holdings, or possibly a negative bias.
However, the evidence in Appendix Figure 1 is based on a small number of movies, as
the Wall Street Journal reviewed only 45 movies produced by 20th Century Fox since 2008.
Hence, in Figure 2a we expand the analysis to consider all media owned by Newscorp. The left
panel in Figure 2a focuses on the 406 movies produced by 20th Century Fox over the period
1985-2011: the average review score by the News Corp. owned media is just slightly lower than
the score attributed for the same movies by other media outlets. This comparison, however,
does not control for possible differences in the average generosity of reviews for the media
owned by News Corp. versus the other media. Indeed, the second panel of Figure 2a shows
that for the 6,976 movies not distributed by 20th Century Fox, the average rating by News
Corp. media is about 3 points lower than the average rating by other media outlets. Once
one takes into account this baseline difference in a difference-in-difference comparison, News
Corp.-owned media give a more positive review to movies distributed by 20th Century Fox.
Below, we test whether this difference is statistically significant and robust to the addition of
control variables.
Figure 2b provides the same evidence for movies distributed by Warner Brothers and their
reviews, compared to movies distributed by other companies. The media owned by Time
Warner provide on average slightly more positive reviews than other media, and this difference
is nearly identical for movies produced by Warner Brothers and for other movies. Hence, unlike
for the case of News Corp. we find no prima facie evidence of conflict of interest in the movie
reviews for media owned by Time Warner.
Regressions on Average Bias. We implement a regression-based test for the effect of
conflict of interest which builds on the graphical evidence above, but allows for the addition
of control variables, which is important since movies produced by different studios differ in
important ways. We estimate a difference-in-difference OLS regression:
= + + +
(7)
+ +
+
+ +
Each observation is a review for movie on media outlet . The dependent variable
is a 0 to 100 score for the review, or an indicator for ‘freshness’ in the Rottentomatoes sample.
5To compute the average review by other media outlets, we first compute for each movie the average review
by all other outlets, and then we average these averages across movies.
12

The coefficient captures the average difference in reviews for movies that are produced
by 20th Century Fox, for which the indicator variable equals 1. The coefficient
captures the average difference in reviews for media outlets that are owned by News Corp. at
the time of movie release, in which case the indicator variable equals 1. The key
coefficient is , which indicates the estimated impact of the conflict of interest, that is, the
average rating for a movie released by 20th Century Fox when reviewed by a media owned
by News Corp., compared to the counterfactual. The coefficients , , and present
the parallel cases for the Time Warner group. The control variables vary across different
specifications. The standard errors are clustered at the movie level to allow for correlation of
errors across multiple reviews of a movie.6
Table 2 reports the results for the combined sample of 474,496 reviews on the 0-100 review
score. (Notice that the sample is smaller than the overall sample of 548,764 reviews because
it does not include qualitative reviews in the Rottentomatoes data, which are not scored) In
Columns 1 to 4 we present the results after including an increasing number of control variables,
to show the effect of controlling for observables. A specification without any controls (Column
1) indicates no significant effect of conflict of interest for either the News Corp. outlets ( ) or
the Time Warner outlets ( ), and introducing fixed effects for the year of release of the movie
reviewed (Column 2) does not affect the estimates appreciably. These estimates, however,
do not control for the fact that the type of movies reviewed by the Newscorp. and Time
Warner media may differ from other media in a way that could bias the estimates. It could
be, for example, that Time magazine reviews only good movies produced by smaller studios,
but reviews both good and bad movies produced by large studios such as Warner Bros. In
this case, the coefficient on the conflict of interest interaction could be downward biased
because we are not controlling for movie quality.
In Column 3 we control for movie quality by introducing fixed effects for each movie. Not
surprisingly, these controls raise the R2 significantly from 0.01 to 0.41. Once we control for
movie quality, we now detect a statistically significant, if moderate sized, effect of conflict of
interest for the News Corp. outlets: = 20749: movies at risk of conflict of interest receive a
more positive review by 2.1 points out of 100. There is instead no significant estimated impact
of conflict of interest for the Time Warner outlets: in fact, the estimated effect of conflict of
interest is to lower the score by 1 point out of 100, if insignificantly so. Given the opposite
sides of the coefficients, an F-test rejects the equality of the conflict of interest coefficients for
the two media groups with a p-value of 0.0035 (bottom row in Table 2).
To further control for the selection of movies reviewed into different media, in Column 4
we introduce fixed effects for each of the 336 media in the sample. The introduction of these
fixed effects, which raises the R2 further to 0.46, increases the estimated effect of the bias due
6In Appendix Table 1 we consider alternative forms of clustering and show that clustering by movie appears
to be the most aggressive one.
13

to conflict of interest for the News Corp. media to = 25651 significantly different from 0
at the 1 percent level. The estimated effect of conflict of interest for the Time Warner group,
instead, remains negative, small, and not significantly different from zero.
Finally, in Columns (5) and (6) we estimate separately the effect for movie reviews in,
respectively, the Metacritic database and in the Rottentomatoes database. (Movie reviews
which are in both data sets are present in both samples) The results are similar in the two
samples, with larger estimates of conflict of interest for News Corp. in the MetaCritic data.
The results using the 0-100 score hence provide evidence of a statistically significant bias
for the News Corp. outlet of 2.6 points out of 100 in the most controlled specification, cor-
responding to a 4 percent increase relative to the average score of 61.5 points. The effect is
relatively small, the equivalent of raising the review by one star (on a zero-to-four scale) for
one out of 10 movies reviewed. The fact that the addition of a rich set of control variables
increases the estimated effect suggests that the estimate may be if anything biased downward,
to the extent that the unobservables resemble the observables (Altonji, Elder, and Taber, 2006)
The conclusions of the Altonji, Elder, and Taber test are strengthened by the fact that the
covariates control a significant share of the residual variance, with an Rˆ2 of 0.46 in Column
4.
For the Time Warner outlets, given the precision of the estimates, in the benchmark spec-
ification we can reject a positive bias larger than 0.9 points out of 100, corresponding to 1.5
percent of the mean score. Hence, the finding of no bias for Time Warner is not due to lack of
power.
In Table 3 we estimate the OLS regression (7) with the ‘freshness’ indicator as dependent
variable . While the 0-100 score used in Table 2 conveys more information than a 0-1
variable, the freshness indicator is defined for the qualitative reviews in the Rottentomatoes
data, which the 0-100 score is not. The results in Table 3 are remarkably parallel to the results
in Table 2. There is no significant evidence of conflict of interest in the specification with no
controls (Column 1). However, once the controls for movie fixed effect (Column 3) and media
fixed effect (Column 4) are added, the results indicate a statistically significant positive bias
for the News Corp. outlets. In the most controlled specification, the bias amounts to a 6.59
percentage point higher probability of a ‘fresh’ review for movies with conflict of interest, an 11
percent increase relative to an average freshness score of 59 percentage points. The estimate is
even larger in the sub-sample of RottenTomatoes data which is also part of the Metacritic data
(Column 5). We return below to a comparison of the magnitude of bias in Table 3 versus in
Table 2. In contrast, we find no evidence of positive bias and some evidence of a (statistically
insignificant) negative bias for the Time Warner outlets.
Robustness. In Appendix Table 1 we present the result of a series of robustness checks for
the benchmark specification with full controls (Column 4 in Tables 2 and 3); we report only the
relevant conflict-of-interest coefficients. Alternative ways to cluster standard errors by studio
14

and by media lead to higher standard errors than in the benchmark specification (Columns 2
and 3, compared to the benchmark clustering reproduced in Column 1). We then explore the
impact of restricting the sample of movies in the control group to ones that are arguably more
similar to the ones at conflict of interest: movies distributed by the Big-6 major studios–
Columbia Pictures, Paramount Pictures, Universal Pictures, Walt Disney/Touchstone Pic-
tures, in addition to 20th Century Fox and Warner Bros.– and by the major indie studios.
The results are very similar (Column 4). Finally, we analyze separately the quantitative re-
views (Column 5) and the qualitative reviews (Column 6). The evidence of bias for Newscorp.
is for the quantitative reviews, which are the large majority; the sample of purely qualitative
reviews is much smaller, and hence the estimates quite noisy.
4.2 Bias by Media and Journalist
So far, we discussed the extent of possible bias in review for the two media conglomerates,
finding evidence of bias in the Newscorp. group, but not among the Time Warner media. This
evidence, however, does not speak to the possible channels through which bias may occur: (i)
an explicit editorial policy conveyed to the journalists; (ii) bias by a reviewer ultimately due
to the conflict of interest, but lacking editorial pressure; (iii) correlation in taste between the
media reviewer (or the media audience) and the affiliated studio.
We can exploit the richness of the movie review data to open up the black-box of me-
dia coverage, and help assess the different possibilities. We postpone the discussion of the
correlated-taste explanation (iii) until section 4.4, and focus this section and the next section
on distinguishing editorial bias (i) from journalistic bias (ii).
To the extent that bias reflects an editorial policy, we expect to find similar bias in most
media outlets belonging to the same conglomerate, and for most journalists within a given
media. This clustering of bias is less likely if bias represents idiosyncratic behavior by a
journalist. We present now evidence on the extent of such clustering.
Bias By Media. For each media , we estimate the specification
= + () + () + ()
() + + (8)
where () is the relevant industrial group (e.g., if the media considered is TV Guide).
We include in the sample for media all reviews for movies that are reviewed by media , and
include only years in which media is owned by the industrial group () (e.g., for the TV
Guide regressions, we only include the years 1988-99). The controls are the full set of movie
and reviewer fixed effects. We present the estimates for the 0-100 score in Panel A of Table 4
and for the freshness score in Panel B of Table 4.
For all six media owned by News Corp., the coefficient for bias is positive, whether one
considers the score results or the freshness results. Given the larger standard errors involved
15

in a media-by-media analysis, the bias is however significant for only one media, the daily
New York Post, for which the bias is significant both in terms of 0-100 score (3.13 points) and
‘freshness’ (7.18 percentage points). There is also marginally significant evidence of a bias in
the ‘freshness’ variable, though not in the 0-100 score, for the Wall Street Journal; however,
the estimates for the Journal are quite imprecise as the conflict of interest starts in 2008. The
largest point estimate of bias in the 0-100 score (though with large standard errors) is for
News of the World, the UK daily which recently closed down because of the scandal regarding
journalistic behavior in hacking.
For the three media owned by Time Warner, instead, the estimated coefficients of bias are
all negative, although insignificant. For both Entertainment Weekly and Time magazine, the
estimates are quite precise and given the confidence intervals we are able to reject any sizeable
bias, such as bias larger than 1.2 points (out of 100) for Entertainment Weekly and larger than
1.8 points (out of 100) for Time magazine.
Bias By Journalist. The evidence documented so far suggests a significant amount
of clustering in the point estimate of the bias within a given conglomerate, suggesting the
potential for a coordinated editorial policy. A stricter test, however, involves testing for bias
journalist-by-journalist within a given media, which we do now.
We take advantage of the fact that most media have only a small number of movie reviewers,
and these reviewers typically stay on for years, if not decades. This long tenure allows us to
estimate journalist-specific patterns which, as far as we know, is a unique feature within the
literature. Table 5 lists all the significant reviewers for the media in the two conglomerates.
Some media outlets, such as Chicago Sun-Times, News of the World, andWall Street Journal,
have only one reviewer, respectively Roger Ebert, Robbie Collin, and Joe Morgenstern. Most
other media outlets have two main reviewers, including TV Guide, The Times, Entertainment
Weekly, and Time Magazine. Finally, the New York Post has five main reviewer, three of
which are more frequent than the others.
In Table 6 we estimate, reviewer-by-reviewer, the equivalent of specification (8), except
that we include in the sample only reviews done by a particular reviewer, and all other reviews
by other media of those same movies. The first four columns of Table 6 present the analysis
separately for four of the main reviewers of the New York Post. (We do not include V.A.
Musetto because, as discussed below, he reviewed only four 20th Century Fox movies, and
hence we cannot estimate whether he is biased). Interestingly, the estimates indicate statisti-
cally significant evidence of bias (at least at 10% level) for three out of four of the New York
Post reviewers. The conclusion holds whether we use the 0-100 score measure or the ‘fresh-
ness’ indicator. The estimated bias for the New York Post, hence, is not due to an outlying
individual. We also estimate significant bias for the main reviewer of the TV Guide (Maitland
McDonagh), but not for the second TV Guide reviewer. For the other Newscorp. outlet with
multiple reviewers–the Times–the point estimates do not indicate bias, but the sample is
16

small enough that the estimates are quite imprecise (results not reported).
Turning to the Time Warner outlets, we detect no evidence of bias for any of the two
reviewers of Entertainment Weekly and Time. (In fact, there is statistically significant evidence
of negative bias for one Time reviewer, but the result does not hold with the ‘freshness’ score.)
Hence, the null finding of bias in the Time Warner outlets does not appear to be due to multiple
reviewers having opposite biases, but rather a uniform finding.
The evidence by media and by journalists suggests a quite homogeneous pattern–the
estimated bias is frequent among the NewsCorp. journalists, but not among the Time Warner
journalists. This evidence is certainly consistent with common incentives (or common selection)
within a conglomerate, though it does not provide any direct evidence of editorial bias, to which
we turn next.
4.3 Editorial Bias
An editor who intends to bias the review process can do so in at least two ways, by putting
pressure on the reviewers, or by assigning the affiliated movies to reviewers who are more
positive. While the former editorial choice is indistinguishable in the data from independent
journalistic bias, the latter evidence of editorial discretion can be detected in the data. Addi-
tionally, this latter form of bias may be more palatable to an editor, as it does not involve any
direct pressure on individual journalists.
The most obvious form of editorial selection of journalists is the hiring of more favorable
journalists and firing of less favorable ones. Editorial pressure therefore can manifest itself in
turn-over of reviewers at the time of change in ownership. We observe no evidence of elevated
turn-over for the outlets which we observe before and after the change in ownership (Table 5):
Roger Ebert stayed on at the Chicago Sun-Times when Newscorp. divested the newspaper, and
Joe Morgenstern stayed on at theWall Street Journal when Newscorp. took it over. Similarly,
in Time magazine there was no change in reviewers in 1990 when Time, Inc. acquired Warner
Bros.
Table 5 provides also evidence on a related personnel-based reviewer selection: reviewers
who are not prone to bias may be more likely to lose their job. We test for this form of selection
using the estimates of bias by reviewer in Table 6. There is no systematic such evidence for
New York Post (one of the reviewers with most positive bias, Megan Lehmann, stays on only
very shortly) and TV Guide.7
The lack of such evidence may not, however, be surprising, since dismissals are a costly
biasing policy. Editorial bias, however, can take advantage less costly forms. A simple strategy
is to assign movies to the reviewers who are on average more generous in their evaluation. A
7We do not apply the test to the Time Warner outlets since we find no evidence of bias in Table 6 for these
media.
17

second, related, strategy is to pick reviewers who are more prone to bias. Both forms of
selection are quite unlikely to occur if individual journalists happen to be biased with no
editorial involvement.
We first test for the first bias, that is, whether affiliated movies are more likely to be
assigned to reviewers who on average are more generous, that is, assign higher scores. To
estimate whether there indeed are significant differences in average reviewer score, we estimate
the OLS regression
= + + +
where is the 0-100 score for movie on media outlet is a movie fixed effect, and
is a reviewer fixed effect (with A.O. Scott of the New York Times as omitted category). We
exclude movies distributed by studios owned by Newscorp. or Time Warner. Table 5 reports
the estimated reviewer fixed effects together with the standard errors. Movie reviewers
indeed differ quite sizably within a given outlet. Within the New York Post, reviewers differ
by up to 7 points, by 5 points in TV Guide, and 3 points in the Times. The differences are
instead smaller in the Time Warner outlets, with a 2-point difference in Entertainment Weekly,
and a 1-point difference in Time Magazine.
Given that journalists in the News Corp. media differ in terms of the average generosity
of their reviews, we can estimate whether movies at conflict of interest are more likely to be
assigned to reviewers who are on average more generous, an assignment which would be more
likely to be due to explicit editorial bias. The last column of Table 5 provides evidence on
the share of each journalist’s reviews which are about movies from affiliated studios. There
is no detectable pattern in the data: the share of 20th Century Fox movies reviewed is 7-
8% for almost all reviewers, despite the large difference in average score generosity. The one
exception is that a reviewer at the New York Post, V.A. Musetto, reviewed nearly none of
the 20th Century Fox movies, differently from the other 4 reviewers. The pattern is, however,
explained by the fact that this reviewer covers nearly exclusively indie movies; and in any case
this reviewer has a high fixed effect, and hence would have been expected, in case of intention
editorial assignment, to handle more 20th Century Fox movies.
To formalize the test, we run for each media with a regressions like (8), except that the
dependent variable is the estimated reviewer fixed effect The evidence, in Appendix Table
2, provides no indication of editorial bias. In fact, for the New York Post we obtain evidence
of negative selection which is due, as discussed before, to one specialized indie movie reviewer
who happens to be relatively generous. We can therefore reject any systematic pattern of
assignment of movies to reviewers in order to benefit the affiliated studio.
In addition, the approximately random assignment of movies documented in Table 5 implies
that we can reject also a second editorial biasing processes, assigning movies from affiliated
studios to reviewers which are more likely to display bias in the case of conflict of interest.
The evidence in this section provides no evidence of editorial bias, whether by dismissal
18

and hiring of different reviewers, or by differential assignment of movies to different reviewers.
Hence, the evidence points more toward a correlated journalistic bias (or correlated tastes)
rather than to editorial policies causing bias.
4.4 Selective Bias
The findings so far focused on the extent of average bias by conglomerate, by media and by
journalist, and in editorial assignments. The bias due to conflict of interest, however, could be
predictably different for different types of movies, in which case the focus on bias on average
does not maximize the chance of detection of bias. To the extent that a journalist, or an editor,
biases movie reviews, we expect the bias to be higher for movies for which the marginal return
to bias is higher, assuming a constant marginal cost.
In this Section, we provide qualitative tests of this prediction. First, we attempt to test the
prediction that the distortion due to bias should be higher for movies for which the audience
is closer to indifference, and hence the density of persuadable types is higher. While we do not
have direct evidence on which movies have the most marginal readers, we suggest that movie
quality is one useful proxy. We assume that movies with low quality (captured by negative
reviews by other outlets) would yield the least impact from a review biased on the margin,
while the impact would be highest for movies with intermediate or higher quality. To illustrate,
a review that attributes to a movie a review of 2 stars (out of 4) instead of the deserved 1 star
is unlikely to persuade many readers. Instead, a reviews which attributes 4 stars to a 3-star
movie could have a significant impact. As a proxy for the movie quality, we use the average
review score by the other media.
We present graphical evidence in Figures 3a-b. In Figure 3a we plot the score assigned by
the Newscorp.-owned media as a function of the average reviews score for the same movie
by all media, separately for movies distributed by affiliated studios (continuous line) and
movies distributed by other studios (dotted line). More precisely, we plot an estimated local
polynomial regression (with an Epanechnikov kernel and a 1st degree polynomial) of the average
review score across the Newscorp. media (excluding the media which did not review the movie)
on the average movie review score. We truncate movies with average movie score below 25
and above 90 (respectively, the 1st and 99th percentile in the distribution). Figure 3a shows
that for the movies with no conflict of interest (dotted line) the Newscorp. outlets on average
follow very closely the reviews of other outlets, with an intercept which is about 2 points
lower. Compared to this line, the reviews of 20th Century Fox (continuous darker line) are
very close for movies with average review score in the range 35-60, but are higher by about 5
points in the range above 60. Interestingly, 60 is about the crossing point for a ‘fresh’ review
in Rottentomatoes. This graph, therefore, indicates a pattern of bias which is consistent with
optimizing bias as in the framework above. The pattern is most accentuated for the New York
19

Post (Appendix Figure 2a) though there is qualitative evidence also for theWall Street Journal
(Appendix Figure 2b)
In Figure 3b we present parallel evidence for the Time Warner-owned outlets. For these
outlets, instead we find no evidence of selective bias: the average score for affiliated movies
follows very closely the score for the non-affiliated movies, a pattern which we find both in
Time magazine (Appendix Figure 2c) and in Entertainment Weekly (Appendix Figure 2d).
We also provide a regression based test in the next OLS specification in Table 7, which we
illustrate here for the Newscorp. case:
= + + 55−70
∗ 55≤70 (9)
+70+ ∗ 70 + +
The dependent variable is the review 0-100 score by a particular media, is the average
review for movie and 55≤70 and 70 are indicators for, respectively, whether the
average review falls in the range 55 ≤ 70 or in the range 70. As such, the
coefficients 55−70 and 70+ are the key coefficients which indicate how the effect of conflict
of interest changes for different types of movies. The regressions include not only movie fixed
effects and media outlet fixed effects, but also interactions between the media outlet fixed effect
and the indicators 55≤70 and 70.
The evidence in Table 7 provides statistically significant evidence for the New York Post of
a larger bias for movies with more positive reviews, as in Appendix Figure 2a, and qualitative
evidence for the Wall Street Journal. The evidence for these outlets is most consistent with
an optimizing bias. The fact that the bias appears only for certain movies is less consistent
with correlation in tastes between the reviewers and the 20th Century Fox movies, since then
we would expect to see such correlation for all movies.
We find no evidence of differential bias for the other media in the Newscorp. group, or in
the Time Warner group.
4.5 Bias by Omission
So far, we have focused on testing whether on average media outlets bias the reviews of movies
for films where the parent company would benefit from extra attendances. However, bias can
occur by omission, rather than by commission. A movie outlet may decide not to review a
below-average movie by an affiliated studio, and make sure to review an above-average movie
by the same studio. In this case, the movie may not display any bias conditional on review,
but the bias is in the review decision itself. We hence analyze the extent to which the News
Corp. outlets fail to review 20th Century Fox movies that other reviewers rate negatively,
while reviewing the movies with positive reviews, and similarly for Time Warner outlets.
Investigating this channel is particularly important because bias by omission in the me-
20

dia may well be more important than bias by commission (Mullainathan, Schwartzstein, and
Shleifer, 2008), and such bias is generally difficult to detect. The study of movie reviews of-
fers an opportunity to do such a study because we know the universe of movies which receive
at least some review in the media, and hence can measure the absence of coverage, which is
instead hard to do for most other studies of media coverage.
Full Omission. We estimate the extent to which different outlets do, or do not, review
movies, as a function of the average review that other reviewers assign, in the presence or
absence of conflict of interest. We condition on the average review by other media for the same
movie, since it is a good predictor of the likely review that a media would issue. Hence, this
allows us to test whether, in case of conflict of interest, a media outlet is more likely to review
movies with high predicted review, compared to its usual pattern.
In doing this, we take into account that media outlets differ widely in their average prob-
ability to review a movie: the New York Post, TV Guide and Entertainment Weekly review a
good share of movies, while Time Magazine reviews only a fraction. Hence, for each media in
the News Corp. or Time Warner Group, we define as matching media the ten other media in
the sample with the most similar average probability of reviewing movies.
Figures 4a-d present the graphical evidence for the four main media in the sample, the
New York Post and Wall Street Journal under Newscorp. ownership, and Time magazine and
Entertainment Weekly under Time Warner ownership. For each of these media, we plot an
estimated local polynomial regression (with an Epanechnikov kernel and a 1st degree polyno-
mial) of an indicator for whether the movie was reviewed on the average movie review score,
computed excluding the eleven media considered in the Figure. We truncate movies with
average movie score below 25 and above 90 (respectively, the 1st and 99th percentile in the
distribution). We do the regression separately for movies distributed by the affiliated studio
(continuous line) and movies distributed by other studios (dotted line). For the ten matching
media, we first compute for each movie the average probability of review in these media, and
then run a local polynomial regression of this average probability on the average movie score
separately by the two types of distributing studios, as above.
Figure 4a presents the evidence for the New York Post (darker blue line) and the average
of ten matched media (lighter blue line). For the movies not distributed by the 20th Century
Fox studios (dotted line), the probability of review increases fairly monotonically from about
40% to about 65% as a function of the average review score; importantly, the pattern is quite
similar for the New York Post and for the matching media, suggesting a successful match.
The question then is whether this pattern differs for movies distributed by 20th Century Fox
(continuous line). The Figure makes clear why it is important to include the matching media
as a comparison group: even in the matched media (continuous light blue line) the probability
of review is higher for 20th Century Fox movies compared to other movies, likely because 20th
Century Fox produces movies with a higher budget and hence on average higher audiences
21

relative to some smaller studios. Compared to this line, the probability of review by the New
York Post for 20th Century Fox movies (continuous dark blue line) is quite close, although
with some evidence of lower review probability for movies with average score below 40 and
higher review probability for movies with average score above 80; there is thus some qualitative
evidence of omission bias.
Figure 4b presents parallel evidence for the Wall Street Journal. The evidence is signifi-
cantly noisier because it only includes the years in which the Journal was under Newscorp.,
that is, from 2008 on. Still, Figure 4b displays a systematic pattern consistent with omission
bias: the probability of review for 20th Century Fox movies increases more steeply in the av-
erage movie score for the Wall Street Journal than it does for the matching media. However,
a similar, though more attenuated pattern, also appears for the non-20th Century Fox media,
suggesting that the match based on average probability in this case is not as successful
Turning to the media owned by Time Warner, Figure 4c presents the corresponding evi-
dence for Time magazine. The figure provides quite striking evidence of omission bias. The
probability of review of Warner Bros. movies is strongly increasing in the measured quality of
the movie, and this relationship is significantly more accentuated than in the matched media.
Still, a cautionary note is that the match is imperfect in that even for non-Warner Bros. movies
the probability of review by Time magazine is somewhat more responsive to the score than it
is in the sample of matching media.
Figure 4d presents the evidence for Entertainment Weekly. The average probability of
review of Warner Bros. movies in this weekly as a function of movie quality closely parallels
the corresponding average probability of review in the ten matched media (with a higher level).
As such, there is no evidence of omission bias.
To complement the graphical evidence, we estimate the following linear probability model
in Table 8, which we illustrate for the case of media owned by News Corp.:
= + +
∗ + + (10)
An observation is a possible review for a movie by one of eleven media: the media outlet
featured in the respective column and the ten media outlets in the sample with the closest
matching probability of review to the featured media. In each specification, the time period
spans the period in which the featured media exists and is owned by the conflicted conglom-
erate. The dependent variable is the indicator which equals 1 if media outlet reviews
movie The key coefficient is on the interaction of the conflict of interest variable with the
mean rating score (computed excluding the eleven media). This coefficient indicates how
the probability of a review varies with the average review score, in the presence versus absence
of a conflict of interest. The regression includes a rich set of fixed effect, movie fixed effects,
media outlet fixed effects, and media outlet fixed effects interacted with the mean rating
The inclusion of these fixed effects implies that we are controlling for other double interaction
22

terms such as ∗ (absorbed by the movie fixed effects) and ∗ (absorbed
by the media outlet fixed effects interacted with the mean rating). A key assumption made in
equation (10) is that the probability of movie review is linearly increasing in the average movie
score; we adopt this assumption given the evidence of approximate linearity in Figures 4a-d.
The evidence in Table 8 provides no consistent evidence of selective review consistent with
omission bias for the Newscorp. media. Indeed, the relevant coefficient on the interaction
between conflict of interest and average review score is significantly negative for one media (The
Times) and marginally significantly positive for two other media (TV Guide and Wall Street
Journal). For the Time Warner outlets, instead, we find evidence consistent with strategic
omission bias for two outlets — CNN.com and Time Magazine. This evidence, consistent
with the graphical evidence, therefore suggests that bias by omission is a substitute, not a
complement, of bias by commission, as we find evidence of it in the media group — Time
Warner — for which we found no evidence of bias condition on a review.
Partial Omission. To provide further evidence on the possibility of bias by omission,
we consider a more subtle biasing strategies of partial omission of information: delivering a
review later, once readers are likely to have received the information from other media and
hence a review is likely less influential, and providing shorter reviews, which likely convey less
information.
Since the information on both date of review and on the content of the review are not
available on either the Metacritic or Rottentomatoes site, we scraped the content of all the
reviews available on the websites of the four media with the most reviews in our data: Enter-
tainment Weekly (3,624 reviews starting from 1990), New York Post (1,257 reviews starting
from 2006), Time magazine (662 reviews starting from 1985), and Wall Street Journal (1,364
reviews starting from 2002). In addition, we observe two control media which were relatively
easy to scrape, the Boston Globe (896 reviews starting from 2002), and the Village Voice (3,975
reviews starting from 1998). For the subset of reviews in these media with information on date
of review, we create an indicator variable for movies reviewed 5 or more days after the release
date, as well as a continuous variable for the difference between the date of review and the
date of movie release8. We also use as an indicator of length the log of number of words in a
review (we set to missing reviews shorter than 100 words).
In Table 9, for each of the three outcome variables, we estimate specification (7) to test
whether there is an impact of conflict of interest, independent of the quality of movie. We
include both media and movie fixed effects. We find evidence of biased coverage in the Time
Warner outlets: the reviews for movies produced by Warner Bros. are less likely to be delayed
by about 7 percentage points (Column 1), are released on average 0.7 day early (Column 3),
and are one average 16 percent longer (Column 5). There is no consistent evidence instead
8For both variables, we exclude reviews published either more than 10 days before the release date, or more
than 20 days after the release date, since for these observations the date is likely to be miscoded.
23

for the Newscorp. outlets, with if anything evidence of more delay for the 20th Century Fox
movies.
We then consider how these patterns vary by the average review score of the movie (com-
puted excluding the five media), as in specification (10). We include fixed effects for movie,
media, and media interacted with the average review score. In these specifications (Columns
2, 4, and 6), we find no evidence that the intensity of coverage differs as a function of the
quality of the movie, either in the Time Warner outlets or in the Newscorp. outlets.
Altogether, there is evidence of more intensive coverage for movies at conflict of interest in
the Time Warner outlets; however, unlike for the evidence on omission of reviews, this pattern
is not responsive to the movie quality.
4.6 Bias in Movie Aggregator
So far we have focused on the most obvious conflict of interest in the movie industry induced by
the consolidation of studios like 20th Century Fox and Warner Bros. into media conglomerates
which employ movie reviewers. But the conflict of interest induced by consolidation hardly
stops there.
Both of the review aggregators which we use in this study–Metacritic and Rottentomatoes–
are themselves at risk of conflict of interest. Metacritic.com, an independent entity when
launched in 2001, was acquired by CNET in August 2005, and CNET itself was acquired in
2008 by CBS. Rottentomatoes.com, also independent when launched in 1998, was acquired by
IGN Entertainment in June 2004, and IGN itself was purchased by News Corp. in September
2005. IGN, and hence RottenTomatoes, was then sold in January of 2010 by Newscorp. In-
terestingly, in April 2011 IGN was then acquired by Time Warner, the other conglomerate in
our study.
The ownership structure of RottenTomatoes generates an incentive to post more positive re-
views of 20th Century Fox movies during the period of Newscorp. ownership (2006-2009). Since
the movie reviews are posted quickly on the Rottentomatoes site and then rarely updated9, we
use the year of release of the movie to test the hypothesis of conflict of interest. We estimate
= + 2006−09 +
+ + (11)
where is a measure of a movie review on Rotten Tomatoes for movie in media outlet
and the coefficient of interest if which captures how movies distributed by the 20th
Century Fox studio (indicated with = 1) are characterized in reviews in years 2006-
2009, compared with the years before and after. Since 20th Century Fox movies may have
a different average quality than movies produced by other studios, we control for the time-
invariant quality with coefficient Also, in most specifications we include in the control
9Consistent with this, two separate scrapes of the site at 3 month distance yielded no change in the reviews
for older movies.
24

variables year fixed effects (to control for differences in movie quality or review generosity by
year) and media fixed effects (to control for time-invariant media averages). Most importantly,
we can include among the controls the MetaCritic scoring for the same movie review.
In Table 10 we report the estimate of (11) where in Columns 1 to 7 we use as dependent
variable the 0-1 freshness indicator which is the hallmark of the Rottentomatoes site. Using
the sample of all reviews in the Rottentomatoes sample and with no controls (Column 1), the
estimates suggest that over the period of Newscorp. ownership, Rottentomatoes provides more
negative reviews of 20th Century Fox movies ( = −00684), a conclusion which does notchange after inclusion of year and media fixed effects (Column 2).
This finding, however, may be spurious and due to objectively lower quality movies pro-
duced by the Fox studio in those four years. To control for this confound, we add as control
the quantitative score of the review, as reported by Rottentomatoes, and translated into a
0-100 scale as described in Section 3.10 Hence, we examine whether Rottentomatoes is more
generous in attributing ‘fresh’ reviews to Fox movies, given the underlying coded score (say, 3
out of 5 stars). In this specification (Column 3), the effect of conflict of interest is precisely
estimated to be close to zero ( = −00073). The standard errors in this specifications aretight, allowing us to reject as an upper bound that conflict of interest increases the probability
of a fresh score by 0.7 percentage points, a small effect.
In Figure 5a, we present parallel graphical evidence using a local polynomial estimator of the
Rotten Tomatoes freshness score on the 0-100 quantitative score. We run the non-parametric
regressions separately for the 20th Century Fox movies (the continuous lines) and the other
movies (dotted lines), split by the period of Newscorp. ownership (dark blue line) and the
remaining time period (light blue line). The four lines are so close it is nearly impossible to
tell them apart on the graph, again indicating no bias.
While we detect no bias on average, it is possible that bias may have been present in
some years, for example when Newscorp. just acquired Rotten Tomatoes and awareness of the
conflict of interest was presumably even lower. We estimate an event study specification
= + +
(1− ) + +
The dependent variable is the freshness indicator and the 0-100 score is a control variable,
as in Column 3 of Table 10, but instead of separating the years into a period of ownership
(2006-09) and all else, we interact the year fixed effects with an indicator for Fox movie and
an indicator for the complement. In Figure 5b, we plot the coefficients and As the
graph shows, there is no evidence that the residual freshness score for the Fox movies ( )
diverges upwards from the series for other movies ( ) in any of the years of ownership.
Since bias may still be present in a subset of the data, we analyze separately reviews with a
10If the Rotten Tomatoes score is missing, for example for qualitative reviews, we use the score in MetaCritic
if available.
25

quantitative score (i.e. stars) and qualitative reviews for which the freshness score is attributed
by a staff reading. We find no bias in the sample of scored reviews (Column 4), but this could
be due to the fact that, as Figure 5a shows, nearly all movie reviews scored below 50 receive
a ‘rotten’ rating and nearly all movie reviews scored above 70 receive a ‘fresh’ rating. Hence,
in Column 5 we focus on the intermediate range of reviews with scores between 50 and 70,
for which Rottentomatoes does not apply a strict cut-off rule and seems to use qualitative
information such as a detailed reading of the review. Even in the sample, we detect no bias
(Column 5).
Arguably, however, bias is most likely for reviews without a quantitative score since the
probability of detection is particularly low without a quantitative benchmark. Yet, we find no
evidence of bias in this sample (Column 6). To tighten the power of the test, we reduce the
sample to qualitative reviews which are stored in both aggregators, and include as a control
the score attributed by the staff of Metacritic. Since Metacritic does not suffer from the same
conflict of interest, its score should be unbiased in this respect. In this sample (Column 7), we
again estimate no effect of the conflict of interest on bias, with more precise estimates.
We also consider the possibility that Rottentomatoes may not bias its freshness indicator,
but rather the quantitative score which we used as control variable in Columns 3-5. In Column
8 we regress the RottenTomatoes quantitative score (hence excluding unscored reviews) on the
corresponding score for the same review in MetaCritic. The estimates indicate again no bias,
and we can reject even a very small bias of 0.15 points out of 100.
Hence, the results from this part of the analysis indicate that, despite the presence of a
conflict of interest, there is no semblance of bias in Rottentomatoes, even for the types of
reviews for which detection of bias would be hard and hence bias more likely.
5 Conclusion
Consolidation in the media industry is considered by many as a condition for survival for an
industry which has been hard hit by the loss of advertising. Yet, consolidation does not come
without potential costs. In addition to the concern about the potential loss of diversity, we
consider the increased incidence of conflict of interest, and possible ensuing bias. We focus on
conflict of interest for movie reviews, such as when the Wall Street Journal reviews a movie
by 20th Century Fox. The holding company, Newscorp., would benefit financially from a more
positive review, and hence higher movie attendance, creating a conflict of interest.
Using a data set of over half a million movie reviews from 1985 to 2011, we show that while
media bias due to conflict of interest in conglomerates occurs, its extent is limited, presumably
by the value of the reputation of the media outlets and the reviewers themselves. We find that
Newscorp. media outlets provide a more positive review to 20th Century Fox movies by 2.6
points out of 100, the equivalent of one extra star every ten reviews. We find no evidence of
26

such bias among the Time Warner outlets, although among these outlets we find evidence of
bias by omission–weaker Warner Bros. movies are less likely to be reviewed. We examine the
incidence of bias by type of movie, by individual reviewer, and considered editorial choices.
Although some reviewers display higher bias than other reviewers, we find no evidence that
affiliated movies are more likely to be assigned to more generous reviewers, an editorial choice
which would have indicated more conscious bias. We also find no evidence of bias in the Rotten
Tomatoes aggregator, which was owned by Newscorp. between 2006 and 2009.
We can use the estimates of the impact of media bias on movie reviews and the model in
Section 2 to compute a back-of-the-envelope bound for the value of a reputation. To do so,
we need an assumption about the persuasiveness of positive movie reviews, (− ∗) in themodel. We take to be that an extra star (our of 4) convinces 1 percent of readers to watch a
movie. This persuasion rate is in the lower range of the estimated persuasion rates (DellaVigna
and Gentzkow, 2010) and is significantly smaller than the estimated impact of media reviews of
Reinstein and Snyder (2005), though admittedly we have no evidence. Under this assumption,
an extra star in a single movie review for a 20th Century Fox in a newspaper like the New York
Post with a circulation of about 500,000 readers would add approximately $40,000 in profits
for Newscorp., since the studio receives about half of the box office sales (at an average price
of $8 per ticket), and about another half from higher DVD and TV royalties.11
If the New York Post had biased by one star all reviews for the 481 20th Century Fox
movies released since 1993, the increased profit could have been nearly $20m. The fact that
such systematic bias did not take place indicates that the value of the New York Post reputation
is larger. We do, however, find a bias of one star every ten reviews, for an overall estimated
benefit to Newscorp. of $2m. This observed bias indicates that such extra revenue is worth
the reputational risk that this small bias be discovered.
Within the context of movie reviews we addressed questions that have arisen in the eco-
nomics of the media — such as whether bias occurs by omission or commission —about which
we previously had limited empirical knowledge. We view this contribution as a step forward in
better understanding the functioning of media outlets, which play a key role in the formation
of public opinion.
The findings in this paper relate to the general debate about the impact of conflicts of
interest. Conflicts of interest are believed to have played a major role in the recent economic
crisis, as in the case of rating agencies that had incentives to provide AAA ratings even when
the underlying security was hard to price. This particular project focuses on one form of
conflict of interest in the context of the media, the one induced by cross-holdings, which has
not previously been investigated. We believe that it is important to better understand how
media outlets navigate the trade-off between professional journalism and revenue maximization
for the owners.
11Personal communication with Bruce Nash, founder of www.the-numbers.com.
27

References
[1] Altonji J., T. Elder T, and C. Taber (2005) Selection on Observed and Unobserved
Variables: Assessing the Effectiveness of Catholic Schools. Journal of Political Economy,
113(1), 151-184.
[2] Cain, D.M., Loewenstein, G. & Moore, D.A. (2005). The dirt on coming clean: Perverse
effects of disclosing conflicts of interest. Journal of Legal Studies, 34(1), 1-25.
[3] Chipty, Tasneem. 2001. Vertical integration, market foreclosure, and consumer welfare in
the cable television industry, The American Economic Review, 91 (3), 428-453.
[4] DellaVigna S, Gentzkow G. 2010. Persuasion: Empirical Evidence. Annual Review of
Economics, 2, 643-669.
[5] DellaVigna S, Kaplan E, 2007. The Fox News effect: Media bias and voting. Quarterly
Journal of Economics, 122(3):1187—234
[6] DeMarzo P, Vayanos D, Zwiebel J. 2003. Persuasion bias, social influence, and uni-
dimensional opinions. Quarterly Journal of Economics, 118:909—68
[7] Durante Ruben, Knight Brian. Forthcoming. Partisan control, media bias, and viewer re-
sponses: evidence from Berlusconi’s Italy. Journal of the European Economic Association.
[8] Enikolopov R, Petrova M, Zhuravskaya EV, forthcoming. Media and political persuasion:
Evidence from Russia. American Economic Review.
[9] Eyster E, Rabin M. 2009. Rational and native herding. Work. Pap., Univ. Calif., Berkeley
[10] Gentzkow MA, Shapiro JM. 2006. Media bias and reputation. J. Polit. Econ. 114(2):280—
316.
[11] Gentzkow M, Shapiro J. 2010. What drives media slant? Evidence from U.S. daily news-
papers. Econometrica.
[12] George, Lisa and Joel Waldfogel. 2006. “The New York Times and the Market for Local
Newspapers” American Economic Review, Vol. 96, pp. 435-447.
[13] Gerber A, Karlan D, Bergan, D, 2009. Does the media matter? a field experiment measur-
ing the effect of newspapers on voting behavior and political opinions. American Economic
Journal: Applied Economics, 1(2):35—52
[14] Gilens M, Hertzman C. 2008. Corporate ownership and news bias: newspaper coverage of
the 1996 Telecommunications Act. J. Polit. 62(02):369—86
28

[15] Gooslbee, Austan. 2007. Vertical Integration and the Market for Broadcast and Cable
Television Programming. Working paper.
[16] Groseclose, Tim and Jeffrey Milyo. 2005. “A Measure of media bias”. Quarterly Journal
of Economics, 120, 1191-1237.
[17] Knight B., Chiang C. (forthcoming) Media bias and influence: Evidence from newspaper
endorsements. Review of Economic Studies.
[18] Larcinese V, Puglisi R, Snyder JM. 2007. Partisan bias in economic news: evidence on
the agenda-setting behavior of us newspapers. NBER Work. Pap. 13378
[19] Malmendier U, Shanthikumar DM. 2007. Are small investors naive about incentives? J.
Financ. Econ. 85(2):457—89
[20] Mullainathan S, Schwartzstein J, Shleifer A, 2008. Coarse thinking and persuasion. Quar-
terly Journal of Economics, 123(2):577—619
[21] Reinstein D, Snyder C, 2005 “The Influence of Expert Reviews on Consumer Demand
for Experience Goods: A Case Study of Movie Critics” Journal of Industrial Economics,
53(1):27-51.
[22] Ravid, S. Abraham, John Wald, and Suman Basuroy. 2006. “Distributors and film critics:
does it take two to Tango?” Journal of Cultural Economics, 30, pp. 201-218.
[23] Reuter J, Zitzewitz E, 2006. Do ads influence editors? Advertising and bias in the financial
media. The Quarterly Journal of Economics, 121(1):197—227
[24] Gabriel Rossman. 2003. The Influence of Ownership on the Valence of Media Content:
The Case of Movie Reviews. Working Paper #27, Summer 2003
[25] Stromberg, D. (2004) Radio’s impact on public spending. Quarterly Journal of Economics
119(1), 189-221.
29

30
Figure 1. Bias due to conflict of interest as a function of movie quality
Notes: Figure 1 plots the optimal bias in the model as a function of the expected updated quality of the movie. We assume a normal distribution for ε∼N(0,2/3), we set gamma=rho=1, q_0=10, pN/c equal to 1 and u equal to 10.

31
Figure 2a. Average bias in movie ratings: News Corp.-affiliated outlets
02
04
06
0
News Corp. Studio Other Studios
Mean of the FOX-affiliated publications average score by movieMean of the non-FOX-affiliated publications average score by movie
No. movies (l-to-r):406, 6976.
Mo
vie
ra
ting
Graphs by distribution
Figure 2b. Average bias in movie ratings: Time Warner-affiliated outlets
02
04
06
08
0
Time Warner Studio Other Studios
Mean of the TW-affiliated publications average score by movieMean of the non-TW-affiliated publications average score by movie
No. movies (l-to-r):602, 4307.
Mo
vie
ra
ting
Graphs by distribution
Notes: Figures 2a and 2b report the average movie review score on a 0 to 100 scale. In Figure 2a the movies are split by whether the movies are distributed by 20th Century Fox and whether the media reviewing is owned by Newscorp. In Figure 2b the split is by whether the movies are distributed by Warner Bros. and the media reviewing is owned by Time Warner.

32
Figure 3a-b. Selective bias –News Corp.-owned outlets (2a) and Time Warner-owned outlets (2b)
Notes: Figures 3a-3b report a local polynomial regression with Epanechnikov kernel and 1st degree polynomial of the review score for a particular group of media on the average movie review score by all media. We do separate regressions for the movies distributed by the affiliated studio and movies distributed by all other studios. Figure 3a focuses on all the Newscorp.-owned media, Figure 3b focuses on all the Time Warner-owned media.

33
Figure 4a-b. Selective coverage -- Probability of review by movie quality (rating): News Corp. outlets: New York Post (4a) and Wall Street Journal (4b)
Notes: Figures 4a and 4b report a local polynomial regression with Epanechnikov kernel and 1st degree polynomial of an indicator for whether the movie was reviewed on the average movie review score. Figure 4a focuses on the probability of review (and hence possible omission bias) for New York Post, Figure 4b for the Wall Street Journal. In both cases, the sample includes the media itself (the dark blue line) and the average of 10 matching media with the closest average review probability (the light blue line).

34
Figure 4c-d. Selective coverage -- Probability of review by movie quality (rating): Time Warner outlets: Time Magazine (4c) and Entertainment Weekly (4d)
Notes: Figures 4c and 4d report a local polynomial regression with Epanechnikov kernel and 1st degree polynomial of an indicator for whether the movie was reviewed on the average movie review score. Figure 4c focuses on the probability of review (and hence possible omission bias) for Time Magazine, Figure 4d for Entertainment Weekly. In both cases, the sample includes the media itself (the dark blue line) and the average of 10 matching media with the closest average review probability (the light blue line).

35
Figures 5a-5b. Conflict of Interest in Rotten Tomatoes (Newscorp 2006-09)
Notes: Figure 5a reports a local polynomial regression with Epanechnikov kernel with bandwidth 5 and a 1st degree polynomial of an indicator for freshness rating of a movie in Rotten Tomatoes on the corresponding movie review score. The sample includes the period in which Rotten Tomatoes is owned by Newscorp. (2006-09, dark blue) and the remaining period (light blue), and plots separate regressions for 20th Century Fox movies (continuous line) and other movies (dotted line). Figure 5b reports the estimated coefficients from an event study regression of the freshness score in Rotten Tomatoes on the quantitative score and year fixed effects interacted with an indicator for a 20th Century Fox movie (coefficient plotted in continuous line) and year fixed effects interacted with an indicator for all other movies (coefficient plotter in dotted line).

36
Media OutletMedia Type Years Owner
No. of Reviews While
Owned
No. of Reviews
While Not Owned
Usual Rating System
Data Source (Rotten Tomato - RT, MetaCritic -
MC, or Both)
Score in MC - Mean (s.d.)
Score in RT -
Mean (s.d.)
Share 'fresh' in RT Most common reviewers
All Reviews 336 media
1985-2011 17039 531725 Varies MC (54354), RT (416862), Both
61.13 (21.52)
61.65 (21.57)
0.59
Chicago Sun-Times Newsp. 1985-2011 News Corp. until 1986
186 5833 0 to 4 stars (1/2 allowed)
MC (653), RT (2531), Both (2835)
71.20 (20.41)
68.75 (21.14)
0.62 Roger Ebert (5638)
New York Post Newsp. 1998-2011 News Corp. from 1993
6278 - 0 to 4 stars (1/2 allowed)
MC (1472), RT (1200), Both (3606)
56.35 (22.48)
56.09 (22.74)
0.48 Lou Lumenick (2236), V.A. Musetto (1618), Kyle Smith
(1154)News Of The World Newsp.
(UK)2008-2011 News Corp. 407 - 0 to 5 stars RT 58.08
(24.41)0.57 Robbie Collin (407)
TV Guide Weekly 1985-2009 New Corp. 1988-99
980 4876 0 to 4 stars (1/2 allowed)
MC (1928), RT (900), Both (3028)
59.48 (17.20)
60.24 (17.18)
0.59 Maitland McDonagh (2588), Ken Fox (2072)
Times Newsp. (UK)
2003-2011 News Corp. 960 - 0 to 5 stars RT - 53.60 (20.64)
0.55 Wendy Ide (377), James Christopher (286)
Wall Street Journal Newsp. 1985-2011 News Corp. from 2008
555 1218 Qualitative MC (1124), RT (81), Both (568)
58.56 (26.28)
- 0.56 Joe Morgenstern (1510)
CNN.com Website 1997-2007 Time Warner 528 - Qualitative RT - - 0.55 Paul Clinton (325)
Entertainment Weekly Weekly 1990-2011 Time Warner from 1990
4889 - A to F (+/- allowed)
MC (1340), RT (615), Both (2934)
65.15 (23.04)
65.16 (22.99)
0.59 Owen Gleiberman (2307), Lisa Schwarzbaum (1946)
Time Weekly 1985-2010 Time Warner from 1990
1375 97 Qualitative MC (773), RT (240), Both (459)
66.57 (22.83)
- 0.71 Richard Corliss (775), Richard Schickel (542)
Other Reviews 326 media
1985-2011 - 519701 Varies MC (47064), RT (408519), Both
60.93 (21.40)
61.63 (21.55)
0.59
SUMMARY STATISTICS: MEDIA SOURCES OF MOVIE REVIEWSTABLE 1, PANEL A
Notes: The sources of the movie review data are www.metacritic.com (abbreviated MC) and www.rottentomatoes.com (abbreviated RT). The data covers all reviews available from 1985 until July 2011. See text for additional information.

37
Distributor of Movie (Studio) Studio Type Years Owner
No. of Reviews
No. of Movies
Data Source (Rotten Tomato - RT,
MetaCritic - MC, or Both)
Score in MC - Mean (s.d.)
Score in RT -
Mean (s.d.)
Share 'fresh' in
RTAll Studios 1985-2011 548764 12999 MC (54354), RT
(416862), Both (77548)61.13
(21.52)61.65
(21.57)0.59
20th Century Fox Major 1985-2011 News Corp. 32159 449 MC (2580), RT (25455, Both (4124)
54.40 (21.57)
56.33 (21.79)
0.48
Fox Searchlight Independent 1995-2011 News Corp. 12547 126 MC (990), RT (9433), Both (2124)
66.91 (19.41)
67.40 (20.07)
0.68
Fox (Other) Other 1987-2010 News Corp. 390 13 MC (70), RT (307), Both (13)
54.55 (28.55)
66.40 (20.18)
0.71
Warner Bros. Major 1989-2011 Time Warner from 1989
44162 575 MC (3428), RT (34511), Both (6223)
55.84 (22.27)
58.04 (22.05)
0.50
Fine Line Independent 1990-2005 Time Warner from 1989
3764 80 MC (526), RT (2751), Both (487)
68.96 (21.37)
68.80 (22.00)
0.71
HBO Other 1989-2010 Time Warner from 1989
605 64 MC (23), RT (532), Both (50)
74.60 (18.29)
66.65 (20.83)
0.78
New Line Independent 1989-2008 Time Warner from 1996
16667 233 MC (1310), RT (2014), Both (2198)
55.49 (23.12)
57.94 (22.55)
0.50
Picturehouse Independent 2005-2009 Time Warner from 1989
2590 34 MC (195), RT (2014), Both (381)
65.10 (19.02)
66.54 (20.14)
0.66
Warner Independent Independent 2004-2008 Time Warner 2733 26 MC (177), RT (2105), Both (451)
65.95 (18.90)
66.53 (19.21)
0.63
Warner Home Video Other 1989-2009 Time Warner from 1989
783 59 MC (30), RT (739), Both (14)
52.61 (22.60)
58.93 (24.02)
0.57
Other Studios 1985-2011 432364 11423 MC (45025), RT (325856), Both (61483)
61.92 (21.27)
62.29 (21.38)
0.60
TABLE 1, PANEL BSUMMARY STATISTICS: STUDIOS
Notes: The sources of the movie review data are www.metacritic.com (abbreviated MC) and www.rottentomatoes.com (abbreviated RT). The data covers all reviews available from 1985 until July 2011. See text for additional information.

38
Specification:
Dep. Var.:(1) (2) (3) (4) (5) (6)
1.0285 1.0886 2.0749** 2.5651*** 2.7175*** 2.3197**(Measure of Conflict of Interest for News Corp.) [0.9381] [0.9371] [0.8133] [0.7966] [0.9045] [0.9246]
-1.2510 -1.2101 -1.0430 -0.4998 -0.1152 -0.0585(Measure of Conflict of Interest Time Warner) [0.7937] [0.7925] [0.6832] [0.6829] [0.7224] [0.8076]
-2.9916*** -3.0534***[0.7443] [0.7418]
-3.2318*** -3.2496***[0.6252] [0.6246]
-4.9151*** -4.8264*** -4.4181*** -1.7450*** -2.1882*** -1.7968**[0.2299] [0.2186] [0.1939] [0.4612] [0.5112] [0.7140]
4.2613*** 4.4035*** 3.7427*** 4.4895* 3.7029 3.5507[0.2763] [0.2724] [0.2428] [2.6362] [2.5121] [4.6752]
Year Fixed Effects X X X X XMovie Fixed Effects X X X XMedia Outlet Fixed Effects X X X
MetaCritic Only
RottenTomatoes Only
61.52 61.52 61.52 61.52 61.13 61.52
p = 0.0658* p = 0.0633* p = 0.0035*** p = 0.0037*** p = 0.0153** p = 0.0541*
0 0.01 0.41 0.46 0.52 0.45
N=474,496 N=474,496 N=474,496 N=474,496 N=132,731 N=419,402
R2
N
Notes: An observation is a movie review by a media outlet from 1985 to July 2011. The dependent variable is a movie review converted on the 0-100 scale devised by metacritic.com . The standard errors in parentheses are clusteredby movie.* significant at 10%; ** significant at 5%; *** significant at 1%
Indicator for Warner Brothers Movie
Indicator for Media Outlet Owned by Time Warner
Indicator for Media Outlet Owned by News Corp.
Sample: Metacritic Sample + RottenTomatoes Sample
p-value of test of equality of effect of conflict of interest for News Corp. and for Time Warner:
Mean of Dependent Variable
TABLE 2THE EFFECT OF CONFLICT OF INTEREST ON MOVIE REVIEWS: AVERAGE BIAS (0-100 SCORE)
OLS Regressions
Movie Review on a 0-100 Scale for Movie m in Media Outlet o
Indicator for Fox Movie on News Corp.-Owned Outlet
Indicator for 20th Century Fox Movie
Indicator for Warner Bros. Movie on TW-Owned Outlet
Control Variables:
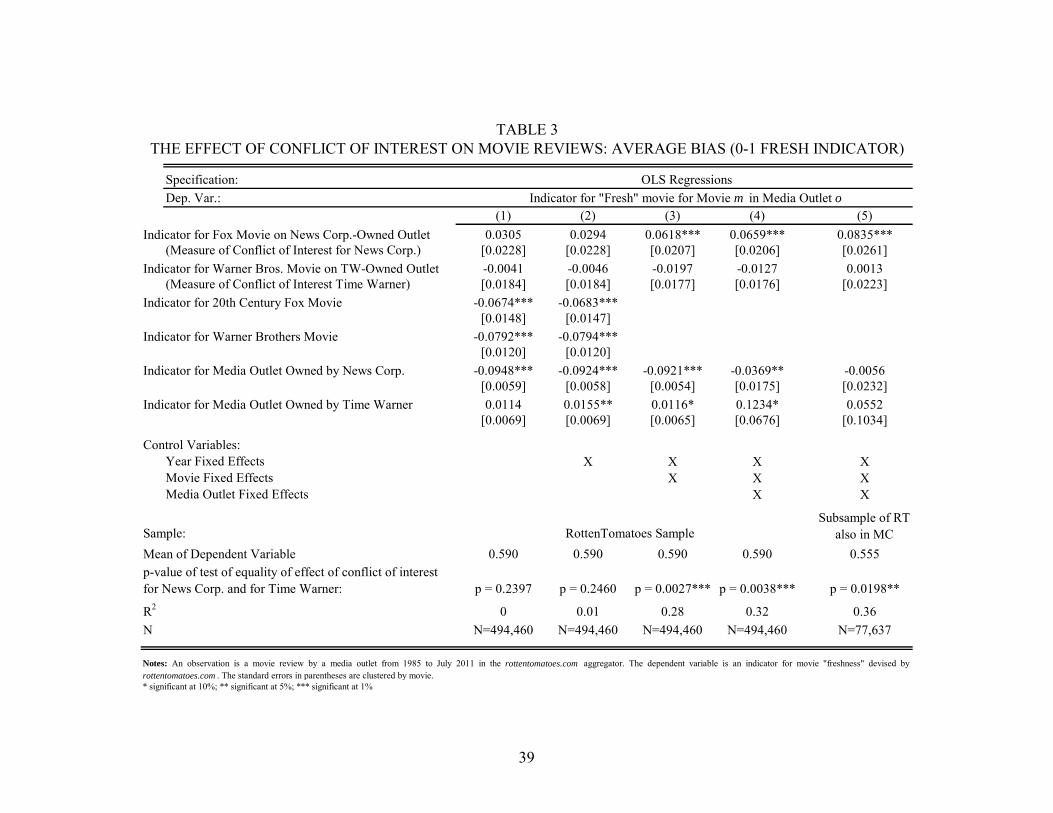
39
Specification:
Dep. Var.:(1) (2) (3) (4) (5)
0.0305 0.0294 0.0618*** 0.0659*** 0.0835***(Measure of Conflict of Interest for News Corp.) [0.0228] [0.0228] [0.0207] [0.0206] [0.0261]
-0.0041 -0.0046 -0.0197 -0.0127 0.0013(Measure of Conflict of Interest Time Warner) [0.0184] [0.0184] [0.0177] [0.0176] [0.0223]
-0.0674*** -0.0683***[0.0148] [0.0147]
-0.0792*** -0.0794***[0.0120] [0.0120]
-0.0948*** -0.0924*** -0.0921*** -0.0369** -0.0056[0.0059] [0.0058] [0.0054] [0.0175] [0.0232]
0.0114 0.0155** 0.0116* 0.1234* 0.0552[0.0069] [0.0069] [0.0065] [0.0676] [0.1034]
Year Fixed Effects X X X XMovie Fixed Effects X X XMedia Outlet Fixed Effects X X
Subsample of RT also in MC
0.590 0.590 0.590 0.590 0.555
p = 0.2397 p = 0.2460 p = 0.0027*** p = 0.0038*** p = 0.0198**
0 0.01 0.28 0.32 0.36
N=494,460 N=494,460 N=494,460 N=494,460 N=77,637
TABLE 3THE EFFECT OF CONFLICT OF INTEREST ON MOVIE REVIEWS: AVERAGE BIAS (0-1 FRESH INDICATOR)
OLS Regressions
Indicator for "Fresh" movie for Movie m in Media Outlet o
Indicator for Fox Movie on News Corp.-Owned Outlet
Indicator for Warner Bros. Movie on TW-Owned Outlet
Indicator for 20th Century Fox Movie
Indicator for Warner Brothers Movie
Indicator for Media Outlet Owned by News Corp.
Indicator for Media Outlet Owned by Time Warner
Control Variables:
Sample:
R2
N
Notes: An observation is a movie review by a media outlet from 1985 to July 2011 in the rottentomatoes.com aggregator. The dependent variable is an indicator for movie "freshness" devised byrottentomatoes.com . The standard errors in parentheses are clustered by movie.* significant at 10%; ** significant at 5%; *** significant at 1%
RottenTomatoes Sample
p-value of test of equality of effect of conflict of interest for News Corp. and for Time Warner:
Mean of Dependent Variable

40
Specification:
Chicago SunTimes
New York Post
News of the World TV Guide Times (UK)
Wall Street Journal CNN.com
Entertainment Weekly Time
(1) (2) (3) (4) (5) (6) (7) (8) (9)
Panel A.Dep Var.: Score (0-100)
2.3530 3.1382*** 3.8096 2.4169 0.0286 0.5175 . -0.3039 -0.9717
[4.8051] [0.9877] [3.2221] [1.6519] [2.2918] [3.1342] . [0.7363] [1.3957]
0.49 0.45 0.48 0.43 0.46 0.46 . 0.46 0.41
N=3,314 N=362,309 N=36,787 N=46,740 N=73,318 N=47,888 . N=362,266 N=127,688Panel B.Dep Var.: Indicator for Fresh in Rottentomatoes
-0.0166 0.0718*** 0.0130 0.0672 0.0598 0.1120* -0.0541 -0.0027 -0.0079[0.1261] [0.0258] [0.0769] [0.0913] [0.0593] [0.0615] [0.0436] [0.0208] [0.0457]
0.38 0.30 0.31 0.32 0.30 0.29 0.29 0.31 0.27
N=3,435 N=381,533 N=40,551 N=42,286 N=82,516 N=50,265 N=73,883 N=379,758 N=133,835
Movie Fixed Effects X X X X X X X X XMedia Outlet Fixed Effects X X X X X X X X X
R2
N
OLS Regressions
News Corp. Conflict of Interest
Control Variables:
* significant at 10%; ** significant at 5%; *** significant at 1%
Indicator for Conflict of Interest
N
Notes: An observation is a movie review by a media outlet from 1985 to July 2011. Each column is a separate regression including as observations only movies with at least one review by the featured outlet, and as independent variablesindicator variables for the outlet and for production by the conflicted distributing company (20th Century Fox and Warner Bros.). The dependent variable in Panel A is a 0-100 score for the review, whille the dependent variable in Panel Bis an indicator variable for "freshness" from the rottentomatoes data. All specifications include fixed effects for the movie and for the media reviewing.The standard errors in parentheses are clustered by movie.
TABLE 4THE EFFECT OF CONFLICT OF INTEREST ON MOVIE REVIEWS: BY MEDIA
Indicator for Conflict of Interest
R2
Time Warner Conflict of Interest

41
Media Outlet Media TypeYears In
Data
Years In Data and Owned Reviewer Name and Years
No. of Reviews
while Owned
Fixed Effect for Average Score (s.e.)
Share reviews of affiliated
studio
Panel A. News Corp. OutletsChicago Sun-Times Newsp. 1985-2011 1985-1986 Roger Ebert ('85-'11) 184 10.23 (.46) 8.70%
New York Post Newsp. 1998-2011 1998-2011 Lou Lumenick ('98-'11) 2236 -2.19 (.56) 6.98%
New York Post Newsp. 1998-2011 1998-2011 V.A. Musetto ('98-'11) 1618 -1.34 (.57) 0.25%
New York Post Newsp. 1998-2011 1998-2011 Kyle Smith ('05-'11) 1154 -7.38 (.78) 6.67%
New York Post Newsp. 1998-2011 1998-2011 Jonathan Foreman ('98-'04) 622 -0.74(.80) 6.91%
New York Post Newsp. 1998-2011 1998-2011 Megan Lehmann ('02-'04) 366 -3.81 (.98) 7.10%
News of the World Newsp. (UK) 2008-2011 2008-2011 Robbie Collin ('08-'11) 407 -0.62 (1.17) 9.09%
TV Guide Weekly 1985-2011 1988-1999 Maitland McDonagh ('97-'08) 370 -0.60 (.48) 9.19%
TV Guide Weekly 1985-2011 1988-1999 Ken Fox ('97-'08) 134 4.29 (.50) 9.70%
Times Newsp. (UK) 2003-2011 2003-2011 Wendy Ide ('03-'10) 377 -7.82 (.96) 5.31%
Times Newsp. (UK) 2003-2011 2003-2011 James Christopher ('03-'10) 286 -4.59 (1.28) 9.09%
Wall Street Journal Newsp. 1985-2011 2008-2011 Joe Morgenstern ('01-'11) 496 -3.64 (.66) 8.67%
Panel B. Time Warner OutletsCNN.com Website 1997-2007 1997-2007 Paul Clinton ('98-'05) 325 . 22.46%
Entertainment Weekly Weekly 1990-2011 1990-2011 Owen Gleiberman ('90-'11) 2307 6.49 (.58) 12.83%
Entertainment Weekly Weekly 1990-2011 1990-2011 Lisa Schwarzbaum ('94-'11) 1946 8.41 (.53) 11.97%
Time Weekly 1985-2010 1990-2010 Richard Corliss ('85-'11) 724 3.53 (.88) 16.71%
Time Weekly 1985-2010 1990-2010 Richard Schickel ('85-'08) 502 2.50 (1.11) 16.73%
TABLE 5REVIEWERS FOR MEDIA AT RISK OF CONFLICT OF INTEREST
Notes: The sources of the movie review data are www.metacritic.com (abbreviated MC) and www.rottentomatoes.com (abbreviated RT). The data covers all reviews available from 1985 until July 2011. See text for additional information.

42
Specification:
Lou Loumenick Kyle Smith
Jonathan Foreman
Megan Lehmann
Maitland McDonagh Ken Fox
Owen Gleiberman
Lisa Schwarzbau
Richard Corliss
Richard Schickel
(1) (2) (3) (4) (5) (6) (7) (8) (9) (10)
Panel A.Dep Var.: Score (0-100)
3.0068** 6.0914*** -0.2606 5.4902* 6.0412*** -4.2065 -0.3830 -0.4791 0.9784 -4.6170**
[1.3149] [2.3501] [2.8959] [3.1414] [2.1031] [5.0740] [1.1448] [1.0141] [1.8489] [2.3329]
0.46 0.45 0.46 0.44 0.43 0.47 0.44 0.45 0.42 0.38
N=165,133 N=82,384 N=42,165 N=25,553 N=20,826 N=5,708 N=172,627 N=152,808 N=71,569 N=43,975Panel B.Dep Var.: Indicator for Fresh in Rottentomatoes
0.0614* 0.1537*** 0.0368 0.1479* 0.2377** 0.0105 -0.0097 0.0059 0.0511 -0.0182[0.0348] [0.0558] [0.0769] [0.0837] [0.0918] [0.1812] [0.0309] [0.0298] [0.0639] [0.0719]
0.30 0.31 0.31 0.31 0.32 0.35 0.30 0.30 0.28 0.26
N=175,793 N=87,197 N=45,559 N=25,634 N=20,214 N=5,326 N=180,977 N=162,379 N=75,084 N=46,505
Movie Fixed Effects X X X X X X X X X XMedia Outlet Fixed Effects X X X X X X X X X X
Notes: An observation is a movie review by a media outlet from 1985 to July 2011. Each column is a separate regression including as observations only movies with at least one review by the featured reviewer, and as independent variables indicator variables for theoutlet and for production by the conflicted distributing company (20th Century Fox and Warner Bros.). The dependent variable in Panel A is a 0-100 score for the review, whille the dependent variable in Panel B is an indicator variable for "freshness" from therottentomatoes data. All specifications include fixed effects for the movie and for the media reviewing.The standard errors in parentheses are clustered by movie.
* significant at 10%; ** significant at 5%; *** significant at 1%
Entertainment Weekly TimeNew York Post TV Guide
R2
N
Indicator for Conflict of Interest
R2
NControl Variables:
TABLE 6THE EFFECT OF CONFLICT OF INTEREST ON MOVIE REVIEWS: BY REVIEWER
OLS Regressions
News Corp. Conflict of Interest Time Warner Conflict of Interest
Indicator for Conflict of Interest

43
Specification:Dependent Variable:
Chicago SunTimes
New York Post
News of the World TV Guide Times (UK)
Wall Street Journal CNN.com
Entertainment Weekly Time
(1) (2) (3) (4) (5) (6) (7) (8) (9)
-1.8511 1.6053 9.3846** 2.7745 3.0971 -0.4418 . 0.0172 -1.3100[8.1669] [1.5719] [4.5067] [3.1145] [3.1936] [4.6435] [1.2686] [3.4622]
6.6737 1.2414 -15.0553** -3.4936 -5.8530 6.0759 . -0.1049 0.9607(55<Average Movie Rating<=70) [8.9600] [2.2644] [6.9450] [3.9723] [5.8224] [6.6080] [1.7136] [4.0386]
-5.5183 5.6198*** 5.5208 -0.1861 -6.4469 2.1793 . 1.2430 1.6107(Average Movie Rating>70) [8.7293] [2.1265] [6.1254] [3.9991] [5.0638] [6.2369] [1.7644] [3.9919]
0.58 0.48 0.51 0.47 0.49 0.48 . 0.48 0.43
N=3,314 N=362,272 N=36,772 N=46,740 N=73,308 N=47,880 . N=362,230 N=127,682
Movie Fixed Effects X X X X X X X X XMedia Outlet Fixed Effects X X X X X X X X XMedia Outlet f.e. *(55<Average Movie Rating<=70)
X X X X X X X X X
Media Outlet f.e. *(Average Movie Rating>70)
X X X X X X X X X
TABLE 7THE EFFECT OF CONFLICT OF INTEREST ON MOVIE REVIEWS: SELECTIVE BIAS
OLS RegressionsMovie review score (0-100)
News Corp. Conflict of Interest Time Warner Conflict of Interest
Notes: An observation is a movie review by a media outlet from 1985 to July 2011. Each column is a separate regression including as observations only movies with at least one review by the featured outlet during the period in which theoutlet is owned by Newscorp. or Time Warner. The average score is computed as the average 0-100 score for a movie from all media outlets. The dependent variable is a 0-100 score for the review. The standard errors in parentheses areclustered by movie.* significant at 10%; ** significant at 5%; *** significant at 1%
Indicator for Conflict of Interest *
Indicator for Conflict of Interest *
Indicator for Conflict of Interest
R2
NControl Variables:

44
Specification:Dependent Variable:
Chicago SunTimes
New York Post
News of the World TV Guide Times (UK)
Wall Street Journal CNN.com
Entertainment Weekly Time
(1) (2) (3) (4) (5) (6) (7) (8) (9)
-0.0189* 0.0011 -0.0008 0.0039* -0.0035** 0.0051* 0.0024** 0.0004 0.0034***Average Movie Rating [0.0103] [0.0012] [0.0027] [0.0022] [0.0016] [0.0027] [0.0010] [0.0007] [0.0009]
1.0969* -0.1214 -0.0142 -0.1896 0.1329 -0.3019** -0.0903 0.0939** -0.1493***[0.5838] [0.0750] [0.1546] [0.1212] [0.0936] [0.1439] [0.0605] [0.0388] [0.0483]
0.31 0.52 0.44 0.44 0.32 0.48 0.23 0.48 0.34
N=3,278 N=109,747 N=28,974 N=37,048 N=76,978 N=28,974 N=85,316 N=133,331 N=133,342
Movie Fixed Effects X X X X X X X X XMedia Outlet Fixed Effects X X X X X X X X XMedia Outlet Fixed Effects*Average Movie Rating
X X X X X X X X X
TABLE 8CONFLICT OF INTEREST AND OMISSION BIAS: PROBABILITY OF REVIEW
OLS Regressions
News Corp. Conflict of Interest Time Warner Conflict of Interest
Indicator for Conflict of Interest
Notes: Each column is a separate regression including as observations potential movie reviews by the featured media outlet, or by any of 10 matched media, with match based on similar average probability of review. The sample onlyincludes years in which the media featured in the relevant column is owned by Newscorp. or Time Warner. The average score is computed as the average 0-100 score for a movie from all media outlets excluding the featured media and the10 matched media. All specifications include fixed effects for the movie, for the media reviewing, and an interaction of the average score and the reviewer fixed effect .The standard errors in parentheses are clustered by movie.
* significant at 10%; ** significant at 5%; *** significant at 1%
Indicator variable for review of a movie by media m
Indicator for Conflict of Interest *
Sample: Potential review in featured media and in each of 10 matched media, with match based on similar average probability of review
R2
NControl Variables:

45
Specification:
Dep. Var.:(1) (2) (3) (4) (5) (6)
0.0722** -0.1190 0.9039*** -1.3530 0.0063 0.2134[0.0303] [0.1808] [0.3377] [1.7651] [0.0634] [0.3145]
0.0029 0.0340 -0.0030Average Movie Rating [0.0027] [0.0270] [0.0047]
-0.0722*** -0.0098 -0.7497** -0.5489 0.1589*** 0.0115[0.0246] [0.1485] [0.3773] [2.4431] [0.0503] [0.2576]
-0.0010 -0.0025 0.0020Average Movie Rating [0.0024] [0.0418] [0.0039]
Movie Fixed Effects X X X X X XMedia Outlet Fixed Effects X X X X X XMedia Outlet Fixed Effects * Average Movie Rating X X X
0.185 0.185 0.185 0.185 5.976 5.976
0.63 0.65 0.73 0.74 0.7 0.71
N=10,875 N=10,875 N=10,875 N=10,875 N=11,219 N=11,219
Control Variables:
Sample:
TABLE 9PARTIAL OMISSION BIAS: DELAYED REVIEWS AND REVIEW LENGTH
OLS Regressions
Conflict of Interest for News Corp.
Conflict of Interest for News Corp. *
Difference between date of review and of release
* significant at 10%; ** significant at 5%; *** significant at 1%
Indicator for delayed review Log (Word length in review)
Boston Globe, Entertainment Weekly, New York Post, Time, Village Voice, and Wall Street Journal
Mean of Dependent Variable
R2
N
Notes: An observation is a movie review by the Boston Globe, Entertainment Weekly, New York Post, Time magazine,Village Voice, and Wall Street Journal. The dependent variable in Columns 1 and 2 is anindicator variable for a review taking place at least 5 days after the movie release date. The dependent variable in Columns 3 and 4 is the difference between the date of the review and the date of the release of amovie. The dependent variable in Columns 5 and 6 is the log of the word count. The average review score for a movie is computed excluding the media in the sample. The standard errors in parentheses are clusteredby movie.
Conflict of Interest for Time Warner
Conflict of Interest for Time Warner *

46
Specification:
Dep. Var.:RottenTomatoes
0-100 Score
(1) (2) (3) (4) (5) (6) (7) (8)
-0.0684** -0.0637* -0.0073 -0.0075 0.0002 -0.0557 -0.0049 -0.1609(RottenTomatoes owned by Newscorp.: 2006-09) [0.0328] [0.0330] [0.0069] [0.0069] [0.0084] [0.0349] [0.0188] [0.1471]
-0.0329** -0.0366** -0.0082** -0.0070* -0.0060 -0.0470** -0.0255** -0.1698*[0.0164] [0.0161] [0.0037] [0.0038] [0.0049] [0.0185] [0.0111] [0.0948]
0.0182*** 0.0183*** 0.0394***[0.0001] [0.0001] [0.0002]
0.0174*** 0.9597***[0.0001] [0.0012]
Year Fixed Effects X X X X X X XMedia Outlet Fixed Effects X X X X X X X
Only Reviews Scored in RT
Only Reviews with 50<=Score<=70
Reviews Scored in RT and MC
0 0.04 0.64 0.65 0.57 0.05 0.56 0.94
N=494,410 N=419,375 N=419,375 N=394,908 N=152,343 N=97,375 N=24,467 N=53,108
* significant at 10%; ** significant at 5%; *** significant at 1%
All Reviews
0-100 MetaCritic Review Score
Only Reviews Unscored in RTSample:
R2
N
Notes: An observation is a movie review. The dependent variable in Columns 1 to 7 is an indicator variable for 'freshness' of a movie according to review in RottenTomatoes, while the dependent variable in Column 8 is the underlying quantitative rating of areview in RottenTomatoes converted into a 0-100 score according to the MetaCritic procedure. The key indepedendent variables are indicators for movies distributed by 20th Century Fox and an interaction of this indicator with the years in whichRottentomatoes is owned by Newscorp. (2006-09). The standard errors in parentheses are clustered by movie.
Indicator for 20th Century Fox Movie *
0-100 Review Score
Control Variables:
TABLE 10BIAS IN ROTTEN TOMATO: EFFECT OF NEWSCORP. OWNERSHIP
OLS Regressions
RottenTomatoes 0-1 "Freshness" indicator
Indicator for 20th Century Fox Movie

47
Appendix Figure 1. Average bias in movie ratings: Wall Street Journal pre- and post-2008 (year of acquisition by News Corp.)
02
04
06
08
00
20
40
60
80
Owned by Newscorp, News Corp. Studio Owned by Newscorp, Other Studios
Not Owned, News Corp. Studio Not Owned, Other Studios
Wall Street Journal average scoreMean of non-FOX-affiliated publications average score by movie
No. movies (l-to-r and top-to-bottom):45, 484, 110, 1062.
Mo
vie
ra
ting
Graphs by own_dummy and distribution

48
Appendix Figure 2a-b. Selective bias –News Corp.-owned outlets: New York Post (2a) and Wall Street Journal (2b)
Notes: Appendix Figures 2a-2b report a local polynomial regression with Epanechnikov kernel and 1st degree polynomial of the review score for a particular group of media on the average movie review score by all media. We do separate regressions for the movies distributed by the affiliated studio and movies distributed by all other studios. Figure 2a focuses on the New York Post, Figure 2b on the Wall Street Journal.

49
Appendix Figure 2c-2d. Selective bias –Time Warner -owned outlets: Time (2c) and Entertainment Weekly (2d)
Notes: Appendix Figures 2c-2d report a local polynomial regression with Epanechnikov kernel and 1st degree polynomial of the review score for a particular group of media on the average movie review score by all media. We do separate regressions for the movies distributed by the affiliated studio and movies distributed by all other studios. Figure 2c focuses on on Time, Figure 2d on Entertainment Weekly.

50
Specification:
Dep. Var.:(1) (2) (3) (4) (5) (6)
Panel A. Dep Var.: Score (0-100)
2.5651*** 2.5651*** 2.5651*** 1.8353** 2.8436*** -1.2320(Measure of Conflict of Interest for News Corp.) [0.7966] [0.2535] [0.4780] [0.8178] [0.9586] [3.1867]
-0.4998 -0.4998 -0.4998** -0.4379 -0.4857 4.6602*(Measure of Conflict of Interest Time Warner) [0.6829] [0.3680] [0.2052] [0.7122] [0.8812] [2.7006]
0.46 0.46 0.46 0.46 0.45 0.6
N=474,496 N=474,496 N=474,496 N=297,607 N=394,930 N=24,472
Panel B. Dep Var.: Freshness Indicator (0-1)
0.0659*** 0.0659*** 0.0659*** 0.0517** 0.0632*** 0.0598(Measure of Conflict of Interest for News Corp.) [0.0206] [0.0087] [0.0079] [0.0212] [0.0230] [0.0522]
-0.0127 -0.0127 -0.0127 -0.0196 -0.0074 -0.0290(Measure of Conflict of Interest Time Warner) [0.0176] [0.0120] [0.0094] [0.0184] [0.0207] [0.0337]
0.32 0.32 0.32 0.31 0.33 0.35
N=494460 N=494460 N=494460 N=314,071 N=397,057 N=97,403
Indicators for ownership of media by FOX and TW X X X X X XMovie Fixed Effects X X X X X XMedia Outlet Fixed Effects X X X X X X
BenchmarkCluster by
StudioCluster by
MediaOnly major-6 studios and
major indie studiosNumeric
reviews onlyQualitative
reviews only
APPENDIX TABLE 1THE EFFECT OF CONFLICT OF INTEREST ON MOVIE REVIEWS: ROBUSTNESS
OLS Regressions
Movie Review on a 0-100 Scale for Movie m in Media Outlet o
Indicator for Fox Movie on News Corp.-Owned Outlet
Indicator for Warner Bros. Movie on TW-Owned Outlet
* significant at 10%; ** significant at 5%; *** significant at 1%
R2
N
N
Notes: An observation is a movie review by a media outlet from 1985 to July 2011. The dependent variable is a movie review converted on the 0-100 scale devised by metacritic.com . The standard errors in parentheses are clustered by movie.
Indicator for Fox Movie on News Corp.-Owned Outlet
Indicator for Warner Bros. Movie on TW-Owned Outlet
R2
Control Variables:
Robustness Check:

51
Specification:Dependent Variable:
New York Post TV Guide Times (UK)
Entertainment Weekly Time
(1) (2) (3) (4) (5)-0.5914*** 0.3535 0.4271 -0.3039 -0.9717
[0.1381] [0.3915] [0.3288] [0.7363] [1.3957]
0.75 0.69 0.82 0.46 0.41
N=388,382 N=47,593 N=77,481 N=386,348 N=136,823
Movie Fixed Effects X X X X XMedia Outlet Fixed Effects X X X X X
APPENDIX TABLE 2TEST OF EDITORIAL ASSIGNMENT TO REVIEWER WITH HIGHEST SCORE
Newscorp. Conflict Time Warner Conflict
Indicator for Conflict of Interest
Notes: An observation is a movie review by a media outlet from 1985 to July 2011. Each column is a separate regression including as observations onlymovies with at least one review by the featured outlet, and as independent variables indicator variables for the outlet and for production by the conflicteddistributing company (20th Century Fox and Warner Bros.). The dependent variable is the estimated fixed effect for the chosen reviewer. As such, thespecification tests whether for movies with conflict of interest, reviewers who tend to give on average more positive socres are more likely to be chosen. Allspecifications include fixed effects for the movie and for the media reviewing.The standard errors in parentheses are clustered by movie.
* significant at 10%; ** significant at 5%; *** significant at 1%
R2
NControl Variables: