does investment skill decline due to cognitive aging …jgsfss/lonestar/kumar.pdf · does...
TRANSCRIPT

Does Investment Skill Decline due to Cognitive Aging or
Improve with Experience?∗
George Korniotis
Board of Governors of the Federal Reserve System
Alok Kumar
University of Texas at Austin
McCombs School of Business
July 20, 2007
∗Please address all correspondence to Alok Kumar, McCombs School of Business, University of
Texas at Austin, 1 University Station, B6600, Austin, TX 78712; Phone: 512-232-6824; email:
[email protected]. George Korniotis is at the Board of Governors of the Federal Reserve Sys-
tem; Phone: 202-452-2581; email: [email protected]. We would like to thank Warren Bailey,
Robert Battalio, Jeff Bergstrand, Sudheer Chava, George Constantinides, Shane Corwin, Tom Cosimano,
Alex Edmans, Joe Egan, Xavier Gabaix, John Griffin, David Hirshleifer, Roger Huang, Mark Hulbert, Zo-
ran Ivkovich, Jerry Langley, Sonya Lim, Tim Loughran, Alex Michaelides, Fred Mittelstaedt, David Ng,
David Pearce, Jim Poterba, Paul Schultz, Bob Shiller, John Stiver, Paul Tetlock, Stathis Tompaidis, Mitch
Warachka, Frank Yu, Eduardo Zambrano, and seminar participants at Notre Dame, University of Amster-
dam, NHH Bergen, BI Norweigian School of Management, and University of Cyprus for helpful discussions
and valuable comments. In addition, we would like to thank Itamar Simonson for making the investor data
available to us and Brad Barber and Terrance Odean for answering numerous questions about the investor
database. We are responsible for all remaining errors and omissions.

Does Investment Skill Decline due to Cognitive Aging orImprove with Experience?
Abstract
This study examines whether cognitive aging adversely affects the stock investment decisions of
older individual investors. Motivated by the evidence from psychological and learning research, we
conjecture that older investors’ portfolio decisions reflect greater knowledge about investing but
investment skill deteriorates with age due to the adverse effects of cognitive aging. Consistent with
our hypothesis, we find that older and experienced investors follow “rules of thumb” that reflect
greater investment knowledge. But older investors also exhibit worse investment skill, especially if
they are less educated, earn lower income, and belong to minority racial/ethnic groups. Overall,
the adverse effects of cognitive aging dominate: Investors with greater cognitive decline earn 3%
lower risk-adjusted annual returns, and the performance differential is 5% among investors who
hold larger portfolios.
1. Introduction
The older population in the United States is growing at a dramatic pace and it is also
becoming more diverse in terms of its racial and ethnic composition.1 Because of this growth
in the proportion of older people, there has been heightened interest in understanding their
post-retirement quality of life. The popular media has raised some concerns that older people
would not be able to generate the annual income necessary to sustain the pre-retirement
quality of life.2 Thus, as the U.S. population ages, it becomes important to understand
the investment decisions of older individual investors because investment income is likely to
be a significant proportion of their post-retirement income, and therefore, one of the main
determinants of their post-retirement quality of life.
In this study, we focus on an important but previously unexplored determinant of the
stock investment decisions of older investors, namely, cognitive aging. We examine whether
older people make better investment choices as they gain more investment experience, or
1According to the 2004 Federal Interagency Forum on Aging-Related Statistics, older people (people aged65 and above) represented about 12% of the population in 2000, but by 2030, their proportion is expected toincrease to about 20%. During the same period, the proportional share of African Americans and Hispanicsin the older population is expected to increase from 14% to 31%.
2In a recent article, available at http://www.nd.edu/∼ndbizmag/spring2005/Feature Old web.shtml,Reynolds (2005) raises several thought-provoking questions about the ability of older people to retire suc-cessfully.
1

whether their investment skill deteriorates with age due to the adverse effects of cognitive
aging. This is an important issue that has implications for how individual investors should
structure their portfolios over time, the type of investment advice they should seek over their
lifetime, and the potential effects of changes in government policy on investment generated
retirement income. To our knowledge, this is the first study that highlights the potential
role and the importance of cognitive aging in people’s investment decisions.
The extant evidence from cognitive aging and learning research indicates that aging and
learning processes operate jointly. The psychological evidence on cognitive aging indicates
that both physical and cognitive abilities, especially memory, decline with age (e.g., Horn
(1968), Fair (1994, 2004), Salthouse (2000), Schroeder and Salthouse (2004)). Furthermore,
research in learning suggests that with experience, older investors might accumulate greater
investment knowledge and exhibit greater awareness of the fundamental principles of invest-
ing. Their accumulated investing wisdom could help them make better investment decisions.
Investors might also be less prone to behavioral biases as they grow older and become more
experienced (e.g., List (2003), Goetzmann and Kumar (2005), Feng and Seasholes (2005),
Dhar and Zhu (2006)).
Motivated by these earlier findings, we conjecture that, on the one hand, older investors
would accumulate greater knowledge about the fundamental principles of investing. But on
the other hand, their declining cognitive abilities could hinder the effective application of
those principles. As a result, older investors’ portfolios might under-perform the common
performance benchmarks.3 Using the end-of-month portfolio holdings and trades of a sample
of individual investors at a large U.S. brokerage house, we empirically test this dual pronged
conjecture.4
The empirical analysis focuses on the relative influences of age and investment experience
on investors’ portfolio decisions and performance. We estimate “rules of thumb” and “skill”
regressions, where the dependent variable is either a measure that reflects the outcome of
following an investing “rule of thumb” or a measure of investment skill. The key explanatory
3In a related study, Agarwal, Driscoll, Gabaix, and Laibson (2007) examine whether the interactionbetween cognitive abilities and experience generates a hump-shaped pattern in financial sophistication, whichinfluences the prices people pay for financial services.
4The individual investor database has been used in several studies including Odean (1998, 1999), Barberand Odean (2000, 2001), and more recently in Ivkovic and Weisbenner (2005), Ivkovic, Poterba, and Weis-benner (2005), Graham and Kumar (2006), Lim (2006), Zhu (2006), Barber and Odean (2007), and Ivkovic,Sialm, and Weisbenner (2007).
2

variables are age and investment experience. We use age to capture the adverse effects of
cognitive aging and use experience (the number of days between the account opening date and
December 31, 1996) to capture the positive effects of experience.5 Without the experience
measure, age would capture two confounding effects, one related to experience and the other
related to cognitive aging. By including age and experience variables simultaneously, we can
separate the positive effects of experience from the negative effects of cognitive aging.
Our empirical evidence strongly supports our main conjecture. Consistent with the theo-
retical predictions of life-cycle and learning models, we find that older and more experienced
investors hold less risky portfolios, exhibit stronger preference for diversification, trade less
frequently, and exhibit greater propensity for year-end tax-loss selling. And consistent with
the psychological evidence, we find that older investors exhibit worse stock selection ability
and poor diversification skill. The age-skill relation has an inverted U-shape and, further-
more, the skill deteriorates sharply around the age of 70. Thus, older investors exhibit a
greater propensity to use common investing “rules of thumb” but they appear less skillful in
successfully implementing those rules.
To gather additional support for our main hypothesis, we seek guidance from the psy-
chology literature that examines the conditional effects of cognitive aging. The psychologi-
cal evidence indicates that people who are more educated, more resourceful, and undertake
intellectually stimulating jobs are able to better compensate for their declining cognitive
abilities (Arbuckle, Gold, and Andres (1986), Baltes and Lang (1997), Cagney and Laud-
erdale (2002)). The evidence also suggests that the age-related decline in cognitive abilities
is steeper for African Americans and Hispanic minority groups (e.g., Avolio and Waldman
(1986), Black (2004)).
Motivated by this psychological evidence, we use age-income, age-education, and age-
race/ethnicity interaction terms as additional proxies for cognitive aging and examine the
conditional deterioration in cognitive abilities with age. Consistent with our hypothesis,
we find that the adverse effects of aging are stronger among older investors who are also
relatively less educated, earn lower income, and belong to the Hispanic ethnic group.
Because we cannot measure the cognitive abilities of investors directly, our results are
open to alternative interpretations. To further ensure that the variables we use to capture
5The brokerage account opening date can be prior to the sample start date of January 1991. The earliestaccounts were opened in 1972 and all investors in the sample have an account opening date prior to 1992.About 88% of investors in the sample opened their accounts prior to the beginning of the sample period.
3

cognitive aging are appropriate, we estimate a model of cognitive aging using a representative
European household-level data set, which includes direct measures of cognitive abilities. The
model estimates indicate that cognitive abilities increase with education, wealth, and income
but decline with age. Furthermore, the cognitive decline is steeper among individuals who
are also less educated and have lower income. This evidence indicates that demographic
variables such as age, income, wealth, education, and their interactions is likely to capture
the adverse effects of cognitive aging reasonably well.
Studies like ours that examine the effects of age also face the classic age-cohort-period
identification problem (e.g., Heaton (1997), Ameriks and Zeldes (2004)). A potential alter-
native interpretation of our evidence on cognitive aging is that it reflects birth cohort effects.
While plausible, there are several reasons why cohort effects are unlikely to explain our main
findings. First, it is difficult to conceive a hypothesis based on cohort effects that predicts
the observed opposite effects of age in our “rules of thumb” and “skill” regressions. Put
differently, cohort effects cannot easily explain why older investors would exhibit a greater
propensity to follow common investment principles but exhibit a lower ability to apply them
effectively. Second, cohort-based explanations for the observed sudden drop in performance
at older age are unlikely to be convincing. Third, cohort effects cannot successfully account
for the inverted U-shaped relation between age and investment skill. In contrast, all these
findings are strongly consistent with the cognitive aging hypothesis and reflect the natural
outcome of the joint aging and learning processes.
In spite of our novel identification strategy based on economic reasoning, we attempt to
directly control for cohort effects using two distinct methods. First, we follow Poterba and
Samwick (1997) and include cohort-range dummy variables in our cross-sectional regressions.
We find that the cohort dummies have insignificant coefficient estimates in all our specifica-
tions. Second, we adopt the differencing method proposed in McKenzie (2006) to eliminate
cohort effects. For each investor, we compute the change in performance between the first
and the second halves of the sample period and examine whether the performance differ-
ential varies with age. In our graphical analysis, we find that the performance differential
measure exhibits an inverted U-shaped pattern and similar to the age-skill relation, there is a
sharp decline at very old age. This evidence is consistent with the cognitive aging hypothesis
and does not suffer from potential contamination from cohort effects because eliminates the
common cohort effects. Overall, these results indicates that cohort effects do not induce the
4

observed negative age-skill relation.
Examining the economic costs of aging, we find that, on average, investors with greater
cognitive decline earn about 3% lower risk-adjusted annual returns, and the performance
differential is over 5% among investors with larger portfolios. We conduct several robustness
tests and show that our results are not sensitive to our relatively short sample size, ex-
ceptional performance of certain styles and industries, the choice of skill measures, potential
error in skill measurement, our inability to observe investors’ full portfolios, choice of the risk
adjustment methodology, specific market conditions, investors’ lack of interest in relatively
small portfolios, and the geographical concentration of our sample investors.
At a first glance, our evidence might appear puzzling, and perhaps surprising, because
the finance literature on portfolio choice mainly attributes increasing risk aversion and the
positive effects of experience to the aging process. The adverse effects of cognitive aging are
typically ignored. Within this traditional portfolio choice paradigm, it is very difficult to
conceive a hypothesis that posits a positive impact of experience and the negative impacts of
age, age-income, age-education, and age-race/ethnicity interaction terms on investment skill.
However, when interpreted in the appropriate context of the extant psychological evidence
on cognitive aging, our findings appear intuitive and economically meaningful because they
represent the natural outcome of the joint aging and learning processes.
The rest of the paper is organized as follows. In the next section, we develop the testable
hypotheses and discuss related research. We describe the data in Section 3. In Section 4,
we examine the stock preferences of older investors and test our first hypothesis that focuses
on the positive effects of aging and experience. In Section 5, we test our unconditional and
conditional hypotheses, which posit that stock investment skill deteriorates with age but
improves with experience. In Section 6, we estimate the economic costs of aging. In Section
7, we conduct robustness checks and attempt to rule out alternative interpretations of our
key findings. We conclude in Section 8 with a brief summary of the paper and potential
implications of our results.
2. Hypothesis Development and Related Research
We develop our testable hypotheses by synthesizing the empirical evidence from the psy-
chological research on aging, the literature on learning, and life-cycle models of investing.
5

The extant psychological evidence indicates that the decline in cognitive abilities is a normal
consequence of biological aging and this phenomenon is observed across different countries
and cultures (Craik and Salthouse (1992)).
Both physical and cognitive abilities, especially memory, decline with age (e.g., Horn
(1968), Fair (1994, 2004), Salthouse (2000), Schroeder and Salthouse (2004)), where the de-
cline begins at a relatively young age of 30 (Grady and Craik (2000)). Weakening memory
slows down the information processing ability of individuals and leads to a decline in older
people’s ability to perceive conditional probabilities (Spaniol and Bayen (2005)). Further-
more, due to a decline in attentional ability, older people get distracted easily and they
are unable to distinguish between relevant and irrelevant information. Thus, older people
are likely to react to new information inappropriately because they are typically slower and
relatively less effective at processing and integrating new information.
The psychological evidence also indicates that people are likely to experience a decline
in their general intelligence level as they grow older. The aging process influences general
intelligence through two distinct channels. First, general intelligence declines with age due to
the adverse effects of aging on memory and attention (e.g., Lindenberger and Baltes (1994),
Baltes and Lindenberger (1997)). Second, with aging, there is also a decline in the sensory
(vision and hearing) functioning, which leads to a decline in general intelligence. The decline
in intelligence is much steeper after the age of 70 (Lindenberger and Baltes (1997)), while
the adverse effects are attenuated in people’s area of expertise because of frequent practicing
(Masunaga and Horn (2001)).
Furthermore, socioeconomic and demographic factors such as education, income, wealth,
race/ethnicity, and gender can exacerbate the adverse effects of cognitive aging. People
who are more educated, more resourceful (i.e., have higher income and are wealthier), and
undertake intellectually stimulating jobs experience a slower decline in cognitive abilities
because they are able to actively compensate for the adverse effects of aging (Arbuckle,
Gold, and Andres (1986), Baltes and Lang (1997), Cagney and Lauderdale (2002)). In
contrast, the age-related decline in cognitive abilities is steeper among older women (Shanan
and Sagiv (1982)) as well as older African Americans and Hispanics (Avolio and Waldman
(1986), Black (2004)).
While old age is likely to have an adverse effect on people’s ability to make effective
investment decisions, older investors are likely to have greater investment experience and
6
greater awareness of the fundamental principles of investing. Their accumulated investing
wisdom could help them make more efficient investment decisions. Theoretical models of
portfolio choice (e.g., Bakshi and Chen (1994), Samuelson (1991), Campbell and Viceira
(2002), Cocco, Gomes, and Maenhout (2005), Gomes and Michaelides (2005)) also posit
that the riskiness of investor portfolios would decline with age due to decreasing investment
horizon and increasing risk aversion.6
In addition to these channels, investors are likely to learn, and they might be less prone
to behavioral biases as they grow older and become more experienced. The extant empiri-
cal evidence from the individual investor literature indicates that older investors exhibit a
weaker disposition effect (Dhar and Zhu (2006)), hold relatively better diversified portfolios
(Goetzmann and Kumar (2005)), and exhibit lower degree of over-confidence (Barber and
Odean (2001)). Furthermore, these behavioral biases decline as investors learn and gain more
experience (e.g., List (2003), Goetzmann and Kumar (2005), Feng and Seasholes (2005)).
Older investors are also less prone to gambling type activities in the stock market (Kumar
(2006)).
Overall, the consensus that emerges from cognitive aging and learning research suggests
that, on the one hand, older investors are likely to make relatively more conservative choices
and might possess relatively greater knowledge about the fundamental principles of investing.
But on the other hand, effective application of those principles requires efficient processing
of information, which they might lack.7 Given the opposite predictions of aging and learning
research, our study investigates empirically whether declining cognitive abilities or increasing
investment experience has a stronger influence on investors’ stock investment decisions. First,
based on the evidence from learning research, we posit that:
6Theoretical models (e.g., Mossin (1968), Samuelson (1969), Merton (1969)) also predict that portfolioholdings of investors would not vary with age in an ideal economy where the following four conditions aresatisfied: (i) asset returns are independently and identically distributed, (ii) investors have constant relativerisk aversion preferences and these preferences do not change over time, (iii) investors do not earn laborincome and hold only tradeable assets, and (iv) transaction costs are zero and markets are complete. SeeAmeriks and Zeldes (2004) for an excellent review of this literature.
7There is an interesting (though imperfect) analogy between the investment behavior of older investors weare trying to capture and the driving behavior of older people. Older drivers have more driving experience butthey are unable to apply that skill effectively due to a decline in their physical abilities. In a similar manner,older investors might have greater knowledge about investing but they can still fail to apply them effectivelydue to decline in their general intelligence and information processing ability. The analogy suggests thatjust as older drivers face additional aging related risks, older investors are likely to expose their portfolios touncompensated risks due to their declining cognitive abilities.
7

H1: Investment knowledge increases with both age and experience.
Next, based on the extant psychological evidence, we develop our unconditional hypothesis,
which posits that:
H2: Investment skill increases with experience due to the positive effects of learn-
ing but declines with age due to the adverse effects of cognitive aging.
While support for the unconditional hypothesis would provide evidence consistent with the
predictions of cognitive aging, the following conditional hypothesis would strongly reinforce
that evidence:
H2cond: The decline in investment skill is steeper among older investors who are
less educated, earn lower income, and belong to a racial/ethnic minority group.
In the following sections, we test these hypotheses using data from multiple sources.
3. Data and Sample Selection
The main data set for this study consists of all trades and end-of-month portfolio positions
of investors at a major U.S. discount brokerage house for the 1991 to 1996 time period. This
data set offers several advantages and is quite appropriate for examining the adverse effects
of cognitive aging. First, because our retail database consists of detailed stock-level data,
we are able to investigate whether portfolio characteristics (e.g., portfolio tilt toward value
stocks, growth stocks, etc.) vary with age. Second, using detailed information about the
composition of investor portfolios, we are able to obtain more direct measures of portfolio risk
instead of relying on survey-declared risk-aversion proxies. This allows us to obtain relatively
accurate risk-adjusted performance measures. Last, unlike a full-service brokerage, where
investors are likely to be strongly influenced by advice from the brokerage firm, investors
in our sample manage their portfolios themselves. Our sample is also tilted towards the
relatively affluent class of investors who might be able to compensate for their declining
information processing abilities more effectively. Thus, the adverse effects of cognitive aging
on investment decisions we find are likely to be stronger in a more representative sample
containing a greater proportion of lower income individuals.8
8The mean net worth of investors in our sample is $268,909 (median is $100,000), which is considerablyhigher than the mean net worth (= $106,399) of households in the 1995 Survey of Consumer Finances(Poterba (2001)).
8

Of course, ideally, a data set that captures the portfolio holdings and trades of a represen-
tative sample of individual investors over a long time period is needed to accurately measure
the adverse effects of cognitive aging and to quantify cohort effects (e.g., Heaton (1997),
Ameriks and Zeldes (2004)). In the absence of such an extensive dataset, our paper uses the
richness of the cross-sectional information to examine the adverse effects of cognitive aging.
And we use economic reasoning to rule out cohort based explanations for our findings. Even
if a long panel data set were available, one might worry about time effects induced by the
changing investment environment over long time periods. In other words, with a long panel,
we might be able to better separate aging and cohort effects but it would be very difficult
to isolate time effects. Thus, the relatively short brokerage sample offers some advantages
over a long, panel data set.
There are 77,995 households in the retail database who hold common stocks and trade
a variety of other securities including mutual funds, options, American depository receipts
(ADRs), etc. In this study, we focus on the investment behavior of 62,387 investors who have
traded common stocks. The average aggregate value of investor portfolios in our sample is
about 2.18 billion and our sample investors executed about 1.9 million common stock trades
during the six-year sample period. Overall, investors’ stock holdings and trades encompass
about 90% of stocks (9,011 stocks) from the Center for Research on Security Prices (CRSP)
universe.
An average investor holds a four-stock portfolio (median is three) with an average size
of $35,629 (median is $13,869). For a subset of households, demographic information such
as age, income, wealth, occupation, marital status, gender, etc. is available, where most of
the demographic information is self-reported at the time the brokerage account is opened.9
Further details on the investor database are available in Barber and Odean (2000).
Table I, Panel A reports summary statistics for five groups of investors grouped as age
cohorts. Because our primary focus is on the investment behavior of older investors, in Panel
B, we also provide summary statistics for five groups of older investors (age ≥ 60) grouped
as age cohorts. A typical investor in our sample has held a brokerage account for about
ten years, and as expected, investment experience increases with age. More importantly,
9Because the demographic information is available for only a subset of investors in the sample (e.g., bothage and income measures are available for only 31,260 investors), the number of observations in our cross-sectional regressions depends upon the subset of demographic variables included. See Barber and Odean(2001, Section II.A) for additional details about the available demographic information.
9

we find that consistent with the prior evidence (e.g., Poterba (2001)), the mean portfolio
size increases monotonically with age and there is no evidence that older investors reduce
their exposure to equity as their investment horizon decreases. In fact, older investors have
greater proportional investment in the stock market, both when measured as a proportion
of their total wealth and their annual income.
The cross-sectional variations in wealth and income in our sample also match well with
corresponding cross-sectional variations in the more representative Survey of Consumer Fi-
nances (SCF) data. For instance, consistent with the evidence in Poterba (2001), we find
that the wealth level peaks within the age range of 65-69. Additionally, we find that the
annual income peaks within the age range of 47-52, which is also consistent with the predic-
tions of the life-cycle models. Overall, these comparisons with the SCF data suggest that
our sample of older retail investors is reasonably representative of the older households in
the U.S.10
To enrich our analysis, we complement the individual investor data with demographic
data from the 1990 U.S. Census.11 We use the Census data to identify the racial/ethnic profile
and the educational background of investors. To identify the racial/ethnic composition of
investors, for each zip code, we compute the proportion of individuals in the following four
racial/ethnic groups: (i) Caucasian, (ii) African American, (iii) Hispanic, and (iv) Others.
Using the zip code of each investor, we assign her the appropriate zip code-level racial/ethnic
profile. Similarly, we use the Census data to infer the education level of an investor. Investors
who live in more educated zip codes are assumed to be more educated, where the proportion
of the zip code population that holds a bachelor’s or higher degree is used to identify the
educational status of that zip code.12
Several other data sets are used in this study. We use a representative household-level
data set from the 2005 wave of the Survey of Health, Aging, and Retirement in Europe
(SHARE) to estimate a model of cognitive abilities.13 For each stock in the sample, we obtain
10See Ivkovic, Poterba, and Weisbenner (2005) and Ivkovic, Sialm, and Weisbenner (2007) for additionaldiscussions on the representativeness of our individual investor data.
11The U.S. Census data are available at http://www.census.gov/main/www/cen1990.html.12Because we use the zip code-level Census data and assign to each investor the racial/ethnic and edu-
cational profile of her zip code, strictly speaking, the race and the education level measures of an investorindicates the dominant race and the educational status of the people in her zip code. However, we avoid theselengthy descriptors such as “investor who lives in a zip code dominated by African Americans”. Instead, webroad labels such as Hispanic investor, highly educated investor, older African American investor, etc. torefer to an investor.
13The SHARE data are available at http://www.share-project.org/. See Christelis, Jappelli, and
10

the quarterly cash dividend payments, monthly prices, returns, and market capitalization
data from CRSP and quarterly book value of common equity data from COMPUSTAT.
We obtain the monthly time-series of the three Fama-French factors and the momentum
factor from Professor Kenneth French’s data library.14 Last, we obtain characteristic-based
benchmarks from Professor Russ Wermer’s web site.15
4. When Do Older Investors Make Better Investment Decisions?
To find support for our first hypothesis (H1), we examine whether the knowledge and experi-
ence accumulated over time manifest themselves in investors’ portfolio holdings and trading
decisions.
4.1. Age and Equity Portfolio Risk
In our first formal analysis, we examine whether older investors follow the common theoret-
ical prescription and hold relatively less risky portfolios. Specifically, we examine the style
preferences of five age-based investor groups to determine whether older investors tilt their
portfolios toward relatively less risky stocks. Since our focus is on the investment behavior
of older investors, we also examine the style preferences of five groups of investors sorted on
age, where the minimum age is 60.
To measure the style preferences of an investor group, first, we combine the portfolios of
all investors in that group and construct a group-level portfolio (p). Next, for portfolio p,
at the end of each month t, we compute the actual weights (in percent) assigned to various
style portfolios (wspt), where the subscript s refers to a style portfolio. The following six
stock characteristics are used to measure investors’ style preferences: (i) stock volatility or
total risk, (ii) dividend yield, (iii) market beta, estimated using past 60 months of data, (iv)
firm size, (v) book-to-market (B/M) ratio, and (vi) past 12-month return or momentum.
We also construct the aggregate market portfolio by combining the entire universe of stocks
available on CRSP and compute the expected weights (in percent) assigned to various style
Padula (2006) for details.14The data library is available at http://mba.tuck.dartmouth.edu/pages/faculty/ken.french/.15The data are available at http://www.smith.umd.edu/faculty/rwermers/ftpsite/Dgtw/coverpage.htm.
11

portfolios(wsmt).16 Lastly, we compute the unexpected (or excess) portfolio weight allocated
to a style in the group-level portfolio, which is the difference between the actual and the
expected style weights (wspt−wsmt). The unexpected style weights in a given period provide
a measure of the group’s instantaneous style preferences and the means of the monthly
unexpected style weights indicate the style preferences of a group during a chosen time-
period.
Age-dependent style preference estimates are reported in Table II. We find that older and
younger investors exhibit distinct style preferences. Both younger (age quintile 1) and older
(age quintile 5) investors prefer small stocks but older investors exhibit a weaker preference
for small stocks (see set (4)). Older (younger) investors over-weight small stocks by 15%
(17.54%) and under-weight large-cap stocks by 20.02% (22.96%). Similarly, consistent with
the evidence in Graham and Kumar (2006), we find that older investors, especially those
who are above 75, exhibit stronger preference for high dividend yield stocks.17 Overall, our
evidence on age-dependent style preferences indicates that, even though older investors do
not reduce their exposure to equity (see Table I), within the equity asset class, they prefer
stocks that are relatively less risky.
For greater accuracy, we estimate panel regression models and examine the characteristics
of age based group portfolios in a multivariate setting. In these regressions, the excess weight
assigned to a stock in the aggregate group portfolio is the dependent variable and the mean
return, idiosyncratic volatility, skewness, kurtosis, and the price of the stock are used as
the primary independent variables.18 The return moments are calculated using the past
60 months of data and the idiosyncratic volatility measure is the variance of the residual
obtained by fitting a four-factor model to the monthly stock returns series.
Additionally, the following control variables are employed: (i) market beta, which is also
estimated using past 60 months of data, (ii) firm size, (iii) book-to-market ratio, (iv) short-
16If investors in a group were to randomly select stocks, where the probability of picking a stock isproportional to its size, the weight of a style in the group portfolio would be approximately equal to theweight of the style in the aggregate market portfolio. Alternatively, if investors as a group exhibit mean-variance preferences even when individually they do not hold such preferences, they would hold the marketportfolio. In either case, the set of weights in the aggregate market portfolio serves as an appropriatebenchmark.
17These differences in stock preferences are obviously not independent of one another. Our intent here issimply to illustrate that older and younger investors prefer different types of stocks.
18The excess portfolio weight allocated to stock i in month t is given by: EW ipt = wipt−wimt
wimt× 100, where
wipt is the actual weight assigned to stock i in group portfolio p in month t and wimt is the weight of stocki in the aggregate market portfolio in month t.
12

term momentum (past one-month stock return), (v) longer-term momentum (past twelve-
month stock return), (vi) an S&P500 dummy which is set to one if the stock belongs to the
S&P500 index, and (vii) monthly volume turnover. To account for potential auto correlation
and cross correlation in errors, we use the non-parametric approach of Driscoll and Kraay
(1998) and obtain the corrected standard errors for our estimates. This methodology pro-
vides a unified approach for simultaneously correcting the standard errors for cross-sectional
correlation, serial auto correlation, and cross serial correlation in a panel setup.19
The panel regression estimates are presented in Table III. The independent variables have
been standardized (mean = 0, standard deviation = 1) to facilitate comparisons among the
coefficient estimates. We also ensure that multi-collinearity is not contaminating our results.
We estimate the panel regression model for three age-based categories: (i) younger age group
containing investors in the 20-38 age range, (ii) older age group consisting of investors in
the 60-94 age range, and finally, (iii) within the older investor group, the oldest age group
consisting of investors in the 75-94 age range. Additionally, we estimate two panel regressions
to examine the differences in the stock preferences of groups (i) and (ii), and (i) and (iii).
Focusing on the differential regression estimates (columns (4) and (5)), we find that
older investors favor relatively less risky stocks. Specifically, older investors’ preferences for
stocks with higher idiosyncratic volatility, higher market beta, lower market capitalization,
lower prices are weaker than those of younger investors. Older investors also exhibit weaker
preference for stocks with higher skewness, which indicates they are less likely to chase
extreme positive returns. Furthermore, our estimates indicate that investors’ preferences for
less risky stocks increase with age because the differences in stock preferences, as reflected
by the magnitudes of the coefficient estimates, are stronger when we consider the 75-94 age
group (see column (5)).20
In sum, the sorting results and panel regression estimates indicate that the average risk
exposures of investors’ stock portfolios decrease with age. Consistent with our first hypothesis
(H1), the evidence indicates that experienced and prudent investors reduce the riskiness of
19We find that the coefficient estimates are very similar and the t-statistics are of higher magnitudewhen we estimate Fama and MacBeth (1973) cross-sectional regressions and use the Pontiff (1996) methodto compute serial correlation adjusted standard errors. We choose to report the conservative t-statisticsobtained using the Driscoll and Kraay (1998) methodology.
20The results are remarkably similar when we use other age categories. Specifically, we examined therobustness of our results using the following three age groups: (i) 20-40 (weak retirement motive), (ii) 41-65(strong retirement motive), and (iii) above 65 (retired).
13

their portfolios as they grow older.
4.2. Do Investors Accumulate More Knowledge About Investing As They Grow Older?
To examine whether older investors exhibit greater knowledge about investing, we concen-
trate on a few important dimensions of portfolio decisions that reflect “rules of thumb” in
investing. The set of decisions we consider is guided by the availability of data. First, we
examine whether older investors are more likely to recognize the potential benefits of diversi-
fication. Next, we examine whether older investors trade less frequently because they realize
that active trading in efficient markets is a futile exercise. Last, we examine whether older
investors are more likely to engage in year-end tax-loss selling, since it requires financial
awareness but does not necessarily require skill.21
We estimate several “rule of thumb” cross-sectional regressions, where the dependent vari-
able is a measure of investment decision that reflects a specific investing “rule of thumb”.
The measures are obtained for each investor using their decisions during the entire sample
period. For each investment decision, we estimate both unconditional and conditional regres-
sion models. In the unconditional regressions, the independent variables are only age and
investment experience. Age corresponds to the head of the household and Investment Expe-
rience is the number of days between the account opening date and December 31, 1996.22
Most investors (about 88%) opened their brokerage accounts prior to the start of the sample
period and all accounts were opened before 1992.
In the conditional regressions, several demographic variables and portfolio characteristics
are employed as control variables: Income represents the annual household income.23 Educa-
tion represents the proportion of people in investor’s zip code that has attained a bachelor’s
or higher educational degree. The Male Dummy is set to one if the head of the household is
male, and the Retired dummy is set to one if the head of the household is retired. Portfolio
Size is the average market capitalization of the household portfolio, Portfolio Turnover is
the average of monthly buy and sell turnovers, and Portfolio Dividend Yield is the average
21Optimal trading behavior in presence of taxes requires skill (e.g., Constantinides (1983, 1984), Ivkovic,Poterba, and Weisbenner (2005)). However, such optimal response to taxes would lead to higher risk-adjustedperformance, which our risk-adjusted performance measures would capture (see Section 5).
22The date is arbitrarily chosen and the choice does not influence any of our results.23We have information about both the income and the wealth of investors. We use the income measure in
our empirical analysis because it is available for a larger subset of investors in the sample. Our results arevery similar when we use wealth instead of income.
14

dividend yield of the household portfolio.24 The RMRF (market factor), SMB (small-minus-
big factor), HML (high-minus-low factor), and UMD (up-minus-down or momentum factor)
exposures are the factor loadings of an investor’s portfolio and they capture the risk charac-
teristics of the portfolio. The factor loadings are obtained by fitting a four-factor time-series
model to the monthly portfolio returns series of each investor over the period the investor
is active. Last, Mutual Fund Holdings is the proportion of the equity portfolio allocated to
mutual funds.
The “rule of thumb” cross-sectional regression estimates are presented in Table IV, where
the t-statistics are computed using robust and zip code level clustered standard errors. As
before, to ensure that extreme values are not affecting our results, we winsorize all variables
at their 0.5 and 99.5 percentile levels. The independent variables have been standardized so
that each variable has a mean of zero and a standard deviation of one.
In the first two regressions, to examine whether older investors are more aware of the
potential benefits of diversification, we use the number of stocks in the portfolio as the
dependent variable (columns (1) and (2)). Our intent here is not to show that older investors
hold more diversified stock portfolios. Given that we cannot observe the entire portfolios
of investors, the number of stocks is likely to be a very noisy measure of diversification.
Nonetheless, the number of stocks in an investor portfolio is likely to indicate whether or
not an investor exhibits a preference for diversification.
Our results from the unconditional model indicate that older and more experienced in-
vestors hold portfolios containing more stocks. The coefficient estimates are significantly
positive for both Age and Investment Experience, even in the presence of various control
variables. The (unreported) coefficient estimates for the control variables are also broadly
consistent with our expectations. For instance, the positive coefficient estimate for Mutual
Fund Holdings indicates that investors who exhibit stronger preference for diversification
in their stock portfolios also hold more mutual funds. Overall, consistent with our first
hypothesis, the evidence indicates that the portfolio choices of older and more experienced
investors are more likely to conform to one of the key principles of investing, namely, portfolio
diversification.
24Because we use sample period averages for many of our variables, there is an issue of endogeneity thatcould affect some of our estimates. To minimize potential endogeneity affecting our coefficient estimates,we experimented with portfolio characteristics measures (e.g., the portfolio size) from the first month theinvestor enters the sample. We find that the coefficient estimates are virtually unchanged when we use thosealternative measures. For consistency, we use the full sample based measures for all portfolio variables.
15

Next, we examine whether older investors follow one of the key recommendations of
the efficient market hypothesis, which posits that investors should not trade actively to
improve performance because such an exercise would be futile. In the next two regression
specifications (columns (3) and (4)), we use the monthly portfolio turnover as the dependent
variable.25 Again, consistent with our first hypothesis, we find that both older and more
experienced investors exhibit lower turnover rates. The coefficient estimates are significantly
negative for both Age and Investment Experience, even in the presence of various control
variables. The negative coefficient estimate for Age and the positive coefficient estimate for
the Male Dummy are consistent with the evidence in Barber and Odean (2001), who find that
older (male) investors trade relatively less (more) frequently. These estimates indicate that
the trading behavior of older investors are more likely to conform to another key principle
of investing, namely, less frequent trading.
While these cross-sectional regression estimates are consistent with our first hypothesis,
one might argue that a stronger preference for diversification and lower portfolio turnover do
not necessarily imply greater investment knowledge but reflect “passive” investing by older
investors. To address this potential concern, we use another knowledge measure that is more
likely to capture investor’s knowledge about investing. Specifically, we examine whether
older investors exhibit greater propensity to engage in year-end tax-loss selling.
We estimate a regression model where the proportion of “losers” (stock investments where
an investor suffers a loss) sold in the month of December is used as a dependent variable.26
The regression estimates indicate that both older and more experienced investors are more
willing to sell their losers in December. The coefficient estimates are significantly positive for
both Age (estimate = 0.016, t-stat = 5.696) and Investment Experience (estimate = 0.006,
t-stat = 2.311), even in the presence of various control variables. Again, in unreported
results, we find that most control variables have the expected signs. For instance, investors
who hold larger portfolios and trade more often are likely to sell more losers in December.
This evidence indicates that the trading behavior of older investors are likely to reflect yet
another investing rule of thumb: “Sell your losers in December”.
25The monthly portfolio turnover rate is the average of purchase and sales turnover rates. The purchaseturnover rate in month t is the ratio of the dollar value of purchases in month t (beginning of month stockprices are used to compute the value) and the dollar value of the portfolio at the end of month t − 1. Thesales turnover rate is defined in an analogous manner.
26The estimates are similar when we examine the proportion of losses realized in both November andDecember.
16

Given that the coefficient estimates of Age and Investment Experience have similar signs
in all cross-sectional regression specifications, one might suspect that the two variables cap-
ture identical aspects of investors’ investment decisions. But we find that age and investment
experience measures are weakly correlated (correlation = 0.142). Furthermore, when we es-
timate a cross-sectional regression with portfolio dividend yield as the dependent variable,
we find that the coefficient estimate for Age is positive but the coefficient estimate for In-
vestment Experience is negative (see Table IV, column (5)). The positive coefficient estimate
for Age is consistent with the evidence in Graham and Kumar (2006), who show that older
investors are likely to prefer high yield stocks for consumption reasons. However, the neg-
ative estimate for Investment Experience is new and it indicates that, all else equal, more
experienced investors prefer lower yield stocks. In the current context, more importantly,
the estimates indicate that the age and experience variables capture two distinct aspects of
investors’ investment decisions.
Taken together, our “rule of thumb” cross-sectional regression results indicate that older
investors make more conservative stock investment choices and their choices reflect greater
knowledge about investing. This evidence supports our first hypothesis (H1), which posits
that investment knowledge increases with both age and experience.
5. When do Older Investors Make Worse Investment Decisions?
While older investors, especially those who are more experienced, exhibit a greater propen-
sity to follow common investment “rules of thumb”, how effectively can they apply those
principles? To gather support for our second hypothesis (H2 and H2cond) that posits op-
posite effects of age and experience, we estimate “skill” cross-sectional regressions, where a
measure of investment skill is employed as the dependent variable.
We focus on two specific investment skills: “diversification skill” and the stock selection
ability. Our conjecture is that although older investors hold portfolios with larger number of
stocks, they might not exhibit “diversification skill” because the ability to perceive correla-
tions accurately might decline with age.27 Furthermore, investors’ stock selection skill could
27Goetzmann, Li, and Rouwenhorst (2005) show that the total portfolio variance can be reduced byincreasing the number of stocks in the portfolio and by a proper selection of stocks such that the averagecorrelation among stocks in the portfolio is lower. Variance reduction through proper stock selection reflects“skill” while addition of stocks in the portfolio without a reduction in the average portfolio correlation reflectsa “passive” form of diversification.
17
decline with age because the adverse effects of cognitive aging could influence people’s ability
to efficiently process new information. In contrast, both diversification and stock selection
skills are likely to improve with investment experience.
5.1. Age, Investment Experience, and Investment Skill
We use the monthly Sharpe ratio to measure diversification skill and the monthly port-
folio alpha to measure stock selection skill. The alpha measure is the intercept from the
four-factor time-series model, where the portfolio returns is the dependent variable and the
four commonly used risk factors (RMRF, SMB, HML, and UMD) are employed as depen-
dent variables. We also employ the mean characteristic-adjusted monthly portfolio return
obtained using the Daniel, Grinblatt, Titman, and Wermers (1997) methodology as an al-
ternative measure of investment skill. The DGTW characteristic-adjusted return of a stock
is the difference between the raw monthly stock return and the return from a matching size,
book-to-market, and momentum matched benchmark portfolio return. Both investment skill
measures captures the ability of investors to generate excess returns from their portfolio de-
cisions, after accounting for the known differences in their style and risk preferences (see
Table II).
Before presenting the skill regression estimates, we graphically illustrate the univari-
ate relation between age and investment skill. Figure 1 shows the variation in the mean
characteristic-adjusted portfolio returns with age. Two features of the plot are noteworthy.
First, the investment performance exhibits an inverted U-shape with a peak around 40 years.
The hump shape reflects the combined effects of experience and aging. Second, there is an
abrupt and significant drop in performance around the age of 70. This nonlinear effect sup-
ports our cognitive aging hypothesis and is consistent with the psychological evidence that
finds a steeper cognitive decline after the age of 70. Overall, the graphical evidence reveals
that a complex set of interactions among age, experience, and investment skill determine
portfolio performance.
The skill regressions allow us to better quantify these interactions. In the first set of re-
gressions, we test our unconditional hypothesis, where the only independent variables are Age
and Investment Experience. The cross-sectional regression estimates for the unconditional
models are presented in Table V (columns (1), (3), and (5)). In all our regression speci-
18

fications, we use robust, clustered standard errors to account for potential cross-sectional
dependence within zip codes.
In the Sharpe ratio regression (column (1)), Age has a negative but statistically insignif-
icant coefficient estimate (estimate = −0.001, t-stat = −0.935) while Investment Experience
has a significantly positive coefficient estimate (estimate = 0.011, t-stat = 11.644).28 In
the alpha regression (column (3)), Age has a significantly negative coefficient estimate (esti-
mate = −0.042, t-stat = −5.047) and Investment Experience has a negative but statistically
insignificant estimate (estimate = −0.010, t-stat = −1.184). Last, in the characteristic-
adjusted return regression (column (5)), Age has a significantly negative coefficient estimate
(estimate = −0.044, t-stat = −7.293) while Investment Experience has a significantly posi-
tive coefficient estimate (estimate = 0.037, t-stat = 6.053).29 These coefficient estimates are
consistent with our main hypothesis and indicate that Age has opposite effects in “rule of
thumb” and “skill” regressions.
The coefficient estimates in the skill regressions are significant in economic terms. For
instance, the estimate for Age in the alpha regression indicates that, holding experience fixed,
a one standard deviation shift in the age of an investor would correspond to an annual, risk-
adjusted performance decline of 0.042 × 12 = 0.504%. The mean age of investors in our
sample is 50 and the standard deviation is about 12. Thus, when an investor aged 30
becomes older and crosses the retirement age of 65 (a three standard deviation change in
age), she is likely to suffer an annual performance decline of 1.512% on a risk-adjusted basis.
Collectively, the graphical evidence and the results from our unconditional tests indicate
that, investment skill varies inversely with age and positively with investment experience.
This evidence is consistent with our unconditional hypothesis (H2) but the strengths of
age-skill and experience-skill relations are rather weak.30
28Consistent with our evidence, using household-level data from Sweden, Calvet, Campbell, and Sodini(2005) show that older investors make cautious but relatively less efficient investment choices. Also, seeCampbell (2006).
29Our results might appear inconsistent with the evidence in the Barber and Odean (2001) study, who finda positive relation between age and net performance. When we use a cross-sectional regression specificationsimilar to theirs with portfolio turnover as an additional control variable (to capture the adverse effects oftrading) and without Investment Experience as one of the independent variables, we also find a positiverelation between age and portfolio performance.
30In a different context, Chevalier and Ellison (1999) find that, keeping experience and other characteristicsconstant, older mutual fund managers exhibit worse performance than younger managers. They find thisevidence puzzling and attribute it to managers’ career concerns. However, the evidence is also consistent withour unconditional hypothesis, which posits that skill varies inversely with age and positively with experience.
19

To gather stronger support for the second hypothesis, we consider additional proxies for
cognitive aging. Our choice is motivated by the psychological evidence, which finds that
people who are more educated, more resourceful, and undertake intellectually stimulating
jobs are able to better compensate for their declining cognitive abilities (Arbuckle, Gold, and
Andres (1986), Baltes and Lang (1997), Cagney and Lauderdale (2002)). Analogous to the
psychological evidence, we expect that the adverse effects of cognitive aging would be weaker
among wealthier, higher income, and more educated investors. Older investors who are more
educated and more resourceful (i.e., investors with higher income and greater wealth) might
be able to better compensate for their declining information processing abilities.
5.2. An Empirical Model of Cognitive Abilities
Before estimating extended specifications of skill regressions, we further ensure that the ad-
ditional cognitive aging proxies employed in the regression specification are appropriate. We
estimate a model of cognitive abilities using a representative European household data set.
The data contain three direct measures of cognitive abilities: (i) verbal ability, (ii) quan-
titative ability, and (iii) memory. The three cognitive measures are positively correlated
but the maximum correlation is below 0.50. Using these measures, we obtain a composite
(equal-weighted) measure of cognitive abilities. The European household data also contain
demographic variables that are available in our individual investor data set. We consider
several regression specifications, where one of direct measures of cognitive abilities is the
dependent variable and the main determinants of cognitive abilities identified in the psycho-
logical literature are the independent variables.
The cognitive abilities regression estimates are reported in Table VI. Consistent with the
psychological evidence, we find that cognitive abilities decline with age and are positively
associated with education, wealth, and income. Furthermore, the decline is steeper among
individuals who are considerably older (age > 70), are less educated, and have lower income.
It is interesting that two facets of cognitive abilities that are more relevant for investment
decisions, namely, the quantitative ability and memory, exhibit a sharper decline with age.
The decline in verbal ability that might be less relevant for investment decisions is relatively
less severe. In sum, the cognitive abilities model estimates indicate that demographic vari-
ables such as age, income, wealth, education, and their interactions are likely to capture the
20

adverse effects of cognitive aging reasonably well.
5.3. Conditional Deterioration in Investment Skill
To quantify the influence of cognitive aging on investment decisions more accurately, we
estimate an extended skill regression specification. This specification includes additional
cognitive aging proxies that are suggested by our empirical model of cognitive abilities.
Specifically, we interact age with income and education, where both the Age*Low Income
and Age*Low Education interaction terms are defined after standardizing the age variable.
We also consider an Over 70 Dummy to capture the sudden drop in investment performance
identified in Figure 1.31
The psychological evidence (e.g., Avolio and Waldman (1986), Black (2004)) suggests that
the age-related decline in cognitive abilities is steeper among ethnic/racial minorities (African
Americans and Hispanics).32 In light of this evidence, we use two additional interaction
terms, one for Hispanics and another for African-Americans. The Hispanic variable is set
to one for investors who live in zip codes where the ratio of the populations of Hispanics to
Whites is in the upper quintile.33 The African American variable is defined in an analogous
manner. We interact both race/ethnicity variables with Age.
We also consider several independent variables to control for the known determinants of
performance and investment skill. We include a Male Dummy as a control variable because
previous studies have shown that gender influences net investment performance (Barber
and Odean (2001)). The Retired Dummy allows us to control for the significant lifestyle
changes at the time of retirement, which could alter investment behavior.34 We employ
several portfolio characteristics as control variables because investors’ risk preferences are
likely to vary with age. This set includes portfolio size, portfolio dividend yield, and the four
factor exposures (RMRF , SMB, HML, and UMD coefficient estimates) of the investor
31We also considered a quadratic age term in our regression specifications. The Age2 variable has aninsignificant coefficient estimate, which is not surprising because other variables like income and wealth alsocapture the hump shape.
32In our sample, zip codes with higher concentration of minorities are primarily located in California,Illinois, Maryland, New York, and Texas.
33When we use the continuous race/ethnicity variables, which are likely to be noisier, the interactionterm estimates are similar, though somewhat weaker. Note that although we use zip code-level measures ofeducation and race/ethnicity, our coefficient estimates are consistent. See Wooldridge (2002) for details.
34The abrupt changes in lifestyle at the time of retirement are known to affect consumption behavior (e.g.,Banks, Blundell, and Tanner (1998), Bernheim, Skinner, and Weinberg (2001)).
21

portfolio.35 Last, the Portfolio Turnover measure serves as an approximate control for the
effects of transaction costs on portfolio performance.
The skill regression estimates for the conditional models are also reported in Table V
(columns (2), (4), and (6)). Consistent with our hypotheses, we find that the age-skill and
experience-skill relations become stronger and appear more transparent in the conditional
models. In the Sharpe ratio regression (column (2)), both Age and Investment Experience
have significant coefficient estimates, where the loading on Age is negative (estimate =
−0.014, t-stat = −3.355) and the loading on Investment Experience is positive (estimate
= 0.010, t-stat = 9.450). We interpret the negative coefficient estimate on Age as an adverse
effect of cognitive aging, while the positive coefficient estimate on Investment Experience
suggests that greater experience leads to greater diversification skill.
Our results from the Sharpe ration regression indicate that the coefficient estimate on
Income is positive but statistically insignificant. However, the Age*Low Income interaction
term has a negative coefficient estimate, which indicates that the adverse effects of aging are
stronger among older investors with lower income. In addition, we find that Education has a
significantly positive coefficient estimate (estimate = 0.002, t-stat = 1.882) and the Age*Low
Education interaction term has a marginally negative coefficient estimate. These results in-
dicate that while education and investment experience leads to more effective diversification,
as investors grow older, their ability to diversify effectively decreases.
When we estimate the conditional skill regression with the four-factor alpha as the de-
pendent variable, the results are remarkably similar to the Sharpe ratio regression estimates.
Both Age and Investment Experience have significant coefficient estimates, where the loading
on Age is negative (estimate = −0.051, t-stat = −4.735) and the loadings on Investment
Experience and Education are positive (the estimates are 0.020 and 0.014, and the t-statistics
are 2.283 and 2.527, respectively). Furthermore, the Over 70 Dummy has a negative and
significant coefficient estimate (estimate = −0.025, t-stat = −2.073). We also find that
the Age*Low Income and Age*Low Education interaction terms have negative coefficient
estimates, though the latter is not statistically significant.
When we use the mean characteristic-adjusted monthly returns to measure risk-adjusted
35Since we use risk-adjusted measures of portfolio performance as dependent variables in our regressionspecifications, these control variables are not necessary. We employ these control variables to be conservative.They would adjust for residual risk differences that the standard risk adjustment models might not be ableto capture.
22

performance, consistent with our alpha regression estimates, we find that age and investment
experience maintain their opposite signs and the interaction terms have similar estimates (see
column (6)).36 The coefficient estimate for Age is −0.054 with a t-statistic of −2.945 and co-
efficient estimate for Investment Experience is 0.027 with a t-statistic of 3.891. Furthermore,
both Age*Low Income and Age*Low Education interaction terms have the expected negative
and significant coefficient estimates (the estimates are −0.014 and −0.005 with t-statistics
of −1.996 and −2.719, respectively).
While we use robust, clustered standard errors in our skill regressions to account for
potential cross-sectional dependence, for additional robustness, we estimate a panel regres-
sion specification using the monthly characteristic-adjusted returns. We use the Driscoll
and Kraay (1998) methodology to account for potential cross-sectional correlation, serial
autocorrelation, and cross serial correlation. We find that the panel regression results are
qualitatively very similar (see column (7)) to the cross-sectional regression estimates.
The coefficient estimates in the skill regressions are easy to interpret in economic terms.
They allow us to quantify the performance decline that can be attributed solely to the
adverse effects of cognitive aging. For instance, the coefficient estimate of Age in column (4)
indicates that, all else equal, a one standard deviation shift in the age of an investor who does
not belong either to the lower income, lower education, or ethnic minority groups would be
associated with an annual, risk-adjusted performance decline of 0.051 × 12 = 0.612%. This
indicates that when an investor aged 30 becomes older and crosses the retirement age of
65 (a three standard deviation change in age), she is likely to suffer an annual performance
decline of 1.836% on a risk-adjusted basis.
Examining the race/ethnicity interactions, we find that Age*Hispanic interaction term
has a significantly negative coefficient estimate in all four regression specifications. For
instance, in the alpha regression (column (4)), the coefficient estimate of the interaction term
is −0.034, with a t-stat of −3.516. In economic terms, this implies that an older investor who
also earns lower income and belongs to the Hispanic ethnic group would experience an annual,
risk-adjusted performance decline of (0.051 + 0.025 + 0.034) × 12 = 1.320%. Furthermore,
a jump in age from 30 to 65 for an investor with these attributes would correspond to an
annual performance decline of 3.96% on a risk adjusted basis. In contrast, we find that the
36The correlation between the four-factor alpha and the characteristic-adjusted performance measures ispositive (0.592) but not extremely high.
23

Age*African American interaction term has insignificant coefficient estimates.
In unreported results, we find that the coefficient estimates of our control variables have
the expected signs. For instance, in the alpha regression, the Portfolio Dividend Yield has
a strongly negative estimate, which indicates that investors who focus excessively on high
dividend yield stocks exhibit weaker stock selection ability. Nonetheless, these investors are
able to reduce the total risk of their portfolios, thereby increasing the Sharpe ratio (see
column (2)). Additionally, investors who hold larger portfolios exhibit better stock selection
ability because portfolio size is likely to be a proxy for greater resources and it may also
reflect greater investment experience.37 We also find that the coefficient estimate for Retired
Dummy is statistically insignificant, which suggests that the abrupt lifestyle change at the
time of retirement does not have an incremental negative effect on investment skill.
Overall, the skill regression estimates support our unconditional hypothesis (H2), which
posits that investment skill increases with experience due to the positive effects of learning,
but declines with age due to the adverse effects of cognitive aging. The evidence also supports
our conditional hypothesis (H2cond), which posits that the decline in skill is steeper among
less educated and less wealthy older investors who belong to minority groups.
5.4. Additional Evidence: Cognitive Aging and Learning
Do older investors learn less effectively due to cognitive aging? To gather additional support
for our main hypothesis, we examine whether the speed and effectiveness of learning depends
upon age. We embed two interaction variables in one of our skill regression specifications
(column (6) in Table V): Below 30 * Low Experience and Over 70 * Low Experience. In
untabulated results, we find that lack of experience has stronger adverse effects on older
investors. The coefficient estimate for the Over 70 * Low Experience dummy is negative and
significant (estimate = −0.041, t-stat = −4.068) while the coefficient estimate of the Below
30 * Low Experience dummy is statistically insignificant (estimate = 0.005, t-stat = 0.546).
This evidence is consistent with our conditional hypothesis and indicates that learning is
impaired by the adverse effects of cognitive aging.
37To eliminate potential concerns about reverse causality (portfolio size is larger because of better portfolioperformance and not vice versa), we use the portfolio size from the first month the investor enters the sample.
24

5.5. Sub Sample Estimates Without the Extreme Performers
To examine whether the exceptionally superior or poor performance of certain types of stocks
or industries are influencing our estimates, we exclude k% investors from both the tails and
re-estimate the skill regressions. When k = 5, our estimates remain qualitatively similar.
For instance, the coefficient estimates for Age and Investment Experience are −0.047 (t-stat
= −3.031) and 0.035 (t-stat = 4.609), respectively. Furthermore, the interaction terms have
the expected negative and significant estimates.
5.6. Evidence from Other Related Settings
While our study focuses on investors’ stock investment decisions to test the cognitive ag-
ing hypothesis, footprints of cognitive aging are observed in other related settings as well.
For instance, the evidence in Bailey, Kumar, and Ng (2006) corroborates our findings and
supports our main hypotheses. While that paper does not focus on the implications of cog-
nitive aging, they find that both older and more experienced investors exhibit a stronger
propensity to invest in foreign securities. Those investors are more likely to participate and,
conditional upon participation, they hold larger foreign equity portfolios. Thus, older and
more experienced investors follow another commonly prescribed investment advice: “Diver-
sify internationally.” However, the empirical evidence in that paper also reveals that while
both older and more experienced investors experience reduction in the portfolio volatility due
to their foreign investments, only experienced investors are able to improve the Sharpe ratios
of their portfolios. This evidence indicates that older investors are more likely to attempt
to exploit the potential benefits of foreign investments but, conditional upon participation,
they appear less skillful in their decisions.
We obtain very similar results when we evaluate investors’ mutual fund investment de-
cisions. In untabulated results, we find that both older and experienced investors are more
likely to invest in mutual funds. Furthermore, older investors exhibit a greater propensity
to invest in index funds while experienced investors exhibit a stronger preference for other
types of funds. Thus, older investors are more likely to follow yet another common invest-
ment rule of thumb: “Invest in well-diversified mutual funds.” However, consistent with our
cognitive aging hypothesis, we also find that only investors with greater experience earn
higher risk-adjusted returns from their increased participation rates in mutual funds. This
25

evidence shows that in yet another setting older investors follow the commonly prescribed
investment principle but are relatively less effective in applying that rule.
5.7. Identification Strategy for Separating Cognitive Aging, Time, and Cohort Effects
Studies like ours that examine the effects of age are plagued with the classic age-cohort-period
identification problem (e.g., Heaton (1997), Ameriks and Zeldes (2004)). The main concern
is that in addition to age-induced cognitive aging effects that we are mainly interested in, age
could capture birth cohort or time effects. Because the three effects are strongly correlated,
it is usually difficult to isolate their effects without a data set that tracks the portfolio choices
of the same set of individuals over a very long period of time. Fortunately, time effects are
unlikely to play a significant role during the relatively short six-year sample period. Thus,
we largely assume that time effects are small and do not contaminate our results.
More importantly, there are several reasons why cohort effects are unlikely to explain our
findings. First, we use a combination of “rules of thumb” and “skill” regressions to identify
the adverse effects of cognitive aging, where our main hypothesis predicts opposite effects of
age in the two contexts. But just like the effects of experience, any cohort-based hypothesis
would predict a similar influence of age in both regressions. Common social experiences such
as the quality of education, socioeconomic environment when growing up, or common first
hand experience of salient events (e.g., the depression or the stock market crash) that are
often associated with cohort effects cannot successfully explain the opposite signs of age in
rules of thumb and skill regressions.
For instance, consider the effects of the quality of education on investment decisions. The
cohort of older investors might have experienced lower quality educational environments and
one might argue that older investors would have stale and relatively less accurate knowledge
about investment concepts such as diversification. But we have shown earlier that older
investors exhibit greater knowledge about investing and their investment choices are more
aligned with several other common investing rules of thumb. Only when we examine their
diversification “skill”, we find that older investors make relatively worse choices. Further-
more, older investors trade less, they are more likely to engage in tax-loss selling and, in
general, exhibit a greater propensity to follow investing “rules of thumb.” Yet, they earn
lower risk-adjusted returns.
26

These findings are consistent with our cognitive aging hypothesis but it is almost im-
possible to conceive a hypothesis based on cohort effects that posits opposite effects of age
in rules of thumb and skill regressions. It is also very difficult to attribute the opposite
effects of age in the two contexts to time effects. Therefore, the coefficient estimates of age
with opposite signs in the rules of thumb and skill regressions not only provides evidence
consistent with our main hypothesis, they also help alleviate potential concerns about time
or cohort effects contaminating our results.
Second, as shown in Figure 1, cohort-based explanations for the abrupt and sudden drop
in performance at older age are unlikely to be very convincing. Third, cohort effects cannot
successfully account for the inverted U-shaped relation between age and investment skill. In
contrast, all these findings are strongly consistent with the cognitive aging hypothesis and
reflect the natural outcome of the joint aging and learning processes.
In spite of our novel identification strategy based on economic reasoning, we follow
Poterba and Samwick (1997) and attempt to directly control for cohort effects in our cross-
sectional regressions by using cohort-range dummy variables. We consider five cohort ranges:
Below 35, 35-45, 45-55, 55-65, and above 65. In untabulated results, we find that the age-
range dummies have negative but insignificant coefficient estimates in all our specifications.
More importantly, the coefficient estimates of age, experience, and other interaction vari-
ables that provide evidence in support of our main hypothesis remain significant. In fact,
the coefficient estimate of Age (see column (6) in Table V) becomes stronger (coefficient
= −0.082, t-stat = −3.129).
We also find that the change in performance between the first and the second halves of
the sample period exhibits an inverted U-shaped pattern (see Figure 1). The older investors
experience a greater decline in performance and similar to the age-skill relation, there is a
sharp decline at very old age. This evidence is consistent with the cognitive aging hypothesis
and does not suffer from potential contamination from cohort effects because differencing
eliminates the common cohort effects (McKenzie (2006)). Overall, these results indicates
that cohort effects are not the main driver of the negative age-skill relation.
To further ensure the robustness and the accuracy of our identification strategy, we iden-
tify a scenario where cohort effects do not make a meaningful prediction but the cognitive
aging hypothesis makes a sharp prediction. Specifically, we assume that portfolio size is a
proxy for task difficulty and examine the effect of portfolio size on portfolio performance
27
differential that we attribute to cognitive aging. When an investor actively manages a larger
portfolio that requires greater attention and cognitive capacity, the cognitive aging hypoth-
esis predicts that the possibility of making mistakes would be greater among older investors.
Consequently, the performance differential between younger and older investors would in-
crease with portfolio size. In contrast, there is no obvious birth cohort based prediction for
the variation in performance differential with portfolio size.
When we include Portfolio Size * Age interaction variable in the skill regression specifi-
cation (column (6) in Table V), it has a significantly negative coefficient estimate (estimate
= −0.032, t-stat = −3.987), while the estimates of other variables in the model remain
almost unchanged. Thus, consistent with the cognitive aging hypothesis, older investors
exhibit greater risk-adjusted performance when they hold larger portfolios that are more
difficult to manage.
6. Economic Costs of Cognitive Aging
6.1. A Portfolio Based Approach
To quantify the economic costs associated with cognitive aging more accurately, we conduct
portfolio-based, time-series tests. An additional advantage of the portfolio-based analysis
is that it is insensitive to concerns about potential cross-sectional dependence in portfolio
performance.
We proceed as follows: First, we follow the standard imputation methodology (e.g.,
Skinner (1987), Ziliak (1998), Browning and Leth-Petersen (2003)) and use the previously
estimated model of cognitive abilities (see Section 5.2 and Table VI) to obtain an imputed
cognitive ability measure for each investor. We regress this imputed cognitive ability measure
on investment experience and obtain a residual cognitive ability measure that is orthogonal
to experience. Next, we sort investors into deciles based on their residual cognitive ability
measures, where group 1 consists of investors with low cognitive ability and group 10 consists
of investors with high cognitive abilities. Last, we examine the average performance of
investors in the ten cognitive ability categories and estimate the economic costs of aging.
We find that investors in the lowest cognitive ability decile earn a mean monthly re-
turn of 0.984%, investors in the highest cognitive ability decile earn a mean monthly return
28

of 1.264%, and the annualized performance differential of 3.360% (12 × (1.264 − 0.984)) is
statistically significant (t-stat = 2.181). The performance differentials are of similar magni-
tudes when we measure the risk-adjusted performance using the four-factor alpha (annualized
performance differential = 3.240%, t-stat = 2.762) or the characteristic-adjusted returns (an-
nualized performance differential = 3.363%, t-stat = 2.827). These performance estimates
indicate that the economic costs of cognitive aging are significant.
Examining the factor exposures of the cognitive ability sorted portfolios, we find that
high cognitive ability investors hold relatively riskier, smaller, and growth-oriented portfo-
lios. For instance, the four factor exposures (RMRF , SMB, HML, and UMD) for the
lowest cognitive ability decile portfolio are 1.083, 0.571, 0.314, and −0.218, respectively. In
contrast, for the highest cognitive ability decile portfolio, the corresponding factor exposures
are 1.219, 0.677, 0.112, and −0.299, respectively. These factor exposure estimates are statis-
tically significant and the factor estimate differences between the high and the low cognitive
ability decile portfolios are also significant. This evidence is consistent with the evidence on
investors’ style preferences, conditional upon age (see Section 4.1 and Table II).
To examine whether the economic costs of aging are also economically significant for
investors who hold larger portfolios, we compute the risk-adjusted performance measures,
conditional upon portfolio size.38 The results are shown in Figure 2. We find that the
economic cost of cognitive aging increases with portfolio size. As portfolio size increases,
high (quintile 5) cognitive ability investors perform better, low (quintile 1) cognitive ability
investors do worse, and the performance gap becomes wider. When portfolio size is below
$10,000, the annualized characteristic-adjusted return differential is 1.725% and it increases
to 5.012% when the portfolio size is above $50,000. When we use the four-factor alpha as
the performance measure, the cognitive aging related performance differentials for small,
mid-sized, and large portfolios are 2.148%, 2.407%, and 4.613%, respectively.
Collectively, the results from portfolio-based time-series tests indicate that investors who
do not experience the adverse effects of cognitive aging (as predicted by our empirical model
of cognitive abilities) earn superior risk-adjusted returns. Importantly and somewhat sur-
prisingly, the economic costs of cognitive aging are larger among investors who hold larger
portfolios. Those investors are less likely to hold significant positions outside their brokerage
38The results are very similar when we compute conditional performance measures using the ratio of themean portfolio size to the annual income as the conditioning variable.
29

accounts, especially during the sample period when the median number of brokerage ac-
counts varied between one and two.39 The performance differentials measured in percentage
terms might not appear alarming. But because older investors hold larger portfolios, the
economic costs are even more significant when measured in dollar terms.
6.2. Identifying the Components of Stock Selection Ability
To better understand how high cognitive ability investors generate superior portfolio per-
formance, we use the Daniel, Grinblatt, Titman, and Wermers (1997) and Wermers (2003)
decomposition to estimate the three components of stock selection skill: characteristic se-
lectivity (CS), characteristics timing (CT ), and average style (AS). A positive estimate for
CS reflects stock selection ability within the style portfolios while a positive CT estimate
provides evidence of style timing.
As before, we sort investors into five or ten categories based on their residual cognitive
ability measures and compute the CS, CT , and AS measures for each of the quintile or decile
portfolios. We find that high cognitive ability investors exhibit greater ability to pick stocks
within the styles. When we consider five portfolios, the annual CS measures for the lowest
and the highest cognitive ability quintile portfolios are −0.496% and 0.660%, respectively,
and the difference of 1.156% is significant. As expected, the performance differential is
stronger (= 1.920%) when we consider decile portfolios.
Examining the CT estimates for the cognitive ability sorted portfolios, we find that CT
estimates are uniformly negative for all portfolios. Thus, both high and low cognitive ability
investors lack characteristic timing abilities. However, the low cognitive ability investors
have more negative CT measure and exhibit worse timing abilities. For instance, the annual
CT measure for the lowest and the highest decile portfolios are −2.001% and −1.156%,
respectively, and the difference is positive (= 0.845%).
The AS estimates for the cognitive ability sorted portfolios exhibit less variation and are
quite similar. Nevertheless, the performance difference between the highest and the lowest
cognitive ability categories is positive. When we consider quintile portfolios, the annual
AS differential is 0.292% and when we consider decile portfolios, the differential is 0.429%.
39According to the 1992 Survey of Consumer Finances (SCF), the median U.S. household held only onebrokerage account (mean = 1.57) in 1992 (about 62% of households had only one brokerage account) andthe 1995 SCF indicates that the median number of brokerage accounts increased to two (mean = 2.62) in1995.
30

Overall, the performance differentials between the highest and the lowest cognitive ability
investor categories with quintile and decile portfolios are 1.949% and 3.195%, respectively.
6.3. Adverse Effects of Aging or Just Unlucky?
While we have used multiple risk-adjusted performance measures to obtain “style adjusted”
portfolio performance, given our relatively short sample size, one might argue that the per-
formance differences reflect systematic age-induced style differences rather than the adverse
effects of cognitive aging. For instance, the style or industries (e.g., the technology sector)
favored by investors with higher cognitive abilities might have yielded exceptional returns
during the six-year sample period. Thus, it is possible that older investors do not have poor
stock picking skills but rather the styles chosen by them performed poorly during the sample
period due to chance.
To address these potential concerns, we extend the performance measurement period both
backward and forward by k-months using investors’ portfolio compositions in January 1991
and November 1996, respectively. The extended period performance estimates are shown in
Figure 3. We find that the performance differential between high and low cognitive ability
investors is significant even during the extended sample periods. For k = 24, 36, 48, and
60, the characteristic-adjusted annual performance differentials are 2.232%, 2.901%, 2.543%,
and 2.351%, respectively. While these estimates are lower than the in-sample performance
differential estimate of 3.363%, they are economically significant and indicate that our per-
formance results cannot be attributed to the exceptional performance of certain style or
industries during the six-year sample period.
7. Alternative Explanations and Additional Robustness Tests
In this section, we conduct a wide array of tests to examine the robustness of our results
and attempt to further rule out alternative interpretations of our findings. The results are
summarized in Table VII, where for brevity, we only report the estimates for the variables
that are most closely related to our hypotheses.
31

7.1. Investment Skill Measure using Investors’ Trades
Although our skill measures capture different dimensions of investment skill, they are not
orthogonal to each other. For additional robustness, we compute a skill measure that is not
strongly correlated with our previous skill measures. An additional advantage of this skill
measure is that it does not depend upon our ability to observe investors’ entire financial
portfolios.
Our choice is motivated by Odean (1999) and Barber and Odean (2001), who use a
similar measure to identify the stock selection ability of investors. Specifically, we use the
mean k-day post-trade buy-sell return differential (PTBSD(k)) as a measure of investment
skill. The trading based performance measure reflects the belief that investors who have
superior stock selection ability are likely to buy stocks that perform better than the stocks
they sell. We choose two different values of k (k = 5 and 10), because using the same
dataset as ours, Coval, Hirshleifer, and Shumway (2002) show that the trading performance
of individual investors declines after about two weeks. The maximum correlation between
the PTBSD measures and the previously employed skill measures is only 0.012 in absolute
terms.
The skill regression estimates with trading based skill measures are summarized in Panel
A. Similar to the results from previous skill measures, we find that the Age and Investment
Experience have opposite signs, both when PTBSD(5) and PTBSD(10) are used as depen-
dent variables. The interaction terms mostly have the expected signs, though their estimates
are statistically weaker. Thus, older investors trade less (see Table IV) but when they do
trade, they make worse buy and sell decisions. The stocks they purchase underperform the
stocks they sell by a larger magnitude. This evidence provides additional and independent
support to our unconditional (H2) and conditional (H2cond) hypotheses.
7.2. Cognitive Aging and Market Timing Skill
Next, we examine investors’ market timing abilities using the two Graham-Harvey perfor-
mance metrics (Graham and Harvey (1996), Graham and Harvey (1997)). We re-estimate
the skill regression and the results are reported in Panel B. Again, we find that, in both
instances, age and investment experience maintain their opposite signs. Moreover, the in-
teraction term estimates are very similar to the respective estimates in the alpha regression
32

(see Table V, column (4)). Thus, consistent with our main hypothesis, market timing skill
improves with experience but deteriorates with age due to the adverse effects of cognitive
aging.
7.3. Split Sample Tests
The 1991 to 1996 sample period encapsulates two distinct market conditions: (i) a relatively
flat market during the first half of the sample period, following the 1990 NBER recession, and
(ii) an increasing market during the second half of the sample period, representing the start
of the “bubble” period. One might be concerned that the negative age-skill relation we find
results from the relatively conservative (i.e., less risky) investments by older investors during
bullish market conditions. To examine whether the adverse effects of cognitive aging are
significant during both periods of weak and strong stock market performance, we estimate the
skill regression for the 1991 to 1993 and the 1994 to 1996 sub periods using the characteristic-
adjusted portfolio returns. We use the characteristic-adjusted performance measures because
the four-factor alpha estimates would be noisier with only three years of data.
The skill regression estimates for the two sub samples are summarized in Panel C. We
find evidence of adverse effects of cognitive aging and positive effects of learning during both
time-periods. Both age and experience variables have significant coefficient estimates. Inter-
estingly, the age-race/ethnicity interaction terms have statistically insignificant coefficient
estimates in the full-sample regression but they have the expected negative signs during
the 1994 to 1996 sub period. Overall, the sub sample estimates indicate that the negative
age-skill relation we find cannot be attributed to the bullish market conditions during the
latter part of the sample period.
7.4. Differential Skill in Identifying Superior Local Stocks
Ivkovic and Weisbenner (2005) show that, on average, the local stock investments of indi-
vidual investors perform better than their non-local investments. To examine whether the
negative age-skill relation hold in both local and non-local settings, we compute the four-
factor alpha for each investor’s local portfolio. The local portfolio represents the part of
the portfolio that contains stock investments in firms located within a 100 mile radius of
33

investor’s location.40 We re-estimate the skill regressions using the local alpha measure as
the dependent variable. The correlation between the local and the total alpha measures is
positive (0.513) but not very high.
The skill regression estimates are reported in Panel D. Again, consistent with our main
conjecture, we find that age and investment experience estimates have opposite signs. More-
over, the age-race/ethnicity interaction terms have negative coefficient estimates. The Age*Low
Income and Age*Low Education interaction terms have the expected negative signs but those
estimates are not statistically significant. The local alpha regression estimates indicate that
older investors also experience the adverse effects of cognitive aging even with their local
stock investment decisions.
7.5. Do Skill Differences Reflect Noisy Risk Adjusted Performance Estimates?
One might be concerned that our alpha measure is noisy due to the relatively short estimation
period and because investors in our sample hold relatively concentrated portfolios with fewer
stocks. To address this potential concern, we re-estimate the cross-sectional skill regression
for two sub samples: (i) only consider investors with statistically significant (t-statistic ≥1.95) alpha estimates, and (ii) only consider investors who have at least 60 months of returns
data. These skill regression estimates are also reported in Panel D. For both sub samples, we
find that the coefficient estimates are consistent with our unconditional (H2) and conditional
(H2cond) hypotheses. In fact, the adverse effects of cognitive aging are stronger (the age
coefficient estimates are more negative) in both sub samples.
7.6. Investment Skill Measure with Controls for Liquidity and Industry Exposures
To ensure that our results are not influenced by the exceptional performance of certain styles
or industries during the relatively short six-year sample-period, we measure investment skill
using extended sample periods (see Section 6.3). To further alleviate such concerns, we follow
the Pastor and Stambaugh (2002) and Pastor and Stambaugh (2003) methodologies and
compute portfolio alphas after employing controls for industry exposures and liquidity. We
estimate skill regressions using this eight-factor alpha. The results are reported in Panel D.
40Following Ivkovic and Weisbenner (2005), we choose the 100-mile cutoff to define local and non-localportfolio components, but the results are similar when we use a 250-mile cutoff.
34

We find that Age is still negatively related to investment skill (coefficient estimate = −0.047,
t-stat = −3.745), while Investment Experience is still positively related to investment skill
(coefficient estimate = 0.022, t-stat = 2.314). Furthermore, the interaction terms maintain
their negative coefficient estimates.
For additional robustness, we follow an alternative approach to control for the effects
of industries. For each investor, we compute the mean portfolio weight allocated to the
48 Fama-French industries (Fama and French (1997)) and employ them as additional inde-
pendent variables in the skill regressions. As expected, we find that many of these industry
weights have large and significant coefficient estimates. For instance, technology stocks in the
electronic equipment industry has a strong positive coefficient estimate (estimate = 0.114,
t-stat = 10.254) while utilities industry has a strong negative coefficient estimate (estimate
= −0.152, t-stat = −12.773). However, the age, experience, and relevant interaction vari-
ables still maintain their signs and statistical significance. Thus, the exceptional performance
of one or more industries does not seem to considerably influence our skill regression esti-
mates.
7.7. Lack of Skill or Lack of Effort?
One might argue that the negative skill-aging relation we find is not too surprising or eco-
nomically meaningful because the portfolios we analyze represent investors’ “play money”
accounts meant primarily for gambling and entertainment purposes. The bulk of investors’
actual investments including their retirement accounts are held elsewhere, which we cannot
observe.
To examine whether the weaker investment skill of older investors can be attributed to
their lack of interest in their brokerage portfolios, we consider a sub sample of investors who
hold larger portfolios in comparison to their income levels. Specifically, we re-estimate the
skill regressions for the sub sample of investors whose mean portfolio size to annual income
ratio (i.e., SIR) is greater than or equal to 1.23 (the top two-third of investors). These
equity portfolios are unlikely to represent investors’ “play money” accounts and are unlikely
to be ignored.
The skill regression estimates for the large portfolio sub sample are summarized in Panel
E. We find that the sub sample coefficient estimates are similar to the full sample results. For
35

instance, Age has a coefficient estimate of −0.053 (t-stat = −4.759) and Investment Experi-
ence has a coefficient estimate of 0.018 (t-stat = 1.996) in the alpha regression. Additionally,
two of the four interaction terms have the expected negative signs.
7.8. Are the Results Driven by Investors Located in California?
Our results might be influenced by the strong concentration of investors from California
because a considerable portion (27.25%) of our sample is located in California. To guard
against this possibility, we exclude all investors who reside in California and re-estimate the
skill regressions. The results for the non-Californian sub sample are summarized in Panel E.
Again, we find that the sub sample coefficient estimates are similar to the full sample results
and portray a similar picture. Age has a coefficient estimate of −0.044 (t-stat = −2.797)
and Investment Experience has a coefficient estimate of 0.017 (t-stat = 2.651) in the alpha
regression.
Collectively, our additional robustness test results indicate that the empirical support
for the unconditional (H2) and conditional (H2cond) hypotheses is strong and the results
are remarkably consistent with the extant psychological evidence. Our findings are not
sensitive to the choice of skill measures, potential error in skill measurement, choice of the risk
adjustment methodology, specific market conditions, investors’ lack of interest in relatively
small brokerage portfolios, and the geographical concentration of our sample investors.
8. Summary and Implications of Our Research
This is the first study to examine the potential role of cognitive aging on the stock investment
decisions of older investors. We investigate whether older individual investors make better
investment choices because of greater investment experience or whether their investment
skill deteriorates with age due to the adverse effects of cognitive aging. This is an important
issue that has implications for how individual investors should structure their portfolios over
time, the type of investment advice they should seek over their lifetime, and the potential
effects of changes in government policy on investment generated retirement income.
Our evidence indicates that older and more experienced investors hold less risky portfo-
lios, exhibit stronger preference for diversification, trade less frequently, and exhibit greater
36

propensity for year-end tax-loss selling. Thus, their choices reflect greater knowledge about
investing. But consistent with the cognitive aging hypothesis, we also find that older in-
vestors have worse investment skill, where the skill deteriorates sharply around the age of
70. Examining the economic costs of aging, we find that older investors earn about 3-5%
lower returns annually on a risk-adjusted basis. Collectively, our evidence indicates that
older investors’ portfolio choices reflect greater knowledge about investing but their invest-
ment skill deteriorates with age due to the adverse effects of cognitive aging.
These results could potentially be used to improve the investment decisions of older in-
vestors. We do not prescribe that older investors should stop making independent investment
decisions. Rather, based on the evidence, our hope is that older people would recognize the
adverse effects of cognitive aging and would try to compensate for those effects, perhaps
by seeking advice from a financial advisor or some other qualified investment professional.
An investment refresher course that highlights the adverse effects of cognitive aging and
suggests effective compensating mechanisms might also be helpful. This may especially be
a wise decision if an investor holds portfolios larger than those examined in this study. Fur-
thermore, the performance results indicate that while most investors in our sample would
benefit from holding a passive index fund, the potential benefits of passive investing are
likely to be greater for older investors.
In broader terms, our findings could help us better understand the stock market par-
ticipation puzzle. Theoretical models typically have the greatest difficulty in explaining
the participation rates in the extreme age categories (e.g., Gomes and Michaelides (2005)).
Based on our findings, we conjecture that younger investors would stay away from the stock
market due to their lack of investment experience, while older investors would be less willing
to participate due to a perception of declining cognitive abilities. A theoretical model that
synthesizes the positive effects of experience and adverse effects of cognitive aging may pro-
vide a fresh perspective into the stock market participation and the broad asset allocation
decisions over the life-cycle.
Our empirical evidence also provides specific guidance for refining asset pricing models
that incorporate the effects of aging. Previous theoretical models have examined the aggre-
gate effects of aging on the stock market behavior (e.g., Bakshi and Chen (1994), Poterba
(2001), Goyal (2004)) through the channel of risk aversion. Our results indicate that age is
likely to influence asset returns through an additional channel. Specifically, if older investors
37

become aware of their declining investment skill, the perceived costs for stock market par-
ticipation would increase, and those investors would demand a higher premium for investing
in the stock market. In this scenario, stock market returns could increase as the population
ages, even when there is no substantial increase in people’s risk aversion. Additionally, our
evidence on the stock preferences of older investors provide guidance about the segments of
the market (e.g., high dividend yield and less risky stocks), where the effects of aging on
stock returns are likely to be stronger.
We conclude the paper with a caveat. Although our results are strongly consistent with
the cognitive aging hypothesis, some amount of caution must be exercised while interpreting
this evidence because we cannot directly measure the degree of cognitive decline among
older investors. In addition, because we use a relatively short six-year panel to identify the
adverse effects of cognitive aging, in spite of our numerous attempts to rule out alternative
explanations for our results based on cohort and time effects, some concerns might remain.
Nevertheless, given the remarkable similarities between our results and the evidence from
psychological research on aging, the footprints of cognitive aging in investment decisions
appear strong and quite difficult to ignore.
38

References
Agarwal, Sumit, John C. Driscoll, Xavier Gabaix, and David Laibson, 2007, The age of
reason: Financial decisions over the life cycle, Working Paper (March), Harvard University
and MIT.
Ameriks, John, and Stephen Zeldes, 2004, How do household portfolios shares vary with
age?, Working paper (September), Graduate School of Business, Columbia University.
Arbuckle, Tannis Y., Dolores Gold, and David Andres, 1986, Cognitive functioning of older
people in relation to social and personality variables, Journal of Psychology and Aging 1,
55–62.
Avolio, Bruce J., and David A. Waldman, 1986, Variation in cognitive, perceptual and
psychomotor abilities across the working life span: Examining the effects of race, sex,
experience, education, and occupational type, Journal of Psychology and Aging 1, 55–62.
Bailey, Warren, Alok Kumar, and David Ng, 2006, Foreign investments of U.S. individual
investors: Causes and consequences, Working paper (December), Cornell University and
University of Texas at Austin.
Bakshi, Gurdip S., and Zhiwu Chen, 1994, Baby boom, population aging, and capital mar-
kets, Journal of Business 67, 165–202.
Baltes, Margaret M., and Frieder R. Lang, 1997, Everyday functioning and successful aging:
The impact of resources, Psychology and Aging 12, 433–443.
Baltes, Paul B., and Ulman Lindenberger, 1997, Emergence of a powerful connection between
sensory and cognitive functions across the adult life span: A new window to the study of
cognitive aging?, Psychology and Aging 12, 12–21.
Banks, James, Richard Blundell, and Sarah Tanner, 1998, Is there a retirement-savings
puzzle?, American Economic Review 88, 769–788.
Barber, Brad M., and Terrance Odean, 2000, Trading is hazardous to your wealth: The
common stock investment performance of individual investors, Journal of Finance 55,
773–806.
39
, 2001, Boys will be boys: Gender, overconfidence, and common stock investment,
Quarterly Journal of Economics 116, 261–292.
, 2007, All that glitters: The effect of attention and news on the buying behavior of
individual and institutional investors, Review of Financial Studies Forthcoming.
Bernheim, Douglas, Jonathan Skinner, and Steven Weinberg, 2001, What accounts for the
variation in retirement wealth among U.S. households?, American Economic Review 91,
832–857.
Black, Sheila, 2004, Cognitive functioning among African American older adults, African
American Research Perspectives 10, 106–118.
Browning, Martin, and Soren Leth-Petersen, 2003, Imputing consumption from income and
wealth information, Economic Journal 113, F282–301.
Cagney, Kathleen A., and Diane S. Lauderdale, 2002, Education, wealth, and cognitive
function in later life, Journal of Gerontology 57B, 163–172.
Calvet, Laurent E., John Y. Campbell, and Paolo Sodini, 2005, Down or out: Assessing
the welfare costs of household investment mistakes, Working Paper (November), Harvard
University.
Campbell, John Y., 2006, Household finance, Journal of Finance 61, 1553–1604.
, and Luis M. Viceira, 2002, Strategic Allocation: Portfolio Choice for the Long-Term
Investor (Oxford University Press, New York, NY).
Chevalier, Judith, and Glenn Ellison, 1999, Are some mutual fund managers better than
others? Cross-sectional patterns in behavior and performance, Journal of Finance 54,
875–899.
Christelis, Dimitris, Tullio Jappelli, and Mario Padula, 2006, Cognitive abilities and portfolio
choice, CEPR Working Paper # 5735.
Cocco, Joao F., Francisco J. Gomes, and Pascal J. Maenhout, 2005, Consumption and
portfolio choice over the life cycle, Review of Financial Studies 18, 491–533.
40
Constantinides, George M., 1983, Capital market equilibrium with personal tax, Economet-
rica 51, 611–636.
, 1984, Optimal stock trading with personal taxes: Implications for prices and the
abnormal January returns, Journal of Financial Economics 13, 65–89.
Coval, Joshua D., David Hirshleifer, and Tyler Shumway, 2002, Can individual investors
beat the market?, Working Paper (December), Harvard Business School.
Craik, Fergus I. M., and Timothy A. Salthouse, 1992, Handbook of Aging and Cognition
(Erlbaum, Hillsdale, NJ).
Daniel, Kent D., Mark Grinblatt, Sheridan Titman, and Russell Wermers, 1997, Measuring
mutual fund performance with characteristic-based benchmarks, Journal of Finance 52,
1035–1058.
Daniel, Kent D., and Sheridan Titman, 1997, Evidence on the characteristics of cross-
sectional variation in stock returns, Journal of Finance 52, 1–33.
Dhar, Ravi, and Ning Zhu, 2006, Up, close and personal: An individual level analysis of the
disposition effect, Management Science Forthcoming.
Driscoll, John C., and Aart C. Kraay, 1998, Consistent covariance matrix estimation with
spatially dependent panel data, Review of Economics and Statistics 80, 549–560.
Fair, Ray C., 1994, How fast do old men slow down?, The Review of Economics and Statistics
76, 103–118.
, 2004, Estimated physical and cognitive aging effects, Cowles Foundation Discussion
Paper # 1495, Yale University.
Fama, Eugene F., and Kenneth R. French, 1997, Industry costs of capital, Journal of Finan-
cial Economics 43, 153–193.
Fama, Eugene F., and James D. MacBeth, 1973, Risk, return, and equilibrium: Empirical
tests, Journal of Political Economy 81, 607–636.
Feng, Lei, and Mark S. Seasholes, 2005, Do investor sophistication and trading experience
eliminate behavioral biases in financial markets?, Review of Finance 9, 305–351.
41

Goetzmann, William N., and Alok Kumar, 2005, Why do individual investors hold under-
diversified portfolios?, Working Paper (November), University of Texas at Austin and Yale
International Center of Finance.
Goetzmann, William N., Lingfeng Li, and K. Geert Rouwenhorst, 2005, Long-term global
market correlations, Journal of Business 78, 1–38.
Gomes, Francisco, and Alexander Michaelides, 2005, Optimal life-cycle asset allocation: Un-
derstanding the empirical evidence, Journal of Finance 60, 869–904.
Goyal, Amit, 2004, Demographics, stock market flows and stock returns, Journal of Financial
and Quantitative Analysis 39, 115–142.
Grady, Cheryl L., and Fergus I.M. Craik, 2000, Changes in memory processing with age,
Current Opinion in Neurobiology 10, 224–231.
Graham, John R., and Campbell R. Harvey, 1996, Market timing ability and volatility
implied in investment newsletters’ asset allocation recommendations, Journal of Financial
Economics 42, 397–421.
, 1997, Grading the performance of market timing newsletters, Financial Analysts
Journal 53, 54–66.
Graham, John R., and Alok Kumar, 2006, Do dividend clienteles exist? Evidence on dividend
preferences of retail investors, Journal of Finance 61, 1305–1336.
Heaton, Angus, 1997, The Analysis of Household Surveys: A Microeconometric Approach to
Development Policy (The Johns Hopkins University Press, Baltimore, MD).
Horn, John L., 1968, Organization of abilities and the development of intelligence, Psycho-
logical Review 75, 242–259.
Ivkovic, Zoran, James Poterba, and Scott Weisbenner, 2005, Tax-motivated trading by in-
dividual investors, American Economic Review 95, 1605–1630.
Ivkovic, Zoran, Clemens Sialm, and Scott Weisbenner, 2007, Portfolio concentration and
the performance of individual investors, Journal of Financial and Quantitative Analysis
Forthcoming.
42

Ivkovic, Zoran, and Scott Weisbenner, 2005, Local does as local is: Information content of
the geography of individual investors’ common stock investments, Journal of Finance 60,
267–306.
Kumar, Alok, 2006, Who gambles in the stock market?, Working paper (July), McCombs
School of Business, University of Texas at Austin.
Lim, Sonya Seongyeon, 2006, Do investors integrate losses and segregate gains? Mental
accounting and investor trading decisions, Journal of Business 79, 2539–2573.
Lindenberger, Ulman, and Paul B. Baltes, 1994, Sensory functioning and intelligence in old
age: A strong connection, Psychology and Aging 9, 339–355.
, 1997, Intellectual functioning in old and very old age: Cross-sectional results from
the Berlin aging study, Psychology and Aging 12, 410–432.
List, John A., 2003, Does market experience eliminate market anomalies?, Quarterly Journal
of Economics 118, 41–71.
Masunaga, Hiromi, and John Horn, 2001, Expertise and age-related changes in components
of intelligence, Psychology and Aging 16, 293–311.
McKenzie, David J., 2006, Disentangling age, cohort, and time effects in the additive model,
Oxford Bulletin of Economics and Statistics 68, 473–495.
Merton, Robert C., 1969, Lifetime portfolio selection under uncertainty: The continuous
time case, Review of Economics and Statistics 51, 247–257.
Mossin, Jan, 1968, Optimal multiperiod portfolio policies, Journal of Business 41, 215–229.
Odean, Terrance, 1998, Are investors reluctant to realize their losses?, Journal of Finance
53, 1775–1798.
, 1999, Do investors trade too much?, American Economic Review 89, 1279–1298.
Pastor, Lubos, and Robert F. Stambaugh, 2002, Mutual fund performance and seemingly
unrelated assets, Journal of Financial Economics 63, 315–349.
43

, 2003, Liquidity risk and expected stock returns, Journal of Political Economy 111,
642–685.
Pontiff, Jeffrey, 1996, Costly arbitrage: Evidence from closed-end funds, Quarterly Journal
of Economics 111, 1135–1151.
Poterba, James M., 2001, Demographic structure and asset returns, Review of Economics
and Statistics 83, 565–584.
, and Andrew A. Samwick, 1997, Household portfolio allocation over the life cycle,
NBER Working Paper 6185.
Reynolds, Rachel, 2005, Can we afford to grow old?, Notre Dame Business 11, 12–18.
Salthouse, Timothy A., 2000, Aging and measures of processing speed, Biological Psychology
54, 35–54.
Samuelson, Paul A., 1969, Lifetime portfolio selection by dynamic stochastic programming,
Review of Economics and Statistics 51, 239–243.
, 1991, Long-run risk tolerance when equity returns are mean regressing: Pseudo-
paradoxes and vindication of businessman’s risk, in W. Brainard, W. Nordhaus and H.
Watts (editors), Money, Macroeconomics and Econominc Policy (The MIT Press), 213-
234.
Schroeder, David H., and Timothy A. Salthouse, 2004, Age-related effects on cognition
between 20 and 50 years of age, Personality and Individual Differences 36, 393–404.
Shanan, J., and R. Sagiv, 1982, Sex differences in intellectual performance during middle
age, Human Development 25, 24–33.
Skinner, Jonathan, 1987, A superior measure of consumption from the panel study of income
dynamics, Economic Letters 23, 213–216.
Spaniol, Julia, and Ute J. Bayen, 2005, Aging and conditional probability judgements: A
global matching approach, Psychology and Aging 20, 165–181.
44

Wermers, Russ, 2003, Is money really ‘smart’? New evidence on the relation between mutual
fund flows, manager behavior, and performance persistence, Working Paper (November),
University of Maryland.
Wooldridge, Jeffrey, 2002, Econometric Analysis of Cross Section and Panel Data (MIT
Press, Cambridge, MA).
Zhu, Ning, 2006, Search costs and household choice between direct and delegated portfolio
management, Working Paper (October), University of California at Davis.
Ziliak, James P., 1998, Does the choice of consumption measure matter? An application to
the permanent-income hypothesis, Journal of Monetary Economics 41, 201–216.
45

Table I
Summary Statistics: Age Sorted Investor Groups
This table reports the summary statistics for age sorted investor groups. Portfolio size is the mean portfoliosize of the investors in the group during the sample period. Income is the annual household income andwealth is the self-reported net worth reported at the account opening date. SIR is the portfolio size toincome ratio, and SWR is the portfolio size to wealth ratio. Investment experience is the number of yearsbetween the account opening date and December 31, 1996. In Panel A, we report the measures for the fiveage quintiles. We further divide the 60-94 age group (the highest age quintile) into quintiles and present thesummary statistics in Panel B. In Panel A (Panel B), there are 5,404 (1,351) observations in each group.The retail investor data are from a large U.S. discount brokerage house for the period from 1991 to 1996.
Panel A: All Investors
Age Group Portfolio Size Income Wealth SIR SWR Experience
Q1 (20-38) $23,372 $90,146 $196,765 0.414 0.283 8.46
Q2 (39-46) $23,372 $98,619 $243,081 0.377 0.246 9.68
Q3 (47-52) $29,270 $101,086 $247,701 0.462 0.304 9.92
Q4 (53-59) $32,543 $93,363 $296,595 0.554 0.298 10.01
Q5 (60-94) $49,274 $70,700 $360,403 1.096 0.346 10.49
Mean $31,566 $90,782 $268,909 0.581 0.295 9.71
Panel B: Investors With Age 60 or Above
Age Group Portfolio Size Income Wealth SIR SWR Experience
Q1 (60-62) $37,652 $87,134 $340,955 0.599 0.293 9.85
Q2 (63-64) $39,678 $74,890 $356,931 0.765 0.322 10.39
Q3 (65-70) $48,416 $72,833 $409,153 1.040 0.313 10.33
Q4 (71-74) $48,556 $67,574 $350,882 0.984 0.338 10.45
Q5 (75-94) $64,526 $64,111 $334,917 1.469 0.464 10.87
46
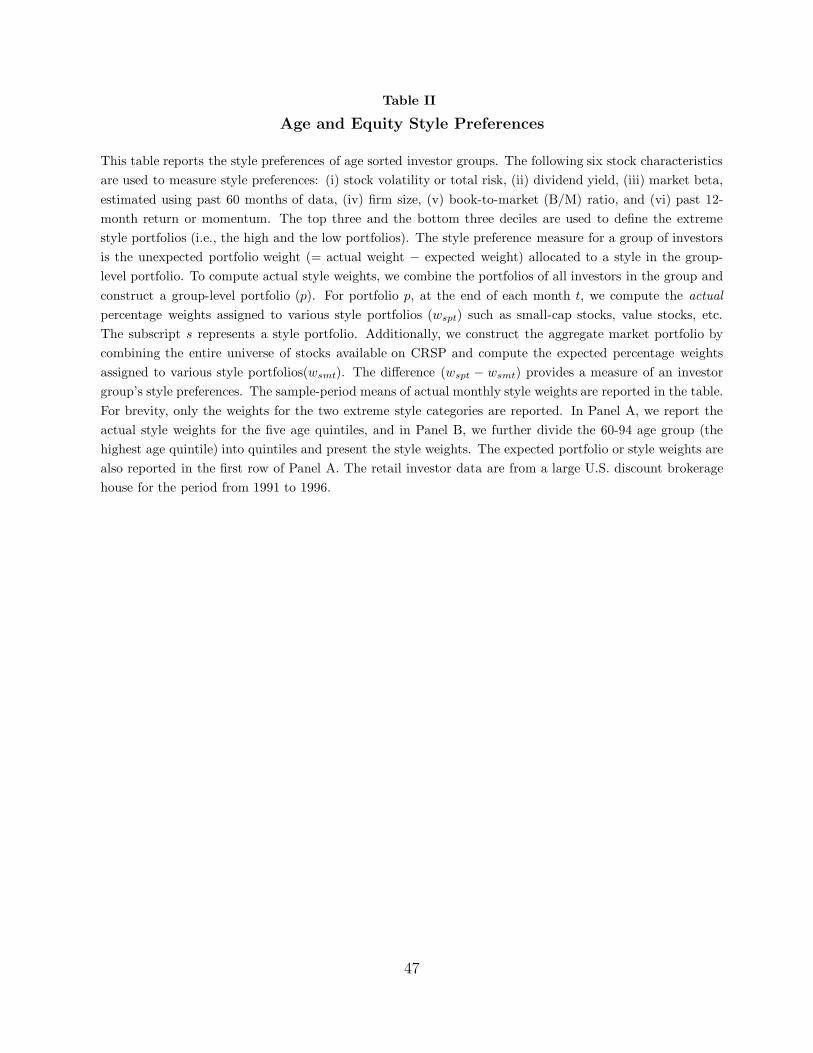
Table II
Age and Equity Style Preferences
This table reports the style preferences of age sorted investor groups. The following six stock characteristicsare used to measure style preferences: (i) stock volatility or total risk, (ii) dividend yield, (iii) market beta,estimated using past 60 months of data, (iv) firm size, (v) book-to-market (B/M) ratio, and (vi) past 12-month return or momentum. The top three and the bottom three deciles are used to define the extremestyle portfolios (i.e., the high and the low portfolios). The style preference measure for a group of investorsis the unexpected portfolio weight (= actual weight − expected weight) allocated to a style in the group-level portfolio. To compute actual style weights, we combine the portfolios of all investors in the group andconstruct a group-level portfolio (p). For portfolio p, at the end of each month t, we compute the actualpercentage weights assigned to various style portfolios (wspt) such as small-cap stocks, value stocks, etc.The subscript s represents a style portfolio. Additionally, we construct the aggregate market portfolio bycombining the entire universe of stocks available on CRSP and compute the expected percentage weightsassigned to various style portfolios(wsmt). The difference (wspt − wsmt) provides a measure of an investorgroup’s style preferences. The sample-period means of actual monthly style weights are reported in the table.For brevity, only the weights for the two extreme style categories are reported. In Panel A, we report theactual style weights for the five age quintiles, and in Panel B, we further divide the 60-94 age group (thehighest age quintile) into quintiles and present the style weights. The expected portfolio or style weights arealso reported in the first row of Panel A. The retail investor data are from a large U.S. discount brokeragehouse for the period from 1991 to 1996.
47

Table II (Continued)
Age and Equity Style Preferences
Panel A: Aggregate Percentage Portfolio Weights For All Investors
Age (1):Total Risk (2):Div Yield (3):Mkt Beta (4):Size (5):B/M (6):Momentum
Group Low High Low High Low High Small Large Growth Value Low High
Exp Wts 76.19 2.15 34.63 24.13 11.74 28.87 4.59 81.45 53.50 11.86 13.54 25.03
20-38 42.34 18.63 30.41 30.84 11.25 44.35 22.13 58.49 50.05 20.24 29.61 27.01
39-46 42.84 18.61 28.97 30.70 11.66 42.26 23.08 56.85 48.61 21.10 29.73 26.30
47-52 44.20 17.64 27.49 32.82 12.27 41.08 22.28 57.87 47.66 21.60 28.66 26.30
53-59 45.13 18.25 26.41 35.01 13.20 39.55 23.00 57.59 47.49 22.32 28.58 25.93
60-94 53.55 15.13 21.29 42.47 17.07 32.82 19.59 61.43 44.25 24.10 26.89 22.97
Panel B: Aggregate Percentage Portfolio Weights For Investors With Age 60 or Above
Age (1):Total Risk (2):Div Yield (3):Mkt Beta (4):Size (5):B/M (6):Momentum
Group Low High Low High Low High Small Large Growth Value Low High
60-62 46.06 18.73 25.44 35.10 15.04 37.27 23.11 57.18 46.52 23.15 28.52 25.58
63-64 51.38 16.43 22.33 39.68 15.17 35.69 20.52 60.27 45.50 23.11 27.25 24.13
65-70 50.90 16.13 23.56 38.91 16.26 34.15 20.84 59.47 45.98 23.26 27.96 23.32
71-74 55.18 13.89 19.76 46.06 18.26 31.28 19.25 61.67 42.83 25.29 26.20 22.53
75-94 57.34 13.77 19.54 46.93 18.80 30.01 17.23 64.57 41.95 25.31 25.66 21.62
48

Table III
Age and Stock Preferences: Panel Regression Estimates
This table reports the panel regression estimates for different age-based investor groups, where the excessweight assigned to a stock in the aggregate group portfolio is the dependent variable. Three aggregate groupportfolios are considered: the aggregate portfolio of younger (age range 20-38), older (age range 60-94),and very old (age range 75-94) investors. The excess portfolio weight allocated to stock i in month t isgiven by: EW ipt = wipt−wimt
wimt× 100, where, wipt is the actual weight assigned to stock i in group portfolio
p in month t and wimt is the weight of stock i in the aggregate market portfolio in month t. The meanreturn, idiosyncratic volatility, skewness, kurtosis, and the price of the stock is used as independent variables.Additionally, the following control variables are employed: (i) market beta, which is estimated using past 60months of data, (ii) firm size, (iii) book-to-market ratio, (iv) short-term momentum (past one-month stockreturn), (v) longer-term momentum (past twelve-month stock return), (vi) an S&P500 dummy which is setto one if the stock belongs to the S&P500 index, and (vii) monthly volume turnover. The t-statistics for thecoefficient estimates are shown in smaller font below the estimates. To account for potential autocorrelationand cross correlation in errors, we use the non-parametric approach of Driscoll and Kraay (1998) and obtaincorrected standard errors. To ensure that extreme values are not affecting our results, we winsorize allvariables at their 0.5 and 99.5 percentile levels. The independent variables have been standardized so thateach variable has a mean of zero and a standard deviation of one. The individual investor data are from alarge U.S. discount brokerage house for the period from 1991 to 1996.
49

Table III (Continued)
Age and Stock Preferences: Panel Regression Estimates
Age Groups
Variable (1):20-38 (2):60-94 (3):75-94 (2)−(1) (3)−(1)
Mean Return −0.118 −0.146 −0.134 −0.016 −0.021
−14.295 −14.293 −13.406 −1.747 −2.356
Idiosyncratic Volatility 0.139 0.128 0.116 −0.046 −0.050
24.124 18.095 16.753 −7.138 −7.880
Skewness 0.052 0.018 −0.019 −0.037 −0.060
11.604 3.254 −3.538 −7.266 −12.018
Kurtosis −0.075 −0.047 −0.015 0.040 0.060
−15.670 −7.984 −2.523 7.513 11.314
Stock Price −0.033 −0.054 −0.055 −0.014 −0.013
−11.268 −14.903 −15.520 −1.213 −0.859
Market Beta 0.095 0.033 0.007 −0.068 −0.081
29.707 8.383 1.881 −19.061 −22.980
Log(Firm Size) −0.128 −0.104 −0.007 0.026 0.115
−31.992 −21.011 −1.348 3.415 26.088
Book-To-Market Ratio −0.058 −0.025 −0.032 0.039 0.033
−19.793 −6.940 −9.199 11.965 10.172
Past 1-Month Stock Return 0.003 0.009 0.010 0.002 0.004
0.882 2.209 2.448 0.685 1.009
Past 12-Month Stock Return 0.001 0.025 0.016 0.014 0.006
0.134 4.607 2.996 2.789 1.286
S&P500 Dummy 0.008 0.067 −0.005 −0.010 −0.011
4.534 20.810 −2.537 −5.039 −5.682
Monthly Turnover 0.062 −0.003 0.053 −0.017 −0.025
23.627 −1.564 16.851 −5.876 −8.604
Month Fixed Effects Yes Yes Yes Yes Yes
Number of Observations 113,269 113,269 113,269 113,269 113,269
Adjusted R2 0.056 0.031 0.011 0.010 0.024
50

Table IV
Age, Investment Experience, and Investment Decisions:“Rule of Thumb” Cross-Sectional Regression Estimates
This table reports the estimates for cross-sectional regressions, where a measure of investment choice reflect-ing a “rule of thumb” is the dependent variable. We consider four different measures: (i) average number ofstocks in the portfolio (NSTKS), (ii) portfolio turnover (TURN), (iii) proportion of “losers” (stock invest-ments where an investor has experienced a loss) realized in the month of December (TAX), and (iv) portfoliodividend yield (PDY). All measures are obtained for each investor using their choices during the sampleperiod. Independent variables: Age corresponds to the head of the household and Investment Experienceis the number of days between the account opening date and December 31, 1996. The Over 70 Dummy isset to one if the investor is at least 70 years old. Income is the total household income. Education representsthe proportion of people in investor’s zip code who has attained a bachelor’s or higher educational degree.The Male Dummy is set to one if the head of the household is male, and the Retired dummy is set to oneif the head of the household is retired. Portfolio Size is the average market capitalization of the householdportfolio, Portfolio Turnover is the average of monthly buy and sell turnovers, and Portfolio Div Yield isthe average dividend yield of the household portfolio. Control variables: The RMRF, SMB, HML, andUMD Exposures are the factor loadings of an investor’s portfolio. These loadings are obtained by fittinga four-factor time-series model to the monthly portfolio returns series of each investor over the period theinvestor is active. Mutual Fund Holdings is the proportion of the equity portfolio allocated to mutual funds.Other details: The t-statistics for the coefficient estimates are shown in smaller font below the estimates.Robust, clustered standard errors are used to account for potential cross-sectional dependence within zipcodes. To ensure that extreme values are not affecting our results, we winsorize all variables at their 0.5 and99.5 percentile levels. The independent variables have been standardized so that each variable has a mean ofzero and a standard deviation of one. The individual investor data are from a large U.S. discount brokeragehouse for the period from 1991 to 1996. The zip code-level education data are from the 1990 U.S. Census.
51
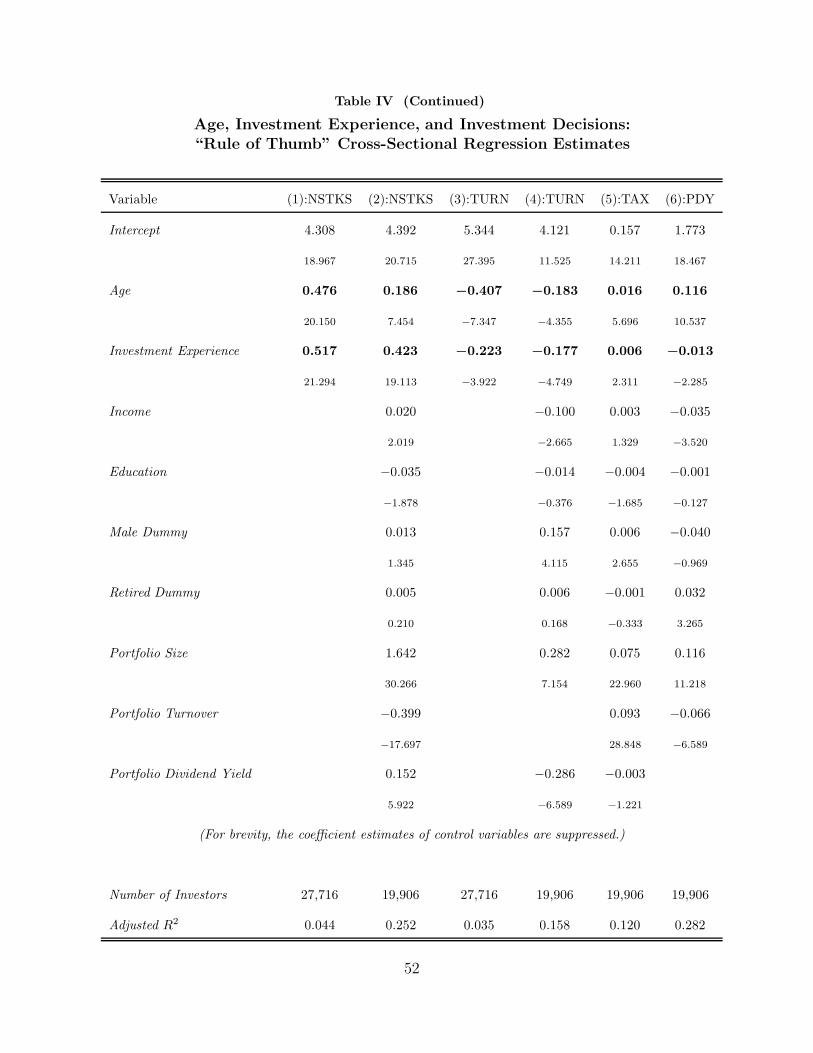
Table IV (Continued)
Age, Investment Experience, and Investment Decisions:“Rule of Thumb” Cross-Sectional Regression Estimates
Variable (1):NSTKS (2):NSTKS (3):TURN (4):TURN (5):TAX (6):PDY
Intercept 4.308 4.392 5.344 4.121 0.157 1.773
18.967 20.715 27.395 11.525 14.211 18.467
Age 0.476 0.186 −0.407 −0.183 0.016 0.116
20.150 7.454 −7.347 −4.355 5.696 10.537
Investment Experience 0.517 0.423 −0.223 −0.177 0.006 −0.013
21.294 19.113 −3.922 −4.749 2.311 −2.285
Income 0.020 −0.100 0.003 −0.035
2.019 −2.665 1.329 −3.520
Education −0.035 −0.014 −0.004 −0.001
−1.878 −0.376 −1.685 −0.127
Male Dummy 0.013 0.157 0.006 −0.040
1.345 4.115 2.655 −0.969
Retired Dummy 0.005 0.006 −0.001 0.032
0.210 0.168 −0.333 3.265
Portfolio Size 1.642 0.282 0.075 0.116
30.266 7.154 22.960 11.218
Portfolio Turnover −0.399 0.093 −0.066
−17.697 28.848 −6.589
Portfolio Dividend Yield 0.152 −0.286 −0.003
5.922 −6.589 −1.221
(For brevity, the coefficient estimates of control variables are suppressed.)
Number of Investors 27,716 19,906 27,716 19,906 19,906 19,906
Adjusted R2 0.044 0.252 0.035 0.158 0.120 0.282
52

Table V
Determinants of Investment Skill: Cross-Sectional Regression Estimates
This table reports the estimates for cross-sectional regressions, where a measure of individual skill is thedependent variable. We consider three skill measures: (i) the monthly Sharpe ratio (SR), (ii) the fourfactor alpha (Alpha), and (iii) the average characteristic-adjusted monthly portfolio return (CharAdj). Thefour factor alpha is obtained by fitting a four-factor time-series model to the monthly portfolio returnsseries of each investor over the period the investor is active. In column (7), we present panel regressionestimates, where the skill measure is the monthly characteristic-adjusted returns. Independent variables:Age corresponds to the head of the household and Investment Experience is the number of days betweenthe account opening date and December 31, 1996. Income is the total household income and Low Incomedummy is set to one for investors with an annual household income of $40,000 or below. Education representsthe proportion of people in investor’s zip code who has attained a bachelor’s or higher educational degree.Low Education dummy is set to one for investors who are in the lowest education level quintile. The MaleDummy is set to one if the head of the household is male, and the Retired dummy is set to one if the headof the household is retired. The African American (Hispanic) variable is the ratio of the population ofAfrican-Americans (Hispanics) and Whites in the investor’s zip code. Control variables: Portfolio Size isthe average market capitalization of the household portfolio, Portfolio Turnover is the average of monthlybuy and sell turnovers, and Portfolio Div Yield is the average dividend yield of the household portfolio.The RMRF, SMB, HML, and UMD Exposures are the factor loadings of an investor’s portfolio. The factorexposures are not used as control variables in specification (7). Other details: The t-statistics for thecoefficient estimates are shown in smaller font below the estimates. Robust, clustered standard errors areused to account for potential cross-sectional dependence within zip codes. To ensure that extreme values arenot affecting our results, we winsorize all variables at their 0.5 and 99.5 percentile levels. The independentvariables have been standardized so that each variable has a mean of zero and a standard deviation of one.The individual investor data are from a large U.S. discount brokerage house for the period from 1991 to1996. The zip code-level education and race/ethnicity data are from the 1990 U.S. Census.
53

Table V (Continued)
Determinants of Investment Skill: Cross-Sectional Regression Estimates
SR Alpha Char Adj
Variable (1) (2) (3) (4) (5) (6) (7)Panel
Intercept 0.101 0.102 −0.341 −0.340 0.006 −0.001 0.031
13.173 9.568 −14.285 −13.099 0.699 −0.101 0.448
Age −0.001 −0.014 −0.042 −0.051 −0.044 −0.054 −0.063
−0.935 −3.355 −5.047 −4.735 −7.293 −2.945 −2.257
Investment Experience 0.011 0.010 −0.010 0.020 0.037 0.027 0.028
11.644 9.450 −1.184 2.283 6.053 3.891 2.289
Over 70 Dummy −0.007 −0.025 −0.020 −0.022
−1.483 −2.073 −2.163 −2.886
Income 0.001 0.001 0.011 0.004
0.824 0.062 1.112 0.470
Low Income Dummy −0.002 −0.004 −0.009 −0.011
−1.223 −0.275 −0.773 −1.004
Age * Low Income −0.002 −0.025 −0.014 −0.022
−2.033 −2.674 −1.996 −2.242
Education 0.002 0.014 0.017 0.013
1.882 2.527 2.717 2.089
Low Education Dummy −0.002 −0.012 −0.014 −0.015
−1.809 −1.813 −1.798 −1.401
Age * Low Education −0.001 −0.003 −0.005 −0.004
−1.789 −1.250 −2.719 −2.242
Male Dummy −0.001 −0.001 −0.006 −0.021
−0.550 −0.108 −0.945 −1.306
Retired Dummy 0.001 0.007 0.004 −0.010
0.072 0.760 0.504 −0.957
Hispanic Dummy −0.002 −0.003 0.009 −0.007
−0.350 −0.650 0.220 −1.072
African American Dummy −0.005 −0.016 −0.012 −0.003
−1.038 −1.403 −1.133 −0.879
Age * Hispanic −0.004 −0.034 −0.025 −0.017
−3.568 −3.516 −3.111 −2.876
Age * African American 0.002 0.010 0.009 −0.007
0.437 0.588 1.108 −1.035
(For brevity, the coefficient estimates of control variables are suppressed.)
Number of Investors 27,716 19,906 27,716 19,906 27,716 19,906 1,186,835
Adjusted R2 0.015 0.055 0.014 0.254 0.028 0.090 0.061
54

Table VI
Determinants of Cognitive Abilities
This table reports the cross-sectional regression estimates, where the dependent variable is a measure ofcognitive ability. The independent variables are the main determinants of cognitive ability identified in thepsychological literature and available in our individual investor sample. Among the independent variables,Wealth is the total net-worth of the household including real-estate, Income is the total household income,Age is the age of the individual, Education is a categorical variable that denotes the level of educationfrom pre-primary to post-tertiary. Low Income dummy is set to one for investors who are in the lowestincome quintile. Low Education dummy is set to one for investors who are in the lowest education levelcategory. Over 70 Dummy is set to one for individuals with age over 70. The t-statistics for the coefficientestimates are shown in smaller font below the estimates. To ensure that extreme values are not affectingour results, we winsorize all variables at their 0.5 and 99.5 percentile levels. The independent variables havebeen standardized so that each variable has a mean of zero and a standard deviation of one. The householddata are from the 2005 wave of the Survey of Health, Aging, and Retirement in Europe (SHARE).
Cognitive ability measure is:
Variable Verbal Quantitative Memory Combined
Intercept −0.001 −0.005 −0.003 0.001
−0.080 −0.754 −0.571 0.118
Wealth 0.049 0.020 0.012 0.031
8.038 3.271 1.963 5.628
Income 0.047 0.053 0.002 0.041
7.818 8.482 0.372 7.230
Education 0.365 0.313 0.312 0.398
25.991 16.255 17.306 25.216
Age −0.129 −0.160 −0.239 −0.211
−13.178 −15.718 −24.088 −23.039
Retired Dummy −0.081 −0.065 −0.011 −0.056
−11.393 −10.394 −1.182 −9.953
Over 70 Dummy −0.010 −0.036 −0.021 −0.032
−1.932 −3.186 −2.902 −3.199
Age × Low Income −0.086 −0.055 −0.066 −0.084
−12.142 −7.460 −9.196 −12.794
Age × Low Education 0.001 −0.014 −0.030 −0.024
0.108 −2.500 −4.140 −3.060
Number of Individuals 22,153 21,777 21,904 22,215
Adjusted R2 0.249 0.211 0.245 0.341
55

Table VII
Robustness Test Results:Skill Regression Estimates using Sub Samples and Alternative Skill Measures
This table reports the estimates for cross-sectional regressions, where a portfolio performance measure is thedependent variable. For brevity, we only report the estimates for the variables that are related to our mainhypotheses. The estimates for the control variables are suppressed. In Panel A, we use a trading based skillmeasure, which is defined as the k-day post-trade buy-sell return differential (PTBSD(k)), k = 5, 10. InPanel B, we consider the two Graham-Harvey performance measures (GH1 and GH2). In GH1, the S&P 500futures index is levered up or down to match the volatility of the investor portfolio. GH1 is the differencebetween the mean return on the newsletter portfolio and the mean return on the volatility-matched marketportfolio. GH2 is computed by levering up or down each investor’s portfolio to match the volatility of theS&P500 futures index. GH2 is the difference between the mean return on the volatility-matched portfolioand the return on the S&P500 futures index. In both cases, the volatilities are computed for the time-periodin which an investor is active and the appropriate portfolio is levered up or down by combining it with T-bills.In Panel C, we measure investment skill using characteristic-adjusted portfolio returns and following Danieland Titman (1997) methodology. In Panel D, we use the four-factor alpha as a measure of investment skill,where we use both the total alpha and the local alpha measures. To compute the total four-factor alphafor an investor portfolio, we use all stocks in the investor’s portfolio and to compute the local four-factoralpha, we only consider the part of the investor portfolio that contains stock investments in firms locatedwithin a 100 mile radius of investor’s location. In Panel D, we also report estimates using the total portfoliofour-factor alpha for two sub samples: (i) only consider investors with statistically significant (t-statistic≥ 1.95) alpha estimates, and (ii) only consider investors who have at least 60 months of returns data. Lastly,in this Panel, we report the skill regression estimates, where an eight-factor alpha is the dependent variable.To compute the eight-factor alpha, we use the four commonly used risk factors (RMRF, SMB, HML, andUMD), three industry factors (Pastor and Stambaugh (2003)), and a liquidity factor (Pastor and Stambaugh(2003)). Last, in Panel E, we report the cross-sectional regression estimates for the following two sub samples:(i) investors with large portfolios relative to income and (ii) investors who are located outside California.The independent variables have been defined previously in Table V. Other details: The t-statistic for thecoefficient estimates are shown in smaller font below the estimates. Robust, clustered standard errors areused to account for potential cross-sectional dependence within zip codes. To ensure that extreme values arenot affecting our results, we winsorize all variables at their 0.5 and 99.5 percentile levels. The independentvariables have been standardized so that each variable has a mean of zero and a standard deviation of one.The individual investor data are from a large U.S. discount brokerage house for the period from 1991 to1996. The zip code-level education and race/ethnicity data are from the 1990 U.S. Census.
56

Table VII
Robustness Test Results:Skill Regression Estimates using Sub Samples and Alternative Skill Measures
Panel A: Skill Measurement using Trading Based Skill Measures
Robustness Test Age Inv Exper Age*Hisp Age*AfrAm Age*LowInc Age*LowEdu
PTBSD(5) −0.081 0.054 −0.018 −0.037 0.015 −0.041
−2.682 2.134 −1.704 −1.446 0.581 −1.253
PTBSD(10) −0.153 0.082 −0.016 −0.018 −0.038 −0.071
−3.790 2.430 −1.469 −1.537 −1.882 −1.621
Panel B: Skill Measurement using Market Timing Performance Metrics
Robustness Test Age Inv Exper Age*Hisp Age*AfrAm Age*LowInc Age*LowEdu
Graham-Harvey 1 −0.023 0.036 −0.042 0.011 −0.020 −0.009
−1.912 3.469 −4.002 1.071 −1.883 −1.672
Graham-Harvey 2 −0.010 0.004 −0.010 0.006 −0.005 −0.002
−2.710 2.359 −3.124 0.827 −1.434 −1.536
Panel C: Regression Estimates using Characteristic-Adjusted Skill Measures
Robustness Test Age Inv Exper Age*Hisp Age*AfrAm Age*LowInc Age*LowEdu
1991-93 Sub Sample −0.041 0.035 0.001 0.011 −0.011 −0.010
−4.739 3.769 0.520 1.137 −2.050 −1.850
1994-96 Sub Sample −0.034 0.030 −0.021 −0.014 −0.005 −0.007
−2.064 3.672 −2.767 −1.903 −1.698 −1.740
57

Table VII(Continued)
Robustness Test Results:Skill Regression Estimates using Sub Samples and Alternative Skill Measures
Panel D: Skill Measurement using Multifactor Alphas
Robustness Test Age Inv Exper Age*Hisp Age*AfrAm Age*LowInc Age*LowEdu
Four-Factor Alpha
Local −0.039 0.026 −0.037 −0.021 −0.008 −0.009
−2.738 2.504 −3.408 −1.921 −0.757 −0.702
Significant −0.053 0.037 −0.025 0.003 −0.016 −0.009
−5.656 10.305 −3.235 0.662 −2.101 −1.884
Min 60 Months of Returns −0.062 0.031 −0.034 0.010 −0.009 −0.010
−3.247 5.019 −2.751 0.585 −2.746 −2.040
Eight-Factor Alpha
Full Sample −0.047 0.022 −0.023 0.009 −0.017 −0.004
−3.745 2.314 −3.652 1.124 −2.668 −1.439
Panel E: Sub Sample Estimates using Four-Factor Alphas
Skill Measure Age Inv Exper Age*Hisp Age*AfrAm Age*LowInc Age*LowEdu
Investors With Large Portfolios −0.053 0.018 −0.032 0.007 −0.032 0.001
−4.759 1.996 −3.268 0.768 −3.099 0.088
Investors Outside California −0.044 0.017 −0.029 0.016 −0.032 −0.003
−2.797 2.651 −2.732 0.532 −3.006 −1.197
58
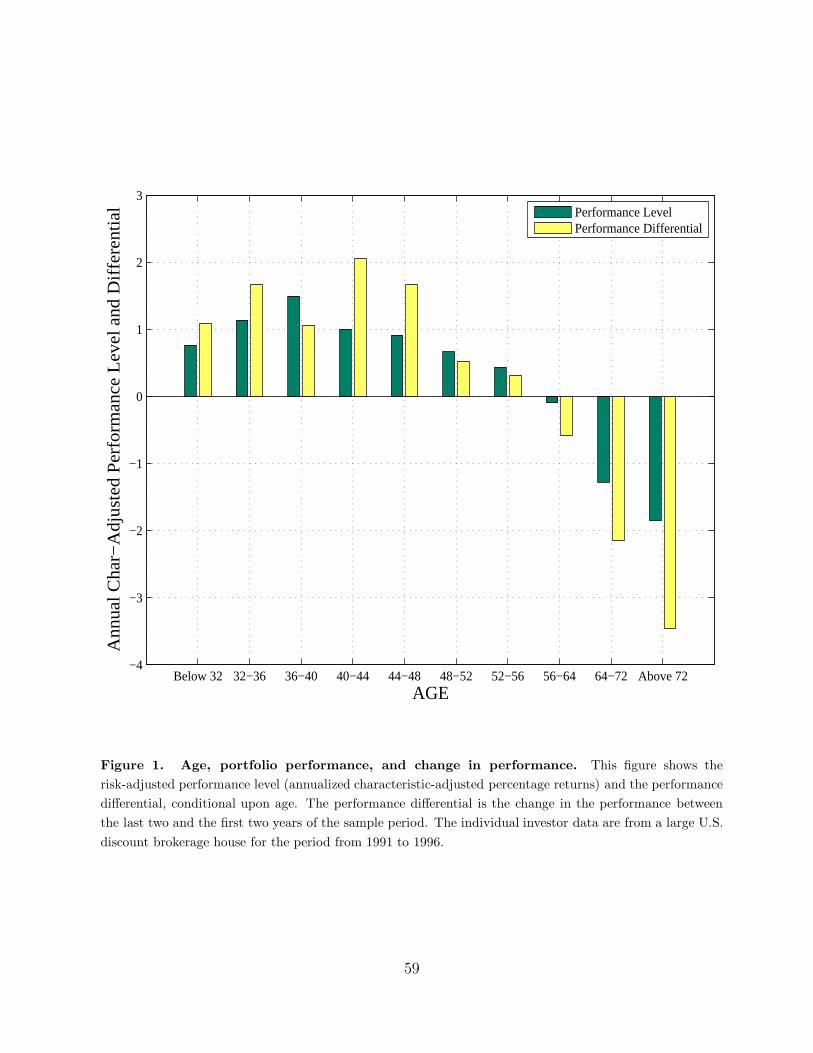
Below 32 32−36 36−40 40−44 44−48 48−52 52−56 56−64 64−72 Above 72−4
−3
−2
−1
0
1
2
3
AGE
Ann
ual C
har−
Adj
uste
d P
erfo
rman
ce L
evel
and
Dif
fere
ntia
l
Performance LevelPerformance Differential
Figure 1. Age, portfolio performance, and change in performance. This figure shows therisk-adjusted performance level (annualized characteristic-adjusted percentage returns) and the performancedifferential, conditional upon age. The performance differential is the change in the performance betweenthe last two and the first two years of the sample period. The individual investor data are from a large U.S.discount brokerage house for the period from 1991 to 1996.
59

All Small (Below $10,000)Medium ($10,000−$50,000)Large (Above $50,000)−3
−2
−1
0
1
2
3
4
5
6
Portfolio Size
Ann
ual R
isk−
Adj
uste
d P
erfo
rman
ce
Low Cognitive AbilityHigh Cognitive AbilityHigh Minus Low
Figure 2. Cognitive aging, portfolio size, and portfolio performance. This figure shows the risk-adjusted performance (annualized characteristic-adjusted percentage returns), conditional upon portfoliosize and investors’ predicted cognitive abilities. The empirical model of cognitive abilities estimated inTable VI is used to obtain the predicted cognitive ability measures. We regress the predicted cognitiveability measure on investment experience and obtain a residual cognitive ability measure that is orthogonalto experience. The individual investor data are from a large U.S. discount brokerage house for the periodfrom 1991 to 1996.
60
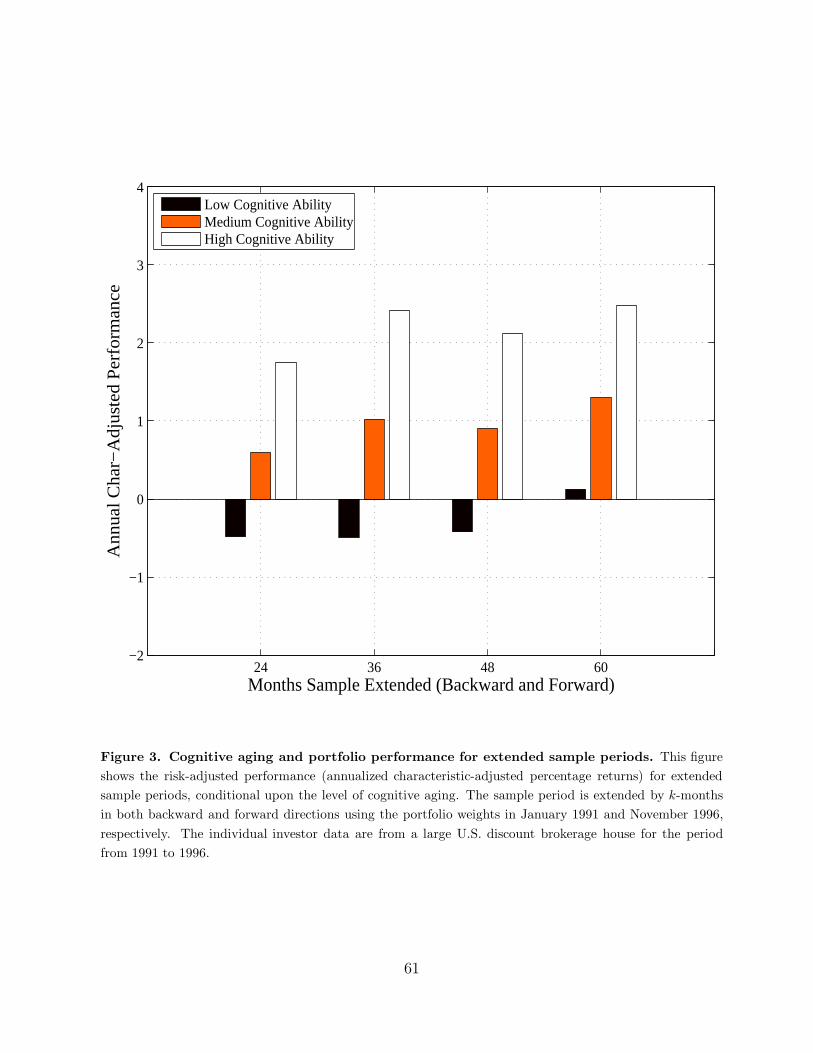
24 36 48 60−2
−1
0
1
2
3
4
Months Sample Extended (Backward and Forward)
Ann
ual C
har−
Adj
uste
d P
erfo
rman
ce
Low Cognitive AbilityMedium Cognitive AbilityHigh Cognitive Ability
Figure 3. Cognitive aging and portfolio performance for extended sample periods. This figureshows the risk-adjusted performance (annualized characteristic-adjusted percentage returns) for extendedsample periods, conditional upon the level of cognitive aging. The sample period is extended by k-monthsin both backward and forward directions using the portfolio weights in January 1991 and November 1996,respectively. The individual investor data are from a large U.S. discount brokerage house for the periodfrom 1991 to 1996.
61