does inventor ownership encourage university research
TRANSCRIPT

De
MD
a
ARRAA
JOH
KBIUE
1
anaWaMTAsuUitc
a2di
0d
Research Policy 40 (2011) 1100– 1112
Contents lists available at ScienceDirect
Research Policy
j our nal ho me p ag e: www.elsev ier .com/ locate / respol
oes inventor ownership encourage university research-derivedntrepreneurship? A six university comparison
artin Kenney ∗, Donald Pattonepartment of Human and Community Development, University of California, Davis, United States
r t i c l e i n f o
rticle history:eceived 30 July 2010eceived in revised form 31 January 2011ccepted 28 April 2011vailable online 12 June 2011
EL classification:3
a b s t r a c t
This paper examines whether university ownership of inventions made by its personnel best serves thewidely held social goals of encouraging technology commercialization and entrepreneurship. Using ahand-collected census of technology-based university spin-offs from six universities, one of which is theUniversity of Waterloo and the only inventor ownership university in North America, we compare thenumber and type of spin-offs produced by these universities. We find suggestive evidence that inventorownership universities can be more efficient in generating spin-offs on both per faculty and per R&D dollarexpended perspective. We find that the field of computer sciences and electrical engineering generates
1
eywords:ayh-Dole Act
nventor ownershipniversity technology licensingntrepreneurship
a greater number of spin-offs than do our other two categories – the biomedical sciences, and the fieldof engineering and the physical sciences. In general, our results demonstrate that inventor ownershipcan be extremely productive of spin-offs. From these results, we suggest that governments seeking toencourage university invention commercialization and entrepreneurship should experiment with aninventor ownership system.
© 2011 Elsevier B.V. All rights reserved.
. Introduction
When first introduced, new laws and practices attract greatttention. However, if successfully diffused, they soon becomeormalized and treated as “natural” (Suchman, 1995; Tolbertnd Zucker, 1983), becoming unquestioned routines (Nelson andinter, 1982). This can lead to new governance models, which
re, in fact, social creations shaped by various forces (Cyert andarch, 1963; Davis and Thompson, 1994; Ocasio and Kim, 1999).
his is the case with the current implementation of the Bayh-Dolect in the U.S., which enshrined institutional ownership of univer-ity inventions. Despite recent questioning of the efficacy of theniversity ownership regime in commercializing inventions in the.S. (Litan et al., 2007; Kenney and Patton, 2009) and increasingly
n Europe (Geuna and Nesta, 2006; Fini et al., in this issue), faith inhe efficacy of current university ownership regime for technologyommercialization remains unshaken.
The conventional view is best illustrated by a 2010 reportuthored by the National Research Council (Merrill and Mazza,
010: p. 58) stating, “arguments for the superiority of an inventor-riven system of technology transfer are largely conjectural. Theres certainly anecdotal evidence of faculty dissatisfaction with the
∗ Corresponding author.E-mail address: [email protected] (M. Kenney).
048-7333/$ – see front matter © 2011 Elsevier B.V. All rights reserved.oi:10.1016/j.respol.2011.05.012
technology licensing office-dominated model as well as evidenceof faculty entrepreneurial success independent of such offices,but there is no systematically collected evidence that inventorshave knowledge and skills superior to those of technology transferpersonnel and their service providers in the various componentsof IP acquisition, management, and licensing.” This conventionalwisdom has a powerful grip on the science policy debate. Thisconclusion is validated by the total adoption in the U.S. andwidespread diffusion of the university ownership regime globally(see Fini et al., in this issue; Mowery and Sampat, 2005; So et al.,2008).
Despite increased questioning of the university ownershipmodel, particularly in relationship to the growing interest inentrepreneurship, there has been little research comparing theuniversity ownership regime with alternatives such as inventorownership. In an earlier paper, we examined the faulty conceptualand theoretical political economic underpinnings of the currentuniversity ownership regime from an efficiency and effectivenessperspective (Kenney and Patton, 2009). This paper tests these con-tentions by measuring the numbers of direct university spin-offs atsix universities, one of which, the University of Waterloo, Canada(hereafter Waterloo) operates under an unfettered inventor own-
ership regime. The results, though limited by having only oneinventor ownership university, suggest that policy-makers desir-ing to foster entrepreneurship and local economic developmentshould consider adopting an inventor ownership regime.
arch P
2
vhisdBos
tathctuo2Dl
oabofilidwfiglfptt
bsceas(wsaAci(egu
M
a2
M. Kenney, D. Patton / Rese
. Previous research and proposition development
In recent years the Bayh-Dole (BD) Act and its effect on uni-ersity technology transfer and university-based entrepreneurshipas received increasing attention from both academics interested
n technology policy and policy-makers (for excellent summaries,ee Rothaermel et al., 2007; O’Shea et al., 2008; Shane, 2004a). Theominant narrative accepts university ownership facilitated by theayh-Dole Act of 1980 (BD) as necessary for the commercializationf research results, and as the reason for the success of U.S. univer-ities in commercializing inventions through entrepreneurship.1
The current university ownership regime is a governance modelhat accords with a particular belief structure about how rightsnd responsibilities should be allocated for commercializing inven-ions made at universities with Federal (and other) funding andow technology can be best commercialized. The research beingommercialized is the result of public funding and conducted atax-exempt institutions. Since the 1980s, particularly for publicniversities supported by state governments, local economic devel-pment has been recognized as an important goal (Lockett et al.,005). Further, a central U.S. societal goal, since at least the Greatepression, has been the support of small businesses and particu-
arly entrepreneurship.The most common alternative to commercializing the technol-
gy through an entrepreneurial firm is to license the technology,nd Thursby and Thursby (2007: p. 631) found licensing income toe the most important self-identified goal for technology licensingffices (henceforth, TLOs). For the TLO, licensing to an establishedrm is an attractive option because it can more easily pay upfront
icensing fees and cover legal and other costs.2 In cases in which thenvention is licensed to an existing firm, the employment generatedue to the license normally occurs at the firm’s existing facilities,hich may not be in close proximity to the university. Establishedrms licensing the technology are unlikely to have any allegiance orratitude to the source university. Another pitfall is that an estab-ished firm may license a technology and never commercialize itor a variety of reasons, such as changing R&D goals, “banking” theatent for other motives, or a simple lack of motivation. This con-rasts to a spin-off, whose future is based upon the technology andhus is compelled to attempt to commercialize the invention.
For many public universities economic development contri-utions have become an increasingly significant justification fortate funding. Studies of university entrepreneurship show thatertain universities report far higher rates of founding than oth-rs (Friedman and Silberman, 2003; Landry et al., 2006; Lockettnd Wright, 2005; O’Shea et al., 2005). Almost always, univer-ity spin-offs are established in close proximity to the universityBreznitz, 2008; Shane, 2004a) and continue to cultivate strong tiesith the university. In some cases, university spin-offs can be the
eeds that result in the formation of an entrepreneurial ecosystem,s has been the case for biotechnology in the San Francisco Bayrea, Boston, and San Diego regions (Powell et al., 2002). One out-ome of entrepreneurial success can be that the spin-off providesncreased research funding for the local university’s laboratoriesBlumenthal et al., 1986; Dechenaux et al., 2009). Finally, successfulntrepreneurs can be the source of donations. These results sug-
est that the benefit of spin-offs can be substantial for the sourceniversity.1 For a detailed discussion of the passage and early impacts of the BD Act, seeowery et al. (2004) and Berman (2008).2 This is tempered by some recent research finding that universities increasingly
re accepting equity in lieu of licensing fees (Feldman et al., 2002; Markman et al.,005).
olicy 40 (2011) 1100– 1112 1101
Evidence from Europe and Japan suggests that university own-ership is not vital for technology transfer, as most transfer inthese nations has been to existing firms and thus does not directlyencourage new firm formation (Carraz, 2008; Chapple et al., 2005;Geuna and Nesta, 2006; Valentin and Jensen, 2007). Both Audretschet al. (2005) and Thursby et al. (2009) have shown that U.S. profes-sors held a significant number of patents in their research field thatwere assigned to firms, even while they were university employees(see also Link et al., 2007; Markman et al., 2008; Siegel et al., 2003).Using a survey instrument, Fini et al. (2010) found that two-thirdsof the firms established by university professors were not based onpatented inventions or inventions disclosed to their university TLO.Building upon Lowe (2006), Kenney and Patton (2009) reason thatthe allocation of invention-ownership rights to the university TLOinstead of the inventor installs an extra intermediary between theinventor and the market place. The empirical evidence of patentingand firm formation by university personnel outside the TLO, andan understanding of the role and operation of TLO in the univer-sity ownership regime suggest that an inventor ownership regimewill generate greater technology-based entrepreneurship than willa university ownership regime. For these reasons, each of the fol-lowing propositions tests the performance of Waterloo against thefive university ownership institutions. Thus, in our initial and mostgeneral test, we propose:
P1. Inventor ownership universities have a greater number of spin-offs than university ownership universities.
It has long been common wisdom that the propensity and easeof establishing new firms differs by industry and, by extension,the academic research field. Despite this knowledge, the differ-ences in invention, patenting, and spin-offs between academicresearch fields has not received significant attention with a fewnotable exceptions. For example, in an examination of TLO inputsand outputs Thursby and Kemp (2002: pp. 121–122) found thatthe biological sciences and engineering are more important tolicensing activities than are the physical sciences. Moreover, uni-versities with medical schools were less likely to be efficient ingenerating various outputs. For example, there has been remark-ably little comparative cross-disciplinary research on universitydisclosures, patenting, licensing, or spin-off generation. In anotherstudy Thursby et al. (2009) distinguished to which types of organi-zations (university, unassigned, startup, or established firm) facultyassigned their patents. They found that the patterns of facultyassignment of patents differed by academic field. In fact, they foundthat both physical scientists and engineers were less likely to assignto the university than were biological scientists (Thursby et al.,2009: p. 21). The results with disclosures, licensing, and patent-ing suggest that academic field may have a significant influenceon spin-offs, also. Our academic fields are not directly compara-ble with those of the previous papers because of our decision toseparate EE&CS from the rest of engineering.
A substantial body of research suggests that the number ofspin-offs from a university is conditioned by characteristics ofuniversities such as quality, R&D expenditures, and number of fac-ulty (Shane, 2004b). The academic status of universities and theirrespective departments has repeatedly been found to be importantin terms of numbers of spin-offs (see, for example, DiGregorio andShane, 2003; O’Shea et al., 2005; Stuart and Ding, 2006; Zucker et al.,1998). University and departmental prestige, measured by either
the quality of science and engineering faculty (O’Shea et al., 2005)or by overall graduate school ranking (DiGregorio and Shane, 2003),is positively and significantly related to the number of spin-offs peryear. Hence, we propose that:
1 arch P
Psb
tfiMisinw(sb
Pwu
owpw
Pms
msBuutwmattofi
Pwb
3
tlilC
na(tedfidi
102 M. Kenney, D. Patton / Rese
2. Inventor ownership universities will have a greater number ofpin-offs than their status, as measured by rankings would suggest,ut this will be conditioned by research fields.
The positive relationship between research expenditures andhe number of technology-based spin-offs has been repeatedly con-rmed (Lockett and Wright, 2005; O’Shea et al., 2005; Powers andcDougall, 2005). The conversion of university R&D expenditures
nto concrete outcomes has received only limited research. One keytudy is by Thursby and Kemp (2002) and examines TLO efficiencyn converting disclosures to licenses, patents, royalties, etc.; they doot measure efficiency in terms of direct spin-offs. As was the caseith the previous proposition that drew upon Kenney and Patton
2009), we would expect that inventor ownership universities willpin-off a greater number of firms per R&D dollar, but that this wille conditioned by academic field. So, we propose:
3. Inventor ownership universities, on an R&D expenditure basis,ill be more efficient at spinning-off firms than university ownershipniversities, but this will be conditioned by field.
Because the institutional barriers to firm formation at inventorwnership universities are lower (Kenney and Patton, 2009), weould expect that they would spin-off a greater number of firmser faculty member than university ownership universities, but thisill be conditioned by academic field.3 Hence:
4. Inventor ownership universities, on a per faculty basis, will beore efficient at spinning-off firms than university ownership univer-
ities, but this will be conditioned by field.
In university-regimes disclosure of inventions to the TLO isandatory and universities can initiate litigation against any per-
onnel that they believe have misappropriated their property.ecause we have data regarding whether the spin-off licensedniversity technology, it is possible to compare licensing acrossniversities. In an inventor ownership university it is not necessaryo license technology; though Waterloo’s Watco issues a licensehen an inventor wishes to use their services for patenting andarketing. For this reason, we expect licensing will be far lower
t Waterloo, what is more interesting is to examine the likelihoodhat a spin-off will license by academic field. Thus, while we expresshe proposition, as a comparison between inventor and universitywnership, the more interesting results will be the differences byeld. So, the final exploratory proposal is that
5. In inventor ownership systems a lower percentage of spin-offsill license technology from the university, but this will be conditionedy field.
. The setting for the comparison
The Canadian and U.S. university systems share many institu-ional similarities and certain differences. At the macro politicalevel, both nations are North American settler states experienc-
ng high levels of immigration. Canada is an Anglo-Saxon commonaw nation (Black and Gilson, 1998). The 2008 per capita GDP, foranadians was US$39,800, while in the U.S. it was US$47,000. For3 The efficiency measures in P3 and P4 are based on spin-off counts, and doot capture all of the performance outcomes of university based startups, suchs number of new products developed or jobs created. See Siegel and Wessnerforthcoming). Because our database includes the names and addresses of the firms,hough the data was spotty, it was possible to examine firm growth in terms ofmployment and/or revenues. The difficulty is that the firms were established atifferent times. Not surprisingly, firms grew, failed, were acquired, acquired otherrms, etc. over time, thereby affecting the employment results. For this reason,rawing any conclusions about impact was difficult and was limited to moments
n time.
olicy 40 (2011) 1100– 1112
adults, the average years of schooling in the U.S. is 12 years and inCanada is 11.6. One significant difference between the two nationsis that the U.S. spends 2.62% of GDP on R&D, while Canada spendsonly 1.94% suggesting that the U.S. government and firms have agreater orientation toward new technology development. Despitethis difference, the macroeconomic similarities are quite striking.By nearly all relevant criteria, Anglophone Canada and the U.S. sharestrong similarities.
In terms of the entrepreneurial environment, the GlobalEntrepreneurship Monitor data shows that the U.S. and Canadawere similar in terms of high-expectations entrepreneurship(Autio, 2007). In terms of the experience with and availability ofventure capital, the U.S. was the first nation to establish and con-tinues to have the world’s largest venture capital industry. Canadawas a fast follower as its first venture capital firms were formedin the early 1970s (Ross and Partners, 1972) making it the oldestventure capital industry outside of the U.S. and United Kingdom.In terms of per capita venture capital investment, the nations areroughly comparable. For example, in 2003 the per capita venturecapital investment in Canada was $67.20; while in the U.S. it was$64.42. While Canada is much smaller than the U.S., in per capitaterms, venture capital investment is comparable. Canadian univer-sities have been the source of approximately 1000 spin-offs and ofthese 100 have been listed on public stock markets in Canada orthe U.S. (Niosi, 2006).
Like the U.S., the Canadian universities are the major public insti-tution responsible for conducting research and it is largely fundedby government granting agencies. All major Canadian universitiesare publicly operated, as opposed to the mixed system in the U.S.For this reason, in this study all the U.S. universities are public. TheU.S. universities are not located in particularly significant technol-ogy clusters, though Waterloo is located in a Canadian technologycluster. In Canada, which has no law equivalent to BD, each uni-versity has set its own policies regarding invention ownership andthere has not been any convergence upon a single practice (seeAtkinson-Grosjean, 2002; Hoye, 2006).4 These similarities suggestthat any differences in university entrepreneurship are not due tovariation in the political and legal systems of the two nations.
3.1. The University of Waterloo
Since its founding in 1957, the University of Waterloo hasemphasized interaction with industry (Bathelt and Hecht, 1990).At its inception, local business leaders advanced a proposal toestablish a university to train engineers and technicians who weredesperately needed for Canada’s growing post-war economy. How-ever, it soon altered its training-centric charter to emphasizeresearch in engineering, the sciences, and mathematics, but laterbecame a comprehensive university (Nelles et al., 2005). It alsodeveloped a ‘co-operative program’ offering students paid workin industry to get practical experience (University of WaterlooWebsite, 2010). As is true at the other universities in our database,the support for entrepreneurship at Waterloo is strong. Over theyears, a strong entrepreneurial culture has emerged. For example,the co-operative program offers an entrepreneurship track. Thisemphasis upon industry linkages bears a certain resemblance to
the land-grant mission of four of the five U.S. universities.Canada has significant concentrations of high-technology activ-ity in a number of locations, particularly its larger cities (Lucas et al.,
4 With few exceptions, research on Canadian university spin-offs has not recog-nized that it has the most diverse set of university technology ownership regimes inthe world and thus simple regressions across all Canadian universities or unadjustedcomparisons across universities are missing an important variable (as an exampleof such an exercise, see Landry et al., 2006).

arch P
2WcBr2vWt
uewufopsaihta
WahriWmtcmpw
cdModsnLfius
3
d
zhlM
o(d
o
M. Kenney, D. Patton / Rese
009). But only in a “Technology Triangle” comprised of three cities,aterloo-Kitchner, Guelph, and Cambridge does Canada have a
oncentrated high-technology agglomeration (Bathelt et al., 2010;ramwell and Wolfe, 2008; Bramwell et al., 2008).5 As previousesearch predicts, (Agrawal and Cockburn, 2003; Audretsch et al.,005), nearly all of Waterloo’s spin-offs were established in theicinity of the university (Bramwell et al., 2008). The University ofaterloo is located at the core of the high-technology activity in
he region (Xu and McNaughton, 2006).From its inception, and unique among Canadian research
niversities, Waterloo adopted a policy that all inventions, notxplicitly the property of a sponsor, were owned by the inventor,ith the sole requirement that all inventions be disclosed to theniversity administration (Hoye, 2006). This placed responsibilityor commercialization on the inventor, but ensured that conflictsf interest could be monitored. According to Bramwell et al. (2008:. 105), “much of the university’s commercialization and spin-offuccess is attributed to its intellectual property (IP) policy, whichllows ownership of IP to rest with the creator, thus encouraging thendividual (faculty or student) to commercialize the idea.” Waterlooas been the most successful Canadian university in encouraginghe formation of new firms by its faculty, students, and staff (Xund McNaughton, 2006: p. 597).
To assist inventors, the University of Waterloo operates theaterloo Commercialization Office (Watco),6 with the mandate to
ssist any and all university inventors. Watco’s total annual incomeas been about C$500,000. Its objective is not to secure returns;ather it is funded as an annual budget item with the goal of assist-ng in technology commercialization. If an inventor chooses to use
atco, the division of proceeds after patent processing fees is nor-ally 25% for Watco and 75% for the inventor(s). In cases in which
he inventor pays for the patenting Watco can be flexible on the per-entage, particularly in cases of software inventions where thereay be no patent costs. To further encourage spin-offs, Watco may
rovide royalty vacations. Finally, Watco advises spin-offs evenhen it does not have any direct stake (Inwood, 2010).
The successes of the University of Waterloo are underappre-iated because, until recently, academic researchers simply usedata provided by the local Association of University Technologyanagers members that only reported the spin-offs using their
ffices. Recent research indicates that for U.S. universities, thisatabase contains only one-third of all firms formed by profes-ors (Fini et al., 2010). For this reason, AUTM data underreports theumber of Waterloo spin-offs. For example, utilizing AUTM dataangford et al. (2006) found that University of Waterloo underper-ormed many other Canadian universities in numbers of patentsssued and licensing fees collected. Using AUTM data, while easy,nderestimates entrepreneurship and validates AUTM and univer-ity ownership as vital to technology commercialization.
.2. The U.S. universities
At this time, every U.S. research university owns all inventionseveloped using their facilities.7 This was not always the case as
5 For a general discussion of where Canada’s technology firms and characteri-ation of each region, see Doutriaux (2003). Colapinto (2007) possibly somewhatyperbolically compared Waterloo with Silicon Valley and Route 128, though, in
arge measure, this may be due to the success of Waterloo spin-off Research inotion, producer of the Blackberry.6 For those interested in understanding how a university can operate a technol-
gy commercialization office in an inventor ownership regime, the Watco websitehttp://www.research.uwaterloo.ca/watco/index.asp) provides an excellent intro-uction.7 Some believe that at the University of Wisconsin, Madison professors own their
wn inventions. This is not the case even when using their own funds in campus
olicy 40 (2011) 1100– 1112 1103
Stanford University, which has been the most successful of all U.S.universities in terms of high-impact entrepreneurship, convertedto a university ownership regime in 1994. The University of Wis-consin had a policy giving professors ownership of all inventionsmade without federal monies and not encumbered by grant stipu-lations, though today this is a moot point because of the ubiquityof Federal support. Because the goal is to compare entrepreneur-ship at an inventor ownership university to university ownershipuniversities, the differences in TLO operation at the five U.S. univer-sities are not examined (for discussions of U.S. TLO operation, seeColyvas et al., 2002; Owen-Smith and Powell, 2001; Owen-Smith,2005).8
4. Data collection and methodology
This paper utilizes a unique database of all technology-basedspin-offs created by university-affiliated personnel at five U.S. uni-versities and one Canadian university.9 The universities are theUniversity of Wisconsin, Madison (UWM); the University of Illinois,Urbana-Champaign (UIUC); the University of Michigan, Ann Arbor(UMAA); the University of California, Davis (UCD), the University ofCalifornia, Santa Barbara (UCSB); and the University of Waterloo,Waterloo, Canada (Waterloo). This study examined 527 universityspin-offs from these six universities between the years 1957 and2009. Twelve spin-offs that did not fit readily into a firm classifi-cation were omitted from further analysis leaving 515 universityspin-offs.
The U.S. universities were chosen for the following reasons. First,all of the universities are public. Second, each one is located in uni-versity towns simplifying the identification of local spin-offs andproviding some control for their geographical location and the localecosystem. The three Midwestern universities are located in theU.S. industrial Midwest as is the case with Waterloo’s location inthe Canadian industrial heartland. Third, each of the U.S. universi-ties is research-oriented, as is Waterloo. According to the ShanghaiJiao Tong University ranking, all of the U.S. universities are rankedoverall in the top 50 universities worldwide, and all of them areranked in the top 25 universities worldwide in at least one gen-eral field of study. In global ratings terms, the U.S. universities aresuperior to Waterloo. Fourth, though all U.S. universities practiceuniversity ownership, the technology licensing organizations differin their organizational location and operational characteristics. Ingeneral, these five U.S. universities are comparable to the Univer-sity of Waterloo with respect to size, academic ranking, and locationoutside of a globally recognized entrepreneurial region.
There has been a proliferation of classification schemes for uni-versity research spin-offs (see, for example, Carayannis et al., 1998;Pirnay et al., 2003). Fini et al. (2010) classify spin-offs on the basis ofwhether they were established on the basis of patented technologyand whether the technology is owned by the inventor’s university.Nicoloau and Birley (2003) separate firms into what they term as:orthodox, which are firms whose technology and inventors spin-off from the university; hybrid, which are firms whose technologyis licensed but the inventor remains a university employee while
having a relationship with the firm; and spin-offs, which are firmswith which the inventor has no connection. In contrast, Wright et al.(2007) uses the market goals of the spin-offs and identifies threeideal types of university spin-offs: venture capital-backed spin-laboratories; all inventions are automatically assigned to the juridically separateWisconsin Alumni Research Foundation.
8 The University of Wisconsin’s WARF has received the most attention, see, forexample, George (2005).
9 All of the universities in this study are public institutions. Other qualitativestudies of TLOs have included private universities. See Siegel et al. (2004).

1104 M. Kenney, D. Patton / Research Policy 40 (2011) 1100– 1112
Table 1Summary of university attributes.
Attribute description Spin-offs Academic ranking R&D expenditures* Faculty sizeNumber of spin-offs, 1957–2010 2010 SJTU ranking $ millions, 2005–2008 average annual Total BMS, CS&EE, EPS faculty
UWM 140 17 792 2195UMAA 88 22 724 3193UIUC 72 25 462 2120UCD 40 46 563 2038UCSB 37 32 163 559Waterloo 138 151–200 95 963
S e dat
omaU(wtstufion
hecaaoiiva
fasawstoct
fiwubndlsw
feDiobn
telecommunications, and wireless. Engineering and physical sci-ences (EPS) includes all spin-offs involved in engineering withthe exception of electrical and biomedical engineering. It also
10 If the founder or founders of a firm could not be identified, or if there was insuf-ficient information to determine the employment background of the founder, thesefirms were not included in the database.
ource: Various, Waterloo faculty size data is for 2011, while for U.S. Universities th* Total for BMS, CS&EE, and EPS; all other R&D expenditures are excluded.
ffs; prospector spin-offs, based on technology with less immediatearket potential; and lifestyle spin-offs, which are established by
cademic personnel with more of a consultancy orientation. Most.S. studies of university spin-offs, with the exception of Fini et al.
2010), focus on data that is most easily collected, i.e., licensing,hich is particularly significant in biotechnology and faculty inven-
ions disclosed to the university TLO. Using Waterloo as a casetudy, Bathelt et al. (2010) categorize spin-offs based on whetherhe university “sponsored” the research or whether they wereniversity-related in that the university in some more indirect waygured in the firm’s formation. While the classification schemesften include student spin-offs, most of the empirical research doesot include them due to the difficulty of identifying them.
In our database, which is a census not a sample, only de novo,igh-technology university spin-offs were included. To be consid-red a high-technology university spin-off a firm had to fulfill threeriteria. The firm had to be de novo, it had to be high technology,nd it had to be founded by university personnel. To be recognizeds de novo the firm could not be a spin-off from an existing firmr be a subsidiary or branch operation. All de novo firms receiv-ng venture capital, as identified in Thomson VentureExpert werencluded. Very small firms of just a few employees providing ser-ices or engaged in consulting were excluded from consideration,s were all exclusively retail establishments.
Second, the firms had to be technology-based. This removedrom consideration firms in apartment management and farminglong with small technical consulting firms established by univer-ity personnel. If the spin-off was, for example, writing softwarelgorithms for larger firms, then it would be included. Also, internetebsite firms targeting the local region were excluded. In contrast,
oftware product spin-offs were included as were internet firmshat grew to be large enough to have a significant web presencer receive venture capital. The reasons for these exclusions were toapture high-potential entrepreneurship and exclude firms such ashose Wright et al. (2007) identifies as “life-style” firms.
A number of techniques and sources were used to assemble therm database. First, all venture capital investments in the countyithin which the university was located were downloaded. Second,niversity’s websites, particularly the technology transfer office,usiness school, and engineering websites were searched. At aumber of universities, individuals or organizations, such as localevelopment agencies and business organizations, have compiled
ists of firms. In some cases, the business press was a valuableource of information. Finally, interviews with local key personsere conducted.
Each firm’s description was examined to ensure that it con-ormed to our criteria. The list was then provided to individuals andntrepreneurs in the region to ascertain if there were missing firms.ata collection was terminated when no new firms were found and
nterviewees said they believed the database was complete. Despiteur confidence regarding the database’s completeness, it is likely toe missing the smallest firms formed prior to 1980, especially thoseo longer extant. In determining which firms were high technology,
a is for 2006.
and what type of technology category most accurately describedthem, the authors relied on a consensus in classification by othersources whenever possible. These sources included descriptions onthe firm’s website, in the local business press, from the universitytechnology transfer office, or a local business association. Each deci-sion for inclusion was made by one of the co-authors and validatedby the other.
Finally, to be classified as a university spin-off, a firm had tohave been founded by at least one individual affiliated with theuniversity during or immediately prior to establishing the spin-off.For all firms in the database an attempt was made to identity thefounders through web searches.10 At the time of the firm’s found-ing, the status of the founders’ relationship with the university wasdetermined. This relationship was determined from the founder’sbiography, which was usually derived from the internet. A firmfounded by an individual who had other employment between thetime they left the university and founded the firm would not beclassified as a spin-off.11 Firms that were established based on auniversity technology license were excluded if no firm founder wasaffiliated with the university. An important reason for excludingsuch “license-only” firms is that examination of a number of thesefirms indicated that often they were established on the basis of anumber of licenses from a variety of organizations, and so estab-lishing a causal linkage between the firm formation and a particularuniversity license is not self-evident.
The licensing data itself in the case of UIUC, UCD, UCSB, andWaterloo was provided by the university’s technology licensingoffice. In the case of UWM the data was extracted from the Insite(2010) database maintained by the UWM School of Business. TheUMAA data was collected and provided by then University ofMichigan professor Arvids Ziedonis and by the UMAA technologylicensing office.
All spin-offs were assigned to 23 different categories andthese were aggregated to three. The category of biomedical sci-ences (BMS) includes all spin-offs involved in biotechnology andfirms selling inputs to biotechnology firms, all firms involved inthe provision of medical services and supplies, including medi-cal instruments, and all veterinary and agricultural biology firms.Computer science and electrical engineering (CS&EE) includes allfirms involved in computers, electronic components, informa-tion technology, internet applications, semiconductors, software,
11 The time elapsed between the time an individual, usually a student, left theuniversity and founded a spin-off was determined by the individual’s biography. Ifthis time period was 1 year or less, and there was no information indicating thatthe individual was employed in the interim, then it was classified as a universityspin-off.

arch Policy 40 (2011) 1100– 1112 1105
irp
4
WhoahTtettmTii
duolsmttgItfRabctmrateR
pNgcmc
5
ist
(Cpa
0
20
40
60
80
100
120
140
19751976197719781979198019811982198319841985198619871988198919901991199219931994199519961997199819992000200120022003200420052006200720082009
UWMWaterlooUMAAUIUCUCDUCSB
140130
87
71
3835
Fig. 1. Cumulative number of spin-offs by university, 1957–2009.Source: Authors’ database.
Table 2Spin-offs by university and technology category, 1957–2010.
BMS CS&EE EPS Total
UWM 78 43 19 140UMAA 37 38 13 88UIUC 8 40 24 72UCD 26 6 8 40UCSB 12 17 8 37Waterloo 8 94 36 138Total and % by class 169 238 108 515
32.8% 46.2% 21.0%
M. Kenney, D. Patton / Rese
ncludes all firms involved in environmental applications, mate-ials, robotics, and scientific instruments. Finally, it includes thehysical sciences.
.1. Variable description
Academic ranking was one of our independent control variables.hile there have long been rankings of U.S. graduate programs, it
as only been within the last decade that cross-national rankingf universities and programs has been undertaken. Currently therere two widely cited global rankings of universities; the Shang-ai Jiao Tong University (SJTU) rankings starting in 2003, and theimes Higher Education rankings begun in 2004 (for a critique ofhese rankings, see Saisana et al., 2011). Because the SJTU rankingsmphasize academic performance and are more comprehensivehan those provided by Times Higher Education, they are utilized inhis study. Unfortunately, the SJTU rankings have only been imple-
ented recently and they began ranking by subject only in 2009.his means contemporary rankings must be used, though the datan this paper is historical. While the rankings are treated only asndicative, they are still informative.
R&D expenditure data was another independent variable. Thisata is available for both U.S. and Canadian universities. For U.S.niversities, the National Science Foundation (NSF, 2009) surveyf research and development expenditures of universities and col-eges was used. In Canada, no similar source of data was locatedo it was compiled from the R&D statistics provided by the fourain Canadian federal agencies. R&D funding classifications from
he major Canadian federal agencies comports with the U.S. sys-em. However, these four agencies did not account for all of theovernment R&D funding that Waterloo received from all sources.n Canada the provinces, in this case Ontario, provide an impor-ant share of the total R&D funding a university receives. In 2008,or example, these four agencies provided just 52.6% of the total&D the university received.12 To adjust for this undercount of R&Dcross disciplines, each R&D category in 2008 was adjusted upwardy a factor of 1.901 (1 divided by 0.526), so that all individual R&Dategories, BMS, CS&EE, EPS, and other R&D areas not included inhis study, would sum to the total 2008 R&D amount. This adjust-
ent is based on the assumption that the total R&D the universityeceives is distributed among disciplines in the same proportionss the R&D received from national agencies. An adjustment fac-or was calculated for each year and applied to all Waterloo R&Dxpenditure categories, providing us with estimates of Waterloo&D expenditures for BMS, CS&EE, and EPS.
Faculty size in the relevant academic fields was the final inde-endent variable collected. The U.S. data was obtained from theational Research Council’s data base assessment of doctoral pro-rams in the U.S. (NRC, 2010) and is for 2006. For Waterlooomparable data was unavailable so in 2011 each academic depart-ent website was accessed and all regular faculty members were
ounted.
. Descriptive statistics and basic results
The six universities can be ranked according to four character-
stics; spin-offs, academic ranking, R&D expenditures, and facultyize. As a general observation, one would expect that all four ofhese characteristics would be positively correlated. What is imme-12 Total R&D funding for Waterloo was obtained from Research Infosource Inc.2011), a private Canadian consulting firm which reports total R&D funding for allanadian universities based upon all publicly available data. This data was then com-ared to the official University of Waterloo Annual Performance Indicators reportnd the differences were negligible.
Source: Authors’ database.
diately apparent is that, in general terms, Waterloo is smaller andless highly ranked than its U.S. comparison group (see Table 1),except in terms of numbers of spin-offs.
Among these six universities the UWM has the longest history ofpromoting technology transfer going back to 1925 with the estab-lishment of the Wisconsin Alumni Research Foundation (WARF).And yet, nearly all of the spin-offs produced by these universi-ties were founded after 1975. Prior to 1975 and in the post WorldWar Two period, the UWM produced 11 spin-offs, while Waterlooand UIUC produced two, and the UMAA and UCSB had one each.Waterloo’s first spin-off occurred in 1970, while the first UCD spin-off occurred in 1975. The cumulative number of all spin-offs byeach university through the year 2009 is shown in Fig. 1.13 Therelative performance in terms of spin-offs has generally held overtime. From the beginning of our database, UWM and Waterloo haveexcelled in terms of the number of spin-offs generated. It was onlyin the early 1990s that UMAA and UIUC accelerated thereby sepa-rating themselves from UCD and UCSB.
In keeping with P1, the universities also perform differentlywhen the spin-offs are categorized into three broad fields (seeTable 2). In terms of the absolute numbers of spin-offs, UWM andWaterloo have been the source of the greatest number, followedby UMAA and the UIUC and then UCD and UCSB, which were thesource of the fewest spin-offs. When divided into different techno-logical fields, UWM had the greatest number of BMS spin-offs, whileWaterloo was the leader in both CS&EE and EPS. There is anotherinteresting observation from Table 2, namely with the exception ofUWM and UCD, at the other universities CS&EE outperformed the
other fields in absolute numbers of spin-offs. For example, CS&EEaccounted for nearly half (46.2%) of all spin-offs. BMS had 169 spin-offs, or 32.8% of the total, while EPS comprised 108 spin-offs, 21.0%13 The university count of total spin-offs in Fig. 1 differs slightly from that reportedin Table 2. It was not possible to establish a founding year for 13 spin-offs, and sothese spin-offs were not included in Fig. 1. In addition, one spin-off from UCD wasfounded in 2010, and so this spin-off was excluded as well.
1 arch Policy 40 (2011) 1100– 1112
otfi
ltohmflaaddpo
5
dntptipthla
lUirUlthlUcsE
gfista
ari
sr6rr
Uw
0
10000 0
20000 0
30000 0
40000 0
50000 0
60000 0
70000 0
80000 0
90000 0
100000 0
2001 2002 2003 2004 2005 2006 2007 2008
UWM
UMAA
Waterlo o
UCSB
UCD
UIUC
All value s in thou sand s of US$, excep t W aterloo (in thou sand s of Ca nadian $)
106 M. Kenney, D. Patton / Rese
f the total. There are likely a number of reasons for this that includehe low-cost of software firms, the ability for students to create suchrms, and the availability and interest of VCs in the field.
From this perspective, in terms of spin-off generation Water-oo performs in the first tier. However, from Fig. 1 it can be seenhat both UWM and Waterloo were benefited by a long historyf entrepreneurship. In the case of Waterloo, graduate studentsave been a major contributor in terms of firm establishment. If, asuch of the literature suggests, entrepreneurship leads to positive
eedback loops, this may explain some measure of the significantead these two universities enjoy. At UIUC and UMAA, there wasn acceleration in entrepreneurship in the early 1990s that sep-rated them from the two Universities of California that only aecade later appear to have become more entrepreneurial. Thisata provides significant support for P1 as Waterloo is roughly onar with UWM which, interestingly enough, had an earlier historyf inventor ownership that has now been abandoned.
.1. Academic ranking and spin-off performance
Academic status has been found to be highly correlated withisclosures, patenting, and spin-off firms. Unfortunately, there areo cross-national ranking systems that correlate directly with ourechnological areas. In Table 3 the SJTU ranking for 2010 are dis-layed. In the overall rankings, Waterloo was significantly inferioro the U.S. group.14 However, as is well known, universities exceln different fields. For example, UWM, UIUC, UCD, and UMAA rankarticularly high in the life sciences. This is not surprising becausehree have colleges of agriculture (UWM, UCD, UIUC), and threeave medical schools (UWM, UCD, UMAA), while UIUC has a Col-
ege of Medicine, but not a medical school.15 UIUC, UMAA, and UCSBre particularly strong in CS&EE and PSE.
The general evidence suggests that academic status is corre-ated with the number of startups. For example, the strengths ofWM and UCD are in BMS, whereas UIUC has its spin-off strength
n CS&EE and EPS. UMAA is quite balanced in rankings and this iseflected in its performance by field. This is also true within theniversity of California system, where UCD’s strength in BMS has
ed to a greater number of spin-offs, while UCSB’s strength is par-icularly evident in CS&EE. There are anomalies. CS&EE at UWMas quite low ratings, but, in terms of spin-offs it trails only Water-
oo, being roughly equal to the far higher-status UIUC. For example,CSB, though having a relatively low-ranking in the life and agri-ultural sciences has 12 spin-offs, but this can be explained by aignificant number of biomedical device spin-offs for its College ofngineering.
Waterloo is clearly different. It has relatively low status, butreat success in spinning off firms. Waterloo’s strength was in theelds in which it had its highest rating in engineering and computercience – and the performance was remarkable as it had more thanwice as many CS&EE startups as any of the other universities. Itlso has more startups in EPS than any other university.
As expected and in conformance with P2, overall ranking has
positive relationship with spin-offs. Moreover, as predicted thiselationship holds at the field level. But most interesting is the find-ng that, as P2 predicted, inventor ownership is a very powerful14 We acknowledge that global academic excellence ranking systems for univer-ities are somewhat arbitrary. In just 7 years, using the same criteria, the overallanking of the UIUC went up 20 places and the UWM went up 10, while UCSB fell
places and UCD fell 10 places. Variation in ranking is even more dramatic acrossanking entities using different criteria, which should remind us that such academicankings are useful but imprecise instruments.15 Just three of these universities have a medical school; the UWM, UMAA, andCD. Therefore it would not be expected that universities without a medical schoolould rank highly in the subject field of clinical medicine and pharmacy.
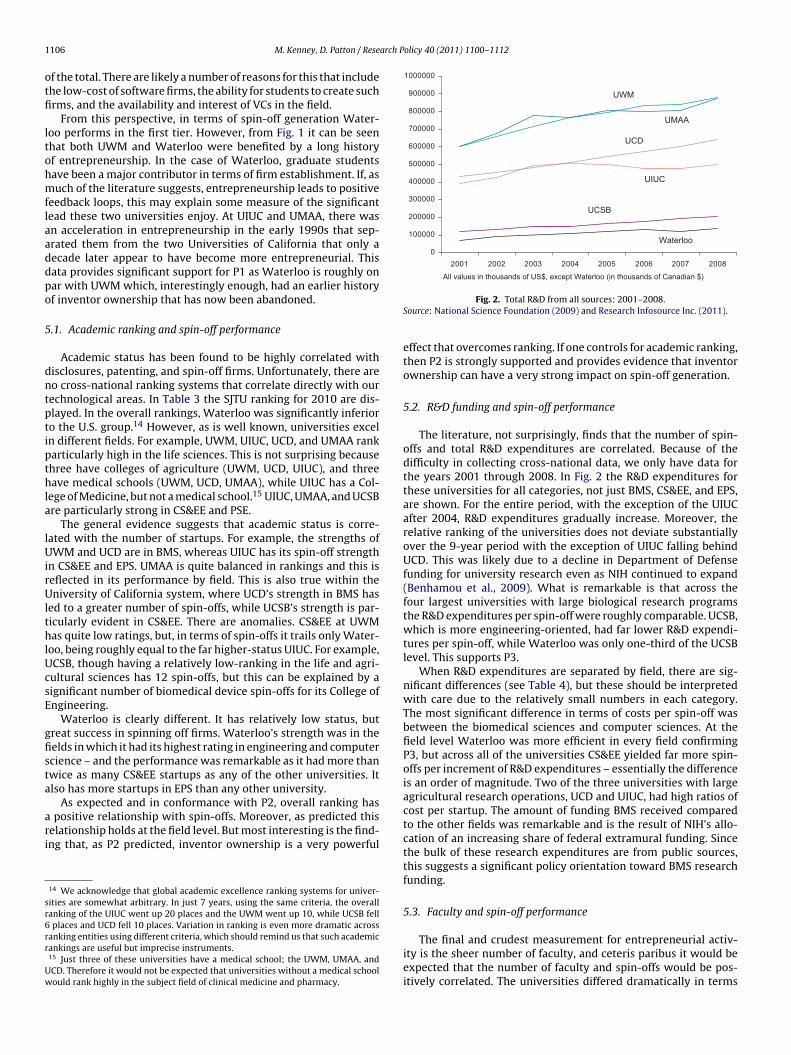
Fig. 2. Total R&D from all sources: 2001–2008.Source: National Science Foundation (2009) and Research Infosource Inc. (2011).
effect that overcomes ranking. If one controls for academic ranking,then P2 is strongly supported and provides evidence that inventorownership can have a very strong impact on spin-off generation.
5.2. R&D funding and spin-off performance
The literature, not surprisingly, finds that the number of spin-offs and total R&D expenditures are correlated. Because of thedifficulty in collecting cross-national data, we only have data forthe years 2001 through 2008. In Fig. 2 the R&D expenditures forthese universities for all categories, not just BMS, CS&EE, and EPS,are shown. For the entire period, with the exception of the UIUCafter 2004, R&D expenditures gradually increase. Moreover, therelative ranking of the universities does not deviate substantiallyover the 9-year period with the exception of UIUC falling behindUCD. This was likely due to a decline in Department of Defensefunding for university research even as NIH continued to expand(Benhamou et al., 2009). What is remarkable is that across thefour largest universities with large biological research programsthe R&D expenditures per spin-off were roughly comparable. UCSB,which is more engineering-oriented, had far lower R&D expendi-tures per spin-off, while Waterloo was only one-third of the UCSBlevel. This supports P3.
When R&D expenditures are separated by field, there are sig-nificant differences (see Table 4), but these should be interpretedwith care due to the relatively small numbers in each category.The most significant difference in terms of costs per spin-off wasbetween the biomedical sciences and computer sciences. At thefield level Waterloo was more efficient in every field confirmingP3, but across all of the universities CS&EE yielded far more spin-offs per increment of R&D expenditures – essentially the differenceis an order of magnitude. Two of the three universities with largeagricultural research operations, UCD and UIUC, had high ratios ofcost per startup. The amount of funding BMS received comparedto the other fields was remarkable and is the result of NIH’s allo-cation of an increasing share of federal extramural funding. Sincethe bulk of these research expenditures are from public sources,this suggests a significant policy orientation toward BMS researchfunding.
5.3. Faculty and spin-off performance
The final and crudest measurement for entrepreneurial activ-ity is the sheer number of faculty, and ceteris paribus it would beexpected that the number of faculty and spin-offs would be pos-itively correlated. The universities differed dramatically in terms

M. Kenney, D. Patton / Research Policy 40 (2011) 1100– 1112 1107
Table 32010 Shanghai Jiao Tong University global academic rankings, overall and selected technology categories.
Overall worldranking
Natural sciencesand mathematics
Eng, technologyand computerscience
Life andagriculturalsciences
Clinical medicineand pharmacy
Computer science
UWM 17 17 23 11 20 52–75UMAA 22 21 7 24 8 18UIUC 25 23 4 18 n.a. 13UCSB 32 19 15 51–75 n.a. 44UCD 46 46 46 21 n.a. 50Waterloo 151–200 n.a. 52–75
Source: Shanghai Jiao Tong University (2010).
Table 4R&D expenditures by university and technology field, 2005–2008 inclusive, $ mil-lions with R&D expenditures per spin-off in parentheses.
BMS CS&EE EPS Total
UWM 2199 104 866 3169(274.9) (20.8) (216.5) (186.4)
UMAA 2056 193 647 2896(228.4) (32.2) (323.5) (170.4)
UCD 1810 57 386 2253(452.5) (14.3) (77.2) (173.3)
UIUC 642 440 766 1847(642.0) (88.0) (127.7) (153.9)
UCSB 91 173 388 652(15.2) (43.3) (194.0) (54.3)
Waterloo 71 97 212 381(71.0) (6.1) (26.5) (15.2)
Total R&D 6869 1064 3265 111982005–2008 spin-offs 29 40 27 96
S
owloaoc
TUi
So
R&D$ per spin-off (236.9) (26.6) (120.9) (116.6)
ource: Authors’ database.
f the numbers of faculty by field and overall (see Table 5). Asas the case with R&D expenditures, the four universities with
arge BMS faculties were less efficient overall in generating spin-ffs. However, UWM was the most efficient on a per faculty basismong the large universities in generating BMS spin-offs. While
n a per faculty basis in BMS, Waterloo was not particularly effi-ient in generating spin-offs. UCSB’s efficiency was driven by theable 5niversity and technology field and number of faculty, 2006 except Waterloo which
s 2011 faculty per spin-off in parentheses.
MBS CS&EE EPS Total
UWM 1385 155 655 2195(173.1) (31.0) (163.8) (129.1)
UMAA 1790 172 1231 3193(198.9) (28.7) (615.5) (187.8)
UCD 1396 99 543 2038(349.0) (24.8) (108.6) (156.8)
UIUC 1023 276 821 2120(1023.0) (55.2) (136.8) (176.7)
UCSB 148 89 322 559(24.7) (22.3) (161.0) (46.6)
Waterloo 232 165 566 963(232.0) (10.3) (70.8) (38.5)
Total faculty 5974 956 4138 11,0682005–2008 spin-offs 29 40 27 96Faculty per spin-off (206.0) (23.9) (153.3) (115.3)
ource: National Research Council (2010) and calculated by authors from Universityf Waterloo departmental websites.
n.a. n.a. 76–100
spin-offs being from biomedical engineering, thereby expressingthe engineering efficiency rather than that of biology departments.
In overall terms, being concentrated in CS&EE and EPS allowedUCSB and Waterloo to appear most efficient on a per faculty basis.On a per faculty basis, Waterloo, once again, was the most efficienton a per faculty basis, thereby lending support to P4. One factorthat did not seem to affect Waterloo’s performance was that itsdepartments (and thus faculty) were not particularly highly ranked,therefore there were likely less star scientists (see, for example,Zucker et al., 1998). In comparative terms, UCSB was particularlystrong in star scientists having four science Nobel Prize winners,though this did not improve their total number of spin-offs.
5.4. The relationship between R&D expenditures, faculty, andspin-offs
To reasonably compare spin-offs across universities it is neces-sary to not only control for the field of technology, but to controlfor the capacity of a university to generate spin-offs. This sec-tion presents the data visually so it is possible to compare facultysize and R&D expenditures simultaneously. For each industry, thefigures display the inverse of the ratios reported in the previoussection, i.e., the ratio of spin-offs divided by R&D is plotted on theX-axis while the ratio of spin-offs over faculty is plotted on the Y-axis. It is important to note that the X- and Y-axis scales differ byfigure due to the differences between technology fields. Movementaway from the origin represents superior performance in terms ofspin-offs generated per R&D dollar or faculty member.
For the BMS, as Fig. 3 shows, all of the universities except UCSBare grouped together. UCSB stands out for efficiency because it has
relatively few faculty in the biomedical sciences and a relatively lowlevel of R&D funding in this area, but most importantly because itsspin-offs were in medical devices; a comparatively low-cost sub-Biomed ical Sc iences200 5 through 20 08
0.000
0.005
0.010
0.015
0.020
0.025
0.030
0.035
0.040
0.045
0.000 0.010 0.020 0.030 0.040 0.050 0.060 0.070
Spinoffs / R&D in millions of dollars
Spinoffs / Faculty
UWM (8)UMAA (9)UIUC (1)UCSB (6)UCD (4)Waterloo (1)5 US universities above
UMAA
UWM
UIUC Waterloo
UCD
UCSB
US Universiti es
Number of univ ersit y spinoff s in parentheses
Fig. 3. Biomedical sciences 2005 through 2008.Source: Author’s database.

1108 M. Kenney, D. Patton / Research Policy 40 (2011) 1100– 1112
Computer Sc ience & Elec trical Engineering2005 through 2008
0.00 0
0.02 0
0.04 0
0.06 0
0.08 0
0.10 0
0.12 0
0.000 0.02 0 0.04 0 0.060 0.080 0.100 0.120 0.140 0.16 0 0.18 0
Spinoff s / R&D in mill ions of doll ars
Spinoffs / Faculty
UWM (5)UMAA (6)UIUC (5)UCSB (4)UCD (4)Waterloo (16)5 US un iversities above
UMAA
UWM
UIUC
Waterloo
UCD
US Universities
UCSB
Number of uni versit y spinoffs in parenthese s
Fig. 4. Computer science and electrical engineering 2005 through 2008.Source: Author’s database.
Enginee ring and Phys ical Sc ience s2005 throug h 20 08
0.00 0
0.00 2
0.00 4
0.00 6
0.00 8
0.01 0
0.01 2
0.01 4
0.01 6
0.00 0 0.005 0.010 0.01 5 0.020 0.025 0.03 0 0.03 5 0.040
Spinoffs / R&D in mill ions of do llars
Spinoffs / Faculty
UWM (4)UMAA (2)UIUC (6)UCSB (2)UCD (5)Waterloo (8 )5 US univer sities abo veUMAA
UWM
UIUC
Waterloo
UCD
US Universit ies UCSB
Number of unive rsity spinoffs in parentheses
Fig. 5. Engineering and physical sciences 2005 through 2008.S
sc
agpWvot
Wvovadt
aosi
All Spinoff s2005 through 200 8
0.000
0.005
0.010
0.015
0.020
0.025
0.030
0.00 0 0.01 0 0.020 0.03 0 0.04 0 0.05 0 0.060 0.07 0
Spinoff s / R&D in mill ions of doll ars
Spinoff s / Facult y
UWM (17 )UMAA (17 )UIUC (12 )UCSB (12 )UCD (13 )Waterloo (25 )5 US un iversities ab ove
UMAA
UWM
UIUC
Waterloo
UCDUS Universitie s
UCSB
Number of unive rsity spinoffs in parentheses
been any experimentation with the institutional arrangements
ource: Author’s database.
ector of the biomedical sciences that came from the engineeringollege.16
In CS&EE, as Fig. 4 indicates, Waterloo’s performance is remark-ble, and though this is in part driven by the large number ofraduate student spin-offs the difference is dramatic. Waterloo’serformance also holds in EPS. As Fig. 5 indicates, the University ofaterloo boasts dramatically better performance than the U.S. uni-
ersities on a per R&D$ and faculty member basis. In EPS, inventorwnership appears to be far more efficient in generating spin-offshan university ownership.
In terms of efficiency regarding the total numbers of spin-offs,aterloo dramatically dominates all of the U.S. comparison uni-
ersities, though UCSB also performs well in spin-offs per dollarf R&D expenditures and per faculty (see Fig. 6). This result pro-ides some support Thursby and Kemp’s (2002) finding that TLOst smaller universities seemed to be more efficient. These figuresemonstrate how much more efficient Waterloo was and reiteratehe support for P3 and P4.
16 UC Santa Barbara spun off four medical devices firms. Had these been counteds engineering spin-offs rather than biomedical spin-offs the relative performancef UC Santa Barbara would have declined in biomedical sciences but increased sub-tantially in engineering and physical sciences. In either event its relative standingn total spin-offs would remain unchanged.
Fig. 6. All spin-offs 2005 through 2008.Source: Author’s database.
5.5. University licensing and entrepreneurship
In the university ownership regime, the rules vary as to whichpersons affiliated with the university must disclose their inven-tions made while undertaking R&D on campus to the TLO. At mostuniversities, disclosures and mandatory transfer of rights to theinventions is required from all employees, visiting scholars, andgraduate students. At these institutions, inventors wishing to com-mercialize inventions they developed on campus must receive alicense from the TLO. Obviously, at inventor ownership universitiesthere is no requirement to secure a license. This section exploreswhether there is a difference in startups licensing between inven-tor and university ownership regimes. There is reason to believethat the rate of licensing would vary by discipline for a numberof reasons and it is interesting to consider whether the pattern ofvariation differs by ownership regime. As Table 6 shows, Waterloospin-offs had the least number of licenses, thereby confirming P5.
Licensing is particularly significant in biotechnology as is thehigh level of faculty disclosure of inventions to the universitylicensing office. As might be expected, the BMS had the highestproportion of spin-offs (46.7%) with university licenses. Interest-ingly, though based on a very small number, at Waterloo BMSspin-offs were more likely to use the TLO and thus take a license.As Table 6 shows, the lowest proportion of licensed spin-offs isin CS&EE where only 18.1% are licensed. EPS is in between with31.5% of spin-offs being licensed. Overall licensing seems to be thegreatest at the three Midwestern universities, lower at UCD andUCSB,17 and very low at Waterloo where only five out of a total of138 spin-offs had university licenses. These results highlight theproblem of relying upon AUTM data to measure technology-baseduniversity startups and, in particular, for Waterloo with its inventorownership system. In public policy terms, this guaranteed underes-timation may not serve U.S. universities well at a time when publicsupport for universities is at low ebb.
6. Discussion
Despite the widespread interest, only recently has there
and obstacles to university-based entrepreneurship. Our resultsdemonstrate that inventor ownership has a positive effect on
17 In the case of the two Universities of California initially all TLO functions werecentralized in the University of California Office of the President. They were laterdecentralized to the campuses, so there may be an institutional memory problemwith underreporting of licensing in earlier cases.

M. Kenney, D. Patton / Research Policy 40 (2011) 1100– 1112 1109
Table 6Number of university spin-offs and percentage licensed by university and technology category, 1957–2010.
BMS CS&EE EPS Total
Total spin-offs % licensed Total spin-offs % licensed Total spin-offs % licensed Total spin-offs % licensed
UWM 78 47.3% 43 14.0% 19 36.8% 140 35.7%UMAA 37 67.6% 38 39.5% 13 38.5% 88 51.1%UIUC 8 87.5% 40 35.0% 24 58.3% 72 48.6%UCD 26 30.8% 6 33.3% 8 37.5% 40 32.5%UCSB 12 8.3% 17 29.4% 8 25.0% 37 21.6%
%
.1%
S
edsgutgtststte
saHpTstop
dtscmsoiaSewebce
WAtaoaioouP
dominates the better funded, more highly rated, and much largeruniversity ownership universities. Remarkably, the only universitythat had a history of inventor ownership, UWM, was Waterloo’s
Waterloo 8 12.5% 94 1.1Total 169 46.7% 238 18
ource: Authors’ database.
ntrepreneurship. It is remarkable that a relatively small Cana-ian university, though admittedly CS&EE-oriented, could performo well. P1 proposed that inventor ownership universities wouldenerate a greater number of spin-offs than university ownershipniversities. While UWM had the greatest number of spin-offs, ifhis was controlled for number of faculty, R&D expenditures, orlobal ranking, then Waterloo exhibited superior performance inerms of spin-offs. Among the four largest universities, UWM wasuperior on nearly every entrepreneurship metric. It is interestingo speculate if this was in any way linked to its earlier history ofupporting inventor ownership. In summation, our data indicateshat inventor ownership as a policy, with or without using con-rols, out-performs university ownership in terms of encouragingntrepreneurship.
Our results agree with those of earlier research in that higher-tatus universities have a greater propensity to generate spin-offsnd that this relationship holds at the technological field level.owever, the results also suggest that inventor ownership is aowerful intervening variable that can mitigate the role of status.his result is of great importance because it suggests that univer-ities and policy-makers aiming to encourage technology transferhrough entrepreneurship may be able to increase the performancef relatively low-status universities by loosening their intellectualroperty licensing regimes.
The existing literature suggests ceteris paribus that R&D expen-itures and the number of spin-offs are positively correlated. Inerms of the simple efficiency indicator of R&D expenditures perpin-off, Waterloo was superior to the U.S. universities, therebyonfirming P3. What was possibly more interesting was the dra-atic difference in efficiency in spin-off generation by field. BMS
pin-offs were an order of magnitude more expensive on a per spin-ff basis. Also, large agricultural research operations seemed toncrease the cost per spin-off for two universities, which is possibly
function of the difficulty of creating startups in the plant sciences.o the results confirm that inventor ownership appears to havefficiency benefits in converting R&D expenditures to spin-offs. Asas the case with academic ranking, absent an ownership-regime
ffect, R&D expenditures are correlated with numbers of spin-offs,ut it is also possible that smaller universities may also have an effi-iency benefit. Here again, ownership regime has a very powerfulffect.
In terms of spin-offs per faculty, our smallest universities,aterloo, was the most successful, but UCSB was quite close.
mong the four largest universities, UWM was the leader. Again,here was a dramatic difference in the number of spin-offs on
per faculty member basis with CS&EE generating roughly onerder of magnitude more spin-offs than BMS when examinedcross all universities. Overall the results once more suggest thatnventor ownership can have a positive impact on the propensity
f university personnel to establish spin-offs. A final interestingbservation is that the three most successful spin-offs from ourniversities; Research in Motion (Waterloo), Netscape (UIUC), andayPal (UIUC), were all established by CS&EE students.36 8.3% 138 3.6%108 31.5% 515 30.3%
As expected, Waterloo spin-offs had far fewer licenses than theU.S. universities. When considered across technology fields, thelowest percentage of licenses were in CS&EE where only 18.1%of the spin-offs secured licenses. BMS had the greatest percent-age of licenses (46.7%) with EPS in the middle (31.5%). In CS&EE,many of the spin-offs are in software, where there are more studentspin-offs and there is less likely to be a “paper trail” of laboratorynotebooks. Also, CS&EE spin-offs are less likely to need physicalfacilities such as laboratories, thereby diminishing the need tomaintain a linkage to the university. Both Waterloo and UCSB hadparticularly low licensing percentages in BMS, but at both universi-ties the BMS spin-offs included a number of biomedical device firmsthat usually require less costly facilities than do biopharmaceuticalspin-offs. These results also suggest that the utility of intermedi-aries such as a TLO may vary by discipline. A TLO or other skilledintermediary with significant resources may be more valuable to abiopharmaceutical firm than a software firm. The data on Waterloosuggests that this may be true as BMS had the highest percentageof licenses. This lends credence to the perception that TLOs con-centrate their proprietary efforts in the biopharmaceutical fieldbecause this is where their leverage and potential contributionsto spin-offs are the greatest. While only speculation, it suggeststhat even in inventor ownership cases, particularly those wherethe biomedical fields are strong, inventors will choose to use a TLO– provided, of course, it is perceived as competent and operating asa facilitator and not regulator.
7. Conclusion
These research results are tentative and subject to limitations.The greatest limitation is that Waterloo is the sole North Amer-ican pure inventor ownership university. Other variables such asthe local culture, university leadership, and TLO operation mayhave influenced our results.18 In regards to the differences in levelsof entrepreneurship by fields, different classifications would haveaffected the comparisons. However, given the striking differences,the results would have remained substantially the same. Our def-inition of a spin-off was extremely rigorous in terms of the firmhaving to be technology-based and the exclusion of the smallestfirms, though, here again, we believe the relative results would nothave changed.
Despite these caveats our results are striking. They suggest thatmore research and policy experimentation would allow a morescientific policy-making process to be undertaken. This examina-tion of the entire population of technology-based spin-offs from sixuniversities showed that the inventor ownership regime strikingly
18 With regard to influence of local and university culture, see, for example, Kenneyand Goe (2004) and Bercovitz and Feldman (2008).

1 arch P
mitdtaAais
aRaseCoem
bcplBttNhoit
ntpfbTtisUbua
Cdcoctistite
aemhm
110 M. Kenney, D. Patton / Rese
ost significant competitor. The argument that Waterloo’s successs because it is not as highly rated as the other universities andhereby has less interest in maintaining the highest academic stan-ards is dubious due not only to UWM’s example, but also to the facthat Stanford operated in an inventor ownership regime until 1994,s was the case for University of Cambridge in England until 2003.t the very least, the results show that in terms of entrepreneurialctivity, inventor ownership can overcome disadvantages includ-ng academic ranking, volume of R&D expenditures, and facultyize.
The ability of Waterloo to spin-off new firms matches UWMnd exceeds the other U.S. universities even as it has received less&D support and has done so with fewer faculty. Moreover, thisbility to generate spin-offs has not been confined to just a few areasuch as computer science, software, or internet applications, but isvident across a broad range of technology fields. This occurred in aanadian legal and financial system that, while very similar to thatf the U.S., is not as optimized for the support of high-opportunityntrepreneurship, thereby making Waterloo’s performance all theore remarkable.The value to society of university spin-offs is hard to estimate,
ut there can be no doubt that policy-makers globally are con-erned about this issue and there have been a proliferation ofrograms at the national, sub-national, and individual university
evel to improve research translation (Roberts and Malone, 1996;reznitz et al., 2008). This is being recognized by some universi-ies, as the introduction to this issue suggests in its discussion ofhe new North Carolina spin-off licensing initiative (University oforth Carolina, 2011). More recently, the University of Missourias loosened its ownership restrictions on student-developed spin-ffs. While half-way steps, they suggest a growing awareness of themportance of spin-offs for regional development and technologyransfer.
If it is accepted that entrepreneurship is important for eco-omic development and that this is a desirable social goal, thenhe social good would be served by reducing obstacles within thearameters of protecting the overall university as an institutionrom issues such as conflicts of interest. Waterloo accomplishes thisy requiring that all professorial linkages with firms be declared.he Waterloo example suggests that universities can improve theirechnology transfer activities dramatically by moving to morenventor control-centric policies and procedures. Entrepreneur-hip and technology transfer has repeatedly been identified as a.S. policy goal, however organizationally universities have erectedarriers to achieving this goal. Inventor ownership is a simple andnequivocal measure to assist this process. Waterloo, though only
single case, suggests that it can be successful.Our results should be welcomed by the National Research
ouncil, as they provide the first empirical test of the ability ofiffering ownership regimes to encourage technology commer-ialization through entrepreneurship. Though based on a singlebservation, these results suggest inventor ownership can be suc-essful and is remarkably efficient economically. It also suggestshat in the U.S., there is a cognitive capture mistaking the currentnstitutional configuration as a “natural” order; the TLO-centric per-pective has framed nearly all the thinking about entrepreneurialechnology transfer about university-affiliated personnel becom-ng entrepreneurs. The results presented here suggest that broaderhinking about, and experiments with, the types of invention own-rship regimes is long overdue.
Since our database includes student spin-offs, our resultslso invite speculation about the role of students in university,
ntrepreneurship, and technological progress. In our database, theost successful spin-off was Waterloo’s Research in Motion, whichas become a large and influential firm. Arguably, the next twoost influential and successful firms were Netscape and PayPal
olicy 40 (2011) 1100– 1112
(both later acquired). All three firms shared two characteristics:(1) they were founded by students, and (2) they were in the infor-mation technologies. Only Netscape licensed technology from theuniversity. This suggests that university students are a largelyunder-studied source of entrepreneurial university spin-offs (seeWennberg et al., in this issue and Astebro et al., 2011 for studies ofuniversity graduates and startups). Student spin-offs may be over-looked because they are difficult to identify or because they areoften in the information technology fields within which patent-ing and TLO involvement is less significant. Our data collectionmethodology is one method of overcoming these obstacles.
Universities operating under an inventor ownership systemcan successfully commercialize campus inventions and encourageentrepreneurship even in the North American environment wherethe dominant ideological position is that TLOs are necessary forsuccess. Because there are so few pure inventor ownership uni-versities Waterloo is only an example, which is not only a smallerand less highly ranked university, but also is heavily weightedtoward engineering and does not have a medical school. Despitethese handicaps, it performed exceptionally well in encouragingentrepreneurship. A corollary to this view is that TLOs cannot oper-ate in an inventor ownership regime when in fact Waterloo has asuccessful TLO. The Waterloo TLO, due to professorial ownership,operates as a service organization with an unconflicted mission ofassisting inventors in commercializing their inventions.
This paper goes some way in ameliorating the National ResearchCouncil’s concern that there was a lack of evidence on the effi-cacy of an inventor-driven system of technology transfer (Merrilland Mazza, 2010: p. 57). While the case of Waterloo certainly doesnot prove that inventor ownership is a superior system, no singleexample could do so, it is evidence that an inventor-driven sys-tem of technology transfer can perform very well. At the very leastit suggests that inventor ownership is an alternative to the currentuniversity intellectual property regime, and that the discussion hasmoved beyond anecdotal evidence and conjectural arguments.
Acknowledgements
The authors thank the Kauffman Foundation for partial fundingof this research. At each university, we thank those who shared timeand data with us. We thank Arvids Ziedonis and Elizabeth Hickeyfor providing the University of Michigan, Ann Arbor data. Numer-ous classes and students assisted in the compilation of this dataand we list them here. For the University of Waterloo, we thank ourstudent Samuel Chiang and Scott Inwood of Watco. For the compi-lation of the University of Wisconsin, Madison data we thank AmyNelson, Jessica Mullan and Marisela Rodriguez. We offer specialthanks to Anne Miner’s assistance in collecting data on the Univer-sity of Wisconsin and we drew extensively upon her Insite website.For the University of California, Davis data we thank Daniel Woo,Bernadette Austin, and David Magee. We thank Lesley Millar and J.Mark Nolan. Leslie Carbahal, Tsai-Yu Lam, and Leticia M. JáureguiCasanueva assisted in the data collection at the University of Illinois,Urbana-Champaign. For the University of California, Santa Barbaradata we thank Mishika Vora. The authors thank Thomas Astebro,Rosa Grimaldi, Donald Siegel, David Wolfe, and Mike Wright forhelpful suggestions. The order of the authors is alphabetical andeach made equal contributions to the paper. We are solely respon-sible for all of the conclusions in this paper.
References
Agrawal, A., Cockburn, I., 2003. The anchor tenant hypothesis: exploring the role oflarge, local, R&D-intensive firms in regional innovation systems. InternationalJournal of Industrial Organization 21 (9), 1227–1253.

arch P
A
A
A
A
B
B
B
B
B
B
B
B
B
B
B
C
C
C
C
C
C
D
D
D
D
F
F
F
F
G
G
H
I
I
M. Kenney, D. Patton / Rese
stebro, T.B., Bazzazian, N., Braguinsky, S., 2011. Start-Ups by UniversityGraduates Versus Faculty and Staff (downloaded on 29 January, 2011)http://ssrn.com/abstract=1752832.
udretsch, D.B., Lehmann, E.E., Warning, S., 2005. University spillovers and new firmlocation. Research Policy 34 (7), 1113–1122.
utio, E., 2007. Global Report on High-Growth Entrepreneurship. (Downloaded on29 January, 2011) http://www.gemconsortium.org./document aspx?id=606.
tkinson-Grosjean, J., 2002. Science policy and university research: Canada and theUSA, 1979–1999. International Journal of Technology Policy and Management 2(2), 102–124.
athelt, H., Hecht, A., 1990. Key technology industries in the Waterloo region:Canada’s Technology Triangle (CTT). The Canadian Geographer 34 (3), 225–234.
athelt, H., Kogler, D.F., Munro, A.K., 2010. A knowledge-based typology of universityspin-offs in the context of regional economic development. Technovation 30(9–10), 519–532.
enhamou, E., et al., 2009. Assessing the Impacts of Changes in the InformationTechnology R&D Ecosystem: Retaining Leadership in an Increasingly GlobalEnvironment. National Academies Press, Washington, DC.
ercovitz, J., Feldman, M., 2008. Academic entrepreneurs: organizational change atthe individual level. Organization Science 19 (1), 69–89.
erman, E.P., 2008. Why did universities start patenting? Institution-building andthe road to the Bayh-Dole Act. Social Studies of Science 38 (6), 835–871.
lack, B., Gilson, R., 1998. Venture capital and the structure of capital markets: banksversus stock markets. Journal of Financial Economics 47, 243–277.
lumenthal, D.M., Gluck, K.S., Louis, M.A., Stoto, M., Wise, D., 1986. University-industry research relationships in biotechnology: implications for theuniversity. Science 232 (4756), 1361–1366.
ramwell, A.N., Wolfe, D.A., 2008. Universities and regional economic development:the entrepreneurial University of Waterloo. Research Policy 37 (8), 1175–1187.
ramwell, A., Nelles, J., Wolfe, D.A., 2008. Knowledge, innovation and institutions:global and local dimensions of the ICT Cluster in Waterloo, Canada. RegionalStudies 42 (1), 101–116.
reznitz, S.M., 2008. Improving or impairing? Following technology transfer changesat the University of Cambridge. Unpublished manuscript made available byauthor.
reznitz, S.M., O’Shea, R.P., Allen, T.J., 2008. University commercialization strate-gies in the development of regional bioclusters. Journal of Product InnovationManagement 25 (2), 129–142.
arayannis, E.G., Rogers, E.M., Kurihara, K., Allbritton, M.M., 1998. High-technologyspin-offs from government R&D laboratories and research universities. Techno-vation 18 (1), 1–11.
arraz, R., 2008. Incentives to patent in a leading Japanese university. In: Paper Pre-sented at the SPF Project on Role of Universities in National Innovation Systems3rd Workshop , Beijing (30–31 October 2008).
happle, W., Lockett, A., Siegel, D., Wright, M., 2005. Assessing the relativeperformance of U.K. university technology transfer offices: parametric and non-parametric evidence. Research Policy 34, 369–384.
olapinto, C., 2007. A way to foster innovation: a venture capital district from SiliconValley and Route 128 to Waterloo region. International Review of Economics 54,319–343.
olyvas, J.A., Crow, M., Gelijns, A., Mazzoleni, R., Nelson, R.R., Rosenberg, N., Sampat,B.N., 2002. How do university inventions get into practice? Management Science48 (1), 61–72.
yert, R.M., March, J.G., 1963. A Behavioral Theory of the Firm. Prentice Hall, Engle-wood Cliffs, NJ.
avis, G.F., Thompson, T.A., 1994. A social movement perspective on corporate con-trol. Administrative Science Quarterly 39 (1), 141–173.
echenaux, E., Thursby, M., Thursby, J., 2009. Shirking, sharing risk and shelving:the role of university license contracts. International Journal of Industrial Orga-nization 27, 80–91.
iGregorio, D, Shane, S., 2003. Why some universities generate more TLO start-upsthan others? Research Policy 32 (2), 209–227.
outriaux, J., 2003. University–industry linkages and the development of knowledgeclusters in Canada. Local Economy 18 (1), 63–79.
eldman, M., Feller, I., Bercovitz, J., Burton, R., 2002. Equity and the technology trans-fer strategies of American research universities. Management Science 48 (1),105–121.
ini, R., Grimaldi, R., Santoni, S., Sobrero, M., in this issue. Complements or substi-tutes? The role of universities and local context in supporting the creation ofacademic spin-offs. Research Policy, forthcoming.
ini, R., Lacetera, N., Shane, S., 2010. Inside or outside the IP system? Business cre-ation in academia. Research Policy 39, 1060–1069.
riedman, J., Silberman, J., 2003. University technology transfer: do incentives, man-agement, and location matter? Journal of Technology Transfer 28 (1), 17–30.
euna, A., Nesta, L.J.J., 2006. University patenting and its effects on academicresearch: the emerging European evidence. Research Policy 35 (6), 790–807.
eorge, G., 2005. Learning to be capable: patenting and licensing at the WisconsinAlumni Research Foundation, 1925-2002. Industrial and Corporate Change 14(1), 119–151.
oye, K.A., 2006. University Intellectual Property Policies and University-IndustryTechnology Transfer in Canada. Ph.D. dissertation. Systems Design Engineering,
University of Waterloo Ontario, Canada.nsite, 2010. “INSITE Entrepreneurship Census”. http://www.bus.wisc.edu/insite/insite-census (accessed August 12, 2010).
nwood, S. (Director of Commercialization, Intellectual Property ManagementGroup), 2010. Telephonic Interview April 15, 2010, 10–11 am.
olicy 40 (2011) 1100– 1112 1111
Kenney, M., Goe, W.R., 2004. The role of social embeddedness in professorialentrepreneurship: a comparison of electrical engineering and computer scienceat UC Berkeley and Stanford. Research Policy 33 (5), 691–707.
Kenney, M., Patton, D., 2009. Reconsidering the Bayh-Dole Act and the current uni-versity invention ownership model. Research Policy 38, 1407–1422.
Landry, R., Amara, N., Rherrad, I., 2006. Why are some university researchers morelikely to create spin-offs than others? Evidence from Canadian universities.Research Policy 35, 1599–1615.
Langford, C.H., Hall, J., Josty, P., Matos, S., Jacobson, A., 2006. Indicators and outcomesof Canadian university research: proxies becoming goals? Research Policy 35,1586–1598.
Link, A.N., Siegel, D.S., Bozeman, B., 2007. An empirical analysis of the propensity ofacademics to engage in informal university technology transfer. Industrial andCorporate Change 16 (4), 641–655.
Litan, R.E., Mitchell, L., Reedy, E.J., 2007. The university as innovator: bumps in theroad. Issues in Science and Technology 23 (4), 57–66.
Lockett, A., Siegel, D.S., Wright, M., Ensley, D.M., 2005. The creation of spin-off firmsat public research institutions: managerial and policy implications. ResearchPolicy 34 (7), 981–993.
Lockett, A., Wright, M., 2005. The creation of spin-off firms at public researchinstitutions: managerial and policy implcations. Research Policy 34 (7),1043–1057.
Lowe, R.A., 2006. Who develops a university invention? The impact of tacit knowl-edge and licensing policies. Journal of Technology Transfer 31 (4), 415–429.
Lucas, M., Sands, A., Wolfe, D.A., 2009. Regional clusters in a global industry: ICTclusters in Canada. European Planning Studies 17 (2), 189–209.
Markman, G.D., Phan, P.H., Balkin, D.B., Gianiodis, P.T., 2005. Entrepreneurshipand university-based technology transfer. Journal of Business Venturing 20 (2),241–263.
Markman, G.D., Gianiodis, P.T., Phan, P.H., 2008. Full-time faculty or part-timeentrepreneurs. IEEE Transactions on Engineering Management 55 (1), 29–36.
Merrill, S.A., Mazza, A.-M. (Eds.), 2010. Managing University Intellectual Property inthe Public Interest. National Research Council, Washington, DC.
Mowery, D.C., Nelson, R.R., Sampat, B.N., Ziedonis, A.A., 2004. Ivory Tower and Indus-trial Innovation: University-Industry Technology before and after the Bayh-DoleAct in the United States. Stanford University Press, Stanford.
Mowery, D.C., Sampat, B.N., 2005. The Bayh-Dole Act of 1980 and university-industrytechnology transfer: a model for other OECD governments? Journal of Technol-ogy Transfer 30, 115–127.
National Research Council, 2010. A Data-Based Assessment of Research-DoctoratePrograms in the United States. The National Academies Press, Washington, D.C.
National Science Foundation, 2009. Survey of Research and Develop-ment Expenditures at Universities and Colleges. http://www.nsf.gov/statistics/srvyrdexpenditures (Accessed February 14, 2011).
Nelles, J., Bramwell, A., Wolfe, D.A., 2005. History culture and path dependency: theorigins of the Waterloo ICT cluster. In: Wolfe, Davis A., Matthew, Lucas (Eds.),Global Networks and Local Linkages: The Paradox of Cluster Development inan Open Economy. McGill-Queen’s University Press, Montreal & Kingston, pp.227–253.
Nelson, R.R., Winter, S.G., 1982. An Evolutionary Theory of Economic Change. Har-vard University Press, Cambridge.
Nicoloau, N., Birley, S., 2003. Academic networks in a trichotomous categorisationof university spinouts. Journal of Business Venturing 18, 333–359.
Niosi, J., 2006. Success factors in Canadian academic spin-offs. Journal of TechnologyTransfer 31, 451–457.
Ocasio, W., Kim, H., 1999. The circulation of corporate control: selection of func-tional backgrounds of new CEOs in large U.S. manufacturing firms, 1981-1992.Administrative Science Quarterly 44 (3), 532–562.
O’Shea, R.P., Allen, T.J., Chevalier, A., Roche, F., 2005. Entrepreneurial orientation,technology transfer and spin-off performance of U.S. universities. Research Pol-icy 34, 994–1009.
O’Shea, R.P., Chugh, H., Allen, T.J., 2008. Determinants and consequences of univer-sity spin-off activity: a conceptual framework. Journal of Technology Transfer33, 653–666.
Owen-Smith, J., 2005. Dockets, deals, and sagas: commensuration and the rational-ization of experience in university licensing. Social Studies of Science 35 (1),69–97.
Owen-Smith, J., Powell, W.W., 2001. To patent or not: faculty decisions and insti-tutional success at technology transfer. Journal of Technology Transfer 26 (1),99–114.
Pirnay, F., Surlemont, B., Nlemvo, F., 2003. Toward a typology of university spin-offs.Small Business Economics 21 (4), 355–369.
Powers, J.B., McDougall, P.P., 2005. University start-up formation and technol-ogy licensing with firms that go public: a resource-based view of academicentrepreneurship. Journal of Business Venturing 20, 291–311.
Powell, W.W., Koput, K.W., Smith-Doerr, L., Bowie, J.I., 2002. The spatial clusteringof science and capital. Regional Studies 36 (3), 299–313.
Research Infosource Inc., 2011. Research Infosource: Canada’s Source of R&D Intelli-gence. http://www.researchinfosource.com/about.shtml (accessed February 14,2011).
Roberts, E.B., Malone, D.E., 1996. Policies and structures for spinning off new com-
panies from research and development organizations. R & D Management 26(1), 17–48.Ross and Partners, 1972. The Canadian Computer Manufacturing Industry and theVenture Capital Market. Report to the Science Council of Canada. Unpublishedmimeograph in author’s possession.

1 arch P
R
S
S
S
S
S
S
S
S
S
112 M. Kenney, D. Patton / Rese
othaermel, F.T., Agung, S.D., Jiang, L., 2007. University entrepreneurship: a taxon-omy of the literature. Industrial and Corporate Change 16 (4), 691–791.
aisana, M., d’Hombres, B., Saltelli, A., 2011. Rickety numbers: volatility of universityrankings and policy implications. Research Policy 40 (1), 165–177.
hane, S., 2004a. Academic Entrepreneurship: University Spin-offs and Wealth Cre-ation. Edgar Elgar, Cheltenham, UK.
hane, S., 2004b. Encouraging university entrepreneurship? The effect of the Bayh-Dole Act on university patenting in the United States. Journal of BusinessVenturing 19 (1), 127–151.
hanghai Jiao Tong University, 2010. Academic Ranking World Universities.http://www.arwu.org/aboutARWU.jsp.
iegel, D.S., Waldman, D.S., Link, A.N., 2003. Assessing the impact of organiza-tional practices on the productivity of university technology transfer offices:an exploratory study. Research Policy 32, 27–48.
iegel, D.S., Waldman, D.S., Atwater, L., Link, A.N., 2004. Toward a model ofthe effective transfer of scientific knowledge from academicians to prac-titioners: qualitative evidence from the commercialization of universitytechnologies. Journal of Engineering and Technology Management 21 (1–2),115–142.
iegel, D.S., Wessner, C. Universities and the success of entrepreneurial ventures:evidence from the Small Business Innovation Research Program. Journal of Tech-nology Transfer, forthcoming.
o, A.D., Sampat, B.N., Rai, A.K., Cook-Deegan, R., Reichman, J.H., et al., 2008. Is
Bayh-Dole good for developing countries? Lessons from the US experience. PLoSBiology 6 (10), doi:10.1371/journal.pbio.0060262v.tuart, T.E., Ding, W.W., 2006. When do scientists become entrepreneurs? The socialstructural antecedents of commercial activity in the academic life sciences.American Journal of Sociology 112 (1), 97–144.
olicy 40 (2011) 1100– 1112
Suchman, M., 1995. Managing legitimacy: strategic and institutional approaches.Academy of Management Review 20, 571–611.
Thursby, J.G., Fuller, A., Thursby, M.C., 2009. US faculty patenting: inside and outsidethe university. Research Policy 38 (1), 14–25.
Thursby, J.G., Kemp, S., 2002. Growth and productive efficiency of university intel-lectual property licensing. Research Policy 31, 109–124.
Thursby, J.G., Thursby, M.C., 2007. University licensing. Oxford Review of EconomicPolicy 23 (4), 620–639.
Tolbert, P.S., Zucker, L.G., 1983. Institutional sources of change in the formal structureof organizations: the diffusion of civil service reform, 1880-1935. AdministrativeScience Quarterly 28, 22–39.
University of North Carolina, 2011. “Carolina Express License Agreement.”http://otd.unc.edu/starting a company.php (Accessed April 11, 2011).
University of Waterloo, 2010. A brief history of the University of Water-loo. http://uwaterloo.ca/aboutuw/history/briefhistory.php (Accessed August21, 2010).
Valentin, F., Jensen, R.L., 2007. Effects on academia-industry collaboration of extend-ing university property rights. Journal of Technology Transfer 32 (3), 251–276.
Wennberg, K., Wiklund, J. Wright, M., in this issue. The effectiveness of universityknowledge spillovers: performance differences between university spinoffs andcorporate spinoffs. Research Policy, forthcoming.
Wright, M., Clarysse, B., Mustar, P., Lockett, A., 2007. Academic Entrepreneurship inEurope. Edward Elgar, Cheltenham.
Xu, S.X., McNaughton, R.B., 2006. High-technology cluster evolution: a network anal-ysis of Canada’s Technology Triangle. International Journal of Entrepreneurshipand Innovation Management 6 (6), 591–608.
Zucker, L.G., Darby, M.R., Armstrong, J., 1998. Geographically localized knowledge:spillovers or markets? Economic Inquiry 36 (1), 65–86.