does foreign investment really improve corporate ...webfac/gourinchas/e281_f06/bo.pdfa conduit for...
TRANSCRIPT

1
Does Foreign Investment Really Improve Corporate Governance?
Evidence from Thailand
Sudarat Ananchotikul
University of California, Berkeley
This Draft: November 1, 2006
Abstract
It is widely argued that foreign investment is a mechanism for improving corporate governance in emerging markets. This paper challenges this convention wisdom using firm-level data on 365 Thai firms listed on the Thai Stock Exchange. I construct a firm-specific index of the quality of corporate governance and use econometric methods to test the hypothesis that foreign investment has a positive effect. Endogeneity problems are addressed by using long-standing statutory limits on foreign ownership as an instrument for foreign investment. The results show that the form of foreign investment matters. When foreign industrial companies buy large stakes, there is no improvement in corporate governance; if anything the opposite is true. It appears that foreign industrial investors act as insiders: they favor weak corporate governance because it allows them to exploit minority shareholders. In contrast, purchases of minority stakes by foreign institutional investors lead to improvements in corporate governance. I also find that corporate governance is poorer for firms whose major foreign owner comes from a country with relatively weak governance institutions.
I wish to express my deepest gratitude to Professor Barry Eichengreen for his continuous support, encouragement, and guidance during the research process. I am also indebted to Professor Pierre-Olivier Gourinchas, Professor Ann Harrison, Professor Ulrike Malmandier, Professor Edward Miguel, Professor Mark Seasholes, and Professor Akila Weerapana for very helpful comments. Financial support for data collection from the IBER mini-grant, UC Berkeley, is gratefully acknowledged. All errors are mine. *Department of Economics, University of California, Berkeley. Author’s e-mail contact: [email protected]

2
1. Introduction
A popular view among policy makers is that foreign ownership positively influences firm
performance and profitability. This view derives from the presumption that foreign investment is
a conduit for technology, capital, managerial skills, training techniques and various intangibles
that promote efficiency.1 Recently, good corporate governance has been added to the list of
potential benefits.2 Surprisingly, however, there has been little systematic work on this
relationship, especially for emerging market economies. This paper develops new evidence on the
linkage. It shows that the effect of foreign investment on the quality of corporate governance is a
good deal more complicated than commonly assumed and that its direction is sometimes contrary
to what is conventionally supposed.
Theories predicting a positive effect of foreign investment on corporate governance view
foreign investors as outside shareholders. Foreign equity investment—whether it is in the form of
joint ventures, multinational subsidiaries, takeovers, or even institutional portfolio investment—
results in foreigners becoming outside blockholders with the ability (through voting rights) and
the incentive (through cash-flow rights) to monitor incumbent management and force changes in
behavior that are in the interest of outside shareholders as a class (Shleifer and Vishny, 1986). In
addition, insofar as foreign corporate practices are superior to those prevailing in the host
economy, foreign ownership participation may provide information and encourage the adoption
of superior practices in areas such as information disclosure, internal checks and balances, and
accounting standards (OECD, 2002).
But do foreign investors always, in fact, act as minority investors seeking a better deal for
outside shareholders? If they acquire a controlling stake in a domestic firm, they may then have
the same incentive as other insiders to exploit minority shareholders. Ironically, the same sizeable
ownership stake that positions foreign owners to monitor management can also give them an
incentive to oppose governance reforms that undermine the position of the dominant blockholder.
Since foreign companies often acquire management control when they invest in emerging market
economies, it is at least conceivable that this perverse effect could be quite prevalent.3
1 See, among others, Dunning and Pearce (1977), Globerman (1979), Blomstrom (1986), Harrison (1996), Doms and Jensen (1998), and Kimura and Kiyota (2004)). 2 Since the quality of corporate governance is positively correlated with firm value (Black, 2002; Durnev and Kim, 2004; Klapper and Love, 2004), the link from foreign ownership participation to good governance and hence to high firm valuation seems to be a plausible direction of causality. 3 Moreover, in the case of Asian economies where hostile takeovers are rare and friendly negotiation is a customary way of doing business, foreign investors who become joint-venture partners tend to have personal ties with incumbent shareholders. The increase in value of equity holdings from monitoring thus may not generate sufficient motivation for foreign inside shareholders to press for more efficient behavior on the part of management. Rather,

3
Two theoretical arguments provide further grounds for questioning the existence of an
unconditional positive relationship between foreign ownership and the quality of corporate
governance. First, the entrenchment hypothesis of Morck, Shleifer, and Vishny (1988) predicts
that more equity ownership by the manager worsens financial performance because managers
with large ownership stakes may be so powerful that they do not have to consider other
stakeholders’ interest. This situation may apply to foreign owners, especially foreign industrial
corporations, since they usually participate in the firm’s management and operation.
Second, the theory of private benefits of control due to Bebchuk (1999) explains why
foreign inside shareholders may not have an incentive to improve corporate governance. It is their
position as large shareholders that provides them with potential private benefits— private in the
sense that they are not shared among all the shareholders in proportion of the shares owned—that
they can enjoy with relative ease if corporate governance is weak.4
Whether foreign ownership contributes to good corporate governance is ultimately an
empirical question. Unfortunately, two obstacles have stymied empirical work in this area. First,
it is difficult to measure the quality of corporate governance at the firm level. Previous work has
relied on limited information on variables such as board size, the share of independent directors,
the number of board meetings, shareholder activism, executive compensation, insider share
ownership, and takeover defenses to proxy for the effectiveness of governance.5 These proxies
capture only certain aspects of governance, and their validity as measures of overall corporate
governance quality depends on the assumption that they are correlated with other governance
practices.
The main contribution of this paper is the construction of a comprehensive corporate
governance index. Unlike other measures of corporate governance commonly used in previous
studies, this corporate governance index captures all major aspects of corporate governance:
board structure, board responsibility, conflict of interest, shareholder rights, and disclosure and
transparency. As many as 87 company attributes related to corporate governance are evaluated
using information from various publicly-available sources such as company disclosure reports, they might find it in their interest to cooperate with other larger blockholders to gain private benefits at the expense of small shareholders. 4 Private benefits may be in the form of outright transfers of assets out of the company for the benefit of those who control them (termed “tunneling” by Johnson, LaPorta, Lopez-de-Silanes, and Shleifer, 2000), unreasonably high compensation for directors who typically are the same people as or related to the controlling shareholders, or capital gains from trading stocks on insider information. The existence of private benefits of control is documented by Barclay, Holderness, and Pontiff (1993), Dyck and Zingales (2004) and Nenova (2003). 5 Board size was used by Yermack (1996); the ratio of independent directors by Klein (1998); executive compensation by Mehran (1995); number of board meetings by Vafeas (1999); insider ownership by Hermalin and Weisbach (1991); institutional ownership by Hartzell and Starks (2003); and anti-takeover provisions by Gompers, Ishii, Metrick (2003).

4
annual reports, company websites, and Stock Exchange of Thailand (SET) databases.6 The
overall index is a weighted average of the scores given to the five components; higher scores
indicate better governance practices. Using this method, I assess the corporate governance quality
for each of 365 non-financial Thai firms listed on the SET in 2004, and for 315 companies in
2000.7 My index is positively correlated to alternative measures of corporate governance—such
as the board of director independence, the number of board meetings, and the existence of
employee stock option program—by construction. Also, the fact that this index is positively
correlated to firm value, as well as minority shareholdings, further confirms the reliability of this
index as a measure of the true quality of corporate governance.8
A second obstacle is the possibility of reverse causality running from the quality of
corporate governance to the foreign ownership decision. To address this problem I exploit the law
on foreign business in Thailand and use the foreign ownership limit as a potential instrument for
actual level of foreign ownership. This foreign ownership limit specifies maximum foreign
shareholdings allowed in individual Thai firms as a function of the type of business activities in
which the firm is engaged. This ownership regulation can be regarded as exogenous for two
reasons: 1) these foreign limits were adopted for reasons which are unrelated to the quality of
corporate governance—such as national security, protection of culturally sensitive business, and a
pursuit of primary economic goals at the time the law was issued;9 and 2) this foreign business
law was established in 1972,10 since which time the Thai capital market and economy have has
evolved substantially. This foreign limit turns out to be a powerful instrument for actual foreign
ownership, making it credible to assert that the association between foreign ownership and the
governance measure is a causal relationship rather than simply a correlation.
6 To date, existing studies that measure firm-level corporate governance by constructing an index similar to the one used in this paper are Black, Jang, and Kim (2005) on Korea, Lefort and Walker (2005) on Chile, and Cheung et al. (2005) on Hong Kong. However, these studies rely on survey data, as opposed to publicly available data, in constructing their indexes. Problems with using survey data on corporate governance are discussed in the Data and Variables section. 7 In 2000, there were 381 companies listed on the SET. In 2004, 436 companies were listed on the SET, of which 66 were financial companies and 40 were companies under rehabilitation. In 2000, 381 companies were listed on the SET. 8 The firm value is measured using Tobin’s q. A set of firm-specific variables are included as control variables in a regression of Tobin’s q on the corporate governance index. Endogeneity is controlled for using “foreign ownership limit” discussed in the next paragraph of the main text. 9 The Foreign Business Law (1972) is believed to be part of an export-push policy of the Thai government during 1972 to 1992. This export-promotion was driven by the major balance of payments problems that Thailand faced in the 1960s resulting from a substantial increase in the importation of raw materials and machinery in the 1960s. Thus, under the Foreign Business Law (1972), a high ratio of foreign equity ownership in export-oriented sector was allowed, while foreign participation in non-tradable services was highly restricted (Thanadsillapakul, 2004). 10 Some slight modifications were made to the law in 1999 to adapt to changes in economic conditions.

5
In my baseline model I regress these measures of corporate governance, appropriately
instrumented, on foreign ownership, controlling for firm characteristics such as size, age,
performance, growth, exporter dummy, business-group dummies, and industry dummies. The
results challenge the presumption that foreign investors are always effective outside monitors. I
find that foreign ownership actually leads to worse corporate governance on average. This result
is robust to controlling for various firm characteristics and endogeneity.
I then divide foreign ownership into foreign industrial and foreign institutional ownership
on the presumption that foreign industrial owners are more frequently corporate insiders than are
foreign institutional investors, since foreign industrial owners typically take on a significant
ownership stake.11 I find that foreign industrial ownership negatively and significantly affects the
quality of corporate governance, and it is the dominance of this type of foreign ownership in the
data that drives the result for aggregate foreign ownership. Evidently, foreign industrial owners
favor weak corporate governance, because poor internal governance makes it easy for them, as
inside investors with control over cash flow rights, to exploit minority shareholders. For
institutional investors (financial institutions and the like), the story is different. These foreigners
tend to hold minority stakes and hence press for governance reforms that strengthen the rights of
minority investors. Apparently, the particular form that foreign investment takes matters
importantly for its implications for the quality of corporate governance.
To further test the private-benefits-of control hypothesis, I examine abnormal returns on
equity holdings using the three-factor Fama-French (1993) model. I regress the estimated
abnormal returns on foreign ownership and other firm characteristics. I find that foreign industrial
ownership is associated with lower abnormal returns even after controlling for endogeneity,
suggesting that private benefits of control may indeed be extracted before the company profits are
distributed to shareholders.
I also test whether the effects of foreign ownership on corporate governance are in part a
function of the quality of corporate governance in the country that is the source of the foreign
investment. I find that Thai firms owned by investors from countries with corporate governance
ratings lower than Thailand have worse governance than their peers, but Thai firms owned by
investors from higher ranking countries do not have better governance. This implies that bad
governance is easier than good governance to be transferred across borders. This is consistent
with a finding from a study of private benefits of control that the premium paid for control is
11 Average holding by an individual foreign industrial owner (in the form of joint ventures or multinationals) is 34 percent, as opposed to 2.7 percent for an individual foreign institutional investor. About 87 percent of foreign industrial owners in the sample hold management and/or board positions.

6
higher when the acquirer is from a country that protects investors less “and thus is more willing
or able to extract private benefits” (Dyck and Zingales, 2003).
Finally, motivated by a finding in La Porta, et al. (1998), I group countries by legal origin.
Here, once again, I find little support for conventional wisdom: source countries whose legal
origin is found to be associated with good governance do not appear to contribute
disproportionately the quality of governance of Thai corporations.
This paper proceeds as follows. Section 2 describes the sample and the construction of the
corporate governance index. Section 3 contains the empirical methodology. Section 4 presents
summary statistics and the estimation results. Section 5 concludes the paper.
2. Data and Variables This study uses firm-level data for 365 Thai firms in the non-financial sector. Only
publicly traded companies listed on the Stock Exchange of Thailand (SET) are analyzed due to
the absence of governance information for non-listed companies. However, limiting the sample to
public companies should not be problematic since foreign investment in private firms is only
fractional, and corporate governance issues such as principle-agency problems and expropriation
from minority shareholders are potentially more severe when firms are large and publicly traded
with numerous small shareholders forming the ownership structure. A private firm in Thailand is
typically controlled by a single family who actively involves in all aspects of the firm. Thus,
corporate governance problems and effective governance mechanisms can be vastly different
between these public and private firms and should be investigated separately.
Construction of Corporate Governance Index
A contribution of this study is to construct quantitative measures of corporate
governance—a Corporate Governance Index (CGI)—for as many as 365 of 436 Thai listed
companies in 2004, and 315 of 381 companies in 2000.12 This index runs from 0 to 100 with
higher values indicating better corporate governance. I collect information for each company
from publicly available sources including the mandatory Annual Disclosure Report (Form 56-1),
company annual reports, corporate websites, the web-based SET Market Analysis and Reporting
Tool (SETSMART), and the SET’s Director Database. Additional information such as corporate
violations of the Stock Exchange rules is obtained from the Securities and Exchange Commission
(SEC)’s database.
12 Financial companies and newly listed companies are excluded from the sample.

7
Most previous studies constructing a governance index rely on survey responses from
companies’ administrators or executives.13 Although a questionnaire can be designed to acquire
in-depth information on a company, self-evaluation of corporate governance is problematic
because it touches upon issues very sensitive to the well-being of the company. Consequently, a
low response rate and self-selection can be expected. Moreover, if firms with poor governance
were to misreport, then these survey-based ratings would not measure the strength of governance
at all. To circumvent these potential problems of survey-based governance rating, I use only
public information available on each company, in the spirit as Cheung et al. (2005), to construct
the governance index used in this study. This is a more comprehensive measure of the corporate
governance practices of Thai companies since it incorporates all crucial elements of standard
governance principles, applied to the case of Thailand.
There are a total of 87 questions. Of these, 76 questions are classified into five
governance components: 1) Board Structure 2) Conflict of Interest 3) Board Responsibilities 4)
Shareholder Rights, and 5) Disclosure and Transparency. The remaining questions capture
specific firm attributes pertaining to corporate governance but the direction in which they affect
the firms is uncertain a priori: for example, whether the chairman of the board of directors and the
CEO are members of the controlling family; what percentage of the total shares of the firm are
held by the chairman and the CEO; what percentage of the total shares are held by minority
shareholders; whether the firm has consolidated companies. These elements are excluded from
computation of the overall corporate governance index. However, their empirical correlations
with the subindexes and the overall index will be examined to gain more insight into the pattern
of corporate governance of Thai listed companies.
Scores are given to each of the governance items and grouped into five categories to
create subindexes. The CGI is then computed as a composite index by taking a weighted average
of the subindexes. Details on scoring and weighting schemes can be found in Appendix A.
The same method is used to construct the CGI for the year 2000 except that the number of
applicable governance questions falls from 87 to 56. Almost half of the questions that dropped off
concern the existence and quality of elements that cannot be assessed contemporaneously such as
the information that existed on company websites during the year 2000. The rest are unavailable
due to changes in disclosure standards and due to the implementation of corporate governance
reforms that came in effect after year 2000. The reduced set of questions is used to calculate an
13 With an exception of Cheung et al. (2005) which uses only public information in constructing an index for 165 Hong Kong listed companies.

8
alternative CGI for 2004 that is comparable with the CGI for 2000 when performing panel data
analysis. The two versions of the CGI for 2004 are strongly correlated.
Foreign Ownership Variables
Data on equity ownership is obtained mainly from the SET database, which provides a list
of all shareholders owning at least 0.5 percent of each listed company. Classification of foreign
shareholders into individual investors, industrial corporations, banks, and non-bank financial
institutions, is based on the information in each company’s Annual Disclosure Report (Form 56-
1) and the foreign investors’ website if available. Whether a foreign company is a joint-venture
partner can also be determined using these sources. Data on foreign ownership classified by
nation is obtained separately from the SET Market Analysis and Reporting Tool (SETSMART)
database.
Control Variables
A number of firm-level variables that may affect the quality of corporate governance are
included as control variables. Data on market capitalization, firm age, return on assets, sales
growth, and industry classification are obtained from the Stock Exchange of Thailand (SET)
database. Exporter information is extracted from Thailand Exporters Directory, Department of
Export Promotion, Ministry of Commerce, Thailand, available at
http://www.thaitrade.com/go/home. Family business groups and state enterprises are identified
using ownership information from the SET database, a Brooker Group publication: Thai Business
Groups: A Unique Guide to Who Owns What, and information on privately-owned companies
from Department of Business Development, Ministry of Commerce available in Thai only at
http://www.dbd.go.th/regis/index.phtml (see Appendix B for details on a construction of various
types of ownership variables).
3. Model Specification 3.1 Baseline OLS Regression
To test hypotheses about the relationship between foreign ownership and corporate
governance, a basic cross-sectional OLS regression model can be specified as:
0 11
K
i i k ki ik
CGI Foreign xβ β γ ε=
= + + +∑ (1)

9
where CGI is the corporate governance index; 0β is a constant; Foreign is the percentage of total
shares held by foreign residents; x is a vector of control variables; andε denotes a standard i.i.d.
disturbance. The subscript i is used to denote individual firms. Control variables include firm size
(log of market capitalization), firm age (log of number of years since establishment), firm
performance (return on assets), firm growth (percentage change in sales), an exporter dummy, a
family-business-group dummy, a state-enterprise dummy, and industry dummies.
Potential endogeneity in the relationship between foreign ownership and corporate
governance exists if corporate governance also determines foreign investment—the quality of
corporate governance is an important factor for foreign investors in making investment decisions.
Foreign investors could be attracted to firms that already have good governance standards than
firms with poor governance, because they have less fear of expropriation by local shareholders, or
because they know more about these firms due to the firms’ superior information disclosure and
transparency. There is also the possibility that some foreign investors are drawn to firms with bad
corporate governance—new foreign owners may identify such firms as offering opportunities for
them to come in, clean up the firm, and raise its value before selling for a profit. This has been
the case for the takeovers of many Thai and Korean companies by overseas institutional investors
after the outbreak of the East Asian crisis when the financial systems became paralyzed by debt
burdens in form of non-performing loans (NPLs).
3.2 Instrumental Variables Approach
I exploit the distinctive rules governing foreign investment in Thailand to identify an
appropriate instrument for foreign ownership. Firms registered in Thailand must comply with the
foreign ownership restrictions imposed by the Foreign Business Act of Thailand. The Act divides
business into three categories named List 1, List 2 and List 3. Business activities that fall under
List 1 are most restricted to foreigner, followed by activities categorized under List 2 and List 3,
respectively. Businesses not covered by this Act are open to full foreign ownership.14 A complete
list of business activities under the three categories is provided in Appendix C.
The categorization of restricted business activities was based on reasons unrelated to
corporate governance such as national security, protection of culturally sensitive sectors, and a
14 Under List 1, businesses are strictly prohibited to foreigners unless there is an exception contained in a special law or a treaty. Businesses under List 2 are those related to the national safety or security or affecting arts and culture, tradition, folk handicraft or natural resources and environment; minority foreign ownership is possible without permission and up to 60 percent foreign ownership is possible with ministerial approval. List 3 contains businesses that Thai nationals are not ready to compete with foreign operators; minority foreign ownership is possible without permission and majority foreign ownership is possible with permission from the Director General and a committee.

10
pursuit of macroeconomic policy at the time of establishment of the law.15 This, together with the
fact that the law was put in place in 1972 and hence was not influenced by corporate governance
of today’s companies, substantiates the exogeneity of the foreign ownership limit and makes it a
plausible instrument for actual foreign ownership.
Foreign ownership limit ( Flimit ) is also strongly correlated with the actual foreign
ownership (correlation coefficient = 0.784, P-value = 0.000). To statistically examine the validity
of Flimit as an instrumental variable, I conduct a Hausman overidentifying restrictions test on a
two-stage least squared (2SLS) regression model, where in the first stage actual foreign
ownership is regressed on Flimit as well as other independent variables from equation (1); in the
second stage, the corporate governance measure is then regressed on the fitted value from the first
stage and the control variables. The statistic obtained from the Hausman test is close to zero,
which indicates that the null hypothesis that there is no correlation between the exogenous
instrument and the error term from the second stage equation can not be rejected, supporting the
null that Flimit is indeed exogenous to the regression system.
3.3 Panel Regression Models
A second aspect of my empirical strategy is to use a fixed effects model or a random
effects model with panel data in an attempt to reduce omitted variables bias. The panel data
model can be specified as:
0 11
K
it it k kit i itk
CGI Foreign xβ β γ α ε=
= + + + +∑ (2)
where the α term denotes either the fixed or random effects.16
Choosing between fixed- and random-effects models is generally done by implementing a
Hausman test which tests the null hypothesis that theα ’s and the independent variables are
uncorrelated. Under this null, the coefficients estimated by the efficient random effects estimator
are the same as the ones estimated by the consistent fixed effects estimator. Using a full model,
the Hausman test rejects the null hypothesis ( 2 (11)χ = 86.63), suggesting that the individual
15 See footnote 8. 16 The fixed effects model makes use of within-firm variation over time, while the random-effects model uses both between- and within-firm variations over time and treats firm-specific disturbance as a random draw from a zero-mean distribution assumed to be uncorrelated with the independent variables. Statistically, the fixed effects model always gives consistent results but may not be the most efficient model to run; the random effects model gives a more efficient estimator and should be used if it is statistically justified.

11
effects are correlated with the other variables in the model. Thus, fixed effects model is the more
appropriate choice.17
4. Empirical Results 4.1 Governance of Thai Publicly-Listed Companies
Table 1 presents summary statistics for the CGI and the subindexes for the 365 sample
companies in 2004. The overall CGI with unequal weights for the subindexes ranges from 25.75
to 90 with a mean score of 53.25 (on a scale from 0 to 100 with a larger number indicating better
corporate governance). Summary statistics for the CGI with an equal weight given to each of the
subindexes does not differ much from that of the overall CGI. The CGI calculated here is by and
large consistent with the corporate governance ratings determined by the Thai Institute of
Directors Association (Thai IOD); seven out of the ten non-financial companies with the highest
CGI in 2004 are in the list of the top ten companies rated by the Thai IOD (which includes both
financial and non-financial corporations).18,19
As shown in Table 2, companies in the resource sector have the best corporate
governance, with an average score of 67.84, followed by firms in the technology industry which
has a mean index score of 57.65. The worst average scores belong to companies under
rehabilitation; these firms were in the process of financial restructuring and were not compelled
to hold an annual shareholder meeting nor required to meet the same disclosure standards as
companies under normal conditions. Panel B of Table 2 shows that corporate governance quality
improves with company size. This is not surprising given that larger companies have more
resources to devote to improving their governance. They also may have more incentive to do so
than smaller firms since they have a greater need to access external capital. The fact that large
firms tend to be scrutinized more intensively than small firms might also motivate the top-tier
firms to strive for the best governance practices.
17 Although a combination of panel and IV estimations would be optimal as to control both endogeneity and omitted variables bias, this combined method is not feasible because the instrumental variable, Flimit , is invariant over time. 18 With cooperation from the SET, the SEC, and McKinsey & Company in Thailand, and financial support from the World Bank, the Thai IOD initiated a program called “Baselining Corporate Governance Practices of Thai Listed Companies” in 2001. Under this program, the Thai IOD ranks Thai listed companies based on their corporate governance performance. Similar to my index, the Thai IOD index uses only publicly available information in their governance assessment. Their results in aggregate and a list of the top 50 companies are presented to the public while governance scores on individual companies remain confidential. 19 The top five companies according to the CGI in 2004 are the Petroleum Authority of Thailand (90.46) PCL, Banpu PCL (86.71), the Siam Cement PCL (86.34), Ratchaburi Electricity Generating Holding PCL (83.92), and the Bangchak Petroleum PCL (82.66). It is interesting to note that these top corporate governance companies all belong to the national resources sector, and four of them are state-owned enterprises.

12
Summary statistics for some attributes of the sample firms in 2004 are shown in Table 3.
A typical board of directors consists of 8 to 15 directors. Three firms in the sample have only 5
directors, the smallest board size allowed by the SEC. Seven firms have 20 or more directors.
Although the size of the board should not matter for corporate governance as much as the quality
of the board, it is generally believed that a board composed of more than 12 directors is too large
to have an effective decision-making and to encourage personal involvement in monitoring
(Yermack, 1996). Thus, in scoring for corporate governance index, I award 1 point to a company
if its board is composed of 5 to 12 directors and 0 if the board size is larger than 12.
Non-executive directors, especially independent ones, are a mainstay of good
governance.20,21 Their presence forms a balance with executive directors to ensure that an
individual person or group cannot unduly influence the board’s decisions. Their independence
further enables them to act objectively and to exercise independent judgment regarding tasks
where there is a potential conflict of interest. In the sample data, non-executive directors make up
about two-thirds of the board membership on average.22 About half of the companies in the
sample have independent non-executive directors accounting for at least one-third of board
membership (median statistics, not shown in the table). This is an improvement when compared
with 21 percent of the sample firms with this attribute in 2000.23
However, the separation of monitoring and management may be less clear than suggested
by the ratio of non-executive directors—as many as 38 percent of the firms have the same
individual acting as both the CEO and board chairman or vice chairman. The management-
oversight role of the board is limited when the chairman of the board is also the leader of the 20 A non-executive director is a member of the board of directors of a company who does not form part of the executive management team. A non-executive director is defined as an independent director if he or she is independent of any major shareholder or management, is not an employee of the company or its affiliation, and is not involved in a day-to-day operations of listed companies. The SET has issued the “Code of Best Practices for Directors of Listed Companies” in October 1999 which provided guidelines for all board members concerning their behavior while holding director appointments. It does not require a minimum number of non-executive directors but it mandates that audit committee members, all of whom must be independent as defined by the SET, must be appointed as directors of the company. 21 For instance, the Cadbury Report (1992) states that “the Committee believes that the caliber of the non-executive members of the board is of special importance in setting and maintaining standards of corporate governance.” Higgs Review (2003) states “a board is strengthened significantly by having a strong group of non-executive directors with no other connection with the company. These individuals bring a dispassionate objectivity that directors with a closer relationship to the company cannot provide.” 22 This average ratio of non-executive directors to total number of directors of the Thai companies is considered healthy by U.S. and U.K. standards. U.S. Business Roundtable (Deloitte & Touche Review) suggests that the majority of directors of a corporation should be non-executive directors. U.K. Hampel Committee advises a company to have at least one-third of the board consisting of non-executive directors for the board to be effective in the oversight role. 23 The SEC and the SET require listed companies to appoint at least 2 independent directors. This requirement is in an absolute term regardless of the total number of the board members or the proportion of shares held by the public. The independent-director ratio of zero in the data reflects that companies had no disclosure on the independence of the board of directors.

13
executive team. Moreover, roughly 50 percent of the companies appointed a member of the
controlling family to be the CEO. This is consistent with the notion that separation of
management from ownership control is rare and hence that there is high probability of
entrenchment by controlling shareholders.24
Table 4 shows that the CGI and each of the five subindexes are positively correlated. The
other variables in the correlation matrix are firm attributes that do not enter the calculation of the
CGI. The negative correlations between the CGI and proxies for the extent to which ownership
overlaps with monitoring and/or management of the firms (eg. the CEO or the Chairman is a
controlling-family member, share ownership of the CEO and the Chairman) reinforce the notion
of entrenchment by large shareholders. Consistent with this pattern, the relationship between
“freefloat” shareholdings, i.e. minority shareholdings, and the CGI indicates that the more widely
held a firm is, the better its corporate governance.25
4.2 Regression Analysis
4.2.1 Does Foreign Ownership Improve Corporate Governance?
Table 6 Columns (1) through (3) report the set of results from cross-sectional OLS
regressions using 2004 data. The inverse relationship between foreign ownership and governance
already manifests themselves in these baseline regressions. The corporate governance measure is
negatively correlated with aggregate foreign ownership conditional on firm size, and the
coefficient estimate on foreign ownership is robust to controlling for other determinants of
corporate governance including industry dummies (regressions 2 and 3). This negative
relationship between the corporate governance measure and foreign shareholdings remains strong
in pooled-data OLS estimation (regression 4) and in panel random-effects and fixed-effects
estimations (regressions 5 and 6). The coefficient on foreign ownership increases in absolute
value from -0.076 in the cross-sectional OLS regression to -0.166 in the panel fixed-effects
regression.
To mitigate plausible endogeneity, I also report IV estimates (Table 7). The foreign
ownership limit is used to instrument for actual foreign ownership in the first stage. The first-
stage relationship between foreign limits and actual foreign ownership is strongly positive:
foreign limit is significantly related to foreign ownership at over 99 percent confidence even
when other controls are included. The F-test for foreign limit in the first-stage regression (F- 24 Expropriation of minority shareholders by controlling shareholders is viewed as a primary agency problem in East Asia. See La Porta et al. (1999) and Claessens et al. (2000). 25 The “freefloat” of a listed security is the proportion of shares available for purchase in the market by minority investors. See the SEC’s definition of “free float” at the end of Table A1, footnote 7.

14
statistic = 156.91 for regression 3) indicates that foreign limit is a strong instrument, suggesting
that the IV estimates are unbiased.
The IV estimate yields a point estimate of -0.139 on foreign ownership in the second-
stage regression which is significant at 99 percent confidence. Since foreign ownership is
instrumented, we can assert a causal relationship that foreign investment adversely affects the
quality of corporate governance of local firms. This IV estimate (Table 7, regression 3) is more
negative than the analogous OLS estimate (Table 6, regression 3) when all controls are included,
suggesting that the adverse effect of foreign ownership on corporate governance can generally be
offset by the attractiveness of good governance to foreign investors when making investment
decision.
For a robustness check, I replace firm-specific log market capitalization, return on asset,
sales growth, and export propensity with their industry averages on a possibility that these control
variables may be endogenously determined by the level of corporate governance.26 In this
regression, the coefficient on foreign ownership remains negative and statistically significant
across all models except for a baseline OLS regression.27
To further test the sensitivity of the results, I divide the sample into different sub-samples
using thresholds on state ownership, firm size, and foreign participation.28 I find that the negative
effect of foreign ownership is more important for firms with small state ownership, high market
capitalization, and large foreign participation. Since all these three criteria are associated with
larger foreign ownership, this finding is consistent with the presumption discussed earlier that
foreign owners may weaken corporate governance if they have the ability and the incentive to do
so through their significant voting rights and cash-flow rights associated with their sizeable
shareholdings.
4.2.2 Does the Type of Foreign Investor Matter?
The foreign ownership variable used so far is measured in aggregate. An interesting
question to investigate is whether different types of foreign investors affect corporate governance
differently. I create two dummy variables to capture relative importance of foreign industrial
ownership and foreign institutional ownership: a “foreign industrial ownership dummy” that
equals 1 if firm is a joint venture with foreign industrial partners who own at least 10 percent of
26 Industry dummies are dropped in this regression. 27 The absolute value of the coefficient on foreign ownership declines for the OLS, IV, pooled OLS, and random-effects models but increases in the fixed-effects model. 28 The threshold for state ownership is 20 percent; market capitalization 9.6 billion baht (mean); foreign ownership 20 percent.

15
total shares, 0 otherwise; and a “foreign institutional ownership dummy” that equals 1 if firm is
not an industrial joint venture and at least 10 percent of total shares is held by foreign institutional
investors, 0 otherwise. There are 80 firms in the sample that fall in the former case, and 58 firms
the latter case. The rest of the firms, which comprise a baseline group, either do not have
substantial foreign ownership (median foreign ownership of this group = 2.9 percent; mean = 6.8
percent) or it is not clear which type of foreign investors dominates.
The two types of foreign ownership are significantly correlated to the measure of
corporate governance but in the opposite directions (Table 8, regression 1): foreign industrial
owners are associated with 3.6 points lower, while foreign institutional investors are associated
with 6.3 points higher, than the baseline group. The negative coefficient of foreign industrial
group remains significant at 99 percent confidence in all three specifications. The positive effect
of the foreign institutional group weakens or disappears, however, when other firm characteristics
are controlled for (regressions 2 and 3). The F-test on the null hypothesis that the coefficients of
the two ownership dummies are not statistically different cannot be rejected at the 99 percent
level in all three models, suggesting that foreign industrial owners and foreign institutional
owners indeed affect the measure of governance differently.
An interpretation of this result is that foreign institutional investors use superior
knowledge and ability combined with a greater incentive to discipline management, directors, and
other insiders of companies to influence companies to establish more vigorous corporate
governance mechanisms and to enhance information disclosure.29 Foreign industrial owners, on
the other hand, either lack these skills or are indifferent to the quality of corporate governance of
the company, perhaps as long as the company continues to generate revenues for them. The fact
that a single foreign industrial owner holds, on average, as high as 34 percent stake of its joint
venture in Thailand (as opposed to 2.7 percent held by a typical foreign institutional investor),30
and that they often directly involve in management and operation of the firm, make the result on
foreign industrial ownership coincide with the entrenchment effect of large shareholdings (Morck,
Shleifer and Vishny, 1988; Shleifer and Vishny, 1986; and Claessens, et al., 2002). According to 29 However, not all foreign institutional investors behave this way as to bring good corporate governance to local companies. There is also a case that foreign institutional investors aim to make only short-term profits by purchasing financially distressed companies at a bargain prices during an economy-wide financial crisis and then selling their stakes when the economy is up and running again, cashing out before addressing governance problems and sometimes leaving the company with even more governance problems. Widely cited examples of this include the purchase and sale of Korean banks by U.S. private equity funds Newbridge Capital and Lone Star, earning a windfall profit of US$1.2 billion and US$4.4 billion, respectively, in less than four years investment span. Their executives now face criminal charges in Korea on suspicion of tax evasion and fraud. Warburg Pincus, another U.S. investment fund, was recently accused of insider trading stemming from the 2003 purchase of LG Card, a credit card company in Korea. 30 Figures from 2004 data.

16
Shleifer and Vishny (1986), large investors can be so powerful that they may pursue their own
interests, which need not correspond with the interests of other (minority) investors or employees
in the firms.
The negative relationship between large foreign industrial ownership and governance can
also be explained in the theoretical model of Bebchuk (1999) which predicts a positive
relationship between the likelihood of having a large blockholder and the potential value of
private benefits of control. This theory is supported by empirical evidence on Australian firms
presented by Lamba and Stapledon (2002) using the value of related party transactions, and
evidence on cross-country comparison by Dyck and Zingales (2003) using the difference in the
price per share paid by an acquirer and the market price after the change in control, as a measure
of private benefits of control. The theory implies that large shareholders, foreign and local alike,
may oppose any positive change in corporate governance because their private benefits may be
threatened once corporate governance—which protects minority investor rights—is strengthened.
Moreover, given that Thailand has relatively weak rule of law, the existence of private benefits of
control in Thailand is supported by empirical findings that the value of private benefits are
negatively related to the quality of legal environment and the level of investor protection of a
country (Dyck and Zingales, 2002; and Nenova, 2003).
The firm-level relationship between foreign direct investment (FDI) and governance
found in this analysis also applies at the country-level. Li and Filer (2004) find a downward-
sloping relationship between country-level FDI and their governance index for a sample of 48
countries. They concludes that investors prefer direct investment when investing in countries with
poor governance institutions because it gives investors more control and thus better protection
through personal connections. The firm-level investigation of this paper in turns explains why
self-interested FDI does not help improve the overall corporate governance in local firms
especially in the area of minority shareholder protection.
4.2.3 Evidence on Private Benefits of Control Hypothesis
Two methods have been used to quantify private benefits of control. The first method,
first used by Barclay and Holderness (1989), measures the difference between the price per share
paid by an acquirer in a takeover event and the market price per share after the change in control
is announced.31 The second method, pioneered by Lease, McConnell, and Mikkelson (1983),
31 The former reflects the cash flow benefits and the private benefits stemming from the acquiring party’s controlling position, while the latter reflects only the cash flow benefits from non-controlling ownership. The difference between these two prices thus reflects the differential payoff accruing to the controlling shareholder.

17
relies on the existence of companies with multiple classes of stocks, with differential voting
rights and calculates the voting premium as an estimate of the magnitude of the private benefits
of control.
However, these methods do not apply in the case of Thai firms because, in Thailand,
merger and acquisition activities have been rare and dual-class share structure is prohibited. Thus,
in attempt to detect the private benefits of control, this paper alternatively looks at the “abnormal
return” on equity holdings, which is the return in excess of the expected rate of return based on an
asset pricing model. The logic is that, stock return (capital gain plus dividend per share) is the
same for all shareholders of a company. These returns depend on many factors such as firm size,
firm value, industry, profitability, growth prospect, and share liquidity. If the controlling
shareholder did extract private benefits from the company, what would be left to be distributed
among all shareholders would be less than otherwise. Lower profits could also depress stock
prices resulting in small or even negative capital gain. Therefore, on average the abnormal returns
should be lower for firms with larger private benefits being extracted, holding constant other
determinants of stock returns.
I calculate abnormal returns using the CAPM and the three-factor Fama-French (1993)
model. The estimated abnormal return is the constant, α, in the model:
CAPM: 1t t tR MKTα β ε= + × + (3)
Three-Factor: 1 2 4t t t t tR MKT SMB HMLα β β β ε= + × + × + × + (4)
where tR is the excess return over the risk-free rate of an individual stock in month t, tMKT is the
market return minus the risk-free rate, and tSMB (small minus big) and tHML (high minus low) are
the month t returns on factor-mimicking portfolios that capture the size and book-to-market
effects.
Columns 1 and 4 of Table 9 show the results from regressing abnormal returns, α, on the
corporate governance measure (CGI) and control variables in OLS and IV estimations,
respectively.32 As expected, abnormal returns increase with the quality of corporate governance
after controlling for endogeneity, implying that good governance may indeed curb extraction of
minority shareholders. Foreign industrial ownership, on the other hand, is negatively correlated
with the abnormal returns (regressions 2, 3 and 4), supporting of the hypothesis that large foreign
industrial owners extract private benefits.
32 I use “foreign ownership limit” as an instrument for the corporate governance measure in the IV regression. This foreign limit variable should be exogenous to the abnormal return estimation equation for the same reasons as previously argued in the case of the corporate governance equation.

18
4.2.4 Where Did Foreign Firms Go Wrong?
Regressions 1 to 5 in Table 10 Panel A are analogous to regression 3 in Table 8 except
that the dependent variables are now the different components of the CGI. Since some foreign
owners are not directly involved in monitoring, their scope for influencing the firm’s corporate
governance is more limited than foreign owners who have their representatives on the board of
directors. Therefore, I also employ a “foreign director dummy” to capture the effect of foreign
direct participation in monitoring on corporate governance (panel B).33
The results show that firms with significant foreign industrial ownership tend to do poorly
in the area of board structure and responsibilities. This area of governance is also problematic for
firms that have one or more foreign nationals serve on the board of director. Since foreign
directors are mostly elected to represent foreign industrial owners who are large shareholders,
these results suggest that foreign industrial firms in Thailand, whether or not they are directly
involved in monitoring, pay little attention to the function of the board of directors as a
governance mechanism.
Firms with foreign institutional investors outperform the other firms in the area of
information disclosure (regression 5), which is not surprising given examples of many
international institutional investors such as U.S.-based CalPERS, TIAA-CREFF, and Fidelity,
who have been active in corporate governance issues and have been pressing for more
transparency in companies in which they invested. These institutional investors intentionally
choose firms with poor corporate governance, which provide opportunities for them to generate
profits by reforming their corporate governance systems which will increase firm market values
(Smith, 1996; Pinto, 2006).34 Since we did not instrument for the ownership variables in this
model, it is also plausible that firms with a high degree of transparency attract more foreign
institutional investors.35 Unfortunately, a lack of long time series data on corporate governance
disallows us to test these two competing hypotheses.
33 “Foreign director dummy” is equal to 1 if there exists at least one director of a foreign national on the board of directors; 0 otherwise. 34 This pattern of institutional investors targeting poor corporate governance companies can be seen in CalPERS’ Focus List of Corporate Laggards. In April 2005, the fund added AIG, AT&T, Delhi, Novell, and Weyerhaeuser to the list stating that “these five companies are now on our radar screen for their poor corporate governance and in many cases poor performance that has economically damaged shareowners.” Rob Feckner, President of the CalPERS Board, declared, “we will press for needed reforms to restore long-term profitability and investor confidence.” http://www.calpers.ca.gov/index.jsp?bc=/about/press/pr-2005/april/focus-list.xml (last visited on September 30, 2006). Pinto (2006) also provides examples that reflect this pattern. Smith (1996) finds that 72 percent of firms targeted by CalPERS adopt proposed changes or make changes resulting in a settlement with CalPERS. Shareholder wealth increases for firms that adopt or settle and decreases for firms that resist. 35 Since we have two endogenous variables (foreign industrial and institutional dummies) but only one instrument, it is infeasible to use the IV method here. One way to get around this problem is to assume that foreign industrial investors are the first movers; they get to decide first which firm to invest in and how much (up to the foreign limits
19
A closer look reveals that foreign industrial ownership companies are less likely to
establish a specialized committee—in addition to a mandatory audit committee—to further
strengthen the checks-and-balances systems of the companies (Table 11).36 Only 9 percent of this
type of firm has set up a nominating committee by the end of 2004, compared with 22 percent for
the rest of the firms. And while 5 percent of the rest of the firms has advanced to establish a
corporate governance committee, none of the firms with large foreign industrial owners bothered
to follow suit.
The role of independent directors of these firms is also relatively limited, and their true
independence is in doubt since most of them do not refer to SEC rules regarding the selection of
independent directors. Overall, directors of foreign industrial ownership firms attend fewer
meetings per year and have lower attendance rate. A significantly smaller percentage of directors
of these firms has gone through the directors training programs offered by the Thai Institute of
Directors (Thai IOD). However, this may be due to the fact that directors’ training programs are
currently offered only in Thai language which effectively limits non-Thai speaking foreign
directors from obtaining this special training.
4.2.5 Country and Legal Origin of Foreign Funds
Common wisdom, at least in convergence of governance literature, is that governance
practices spread from developed countries with good governance to other countries with poor
governance. Implied by this claim is that firms in a poor governance country that are exposed to
source countries that have good governance should have higher governance standards than other
domestic firms, after controlling for firm characteristics. To test this hypothesis, I first identify
the top 20 equity investors in Thailand by country based on the value of their total shareholdings.
These major source countries are then divided into two groups based on their corporate
governance ratings from the IMD’s World Competitiveness Yearbook (2004): one group
comprises of countries with governance ratings higher than Thailand; the other lower than
Thailand. Table 12 shows that only three countries—Japan, India, and China—belong to the latter
group.
The CGI is regressed on the “Good CG Country” and “Poor CG Country” dummies and
other control variables analogous to regression 3 in Table 8. The result is quite striking: poor
of particular firms). Foreign institutional investors are residual investors who can invest only up to the foreign limits less foreign industrial holdings. However, this is a very strong and unrealistic assumption which would render the results unreliable. 36 The Stock Exchange of Thailand requires all listed companies to set up an audit committee, which must compose of at least three independent directors, by the end of 1999.

20
governance seems to be successfully transferred to Thai local companies, whereas there is no
evidence of transfer of good governance (Table 13, right-most panel). Since the three countries
with the poorest governance rankings are all Asian, I investigate whether the practice of bad
governance when investing in a country with relatively weak legal enforcement is inherently an
Asian phenomenon. As shown in the middle panel of Table 13, the coefficient of the Asian
dummy is substantially weaker than that of the dummy for Japan, India, and China (“Poor CG
Country”) in the first panel, demonstrating that not all Asian investors have a negative influence
on the corporate governance of Thai companies.
I also regress the CGI on dummies for individual source countries multiplied by their
share holdings. I find that ownerships by Canada, the United States, the United Kingdom, Japan,
India, and China are negatively correlated, while Sweden and Norway are positively correlated,
to the quality of corporate governance (Table 12). This is surprising given that countries like
Canada, the United States, and the United Kingdom have ranked well in their overall corporate
governance practices. But, evidently, they do not apply their good governance when they do
business abroad.
Next I use legal-origin classifications as in La Porta et al. (1998), who study the
relationship between this variable and the level of investor protection, to divide source countries
into four groups by their legal systems: English origin, German origin, French origin, and
Scandinavian origin.37 According to La Porta et al. (1988), English-law countries generally have
the strongest, and French-civil law countries the weakest, legal protections of investors. German-
law and the Scandinavian countries are in the middle of the range. These relative degrees of legal
protection are used as an alternative measure of country-level corporate governance in the
following analysis.
Similar to the preceding regressions, the CGI of Thai firms is regressed on the legal-origin
dummies and other controls. The regression results are again not overwhelmingly favorable to the
existence of governance transfer. Although the coefficients on English- and French-origin
dummies have the anticipated signs (positive and negative, respectively), they are statistically
insignificant. German and French origins, which were found to be in the middle of the
governance spectrum according to La Porta et al. (1998), are both strongly correlated with the
CGI but in the opposite direction. However, we should not generalize the result for Scandinavian
origin since there are only three cases of companies with considerable investments from
Scandinavian-law-origin countries.
37 Thailand belongs to the English-common-law group.
21
A close look at the data reveals that the negative coefficient on German-origin dummy is
driven primarily by Japanese direct investments in Thai firms in the form of joint ventures or
multinationals. Despite having imported its legal system from the Western states, Japan is well-
known for its prominent relationship-based governance system, where private relationships are
means to do business and rules are taken at face value (Yasuda, 2005). This may explain why
Japanese investors generally do not rely on standard corporate governance mechanisms such as
the board of directors to secure their investments. In fact, Japanese investors, who understand this
relationship-based world very well, tend to be careful about picking their partners who have good
political connections with rent-seeking office holders in Thailand so as to facilitate the run of
their business (Phongpaichit, 2003). This “exporting of corruption” from multinationals in
advanced economies to developing countries is not rare. It is documented that many blue-chip,
name-brand multinationals—Western or Asian alike—have routinely paid bribes to foreign
officials in order to gain contracts or concessions which they would not otherwise have won, or to
do so on more favorable terms (Hawley, 2000).38
4.3 Capsule Case Studies
In this sector, I provide two case studies of Thai firms whose ownership structures
underwent changes as a result of the acquisition of significant stakes by foreign investors—non-
institutional investors in the first case and institutional investors in the second. An increase in
foreign stakes in the former case was accompanied by a decline in a corporate governance
measure, whereas the latter company saw an improvement in the quality of corporate governance
after it sold significant stakes to foreign institutional investors.
Capsule Case Study One
Capetronic International (Thailand) Public Company Limited engages in the manufacture
of computer monitors, LCD-TV, and printed board assemblies for monitors. It is an affiliated
company of the Grande Holdings Group of Hong Kong. Before 2000, the Grande Holdings
Group commanded only 15 percent of the company but by 2004 its ownership increased
38 One example is that during the Suharto years in Indonesia, many multinationals—such as Merrill Lynch, Morgan Stanley, GE, Lucent, BP, Siemens, Mitsubishi, Sumitomo, and Hyundai—merrily invested in joint ventures with Suharto’s children and cronies. Typically they would give some equity, say 25 percent, free to one of the children, who wouldn’t even have to contract to perform any favors in exchange. More case-study examples can also be found in a report titled “Privatization, Multinationals, and Corruption” by David Hall (1999).
22
dramatically to 74 percent.39 This change of ownership structure was accompanied by a decline in
corporate governance measure: from a CGI of 55 in 2000 to 47 in 2004. This reflected the failure
of its directors to actively participate in meetings and to increase company’s transparency by
encouraging more information disclosure. Average directors meeting attendance dropped from 67
percent to only 40 percent. Disclosure of information became slack after the foreign company
took over majority stake: the company failed to disclose compensation and other benefits of
individual directors, related party transactions with explanation, and an overall corporate group
structure. The company also did not have a website, making it more difficult for outsiders to
access information. Since Hong Kong is country with high-quality corporate governance (Table
12), this case study illustrates a situation when an investor from a country with superior
governance does not stick to good governance practice when he conducts business in a country
with lower governance standard.
Capsule Case Study Two
Advanced Agro Public Company Limited (AA) was founded in 1989 by the
Dumnernchanvanit family, which controls a group of companies under the name Soon Hua Seng
(or Kaset Rung Rung in Thai version) Group primarily involved in the rice, tapioca, maize,
fertilizer, and pulp and paper industries. AA’s main business is manufacturing of pulp and paper.
In February 1995, the company became the first in the group to be listed on the Stock Exchange
of Thailand. In September 1998, the StoraEnso Group of Finland bought 19.9 percent of capital
worth $ 80 million from the group. Later that year, Oji Paper Co. Ltd of Japan also acquired 5.53
percent of the company. These alliances with the overseas companies helped expand AA’s export
market into Europe and Japan and facilitated technology transfer through technical and
managerial assistance from the alliance companies.
After AA became a publicly traded company, the Dumnernchanvanit family’s
shareholdings of AA declined over time. Through family members’ and affiliated companies’
shareholdings, the family controlled approximately 75 percent of the company in 1996, 46
percent in 2000, and merely 20 percent in 2004. Between the years 2000 and 2004, the company
sold its significant stake to various foreign institutional investors. These include BNP Paribus
Private Bank Hong Kong Branch (7.2 percent), State Street Bank and Trust Company (6.2
percent), UBS AG Hong Kong Branch (4.6 percent), and HSBC Private Bank, Suisse (4.6
39 In 2004, the Grande Holdings Group held shares of the Capetronic International (Thailand) Public Co. Ltd under various related companies: the Grande Capetronic Holdings Limited (25.3 percent), the Grande Holdings Limited (24.5 percent), and the Grande (Nominees) LTD (24.6 percent).

23
percent). As a result, aggregate foreign ownership in AA increased from 30 percent to 64 percent
during this period. Shareholdings by the StoraEnso Group of Finland and Oji Paper of Japan
remained unchanged.
Corporate governance of AA also improved significantly during this period: its score on
corporate governance measure rose from 43 in 2000 to 59 in 2004, which was one standard
deviation above its industry average. This improvement in corporate governance were attributable
mainly to enhanced disclosure and transparency: the company supplied detailed information
items such as shareholdings meeting procedure, board of director meeting attendance, and audit
committee meetings attendance, grouping of related major shareholders, and individual directors’
and managers’ shareholdings. An investor relations unit was established and several investor
relations activities such as a road show and an open house were also introduced. The company
appointed a new CEO who was a professional manager rather than a family member of the
controlling family. The Chairman’s stake in the company also decreased from 2.54 percent to
only 0.001 percent. Evidently, these positive changes in corporate governance of the firm were
due to the new foreign institutional owners who pressed for governance reforms that strengthen
the rights of minority investors.
5. Conclusion This paper has investigated the effects of foreign investment on corporate governance of
listed companies using a new firm-level data set on Thailand. A comprehensive index was
constructed from detailed company information to measure the corporate governance quality of
each of the sample companies. Potential endogeneity problems were also directly addressed using
an instrumental variables approach in which foreign ownership restriction on Thai business was
employed as an instrument for actual foreign ownership.
The results of this paper challenge conventional wisdom. Foreign investment does not
always contribute to improving governance of recipient firms in developing countries. I find
evidence suggesting that foreign industrial investors have adverse effects on corporate
governance of local firms. This negative effect is robust to the inclusion of various firm
characteristics including industry, family-business, and state-enterprise dummies. Since a foreign
industrial investor typically holds large ownership stake in a Thai firm, the negative effect of
foreign industrial ownership on the quality of governance reflects the scope for using insider
control to seek private benefits by keeping corporate governance weak. The positive correlation
between the presence of large ownership blocks and expropriation of minority shareholders has
24
been asserted on both theoretical and empirical grounds, but only domestic large shareholders
were concerned. This paper contributes to the literature by discovering that foreign (industrial)
block shareholders can also be a source of poor corporate governance.
A positive correlation between foreign institutional ownership and the measure of
governance is also detected. Two plausible explanations for a correlation between foreign
institutional investment and governance are: 1) foreign institutional investors tend to choose firms
with higher governance standards to avoid being expropriated by large shareholders, and 2)
foreign institutional investors have chosen firms with poor governance and then improved the
governance system to increase firm value. Unfortunately, a lack of long time series data on
corporate governance in this paper makes it impossible to distinguish between these two
hypotheses for foreign institutional investors. This can provide a venue for future research.
This paper also finds that Thai firms owned by investors from countries with corporate
governance ratings lower than Thailand are associated with worse governance than their peers,
but the opposite is not true. This implies that bad governance practice is easy to be transferred,
while good governance may be much more costly to be implemented in a country with relative
weak governance institutions.
The results from this paper raise several issues for further research. To what extent can the
results for Thailand be extended to other developing countries? It could be the case that foreign
investors may vary their investment strategies when investing under different institutional
environments. Legal enforcement in Thailand might be too weak, corruption too widespread, or
the capital market not sufficiently developed, to support some forms of effective governance
mechanisms that have been successfully used in countries with better institutions. An attempt to
improve corporate governance may also take a while until its upshot becomes apparent. To
understand the evolution of corporate governance in relation with the presence or absence of
different types of investors, a longitudinal data set covering many years of governance data is
required. Finally, this study has ignored plausible interaction effects between foreign ownership
and other types of ownership structure such as domestic bank ownership, pyramid shareholdings
by a family business group, and state ownership. Different types of ownership can influence
corporate governance of a company differently and their co-existence may either lower or
magnify the quality of corporate governance. These offer possible venues for further research.

25
REFERENCES: Almeida, Heitor and Daniel Wolfenzon (2005), “A Theory of Pyramidal Ownership and Family Business
Groups,” NBER Working Paper No. 11368. Bangkok International Associates, Thai Business and Legal Guide 2003. Barclay, Michael J., and Clifford G. Holderness (1989), “Private Benefits from Control of Public
Corporations,” Journal of Financial Economics 25, pp. 371-395. Barclay, Michael J., Clifford G. Holderness, and Jeffrey Pontiff (1993), “Private Benefits from Block
Ownership and Discounts on Closed-End Funds,” Journal of Financial Economics 33, pp. 263-91. Bebchuk, Lucian Arye (1999), “A Rent-Protection Theory of Corporate Ownership and Control,” NBER
Working Paper No. 7203. Black, Bernard S., Hasung Jang, and Woochan Kim (2006), “Does Corporate Governance Predict Firms'
Market Values? Evidence from Korea,” Journal of Law, Economics, and Organization 22, No. 2. Blomstrom, Magnus (1989), Foreign Investment and Spillovers. London: Routledge. Brooker Group (2001), Thai Business Groups: A Unique Guide to Who Owns What. Cheung, Yan-leung, J. Thomas Connelly, Piman Limpaphayom, and Lynda Zhou (2005), “Do Investors
Really Value Corporate Governance? Evidence from the Hong Kong Market,” Hong Kong Institute for Monetary Research Working Paper No. 22/2005.
Claessens, Stijn and Joseph P.H. Fan (2002), “Corporate Governance in Asia: A Survey,” International Review of Finance 3, pp. 71-103.
Claessens, Stijn, Simeon Djankov, Joseph Fan, and Larry Lang, (2000), “The Separation of Ownership and Control in East Asian Corporations,” Journal of Financial Economics 58, pp. 81-112.
Claessens, Stijn, Simeon Djankov, Joseph P. H. Fan and Larry H. P. Lang (1999), “Expropriation of Minority Shareholders: Evidence from East Asia,” The World Bank, Policy Research Working Paper Series 2088.
Denis, Diane K. and John J. McConnell (2003), “International Corporate Governance,” European Corporate Governance Institute, Finance Working Paper No. 05/2003.
Doidge, Craig, G. Andrew Karolyi, and Rene M. Stulz (2004), “Why Do Countries Matter so Much for Corporate Governance?" NBER Working Paper No. 10726.
Doms, Mark E. and J. Bradford Jensen (1998), “Comparing Wages, Skills, and Productivity between Domestically and Foreign-Owned Manufacturing Establishments in the United States,” in R. Baldwin, R. Lipsey and J.D. Richardson (eds.), Geography and Ownership as Bases for Economic Accounting, Chicago: Chicago University Press.
Durnev, Art and E. Han Kim (2005), “To Steal of Not to Steal: Firm Attributes, Legal Environment, and Valuation,” Journal of Finance 60 No. 3, pp. 1461-1493.
Dyck, Alexander and Luigi Zingales (2004), “Private Benefits of Control: An International Comparison,” Journal of Finance 59, pp. 537-600.
Fama, Eugene F. and Kenneth R. French, 1993, “Common risk factors in the returns on stocks and bonds,” Journal of Financial Economics 33, pp. 3-56
Feldstein, Martin (2000), “Aspects of Global Economic Integration: Outlook for the Future,” NBER Working Paper No. 7899.
Globerman, Steven (1979), “Foreign Direct Investment and ‘Spillover’ Efficiency Benefits in Canadian Manufacturing,” Canadian Journal of Economics 12, pp. 42-56.
Gompers, Paul A., Joy L. Ishii, and Andrew Metrick (2003), “Corporate Governance and Equity Prices,” Quarterly Journal of Economics 118, pp. 107-155.
Harrison, Ann (1996). “Determinants and Effects of Direct Foreign Investment in Cote d’Ivoire, Morocco, and Venezuela,” in M.J. Roberts and J.R. Tybout (eds.), Industrial Evolution in Developing Countries, pp. 163-186. New York: Oxford University Press.
Hartzell, Jay C. and Laura T. Starks (2003), “Institutional Investors and Executive Compensation,” Journal of Finance 58, pp. 2351-2375.
Hawley, Susan (2000), “Exporting Corruption: Privatization, Multinationals, and Bribery,” The Corner House Briefing 19.
Hermalin, Benjamin E., and Michael S. Weisbach (1991), “The Effects of Board Composition and Direct Incentives on Firm Performance,” Financial Management 20, pp. 101-12.

26
Huizinga, Harry and Cécile Denis (2003), “Are Foreign Ownership and Good Institutions Substitutes? The European Evidence,” mimeo, European Commission, Brussels.
Johnson, Simon, Rafael La Porta, Florencio Lopez-de-Silanes, Andrei Shleifer, 2000. Tunneling. American Economic Review Papers and Proceedings 90,pp. 22-27.
Khanna, Tarun and Krishna Palepu (1999), “Emerging Market Business Groups, Foreign Investors, and Corporate Governance,” NBER Working Paper No. 6955.
Kimura, Fukunari and Kozo Kiyota (2004), “Exports, FDI, and Productivity of Firm: Cause and Effect,” Faculty of Business Administration Working Paper No. 216, Yokohama National University.
Klapper, Leora F. and Inessa Love (2004), “Corporate Governance, Investor Protection, and Performance in Emerging Markets,” Journal of Corporate Finance 10, pp.287-322.
Klein, April (1998), “Firm Performance and Board Committee Structure,” Journal of Law and Economics 41, pp. 137-65.
La Porta, Rafael, Florencio Lopez-de-Silanes, and Andrei Shleifer (1999), “Corporate Ownership around the World,” Journal of Finance 54, pp. 471-518.
La Porta, Rafael, Florencio Lopez-de-Silanes, Andrei Shleifer, and Robert Vishny (1998), “Law and Finance,” Journal of Political Economy 106, pp. 1113-1155.
La Porta, Rafael, Florencio Lopez-de-Silanes, Andrei Shleifer, and Robert Vishny (2000), “Investor Protection and Corporate Governance,” Journal of Financial Economics 58, pp. 3-27.
Lamba, Asjeet S. and Geofrey P. Stapledon (2001), “The Determinants of Corporate Ownership Structure: Australian Evidence,” University of Melbourne Public Law Research Paper No. 20.
Lefort, Fernando and Eduardo Walker (2005), “The Effect of Corporate Governance Practices on Company Market Valuation and Payout Policy in Chile,” Inter-American Development Bank, Research Network Working Paper No. R-515.
Lease, Ronald C., John J. McConnell, and Wayne H. Mikkelson (1983), “The Market Value of Control in Publicly-Traded Corporations,” Journal of Financial Economics 11, pp. 439-471.
Li, Shaomin and Larry Filer (2004), “The Effects of the Governance Environment on the Choice of Investment Mode and the Strategic Implications,” Journal of World Business, forthcoming.
Mehran, Hamid (1995), “Executive Compensation Structure, Ownership, and Firm Performance,” Journal of Financial Economics 38, pp. 163-84.
Morck, Randall, Andrei Shleifer and Robert W. Vishny (1988), “Alternative Mechanisms for Corporate Control,” NBER Working Paper No. 2532.
Morck, Randall, David A. Stangeland, and Bernard Yin Yeung (1998), “Inherited Wealth, Corporate Control and Economic Growth: The Canadian Disease,” NBER Working Paper No. 6814.
Nenova, Tatiana (2003), “The Value of Corporate Voting Rights and Control: A Cross-Country Analysis,” Journal of Financial Economics 68, pp. 325-351.
Office of the Board of Investment (2003), “A Business Guide to Thailand,” Office of the Prime Minister, Royal Thai Government.
OECD (2002), Foreign Direct Investment for Development: Maximizing Benefits, Minimizing Costs, Paris: OECD.
Palepu, Krishna, Tarun Khanna, and Joseph Kogan (2002), “Globalization and Similarities in Corporate Governance: A Cross-Country Analysis,” Harvard Business School Working Paper No. 02-041.
Phongpaichit, Pasuk (2003), “Corruption, Governance, and Globalization: Lessons from the New Thailand,” The Corner House Briefing 29.
Pinto, Moshe (2006), “The Role of Institutional Investors in the Corporate Governance,” German Working Papers in Law and Economics Vol. 2006, Paper 1.
Shliefer, Andrei and Robert W. Vishny (1986), “Large shareholders and corporate control,” Journal of Political Economy 94, pp. 461-488.
Shleifer, Andrei and Robert W. Vishny (1997), “A Survey of Corporate Governance,” Journal of Finance 52, pp. 737-83.
Smith, Michael P. (1996), “Shareholder Activism by Institutional Investors: Evidence from CalPERS,” Journal of Finance 51, pp. 227-252.
Stulz, Rene (2005), “The Limits of Financial Globalization,” NBER Working Paper No. 11070. Stulz, Rene (2006), “Financial Globalization, Corporate Governance, and Eastern Europe,” NBER
Working Paper No. 11912.

27
Thai Institute of Directors Association (2004), “Corporate Governance Report of Thai Listed Companies” (in Thai).
Thanadsillapakul, Lawan (2004), “The Investment Regime in ASEAN Countries,” The Thai Law Forum. Vafeas, Nikos (1999), “Board Meeting Frequency and Firm Performance,” Journal of Financial
Economics 53, pp. 113-142. Wiwatanakantang, Yupana (2000), “The Ownership Structure, Capital Structure, and Performance of Thai
Firms,” Ph.D. Thesis, Hirotsubashi University, Tokyo, Japan. Wiwattanakantang, Yupana (2001), “Controlling Shareholders and Corporate Value: Evidence from
Thailand,” Pacific-Basin Finance Journal 9, pp. 323-62. Yasuda, Nobuyuki (2005), “Transformation of Japanese Legal System in the Global Era: Departure from
Asian Developmental State Model?” Nagoya University, Japan, mimeo. Yermack, David (1996), “Higher Market Valuation of Companies with a Small Board Of Directors,”
Journal of Financial Economics 40, pp. 185-211.
APPENDIX A: Construction of the Corporate Governance Index
In this appendix I describe in details the method used to score answers corresponding to corporate
governance questions, and weighting schemes used in creating a composite governance index. A full set of questions
is also provided at the end of this appendix.
Scoring Method
Most of the questions have binary (yes/no) answers. For these questions, I use an indicator variable that
takes the value of 1 whenever the answer is associated with best practices, and 0 otherwise. The remaining questions
have quantitative answers such as the number of independent directors on the board, average director meeting
attendance, the number of securities law violations, etc. These answers are transformed into either 0-1 indicators or
continuous values in the range of 0 and 1. For the former, I develop thresholds that are chosen in association with
best practices in identifying good or poor governance. For instance, companies are assigned value of 1 if the
proportion of independent directors in total directors is greater than 1/3, 0 otherwise. As another example, a company
gets a score of 0 if the chairman of the board holds director or management positions in more than three (publicly
held) companies, because time and productivity constraints can greatly reduce his ability to fully perform monitoring
function in the company he chairs the board. 40
Quantitative questions for which answers are translated into continuous values from 0 and 1 are those
generally believed to be positively correlated with the quality of overall governance. For instance, average director
meeting attendance is scored as its ratio to the total number of meetings, since higher attendance rate implies higher
accountability of the board of directors.
40 A list of directors and their positions are available only for publicly held companies from the SET’s Director Database.

28
Most questions receive a maximum score of 1.41 There are two items, however, that are considered more
important or more directly indicative of corporate governance quality of a company, namely, the records of
violations of securities or corporation laws such as insider trading or failure to comply with disclosure regulations. I
assign a maximum score of 3 to each of these items. Missing data are replaced by lowest scores in corresponding
entries. Since a lack of corporate governance information should be correlated with poor corporate governance, this
practice should not lead to large errors.
The full questionnaire and the calculation of scores are described in Table A1 below. Questions marked
with * are those available only in year 2004 and excluded from the CGI 2000 calculations.
Weighting Schemes
I construct two versions of an overall Corporate Governance Index by applying two different weighting
schemes to the five corporate governance categories; one gives equal weight to all categories, and the other assigns a
weight based on the amount of information obtained in each category. For the latter, each category carries a weight
as follows: board structure 20%; conflict of interest 25%; board responsibilities 20%; shareholder rights 10%; and
disclosure and transparency 25%. This latter version will be used as a primary CGI variable in this paper.
41 A main question and its sub-questions if any comprise one question for the purpose of scoring.

29
Table A1: Structure of Corporate Governance Index
Code Questions Scoring Rule Max. Score Weight
A. BOARD STRUCTURE 6.00 20% a1 What is the size of the board of directors? 1 if 5 <= a1 <=12; 0 otherwise 1.00 a2 What is the size of executive board? 1 if a2 <= 12; 0 otherwise 1.00 a3 How many directors are also managers? 1 if a3/a1 < 1/3; 0 otherwise 1.00 a4 How many directors are "independent"? 1 1 if a4/a1 > 1/3; 0 otherwise 1.00 a5 Does the firm state the definition of "independence" in the disclosure report? 1 1 if a5 = 1; 0 otherwise 1.00
a6 How many directors have attended director training programs by the Thai Institution of Directors Association? 2 1 if a6/a1 > 1/2; 0 otherwise 1.00
B. CONFLICT OF INTEREST 8.00 25%
b1 Is the Chairman the same person as the CEO? 1 if b1 = 0; 0 otherwise 1.00 b2 Is the Chairman "independent"? 1 if b2 = 1; 0 otherwise 1.00 b3 How many public companies does the Chairman concurrently serve as a director or a manager? 1 if b3 <= 3; 0 otherwise 1.00 b4 Does an audit committee exist? 1/2 if b4 = 1; 0 otherwise 0.50 b5 - chaired by independent director? 1/6 if b5 = 1; 0 otherwise 0.17 b6 - role and responsibilities clearly stated? 1/6 if b6 = 1; 0 otherwise 0.17 b7 - performance or meeting attendance disclosed? 1/6 if b7 = 1; 0 otherwise 0.17 b8 Does a nominating committee exist? 1/2 if b8 = 1; 0 otherwise 0.50 b9 - chaired by independent director? 1/6 if b9 = 1; 0 otherwise 0.17 b10 - role and responsibilities clearly stated? 1/6 if b10 = 1; 0 otherwise 0.17 b11 - performance or meeting attendance disclosed? 1/6 if b11 = 1; 0 otherwise 0.17 b12 Does a remuneration committee exist? 1/2 if b12 = 1; 0 otherwise 0.50 b13 - chaired by independent director? 1/6 if b13 = 1; 0 otherwise 0.17 b14 - role and responsibilities clearly stated? 1/6 if b14 = 1; 0 otherwise 0.17 b15 - performance or meeting attendance disclosed? 1/6 if b15 = 1; 0 otherwise 0.17 b16 Does a corporate governance committee exist? 1/2 if b16 = 1; 0 otherwise 0.50 b17 - chaired by independent director? 1/6 if b17 = 1; 0 otherwise 0.17

30
b18 - role and responsibilities clearly stated? 1/6 if b18 = 1; 0 otherwise 0.17 b19 - performance or meeting attendance disclosed? 1/6 if b19 = 1; 0 otherwise 0.17
b20* Does the firm have a policy that specifies a minimum number of independent directors? 1/3 if b20 = 1; 0 otherwise 0.33 Does the firm discuss the following internal-control issues in the disclosure report?
b21 1) Organizational and control environment 2/15 if b21 = 1; 0 otherwise 0.13 b22 2) Risk management 2/15 if b22 = 1; 0 otherwise 0.13 b23 3) Management control activities 2/15 if b23 = 1; 0 otherwise 0.13 b24 4) Information and communication 2/15 if b24 = 1; 0 otherwise 0.13 b25 5) Monitoring and evaluation 2/15 if b25 = 1; 0 otherwise 0.13
C. BOARD RESPONSIBILITIES 13.00 20%
c1* Number of board meetings per year 1 if c1 > 4; 0 otherwise 1.00 c2* Average director's meeting attendance c2/c1 1.00 c3* Average independent director's meeting attendance c3/c1 1.00 c4* Is there a board meeting solely for independent directors? 1 if c4 = 1; 0 otherwise 1.00 c5* Number of audit committee meetings per year 1 if c5 >= 4; 0 otherwise 1.00 c6* Average audit committee meeting attendance c6/c5 1.00 c7 Is there at least one accounting expert on the audit committee? 1 if c7 = 1; 0 otherwise 1.00 c8 How many public companies does the chairman of audit committee serve as a director or manager? 1 if c8 <= 3; 0 otherwise 1.00 c9 Does the firm clearly distinguish the role and responsibilities of the board and management? 1/3 if c9 = 1; 0 otherwise 0.33
c10* Does the firm disclose that directors evaluation system exists? 1/3 if c10 = 1; 0 otherwise 0.33 c11 Does the firm have an option scheme which incentivizes management? 1/3 if c11 = 1; 0 otherwise 0.33 c12 Has there been any legal dispute where the firm was claimed to be at fault during the past year? 1 if c12 = 0; 0 otherwise 1.00 c13 Has there been any sanction to the board, management, or other insider(s) for violations of 3*(1-c13) 3.00
Securities and/or Corporations laws in the last two years? 3 D. SHAREHOLDER RIGHTS 8.00 10%
d1* Does the firm hold an annual general shareholder meeting? 1 if d1 = 1; 0 otherwise 1.00 d2* Does the firm employ one-share-one-vote rule? 1 if d2 = 1; 0 otherwise 1.00 d3* Is cumulative voting allowed in electing directors? 1 if d3 = 1; 0 otherwise 1.00 d4* Is voting by mail allowed? 1 if d4 = 1; 0 otherwise 1.00 d5* How many days in advance does the firm send out a notice of general meetings to shareholders? d5/14 1.00 d6* Is proxy voting allowed? 1 if d6 = 1; 0 otherwise 1.00
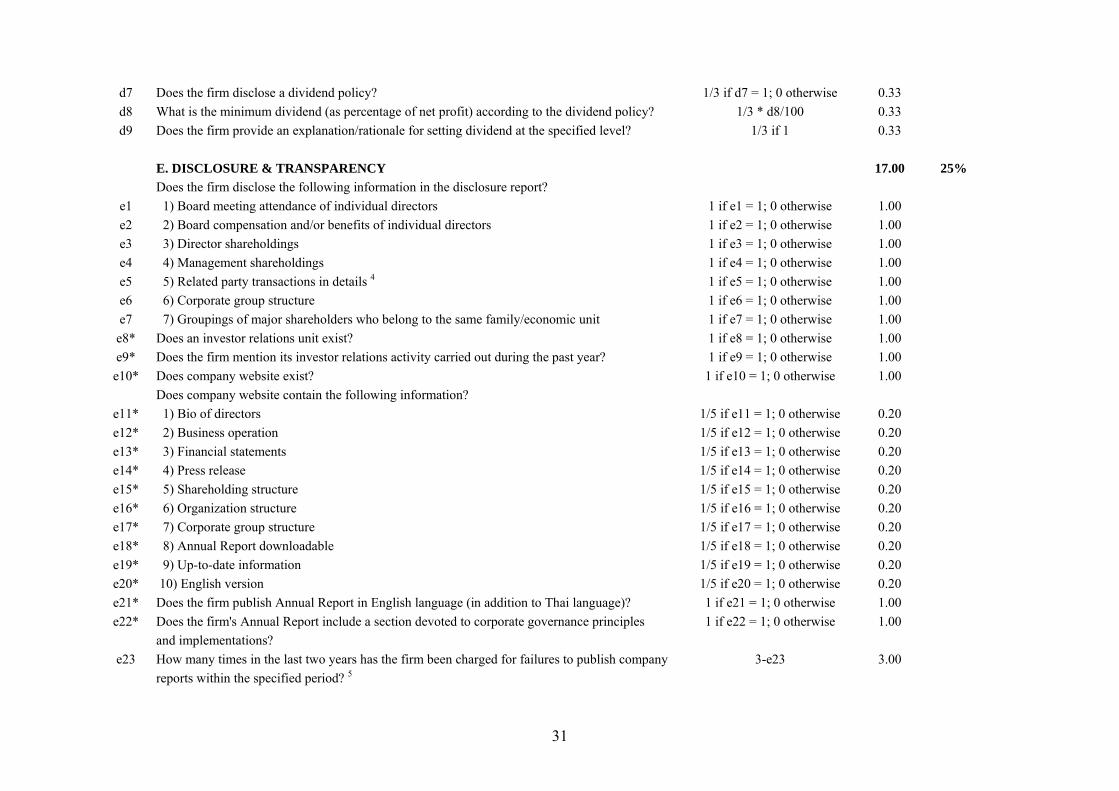
31
d7 Does the firm disclose a dividend policy? 1/3 if d7 = 1; 0 otherwise 0.33 d8 What is the minimum dividend (as percentage of net profit) according to the dividend policy? 1/3 * d8/100 0.33 d9 Does the firm provide an explanation/rationale for setting dividend at the specified level? 1/3 if 1 0.33
E. DISCLOSURE & TRANSPARENCY 17.00 25% Does the firm disclose the following information in the disclosure report?
e1 1) Board meeting attendance of individual directors 1 if e1 = 1; 0 otherwise 1.00 e2 2) Board compensation and/or benefits of individual directors 1 if e2 = 1; 0 otherwise 1.00 e3 3) Director shareholdings 1 if e3 = 1; 0 otherwise 1.00 e4 4) Management shareholdings 1 if e4 = 1; 0 otherwise 1.00 e5 5) Related party transactions in details 4 1 if e5 = 1; 0 otherwise 1.00 e6 6) Corporate group structure 1 if e6 = 1; 0 otherwise 1.00 e7 7) Groupings of major shareholders who belong to the same family/economic unit 1 if e7 = 1; 0 otherwise 1.00
e8* Does an investor relations unit exist? 1 if e8 = 1; 0 otherwise 1.00 e9* Does the firm mention its investor relations activity carried out during the past year? 1 if e9 = 1; 0 otherwise 1.00 e10* Does company website exist? 1 if e10 = 1; 0 otherwise 1.00
Does company website contain the following information? e11* 1) Bio of directors 1/5 if e11 = 1; 0 otherwise 0.20 e12* 2) Business operation 1/5 if e12 = 1; 0 otherwise 0.20 e13* 3) Financial statements 1/5 if e13 = 1; 0 otherwise 0.20 e14* 4) Press release 1/5 if e14 = 1; 0 otherwise 0.20 e15* 5) Shareholding structure 1/5 if e15 = 1; 0 otherwise 0.20 e16* 6) Organization structure 1/5 if e16 = 1; 0 otherwise 0.20 e17* 7) Corporate group structure 1/5 if e17 = 1; 0 otherwise 0.20 e18* 8) Annual Report downloadable 1/5 if e18 = 1; 0 otherwise 0.20 e19* 9) Up-to-date information 1/5 if e19 = 1; 0 otherwise 0.20 e20* 10) English version 1/5 if e20 = 1; 0 otherwise 0.20 e21* Does the firm publish Annual Report in English language (in addition to Thai language)? 1 if e21 = 1; 0 otherwise 1.00 e22* Does the firm's Annual Report include a section devoted to corporate governance principles 1 if e22 = 1; 0 otherwise 1.00
and implementations? e23 How many times in the last two years has the firm been charged for failures to publish company 3-e23 3.00
reports within the specified period? 5

32
OTHER INFORMATION h1 Is the Chairman a controlling family member? h2 The Chairman's shareholdings (% of total number of shares) h3 Is the CEO a controlling family member? h4 The CEO's shareholdings (% of total number of shares) h5 Is there a foreign national on the board of directors? h6 Does the firm have subsidiaries? 6 h7 Does the firm issue corporate bonds? h8* Percentage shares classified as "free float" 7 j1 Is the firm a foreign joint venture? j2 Foreign partner’s shareholdings (% of total number of shares) j3 What is the nationality of the joint-venture partner?
Notes:
* Available only for the year 2004; excluded from CGI 2000 calculations. 1. According to the SET and the SEC, a director is defined as being “independent” if he/she meets the following qualifications:
1) Holding shares not more than 5 per cent of paid-up capital of the company, affiliated company, associated company or related company, which shall be inclusive of the shares held by “related persons”. Related persons mean to include persons who have relationship with or are related to the company to the extent that
they cannot perform their duties independently or in a flexible manner such as supplier, customer, creditor, debtor or person who has business relation that is material, etc. 2) Being a director who does not take part in the management of the company, affiliated company, associated company, related company or majority shareholder of
the company. 3) Not being an employee, staff member or advisor who receives a regular salary from the company, affiliated company, associated company, related company or
majority shareholder of the company; for example, the Chief Executive Officer of the company may not be a member of the Audit Committee because he is directly responsible for the management etc. In addition, he/she must have no direct or indirect benefit or interest in finance and management of the company, affiliated company, associated company or majority shareholder of the company.
4) Being a director who has no benefit or interest of the said nature during the period of 1 year before his appointment as a member of the Audit Committee except where the Board of Directors has carefully considered that such previous benefit or interest does not affect the performance of duties and the giving of independent opinions. In addition, he/she must not be a related person or a close relative of any management member or majority shareholder of the company.
5) Being a director whom is not appointed as a representative to safeguard interests of the company’s directors, majority shareholders or shareholders who are related to the company’s majority shareholders.
6) Being capable of performing duties, giving opinions or reporting the results of performance of work according to the duties delegated by the Board of Directors free and clear of the control of the management or the majority shareholders of the company including related persons or close relatives of the said persons. 2. The SEC and the SET strongly recommend that all directors of listed companies attend at least one directors training course offered by the Thai Institute of Directors Association (Thai IOD) to acquire formal knowledge about their role and responsibilities as well as to develop skills necessary for them to lawfully and effectively perform

33
their board functions. The Thai IOD’s main training courses include the 5 ½ -day Director Certification Program (DCP) and the one-day Director Accreditation Program (DAP). More information can be obtained at the Thai IOD’s website: http://www.thai-iod.com/eng/ 3. To answer this question, I considered law enforcement actions in form of both criminal prosecutions and administrative sanctions by the SEC. A company is given a value of 1 under this question if it appears that during the last two years, director(s), management, or other insider(s) of the company was engaged in an unlawful business regarding takeover procedures, insider trading, dissemination of information, or failed to exercise his/her duties with care and honesty in order to preserve the interest of the company. 4. The SET rules require that if a listed company intends to enter into any transaction with connected persons, the listed company has to comply with the prescribed procedures. For example, if the volume of the connected transaction is not material, the listed company must disclose details of such transaction to the public. But if the volume of the transaction is substantial, the resolution from shareholders meeting must be obtained before entering into such transaction. Information that needs to be disclosed in case of connected transactions includes date when decision is made, relevant parties, explanation regarding the nature of asset or services being transacted, a total value and criteria used in determining the transaction total value, name, tiles and shareholding in the listed company of connected persons, opinions of the board of directors concerning the decision to enter the transaction, and opinions of the audit committee that may be different from those of the board of directors, etc. According to the SET, “connected person” is defined as follows:
(1) the management, major shareholders, controlling persons or persons to be nominated as the management or controlling persons of a listed company or a subsidiary company including related persons and close relatives of such persons.
(2) any juristic person having a major shareholder or a controlling person as the following persons of a listed company or a subsidiary: (a) the management (b) major shareholder (c) controlling person (d) person to be nominated as the management or a controlling person, and (e) related persons and close relatives of persons from (a) to (d).
(3) any person whose behavior can be indicated as an acting person or under a major influence of persons from (1) to (2) when making decision, determining policy, handling management or operation; or other persons the Exchange deems as having the same manner. 5. Failure to file required reports to the SET is considered a criminal violation. Documents required by the Thai public company law to be disclosed by listed company within a specified period are, for example, annual report, audited financial statements, reviewed quarterly reports, and report on the change in beneficial ownership of the company. 6. Under the accounting standards on consolidation of financial statements used in Thailand, the term “subsidiary” is defined as an entity that the parent company holds more than 50% of the total shares of the entity. It should be noted that, companies that are controlled or indirectly held by the parent company are not considered subsidiaries under this definition. 7. The “freefloat” of a listed security is the proportion of shares available for purchase in the market by investors. In principal, it is that part of shares not held by strategic shareholders and not held as treasury stock. The Research Department of the SEC defines strategic shareholders and estimates the free float under a set of guidelines. Strategic shareholders are defined as holders of shares for the purpose of company management or for business strategy. The following shareholders are considered as strategic shareholders:
1) Government, state-owned enterprises, and government agencies 2) Board members, managers or officials on the top four positions ranking down from the manager, including their related persons 3) Shareholders that hold shares in the proportion of more than 5%, with exception to the following groups of shareholders: securities companies, life-insurance 4) Companies, insurance companies, mutual funds, and contractual saving funds 5) Shareholders who have controlling power of the company 6) Shareholders whose shares are subjected to silent period

34
APPENDIX B: Construction of Ownership Variables
Data on equity ownership for individual firms is obtained mainly from the SET database, which provides a
list of all shareholders owning at least 0.5 percent of a listed company. I classify these major shareholders into four
main groups: 1) Thai family-business group, 2) Thai non-family-business investors, 3) Thai government, and 4)
foreign investors. Each group is further divided into subcategories as illustrated in Table 5.
To determine whether an individual or corporation belongs to a Thai family-business group, I consult a
publication titled Thai Business Groups: A Unique Guide to Who Owns What (Brooker Group, 2002) which provides
comprehensive business and personal profiles of the 150 largest business families in Thailand. Additional
information is collected from Department of Business Development, Ministry of Commerce for use in identifying
ultimate owners of Thai non-listed corporations that are shareholders of listed companies in the sample.
Following Wiwattanakantang (2000), I describe a company as having a controlling shareholder if the largest
shareholder(s) holds more than 25 percent of the firm’s shares directly or indirectly.42 There were 43 companies in
which a single foreign investor held more than 25 percent of the total shares; 36 of those companies were foreign
multinational corporations. The family-business-group and the state-enterprise dummies have a value of 1 if a
company is controlled by a family and by the Thai government, respectively; 0 otherwise. In 2004, about 47 percent
of the sample companies were controlled by family business groups and 7 percent by the Thai Government.
The ownership pattern of Thai non-financial listed companies by type of the largest shareholder is presented
in Table B2 below. The evidence is consistent overall with a survey of Thai ownership structure in 1996 by
Wiwattanakantang (2000). Thai family business groups held the largest stake in more than 70 percent of the non-
financial firms in the Thai stock market before the Asian crisis of 1997. However, this pattern has been changing
over time as the family business groups either have given up their control to other types of investors or de-listed their
companies from the stock market.
42 As noted in Wiwattanakantang (2001), under the Public Limited Companies Act, at or above 25 percent shareholdings, a shareholder has sufficient voting rights to do the following: 1) nullify any corporate decisions, 2) demand to inspect the business operation and the financial condition of the company, as well as the conduct of the board, 3) call an extraordinary general meetings at any time, and 4) submit a notion to the court demanding for the dissolution of a company if s/he believes that further company operations will bring only losses, and that the company has no chance of recovery. Since deviation from one-share-one-vote rule is not allowed in Thailand, voting rights are proportional to the number of shares owned by a shareholder.

35
Table B1: Summary Statistics of Shareholdings by Type of Shareholders, 2004
Type of Shareholders M ean Shareholdings Std. Dev. M in M ax(N = 350)
Thai family business group 33.9 26.7 0.0 99.0 individuals 18.1 22.0 0.0 93.8 corporations 15.8 22.1 0.0 99.0
Thai Government 5.6 15.7 0.0 94.2 State/State enterprises 4.0 12.8 0.0 94.2 Crown Property Bureau 1.6 8.7 0.0 80.5
Other Thai investors 21.5 20.2 0.0 97.9 individuals 13.3 15.7 0.0 87.8 corporations 5.4 12.5 0.0 97.9 banks 0.6 3.0 0.0 35.8 non-bank financial institutions 2.0 3.5 0.0 25.0 unidentified1 0.2 0.7 0.0 7.6
Foreign investors 16.1 19.9 0.0 88.4 individuals 1.4 4.4 0.0 40.0 corporations 7.8 16.1 0.0 75.0 banks 2.6 6.4 0.0 72.2 non-bank financial institutions 4.2 8.9 0.0 80.4 government 0.1 1.1 0.0 15.5
Unidentified1 0.0 0.3 0.0 3.1
Notes: 1 Shareholdings under this category is unidentifiable because the shares were held under the Thailand Securities Depository Co., Ltd as a nominee for Thai or foreign investors.
Table B2: Identification of the Largest Shareholder, 1996, 2000, and 2004
Type of ShareholderNo. of firms % No. of firms % No. of firms %
Total 353 100.00 311 100.00 350 100.00
Thai family business group 264 74.79 216 69.45 220 62.86
Thai Government 18 5.10 19 6.11 29 8.29 State/State enterprises 11 3.12 12 3.86 20 5.71 Crown Property Bureaus 7 1.98 7 2.25 9 2.57
Other Thai investors: 31 8.78 23 7.40 46 13.14 individuals 7 1.98 5 1.61 16 4.57 corporations 21 5.95 14 4.50 25 7.14 financial institutions 3 0.85 4 1.29 5 1.43
Foreign investors: 40 11.33 50 16.08 52 14.86 individuals 3 0.85 0 0.00 1 0.29 corporations 31 8.78 36 11.58 42 12.00 financial institutions 6 1.70 14 4.50 9 2.57
Unidentified investors 0 0.00 3 0.96 3 0.86
20041996 2000

36
APPENDIX C: The Three Lists of the Foreign Business Act of 1999.
List 1
The businesses not permitted for aliens to operate due to special reasons:
(1) Newspaper business, radio broadcasting or television station business (2) Rice farming, farming or gardening. (3) Animal farming (4) Forestry and wood fabrication from natural forest (5) Fishery for marine animals in Thai waters and within Thailand specific economic zones. (6) Extraction of Thai herbs. (7) Trading and auctioning Thai antiques or national historical objects. (8) Making or casting Buddha images and monk alms bowls. (9) Land trading
List 2
The businesses related to the national safety or security or affecting arts and culture, tradition, folk handicraft or natural resource and environment.
Group 1: The businesses related to the national safety or security (1) Production, selling, repairing and maintenance of: (a) Fire arms, ammunition, gun powder, explosives.
(b) Accessories of firearms, ammunition, and explosive (c) Armaments, ships, aircrafts or military vehicles. (d) Equipment or components, all categories of war materials.
(2) Domestic land, waterway or air transportation, including domestic airline business. Group 2 : The businesses affecting arts and culture, traditional and folk handicraft: (1) Trading antiques or art objects being Thai arts and handicraft. (2) Production of carved wood. (3) Silkworm farming, production of Thai silk yarn, weaving Thai silk or Thai silk pattern printing. (4) Production of Thai musical instruments. (5) Production of goldware, silverware, nielloware, bronzeware or lacquerware. (6) Production of crockery of Thai arts and culture. Group 3: The businesses affecting natural resources or environment: (1) Manufacturing sugar from sugarcane; (2) Salt farming, including underground salt; (3) Rock salt mining; (4) Mining, including rock blasting or crushing; (5) Wood fabrication for furniture and utensil production
List 3
The business which Thai national are not yet ready to compete with foreigners: (1) Rice milling and flour production from rice and farm produce (2) Fishery, specifically marine animal culture. (3) Forestry from forestation. (4) Production of plywood, veneer board, chipboard or hardboard.

37
(5) Production of lime. (6) Accounting service business. (7) Legal service business. (8) Architecture service business. (9) Engineering service business. (10) Construction, except for: (a) Construction rendering basic services to the public in public utilities or transport requiring special
tools, machinery, technology or construction expertise having the foreigners' minimum capital of 500 million Baht or more.
(b) Other categories of construction as prescribed by the ministerial regulations. (11) Broker or agent business, except: (a) Being broken or agent for underwriting securities or services connected with future trading of
commodities of financing instruments or securities. (b) Being broker or agent for trading or procuring goods or services necessary for production or
rendering services amongst affiliated enterprises. (c) Being broker or agent for trading, purchasing or distributing or seeking both domestic and foreign
markets for selling domestically manufactured or imported goods in the manner of international business operations having the foreigners' minimum capital 100 million Baht or more.
(d) Being broker or agent of other category as prescribed by the ministerial regulations. (12) Auction, except: (a) Auction in the manner of international bidding not being the auction of antiques, historical artifacts
or art objects which are Thai works of arts, handicraft or antiques or having the historical value. (b) Other categories of auction as prescribed by the ministerial regulations.
(13) Internal trade connected with native products or produce not yet prohibited by law. (14) Retailing all categories of goods having the total minimum capital less than 100 million Baht or having
the minimum capital of each shop less than 20 million Baht. (15) Wholesaling all categories of goods having minimum capital of each shop less than million Bath. (16) Advertising business. (17) Hotel business, except for hotel management service (18) Guided tour. (19) Selling food or beverages. (20) Plan cultivation and propagation business. (21) Other categories of service business except that prescribed in the ministerial regulations

38
Table 1: Summary Statistics of Overall Corporate Governance Index (CGI) and Subindexes, 2004
Variable Mean Std. Dev. Min Max No. of Obs Overall CGI 53.25 11.19 25.75 90.46 365 Overall CGI 2 52.52 10.86 23.86 86.46 365Subindexes: A: Board Structure 56.49 19.86 16.67 100.00 365 B: Conflict of Interest 38.86 14.57 10.42 100.00 365 C: Board Responsibilites 62.73 13.60 18.46 91.15 365 D: Shareholder Rights 42.96 15.39 0.00 64.94 365 E: Disclosure & Transparency 61.58 17.21 23.53 100.00 365 Notes: Overall CGI = weighted averaged of the subindexes (20%, 25%, 20%, 10%, 25%, respectively) Overall CGI 2 = weighted averaged of the subindexes (equal weight)
Table 2: CGI by Industry and by Size, 2004
Industry Mean Std. Dev. Min Max No. of ObsAgro & Food Industry 50.65 9.59 26.06 80.27 41Consumer Products 46.84 8.73 25.75 62.47 36Industrials 51.98 10.22 31.79 72.82 43Property & Construction 55.08 11.24 32.76 86.34 67Resources 67.84 14.79 37.42 90.46 16Services 53.17 10.54 33.70 76.09 78Technology 57.65 11.51 31.47 79.26 41MAI b 54.23 6.98 40.74 69.72 21
Rehab c 45.39 9.06 30.35 62.45 19All 53.28 11.30 25.75 90.46 362
Market Capitalization Mean Std. Dev. Min Max No. of Obs(in million Baht)less than 500d 47.20 8.22 26.06 64.19 81between 500 and 1,400 51.61 8.87 25.75 76.09 93between 1,400 and 4,000 53.05 10.73 31.47 80.27 95greater than 4,000 60.46 12.59 34.68 90.46 93All 53.28 11.30 25.75 90.46 362
Panel A: CGI by Industrya
Panel B: CGI by Sizea
Notes: a Shown in this table is the statistics of the CGI with unequal weights. The number of observations slightly drops from the previous table due to companies with missing industry profile in the data set. b The "Market for Alternative Investment (MAI)" was established under The Securities Exchange of Thailand Act. Its purpose is to create new fund-raising opportunities for innovative business with high potential growth as well as a greater range of investment alternatives. It officially commenced operations on June 21, 1999. c Companies under rehabilitation.
d A company must have a minimum paid-up capital of 300 million baht to list on the SET, and 20 million baht for the MAI.
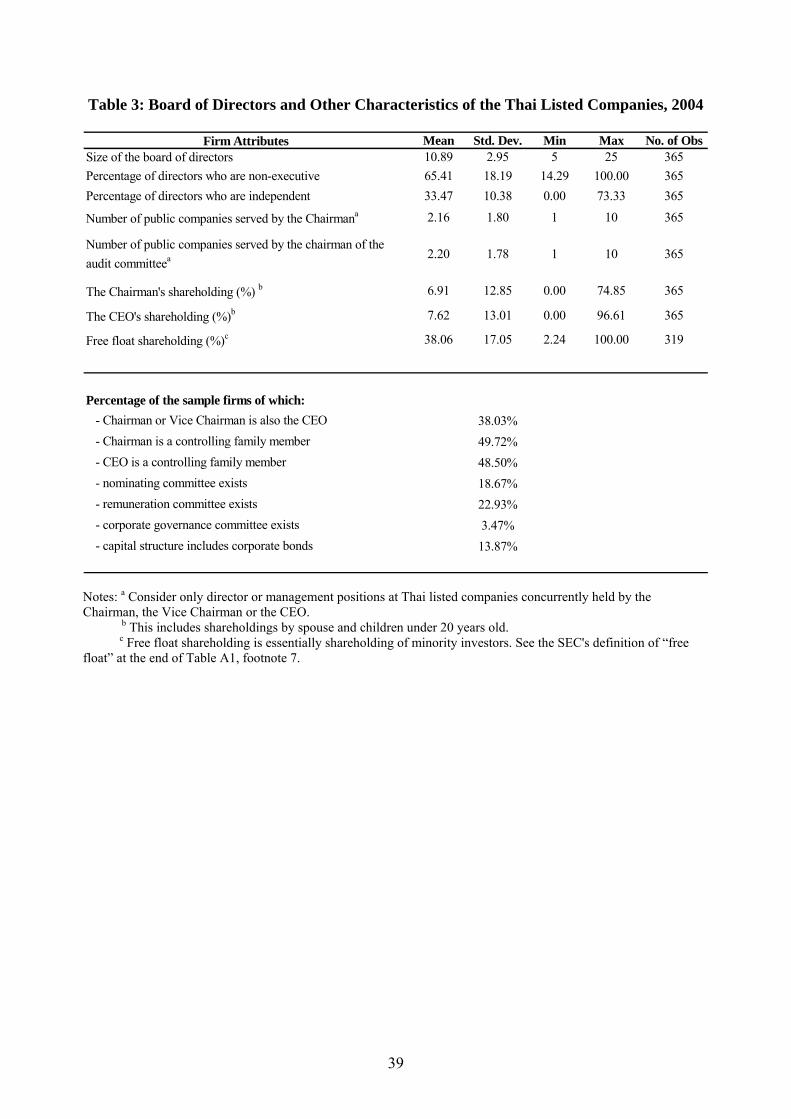
39
Table 3: Board of Directors and Other Characteristics of the Thai Listed Companies, 2004
Firm Attributes Mean Std. Dev. Min Max No. of ObsSize of the board of directors 10.89 2.95 5 25 365Percentage of directors who are non-executive 65.41 18.19 14.29 100.00 365Percentage of directors who are independent 33.47 10.38 0.00 73.33 365
Number of public companies served by the Chairmana 2.16 1.80 1 10 365
Number of public companies served by the chairman of the audit committeea 2.20 1.78 1 10 365
The Chairman's shareholding (%) b 6.91 12.85 0.00 74.85 365
The CEO's shareholding (%)b 7.62 13.01 0.00 96.61 365
Free float shareholding (%)c 38.06 17.05 2.24 100.00 319
Percentage of the sample firms of which:38.03%49.72%48.50%18.67%22.93%3.47%13.87%
- remuneration committee exists - corporate governance committee exists - capital structure includes corporate bonds
- Chairman or Vice Chairman is also the CEO - Chairman is a controlling family member - CEO is a controlling family member - nominating committee exists
Notes: a Consider only director or management positions at Thai listed companies concurrently held by the Chairman, the Vice Chairman or the CEO. b This includes shareholdings by spouse and children under 20 years old. c Free float shareholding is essentially shareholding of minority investors. See the SEC's definition of “free float” at the end of Table A1, footnote 7.

40
Table 4: Correlation Matrix
CGI CG_A CG_B CG_C CG_D CG_E Q1 Q2 Q3 Q4
(CG_A) Board Structure 0.655**
(CG_B) Conflict of Interest 0.731** 0.337**
(CG_C) Board Responsibilities 0.673** 0.259** 0.369**
(CG_D) Shareholder Rights 0.486** 0.176** 0.214** 0.326**
(CG_E) Disclosure 0.779** 0.269** 0.433** 0.450** 0.355**
(Q1) Chairman is a controlling family member -0.272** -0.146** -0.423** -0.098 -0.039 -0.136**
(Q2) CEO is a controlling family member -0.119* -0.016 -0.196* -0.003 -0.077 -0.098 0.310**
(Q3) Chairman's shareholding -0.121* 0.020 -0.271** 0.001 -0.118* -0.063 0.506** 0.238**
(Q4) CEO's shareholding -0.108** 0.028 -0.155** 0.004 -0.154** -0.124* 0.067 0.505* 0.304**
(Q5) Freefloat shareholding 0.150** 0.082 0.103 0.087 0.054 0.159** -0.009 0.074 -0.082 -0.108
Note: * and ** indicate the significance level of the correlation coefficients at 5% and 1%, respectively.

41
Table 5: Descriptive Statistics
Variable Mean Std. Dev. Min Max No. of ObsCGI 2004 (1 to 100) 53.25 11.19 25.75 90.46 365Foreign Ownership (%) 17.86 20.37 0.00 94.40 364Foreign Limits (%) 44.40 16.50 10.00 100.00 364Log(Market Capitalization) 21.25 1.67 16.56 26.91 365Log(Age) 3.26 0.66 1.39 4.87 366Return on Assets (%) 8.42 15.14 -73.67 54.28 362Sales Growth (% change) 0.31 1.37 -0.92 21.76 319
Table 6: Foreign Ownership and Corporate Governance
Dependent Variable: CGI
Pooled OLS Panel Random Effects
Panel Fixed Effects
(1) (2) (3) (4) (5) (6)Foreign Ownership -0.006 -0.073*** -0.076*** -0.105*** -0.109*** -0.166***
(0.025) (0.025) (0.028) (0.020) (0.020) (0.061)Log(Market Capitalization) 3.421*** 2.504*** 2.310*** 2.446*** 5.810***
(0.347) (0.428) (0.285) (0.273) (0.540)Log(Age) -1.788* -1.438** -1.375** -
(1.025) (0.722) (0.698) -Family-Business-Group Dummy -2.185* -1.858** -1.983** -
(1.256) (0.794) (0.834) -State-Enterprise Dummy 7.162*** -0.515 -0.670 -
(2.871) (1.870) (1.781) -Return on Assets 0.087* 0.028* 0.025 -0.092*
(0.046) (0.016) (0.021) (0.048)Sales Growth -0.015 -0.010 -0.020 -0.011
(0.202) (0.221) (0.181) (0.090)Exporter Dummy -0.797 -1.585* -1.600* -
(1.318) (0.873) (0.884) -Constant 53.45*** -18.10 11.54 27.53*** - -59.52***
(0.74) (7.14) (10.36) (6.32) - (14.63)
Industry Dummies No No Yes Yes Yes Yes
Observations 361 361 312 600 600 600R2 0.000 0.243 0.385 0.314 0.343 0.414F-test on H0: ß1 = 0 p = 0.827 p = 0.004 p = 0.007 p = 0.000 p = 0.000 p = 0.008
Cross-Sectional Regressions (2004) Panel Regressions (2000 & 2004)OLS
Notes: Robust standard errors in parentheses. *, ** and *** indicate significance at 10%, 5% and 1% level, respectively.

42
Table 7: Foreign Ownership and Corporate Governance, IV Regressions
(1) (2) (3)1st Stage: Foreign Ownership RegressionForeign limits 0.768*** 0.772*** 0.739***
(0.051) (0.048) (0.059)Log(Market Capitalization) 2.988*** 4.049***
(0.478) (0.664)Log(Age) 3.650**
(1.488)Family-Business-Group Dummy -4.046**
(1.927)State-Enterprise Dummy -7.589*
(3.970)Return on Assets 0.047
(0.067)Sales Growth -0.518
(0.658)Exporter Dummy -1.072
(2.037)Constant -16.28*** -79.99*** -113.15***
(2.41) (10.45) (15.38)
Industry Dummies No No Yes
Observations 360 360 311R2 0.389 0.450 0.478F-test on H0: ß1 = 0 p = 0.000 p = 0.000 p = 0.000
2nd Stage: CGI RegressionForeign Ownership -0.080* -0.075* -0.139***
(0.042) (0.039) (0.051)Log(Market Capitalization) 3.450*** 2.849***
(0.362) (0.493)Log(Age) -1.761*
(1.059)Family-Business-Group Dummy 1.581
(1.329)State-Enterprise Dummy 5.884*
(3.073)Return on Assets 0.088*
(0.046)Sales Growth -0.037
(0.209)Exporting Dummy -0.729
(1.307)Constant 54.81*** -18.65** 5.51
(1.05) (7.33) (10.50)
Industry Dummies No No Yes
Observations 360 360 311R2 0.000 0.246 0.377F-test on H0: ß1 = 0 p = 0.057 p = 0.056 p = 0.007
Cross-Sectional IV (2004)
Notes: Robust standard errors in parentheses.
*, ** and *** indicate significance at 10%, 5% and 1% level, respectively.

43
Table 8: Foreign Industrial versus Institutional Investors, 2004
Dependent Variable: CGI 2004
(1) (2) (3)
Foreign Industrial Ownership Dummya 80 -3.648*** -4.350*** -4.527***(1.318) (1.232) (1.328)
Foreign Institutional Ownership Dummyb 58 6.265*** 1.841 2.552*(1.694) (1.554) (1.540)
Log(Market Capitalization) 3.094*** 2.094***(0.336) (0.405)
Log(Age) -1.813*(0.985)
Family-Business-Group Dummy -2.253*(1.209)
State-Enterprise Dummy 7.771***(2.679)
Return on Assets 0.075*(0.044)
Sales Growth 0.052(0.195)
Exporter Dummy -0.750(1.297)
Constant 53.11** -11.76* 20.33**(0.701) (6.960) (8.692)
Industry Dummies No No Yes
Observations 361 361 312R2 0.071 0.263 0.407F-test on H0: ß1 = ß2 p = 0.000 p = 0.000 p = 0.000
OLSNumber of Incidences
Notes: a Foreign Industrial Ownership Dummy assumes a value of 1 if firm is a joint venture with a foreign industrial partner and its foreign partner owns at least 10% of the firm; 0 otherwise.
b Foreign Institutional Ownership Dummy assumes a value of 1 if firm is not a foreign industrial joint venture and its foreign institutional ownership is at least 10% of the firm; 0 otherwise.
Robust standard errors in parentheses. *, ** and *** indicate significance at 10%, 5% and 1% level, respectively.

44
Table 9: Foreign Ownership and Abnormal Returns
Dependent Variable: Abnormal Returns (α)
(1) (2) (3) (4) (5)Corporate Governance Index (CGI) 0.027 0.291**
(0.020) (0.147)Foreign Industrial Ownership (%) -0.049*** -0.030*
(0.016) (0.018)Foreign Industrial Ownership Dummy -1.636***
(0.548)Foreign Institutional Ownership Dummy 1.744
(1.190)Family-Business-Group Dummy -2.182** -2.799*** -2.529*** -3.033*** -2.415***
(0.971) (1.041) (0.904) (1.078) (0.846)State-Enterprise Dummy -3.191** -4.771*** -4.211*** -6.344** -4.060***
(1.470) (1.775) (1.505) (2.501) (1.436)Log(Market Cap) 0.483** 0.666*** 0.487*** -0.401 0.473**
(0.210) (0.212) (0.165) (0.426) (0.205)Log(Years Listed) 1.791*** 2.000*** 1.966*** 2.318*** 1.916***
(0.474) (0.500) (0.462) (0.589) (0.445)Leverage Ratio 0.212 0.212 0.177 0.226 0.192
(0.327) (0.315) (0.200) (0.318) (0.310)Intangible Assets/Sales -3.409 -3.070 -4.525 -4.732* -4.296
(3.040) (2.686) (3.092) (2.540) (2.723)Fixed Assets/Sales -0.770** -0.747* -0.308* -0.068 -0.322*
(0.378) (0.378) (0.170) (0.262) (0.188)Sales Growth (5yr) 1.454 1.546* 1.546* 1.675 1.532*
(0.890) (0.902) (0.921) (1.201) (0.389)EBIT/Sales 2.218** 1.803* 1.990** 1.483 1.871*
(0.994) (0.984) (0.944) (1.119) (1.028)Share Turnover 0.012** 0.009** 0.009*** 0.009** 0.010**
(0.005) (0.004) (0.004) (0.005) (0.005)
Industry Dummies Yes Yes Yes Yes Yes
Observations 293 296 303 292 295R2 0.283 0.302 0.289 0.116 0.300
OLS IV
Notes: Abnormal return (α) is the constant from the three-factor Fama-French (1993) model (see text for details). Robust standard errors in parentheses. *, ** and *** indicate significance at 10%, 5% and 1% level, respectively.

45
Table 10: Foreign Participation and Components of CGI, 2004
Subindex A Subindex B Subindex C Subindex D Subindex EBoard Structure Conflict of Interest Board Responsibilites Shareholder Rights Disclosure
PANEL A:Foreign Industrial Ownership Dummya -8.501*** -2.538 -5.594*** -3.032 -3.081
(2.717) (1.941) (1.914) (2.358) (1.936)Foreign Institutional Ownership Dummyb 1.759 1.718 3.223 1.955 3.722*
(3.295) (2.432) (2.134) (1.941) (2.162)
Control Variables and Constant Yes Yes Yes Yes Yes
Observations 313 313 313 313 313R2 0.176 0.259 0.154 0.147 0.446F-test on H0: ß1 = ß2 p = 0.006 p = 0.108 p = 0.000 p = 0.048 p = 0.009
PANEL B:Foreign Director Dummy c -5.028** 0.280 -3.001* -1.382 0.025
(2.324) (1.674) (1.687) (1.827) (1.827)
Control Variables and Constant Yes Yes Yes Yes Yes
Observations 313 313 313 313 313R2 0.156 0.252 0.123 0.138 0.433F-test on H0: ß1 = 0 p = 0.031 p = 0.876 p = 0.076 p = 0.450 p = 0.989
Dependent Variable:
Notes: a Foreign Industrial Ownership Dummy assumes a value of 1 if firm is a joint venture with a foreign industrial partner and its foreign partner owns at least 10% of the firm; 0 otherwise.
b Foreign Institutional Ownership Dummy assumes a value of 1 if firm is not a foreign industrial joint venture and its foreign institutional ownership is at least 10% of the firm; 0 otherwise.
c Foreign director dummy is equal to 1 if there exists at least one director of a foreign national on the board of directors; 0 otherwise. All regressions in this table include industry dummies and other control variables analogous to Table 8 Column 3; results are omitted. Robust standard errors in parentheses.
*, ** and *** indicate significance at 10%, 5% and 1% level, respectively.

46
Table 11: Corporate Governance Characteristics of Firms Owned by Foreign Industrial Investors, 2004
Firms w/ Foreign Industrial Ownership All Others Tests of Means
(N = 87) (N = 288)Corporate governance itemsDisclosure of individual directors attendance at board meetings 77% 79%Disclosure of individual directors compensation 57% 62%Disclosure of individual directors shareholdings 91% 96%Disclosure of management shareholdings 89% 93%Disclosure of related party transactions in details 62% 64%
Chairman of the board of directors is a different person from the CEO 62% 61%Percentage of directors who are independent 32% 34%Percentage of directors who are also managers 33% 35%Percentage of directors who have attended directors training programs 18% 42% ***Average number of board meetings in a year 5.3 6.9 ***Average directors attendance at board meetings 75% 83% ***Average independent directors attendance at board meetings 83% 88% *Average audit committee meeting attendance 92% 95%
Existence of nominating committee 9% 22% ***Existence of remuneration committee 17% 25%Existence of corporate governance committee 0% 5% **State definition of "independence" of directors in the disclosure report 17% 34% ***Existence of an accounting expert on the audit committee 49% 59%Existence of company website 77% 85% *Incidence of violation of SEC disclosure rules 2% 9%
Other informationChairman of the board of directors is a controlling-family member 51% 49%CEO is a controlling-family member 23% 54% ***Average Chairman's shareholdings 3% 8% ***Average CEO's shareholdings 3% 9% ***Existence of a foreign director 63% 17% ***Freefloat (minority) shareholdings 31% 40% ***
Note: *, **, *** indicate t-test significant at the 10%, 5%, and 1% level, respectively.
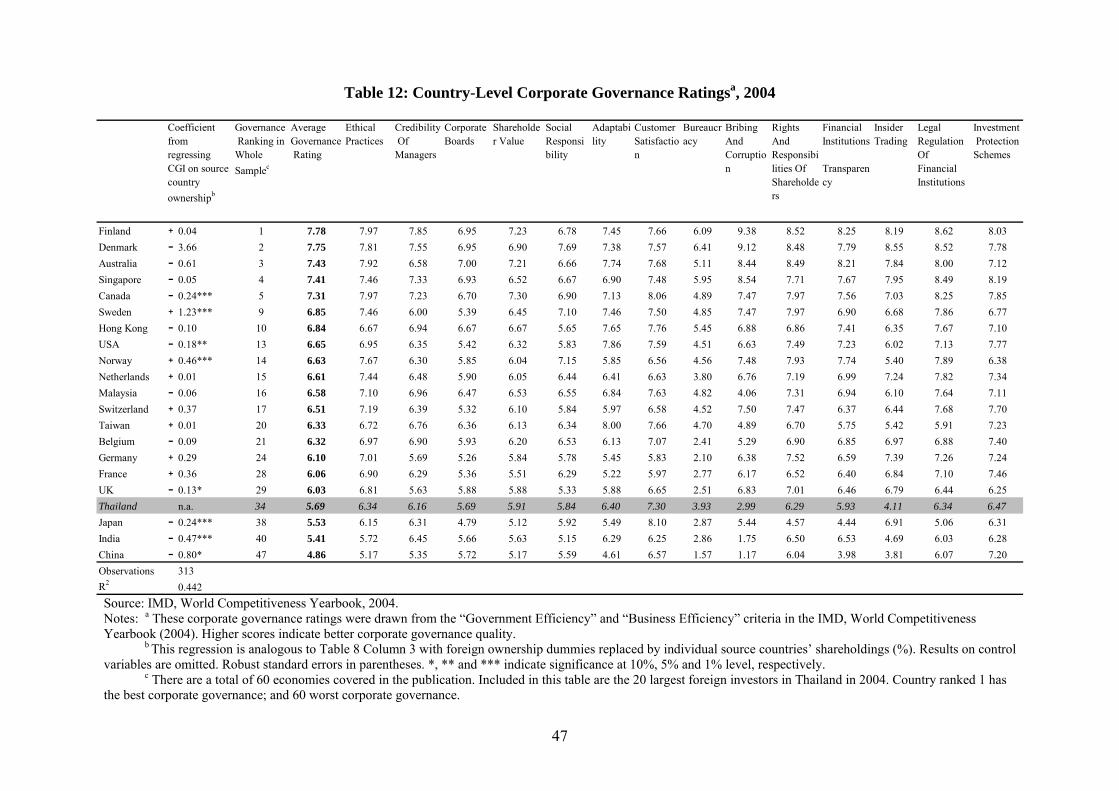
47
Table 12: Country-Level Corporate Governance Ratingsa, 2004
Governance Ranking in Whole Samplec
Average Governance Rating
Ethical Practices
Credibility Of Managers
Corporate Boards
Shareholder Value
Social Responsibility
Adaptability
Customer Satisfaction
Bureaucracy
Bribing And Corruption
Rights And Responsibilities Of Shareholders
Financial Institutions Transparency
Insider Trading
Legal Regulation Of Financial Institutions
Investment Protection Schemes
Finland + 0.04 1 7.78 7.97 7.85 6.95 7.23 6.78 7.45 7.66 6.09 9.38 8.52 8.25 8.19 8.62 8.03Denmark - 3.66 2 7.75 7.81 7.55 6.95 6.90 7.69 7.38 7.57 6.41 9.12 8.48 7.79 8.55 8.52 7.78Australia - 0.61 3 7.43 7.92 6.58 7.00 7.21 6.66 7.74 7.68 5.11 8.44 8.49 8.21 7.84 8.00 7.12Singapore - 0.05 4 7.41 7.46 7.33 6.93 6.52 6.67 6.90 7.48 5.95 8.54 7.71 7.67 7.95 8.49 8.19Canada - 0.24*** 5 7.31 7.97 7.23 6.70 7.30 6.90 7.13 8.06 4.89 7.47 7.97 7.56 7.03 8.25 7.85Sweden + 1.23*** 9 6.85 7.46 6.00 5.39 6.45 7.10 7.46 7.50 4.85 7.47 7.97 6.90 6.68 7.86 6.77Hong Kong - 0.10 10 6.84 6.67 6.94 6.67 6.67 5.65 7.65 7.76 5.45 6.88 6.86 7.41 6.35 7.67 7.10USA - 0.18** 13 6.65 6.95 6.35 5.42 6.32 5.83 7.86 7.59 4.51 6.63 7.49 7.23 6.02 7.13 7.77Norway + 0.46*** 14 6.63 7.67 6.30 5.85 6.04 7.15 5.85 6.56 4.56 7.48 7.93 7.74 5.40 7.89 6.38Netherlands + 0.01 15 6.61 7.44 6.48 5.90 6.05 6.44 6.41 6.63 3.80 6.76 7.19 6.99 7.24 7.82 7.34Malaysia - 0.06 16 6.58 7.10 6.96 6.47 6.53 6.55 6.84 7.63 4.82 4.06 7.31 6.94 6.10 7.64 7.11Switzerland + 0.37 17 6.51 7.19 6.39 5.32 6.10 5.84 5.97 6.58 4.52 7.50 7.47 6.37 6.44 7.68 7.70Taiwan + 0.01 20 6.33 6.72 6.76 6.36 6.13 6.34 8.00 7.66 4.70 4.89 6.70 5.75 5.42 5.91 7.23Belgium - 0.09 21 6.32 6.97 6.90 5.93 6.20 6.53 6.13 7.07 2.41 5.29 6.90 6.85 6.97 6.88 7.40Germany + 0.29 24 6.10 7.01 5.69 5.26 5.84 5.78 5.45 5.83 2.10 6.38 7.52 6.59 7.39 7.26 7.24France + 0.36 28 6.06 6.90 6.29 5.36 5.51 6.29 5.22 5.97 2.77 6.17 6.52 6.40 6.84 7.10 7.46UK - 0.13* 29 6.03 6.81 5.63 5.88 5.88 5.33 5.88 6.65 2.51 6.83 7.01 6.46 6.79 6.44 6.25Thailand n.a. 34 5.69 6.34 6.16 5.69 5.91 5.84 6.40 7.30 3.93 2.99 6.29 5.93 4.11 6.34 6.47Japan - 0.24*** 38 5.53 6.15 6.31 4.79 5.12 5.92 5.49 8.10 2.87 5.44 4.57 4.44 6.91 5.06 6.31India - 0.47*** 40 5.41 5.72 6.45 5.66 5.63 5.15 6.29 6.25 2.86 1.75 6.50 6.53 4.69 6.03 6.28China - 0.80* 47 4.86 5.17 5.35 5.72 5.17 5.59 4.61 6.57 1.57 1.17 6.04 3.98 3.81 6.07 7.20Observations 313R2 0.442
Coefficient from regressing CGI on source country ownershipb
Source: IMD, World Competitiveness Yearbook, 2004. Notes: a These corporate governance ratings were drawn from the “Government Efficiency” and “Business Efficiency” criteria in the IMD, World Competitiveness Yearbook (2004). Higher scores indicate better corporate governance quality. b This regression is analogous to Table 8 Column 3 with foreign ownership dummies replaced by individual source countries’ shareholdings (%). Results on control variables are omitted. Robust standard errors in parentheses. *, ** and *** indicate significance at 10%, 5% and 1% level, respectively. c There are a total of 60 economies covered in the publication. Included in this table are the 20 largest foreign investors in Thailand in 2004. Country ranked 1 has the best corporate governance; and 60 worst corporate governance.

48
Table 13: Origins of Foreign Funds and Institutional Transfers
Dependent Variable: CGI 2004
Number of incidences OLS Number of
incidences OLS Number of incidences OLS
Good CG Country Dummy 112 -1.022 Asian Dummy 86 -2.594* English-Origin Dummy 107 0.364(1.290) (1.402) (1.346)
Poor CG Country Dummy 34 -6.246*** Non-Asian Dummy 60 -1.818 German-Origin Dummy 30 -5.326***(1.914) (1.697) (1.727)
French-Origin Dummy 9 -0.071(2.780)
Scandinavian-Origin Dummy 3 11.168***(2.059)
Constant 12.719 Constant 10.393 Constant 19.51*(8.173) (8.215) (10.28)
Control Variables Yes Control Variables Yes Control Variables Yes
Observations Observations ObservationsR2 R2 R2
F-test on H0: ß1 = ß2 F-test on H0: ß1 = ß2 F-test on H0: ß1 = ß2 = ß3 = ß4
Law Origin of the Largest Source Countryc,dCorporate Governance of the Largest Source Countrya
312
Asian vs. Non-Asian Source Countryb
0.397p = 0.000
3130.383
p = 0.015
3130.371
p = 0.701
Notes: a Good (Poor) CG Country Dummy assumes a value of 1 if the largest source country ranks higher (lower) than Thailand in the corporate governance rating; 0 otherwise. See Table 10 for rankings of the corporate governance of source countries relative to that of Thailand.
b Asian source countries include China, Hong Kong, India, Japan, Malaysia, Singapore, and Taiwan. Non-Asian countries include Australia, Belgium, Canada, Denmark, Finland, France, Germany, the Netherlands, Norway, Sweden, Switzerland, United Kingdom, and the United States. c The law origin dummies have value of 1if shareholders from countries within the respective law origin collectively own more than 10 percent of the total shares in a sample company; 0 otherwise. d In this sample, “English-law-origin” countries include Australia, Canada, Hong Kong, India, Ireland, Israel, Malaysia, Pakistan, Singapore, South Africa, Sri Lanka, United Kingdom, and United States; “French-law-origin” includes Belgium, France, Indonesia, Italy, Jordan, Mexico, the Netherlands, Philippines, Portugal, and Spain; “German-law-origin” includes Austria, Germany, Japan, South Korea, Switzerland, and Taiwan; “Scandinavian-law-origin” includes Denmark, Finland, Norway, and Sweden.
All regressions in this table include industry dummies and other control variables analogous to Table 8 Column 3; results are omitted. Robust standard errors in parentheses.
*, ** and *** indicate significance at 10%, 5% and 1% level, respectively.