does electoral fraud spread? the expansion of electoral manipulation in...
TRANSCRIPT

Full Terms & Conditions of access and use can be found athttp://www.tandfonline.com/action/journalInformation?journalCode=rpsa20
Post-Soviet Affairs
ISSN: 1060-586X (Print) 1938-2855 (Online) Journal homepage: http://www.tandfonline.com/loi/rpsa20
Does electoral fraud spread? The expansion ofelectoral manipulation in Russia
Robert G. Moser & Allison C. White
To cite this article: Robert G. Moser & Allison C. White (2017) Does electoral fraud spread?The expansion of electoral manipulation in Russia, Post-Soviet Affairs, 33:2, 85-99, DOI:10.1080/1060586X.2016.1153884
To link to this article: https://doi.org/10.1080/1060586X.2016.1153884
Published online: 04 Mar 2016.
Submit your article to this journal
Article views: 453
View Crossmark data
Citing articles: 2 View citing articles

Post-soviet AffAirs, 2017 voL. 33, No. 2, 85–99http://dx.doi.org/10.1080/1060586X.2016.1153884
Does electoral fraud spread? The expansion of electoral manipulation in Russia
Robert G. Mosera and Allison C. Whiteb
aDepartment of Government, University of texas at Austin, Austin, tX, UsA; bDepartment of Political science, Colorado state University, fort Collins, Co, UsA
Does electoral fraud spread geographically? Russia provides an excellent case to study the potential geographical diffusion of electoral manipulation. Elections were relatively competitive and mostly free of excessive and blatant electoral manipulation in the 1990s (particularly in the 1995 election) under President Boris Yel’tsin, but became increasingly marred by electoral manipulation in the 2000s under President Vladimir Putin. Studies of electoral fraud in Russia, which have focused primarily on the detection of electoral manipulation, have shown that electoral malfeasance has followed a distinctive geographic pattern. For example, electoral outcomes that have aroused suspicions of fraud have been more likely to occur in the country’s ethnic republics, home to much of Russia’s minority population, rather than in oblasts and krais, which are primarily populated by ethnic Russians (Mebane and Kalinin 2009; Myagkov, Ordeshook, and Shakin 2009; Goodnow, Moser, and Smith 2014; Bader and van Ham 2015). But how, exactly, has electoral fraud in Russia expanded from the relatively limited occurrences during elections in the 1990s to the more numerous and geographically pervasive instances in the 2000s? Are raions (Russia’s smallest geographic units akin to a county or municipality) more likely to be
ABSTRACTIn this paper, we argue that the occurrence of electoral manipulation in Russia has been driven, in part, by diffusion across neighboring raions through emulation, incentives, and networks. Presumably, in Putin’s Russia all local authorities have some incentives to deliver a high number of votes to United Russia, the “party of power”. However, the perceived pressure to deliver ever higher levels of support for Putin’s party arguably increases considerably if one’s raion is located in a region marked by extraordinarily high turnout and high vote share for United Russia. Conversely, the absence of perceived competition to curry executive favor through delivering votes and networks of uncorrupted local authorities, as well as local opposition organizations working to combat electoral fraud, may help explain the absence of fraud among raions located in regions marked by clean elections. Our quantitative analyses suggest that a “neighborhood effect” – the existence of manipulated raions within a region – strongly influences the likelihood that raions are manipulated. Moreover, although results are more mixed, spatial autocorrelation analysis suggests that turnout levels in raions are influenced by the turnout in proximate raions.
ARTICLE HISTORYreceived 12 August 2015 Accepted 21 January 2016
KEYWORDSrussia; electoral fraud; diffusion; neighborhood effect
© 2016 informa UK Limited, trading as taylor & francis Group
CONTACT robert G. Moser [email protected]

86 R. G. MOSER AnD A. C. WHItE
fraudulent if they are located in regions with other raions with manipulated elections? Does geographic proximity to other instances of fraud help explain which raions are manipulated and which are not?
In this paper, we use data from five parliamentary elections in Russia – 1995, 1999, 2003, 2007, and 2011 – to examine the geographic diffusion of electoral manipulation. Using multilevel analyses of electoral and sociodemographic data as well as GIS spatial statistics, we show that there is a geography of electoral manipulation in Russia and that expansion of election fraud has seemed, at least in part, to spread by geographic contagion. Even after controlling for factors such as the ethnic composition of raions and percent rural population at the raion level as well as various characteristics at the regional level (ethnic republic status, Muslim region, Caucasus region, socioeconomic development, and natural resource-based economy), raions were more likely to experience manipulation if they were located in regions that had other raions that experienced excessively high turnout (our proxy for electoral fraud). Moreover, using GIS spatial statistics, we show that, under certain conditions – that is, location within ethnic republics – geographic proximity to other manipulated raions is a significant predictor of fraud. By focusing our attention at the raion level, we are able to demonstrate that electoral manipulation seems to spread at a local level within federal regions such as ethnic republics and oblasts, rather than across regional boundaries.
this finding has important implications for understanding electoral manipulation in Russia. Electoral manipulation in Russia is often viewed as a “top-down” centralized phenomenon, emanating from President Vladimir Putin himself to regional leaders who curry his favor by delivering the vote either as a form of bargaining with the center or as a way to signal loyalty (see Kalinin and Mebane 2010; Bader and van Ham 2015). However, when viewed at the level of raions, the geography of electoral manip-ulation and the patterns of its spread suggest that the phenomenon has an important “bottom-up” quality as well. Local elites and local environments seem to play an important role. Whole regions seem to be untouched by the extraordinarily high turnout and high vote share for Putin’s party, United Russia – which is the hallmark of electoral manipulation – while other regions seem to provide a fer-tile environment for not only the existence of electoral malpractice but also its spread. therefore, our analysis suggests that the diffusion of electoral manipulation is more common within federal regions rather than across them.
Defining and operationalizing electoral manipulation in Russia
Electoral manipulation is the illicit intervention in electoral processes designed to produce specific outcomes that are not expected to occur without said intervention. It takes a wide variety of forms, including political violence and intimidation; various ways of rigging election results (ballot stuffing or misreporting electoral returns); various means to get voters to cast votes in one’s favor (vote buying and patronage), or to stay at home if they are going to cast votes for opponents (denying or restricting access to polling stations); and keeping targeted candidates off the ballot altogether (Lehoucq 2003; Simpser 2013). Direct measures of electoral manipulation are not available in any systematic fashion for Russian elections. therefore, we follow the example of scholars (e.g. Myagkov, Ordeshook, and Shakin 2009; Moraski and Reisinger 2010; Lukinova, Myagkov, and Ordeshook 2011; Goodnow, Moser, and Smith 2014; and Bader and van Ham 2015) who have adopted an indirect approach to gauge electoral misconduct based largely on quantitative indicators, usually unrealistically high voter turnout levels and anomalous distributions of votes across parties.
Like much of the previous research on this issue, we use high voter turnout as our proxy for electoral fraud. We do so for two reasons – the implausibility that exceedingly high turnout is “naturally” occurring and the disproportionally higher vote shares that specific parties receive in high turnout contexts. As Myagkov, Ordeshook, and Shakin (2009) note, in the absence of compulsory voting, extremely high voter turnout in certain raions is most likely driven by some form of electoral manipulation – vote rig-ging, ballot stuffing, vote buying, and patronage-based mobilization – especially if many other raions with similar demographic characteristics experience much lower voter turnout. Moreover, higher voter turnout has been closely associated with higher vote share for a single party, United Russia, in the 2000s.

POSt-SOVIEt AFFAIRS 87
In clean and competitive elections one would expect that increases in voter turnout would result in an increase of voters with all types of preferences going to the polls, not just supporters of one party. thus, higher voter turnout should not change the relative vote share among parties (Myagkov, Ordeshook, and Shakin 2009). thus, excessively high voter turnout in Russia meets the two essential elements in our definition of electoral manipulation – it is indicative of intervention because its sporadic geographic pattern suggests a disruption of normal electoral processes and it appears designed to alter electoral outcomes because very high turnout is closely associated with higher vote shares for the dominant party, particularly under the rule of President Vladimir Putin.
Building on earlier work (Goodnow, Moser, and Smith 2014), we use empirical evidence from the three parliamentary elections held under President Vladimir Putin (2003, 2007, and 2011) to justify our use of high turnout as a proxy for electoral manipulation. As Figure 1 demonstrates, higher voter turnout only benefitted the party of power – United Russia received an increasing share of the vote as reported turnout increased, in contrast to other parties, whose vote shares were relatively stable at lower turnout levels but actually decreased with higher turnout levels. Given these voting patterns, we operationalize electoral manipulation in a dichotomous fashion, classifying raions as fraudulent when reported voter turnout within the raion was equal to or greater than two standard deviations above the national raion-level mean. this is arguably a conservative threshold for identifying electoral manipulation given the relatively monotonic increase in the vote share of United Russia as voter turnout increases in elections under President Vladimir Putin.1
Our proxy measure is more convincing for Russian elections during the 2000s, when a dominant party system emerged and high turnout clearly benefitted it at the cost of other parties, than in the elections of the 1990s. Particularly in the election of 1995, there was no dominant party that exclusively
Figure 1. voter turnout and vote share for select parties in 2003, 2007 and 2011.

88 R. G. MOSER AnD A. C. WHItE
benefited from excessively high turnout and thus much less evidence of electoral manipulation of the sort we are trying to capture. As White (2014, 101–102) notes, scholars and election observers judged the 1995 election to be the cleanest election in Russia’s short history of competitive elections. Despite this, as we show below, there were pockets of extraordinarily high turnout that suggested manipulation, but no single party seemed to be the beneficiary of these measures. Yet, as demonstrated by Figure 2,
Figure 2. voter turnout and vote share for selected parties in 1995 and 1999.

POSt-SOVIEt AFFAIRS 89
excessively high turnout raions in the election of 1995 seemed to favor Our Home is Russia, the party of power at the time, and the Communist Party of the Russian Federation (KPRF), the other party with the strongest regional organizations and, arguably, significant capacity for patronage. By the 1999 elec-tion, the correlation between high turnout and electoral support shifted to the two competing parties of power, Unity (the forerunner of Putin’s United Russia) and Fatherland-All Russia, an electoral bloc uniting regional governors (see Myagkov, Ordeshook, and Shakin 2009, 100). Despite the less striking correlation between high voter turnout and higher vote share of a single dominant party in elections during the 1990s, we use the high turnout proxy for electoral manipulation (two standard deviations above the national mean of turnout) for all elections for consistency.
Why might electoral manipulation concentrate and spread geographically?
In this paper, we are primarily concerned with the role that geographic diffusion plays in electoral manipulation. the role of diffusion has gained significant attention in comparative politics recently, particularly in the study of regime change. Brinks and Coppedge (2006) have persuasively argued that a country’s degree of democracy was powerfully shaped by the level of democracy that existed among its neighbors. Weyland (2010) demonstrated that dramatic popular challenges to authoritarian regimes in nineteenth-century Europe had significant demonstration effects on other countries throughout Europe, sparking revolutions and attempted revolutions throughout the region, even though the final outcome regarding regime type varied considerably. Similarly, Bunce and Wolchik (2011), Beissinger (2009), and Way (2008) have debated the diffusion of challenges to authoritarian regimes of the so-called “colored revolutions” in post-communist states. naturally, these scholars and others (see Enterline and Greig 2005) have stressed the potential for the diffusion of authoritarian as well as democratic processes.
Why might we expect that electoral manipulation would spread geographically and be subject to phenomena such as “neighborhood effects”? We argue that, much like the diffusion of regime change across national borders within broad geopolitical regions, the occurrence of electoral manipulation in Russia has been driven, in part, by diffusion across neighboring raions through emulation, incentives, and networks. Brinks and Coppedge posited as the core assumption of their model of democratic dif-fusion that “countries are rewarded when their regimes are similar to those of their neighbors” (Brinks and Coppedge 2006, 466). Presumably, in Putin’s Russia all local authorities have some incentives to deliver a high number of votes to United Russia, the “party of power,” given the clear signals from a very powerful executive that such outcomes may be rewarded and failure to provide such support may be punished (Kalinin and Mebane 2010). However, the perceived pressure to deliver ever higher levels of support for Putin’s party arguably increases considerably if one’s raion is located in a region marked by extraordinarily high turnout and high vote share for United Russia as opposed to those regions where such outcomes are largely absent. Moreover, there might exist networks of corrupt local authorities that precipitate the spread of electoral malfeasance across raions within certain regions as opposed to those that tend to have cleaner elections. Conversely, the absence of perceived competition to curry executive favor through delivering votes and networks of uncorrupted local authorities, as well as local opposition organizations working to combat electoral fraud, may help explain the absence of fraud among raions located in other regions.
The geography of electoral manipulation in Russia
When examining the geographic expansion of electoral manipulation in Russia, the first thing to note is the phenomenon’s regional-level concentration. Raions with extraordinarily high turnout (our proxy for electoral manipulation) have been relatively concentrated in a small minority of regions in Russia in the 1990s, only to modestly expand to more parts of the country in the 2000s. table 1 summarizes the number of regions with at least one raion that was two standard deviations above the national mean for turnout based on raion-level results.

90 R. G. MOSER AnD A. C. WHItE
Several trends in incidence and growth of high-turnout raions are clear when examining the regions that have manipulated raions. First, manipulated raions have indeed grown in number since 1995, doubling in number in the next election (1999) and then increasing by 50 percent again by 2007 and remaining stable at that higher level in 2011. However, raions with extremely high turnout remain a small minority of the total even in the late 2000s, with just under 7% of raions reaching the threshold of two standard deviations above the mean national turnout in 2007 and 2011. Just over 2% of raions had suspiciously high turnout in 1995 and under 5% met this threshold in 1999.
Furthermore, the geographic distribution of manipulated raions was highly concentrated within a relatively small number of regions, and this pattern remained remarkably stable throughout the 1990s and 2000s. With very few exceptions, the same 17 to 23 regions (out of over 80 total regions) experi-enced all the electoral fraud in Russia based on our measure of electoral manipulation.2 In 1995, 67% of manipulated raions were located in just three regions (tatarstan, Bashkortostan, and Chechnya), and in 1999, 75% of manipulated raions came out of tatarstan, Bashkortostan, and Dagestan (data on Chechnya were missing). the number of regions with manipulated raions increased only slightly in elections held under President Vladimir Putin and the distribution across regions only became marginally more dis-persed. In 2007 and 2011, 59 and 54% of all manipulated raions, respectively, came from four regions: tatarstan, Bashkortostan, Chechnya, and Dagestan. Large concentrations of high-turnout raions were found in a handful of other ethnic republics such as Mordovia and Karbardino-Balkaria and a very few Russian regions like tyumen. In short, a cursory exploration of the geography of electoral manipulation suggests that the expansion in the number of manipulated raions in Russia tended to be driven by the expansion of fraud within regions that had already experienced electoral irregularities rather than diffusion of fraud across regions as has been suggested by other studies (Moraski and Reisinger 2010).
Of course, one might expect the impact of geographic proximity on the diffusion of electoral manip-ulation to be higher at the raion level rather than at the regional level.3 But this is precisely the point of this paper. Our analysis here only suggests the presence of significant diffusion of electoral fraud at the raion level, without uncovering the precise causal mechanisms underlying why this may be the case. Yet, there are several good reasons to suspect that the impact of geographic proximity may be more salient within regions than it is between regions.
First, governors have fewer units to monitor and a smaller political agenda to manage than the president, which allows them to deploy greater attention, pressure, and resources into coordinating electoral manipulation at the raion level if they so choose. Second, the vulnerability of the targets of administrative pressure is likely greater for local officials than it is for governors, since local leaders are arguably more easily punished (that is, removed from office) for not sufficiently producing desired results than governors. this could increase the pressure on local officials to manipulate elections, par-ticularly if neighboring raions are doing so. third, raion leaders may be perceived as more capable of executing electoral manipulation in a single raion than a governor would be in a large, diverse region containing many raions. thus, the relatively small size of raions could raise expectations of the efficacy of raion leaders in the realm of electoral manipulation. Finally, as the pressure to engage in electoral malfeasance moves down the hierarchy of government administration from the president to governors to local raion leaders, the pressure to engage in electoral manipulation arguably grows. Because he sits at the top of the food chain, no one pressures President Vladimir Putin to engage in electoral fraud.
Table 1. summary of manipulated raions, 1995–2011.
*two standard deviations above average raion-level national turnout.
Election yearVoter turnout
threshold*number of manipu-
lated raions
number of regions with any manipulat-
ed raionsPercent of total
raions1995 85.75 67 18 2.531999 82.36 124 17 4.562003 83.75 165 22 6.212007 94.82 182 22 6.722011 92.96 181 23 6.67

POSt-SOVIEt AFFAIRS 91
thus, the level of pressure President Putin exerts on any particular governor will vary on the level of his own perceived electoral vulnerability in that election in that region. However, governors experience and pass along to local raion leaders both the perceived pressure from their superiors at the national level as well as their own reasons to coordinate electoral manipulation for local purposes. By the time these signals reach the local level, the perceived pressure to manipulate elections should be greatest.
More important for the issue of geographic diffusion, taking all of these considerations into account, this pressure to engage in electoral manipulation is not only strongest at the local level but also arguably most susceptible to the impact of geographical proximity within regions rather than between regions because the electoral results of neighboring raions is a primary metric of successful electoral mobilization for raion leaders.
Data and variables
Data
We employ multilevel regression analysis in order to more systematically investigate the potential role of geographical diffusion in the incidence of electoral manipulation in Russia. As indicated above, our study is based on electoral data from the Central Election Commission of Russia and sociodemographic data from the 2002 All-Russian national Census and Rosstat, the Russian State Statistics Service. the election and ethnicity census data are reported at the level of each raion in the country, which gives us approximately 2,700 observations for each election year on which to base our findings. In addition to the ethnicity data, the Rosstat website reports the percentage of the total population that is rural in each raion, which, in combination with information about each region’s gross regional product (GRP) and status as a resource-rich region, provides a measure of socioeconomic welfare.
Dependent and independent variables
As explained above, our dependent variable is electoral manipulation, which we operationalize dichot-omously based on reported voter turnout. Any raion that registers voter turnout that is at least two standard deviations above the raion-level national mean for turnout is coded as fraudulent.
Our primary intent in this paper is to study the geographic variation of high-turnout raions and we expect several factors to influence the number of raions coded as manipulated within the 80 + regions of the Russian Federation.4 If, as we argue above, electoral manipulation is, in part, driven by diffusion, then raions located in regions with other high-turnout raions are more likely to experience manipulation themselves. thus, our variable of greatest interest in the multilevel logistic regression model below is neighborhood effect, a region-level continuous variable measuring the proportion of manipulated raions located within a region.
In order to distinguish between a neighborhood effect and the geographic clustering of other factors that may affect the incidence of electoral fraud, we need to control for other factors at both the raion level and regional level. At the raion level, we have two variables – ethnicity (% non-Russians within raions) and rural (% rural population within raions). Goodnow, Moser, and Smith (2014) argue that eth-nicity may play a vital role in the incidence of electoral manipulation and thus manipulated raions should be more prevalent in local environments with high concentrations of ethnic minorities. Raions with concentrations of ethnic minorities may be perceived as a potential threat to the state and thus require “special efforts” to maintain control and also may possess resources embedded in ethnic mobilization that promote the use of patronage and electoral machine politics (Hale 2003; Goodnow, Moser, and Smith 2014). Following Myagkov and Ordeshook (2008) and Myagkov, Ordeshook, and Shakin (2009), we expect urban raions to be less susceptible to electoral manipulation than rural raions because the former provide fewer opportunities for elite intervention into the electoral process than the latter.
At the regional level, we expect several factors to affect the incidence of high-turnout raions and thus con-trol for them. We expect raions’ location in: ethnic regions, Muslim regions, the Caucasus region, and resource-rich regions to affect the likelihood that a given raion will experience electoral malfeasance. Myagkov, Ordeshook, and Shakin (2009) have firmly established that ethnic regions (republics and autonomous okrugs)

92 R. G. MOSER AnD A. C. WHItE
have experienced more electoral manipulation than Russian regions (oblasts and krais). We also expect raions located in Muslim ethnic regions to be more manipulated than raions in Russian or non-Muslim, non-Rus-sian regions because incentives for national authorities to control Muslim regions may be higher given the experience with the Chechen War and broader violence in the Caucasus as well as the prevalence of drives for autonomy during the 1990s, which were strongest among Muslim ethnic republics (treisman 1997).5 For similar reasons (greater incentives and resources to manipulate elections), we expect raions located in the Caucasus and resource-rich regions to be more likely to experience manipulated elections.6 We also control for economic development at the regional level, expecting that regions with higher levels of prosperity will have higher turnout than regions with lower levels of prosperity.
Multilevel logistic models analysis
to analyze the determinants of electoral fraud in the proportional representation tier of Russian parlia-mentary elections, we specify a series of multilevel logistic models that relate the varying proportions of ethnic and rural populations at the raion level and contextual characteristics at the regional level to the probability that a raion will be subject to electoral manipulation. there are two levels of analysis considered, raion (level 1) and region (level 2). the level-1 predictors of ethnicity and urbanization are both continuous and measure the percentage of non-Russians and rural population in a given raion. We also leverage regional variation at level 2 across numerous dimensions: ethnic republic, Muslim region, Caucasus location, gross regional product, resource region, and the neighborhood effect. Four of the six level-2 contextual variables are dichotomous: ethnic republic, Muslim region, Caucasus location, and resource region. the remaining two regional variables, economic development and neighborhood effect, are continuous and measure gross regional product and the proportion of raions in a region that are coded positively for suspected electoral manipulation.
We employ a random intercept model, which allows the intercept to vary across the level 2, or regional, units. We specify the following model for each election:
Level 1: Yij = β0j + β1j(percent minority)ij + β2j(percent rural)ij + rij
Level 2: β0j = γ00 + γ01(ethnic region)j + γ02(Muslim region)j + γ03(Caucasus location)j + γ04(economic develop-ment)j + γ05(resource region)j + γ06(neighborhood effect)j + u0j
β1j = γ10 β2j = γ20
Above, the left side of the equation is the probability that the dependent variable is equal to one, indicat-ing potential electoral manipulation in raion i nested within region j. β0j is the constant term and equals the log-odds that electoral manipulation will occur when the remaining predictors are all equal to zero. β1j and β2j are the coefficients for percent minority and percent rural, respectively, and indicate the effect of a 1% increase in the minority and rural population on the log-odds of electoral manipulation. the remaining terms represent the coefficients for the regional variables: ethnic region, Muslim region, Caucasus region, economic development, resource region, and neighborhood effect. the regression coefficients are exponentiated so that the independent variables influence the odds of electoral manipulation rather than the logged odds. Substantively, a coefficient of one represents even odds of electoral manipulation, while a coefficient greater than one increases the odds and a coefficient less than one decreases the odds.
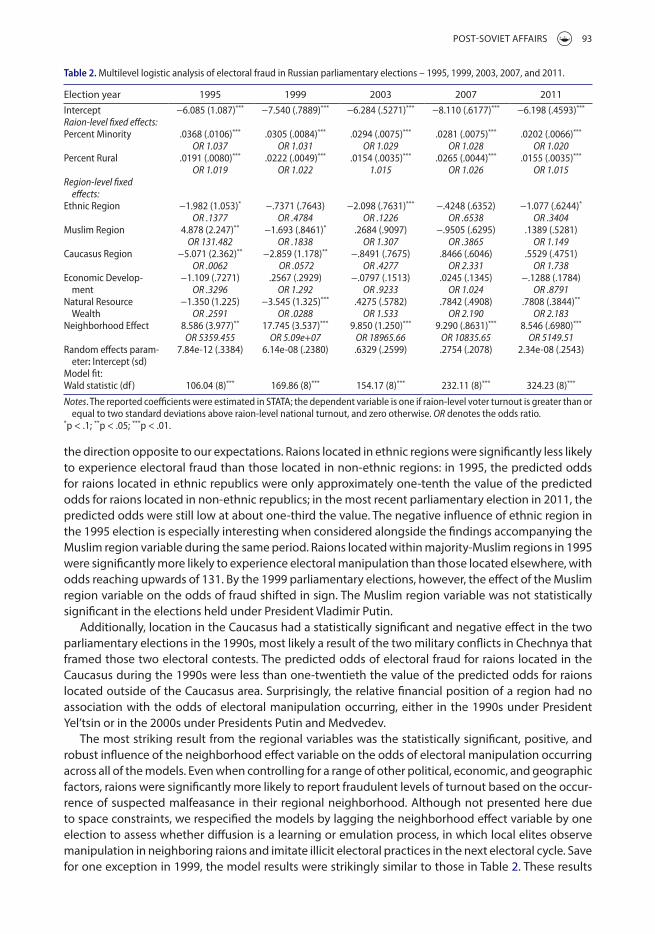
the two raion-level variables are particularly revealing across all of the elections examined (table 2). Without exception, higher concentrations of ethnic minorities exercised a robust and positive effect on the odds of electoral manipulation occurring. A 1% increase in the ethnic minority population of a raion amplified the odds of electoral fraud by 2 to nearly 4%, depending on the model. the second raion-level variable, assessing the percentage of rural residents, also augmented the odds of electoral fraud by 1 to 2% across the models.
At level 2, the predictors controlling for diverse regional contexts produced more variable results compared to those predictors at the raion level, but nevertheless underscore the importance of account-ing for regional differences in analyses of electoral fraud in Russia.7 With regard to the ethnic region indicator, the majority of the models demonstrated a statistically significant and robust effect, albeit in
POSt-SOVIEt AFFAIRS 93
the direction opposite to our expectations. Raions located in ethnic regions were significantly less likely to experience electoral fraud than those located in non-ethnic regions: in 1995, the predicted odds for raions located in ethnic republics were only approximately one-tenth the value of the predicted odds for raions located in non-ethnic republics; in the most recent parliamentary election in 2011, the predicted odds were still low at about one-third the value. the negative influence of ethnic region in the 1995 election is especially interesting when considered alongside the findings accompanying the Muslim region variable during the same period. Raions located within majority-Muslim regions in 1995 were significantly more likely to experience electoral manipulation than those located elsewhere, with odds reaching upwards of 131. By the 1999 parliamentary elections, however, the effect of the Muslim region variable on the odds of fraud shifted in sign. the Muslim region variable was not statistically significant in the elections held under President Vladimir Putin.
Additionally, location in the Caucasus had a statistically significant and negative effect in the two parliamentary elections in the 1990s, most likely a result of the two military conflicts in Chechnya that framed those two electoral contests. the predicted odds of electoral fraud for raions located in the Caucasus during the 1990s were less than one-twentieth the value of the predicted odds for raions located outside of the Caucasus area. Surprisingly, the relative financial position of a region had no association with the odds of electoral manipulation occurring, either in the 1990s under President Yel’tsin or in the 2000s under Presidents Putin and Medvedev.
the most striking result from the regional variables was the statistically significant, positive, and robust influence of the neighborhood effect variable on the odds of electoral manipulation occurring across all of the models. Even when controlling for a range of other political, economic, and geographic factors, raions were significantly more likely to report fraudulent levels of turnout based on the occur-rence of suspected malfeasance in their regional neighborhood. Although not presented here due to space constraints, we respecified the models by lagging the neighborhood effect variable by one election to assess whether diffusion is a learning or emulation process, in which local elites observe manipulation in neighboring raions and imitate illicit electoral practices in the next electoral cycle. Save for one exception in 1999, the model results were strikingly similar to those in table 2. these results
Table 2. Multilevel logistic analysis of electoral fraud in russian parliamentary elections – 1995, 1999, 2003, 2007, and 2011.
Notes. the reported coefficients were estimated in stAtA; the dependent variable is one if raion-level voter turnout is greater than or equal to two standard deviations above raion-level national turnout, and zero otherwise. OR denotes the odds ratio.
*p < .1; **p < .05; ***p < .01.
Election year 1995 1999 2003 2007 2011intercept −6.085 (1.087)*** −7.540 (.7889)*** −6.284 (.5271)*** −8.110 (.6177)*** −6.198 (.4593)***
Raion-level fixed effects:Percent Minority .0368 (.0106)*** .0305 (.0084)*** .0294 (.0075)*** .0281 (.0075)*** .0202 (.0066)***
OR 1.037 OR 1.031 OR 1.029 OR 1.028 OR 1.020Percent rural .0191 (.0080)*** .0222 (.0049)*** .0154 (.0035)*** .0265 (.0044)*** .0155 (.0035)***
OR 1.019 OR 1.022 1.015 OR 1.026 OR 1.015Region-level fixed
effects:ethnic region −1.982 (1.053)* −.7371 (.7643) −2.098 (.7631)*** −.4248 (.6352) −1.077 (.6244)*
OR .1377 OR .4784 OR .1226 OR .6538 OR .3404Muslim region 4.878 (2.247)** −1.693 (.8461)* .2684 (.9097) −.9505 (.6295) .1389 (.5281)
OR 131.482 OR .1838 OR 1.307 OR .3865 OR 1.149Caucasus region −5.071 (2.362)** −2.859 (1.178)** −.8491 (.7675) .8466 (.6046) .5529 (.4751)
OR .0062 OR .0572 OR .4277 OR 2.331 OR 1.738economic Develop-
ment −1.109 (.7271) .2567 (.2929) −.0797 (.1513) .0245 (.1345) −.1288 (.1784)
OR .3296 OR 1.292 OR .9233 OR 1.024 OR .8791Natural resource
Wealth−1.350 (1.225) −3.545 (1.325)*** .4275 (.5782) .7842 (.4908) .7808 (.3844)**
OR .2591 OR .0288 OR 1.533 OR 2.190 OR 2.183Neighborhood effect 8.586 (3.977)** 17.745 (3.537)*** 9.850 (1.250)*** 9.290 (.8631)*** 8.546 (.6980)***
OR 5359.455 OR 5.09e+07 OR 18965.66 OR 10835.65 OR 5149.51random effects param-
eter: intercept (sd)7.84e-12 (.3384) 6.14e-08 (.2380) .6329 (.2599) .2754 (.2078) 2.34e-08 (.2543)
Model fit:Wald statistic (df ) 106.04 (8)*** 169.86 (8)*** 154.17 (8)*** 232.11 (8)*** 324.23 (8)***

94 R. G. MOSER AnD A. C. WHItE
suggest that there may be an important temporal dimension to the diffusion of electoral malfeasance, although the evidence presented in table 2 indicates that such processes seem to occur simultaneously as well.8
Spatial statistics
We selected two regions, tatarstan and Bashkortostan, as illustrative case studies to assess the spatial patterning of turnout and possible electoral manipulation at the subnational level in Russia from the mid-1990s through 2011. these regions allow us to compare and contrast the spatial patterning of electoral turnout between two largely similar ethnic regions. Leveraging turnout data at the smallest administrative unit in Russia for which there is available data, each region’s unique spatial pattern of turnout is mapped for each of the five parliamentary elections. the turnout thresholds created in the graduated colors map legends correspond to the standard deviation derived from raion-level national turnout for a given election.
Collectively, the maps showcase variation in turnout within regions over time as well as variation between regions. the maps in Figure 3 reveal that turnout reaching our threshold for fraud occurred even in the most competitive legislative election in post-communist Russia – 1995 – but also spread rapidly once Putin entered Russian politics in 1999. Raions reporting the highest levels of turnout in tatarstan spread unceasingly from 1995 through 2003. By 2003, nearly the entire region contained raions suspected of fraud as only a small handful of raions in the region registered turnout that fell below our conservative threshold, a pattern that continued throughout legislative elections in the Putin era. A type of geographic diffusion may be occurring in tatarstan, in which raions that are geographically proximate learn of, and ultimately emulate, each other’s electoral practices during parliamentary contests. Yet, the contagion of electoral manipulation also seems to have important geographic or structural contours in the region: in each election, the raions comprising the region’s gorods (cities) reported turnout that
Figure 3. turnout in tatarstan, 1995–2011.
POSt-SOVIEt AFFAIRS 95
fell significantly below the more rural raions surrounding them, suggesting that the contagion spread quickly in the countryside but failed to infect the cities to the same degree.
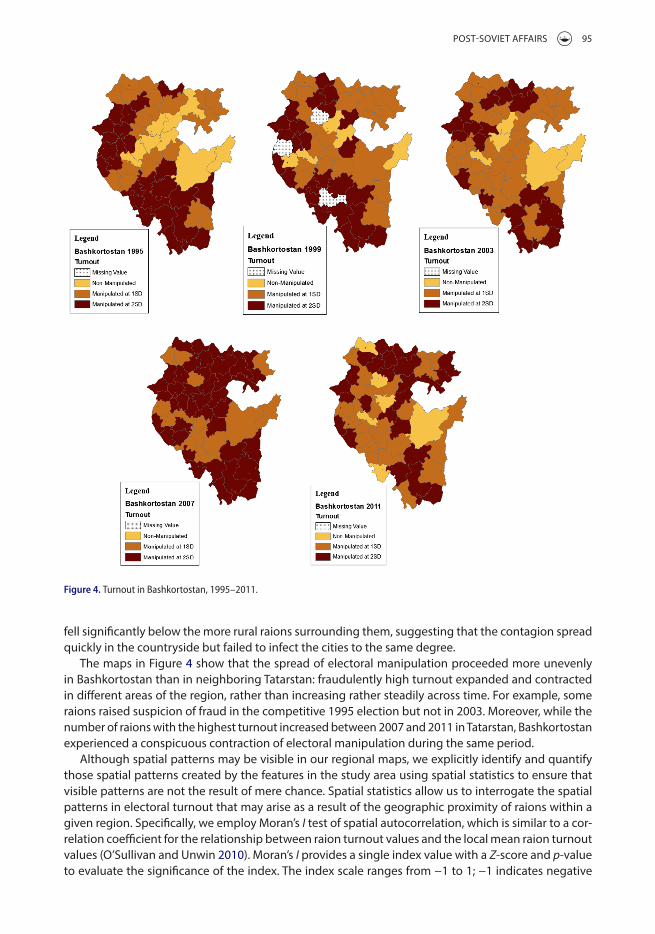
the maps in Figure 4 show that the spread of electoral manipulation proceeded more unevenly in Bashkortostan than in neighboring tatarstan: fraudulently high turnout expanded and contracted in different areas of the region, rather than increasing rather steadily across time. For example, some raions raised suspicion of fraud in the competitive 1995 election but not in 2003. Moreover, while the number of raions with the highest turnout increased between 2007 and 2011 in tatarstan, Bashkortostan experienced a conspicuous contraction of electoral manipulation during the same period.
Although spatial patterns may be visible in our regional maps, we explicitly identify and quantify those spatial patterns created by the features in the study area using spatial statistics to ensure that visible patterns are not the result of mere chance. Spatial statistics allow us to interrogate the spatial patterns in electoral turnout that may arise as a result of the geographic proximity of raions within a given region. Specifically, we employ Moran’s I test of spatial autocorrelation, which is similar to a cor-relation coefficient for the relationship between raion turnout values and the local mean raion turnout values (O’Sullivan and Unwin 2010). Moran’s I provides a single index value with a Z-score and p-value to evaluate the significance of the index. the index scale ranges from −1 to 1; −1 indicates negative
Figure 4. turnout in Bashkortostan, 1995–2011.

96 R. G. MOSER AnD A. C. WHItE
autocorrelation or perfect dispersion, 1 indicates positive autocorrelation or perfect correlation, and 0 indicates that the spatial pattern is purely random. the null hypothesis of Moran’s I is that the spa-tial pattern of turnout is caused by an independent random process or the result of complete spatial randomness.
Because our primary interest is to examine the potential geographic diffusion of electoral manip-ulation in Russian parliamentary elections, we defined what constitutes a geographic neighbor for the purposes of our Moran’s I calculations according to inverse distance, which is the appropriate conceptualization of spatial relationships to model processes where the closer two units are in space, the more likely they are to interact or influence each other. Our inverse-distance conceptualization of spatial relationships represents a hypothesis about the range and nature of any likely geographic effects relating to electoral turnout: we expect that raions in close geographic proximity are more likely than distant raions to influence each other’s electoral practices through various mechanisms of diffusion, such as learning, neighbor emulation, or competition among local elites to curry favor with powerful regional governors (Brinks and Coppedge 2006; O’Sullivan and Unwin 2010, 220).
table 3 presents the results of the spatial statistics for our two regional case studies, as well as Russia as a whole. Across all regions in Russia, the test for spatial autocorrelation demonstrates sta-tistically significant and positive spatial dependency in the distribution of turnout at the raion level. Raions have been more similar to each other than different, indicating that the difference in turnout values of nearby raions has been less than the difference in turnout values among all raions (Mitchell 2005). Compared to all regions, the spatial statistics for tatarstan reveal a significantly higher degree of spatial dependency in each of the five elections. the level of turnout in a given raion in tatarstan has not had an equal probability of occurring anywhere and the positioning of that turnout has not been independent of the positioning of turnout in other raions, violating the two conditions postulated by the null hypothesis (O’Sullivan and Unwin 2010,10).
Surprisingly, the Moran’s I indices for Bashkortostan, on the other hand, achieved statistical signif-icance and denoted positive spatial dependency starting only in 2007. Unlike tatarstan, during the 1990s and into the first parliamentary election of the 2000s, the distribution of turnout across raions in Bashkortostan cannot be distinguished from an independent random process. theoretically, the reported turnout in any given raion in Bashkortostan could have occurred in any other raion in the region and was not influenced by levels of political participation in nearby raions.
these findings were unexpected for several reasons. First, some degree of spatial dependence is expected between administrative units that are geographically near to each other (tobler 1970). the fact that political outcomes in Bashkortostan violate tobler’s first law of geography is therefore striking. Second, as mentioned, the spatial statistics using data from all regions demonstrate positive and statis-tically significant spatial dependency that became consistently more pronounced over time. Given that levels of turnout across Russia’s more than 2,700 raions grew increasingly interdependent, one might reasonably expect that such dependency would only strengthen in the context of a single region, espe-cially one for which machine politics and electoral mobilization have been well-documented. Finally, raions in a similar ethnic region, tatarstan, proved to be remarkably similar to the national pattern with respect to turnout and the presence of statistically significant spatial dependence. the findings from these two ethnic regions suggest that the geographic diffusion of electoral innovations aimed at achieving high rates of turnout in the ethnic republics may be less uniform and more limited than ini-tially expected: these regions are strikingly similar across a number of underlying factors, namely ethnic
Table 3. spatial patterns of electoral turnout in tatarstan and Bashkortostan in russian parliamentary elections (Moran’s i values).
*p-value < .1; **p-value < .05; ***p-value < .01.
Parliamentary election year/region 1995 1999 2003 2007 2011All regions .0575*** .0843*** .1075*** .1158**** .1369***
tatarstan .3417*** .3220*** .2580** .2985*** .2572**
Bashkortostan −.0277 .0146 .1143 .1237** .1340**

POSt-SOVIEt AFFAIRS 97
republic status, a majority-Muslim population, location outside the Caucasus, similar gross regional products, and resource-based regional economies, yet differ significantly with regard to the existence and strength of spatial dependence across time. the Putin effect in Russian electoral politics clearly manifested at different times in different regions, underscoring the importance of disaggregating the category of ethnic republics in future research on the dynamics of electoral malfeasance.
Conclusion
the analysis presented here provides several important findings regarding electoral manipulation in Russia. First, manipulated elections, while widespread by the 2000s were not a nationwide phenom-enon. Rather, there were regions that were clearly and egregiously affected by electoral malfeasance and other regions that were largely untouched by the type of manipulation that could be identified through excessively high turnout and high vote shares for the dominant party. Moreover, there is strong evidence suggesting that electoral manipulation in Russia is influenced by geographic diffusion within federal regions. Manipulated raions tended to cluster geographically and the expansion of electoral fraud over time tended to occur within regions rather than across regional boundaries. the proportion of manipulated raions within a region is a significant factor, both statistically and substantively, in mul-tilevel models examining the determinants of electoral manipulation.
Preliminary spatial statistics on selected regions assessing the influence of geographic proximity on voter turnout offer more mixed results but provide an interesting avenue to further investigate this phenomenon. While tatarstan showed strong evidence of geographic diffusion of electoral fraud throughout the 1990s and 2000s, its neighbor Bashkortostan only displayed spatial patterns suggesting diffusion over the last two elections. Most likely, regional concentration of electoral fraud in Russia is due to a combination of underlying structural factors (that are also geographically concentrated, such as minority populations) as well as the type of mechanisms such as emulation, learning, and pressure we commonly associate with diffusion. As scholars move from identifying electoral fraud to explaining its determinants, it will be important for them to investigate the causal mechanisms underlying the regional concentration of electoral manipulation within regions.
Notes1. In our multi-level logistic regression models, we tested our hypotheses at thresholds of both one and two standard
deviations above the national mean voter turnout. Our findings were similar using both thresholds. Only findings for models using the two-standard deviation threshold are shown.
2. As one might expect, a lower threshold for electoral manipulation (one standard deviation above the average raion-level turnout) produces significantly more potentially manipulated raions and substantially more regions with at least one potentially manipulated raion. For example, at the one-standard deviation threshold, there were 378 manipulated raions (14% of total raions) and 50 regions with at least one manipulated raion in the 2003 election. However, this lower level potentially captures non-manipulated raions, especially in earlier elections. For example, such a threshold would result in higher numbers of manipulated raions in 1995 (415) than in 2003 (379), even though the 1995 election is considered by most analysts to be the cleanest post-Soviet Russian election. Consequently, we opted for the higher, more conservative proxy of two standard deviations for electoral manipulation.
3. the authors wish to acknowledge and thank an anonymous reviewer for originally making this point.4. the number of Russia’s federal units has changed over time. Originally, there were 89 regions after Russia became
an independent state in 1991, but then some autonomous units were eliminated or merged through federal reorganizations so that now there are only 83 regions.
5. Because religion and ethnicity are closely associated in Russia, we use ethnicity as a proxy for religious tradition. Certain ethnic groups are coded as Muslim (e.g. tatars, Bashkirs, and Ingush), while the Russian majority and other non-Russian minorities are coded as non-Muslim (e.g. Buryat, Kalmyk, and Mordva).
6. Data on the percentage of regional economies based on the export of natural resources come from Bradshaw (2006).
7. the addition of the neighborhood effect variable likely affected the influence of the other regional-level independent variables. We re-ran the analysis without the neighborhood effect variable (not shown here), and the Muslim region variable was statistically significant and positively correlated with electoral manipulation for all elections. the results for the other regional-level factors (ethnic region, Caucasus region, and economic development) were

98 R. G. MOSER AnD A. C. WHItE
unchanged and mostly statistically insignificant. While these findings suggest a high degree of multicollinearity between neighborhood effects and Muslim regions, the magnitude of the neighborhood effect outweighs the magnitude of the Muslim variable in the two analyses, suggesting that the neighborhood effect is capturing more than just the effect of Muslim regions.
8. One could also argue that, as electoral manipulation became a more regular occurrence under President Putin in the 2000s, the detection of geographic diffusion within regions may actually be more difficult to observe. this is due to the potential that voter turnout would get so high that variation between raions (particular variations at our threshold for manipulation of two standard deviations higher than the national raion-level mean) would be less likely despite the persistence of widespread electoral manipulation. Indeed, as shown in table 1, the numerical threshold for manipulation was significantly higher in 2007 and 2011 (95 and 93%, respectively) than it was in previous elections (86% and lower). the authors would like to thank an anonymous reviewer for making this point. However, we could not find a reasonable control variable to account for this phenomenon. Ultimately, this issue simply makes our research design a more difficult test of our hypothesis. Even though it was more difficult to detect diffusion of fraud in the 2007 and 2011 elections because the overall national turnout was higher in those years, we still had robust findings on our principal variable of interest – the “neighborhood effect.” this provides further reason to believe our central finding that there was geographical diffusion of electoral fraud within regions.
AcknowledgementsAllison C. White held an American Fellowship from AAUW in 2013–2014 that supported this research.
Disclosure statementno potential conflict of interest was reported by the authors.
ReferencesBader, M., and C. van Ham. 2015. “What Explains Regional Variation in Election Fraud? Evidence from Russia: A Research
note.” Post-Soviet Affairs 31 (6): 514–528.Beissinger, M. 2009. “Debating the Color Revolutions: An Interrelated Wave.” Journal of Democracy 20 (1): 74–77.Bradshaw, M. 2006. “Observations on the Geographical Dimensions of Russia’s Resource Abundance.” Eurasian Geography
and Economics 47 (6): 724–746.Brinks, D., and M. Coppedge. 2006. “Diffusion is no Illusion: neighbor Emulation in the third Wave of Democracy.”
Comparative Political Studies 39 (4): 463–489.Bunce, V., and S. Wolchik. 2011. Defeating Authoritarian Leaders in Postcommunist Countries. new York: Cambridge University
Press.Enterline, A., and J. Greig. 2005. “Beacons of Hope? the Impact of Imposed Democracy on Regional Peace, Democracy, and
Prosperity.” The Journal of Politics 67 (4): 1075–1098.Goodnow, R., R. Moser, and t. Smith. 2014. “Ethnicity and Electoral Manipulation in Russia.” Electoral Studies 36 (4): 15–27.Hale, H. 2003. “Explaining Machine Politics in Russia’s Regions: Economy, Ethnicity, and Legacy.” Post-Soviet Affairs 19 (3):
228–263.Kalinin, K., and W. Mebane. 2010. “Understanding Electoral Frauds through Evolution of Russian Federalism: From ‘Bargaining
Loyalty’ to ‘Signaling Loyalty’.” Paper prepared for presentation at the Annual Meeting of the American Political Science Association, Washington, DC, September 2–5.
Lehoucq, F. 2003. “Electoral Fraud: Causes, types, and Consequences.” Annual Review of Political Science 6 (1): 233–256.Lukinova, E., M. Myagkov, and P. Ordeshook. 2011. “Ukraine 2010: Were tymoshenko’s Cries of Fraud Anything More than
Smoke?” Post-Soviet Affairs 27 (1): 37–63.Mebane, W., and K. Kalinin. 2009. “Comparative Election Fraud Detection.” Paper prepared for presentation at the Annual
Meeting of the American Political Science Association, toronto, Canada, September 3–6.Mitchell, A. 2005. The Esri Guide to GIS Analysis, Volume 2: Spatial Measurements and Statistics. Redlands, CA: ESRI Press.Moraski, B., and W. Reisinger. 2010. “Spatial Contagion in Regional Machine Strength: Evidence from Voting in Russia’s
Federal Elections.” Paper prepared for presentation at the Annual Meeting of the American Political Science Association, Washington, DC, September 2–5.
Myagkov, M., and P. Ordeshook. 2008. “Russian Elections: An Oxymoron of Democracy.” Accessed February 1. http://ssrn.com/abstract=1090975
Myagkov, M., P. Ordeshook, and D. Shakin. 2009. The Forensics of Election Fraud. new York: Cambridge University Press.O’Sullivan, D., and D. Unwin. 2010. Geographic Information Analysis. Hoboken, nJ: Wiley.Simpser, A. 2013. More than Winning: Why Governments and Parties Manipulate Elections. new York: Cambridge University
Press.

POSt-SOVIEt AFFAIRS 99
tobler, W. R. 1970. “A Computer Movie Simulating Urban Growth in the Detroit Region.” Economic Geography 46 (2): 234–240.treisman, D. 1997. “Russia’s Ethnic ‘Revival’ – the Separatist Activism of Regional Leaders in a Postcommunist Order.” World
Politics 49 (02): 212–249.Way, L. 2008. “the Real Causes of the Color Revolutions.” Journal of Democracy 19 (3): 55–69.Weyland, K. 2010. “the Diffusion of Regime Contention in European Democratization, 1830–1940.” Comparative Political
Studies 43 (8–9): 1148–1176.White, A. 2014. “From Competition to Monopoly: Establishing Party Dominance in Post-Communist Russia.” Doctoral
dissertation, Department of Government, University of texas at Austin.