does 5-propionyl-1-dimethylaminonapthalene fluoresce
TRANSCRIPT

W&M ScholarWorks W&M ScholarWorks
Undergraduate Honors Theses Theses, Dissertations, & Master Projects
5-2017
Does 5-propionyl-1-dimethylaminonapthalene Fluoresce through a Does 5-propionyl-1-dimethylaminonapthalene Fluoresce through a
TICT State? TICT State?
Tao Chen College of William and Mary
Follow this and additional works at: https://scholarworks.wm.edu/honorstheses
Part of the Organic Chemistry Commons, and the Physical Chemistry Commons
Recommended Citation Recommended Citation Chen, Tao, "Does 5-propionyl-1-dimethylaminonapthalene Fluoresce through a TICT State?" (2017). Undergraduate Honors Theses. Paper 1142. https://scholarworks.wm.edu/honorstheses/1142
This Honors Thesis is brought to you for free and open access by the Theses, Dissertations, & Master Projects at W&M ScholarWorks. It has been accepted for inclusion in Undergraduate Honors Theses by an authorized administrator of W&M ScholarWorks. For more information, please contact [email protected].

1
Table of Contents
Abstract…………………………………………………………………………………..4
Introduction………………………………………………………………………………4
Background………………………………………………………………………………6
Experimental Methods…………………………………………………………………..11
Results and Discussion…………………………………………………………………..22
Conclusion……………………………………………………………………………….35
References………………………………………………………………………………..36
Appendix…………………………………………………………………………………37
Table of Figures
Figure 1. Ground state (left) and excited state (right) of PRODAN……………………...4
Figure 2. 5-propionyl-1-dimethylaminonapthalene (1)…………………………………..6
Figure 3. Structures of DNS (left) and DMABN (right)………………………………….7
Figure 4. Structures of four different PRODAN derivatives synthesized to test
PRODAN’s fluorescence properties……………………………………………………....7
Figure 5. Jablonski Diagram1……………………………………………………………..9
Figure 6. Synthesis of 1-(1-methyl-1, 2, 3, 4-tetrahydronaptho[1, 8-bc] azepin-7-yl)
propan-1-one……………………………………………………………………………12
Figure 7. fluorescence emission spectra of 5-propionyl-1-dimethylaminonapthalene in 11
different solvents…………………………………………………………………………23
Figure 8. fluorescence emission spectra of 1-(1-methyl-1, 2, 3, 4-tetrahydronaptho[1, 8-
bc] azepin-7-yl) propan-1-one in 11 different solvents………………………………….24
Figure 9. Structure of pyridinium N-phenolate betaine dye 36………………………...25

2
Figure 10. Plot of 𝜆𝑚𝑎𝑥 of 5-propionyl-1-dimethylaminonapthalene with respect to the
solvent’s ET(30) values…………………………………………………………………..26
Figure 11. Plot of 𝜆𝑚𝑎𝑥 of 1-(1-methyl-1, 2, 3, 4-tetrahydronaptho[1, 8-bc] azepin-7-yl)
propan-1-one with respect to the solvent’s ET(30) values……………………………….27
Figure 12. Fluorescene emission spectra of 1-(1-methyl-1, 2, 3, 4-tetrahydronaptho[1, 8-
bc] azepin-7-yl) propan-1-one solution (0.076 mg/mL) dissolved in 2 mL toluene (left)
and anthracene solution (0.71 mg/mL) dissolved in 2 mL toluene (right) using the method
of standard additions. For the 1-(1-methyl-1, 2, 3, 4-tetrahydronaptho[1, 8-bc] azepin-7-
yl) propan-1-one solution, 10 𝜇𝐿 was injected into the cuvette each time; 3 𝜇𝐿 of the
anthracene solution was injected into the cuvette each time…………………………….28
Figure 13. Plot of log (Imax
Isolvent) vs. SA for 1-(1-methyl-1, 2, 3, 4-tetrahydronaptho[1, 8-
bc] azepin-7-yl) propan-1-one in various alcohol solvents plotted with respect to the
empirical solvent acidity values of the solvents reported in Catlan et al………………32
Figure 14. Plot of log (Imax
Isolvent) vs. SA for 5-propionyl-1-dimethylaminonapthalene in
various alcohol solvents plotted with respect to the empirical solvent acidity values of the
solvents reported in Catlan et al…………………………………………………………33
Figure 15. Synthesis of 7-bromo-1-methyl-2, 3-dihydrobenzo [h] quinolin-4 (1H)-
one………………………………………………………………………………………..34
Figure A1. 1H NMR spectrum of 5-bromo-1-nitronapthalene…………………………..37
Figure A2. 1H NMR spectrum of 1-amino-5-bromonapthalene………………………...38
Figure A3. 1H NMR spectrum of N-((1H-benzol[d][1, 2, 3] triazol-1-yl)methyl)-5-
bromonapthale-1-amine………………………………………………………………….39
Figure A4. 1H NMR spectrum of 1-methylamino-5-bromonapthalene…………………40

3
Figure A5. 1H NMR spectrum of 3-((5-bromonaphthalen-1-yl)(methyl)amino)propanoic
acid……………………………………………………………………………………….40
Figure A6. 1H NMR spectrum of 7-bromo-1-methyl-2,3-dihydronaphtho[1,8-bc]azepin-
4(1H)-one………………………………………………………………………………...41
Figure A7. 1H NMR spectrum of 7-bromo-1-methyl-1,2,3,4-tetrahydronaphtho[1,8-
bc]azepine……………………………………………………………………………......41
Figure A8. 1H NMR spectrum of 1-(1-methyl-1, 2, 3, 4-tetrahydronaptho[1, 8-bc]
azepin-7-yl) propan-1-one……………………………………………………………….42
Figure A9. 13C NMR spectrum of 1-(1-methyl-1, 2, 3, 4-tetrahydronaptho[1, 8-bc]
azepin-7-yl) propan-1-one……………………………………………………………….43

4
Abstract
Molecular sensors are molecules that interact with substances of interest and produce a
detectable change. Therefore, their unique properties have been applied in various field.
This paper aims to study whether structural changes are required for the molecular sensor
5-propionyl-1-dimethylaminonapthalene to reach its charge transfer excited state. After
examining the solvatochromism, quantum yield, and hydrogen bond quenching data
between 5-propionyl-1-dimethylaminonapthalene and 1-(1-methyl-1, 2, 3, 4-
tetrahydronaptho[1, 8-bc] azepin-7-yl) propan-1-one, this paper concludes that 5-
propionyl-1-dimethylaminonapthalene fluoresces through a planar ICT and the carbonyl
group is sensitive to hydrogen bond quenching.
Introduction
Molecular sensors are molecules that interact with substances of interest and
produce a detectable change. Therefore, they have been studied and applied widely in the
field of chemistry due to their unique properties. For instance, the molecule PRODAN
(N,N-dimethyl-6-propionyl-2-naphthylamine) is a highly fluorescent, hydrophobic
molecule, first synthesized and characterized by Weber and Farris in 1979. 2 One of the
unique properties of PRODAN is that that it has a charge transfer excited state, which is
shown in Figure 1.
Figure 1. Ground state (left) and excited state (right) of PRODAN.

5
In the charge-transfer state the nitrogen atom donates its lone pair into the naphthalene
ring system. As a result, the nitrogen atom bears a positive charge while the oxygen atom
becomes negatively charged. This charge separation causes an increase in the dipole
moment of the molecule. Therefore, when PRODAN is in the charge-transfer excited
state, the increase of its dipole moment causes solvents to reorient in order to compensate
for this change. Due to the increase in dipole moment, the more polar the solvent is, the
stronger the solvation; stronger solvation lowers the energy of the charge transfer state of
PRODAN. The wavelength where PRODAN shows maximum fluorescence intensity is
called 𝜆𝑚𝑎𝑥. Therefore, the lower the energy of the charger transfer state, the higher the
𝜆𝑚𝑎𝑥. Since 𝜆𝑚𝑎𝑥 is related to solvent dipolarity (permanent molecular dipole moment),
scientists use it to measure solvent polarity. For instance, Bondar and Rowe studied the
preferential interactions of PRODAN with cholesterol and showed that PRODAN’s
fluorescence maxima varies in phospholipid bilayers as a function of phase state, which
indicates that PRODAN is good for determining the polarity of various of phospholipid
membranes.3
Our lab has been interested in studying the fluorescence properties of PRODAN
and its derivatives. Specifically, we wanted to study if there were any structure changes
necessary for PRODAN to reach the charge transfer state. For instance, in the past years
our group has shown that the carbonyl group of PRODAN derivatives does not twists out
of the plane of the naphthalene ring to reach the charge transfers state in protic solvents.4
In addition, some PRODAN derivatives have desired properties such as strong
fluorescence quenching when alcohol groups hydrogen bond to the carbonyl

6
oxygen. Therefore, PRODAN derivatives are good sensors for characterizing the
hydrogen-bond donating abilities of protic solvents.
Many chemists have believed that dansyl molecules fluoresce through the TICT
(twisted intramolecular charge transfer) state.5 In the TICT state, the amine group twists
out of the plane and becomes perpendicular to the naphthalene ring. As a result, the lone
pair on the nitrogen cannot donate into the naphthalene ring system due to a lack of p-
orbital overlap. In this case, the molecule reaches complete charge separation through the
nitrogen atom losing an electron and become positively charge while the negative charge
is dispersed through the rest of the molecule. Therefore, the main focus of this paper is to
study whether the amine group in the PRODAN derivative shown in figure 2 twists out of
the plane of the naphthalene ring to reach the charge transfer state. In addition, this paper
studies whether 5-propionyl-1-dimethylaminonapthalene is sensitive to hydrogen bond
quenching.
1
Figure 2. 5-propionyl-1-dimethylaminonapthalene (1)
Background
Previous studies have shown that molecular sensors such as DNS and DMABN
fluoresce through the TICT state (Figure 3).6 Therefore, one would expect PRODAN,

7
which has a dimethyl-amino group acting as an electron donor like DNS and DMABN, to
fluoresce through the TICT state as well.
Figure 3. Structures of DNS (left) and DMABN (right).
In order to test this hypothesis, our group has synthesized the four derivatives of
PRODAN shown in figure 4 and compared their fluorescence properties with PRODAN.
2 3
4 5
Figure 4. Structures of four different PRODAN derivatives synthesized to test
PRODAN’s fluorescence properties.

8
Compounds 2 and 3 force the amino group to be within the plane of the naphthalene ring
system while compounds 4 and 5 lock the tertiary amino group perpendicular to the
naphthalene ring system. The experimental results show that compound 2 and 3 display
similar solvatochromism and quantum yield as PRODAN.7 On the other hand, compound
4 and 5’s fluorescence is strongly deactivated.5 Therefore, these results suggest that
PRODAN does not reach the TICT state to fluoresce; instead, it fluoresces through a
planar ICT state. In addition, our group also studied whether the twisting of the carbonyl
group affects the fluorescence properties of PRODAN and its derivatives. As shown in
figure 4, the difference between compound 2 and 3 is that compound 3 has a bulky group
at the carbonyl end, which forces the carbonyl group to twist out of plane. The fact that
compounds 2 and 3 display similar solvatochromism and quantum yield suggests that the
twisting of the carbonyl group does not affect the fluorescence properties of PRODAN
and its derivatives.6
In our previous studies, we have also discovered that some PRODAN derivatives
are sensitive to hydrogen bond quenching.6 After further study, we have shown that the
PRODAN derivatives that have twisted carbonyl groups have this unique property, which
is useful in determining solvent acidity through the magnitude of their fluorescence
quenching.8
Due to the success in our previous works, this paper aims to test the
aforementioned hypothesis that dansyl-like molecules fluoresce through the TICT state
with a similar experimental approach. In order to study the fluorescence properties of 5-
propionyl-1-dimethylaminonapthalene, it is necessary to understand the concepts of

9
solvatochromism and fluorescence quenching. A Jablonski diagram is presented to help
illustrate the study of solvatochromism (Figure 6).
Figure 5. Jablonski Diagram9
In general, fluorophores absorb energy to reach the singlet excited state from the ground
state. After internal conversion, some excited states return back to the ground state
through fluorescence. The uniqueness with PRODAN and its derivatives is that the
energy gap between the ground state and the excited state varies when they are dissolved
in solvents with different polarity. As aforementioned, when PRODAN reaches the
charge transfer state, its dipole moment increases due to charge separation. Therefore,
solvents with stronger polarity can stabilize this charge separation better through

10
Columbic attraction, which results in lowering the energy gap between the ground state
and the excited state. On the other hand, solvents with weaker polarity can only stabilize
the charge separation through van der Waals interaction, which cannot lower the energy
gap significantly. The energy gap between the ground state and the singlet excited can be
measured using the Stokes shift, which is the difference in frequency between the
maxima of the absorption spectra and the maxima of the emission spectra. Therefore, the
difference in frequency is smaller in more polar solvents than in less polar solvents. For
the purpose of our study, since the absorption spectra changes little when dissolved in
solvents with different polarity, the measurement of the emission spectra is sufficient to
determine the magnitude of the Stokes shift.
Solvatochromism is the study of how strongly solvent polarity affects the Stokes
shift of the compound, which ultimately determines whether the compound is suitable for
being used as a molecular sensor. Various methods have been used to measure the
solvatochromic properties. In this paper we measured the solvatochromic properties of 5-
propionyl-1-dimethylaminonapthalene and the details will be described in the result
section. In general, we generated a plot of 𝜆𝑚𝑎𝑥 with respect to the solvent polarity
parameter reported in Catlan et al.10 Then, we determined the line of best fit and found
the slope of the line. The magnitude of the slope is related to the magnitude of the
solvatochromism.
While solvatochromism is useful in studying the relationship between solvent
polarity and the change in Stokes shift, it should be used with caution. It has been
reported that protic solvents also stabilize the charge transfer state due to hydrogen
bonding, a specific interaction, which would heavily skew the data in the sense that 𝜆𝑚𝑎𝑥

11
will shift to a higher wavelength than the expected value.11 Therefore, it is crucial to
either avoid using protic solvents for solvatochromism studies or be aware that protic
solvents tend to have a higher wavelength that does not fit the data trendline.
Quenching is the process that decreases the fluorescence intensity. There are
many factors that could result in fluorescence quenching. For instance, when the singlet
excited state goes through intersystem crossing to reach the triplet excited state, there
would be less singlet excited state to fluoresce. In the case of hydrogen-bond quenching,
it is believed that since hydrogen bond have high vibrational energy, the excited states of
fluorophores can return to their ground state by releasing energy into the hydrogen bond
through vibrational modes instead of emitting photons, thus decreasing the fluorescence
intensity. In our method to measure the magnitude of hydrogen bond quenching,
fluorophores are dissolved into solvents with different solvent acidity. After measuring
the fluorescence intensities in various solvents, the term log (𝐼𝑚𝑎𝑥
𝐼𝑠𝑜𝑙𝑣𝑒𝑛𝑡) is plotted against the
empirical solvent acidity values reported in Catlan et al.9 𝐼𝑠𝑜𝑙𝑣𝑒𝑛𝑡 is the fluorescence
intensity for each different value and 𝐼𝑚𝑎𝑥 is the largest value amongst 𝐼𝑠𝑜𝑙𝑣𝑒𝑛𝑡.
Experimental Methods
Synthesis of Derivative
The derivative compound 6 (1-(1-methyl-1, 2, 3, 4-tetrahydronaptho[1, 8-bc] azepin-7-yl)
propan-1-one) we synthesized forces the amine group to remain in the plane of the
naphthalene ring, which prevents it from reaching the TICT state. An eight-step process
to synthesize the PRODAN derivative of our interest is shown in figure 6.

12
6
Figure 6. Synthesis of 1-(1-methyl-1, 2, 3, 4-tetrahydronaptho[1, 8-bc] azepin-7-yl)
propan-1-one.
All intermediates were confirmed by 1H NMR spectra and the final product was
confirmed by 13C NMR spectra located in Appendix A. All spectra were obtained from
an Agilent DD2-400 or Varian Mercury VX-400 spectrometer. Starting materials and
reagents were purchased from Acros, Aldrich, and Fisher. The procedure for each step is
given in detail in the following paragraphs.

13
Preparation of 5-bromo-1-nitronapthalene
The first step was the bromination of 1-nitronapthalene. 10 grams of commercially
available 1-nitronapthalene and 0.1 gram of FeCl3 were added to a 100mL round bottom
flask and heated to 90 ℃ with an oil bath. Then 3.0 mL of bromine was added dropwise
to the flask using an addition funnel. The reagents were stirred in the flask for 2 hours
under 90 ℃ with a condenser placed on top of the addition funnel. Then the product was
dissolved in 250 mL of ethanol in a 500mL beaker. Ethanol was heated with a hot plate
until it started to boil. After most of the product was dissolved into the solvent, the hot
plate was turned off and the solution was cooled under room temperature to allow for
crystallization. After the crystals had formed, suction filtration was performed. During
the process, the beaker was rinsed three times with small amounts (1mL) of ice-cold
ethanol. The filtrate weighed 10.07 grams and was transferred to a 100 mL beaker. 1H
NMR confirmed that the product was 5-bromo-1-nitronapthalene, thus the yield was
69.11%.

14
Preparation of 1-amino-5-bromonapthalene
For the reduction step, 4.80 grams of 5-bromo-1-nitronapthalene, 29.85 grams of Sn, and
124 mL of ethanol was added to a 250 mL round bottom flask. Then 58 mL of HCl was
added dropwise while stirring and the reaction was allowed to stir overnight. Celite
filtration was performed to remove Sn and the filtrate was transferred to a 1 L beaker.
The filtrate was neutralized by adding sodium bicarbonate until the pH test strip indicated
the pH was around 8. Suction filtration was performed and the beaker was rinsed with
water several times. The filtrate was washed by 100 mL of methylene chloride for three
times in a 500 mL separatory funnel. The organic layer was transferred to a 500 mL
round bottom flask and the solvent was evaporated using a rotovap. 1.16 grams of the
product (1-amino-5-bromonapthalene) was confirmed by 1H NMR, which gave a 27.4%
yield.
Preparation of 1-methylamino-5-bromonapthalene
The next step was reductive amination. 1.16 grams of 1-amino-5-bromonapthalene, 0.62
grams of benzotriazole, 0.157 grams of 37% formalin and 10 mL of ethanol was added to

15
a 50 mL round bottom flask. The reaction was allowed to stir overnight. Suction filtration
was performed and the round bottom flask was rinsed with a small amount ethanol
multiple times. The solid collected from the filtration was confirmed by 1H NMR to be
the desired product and weighed 1.52 grams, which gave an 82.6% yield.
1.52 grams of the intermediate, 25 mL of THF and 0.45 grams of NaBH4 were added to a
100 mL round bottom flask. The reaction was allowed to stir overnight. Then the solvent
was evaporated using a rotovap. The remaining product was dissolved in 100 mL of
water and washed with 100 mL of hexane for three times in a separatory funnel. The
hexane layer was collected and washed with 100 mL of water for three times in another
separatory funnel. The hexane layer was dried with MgSO4 anhydrous. Gravity filtration
was performed to remove the solid and the hexane solvent was evaporated using a
rotovap. The solid weighed 0.63 grams and was confirmed by 1H NMR to be 5-bromo-1-
methyl-aminonapthalene, which gave a 62.4% yield.
1H NMR (400MHz, CDCl3): δ = 7.77 (d, 2H, J=8.2 Hz), 7.64 (d, 1H, J=8.6 Hz), 7.49 (t,
1H, J=8.0 Hz), 7.26 (q, 1H, J=5.2 Hz), 6.66 (d, 1H, J=7.5 Hz), 4.47 (s, 1H, NH), 3.03 (s,
3H).

16
Preparation of 3-((5-bromonaphthalen-1-yl)(methyl)amino)propanoic acid
The Michael Addition step was performed by addition of 0.63 grams of 5-bromo-1-
methyl-aminonapthalene, 2 mL of acetic acid and 1 mL of acrylic acid to a 50 mL round
bottom flask. The reaction was allowed to stir at 110 ℃ for 1 hour. After the solution was
cooled to room temperature, it was poured into a 500 mL beaker with 150 mL of ice cold
water. Next, 35 grams of NaCl was added and the solution in the beaker was stirred
overnight. The solution was extracted three times with 100 mL each of ethyl acetate in a
separatory funnel. The ethyl acetate layer was collected and dried with MgSO4
anhydrous. Gravity filtration was performed to remove the solid and the solvent was
evaporated using a rotovap. The solid was dissolved in a mixture solution of 50 mL of
methylene chloride and 100 mL hexane. Then the solution was washed three times with
150 mL each of 1 mol/L NaOH solution. The aqueous layer was reacidified with 12mol/L
HCl until the pH test paper indicated a pH of 7. Then the aqueous layer was extracted
three times with 100 mL each of methylene chloride for three times. The organic was
collected and dried with anhydrous MgSO4. Gravity filtration was performed to remove
the solid and the solvent was evaporated using a rotovap. The solid weighed 0.54 grams
and was confirmed by 1H NMR, which gave a yield of 65.7%.

17
1H NMR (400MHz, CDCl3): δ = 8.17 (d, 1H, J=8.6 Hz), 8.06 (d, 1H, J=8.6 Hz), 7.79 (d,
1H, J=7.4 Hz), 7.54 (t, 1H, J=8.1 Hz), 7.34 (t, 1H, J=7.8 Hz), 7.26 (t, 1H, J=3.8 Hz), 5.30
(s, 1H, OH), 3.49 (t, 2H, J=6.9 Hz), 2.89 (s, 3H), 2.63 (t, 2H, J=6.9 Hz).
Preparation of 7-bromo-1-methyl-2,3-dihydronaphtho[1,8-bc]azepin-4(1H)-one
The intermediate synthesized from the previous step (5.14 grams) was dissolved in 45
mL of methylene chloride in a round bottom flask. DMF (20 drops) was added to the
flask. Then 6.64 grams of oxalyl chloride was added dropwise into the flask. The reaction
was stirred in an ice-water bath under a CaCl2 drying tube for 1 hour and 30 minutes.
Solvents were evaporated using a rotovap. Then the excess oxalyl chloride was removed
under high vacuum. The remaining product in the round bottom flask was dissolved in 75
mL methylene chloride. Aluminum chloride (6.7 grams) was added. The flask was heated
in an oil bath until the methylene chloride began to reflux. The reaction was stirred
during this condition under a CaCl2 drying tube for 3 hours. The reaction was allowed to
cool to room temperature. Then 12.53 grams of NaHCO3 dissolved in 300 mL of water
was added to the flask and the reaction was stirred overnight. The substances in the flask
was diluted with 200 mL of water and extracted with 75 mL of 10% methylene
chloride/hexane mixture twice in a separatory funnel. The third time the aqueous layer
was washed with 75 mL of 20% methylene chloride/hexane mixture. The organic layer

18
was collected and washed with 100 mL of ice cold water. Then the organic layer was
dried with Na2SO4. Gravity filtration was performed and the solvent was evaporated
using a rotovap. Then the crude product was distilled under high vacuum b.p.=160℃ to
210℃. The 1.3 grams of solid collected after distillation was confirmed by 1H NMR to be
the desired intermediate shown above, which gave a yield of 25.3%.
1H NMR (400MHz, CDCl3): δ = 7.91 (d, 1H, J=8.6 Hz), 7.81 (d, 1H, J=7.8 Hz), 7.50 (t,
1H, J=8.0 Hz), 7.44 (d, 1H, J=7.5 Hz), 7.06 (d, 1H, J=7.8 Hz), 3.46 (t, 2H, J=6.7 Hz),
3.10 (t, 2H, J=6.5 Hz), 2.17 (s, 3H).
Preparation of 7-bromo-1-methyl-1,2,3,4-tetrahydronaphtho[1,8-bc]azepine
The intermediate synthesized from the previous step (3.89 grams) was added to a 100 mL
round bottom flask with 3.0 grams of KOH powder, 64 mL of diethylene glycol, 5.3 mL
of hydrazine hydrate and 1.3 mL of water. The flask was heated in an oil bath under N2
gas to 145℃. The reaction was allowed to stir for 20 minutes before adding a Dean-Stark
trap. Then the flask was heated to 180 ℃ and stirred for 4 hours. A total of 1.5 mL was
collected in the distillation. The reaction mixture was poured into 250 mL of water. The
aqueous layer was washed five times with 50 mL each of methylene chloride in a
separatory funnel. The organic layer was collected and diluted with 300 mL of hexane.
The organic layer was washed four times with 125 mL each of ice cold water and dried
with with anhydrous MgSO4. Gravity filtration was performed to remove the solid and

19
the solvent was evaporated using a rotovap. Distillation was performed under high
vacuum at 90 ℃ giving 1.00 grams of solid. The aqueous layer was collected and
saturated with NH4Cl, which caused the emulsion to start dissipating. Then NaCl was
added to further dissipate the emulsion. Two distinct layers were formed. The lower
organic layer was extracted and distilled using the same procedure mentioned above,
giving 1.64 grams of solid. Both solids were confirmed by 1H NMR to be the desired
intermediate, which gave a yield of 64.55%.
1H NMR (400MHz, CDCl3): δ =7.71 (d, 1H, J=8.6 Hz), 7.58 (d, 1H, J=7.4 Hz), 7.39 (t,
1H, J=8.1 Hz), 6.94 (d, 1H, J= 7.8Hz), 6.79 (d, 1H, J=7.4 Hz), 3.22 (m, 4H), 3.02 (s, 3H),
2.13 (q, 2H, J= 6.8 Hz)
Preparation of 1-(1-methyl-1, 2, 3, 4-tetrahydronaptho[1, 8-bc] azepin-7-yl) propan-1-one
The intermediate synthesized from the previous step (0.73 grams) was dissolved in 15
mL of THF under N2 in a 100 mL round bottom flask. The reaction was cooled to −75℃
in a slush bath. Next, 2.2 mL of n-BuLi was added to the flask drop-wise. Then 0.35
grams of propionyl pyrrole was added. The reaction was stirred and warmed slowly to
−25℃. At this point, 3 mL of water was added to the flask. When the reaction was
stirred and warmed slowly to 0℃, 200 mL of Et2O was added. The solution was washed
with 100 mL of NH4Cl solution twice and dried with Na2SO4 and the solvent was

20
evaporated with a rotovap. The collected solid was purified through a column separation
with the column fractions being 0%, 1%, 2%, 3%, 4%, 6%, 8%, 10%, and 20% of ethyl
acetate/hexane mixture. The fractions that contained the desired product were determined
through 1H NMR. The solids were collected and combined. Then a distillation was
performed under high vacuum, b.p.=120 - 160℃. The product (1-(1-methyl-1, 2, 3, 4-
tetrahydronaptho[1, 8-bc] azepin-7-yl) propan-1-one) weighed 240 mg and was
confirmed by 1H NMR and 13C NMR spectra, which gave a yield of 34.4%.
1H NMR (400MHz, CDCl3): δ = 7.87 (d, 1H, J=8.2 Hz), 7,57 (d, 1H, J=7.1 Hz), 7.34 (t,
1H, J=8.2 Hz), 7.08 (d, 1H, J=7.4 Hz), 6.75 (d, 1H, J=7.4 Hz), 3.22 (m, 4H), 3.01 (m,
5H), 2.15 (q, 2H, J=6.7 Hz), 1.25 (t, 3H, J=7.3 Hz).
13C NMR (100MHz, CDCl3): δ = 205.90, 152.87, 144.10, 134.91, 132.64, 128.19,
127.15, 123,41, 116.54, 108.68, 77.01, 56.43, 41.02, 35.56, 34.53, 29.51, 8.84.
Fluorescence Property Testing
All solvents used for fluorescence and absorption measurements were
spectrophotometric grade. Fluorescence emission data were collected using a fiber
optic system with a 366 nm LED light source and an Ocean Optics Maya CCD
detector. Absorption data were obtained using the same fiber optic system with a
miniature deuterium/tungsten light source instead of the LED light source. Testing
samples’ temperature was stabled at 23℃ with a thermostat.
Solvatochromism Procedure
A stock solution was prepared with 25.1 mg of the synthesized product (1-(1-methyl-1, 2,
3, 4-tetrahydronaptho[1, 8-bc] azepin-7-yl) propan-1-one) dissolved in 10 mL toluene. A
second stock solution was prepared by diluting 2 mL of the stock solution to 10 mL.

21
After measuring a background spectrum, 2 mL of cyclohexane was added to the cuvette
and 25 𝜇𝐿 of the diluted solution was injected into the cuvette. After obtaining a
spectrum, the cuvette was cleansed with acetone and the same procedure was repeated
with toluene, chlorobenzene, diethyether, methylene chloride, ethyl acetate, acetone,
DMSO, acetonitrile, isopropanol, and methanol. The only difference between obtaining
fluorescence emission data and absorption data was using a different light source and the
acquisition parameters (integration time, no. of scans to average).
Quantum Yield Testing Procedure
A stock solution was prepared with 7.6 mg of the synthesized product (1-(1-methyl-1, 2,
3, 4-tetrahydronaptho[1, 8-bc] azepin-7-yl) propan-1-one) dissolved in 5 mL of toluene.
The initial stock solution was a clear liquid. However, after several days in the hood, it
became cloudy, which suggested that impurity was formed. Therefore, a short column
separation was performed. After adding the solution to the column, additional toluene
was added and the first 5 mL and second 5 mL of solution was collected. The
fluorescence intensity between the first and second 5 mL solution had a 19:1 ratio, which
indicated that the upper bound for the concentration of the first solution was 1.44 mg/mL,
and the upper bound for the concentration of the second solution was 0.076 mg/mL.
Quantum yield is the number of photons emitted over the number of photons
absorbed. While absorption can be measured directly using Beer’s Law, fluorescence
intensity only gives an arbitrary number. Therefore, in order to determine the quantum
yield for 1-(1-methyl-1, 2, 3, 4-tetrahydronaptho[1, 8-bc] azepin-7-yl) propan-1-one,
anthracene with a quantum yield of 0.3 was used as a reference.

22
A stock solution was prepared with 7.1 mg of anthracene dissolved in 10 mL of
toluene. The standard addition method was used to measure the quantum yield. After
recording a background spectrum, 2 mL of toluene and 3 𝜇𝐿 of the anthracene stock
solution were added to the cuvette. The spectrum was recorded and another 3 𝜇𝐿 of the
anthracene solution was injected into the cuvette. This process was repeated until a total
of 15 𝜇𝐿 of the anthracene solution was injected into the cuvette. The cuvette was cleaned
and added with 2 mL of toluene and 2 𝜇𝐿 of the solution with the 1.44 mg/mL upper
bound concentration. After recording the spectrum, an additional 2 𝜇𝐿 was added and the
process was repeated until a total of 10 𝜇𝐿 of the solution was added into the cuvette. The
cuvette was cleaned and added with 2 mL of toluene and 10 𝜇𝐿 of the solution with the
0.076 mg/mL upper bound. The spectrum was recorded and another 10 𝜇𝐿 of the solution
was injected into the cuvette. The process as repeated until a total of 50 𝜇𝐿 of the solution
was added into the cuvette.
Hydrogen Bond Quenching Test Procedure
A stock solution was prepared with 25.1 mg of the synthesized product (1-(1-methyl-1, 2,
3, 4-tetrahydronaptho[1, 8-bc] azepin-7-yl) propan-1-one) dissolved in 10 mL toluene. A
second stock solution was prepared by diluting 2 mL of the stock solution to 10 mL.
After measuring a background spectrum, 2 mL of 1-decanol and 25 𝜇𝐿 of the diluted
solution were added into the cuvette. The spectrum was obtained and the cuvette was
cleansed. Then the process was repeated for 1-octanol, 1-pentanol, 1-butanol, ethanol, 1-
propanol, cyclopentanol, 2-propanol, 2-butanol, 2-octanol, and methanol.
Results and Discussion
Solvatochromism Results

23
Fluorescence emission spectra for 5-propionyl-1-dimethylaminonapthalene and 1-(1-
methyl-1, 2, 3, 4-tetrahydronaptho[1, 8-bc] azepin-7-yl) propan-1-one are shown in
Figure 7 and Figure 8.
Figure 7. fluorescence emission spectra of 5-propionyl-1-dimethylaminonapthalene in 11
different solvents.
0
20000
40000
60000
80000
100000
120000
11000 16000 21000 26000
Inte
nsi
ty
Wavenumber (cm-1)
cyclohexane
toluene
chlorobenzene
methylene chloride
ethyl acetate
diethyl ether
acetone
acetonitrile
DMSO
isopropanol
methanol

24
Figure 8. fluorescence emission spectra of 1-(1-methyl-1, 2, 3, 4-tetrahydronaptho[1, 8-
bc] azepin-7-yl) propan-1-one in 11 different solvents.
In an ideal fluorescence spectrum, the fluorescence emission has a symmetric bell curve
shape. Therefore, 𝜆𝑚𝑎𝑥 would be the wavelength at the maxima fluorescence intensity.
However, since fluorescence spectra do not have the ideal symmetric shapes, 𝜆𝑚𝑎𝑥 is
determined through the center of gravity calculation using the rectangular approximation
for integration. Then the determined fluorescence maxima for 5-propionyl-1-
dimethylaminonapthalene and 1-methyl-7-propionyl-2, 3-dihydranaptho [1, 8-bc] azepin-
4 (1H)-one were plotted with respect to the solvent’s empirical values reported using the
𝐸𝑇(30) parameter. The 𝐸𝑇(30) parameter are empirical values that uses pyridinium N-
phenolate betaine dye 36 (Figure 9) as the reference compound.12
0
10000
20000
30000
40000
50000
60000
70000
80000
90000
11000 16000 21000 26000
Inte
nsi
ty
Wavenumber (cm-1)
cyclohexane
toluene
chlorobenzene
methylene chloride
ethyl acetate
diethyl ether
acetone
acetonitrile
DMSO
isopropanol
methanol

25
Figure 9. Structure of pyridinium N-phenolate betaine dye 36.
As shown in Figure 9, the reference compound is not only dipolar, but also sensitive to
hydrogen bonding at the oxygen atom. Therefore, the 𝐸𝑇(30) parameter takes into
account of the solvent’s polarity and hydrogen bond ability. This is one possible
explanation for the fact that the data points corresponding to isopropanol and methanol
do not deviate from the trend as expected. A line of best fit is generated for both plots and
the plots are displayed in Figure 10 and Figure 11. When obtaining the line of best fit,
both plots excluded the cyclohexane data point because it was an outlier for both cases.
One possible explanation is that cyclohexane is non-polarizable, which means that when
the PRODAN derivatives reach the excited states, cyclohexane does not reorient to
stabilize the charge, which caused the energy gap between the ground state and the
excited state to be higher than expected.

26
Figure 10. Plot of 𝜆𝑚𝑎𝑥 of 5-propionyl-1-dimethylaminonapthalene with respect to the
solvent’s ET(30) values.
y = -173.39x + 24253R² = 0.9902
14500
15000
15500
16000
16500
17000
17500
18000
18500
33.0 38.0 43.0 48.0 53.0
Wa
ve
nu
mb
er
(cm
-1)
ET(30) values (kcal/mol)

27
Figure 11. Plot of 𝜆𝑚𝑎𝑥 of 1-(1-methyl-1, 2, 3, 4-tetrahydronaptho[1, 8-bc] azepin-7-yl)
propan-1-one with respect to the solvent’s ET(30) values.
As shown in figure 10 and 11, the slope for each plot is -173 and -152. Since the
difference between the slopes is within a factor of 1.2 (1.14), the results suggest that 1-(1-
methyl-1, 2, 3, 4-tetrahydronaptho[1, 8-bc] azepin-7-yl) propan-1-one has a similar
magnitude of solvatochromism compared to that of 5-propionyl-1-
dimethylaminonapthalene, which ultimately suggest that 5-propionyl-1-
dimethylaminonapthalene does not fluoresce through the TICT state. One possible reason
that the slope of 1-(1-methyl-1, 2, 3, 4-tetrahydronaptho[1, 8-bc] azepin-7-yl) propan-1-
one is less than that of 5-propionyl-1-dimethylaminonapthalene is that the extra alkyl
group shielding around the naphthalene system makes it less sensitive to the solvents.
y = -151.89x + 23643R² = 0.9857
15000
15500
16000
16500
17000
17500
18000
18500
19000
30.0 35.0 40.0 45.0 50.0 55.0
Wa
ve
nu
mb
er
(cm
-1)
ET(30) values (kcal/mol)

28
Quantum Yield Results
As mentioned in the experimental section, 1-(1-methyl-1, 2, 3, 4-tetrahydronaptho[1, 8-
bc] azepin-7-yl) propan-1-one solutions with different concentrations were used for the
quantum yield testing. The fluorescence emission spectra of 1-(1-methyl-1, 2, 3, 4-
tetrahydronaptho[1, 8-bc] azepin-7-yl) propan-1-one solution (0.076 mg/mL) dissolved in
2 mL toluene and anthracene solution (0.71 mg/mL) dissolved in 2mL toluene is shown
in Figure 12.
Figure 12. Fluorescene emission spectra of 1-(1-methyl-1, 2, 3, 4-tetrahydronaptho[1, 8-
bc] azepin-7-yl) propan-1-one solution (0.076 mg/mL) dissolved in 2 mL toluene (left)
0
5000
10000
15000
20000
25000
12000 14000 16000 18000 20000 22000 24000 26000 28000
Inte
nsi
ty
Wavenumber (cm-1)

29
and anthracene solution (0.71 mg/mL) dissolved in 2 mL toluene (right) using the method
of standard additions. For the 1-(1-methyl-1, 2, 3, 4-tetrahydronaptho[1, 8-bc] azepin-7-
yl) propan-1-one solution, 10 𝜇𝐿 was injected into the cuvette each time; 3 𝜇𝐿 of the
anthracene solution was injected into the cuvette each time.
The fluorescence emission spectra of 1-(1-methyl-1, 2, 3, 4-tetrahydronaptho[1, 8-bc]
azepin-7-yl) propan-1-one solution (1.44 mg/mL) dissolved in 2 mL toluene only differs
from Figure 11 with higher fluorescence intensities and therefore is not displayed.
As aforementioned, fluorescence intensities are arbitrary numbers. Therefore, in
order to calculate the quantum yield of compound 1 and 6, anthracene is used as a
reference compound. Since absorption is linearly proportional to the concentration of
solution, the magnitude of absorption at 366 nm (excitation wavelength) should also be
linearly proportional to the concentration of the solution. In addition, the integrated
fluorescence intensity is also linearly proportional to the concentration of the solution.
Quantum yield is proportional to the ratio of the fluorescence intensity over the
molecule’s absorption. Since the quantum yield of anthracene is 0.3, the quantum yield of
compound 1 and 6 can be obtained by using the ratios determined for anthracene and the
two compounds, which is summarized in equation (1).
𝑟𝑎𝑡𝑖𝑜𝑢𝑛𝑘𝑛𝑜𝑤𝑛
𝑟𝑎𝑡𝑖𝑜𝑎𝑛𝑡ℎ𝑟𝑎𝑐𝑒𝑛𝑒=
𝜙𝑢𝑛𝑘𝑛𝑜𝑤𝑛
𝜙𝑎𝑛𝑡ℎ𝑟𝑎𝑐𝑒𝑛𝑒 (1)
When determining the slopes for the standard addition plot for anthracene, the point
corresponding to a total of 15 μL of anthracene injected into the cuvette is not included
because it deviates significantly from the line of best fit. This is possibly due to internal
filtering, which means due to the high concentration of anthracene, some fluorescence
30
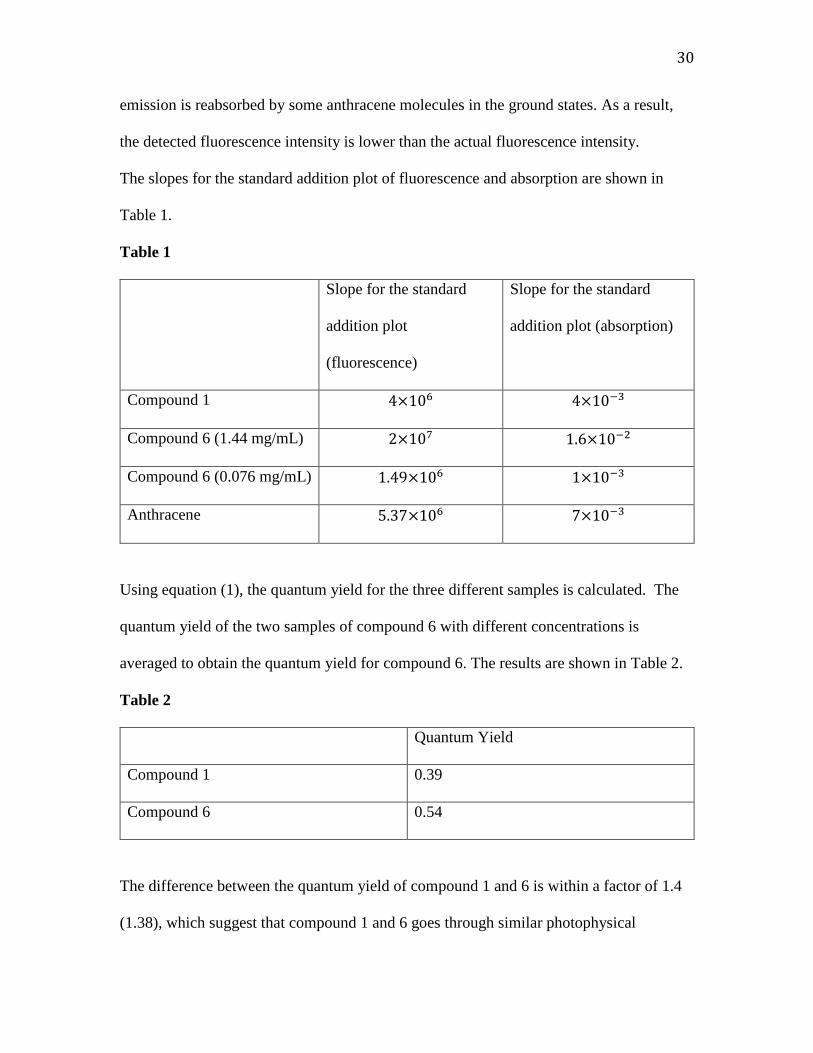
emission is reabsorbed by some anthracene molecules in the ground states. As a result,
the detected fluorescence intensity is lower than the actual fluorescence intensity.
The slopes for the standard addition plot of fluorescence and absorption are shown in
Table 1.
Table 1
Slope for the standard
addition plot
(fluorescence)
Slope for the standard
addition plot (absorption)
Compound 1 4×10⁶ 4×10⁻³
Compound 6 (1.44 mg/mL) 2×10⁷ 1.6×10⁻²
Compound 6 (0.076 mg/mL) 1.49×10⁶ 1×10⁻³
Anthracene 5.37×10⁶ 7×10⁻³
Using equation (1), the quantum yield for the three different samples is calculated. The
quantum yield of the two samples of compound 6 with different concentrations is
averaged to obtain the quantum yield for compound 6. The results are shown in Table 2.
Table 2
Quantum Yield
Compound 1 0.39
Compound 6 0.54
The difference between the quantum yield of compound 1 and 6 is within a factor of 1.4
(1.38), which suggest that compound 1 and 6 goes through similar photophysical

31
processes. If compound 1 fluoresces through the TICT state while compound 6’s rigidity
forces the compound to fluoresce through a planar ICT state, the photophysical processes
of the two compounds would be different and their quantum yield would differ
significantly. Therefore, the fact that compound 1 and 6 have fairly similar quantum yield
confirms the solvatochromism result that 5-propionyl-1-dimethylaminonapthalene
fluoresces through the planar ICT state instead of the TICT state.
Hydrogen Bond Quenching Results
In these experiments the index of refraction is used to correct the fluorescence intensity,
which accounts for different amount of light impinging on the detector. Equation (2) is
used to obtain the corrected fluorophore’s integrated fluorescence intensity in various
solvents.
𝐼𝑠𝑜𝑙𝑣𝑒𝑛𝑡 =∫ 𝐹(��)𝑑��
𝜂𝑠𝑜𝑙𝑣𝑒𝑛𝑡2
𝜂𝑚𝑎𝑥2
𝐴366𝑛𝑚 (2)
Isolvent stands for the integrated fluorescence intensity, F(υ) is the fluorescence intensity
as a function of wavenumber, ηsolvent is the index of refraction of the solvent, ηmax is the
largest value amongst ηsolvent and A366nm is the magnitude of absorption at 366 nm
(excitation wavelength). After measuring the Isolvent values, the largest Isolvent value
will be used as Imax. The term log (𝐼𝑚𝑎𝑥
𝐼𝑠𝑜𝑙𝑣𝑒𝑛𝑡) is plotted with respect to the empirical solvent
acidity values of the solvents reported in Catlan et al and a line of best fit is generated
(Figure 13).

32
Figure 13. Plot of log (Imax
Isolvent) vs. SA for 1-(1-methyl-1, 2, 3, 4-tetrahydronaptho[1, 8-
bc] azepin-7-yl) propan-1-one in various alcohol solvents plotted with respect to the
empirical solvent acidity values of the solvents reported in Catlan et al.
The process is repeated for 5-propionyl-1-dimethylaminonapthalene and the plot is
shown in Figure 14.
y = 2.3576x - 0.2864R² = 0.9662
-0.20
0.00
0.20
0.40
0.60
0.80
1.00
1.20
1.40
0 0.1 0.2 0.3 0.4 0.5 0.6 0.7
log
(Im
ax/
I solv
en
t)
Solvent Acidity

33
Figure 14. Plot of log (Imax
Isolvent) vs. SA for 5-propionyl-1-dimethylaminonapthalene in
various alcohol solvents plotted with respect to the empirical solvent acidity values of the
solvents reported in Catlan et al.
When plotting the line of best fit, data points for 1-decanol and 1-octanol were not
included because the magnitude of quenching was significantly lower than expected. One
possible reason is that since 1-decanol and 1-octanol are viscous, molecules are harder to
reorient, which makes the formation of hydrogen bonds more difficult. Therefore, the
actual magnitude of quenching is lower than expected. In our previous studies concerning
hydrogen bond quenching, we determined that if the slope for log (Imax
Isolvent) vs. solvent
acidity is greater than 2, the fluorophore is sensitive to hydrogen bond quenching.7
Therefore, since the slopes for compound 1 and 6 are 2.55 and 2.36 respectively, both
compound 1 and 6 are sensitive to hydrogen bond quenching. In addition, the fact that
compound 6, which prevents the amine group from twisting out of plane, displays similar
y = 2.5547x - 0.2821R² = 0.9702
-0.20
0.00
0.20
0.40
0.60
0.80
1.00
1.20
1.40
0.000 0.100 0.200 0.300 0.400 0.500 0.600 0.700
log
(Im
ax/
I solv
en
t)
Solvent Acidity

34
hydrogen bond quenching characteristics as compound 1 suggest that hydrogen bond
quenching occurs at the carbonyl group rather than the amine group.
Synthetic Obstacles
Initially we tried to synthesize the derivative 7-bromo-1-methyl-2, 3-dihydrobenzo [h]
quinolin-4 (1H)-one through the following steps shown in Figure 15. Similar to
compound 6, this derivative also forces the amine group to remain in the plane of the
naphthalene ring.
Figure 15. Synthesis of 7-bromo-1-methyl-2, 3-dihydrobenzo [h] quinolin-4 (1H)-one.
However, the last step, which uses polyphosphoric acid for cyclization, produced an
extremely low yield. We suspect that rather than going through the cyclization process,
many of the reactants went through a reverse Michael addition and formed the previous
intermediate. Therefore, we do not have enough products to test the fluorescence
properties.

35
Conclusion
By comparing the solvatochromism, quantum yield, and hydrogen bond quenching
results between 5-propionyl-1-dimethylaminonapthalene and 1-(1-methyl-1, 2, 3, 4-
tetrahydronaptho[1, 8-bc] azepin-7-yl) propan-1-one, we found that the results for both
compounds are similar, which suggest that both compound go through similar
photophysical processes. If the amine group on 5-propionyl-1-dimethylaminonapthalene
twists out of the plane of the naphthalene ring system, the aforementioned testing results
should differ significantly between the two compounds since they fluoresce through
different excited states. Therefore, we conclude that 5-propionyl-1-
dimethylaminonapthalene fluoresces through the planar ICT state instead of the TICT
state. In addition, the hydrogen bond quenching test results suggest that the carbonyl
group on 5-propionyl-1-dimethylaminonapthalene is the dominant site that is sensitive to
hydrogen bond quenching instead of the amine group.

36
1 What is the Jablonski diagram? https://www.quora.com/What-is-the-Jablonski-diagram.
References 2 Weber, Gregorio, and Fay J. Farris. "Synthesis and Spectral Properties of a
Hydrophobic Fluorescent Probe: 6-propionyl-2-(dimethylamino)naphthalene." -
Biochemistry (ACS Publications). July 1979. Web. 18 Mar. 2016.
3 Bondar, Olga P., and Elizabeth S. Rowe. "Preferential Interactions of Fluorescent Probe
Prodan with Cholesterol." ScienceDirect. Feb. 1999. Web. 18 Mar. 2016.
4 Lobo, B. C.; Abelt, C. J. Does PRODAN Possess a Planar or Twisted Charge-Transfer
Excited State? Photophysical Properties of Two PRODAN Derivatives
http://pubs.acs.org/doi/pdf/10.1021/jp036013r (accessed Apr 13, 2017).
5 Tharmaraj, V.; Pitchumani, K. An acyclic, dansyl based colorimetric and fluorescent
chemosensor for Hg(II) via twisted intramolecular charge transfer (TICT)
http://www.sciencedirect.com/science/article/pii/S0003267012013438 (accessed Apr 13,
2017).
6 Davis, B. N.; Abelt, C. J. Synthesis and Photophysical Properties of Models for Twisted
PRODAN and Dimethylaminonaphthonitrile
http://pubs.acs.org/doi/pdf/10.1021/jp046050y (accessed Apr 13, 2017).
7 Everett, R. K.; Nguyen, H. A. A.; Abelt, C. J. Does PRODAN Possess an O-TICT
Excited State? Synthesis and Properties of Two Constrained Derivatives
http://pubs.acs.org/doi/pdf/10.1021/jp1002808 (accessed Apr 13, 2017).
8 Green, A. M.; Naughton, H. R.; Nealy, Z. B.; Pike, R. D.; Abelt, C. J. Carbonyl-Twisted
6-Acyl-2-dialkylaminonaphthalenes as Solvent Acidity Sensors
http://pubs.acs.org/doi/abs/10.1021/jo301263g (accessed Apr 13, 2017).
9 What is the Jablonski diagram? https://www.quora.com/What-is-the-Jablonski-diagram.
10 Catalan, J.; Perez, P.; Laynez, J.; Blanco, F. G.Journal of Fluorescence1991,1(4), 215–
223.
11 Kawski, A.Zeitschrift für Naturforschung A1999,54(6-7).
12 Reichardt, C.Chemical Reviews1994,94(8), 2319–2358.

37
Appendix A: NMR Spectra
Figure A1. 1H NMR spectrum of 5-bromo-1-nitronapthalene

38
Figure A2. 1H NMR spectrum of 1-amino-5-bromonapthalene

39
Figure A3. 1H NMR spectrum of N-((1H-benzol[d][1, 2, 3] triazol-1-yl)methyl)-5-
bromonapthale-1-amine

40
Figure A4. 1H NMR spectrum of 1-methylamino-5-bromonapthalene
Figure A5. 1H NMR spectrum of 3-((5-bromonaphthalen-1-yl)(methyl)amino)propanoic
acid

41
Figure A6. 1H NMR spectrum of 7-bromo-1-methyl-2,3-dihydronaphtho[1,8-bc]azepin-
4(1H)-one
Figure A7. 1H NMR spectrum of 7-bromo-1-methyl-1,2,3,4-tetrahydronaphtho[1,8-
bc]azepine

42
Figure A8. 1H NMR spectrum of 1-(1-methyl-1, 2, 3, 4-tetrahydronaptho[1, 8-bc]
azepin-7-yl) propan-1-one

43
Figure A9. 13C NMR spectrum of 1-(1-methyl-1, 2, 3, 4-tetrahydronaptho[1, 8-bc]
azepin-7-yl) propan-1-one