doe fundamentals handbook instrumentation and …
TRANSCRIPT

DOE-HDBK-1013/1-92 JUNE 1992
DOE FUNDAMENTALS HANDBOOK
INSTRUMENTATION AND CONTROL
Volume 1 of 2
U.S. Department of Energy
Washington, D.C. 20585
FSC-6910

This document has been reproduced directly from the best available copy.
Available to DOE and DOE contractors from the Office of Scientific and Technical Information. P. O. Box 62, Oak Ridge, TN 37831; prices available from (615) 576-8401. FTS 626-8401.
Available to the public from the National Technical Information Service, U.S. Department of Commerce, 5285 Port Royal Rd., Springfield, VA 22161.

DISCLAIMER
This report was prepared as an account of work sponsored by an agency of the United States Government. Neither the United States Government nor any agency Thereof, nor any of their employees, makes any warranty, express or implied, or assumes any legal liability or responsibility for the accuracy, completeness, or usefulness of any information, apparatus, product, or process disclosed, or represents that its use would not infringe privately owned rights. Reference herein to any specific commercial product, process, or service by trade name, trademark, manufacturer, or otherwise does not necessarily constitute or imply its endorsement, recommendation, or favoring by the United States Government or any agency thereof. The views and opinions of authors expressed herein do not necessarily state or reflect those of the United States Government or any agency thereof.

DISCLAIMER Portions of this document may be illegible in electronic image products. Images are produced from the best available original document.

DOE-HEBK—1013/1-92
DE92 019792
DOE FUNDAMENTALS HANDBOOK INSTRUMENTATION AND CONTROL Volume 1 of 2
U.S. Department of Energy FSC-6910 Washington, D.C. 20585
MASTER , DISTRIBUTION OF THIS DOCUMENT IS UNLIMITED

INSTRUMENTATION AND CONTROL
ABSTRACT
The Instrumentation and Control Fundamentals Handbook was developed to assist nuclear facility operating contractors provide operators, maintenance personnel, and the technical staff with the necessary fundamentals training to ensure a basic understanding of instrumentation and control systems. The handbook includes information on temperature, pressure, flow, and level detection systems; position indication systems; process control systems; and radiation detection principles. This information will provide personnel with an understanding of the basic operation of various types of DOE nuclear facility instrumentation and control systems.
Key Words: Training Material, Temperature Detection, Pressure Detection, Level Detection, Flow Detection, Position Indication, Radiation Detection, Process Control
Rev. 0 IC

INSTRUMENTATION AND CONTROL
FOREWORD
The Department of Energy (DOE) Fundamentals Handbooks consist of ten academic subjects, which include Mathematics; Classical Physics; Thermodynamics, Heat Transfer, and Fluid Flow; Instrumentation and Control; Electrical Science; Material Science; Mechanical Science; Chemistry; Engineering Symbology, Prints, and Drawings; and Nuclear Physics and Reactor Theory. The handbooks are provided as an aid to DOE nuclear facility contractors.
These handbooks were first published as Reactor Operator Fundamentals Manuals in 1985 for use by DOE Category A reactors. The subject areas, subject matter content, and level of detail of the Reactor Operator Fundamentals Manuals was determined from several sources. DOE Category A reactor training managers determined which materials should be included, and served as a primary reference in the initial development phase. Training guidelines from the commercial nuclear power industry, results of job and task analyses, and independent input from contractors and operations-oriented personnel were all considered and included to some degree in developing the text material and learning objectives.
The DOE Fundamentals Handbooks represent the needs of various DOE nuclear facilities' fundamentals training requirements. To increase their applicability to nonreactor nuclear facilities, the Reactor Operator Fundamentals Manual learning objectives were distributed to the Nuclear Facility Training Coordination Program Steering Committee for review and comment. To update their reactor-specific content, DOE Category A reactor training managers also reviewed and commented on the content. On the basis of feedback from these sources, information that applied to two or more DOE nuclear facilities was considered generic and was included. The final draft of each of these handbooks was then reviewed by these two groups. This approach has resulted in revised modular handbooks that contain sufficient detail such that each facility may adjust the content to fit their specific needs.
Each handbook contains an abstract, a foreword, an overview, learning objecUves, and text material, and is divided into modules so that content and order may be modified by individual DOE contractors to suit their specific training needs. Each subject area is supported by a separate examination bank with an answer key.
The DOE Fundamentals Handbooks have been prepared for the Assistant Secretary for Nuclear Energy, Office of Nuclear Safety Policy and Standards, by the DOE Training Coordination Program. This program is managed by EG&G Idaho, Inc.
Rev. 0 IC

INSTRUMENTATION AND CONTROL
OVERVIEW
The Department of Energy Fundamentals Handbook entitled Instrumentation and Control was prepared as an information resource for personnel who are responsible for the operation of the Department's nuclear facilities. A basic understanding of instrumentation and control is necessary for DOE nuclear facility operators, maintenance personnel, and the technical staff to safely operate and maintain the facility and facility support systems. The information in the handbook is presented to provide a foundation for applying engineering concepts to the job. This knowledge will help personnel more fully understand the impact that their actions may have on the safe and reliable operation of facility components and systems.
The Instrumentation and Control handbook consists of seven modules that are contained in two volumes. The following is a brief description of the information presented in each module of the handbook.
Volume 1 of 2
Module 1 - Temperature Detectors
This module describes the construction, operation, and failure modes for various types of temperature detectors and indication circuits.
Module 2 - Pressure Detectors
This module describes the construction, operation, and failure modes for various types of pressure detectors and indication circuits.
Module 3 - Level Detectors
This module describes the construction, operation, and failure modes for various types of level detectors and indication circuits.
Module 4 - Flow Detectors
This module describes the construction, operation, and failure modes for various types of flow detectors and indication circuits.
Module 5 - Position Indicators
This module describes the construction, operation, and failure modes for various types of position indicators and control circuits.
Rev. 0 IC

INSTRUMENTATION AND CONTROL
Volume 2 of 2
Module 6 - Radiation Detectors
This module describes the principles of radiation detection, detector operation, circuit operation, and specific radiation detector applications.
Module 7 - Principles of Control Systems
This module describes the principles of operation for control systems used in evaluating and regulating changing conditions in a process.
The information contained in this handbook is by no means all encompassing. An attempt to present the entire subject of instrumentation and control would be impractical. However, the Instrumentation and Control handbook does present enough information to provide the reader with a fundamental knowledge level sufficient to understand the advanced theoretical concepts presented in other subject areas, and to better understand basic system and equipment operations.
Rev. 0 IC
Department of Energy Fundamentals Handbook
INSTRUMENTATION AND CONTROL Module 1
Temperature Detectors
Temperature Detectors TABLE OF CONTENTS
TABLE OF CONTENTS
LIST OF FIGURES ii
LIST OF TABLES iii
REFERENCES iv
OBJECTIVES v
RESISTANCE TEMPERATURE DETECTORS (RTDs) 1
Temperature 1 RTD Construction 2
Summary 4
THERMOCOUPLES 5
Thermocouple Construction 5 Thermocouple Operation 6
Summary 7
FUNCTIONAL USES OF TEMPERATURE DETECTORS 8
Functions of Temperature Detectors 8 Detector Problems 8 Environmental Concerns 9 Summary 9
TEMPERATURE DETECTION CIRCUITRY 10 Bridge Circuit Construction 10 Bridge Circuit Operation 12 Temperature Detection Circuit 14 Temperature Compensation 15 Summary 16
Rev. 0 Page i IC-01

LIST OF FIGURES Temperature Detectors
LIST OF FIGURES
Figure 1 Electrical Resistance-Temperature Curves 2
Figure 2 Internal Constiiiction of a Typical RTD 3
Figure 3 RTD Protective Well and Terminal Head 4
Figure 4 Thermocouple Material Characteristics
When Used with Platinum 5
Figure 5 Internal Construction of a Typical Thermocouple 6
Figure 6 Simple Thermocouple Circuit 6
Figure 7 Temperature-vs-Voltage Reference Table 7
Figure 8 Bridge Circuit 11
Figure 9 Unbalanced Bridge Circuit 12
Figure 10 Balanced Bridge Circuit 13
Figure 11 Block Diagram of a Typical Temperature Detection Circuit 14
Figure 12 Resistance Thermometer Circuit with Precision Resistor in Place of Resistance Bulb 15
IC-01 Page ii Rev. 0

Temperature Detectors LIST OF TABLES
LIST OF TABLES
NONE
Rev. 0 Page u\ IC-01

REFERENCES Temperature Detectors
REFERENCES
Kirk, Franklin W. and Rimboi, Nicholas R., Instrumentation. Third Edition, American Technical Publishers, ISBN 0-8269-3422-6.
Academic Program for Nuclear Power Plant Personnel. Volume IV, General Physics Corporation, Library of Congress Card #A 397747, April 1982.
Fozard, B., Instrumentation and Control of Nuclear Reactors. ILIFFE Books Ltd., London.
Wightman, E.J., Instrumentation in Process Control. CRC Press, Cleveland, Ohio.
Rhodes, T.J. and Carroll, G.C., Industrial Instruments for Measurement and Control. Second Edition, McGraw-Hill Book Company.
Process Measurement Fundamentals. Volume I, General Physics Corporation, ISBN 0-87683-001-7, 1981.
IC-01 Page iv Rev. 0

Temperature Detectors OBJECTIVES
TERMINAL OBJECTIVE
1.0 Given a temperature instrument, RELATE the associated fundamental principles, including possible failure modes, to that instrument.
ENABLING OBJECTIVES
1.1 DESCRIBE the construction of a basic RTD including: a. Major component arrangement b. Materials used
1.2 EXPLAIN how RTD resistance varies for the following: a. An increase in temperature b. A decrease in temperature
1.3 EXPLAIN how an RTD provides an output representative of the measured temperature.
1.4 DESCRIBE the basic construction of a thermocouple including: a. Major component arrangement b. Materials used
1.5 EXPLAIN how a thermocouple provides an output representative of the measured temperature.
1.6 STATE the three basic functions of temperature detectors.
1.7 DESCRIBE the two alternate methods of determining temperature when the normal temperature sensing devices are inoperable.
1.8 STATE the two environmental concerns which can affect the accuracy and reliability of temperature detection instrumentation.
1.9 Given a simplified schematic diagram of a basic bridge circuit, STATE the purpose of the following components: a. R, and Rj b. R, c. Adjustable resistor d. Sensitive ammeter
Rev. 0 Page v IC-01

OBJECTIVES Temperature Deteaors
ENABLING OBJECTIVES (Cont.)
1.10 DESCRIBE the bridge circuit conditions that create a balanced bridge.
1.11 Given a block diagram of a basic temperature instrument detection and control system, STATE the purpose of the following blocks: a. RTD b. Bridge circuit c. DC-AC converter d. Amplifier e. Balancing motor/mechanical linkage
1.12 DESCRIBE the temperature instrument indication(s) for the following circuit faults: a. Short circuit b. Open circuit
1.13 EXPLAIN the three methods of bridge circuit compensation for changes in ambient temperature.
IC-01 Page vi Rev. 0

Temperature Detectors RESISTANCE TEMPERATURE DETECTORS (RTDs)
RESISTANCE TEMPERATURE DETECTORS (RTDs)
The resistance of certain metals will change as temperature changes. This characteristic is the basis for the operation of an RTD.
EG 1.1 DESCRIBE the construction of a basic RTD including: a. Major component arrangement b. Materials used
EG 1.2 EXPLAIN how RTD resistance varies for the following: a. An increase in temperature b. A decrease in temperature
EG 1.3 EXPLAIN how an RTD provides an output representative of the measured temperature.
Temperature
The hotness or coldness of a piece of plastic, wood, metal, or other material depends upon the molecular activity of the material. Kinetic energy is a measure of the activity of the atoms which make up the molecules of any material. Therefore, temperature is a measure of the kinetic energy of the material in question.
Whether you want to know the temperature of the surrounding air, the water cooling a car's engine, or the components of a nuclear facility, you must have some means to measure the kinetic energy of the material. Most temperature measuring devices use the energy of the material or system they are monitoring to raise (or lower) the kinetic energy of the device. A normal household thermometer is one example. The mercury, or other liquid, in the bulb of the thermometer expands as its kinetic energy is raised. By observing how far the liquid rises in the tube, you can tell the temperature of the measured object.
Because temperature is one of the most important parameters of a material, many instruments have been developed to measure it. One type of detector used is the resistance temperature detector (RTD). The RTD is used at many DOE nuclear facilities to measure temperatures of the process or materials being monitored.
Rev. 0 Page 1 IC-01
RESISTANCE TEMPERATURE DETECTORS (RTDs) Temperature Detectors
RTD Construction
The RTD incorporates pure metals or certain alloys that increase in resistance as temperature increases and, conversely, decrease in resistance as temperature decreases. RTDs act somewhat like an electrical transducer, converting changes in temperature to voltage signals by the measurement of resistance. The metals that are best suited for use as RTD sensors are pure, of uniform quality, stable within a given range of temperature, and able to give reproducible resistance-temperature readings. Only a few metals have the properties necessary for use in RTD elements.
G
(U
£ <u
Q 1—
• ^
<u <-> c o m (n
Q:
600 r-
5 0 0
4 0 0
3 0 0
2 0 0
100
0
-
-
—
_
-^
- 2 0 0
Nickel
^^^-^^^ /""'^ Copper
/ y^^ / y^ Platinum
/ /^^^'^^ / y ^ ^ ^ ' ^ ' ^
1 ^^^^
/̂̂ '̂ y ^
y— 1 1 1 1 1 1 0 200 400 600 800 1000
Temperature of RTD element ( 'C)
Figure 1 Electncal Resistance-Temperature Curves
RTD elements are normally constructed of platinum, copper, or nickel. These metals are best suited for RTD applications because of their linear resistance-temperature characteristics (as shown in Figure 1), their high coefficient of resistance, and their ability to withstand repeated temperature cycles.
The coefficient of resistance is the change in resistance per degree change in temperature, usually expressed as a percentage per degree of temperature. The material used must be capable of being drawn into fine wire so that the element can be easily constructed.
IC-01 Page 2 Rev. 0
Temperature Deteaors RESISTANCE TEMPERATURE DETECTORS (RTDs)
RTD elements are usually long, spring-like wires surrounded by an insulator and enclosed in a sheath of metal. Figure 2 shows the internal construction of an RTD.
Bai ley Cont ro ls C o m p a n y
In rone l Shen th
Porce la in nsu la to r
P l a t i n u m Wires
A lum ina Powder
Figure 2 Internal Construction of a Typical RTD
This particular design has a platinum element that is surrounded by a porcelain insulator. The insulator prevents a short circuit between the wire and the metal sheath.
Inconel, a nickel-iron-chromium alloy, is normally used in manufacturing the RTD sheath because of its inherent corrosion resistance. When placed in a liquid or gas medium, the Inconel sheath quickly reaches the temperature of the medium. The change in temperature will cause the platinum wire to heat or cool, resulting in a proportional change in resistance.
This change in resistance is then measured by a precision resistance measuring device that is calibrated to give the proper temperature reading. This device is normally a bridge circuit, which will be covered in detail later in this text.
Rev. 0 Page 3 IC-01

RESISTANCE TEMPERATURE DETECTORS (RTDs) Temperature Detectors
Figure 3 shows an RTD protective well and terminal head. The well protects the RTD from damage by the gas or liquid being measured. Protecting wells are normally made of stainless steel, carbon steel, Inconel, or cast iron, and they are used for temperatures up to 1100°C.
Figure 3 RTD Protective Well and Terminal Head
Summary
Resistance temperature detectors (RTDs) are summarized below.
RTD Summary
The resistance of an RTD varies directiy with temperature:
As temperature increases, resistance increases. As temperature decreases, resistance decreases.
RTDs are constructed using a fine, pure, metallic, spring-like wire surrounded by an insulator and enclosed in a metal sheath.
A change in temperature will cause an RTD to heat or cool, producing a proportional change in resistance. The change in resistance is measured by a precision device that is calibrated to give the proper temperature reading.
IC-01 Page 4 Rev. 0
Temperature Detectors THERMOCOUPLES
THERMOCOUPLES
The thermocouple is a device that converts thermal energy into electrical energy.
EG 1.4 DESCRIBE the basic construction of a thermocouple including: a. Major component arrangement b. Materials used
EG 1.5 EXPLAIN how a thermocouple provides an output representative of the measured temperature.
Thermocouple Construction 10 12 14 X 100 Degree C
30
20
10
- 2 0
-50
«Chi omel
-]—r -P t 90 Rh 10
- Constantan
Pt
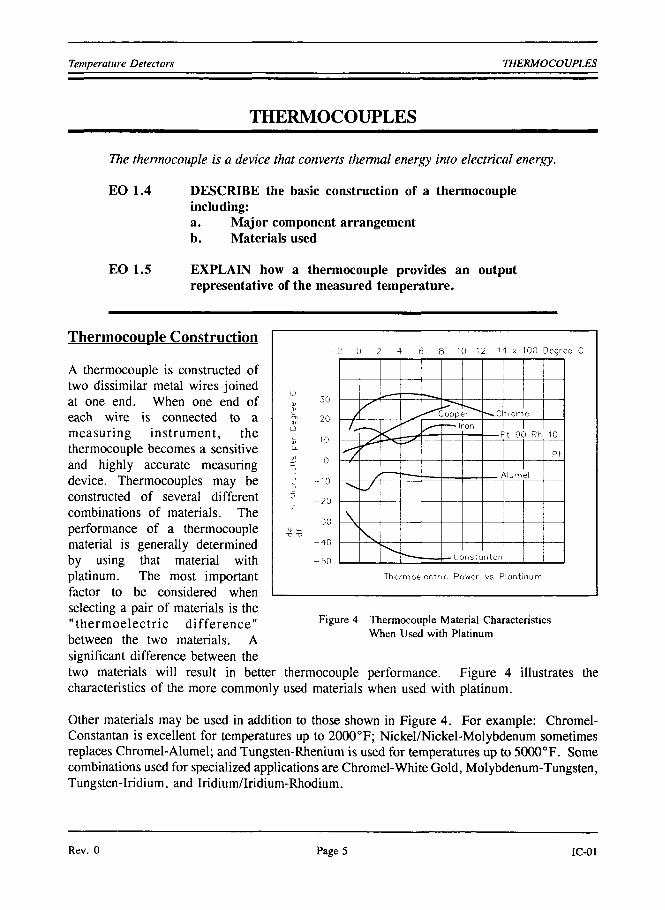
A thermocouple is constructed of two dissimilar metal wires joined at one end. When one end of each wire is connected to a measuring instrument, the thermocouple becomes a sensitive and highly accurate measuring device. Thermocouples may be constructed of several different combinations of materials. The performance of a thermocouple material is generally determined by using that material with platinum. The most important factor to be considered when selecting a pair of materials is the "thermoelectric difference" between the two materials. A significant difference between the two materials will result in better thermocouple performance. Figure 4 illustrates the characteristics of the more commonly used materials when used with platinum.
Other materials may be used in addition to those shown in Figure 4. For example: Chromel-Constantan is excellent for temperatures up to 2000°F; Nickel/Nickel-Molybdenum sometimes replaces Chromel-Alumel; and Tungsten-Rhenium is used for temperatures up to 5000°F. Some combinations used for specialized applications are Chromel-White Gold, Molybdenum-Tungsten, Tungsten-Iridium, and Iridium/Iridium-Rhodium.
Thermoelectr ic Power vs Plantinum
Figure 4 Thermocouple Material Characteristics When Used with Platinum
Rev. 0 Page 5 IC-01

THERMOCOUPLES Temperature Detectors
Figure 5 shows the internal construction of a typical thermocouple. The leads of the thermocouple are encased in a rigid metal sheath. The measuring junction is normally formed at the bottom of the thermocouple housing. Magnesium oxide surrounds the thermocouple wires to prevent vibration that could damage the fine wires and to enhance heat transfer between the measuring junction and the medium surrounding the thermocouple.
Thermocouple Operation
Thermocouples will cause an electric current to flow in the attached circuit when subjected to changes in temperature. The amount of current that will be produced is dependent on the temperature difference between the measurement and reference junction; the characteristics of the two metals used; and the characteristics of the attached circuit. Figure 6 illustrates a simple thermocouple circuit.
\ \ \ \ \ \ \ \ \ \ \ \ \ \ \ \ ^
\1 Bailey Controls . Compony
\
V
Inconel Sheath
Thermocouple Wires
-Magnesium Oxide
Figure 5 Internal Construction of a Typical Thermocouple
Measuring Junction (Hot)
r n ^ Heat
(S) Voltmeter
^ (^
Reference Junction (Cold)
Source
^Dissimilar Metal Wires
I I
Figure 6 Simple Thermocouple Circuit
Heating the measuring j u n c t i o n of t h e thermocouple produces a voltage which is greater than the voltage across the reference junction. The difference between the two voltages is proportional to the d i f fe rence in temperature and can be measured on the voltmeter (in millivolts). For ease of operator use, some voltmeters are set up to read out directiy in temperature through use of electronic circuity.
IC-01 Page 6 Rev. 0

Temperature Detectors THERMOCOUPLES
Other applications provide only the millivolt readout. In order to convert the millivolt reading to its corresponding temperature, you must refer to tables like the one shown in Figure 7. These tables can be obtained from the thermocouple manufacturer, and they list the specific temperature corresponding to a series of millivolt readings.
Tcmperat
°C
0 + 0 100 200 300 400 500 600 700 800 900
1,000
1,100
1,200
1,300
1,400
1,500
1,600
1,700
°C
ures CC) (IPTS 1968)
0
0000
0000
0 645
1 440
2 323
3 260
4 234
5 237
6 274
7 345
8 448
9 585
10 754
11 947
13 155
14 368
15 576
16 771
17 942
0
10
-0 053
0 055
0 719
1 525
2 414
3 356
4 333
5 339
6 380
7 454
8 560
9 700
10 872
12 067
13 276
14 489
15 697
16 890
18 058
10
20
0 103
0 113
0 795
1 611
2 506
3 452
4 432
5 442
6 486
7 563
8 673
9 816
10 991
12 188
13 397
14 610
15 817
17 008
18 170
20
30 40 Thermoelectnc
0 150
0 173
0 872
1 698
2 599
3 549
4 532
5 544
6 592
7 672
8 786
9 932
11 110
12 308
13 519
14 731
15 937
17 125
18 282
30
0 194
0 235
0 950
1 785
2 692
3 645
4 632
5 648
6 699
7 782
8 899
10 048
11 229
12 429
13 640
14 852
16 057
17 243
18 394
40
50 Voltage in
-0 236
0 299
1 029
1 873
2 786
3 743
4 732
5 751
6 805
7 892
9 012
10 165
11 348
12 550
13 761
14 973
16 176
17 360
18 504
50
60 70 Absolute Millivolts
0 365
1 109
1 962
2 880
3 840
4 332
5 855
6 913
8 003
9 126
10 282
11 467
12 671
13 883
15 094
16 296
17 477
18 612
60
0 432
1 190
2 051
2 974
3 938
4 933
5 960
7 020
8 114
9 240
10 400
11 587
12 792
14 004
15 215
16 415
17 594
70
80
0 502
1 273
2 141 3 069 4 036 5 034 6 064 7 128 8 225
9 355
10 517
11 707
12 913
14 125
15 336
16 534
17711
80
90
0 573
1 356
2 232
3 164
4 135
5 136
6 169
7 236
8 336
9 470
10 635
11 827
13 034
14 247
15 456
16 653
17 826
90
Reference Junction 0°C
100
0 645
1 440
2 323
3 260
4 234
5 237
6 274
7 345
8 448
9 585
10 754
11 947
13 155
14 368
15 576
16 771
17 942
100
"C
- 0
-H 0
100 200 300 400 500 600 700 800 900
1,000
1,100
1,200
1,300
1,400
1,500
1,600
1,700
°C
Figure 7 Temperature-vs-Voltage Reference Table
Summary
Thermocouples are summarized below.
Thermocouple Summary
A thermocouple is constructed of two dissimilar wires joined at one end and encased in a metal sheath.
The other end of each wire is connected to a meter or measuring circuit.
Heating the measuring junction of the thermocouple produces a voltage that is greater than the voltage across the reference junction.
The difference between the two voltages is proportional to the difference in temperature and can be measured on a voltmeter.
Rev. 0 Page 7 IC-01

FUNCTIONAL USES OF TEMPERATURE DETECTORS Temperature Detectors
FUNCTIONAL USES OF TEMPERATURE DETECTORS
Temperature sensing devices, such as RTDs and thermocouples, provide necessary temperature indications for the safe and continued operation of the DOE facility fluid systems. These temperature indications may include:
• Reactor hot and cold leg temperatures • Pressurizer temperature • Purification demineralizer inlet temperature • Cooling water to and from various components • Secondary feed temperature
EO 1.6 STATE the three basic functions of temperature detectors.
EO 1.7 DESCRIBE the two alternate methods of determining temperature when the normal temperature sensing devices are inoperable.
EO 1.8 STATE the two environmental concerns which can affect the accuracy and reliability of temperature detection instrumentation.
Functions of Temperature Detectors
Although the temperatures that are monitored vary slightly depending on the details of facility design, temperature detectors are used to provide three basic functions: indication, alarm, and control. The temperatures monitored may normally be displayed in a central location, such as a control room, and may have audible and visual alarms associated with them when specified preset limits are exceeded. These temperatures may have control functions associated with them so that equipment is started or stopped to support a given temperature condition or so that a protective action occurs.
Detector Problems
In the event that key temperature sensing instruments become inoperative, there are several alternate methods that may be used. Some applications utilize installed spare temperature detectors or dual-element RTDs. The dual-element RTD has two sensing elements of which only one is normally connected. If the operating element becomes faulty, the second element may be used to provide temperature indication. If an installed spare is not utilized, a contact pyrometer (portable thermocouple) may be used to obtain temperature readings on those pieces of equipment or systems that are accessible.
IC-Ol Page 8 Rev. 0
Temperature Detectors FUNCTIONAL USES OF TEMPERATURE DETECTORS
If the malfunction is in the circuitry and the detector itself is still functional, it may be possible to obtain temperatures by connecting an external bridge circuit to the detector. Resistance readings may then be taken and a corresponding temperature obtained from the detector calibration curves.
Environmental Concerns
Ambient temperature variations will affect the accuracy and reliability of temperature detection instrumentation. Variations in ambient temperature can directly affect the resistance of components in a bridge circuit and the resistance of the reference junction for a thermocouple. In addition, ambient temperature variations can affect the calibration of electric/electronic equipment. The effects of temperature variations are reduced by the design of the circuitry and by maintaining the temperature detection instrumentation in the proper environment.
The presence of humidity will also affect most electrical equipment, especially electronic equipment. High humidity causes moisture to collect on the equipment. This moisture can cause short circuits, grounds, and corrosion, which, in turn, may damage components. The effects due to humidity are controlled by maintaining the equipment in the proper environment.
Summary
Detector Uses Summary
• Temperature detectors are used for:
Indication Alarm functions Control functions
• If a temperature detector inoperative:
A spare detector may (if installed) A contact pyrometer used
• Environmental concerns:
Ambient temperature Humidity
became
be used
can be
Rev. 0 Page 9 IC-Ol

TEMPERATURE DETECTION CIRCUITRY Temperature Detectors
TEMPERATURE DETECTION CIRCUITRY
The bridge circuit is used whenever extremely accurate resistance measurements are required (such as RTD measurements).
EO 1.9 Given a simplified schematic diagram of a basic bridge circuit, STATE the purpose of the following components: a. R| and R, b. R. c. Adjustable resistor d. Sensitive ammeter
EO 1.10 DESCRIBE the bridge circuit conditions that create a balanced bridge.
EO 1.11 Given a block diagram of a basic temperature instrument detection and control system, STATE the purpose of the following blocks: a. RTD b. Bridge circuit c. DC-AC converter d. Amplifier e. Balancing motor/mechanical linkage
EO 1.12 DESCRIBE the temperature instrument indication(s) for the following circuit faults: a. Short circuit b. Open circuit
EO 1.13 EXPLAIN the three methods of bridge circuit compensation for changes in ambient temperature.
Bridge Circuit Construction
Figure 8 shows a basic bridge circuit which consists of three known resistances, Ri, Rj, and Rj (variable), an unknown variable resistor R^ (RTD), a source of voltage, and a sensitive ammeter.
IC-Ol Page 10 Rev. 0

Temperature Detectors TEMPERATURE DETECTION CIRCUITRY
Figure 8 Bndge Circuit
Resistors R, and Rj are the ratio arms of the bridge. They ratio the two variable resistances for current flow through the ammeter. Rj is a variable resistor known as the standard arm that is adjusted to match the unknown resistor. The sensing ammeter visually displays the current that is flowing through the bridge circuit. Analysis of the circuit shows that when Rj is adjusted so that the ammeter reads zero current, the resistance of both arms of the bridge circuit is the same. Equation 1-1 shows the relationship of the resistance between the two arms of the bridge.
R, (1-1)
Since the values of R,, Rj, and Rj are known values, the only unkown is R,. The value of R, can be calulated for the bridge during an ammeter zero current condition. Knowing this resistance value provides a baseline point for calibration of the instrument attached to the bridge circuit. The unknown resistance, R„ is given by Equation 1-2.
R. R,
(1-2)
Rev. 0 Page 11 IC-Ol
TEMPERATURE DETECTION CIRCUITRY Temperature Detectors
Bridge Circuit Operation
The bridge operates by placing R̂ in the circuit, as shown in Figure 8, and then adjusting Rj so that all current flows through the arms of the bridge circuit. When this condition exists, there is no current flow through the ammeter, and the bridge is said to be balanced. When the bridge is balanced, the currents through each of the arms are exactly proportional. They are equal if R, = R2. Most of the time the bridge is constructed so that Rj = R2. When this is the case, and the bridge is balanced, then the resistance of R, is the same as R3, or R̂ = R3.
When balance exists, R3 will be equal to the unknown resistance, even if the voltage source is unstable or is not accurately known. A typical Wheatstone bridge has several dials used to vary the resistance. Once the bridge is balanced, the dials can be read to find the value of R3. Bridge circuits can be used to measure resistance to tenths or even hundredths of a percent accuracy. When used to measure temperature, some Wheatstone bridges with precision resistors are accurate to about + 0.1°F.
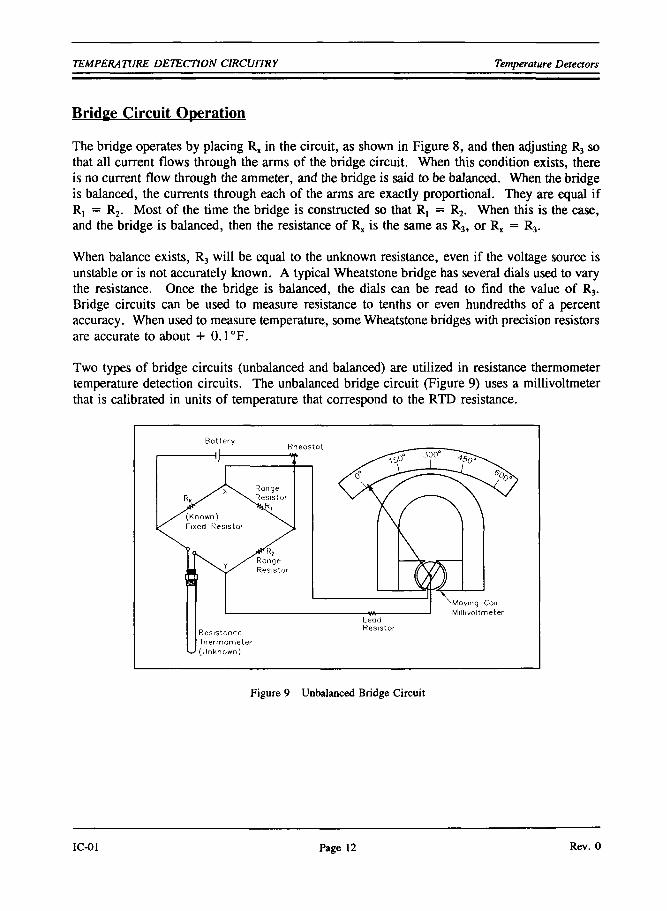
Two types of bridge circuits (unbalanced and balanced) are utilized in resistance thermometer temperature detection circuits. The unbalanced bridge circuit (Figure 9) uses a millivoltmeter that is calibrated in units of tem{)erature that correspond to the RTD resistance.
Figure 9 Unbalanced Bridge Circuit
IC-Ol Page 12 Rev. 0

Temperature Detectors TEMPERATURE DETECTION CIRCUITRY
The battery is connected to two opposite points of the bridge circuit. The millivoltmeter is connected to the two remaining points. The rheostat regulates bridge current. The regulated current is divided between the branch with the fixed resistor and range resistor Rj, and the branch with the RTD and range resistor Rj. As the electrical resistance of the RTD changes, the voltage at points X and Y changes. The millivoltmeter detects the change in voltage caused by unequal division of current in the two branches. The meter can be calibrated in units of temperature because the only changing resistance value is that of the RTD.
The balanced bridge circuit (Figure 10) uses a galvanometer to compare the RTD resistance with that of a fixed resistor. The galvanometer uses a pointer that deflects on either side of zero when the resistance of the arms is not equal. The resistance of the slide wire is adjusted until the galvanometer indicates zero. The value of the slide resistance is then used to determine the temperature of the system being monitored.
Figure 10 Balanced Bndge Circuit
A slidewire resistor is used to balance the arms of the bridge. The circuit will be in balance whenever the value of the slidewire resistance is such that no current flows through the galvanometer. For each temperature change, there is a new value; therefore, the slider must be moved to a new position to balance the circuit.
Rev. 0 Page 13 IC-Ol

TEMPERATURE DEJECTION CIRCUITRY Temperature Detectors
Temperature Detection Circuit
Figure 11 is a block diagram of a typical temperature detection circuit. This represents a balanced bridge temperature detection circuit that has been modified to eliminate the galvanometer.
ihll. i
i h l L
'
Bridge CKT
RTD
Mechanical Linkage
DC "
[DC
DC - AC Converter AC
- » • Balancing Motor
Amplifier
Figure 11 Block Diagram of a Typical Temperature Detection Circuit
The block consists of a temperature detector (RTD) that measures the temperature. The detector is felt as resistance to the bridge network. The bridge network converts this resistance to a DC voltage signal.
An electronic instrument has been developed in which the DC voltage of the potentiometer, or the bridge, is converted to an AC voltage. The AC voltage is then amplified to a higher (usable) voltage that is used to drive a bi-directional motor. The bi-directional motor positions the slider on the slidewire to balance the circuit resistance.
If the RTD becomes open in either the unbalanced and balanced bridge circuits, the resistance will be infinite, and the meter will indicate a very high temperature. If it becomes shorted, resistance will be zero, and the meter will indicate a very low temperature.
IC-OI Page 14 Rev. 0

Temperature Detectors TEMPERATURE DETECTION CIRCUITRY
When calibrating the circuit, a precision resistor of known value is substituted for the resistance bulb, as shown in Figure 12.
Figure 12 Resistance Thermometer Circuit with Precision Resistor in Place of Resistance Bulb
Battery voltage is then adjusted by varying R̂ until the meter indication is correct for the known resistance.
Temperature Compensation
Because of changes in ambient temperature, the resistance thermometer circuitry must be compensated. The resistors that are used in the measuring circuitry are selected so that their resistance will remain constant over the range of temperature expected. Temperature compensation is also accomplished through the design of the electronic circuitry to compensate for ambient changes in the equipment cabinet. It is also possible for the resistance of the detector leads to change due to a change in ambient temperature. To compensate for this change, three and four wire RTD circuits are used. In this way, the same amount of lead wire is used in both branches of the bridge circuit, and the change in resistance will be felt on both branches, negating the effects of the change in temperature.
Rev. 0 Page 15 IC-Ol
TEMPERATURE DETECTION CIRCUITRY Temperature Detectors
Summary
Temperature detection circuit operation is summarized below.
Circuit Operation Summary
The basic bridge circuit consists of:
Two known resistors (Rj and Rj) that are used for ratioing the adjustable and known resistances One known variable resistor (R3) that is used to match the unknown variable resistor One unknown resistor (RJ that is used to measure temperature A sensing ammeter that indicates the current flow through the bridge circuit
The bridge circuit is considered balanced when the sensing ammeter reads zero current.
A basic temperature instrument is comprised of:
An RTD for measuring the temperature A bridge network for converting resistance to voltage A DC to AC voltage converter to supply an amplifiable AC signal to the amplifier An AC signal amplifier to amplify the AC signal to a usable level A balancing motor/mechanical linkage assembly to balance the circuit's resistance
An open circuit in a temperature instrument is indicated by a very high temperature. A short circuit in a temperature instrument is indicated by a very low temperature.
Temperature instrument ambient temperature compensation is accomplished by:
Measuring circuit resistor selection Electronic circuitry design Use of three or four wire RTD circuits
IC-Ol Page 16 Rev. 0

Department of Energy Fundamentals Handbook
INSTRUMENTATION AND CONTROL Module 2
Pressure Detectors

Pressure Detectors TABLE OF CONTENTS
TABLE OF CONTENTS
LIST OF FIGURES ii
LIST OF TABLES iii
REFERENCES iv
OBJECTIVES V
PRESSURE DETECTORS 1
Bellows-Type Detectors 1 Bourdon Tube-Type Detectors 2
Summary 3
PRESSURE DETECTOR FUNCTIONAL USES 4
Pressure Detector Functions 4
Detector Failure 4 Environmental Concerns 4 Summary 5
PRESSURE DETECTION CIRCUITRY 6
Resistance-Type Transducers 6 Inductance-Type Transducers 9 Capacitive-Type Transducers 11 Detection Circuitry 12 Summary 13
Rev. 0 Page i IC-02

LIST OF FIGURES Pressure Detectors
LIST OF FIGURES
Figure 1 Basic Metallic Bellows 1
Figure 2 Bourdon Tube 2
Figure 3 Strain Gauge 7
Figure 4 Strain Gauge Pressure Transducer 7
Figure 5 Strain Gauge Used in a Bridge Circuit 8
Figure 6 Bellows Resistance Transducer 9
Figure 7 Inductance-Type Pressure Transducer Coil 9
Figure 8 Differential Transformer 10
Figure 9 Capacitive Pressure Transducer 11
Figure 10 Typical Pressure Detection Block Diagram 12
IC-02 Page ii Rev. 0
Pressure Detectors LIST OF TABLES
LIST OF TABLES
NONE
Rev. 0 Page iii IC-02
REFERENCES Pressure Detectors
REFERENCES
Kirk, Franklin W. and Rimboi, Nicholas R., Instrumentation. Third Edition, American Technical Publishers, ISBN 0-8269-3422-6.
Academic Program for Nuclear Power Plant Personnel. Volume IV, General Physics Corporation, Library of Congress Card #A 397747, April 1982.
Fozard, B., Instrumentation and Control of Nuclear Reactors. ILIFFE Books Ltd., London.
Wightman, E.J., Instrumentation in Process Control. CRC Press, Cleveland, Ohio.
Rhodes, T.J. and Carroll, G.C., Industrial Instruments for Measurement and Control. Second Edition, McGraw-Hill Book Company.
Process Measurement Fundamentals. Volume I, General Physics Corporation, ISBN 0-87683-001-7, 1981.
IC-02 Page iv Rev. 0
Pressure Detectors OBJECTIVES
TERMINAL OBJECTIVE
1.0 Given a pressure instrument, RELATE the fundamental principles, including possible failure modes, to that specific instrument.
ENABLING OBJECTIVES
1.1 EXPLAIN how a bellows-type pressure detector produces an output signal including: a. Method of detection b. Method of signal generation
1.2 EXPLAIN how a bourdon tube-type pressure detector produces an output signal including: a. Method of detection b. Method of signal generation
1.3 STATE the three functions of pressure measuring instrumentation.
1.4 DESCRIBE the three alternate methods of determining pressure when the normal pressure sensing devices are inoperable.
1.5 STATE the three environmental concerns which can affect the accuracy and reliability of pressure detection instrumentation.
1.6 EXPLAIN how a strain gauge pressure transducer produces an output signal including: a. Method of detection b. Method of signal generation
1.7 Given a basic block diagram of a typical pressure detection device, STATE the purpose of the following blocks: a. Sensing element b. Transducer c. Pressure detection circuitry d. Pressure indication
Rev. 0 Page V IC-02

Pressure Detectors
Intentionally Left Blank
IC-02 Page vi Rev. 0
Pressure Detectors PRESSURE DETECTORS
PRESSURE DETECTORS
Many processes are controlled by measuring pressure. This chapter describes the detectors associated with measuring pressure.
EO 1.1 EXPLAIN how a bellows-type pressure produces an output signal including: a. Method of detection b. Method of signal generation
detector
EO 1.2 EXPLAIN how a bourdon tube-type pressure detector produces an output signal including: a. Method of detection b. Method of signal generation
Bellovys-Type Detectors
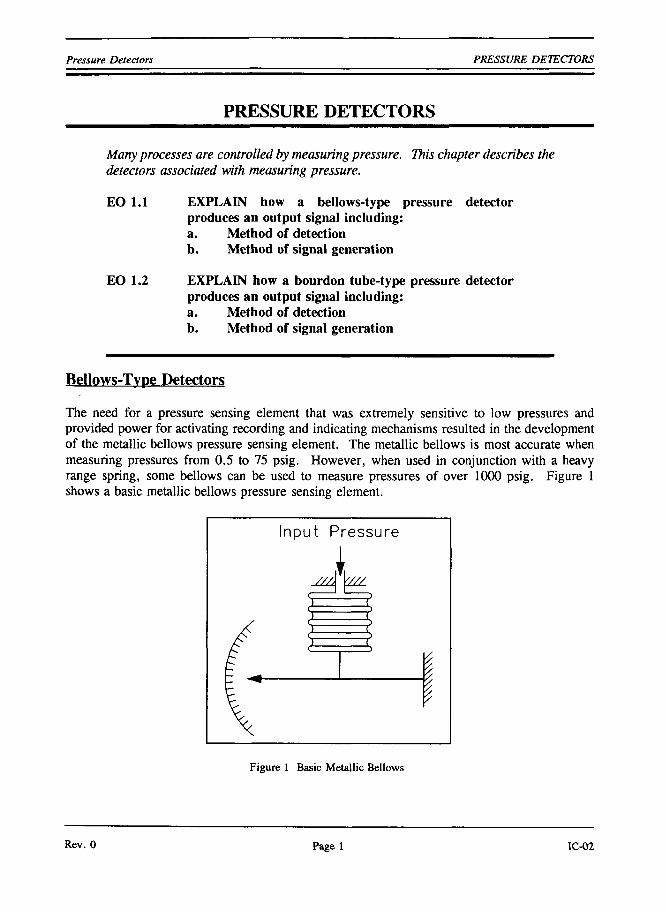
The need for a pressure sensing element that was extremely sensitive to low pressures and provided power for activating recording and indicating mechanisms resulted in the development of the metallic bellows pressure sensing element. The metallic bellows is most accurate when measuring pressures from 0.5 to 75 psig. However, when used in conjunction with a heavy range spring, some bellows can be used to measure pressures of over 1000 psig. Figure 1 shows a basic metallic bellows pressure sensing element.
Figure 1 Basic Metallic Bellows
Rev. 0 Page 1 IC-02

PRESSURE DETECTORS Pressure Detectors
The bellows is a one-piece, collapsible, seamless metallic unit that has deep folds formed from very thin-walled tubing. The diameter of the bellows ranges from 0.5 to 12 in. and may have as many as 24 folds. System pressure is applied to the internal volume of the bellows. As the inlet pressure to the instrument varies, the bellows will expand or contract. The moving end of the bellows is connected to a mechanical linkage assembly. As the bellows and linkage assembly moves, either an electrical signal is generated or a direct pressure indication is provided. The flexibility of a metallic bellows is similar in character to that of a helical, coiled compression spring. Up to the elastic limit of the bellows, the relation between increments of load and deflection is linear. However, this relationship exists only when the bellows is under compression. It is necessary to construct the bellows such that all of the travel occurs on the compression side of the point of equilibrium. Therefore, in practice, the bellows must always be opposed by a spring, and the deflection characteristics will be the resulting force of the spring and bellows.
Bourdon Tube-Type Detectors
Cross Section
Internal Pressure
^3 Bourdon
Tube
Cross Section with
lnterr>al Pressure
Bourdon Tube
The bourdon tube pressure instrument is one of the oldest pressure sensing instruments in use today. The bourdon tube (refer to Figure 2) consists of a thin-walled tube that is flattened diametrically on opposite sides to produce a cross-sectional area elliptical in shape, having two long flat sides and two short round sides. The tube is bent lengthwise into an arc of a circle of 270 to 300 degrees. Pressure applied to the inside of the tube causes distention of the flat sections and tends to restore its original round cross-section. This change in cross-section causes the tube to straighten slightly. Since the tube is permanently fastened at one end, the tip of the tube traces a curve that is the result of the change in angular position with respect to the center. Within limits, the movement of the tip of the tube can then be used to position a pointer or to develop an equivalent electrical signal (which is discussed later in the text) to indicate the value of the applied internal pressure.
Figure 2 Bourdon Tube
IC-02 Page 2 Rev. 0

Pressure Detectors PRESSURE DETECTORS
Summary
The operation of bellows-type and bourdon tube-type pressure detectors is summarized below.
Bellows and Bourdon Tube Pressure Detectors Summary
In a bellows-type detector:
System pressure is applied to the internal volume of a bellows and mechanical linkage assembly. As pressure changes, the bellows and linkage assembly move to cause an electrical signal to be produced or to cause a gauge pointer to move.
In a bourdon tube-type detector:
System pressure is applied to the inside of a slightly flattened arc-shaped tube. As pressure increases, the tube tends to restore to its original round cross-section. This change in cross-section causes the tube to straighten.
Since the tube is permanently fastened at one end, the tip of the tube traces a curve that is the result of the change in angular position with respect to the center. The tip movement can then be used to position a pointer or to develop an electrical signal.
Rev. 0 Page 3 IC-02

PRESSURE DETECTOR FUNCTIONAL USES Pressure Detectors
PRESSURE DETECTOR FUNCTIONAL USES
Pressure measurement is a necessary function in the safe and efficient operation of DOE nuclear facilities.
EO 1.3 STATE the three functions of pressure measuring instrumentation.
EX) 1.4 DESCRIBE the three alternate methods of determining pressure when the normal pressure sensing devices are inoperable.
EO 1.5 STATE the three environmental concerns which can affect the accuracy and reliability of pressure detection instrumentation.
Pressure Detector Functions
Although the pressures that are monitored vary slightly depending on the details of facility design, all pressure detectors are used to provide up to three basic functions: indication, alarm, and control. Since the fluid system may operate at both saturation and subcooled conditions, accurate pressure indication must be available to maintain proper cooling. Some pressure detectors have audible and visual alarms associated with them when specified preset limits are exceeded. Some pressure detector applications are used as inputs to protective features and control functions.
Detector Failure
If a pressure instrument fails, spare detector elements may be utilized if installed. If spare detectors are not installed, the pressure may be read at an independent local mechanical gauge, if available, or a precision pressure gauge may be installed in the system at a convenient point. If the detector is functional, it may be possible to obtain pressure readings by measuring voltage or current values across the detector leads and comparing this reading with calibration curves.
Environmental Concerns
Pressure instruments are sensitive to variations in the atmospheric pressure surrounding the detector. This is especially apparent when the detector is located within an enclosed space. Variations in the pressure surrounding the detector will cause the indicated pressure from the detector to change. This will greatly reduce the accuracy of the pressure instrument and should be considered when installing and maintaining these instruments.
IC-02 Page 4 Rev. 0

Pressure Detectors PRESSURE DETECTOR FUNCTIONAL USES
Ambient temperature variations will affect the accuracy and reliability of pressure detection instrumentation. Variations in ambient temperature can directiy affect the resistance of components in the instrumentation circuitry, and, therefore, affect the calibration of electric/electronic equipment. The effects of temperature variations are reduced by the design of the circuitry and by maintaining the pressure detection instrumentation in the proper environment.
The presence of humidity will also affect most electrical equipment, especially electronic equipment. High humidity causes moisture to collect on the equipment. This moisture can cause short circuits, grounds, and corrosion, which, in turn, may damage components. The effects due to humidity are controlled by maintaining the equipment in the proper environment.
Summary
The three functions of pressure monitoring instrumentation and alternate methods of monitoring pressure are summarized below.
Functional Uses Summary
Pressure detectors perform the following basic functions:
Indication Alarm
Control
If a pressure detector becomes inoperative:
A spare detector element may be used (if installed). A local mechanical pressure gauge can be used (if available). A precision pressure gauge may be installed in the system.
Environmental concerns:
Atmospheric pressure Ambient temperature Humidity
Rev. 0 Page 5 IC-02

PRESSURE DETECTION CIRCUITRY Pressure Detectors
PRESSURE DETECTION CIRCUITRY
Any of the pressure detectors previously discussed can be joined to an electrical device to form a pressure transducer. Transducers can produce a change in resistance, inductance, or capacitance.
EO 1.6 EXPLAIN how a strain gauge pressure transducer produces an output signal including: a. Method of detection b. Method of signal generation
EO 1.7 Given a basic block diagram of a typical pressure detection device, STATE the purpose of the following blocks: a. Sensing element b. Transducer c. Pressure detection circuitry d. Pressure indication
Resistance-Type Transducers
Included in this category of transducers are strain gauges and moving contacts (slidewire variable resistors). Figure 3 illustrates a simple strain gauge. A strain gauge measures the external force (pressure) applied to a fine wire. The fine wire is usually arranged in the form of a grid. The pressure change causes a resistance change due to the distortion of the wire. The value of the pressure can be found by measuring the change in resistance of the wire grid. Equation 2-1 shows the pressure to resistance relationship.
R = K I I (2-1) A
where
R = resistance of the wire grid in ohms K = resistivity constant for the particular type of wire grid L = length of wire grid A = cross sectional area of wire grid
IC-02 Page 6 Rev. 0
Pressure Detectors PRESSURE DETECTION CIRCUITRY
Force
t Lead Wires
1
( C
(
)
Frirce
Gr id Wire
^ Flexible Back ing
Figure 3 Strain Gauge
As the wire grid is distorted by elastic deformation, its length is increased, and its cross-sectional area decreases. These changes cause an increase in the resistance of the wire of the strain gauge. This change in resistance is used as the variable resistance in a bridge circuit that provides an electrical signal for indication of pressure. Figure 4 illustrates a strain gauge pressure transducer.
Strain gauge ^, ... , \ ' ^ Flexible beam
Temp, compensating Gauge
Bellaws Pressure
Figure 4 Strain Gauge Pressure Transducer
Rev. 0 Page 7 IC-02

PRESSURE DETECTION CIRCUITRY Pressure Detectors
An increase in pressure at the inlet of the bellows causes the bellows to expand. The expansion of the bellows moves a flexible beam to which a strain gauge has been attached. The movement of the beam causes the resistance of the strain gauge to change. The temperature compensating gauge compensates for the heat produced by current flowing through the fine wire of the strain gauge. Strain gauges, which are nothing more than resistors, are used with bridge circuits as shown in Figure 5.
Figure 5 Strain Gauge Used in a Bridge Circuit
Alternating current is provided by an exciter that is used in place of a battery to eliminate the need for a galvanometer. When a change in resistance in the strain gauge causes an unbalanced condition, an error signal enters the amplifier and actuates the balancing motor. The balancing motor moves the slider along the slidewire, restoring the bridge to a balanced condition. The slider's position is noted on a scale marked in units of pressure.
IC-02 Page 8 Rev. 0

Pressure Detectors PRESSURE DETECTION CIRCUITRY
Other resistance-type transducers combine a bellows or a bourdon tube with a variable resistor, as shown in Figure 6. As pressure changes, the bellows will either expand or contract. This expansion and contraction causes the attached slider to move along the slidewire, increasing or decreasing the resistance, and thereby indicating an increase or decrease in pressure.
Pressure
1
.S l idewi re
Lead Wires
Figure 6 Bellows Resistance Transducer
Inductance-Type Transducers
The inductance-type transducer consists of three parts: a coil, a movable magnetic core, and a pressure sensing element. The element is attached to the core, and, as pressure varies, the element causes the core to move inside the coil. An AC voltage is applied to the coil, and, as the core moves, the inductance of the coil changes. The current through the coil will increase as the inductance decreases. For increased sensitivity, the coil can be separated into two coils by utilizing a center tap, as shown in Figure 7. As the core moves within the coils, the inductance of one coil will increase, while the other will decrease.
Movable Iron Core
Non-Conductive Tube
. Coils
Figure 7 Inductance-Type Pressure Transducer Coil
Rev. 0 Page 9 IC-02

PRESSURE DETECTION CIRCUITRY Pressure Detectors
Another type of inductance transducer, illustrated in Figure 8, utilizes two coils wound on a single tube and is commonly referred to as a Differential Transformer.
Figure 8 Differential Transformer
The primary coil is wound around the center of the tube. The secondary coil is divided with one half wound around each end of the tube. Each end is wound in the opposite direction, which causes the voltages induced to oppose one another. A core, positioned by a pressure element, is movable within the tube. When the core is in the lower position, the lower half of the secondary coil provides the output. When the core is in the upper position, the upper half of the secondary coil provides the output. The magnitude and direction of the output depends on the amount the core is displaced from its center position. When the core is in the mid-position, there is no secondary output.
IC-02 Page 10 Rev. 0
Pressure Detectors PRESSURE DETECTION CIRCUITRY
Capacitive-Type Transducers
Capacitive-type transducers, illustrated in Figure 9, consist of two flexible conductive plates and a dielectric. In this case, the dielectric is the fluid.
Fluid Pressure
Flexible Plate Ci
Flexible Plate Cc
Figure 9 Capacitive Pressure Transducer
As pressure increases, the flexible conductive plates will move farther apart, changing the capacitance of the transducer. This change in capacitance is measurable and is proportional to the change in pressure.
Rev. 0 Page 11 IC-02
PRESSURE DETECTION CIRCUITRY Pressure Detectors
Detection Circuitry
Figure 10 shows a block diagram of a typical pressure detection circuit.
Sensing Elemenl; Transducer
Pressure Detection Circuitry
Pressure Indication
Figure 10 Typical Pressure Detection Block Diagram
The sensing element senses the pressure of the monitored system and converts the pressure to a mechanical signal. The sensing element supplies the mechanical signal to a transducer, as discussed above. The transducer converts the mechanical signal to an electrical signal that is proportional to system pressure. If the mechanical signal from the sensing element is used directly, a transducer is not required and therefore not used. The detector circuitry will amplify and/or transmit this signal to the pressure indicator. The electrical signal generated by the detection circuitry is proportional to system pressure. The exact operation of detector circuitry depends upon the type of transducer used. The pressure indicator provides remote indication of the system pressure being measured.
IC-02 Page 12 Rev. 0
Pressure Detectors PRESSURE DETECTION CIRCUITRY
Summary
The operation of a strain guage and a typical pressure detection device is summarized below.
Circuit Operation Summary
The operation of a strain gauge is as follows:
A strain gauge measures the pressure applied to a fine wire. The fine wire is usually arranged in the form of a grid. The pressure change causes a resistance change due to the distortion of the wire.
This change in resistance is used as the variable resistance in a bridge circuit that provides an electrical signal for indication of pressure.
The operation of a typical pressure detection device is as follows:
The detector senses the pressure of the monitored system and converts this pressure to a mechanical signal. The mechanical signal from the detector is supplied to the transducer.
The transducer will convert this signal to a usable electrical signal and send a signal proportional to the detected pressure to the detection circuitry.
The detector circuitry will amplify and/or transmit this signal to the pressure indicator.
The pressure indicator will provide remote indication of the system pressure being measured.
Rev. 0 Page 13 IC-02
Pressure Detectors
Intentionally Left Blank
IC-02 Page 14 Rev. 0
Department of Energy Fundamentals Handbook
INSTRUMENTATION AND CONTROL Module 3
Level Detectors

Level Detectors TABLE OF CONTENTS
TABLE OF CONTENTS
LIST OF FIGURES ii
LIST OF TABLES iii
REFERENCES iv
OBJECTIVES V
LEVEL DETECTORS 1
Gauge Glass 1
Ball Float 4 Chain Float 5 Magnetic Bond Method 6 Conductivity Probe Method 6 Differential Pressure Level Detectors 7 Summary 10
DENSITY COMPENSATION II
Specific Volume 11 Reference Leg Temperature Considerations 12 Pressurizer Level Instruments 13 Steam Generator Level Instrument 13 Summary 14
LEVEL DETECTION CIRCUITRY 15
Remote Indication 15 Environmental Concerns 16 Summary 17
Rev. 0 Page i IC-03

LIST OF FIGURES Level Deteaors
LIST OF FIGURES
Figure 1 Transparent Tube 1
Figure 2 Gauge Glass 2
Figure 3 Reflex Gauge Glass 3
Figure 4 Refraction Gauge Glass (overhead view) 4
Figure 5 Ball Float Level Mechanism 5
Figure 6 Chain Float Gauge 5
Figure 7 Magnetic Bond Detector 6
Figure 8 Conductivity Probe Level Detection System 6
Figure 9 Open Tank Differential Pressure Detector 7
Figure 10 Closed Tank, Dry Reference Leg 8
Figure 11 Closed Tank, Wet Reference Leg 9
Figure 12 Effects of Fluid Density 12
Figure 13 Pressurizer Level System 13
Figure 14 Steam Generator Level System 13
Figure 15 Block Diagram of a Differential Pressure Level Detection Circuit 15
IC-03 Page ii Rev. 0

Level Deteaors LIST OF TABLES
LIST OF TABLES
NONE
Rev. 0 Page lu IC-03
REFERENCES Level Detectors
REFERENCES
Kirk, Franklin W. and Rimboi, Nicholas R., Instrumentation. Third Edition, American Technical Publishers, ISBN 0-8269-3422-6.
Academic Program for Nuclear Power Plant Personnel. Volume IV, General Physics Corporation, Library of Congress Card #A 397747, April 1982.
Fozard, B., Instrumentation and Control of Nuclear Reactors. ILIFFE Books Ltd., London.
Wightman, E.J., Instrumentation in Process Control. CRC Press, Cleveland, Ohio.
Rhodes, T.J. and Carroll, G.C., Industrial Instruments for Measurement and Control. Second Edition, McGraw-Hill Book Company.
Process Measurement Fundamentals. Volume I, General Physics Corporation, ISBN 0-87683-001-7, 1981.
IC-03 Page iv Rev. 0

Level Deteaors OBJECTIVES
TERMINAL OBJECTIVE
1.0 Given a level instrument, RELATE the associated fundamental principles, including possible failure modes, to that instrument.
ENABLING OBJECTIVES
1.1 IDENTIFY the principle of operation of the following types of level instrumentation: a. Gauge glass b. Ball float c. Chain float d. Magnetic bond e. Conductivity probe f. Differential pressure (AP)
1.2 EXPLAIN the process of density compensation in level detection systems to include: a. Why needed b. How accomplished
1.3 STATE the three reasons for using remote level indicators.
1.4 Given a basic block diagram of a differential pressure detector-type level instrument, STATE the purpose of the following blocks: a. Differential pressure (D/P) transmitter b. Amplifier c. Indication
1.5 STATE the three environmental concerns which can affect the accuracy and reliability of level detection instrumentation.
Rev. 0 Page v IC-03

Level Detectors
Intentionally Left Blank
IC-03 Page vi Rev. 0

Level Detectors LEVEL DETECTORS
LEVEL DETECTORS
Liquid level measuring devices are classified into two groups: (a) direct method, and (b) inferred method. An example of the direct method is the dipstick in your car which measures the height of the oil in the oil pan. An example of the inferred method is a pressure gauge at the bottom of a tank which measures the hydrostatic head pressure from the height of the liquid.
EG 1,1 IDENTIFY the principle of operation of the following types of level instrumentation: a. Gauge glass b. Ball float c. Chain float d. Magnetic bond e. Conductivity probe f. Differential pressure (AP)
Gauge Glass
A very simple means by which liquid level is measured in a vessel is by the gauge glass method (Figure 1). In the gauge glass method, a transparent tube is attached to the bottom and top (top connection not needed in a tank open to atmosphere) of the tank that is monitored. The height of the liquid in the tube will be equal to the height of water in the tank.
Transparent Tube
\
(a)
Calibrated Scole
(b )
Figure 1 Transparent Tube
Rev. 0 Page 1 IC-03

LEVEL DETECTORS Level Detectors
Figure 1 (a) shows a gauge glass which is used for vessels where the liquid is at ambient temperature and pressure conditions. Figure 1 (b) shows a gauge glass which is used for vessels where the liquid is at an elevated pressure or a partial vacuum. Notice that the gauge glasses in Figure I effectively form a "U" tube manometer where the liquid seeks its own level due to the pressure of the liquid in the vessel.
Gauge glasses made from tubular glass or plastic are used for service up to 450 psig and 4(X)°F. If it is desired to measure the level of a vessel at higher temperatures and pressures, a different type of gauge glass is used. The type of gauge glass utilized in this instance has a body made of metal with a heavy glass or quartz section for visual observation of the liquid level. The glass section is usually flat to provide strength and safety. Figure 2 illustrates a typical transparent gauge glass.
Figure 2 Gauge Glass
IC-03 Page 2 Rev. 0

Level Detectors LEVEL DETECTORS
Another type of gauge glass is the reflex gauge glass (Figure 3). In this type, one side of the glass section is prism-shaped. The glass is molded such that one side has 90-degree angles which run lengthwise. Light rays strike the outer surface of the glass at a 90-degree angle. The light rays travel through the glass striking the inner side of the glass at a 45-degree angle. The presence or absence of liquid in the chamber determines if the light rays are refracted into the chamber or reflected back to the outer surface of the glass.
Figure 3 Reflex Gauge Glass
When the liquid is at an intermediate level in the gauge glass, the light rays encounter an air-glass interface in one portion of the chamber and a water-glass interface in the other portion of the chamber. Where an air-glass interface exists, the light rays are reflected back to the outer surface of the glass since the critical angle for light to pass from air to glass is 42 degrees. This causes the gauge glass to app)ear silvery-white. In the portion of the chamber with the water-glass interface, the light is refracted into the chamber by the prisms. Reflection of the light back to the outer surface of the gauge glass does not occur because the critical angle for light to pass from glass to water is 62-degrees. This results in the glass appearing black, since it is possible to see through the water to the walls of the chamber which are painted black.
A third type of gauge glass is the refraction type (Figure 4). This type is especially useful in areas of reduced lighting; lights are usually attached to the gauge glass. Operation is based on the principle that the bending of light, or refraction, will be different as light passes through
Rev. 0 Page 3 IC-03

LEVEL DETECTORS Level Detectors
various media. Light is bent, or refracted, to a greater extent in water than in steam. For the portion of the chamber that contains steam, the light rays travel relatively straight, and the red lens is illuminated. For the portion of the chamber that contains water, the light rays are bent, causing the green lens to be illuminated. The portion of the gauge containing water appears green; the portion of the gauge from that level upward appears red.
^x) V/
^/ -r'^<>
Chamber
Light
Gciuqe Windows
Figure 4 Refraction Gauge Glass (overhead view)
Ball Float
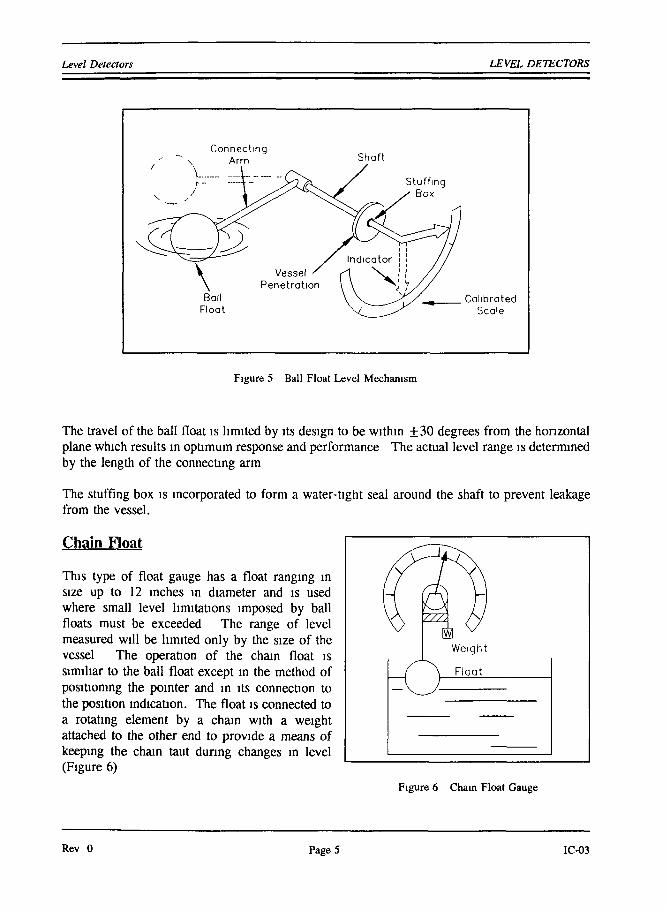
The ball float method is a direct reading liquid level mechanism. The most practical design for the float is a hollow metal ball or sphere. However, there are no restrictions to the size, shape, or material used. The design consists of a ball float attached to a rod, which in turn is connected to a rotating shaft which indicates level on a calibrated scale (Figure 5). The operation of the ball float is simple. The ball floats on top of the liquid in the tank. If the liquid level changes, the float will follow and change the position of the pointer attached to the rotating shaft.
IC-03 Page 4 Rev. 0
Level Detectors LEVEL DETECTORS
Figure 5 Ball Float Level Mechanism
The travel of the ball float is limited by its design to be within ±30 degrees from the honzontal plane which results in optimum response and performance The actual level range is determined by the length of the connecting arm
The stuffing box is incorporated to form a water-tight seal around the shaft to prevent leakage from the vessel.
Chain Float
This type of float gauge has a float ranging in size up to 12 inches in diameter and is used where small level limitations imposed by ball floats must be exceeded The range of level measured will be limited only by the size of the vessel The operation of the chain float is similiar to the ball float except in the method of positioning the pointer and in its connection to the position indication. The float is connected to a rotating element by a chain with a weight attached to the other end to provide a means of keeping the chain taut dunng changes in level (Figure 6)
Weight
Float
Figure 6 Chain Float Gauge
dO-
Rev 0 Page 5 IC-03
LEVEL DETECTORS Level Deteaors
Inner Mognet-
Non—Magnetic -Dip Tube
--Outer Magnet
^Doughnut Float
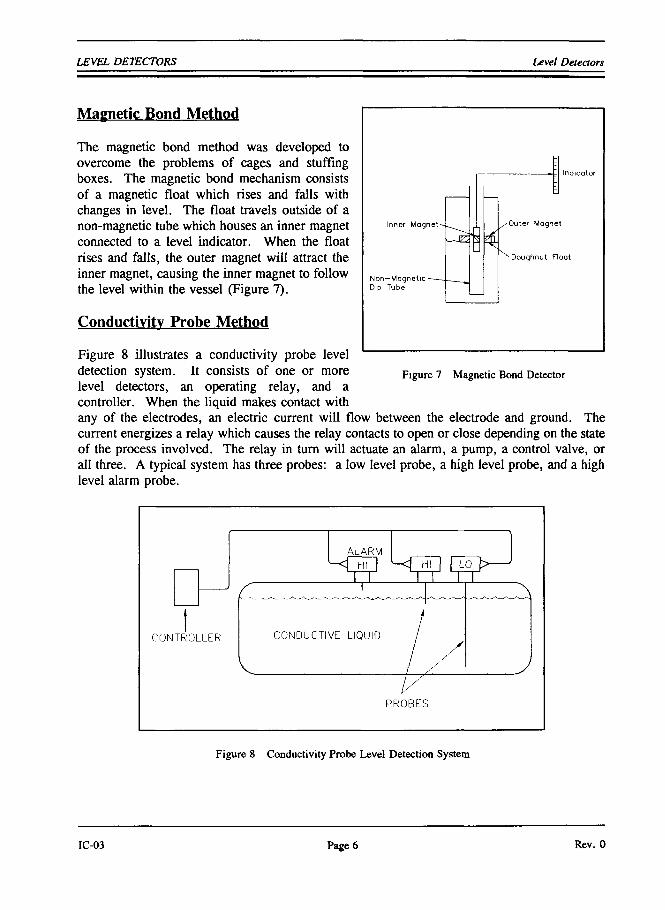
Magnetic Bond Method
The magnetic bond method was developed to overcome the problems of cages and stuffing boxes. The magnetic bond mechanism consists of a magnetic float which rises and falls with changes in level. The float travels outside of a non-magnetic tube which houses an inner magnet connected to a level indicator. When the float rises and falls, the outer magnet will attract the inner magnet, causing the inner magnet to follow the level within the vessel (Figure 7).
Conductivity Probe Method
Figure 8 illustrates a conductivity probe level detection system. It consists of one or more level detectors, an operating relay, and a controller. When the liquid makes contact with any of the electrodes, an electric current will flow between the electrode and ground. The current energizes a relay which causes the relay contacts to open or close depending on the state of the process involved. The relay in turn will actuate an alarm, a pump, a control valve, or all three. A typical system has three probes: a low level probe, a high level probe, and a high level alarm probe.
Figure 7 Magnetic Bond Detector
ALARM '-<1 HI I '-<| HI I I LP
CONTROLLER CONDUCTIVE LIQUID
Figure 8 Conductivity Probe Level Detection System
IC-03 Page 6 Rev. 0
Level Detectors LEVEL DETECTORS
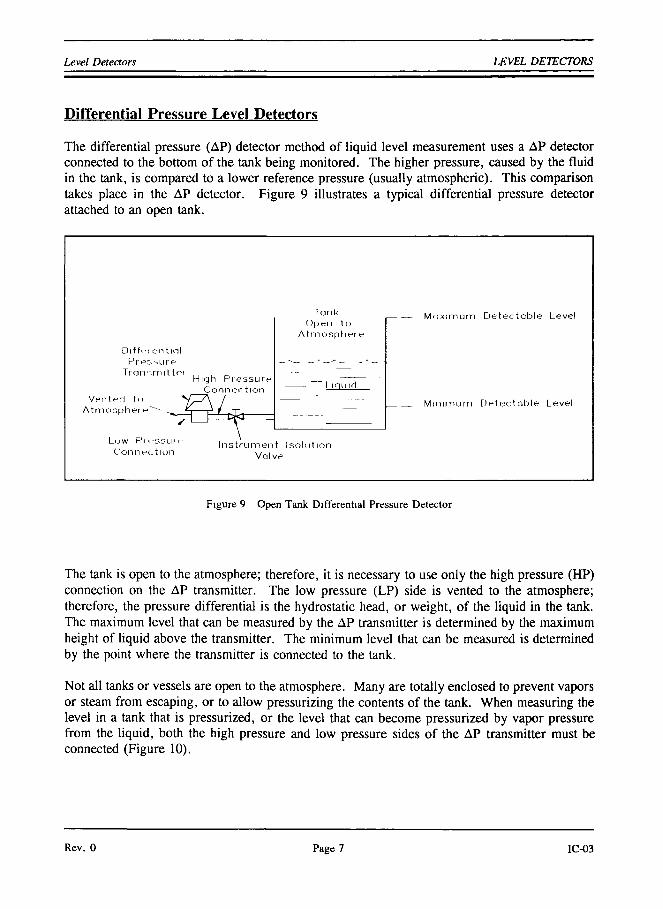
Differential Pressure Level Detectors
The differential pressure (AP) detector method of liquid level measurement uses a AP detector connected to the bottom of the tank being monitored. The higher pressure, caused by the fluid in the tank, is compared to a lower reference pressure (usually atmospheric). This comparison takes place in the AP detector. Figure 9 illustrates a typical differential pressure detector attached to an open tank.
Diffe-rent inl P rp^su re
Tronsmtt t f^r , , , ^ High F^ressure
Conner t ion Venter i to " V ^ \ /
• 1 1 " v "
Low P.e-ssure^ I ns t yumen t o n n t - c t i o n y^^^
Tank Open t u
A t m o s p h e r e
Linmcl
t I so lu t ion
Mc ix imum D e t e c t a b l e Level
M i n i m u i n D e t e c t a b l e Level
Figure 9 Open Tank Differential Pressure Detector
The tank is open to the atmosphere; therefore, it is necessary to use only the high pressure (HP) connection on the AP transmitter. The low pressure (LP) side is vented to the atmosphere; therefore, the pressure differential is the hydrostatic head, or weight, of the liquid in the tank. The maximum level that can be measured by the AP transmitter is determined by the maximum height of liquid above the transmitter. The minimum level that can be measured is determined by the point where the transmitter is connected to the tank.
Not all tanks or vessels are open to the atmosphere. Many are totally enclosed to prevent vapors or steam from escaping, or to allow pressurizing the contents of the tank. When measuring the level in a tank that is pressurized, or the level that can become pressurized by vapor pressure from the liquid, both the high pressure and low pressure sides of the AP transmitter must be connected (Figure 10).
Rev. 0 Page 7 IC-03

LEVEL DETECTORS Level Detectors
Figure 10 Closed Tank, Dry Reference Leg
The high pressure connection is connected to the tank at or below the lower range value to be measured. The low pressure side is connected to a "reference leg" that is connected at or above the upper range value to be measured. The reference leg is pressurized by the gas or vapor pressure, but no liquid is permitted to remain in the reference leg. The reference leg must be maintained dry so that there is no liquid head pressure on the low pressure side of the transmitter. The high pressure side is exposed to the hydrostatic head of the liquid plus the gas or vapor pressure exerted on the liquid's surface. The gas or vapor pressure is equally applied to the low and high pressure sides. Therefore, the output of the AP transmitter is directly proportional to the hydrostatic head pressure, that is, the level in the tank.
Where the tank contains a condensible fluid, such as steam, a slightly different arrangement is used. In applications with condensible fluids, condensation is greatly increased in the reference leg. To compensate for this effect, the reference leg is filled with the same fluid as the tank. The liquid in the reference leg applies a hydrostatic head to the high pressure side of the transmitter, and the value of this level is constant as long as the reference leg is maintained full. If this pressure remains constant, any change in AP is due to a change on the low pressure side of the transmitter (Figure 11).
IC-03 Page 8 Rev. 0

Level Detectors LEVEL DETECTORS
Connec
Figure 11 Closed Tank, Wet Reference Leg
The filled reference leg applies a hydrostatic pressure to the high pressure side of the transmitter, which is equal to the maximum level to be measured. The AP transmitter is exposed to equal pressure on the high and low pressure sides when the liquid level is at its maximum; therefore, the differential pressure is zero. As the tank level goes down, the pressure applied to the low pressure side goes down also, and the differential pressure increases. As a result, the differential pressure and the transmitter output are inversely proportional to the tank level.
Rev. 0 Page 9 IC-03

LEVEL DETECTORS Level Detectors
Summary
The different types of level instruments presented in this chapter are summarized below.
Level Instrumentation Summary
In the gauge glass method, a transparent tube is attached to the bottom and top (top connection not needed in a tank open to atmosphere) of the tank that is monitored. The height of the liquid in the tube will be equal to the height of water in the tank.
The operation of the ball float is simple. The ball floats on top of the liquid in the tank. If the liquid level changes, the float will follow and change the position of the pointer attached to the rotating shaft.
The operation of the chain float is similar to the ball float except in its method of positioning the pointer and its connection to the position indication. The float is connected to a rotating element by a chain with a weight attached to the other end to provide a means of keeping the chain taut during changes in level.
The magnetic bond mechanism consists of a magnetic float that rises and falls with changes in level. The float travels outside of a non-magnetic tube which houses an inner magnet connected to a level indicator. When the float rises and falls, the outer magnet will attract the inner magnet, causing the inner magnet to follow the level within the vessel.
The conductivity probe consists of one or more level detectors, an operating relay, and a controller. When the liquid makes contact with any of the electrodes, an electric current will flow between the electrode and ground. The current energizes a relay which causes the relay contacts to open or close depending on the state of the process involved. The relay in turn will actuate an alarm, a pump, a control valve, or all three.
The differential pressure (AP) detector uses a AP detector connected to the bottom of the tank that is being monitored. The higher pressure in the tank is compared to a lower reference pressure (usually atmospheric). This comparison takes place in the AP detector.
IC-03 Page 10 Rev. 0
Level Detectors DENSITY COMPENSATION
DENSITY COMPENSATION
If a vapor with a significant density exists above the liquid, the hydrostatic pressure added needs to be considered if accurate transmitter output is required.
EO 1.2 EXPLAIN the process of density compensation in level detection systems to include: a. Why needed b. How accomplished
Specific Volume
Before examining an example which shows the effects of density, the unit "specific volume" must be defined. Specific volume is defined as volume per unit mass as shown in Equation 3-1.
Specific Volume = Volume/Mass (3-1)
Specific volume is the reciprocal of density as shown in Equation 3-2.
Specific Volume = (3-2) density
Specific volume is the standard unit used when working with vapors and steam that have low values of density.
For the applications that involve water and steam, specific volume can be found using "Saturated Steam Tables," which list the specific volumes for water and saturated steam at different pressures and temperatures.
The density of steam (or vapor) above the liquid level will have an effect on the weight of the steam or vapor bubble and the hydrostatic head pressure. As the density of the steam or vapor increases, the weight increases and causes an increase in hydrostatic head even though the actual level of the tank has not changed. The larger the steam bubble, the greater the change in hydrostatic head pressure.
Rev. 0 Page 11 IC-03

DENSITY COMPENSATION Level Detectors
Figure 12 illustrates a vessel in which the water is at saturated boiling conditions.
Condensing Pot
Water i 100° F
m^^^
steam 30Cf F
53.2 psig
Electric Heater
Water •"Q 300° F
Figure 12 Effects of Fluid Density
A condensing pot at the top of the reference leg is incorporated to condense the steam and maintain the reference leg filled. As previously stated, the effect of the steam vapor pressure is cancelled at the AP transmitter due to the fact that this pressure is equally applied to both the low and high pressure sides of the transmitter. The differential pressure to the transmitter is due only to hydrostatic head pressure, as stated in Equation 3-3.
Hydrostatic Head Pressure = Density x Height
Reference Leg Temperature Considerations
(3-3)
When the level to be measured is in a pressurized tank at elevated temperatures, a number of additional consequences must be considered. As the temperature of the fluid in the tank is increased, the density of the fluid decreases. As the fluid's density decreases, the fluid expands, occupying more volume. Even though the density is less, the mass of the fluid in the tank is the same. The problem encountered is that, as the fluid in the tank is heated and cooled, the density of the fluid changes, but the reference leg density remains relatively constant, which causes the indicated level to remain constant. The density of the fluid in the reference leg is dependent upon the ambient temperature of the room in which the tank is located; therefore, it is relatively constant and independent of tank temperature. If the fluid in the tank changes temperature, and therefore density, some means of density compensation must be incorporated in order to have an accurate indication of tank level. This is the problem encountered when measuring pressurizer water level or steam generator water level in pressurized water reactors, and when measuring reactor vessel water level in boiling water reactors.
IC-03 Page 12 Rev. 0
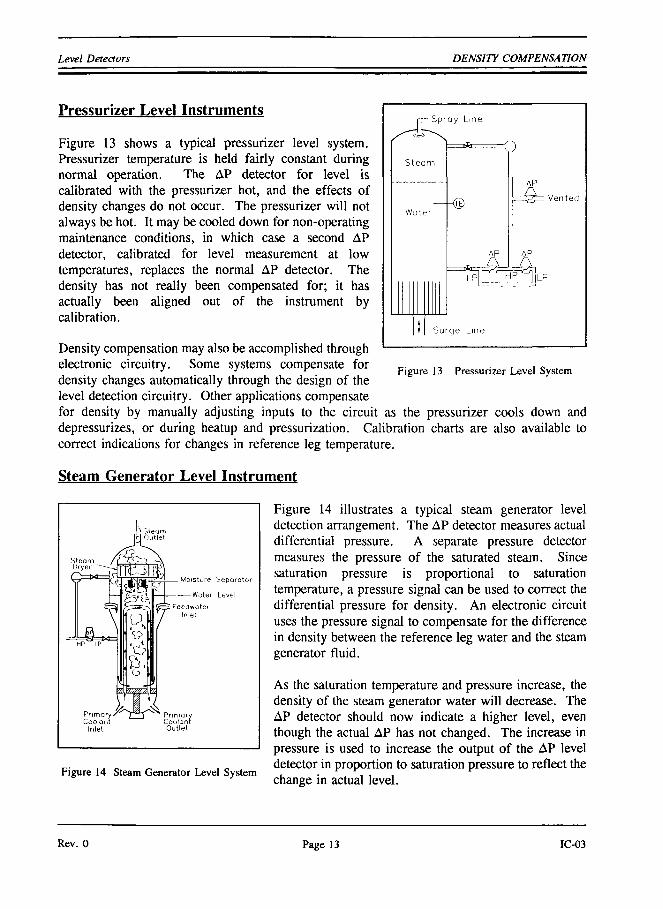
Level Deteaors DENSITY COMPENSATION
Pressurizer Level Instruments
Figure 13 shows a typical pressurizer level system. Pressurizer temperature is held fairly constant during normal operation. The AP detector for level is calibrated with the pressurizer hot, and the effects of density changes do not occur. The pressurizer will not always be hot. It may be cooled down for non-operating maintenance conditions, in which case a second AP detector, calibrated for level measurement at low temperatures, replaces the normal AP detector. The density has not really been compensated for; it has actually been aligned out of the instrument by calibration.
Spray Line
S t e a m
Water - ^
AP
AP
AP
LP HP LP
Surge Line
Figure 13 Pressurizer Level System
Density compensation may also be accomplished through electronic circuitry. Some systems compensate for density changes automatically through the design of the level detection circuitry. Other applications compensate for density by manually adjusting inputs to the circuit as the pressurizer cools down and depressurizes, or during heatup and pressurization. Calibration charts are also available to correct indications for changes in reference leg temperature.
Steam Generator Level Instrument
steam Dryer
- Moisture beparotor
-Woter Level
Figure 14 Steam Generator Ixvel System
Figure 14 illustrates a typical steam generator level detection arrangement. The AP detector measures actual differential pressure. A separate pressure detector measures the pressure of the saturated steam. Since saturation pressure is proportional to saturation temperature, a pressure signal can be used to correct the differential pressure for density. An electronic circuit uses the pressure signal to compensate for the difference in density between the reference leg water and the steam generator fluid.
As the saturation temperature and pressure increase, the density of the steam generator water will decrease. The AP detector should now indicate a higher level, even though the actual AP has not changed. The increase in pressure is used to increase the output of the AP level detector in proportion to saturation pressure to reflect the change in actual level.
Rev. 0 Page 13 IC-03

DENSITY COMPENSATION Level Detectors
Summary
Density compensation is summarized below.
Density Compensation Summary
If a vapor with a significant density exists above the liquid, the hydrostatic pressure that it will add may need to be considered if accurate transmitter output is required.
Density compensation is accomplished by using either:
Electronic circuitry Pressure detector input Instrument calibration
IC-03 Page 14 Rev. 0
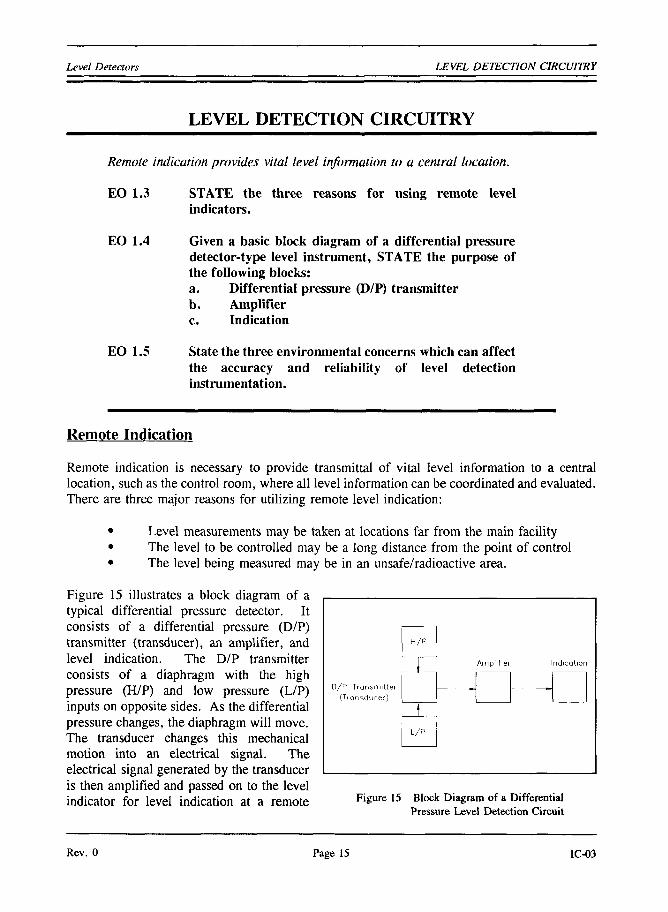
Level Detectors LEVEL DETECTION CIRCUITRY
LEVEL DETECTION CIRCUITRY
Remote indication provides vital level information to a central location.
EO 1.3 STATE the three reasons for using remote level indicators.
EO 1.4 Given a basic block diagram of a differential pressure detector-type level instrument, STATE the purpose of the following blocks: a. Differential pressure (D/P) transmitter b. Amplifier c. Indication
EO 1.5 State the three environmental concerns which can affect the accuracy and reliability of level detection instrumentation.
Remote Indication
Remote indication is necessary to provide transmittal of vital level information to a central location, such as the control room, where all level information can be coordinated and evaluated. There are three major reasons for utilizing remote level indication:
• Level measurements may be taken at locations far from the main facility • The level to be controlled may be a long distance from the point of control • The level being measured may be in an unsafe/radioactive area.
Figure 15 illustrates a block diagram of a typical differential pressure detector. It consists of a differential pressure (D/P) transmitter (transducer), an amplifier, and level indication. The D/P transmitter consists of a diaphragm with the high pressure (H/P) and low pressure (L/P) inputs on opposite sides. As the differential pressure changes, the diaphragm will move. The transducer changes this mechanical motion into an electrical signal. The electrical signal generated by the transducer is then amplified and passed on to the level indicator for level indication at a remote
D/P Transmitter {Tronsdurer)
H / P
1
t L / P
Aniplifiei ndicatior
Figure 15 Block Diagram of a Differential Pressure L.evel Detection Circuit
Rev. 0 Page 15 IC-03
LEVEL DETECTION CIRCUITRY Level Detectors
location. Using relays, this system provides alarms on high and low level. It may also provide control functions such as repositioning a valve and protective features such as tripping a pump.
Environmental Concerns
Density of the fluid whose level is to be measured can have a large effect on level detection instrumentation. It primarily affects level sensing instruments which utilize a wet reference leg. In these instruments, it is possible for the reference leg temperature to be different from the temperature of the fluid whose level is to be measured. An example of this is the level detection instrumentation for a boiler steam drum. The water in the reference leg is at a lower temperature than the water in the steam drum. Therefore, it is more dense, and must be compensated for to ensure the indicated steam drum level is accurately indicated.
Ambient temperature variations will affect the accuracy and reliability of level detection instrumentation. Variations in ambient temperature can directly affect the resistance of components in the instrumentation circuitry, and, therefore, affect the calibration of electric/electronic equipment. The effects of temperature variations are reduced by the design of the circuitry and by maintaining the level detection instrumentation in the proper environment.
The presence of humidity will also affect most electrical equipment, especially electronic equipment. High humidity causes moisture to collect on the equipment. This moisture can cause short circuits, grounds, and corrosion, which, in turn, may damage components. The effects due to humidity are controlled by maintaining the equipment in the proper environment.
IC-03 Page 16 Rev. 0

Level Detectors LEVEL DETECTION CIRCUITRY
Summary
The density of the fluid, ambient temperature changes, and humidity are three factors which can affect the accuracy and reliability of level detection instrumentation. Level detection circuit operation is summarized below.
Circuit Operation Summary
There are three major reasons for utilizing remote level indication:
Level measurements may be taken at locations far from the main facility.
The level to be controlled may be a long distance from the point of control.
The level being measured may be in an unsafe/radioactive area.
The basic block diagram of a differential pressure level instrument are:
A differential pressure (D/P) transmitter which consists of a diaphragm with the high pressure (H/P) and low pressure (L/P) inputs on opposite sides. As the differential pressure changes, the diaphragm will move. The transducer changes this mechanical motion into an electrical signal.
An amplifier amplifies the electrical signal generated by the transducer and sends it to the level indicator.
A level indicator displays the level indication at a remote location.
Rev. 0 Page 17 IC-03

Level Detectors
Intentionally Left Blank
IC-03 Page 18 Rev. 0

Department of Energy Fundamentals Handbook
INSTRUMENTATION AND CONTROL Module 4
Flow Detectors
Flow Deteaors TABLE OF CONTENTS
TABLE OF CONTENTS
LIST OF FIGURES ii
LIST OF TABLES iii
REFERENCES iv
OBJECTIVES v
HEAD FLOW METERS 1
Orifice Plate 3
Venturi Tube 4 Dall Flow Tube 5 Pitot Tube 6 Summary 7
OTHER FLOW METERS 8
Area Flow Meter 8 Displacement Meter 9 Hot-Wire Anemometer 10 Electromagnetic Flowmeter 10 Ultrasonic Flow Equipment 10 Summary 11
STEAM FLOW DETECTION 12
Summary 16
FLOW CIRCUITRY 17
Circuitry 17
Use of Flow Indication 18 Environmental Concerns 18 Summary 19
Rev. 0 Page i IC-04

LIST OF FIGURES Flow Detectors
LIST OF FIGURES
Figure 1 Head Flow Meter 1
Figure 2 Orifice Plates 3
Figure 3 Venturi Tube 4
Figure 4 Dall Flow Tube 5
Figure 5 Pitot Tube 6
Figure 6 Rotameter 8
Figure 7 Nutating Disk 9
Figure 8 Flow Nozzle 12
Figure 9 Simple Mass Flow Detection System 14
Figure 10 Gas Flow Computer 15
Figure 11 Differential Pressure Flow Detection Block Diagram 17
IC-04 Page ii Rev. 0

Flow Detectors LIST OF TABLES
LIST OF TABLES
NONE
Rev. 0 Page iii IC-04
REFERENCES Flow Detectors
REFERENCES
Kirk, Franklin W. and Rimboi, Nicholas R., Instrumentation. Third Edition, American Technical Publishers, ISBN 0-8269-3422-6.
Academic Program for Nuclear Power Plant Personnel. Volume IV, General Physics Corporation, Library of Congress Card #A 397747, April 1982.
Fozard, B., Instrumentation and Control of Nuclear Reactors. ILIFFE Books Ltd., London.
Wightman, E.J., Instrumentation in Process Control. CRC Press, Cleveland, Ohio.
Rhodes, T.J. and Carroll, G.C., Industrial Instruments for Measurement and Control. Second Edition, McGraw-Hill Book Company.
Process Measurement Fundamentals. Volume I, General Physics Corporation, ISBN 0-87683-001-7, 1981.
IC-04 Page iv Rev. 0

Flow Detectors OBJECTIVES
TERMINAL OBJECTIVE
1.0 Given a flow instrument, RELATE the associated fundamental principles, including possible failure modes, to that instrument.
ENABLING OBJECTIVES
1.1 EXPLAIN the theory of operation of a basic head flow meter.
1.2 DESCRIBE the basic construction of the following types of head flow detectors: a. Orifice plates b. Venturi tube c. Dall flow tube d. Pitot tube
1.3 DESCRIBE the following types of mechanical flow detectors, including the basic construction and theory of operation. a. Rotameter b. Nutating Disk
1.4 DESCRIBE density compensation of a steam flow instrument to include the reason density compensation is required and the parameters used.
1.5 Given a block diagram of a typical flow detection device, STATE the purpose of the following blocks: a. Differential pressure (AP) transmitter b. Extractor c. Indicator
1.6 STATE the three environmental concerns which can affect the accuracy and reliability of flow sensing instrumentation.
Rev. 0 Page V IC-04

Flow Detectors
Intentionally Left Blank
IC-04 Page vi Rev. 0

Flow Detectors HEAD FLOWMETERS
HEAD FLOW METERS
Flow measurement is an important process measurement to be considered in operating a facility's fluid systems. For efficient and economic operation of these fluid systems, flow measurement is necessary.
EO 1.1 EXPLAIN the theory of operation of a basic head flow meter.
EO 1.2 DESCRIBE the basic construction of the following types of head flow detectors: a. Orifice plates b. Venturi tube c. Dall flow tube d. Pitot tube
Head flow meters operate on the principle of placing a restriction in the line to cause a differential pressure head. The differential pressure, which is caused by the head, is measured and converted to a flow measurement. Industrial applications of head flow meters incorporate a pneumatic or electrical transmitting system for remote readout of flow rate. Generally, the indicating instrument extracts the square root of the differential pressure and displays the flow rate on a linear indicator.
There are two elements in a head flow meter; the primary element is the restriction in the line, and the secondary element is the differential pressure measuring device. Figure 1 shows the basic operating characteristics of a head flow meter.
Figure 1 Head Flow Meter
Restriction
Flo*-
Manometer'
Pressure DifferenticI
Rev. 0 Page 1 IC-04

HEAD FLOWMETERS Flow Detectors
The flowpath restriction, such as an orifice, causes a differential pressure across the orifice. This pressure differential is measured by a mercury manometer or a differential pressure detector. From this measurement, flow rate is determined from known physical laws.
The head flow meter actually measures volume flow rate rather than mass flow rate. Mass flow rate is easily calculated or computed from volumetric flow rate by knowing or sensing temperature and/or pressure. Temperature and pressure affect the density of the fluid and, therefore, the mass of fluid flowing past a certain point. If the volumetric flow rate signal is compensated for changes in temperature and/or pressure, a true mass flow rate signal can be obtained. In Thermodynamics it is described that temperature and density are inversely proportional, while pressure and density are directly proportional. To show the relationship between temperature or pressure, the mass flow rate equation is often written as either Equation 4-1 or 4-2.
(4-1)
(4-2)
m
rii
where
m A AP P T K
= KAv/AP(P)
= KAv/AP(l/T)
= mass flow rate (Ibm/sec) = area (ft') = differential pressure (Ibf/ft̂ ) = pressure (Ibf/ft̂ ) = temperature (°F) = flow coefficient
The flow coefficient is constant for the system based mainly on the construction characteristics of the pipe and type of fluid flowing through the pipe. The flow coefficient in each equation contains the appropriate units to balance the equation and provide the proper units for the resulting mass flow rate. The area of the pipe and differential pressure are used to calculate volumetric flow rate. As stated above, this volumetric flow rate is converted to mass flow rate by compensating for system temperature or pressure.
IC-04 Page 2 Rev. 0

Flow Deteaors HEAD FLOWMETERS
Orifice Plate
The orifice plate is the simplest of the flowpath restrictions used in flow detection, as well as the most economical. Orifice plates are flat plates 1/16 to 1/4 inch thick. They are normally mounted between a pair of flanges and are installed in a straight run of smooth pipe to avoid disturbance of flow patterns from fittings and valves.
Three kinds of orifice plates are used: concentric, eccentric, and segmental (as shown in Figure 2).
The concentric orifice plate is the most common of the three types. As shown, the orifice is equidistant (concentric) to the inside diameter of the pipe. Flow through a sharp-edged orifice plate is characterized by a change in velocity. As the fluid passes through the orifice, the fluid converges, and the velocity of the fluid increases to a maximum value. At this point, the pressure is at a minimum value. As the fluid diverges to fill the entire pipe area, the velocity decreases back to the original value. The pressure increases to about 60% to 80% of the original input value. The pressure loss is irrecoverable; therefore, the output pressure will always be less than the input pressure. The pressures on both sides of the orifice are measured, resulting in a differential pressure which is proportional to the flow rate.
Segmental and eccentric orifice plates are functionally identical to the concentric orifice. The circular section of the segmental orifice is concentric with the pipe. The segmental portion of the orifice eliminates damming of foreign materials on the upstream side of the orifice when mounted in a horizontal pipe. Depending on the type of fluid, the segmental section is placed on either the top or bottom of the horizontal pipe to increase the accuracy of the measurement.
Eccentric orifice plates shift the edge of the orifice to the inside of the pip)e wall. This design also prevents upstream damming and is used in the same way as the segmental orifice plate.
Orifice plates have two distinct disadvantages; they cause a high permanent pressure drop (outlet pressure will be 60% to 80% of inlet pressure), and they are subject to erosion, which will eventually cause inaccuracies in the measured differential pressure.
Concentric Eccentric Segmental
Figure 2 Orifice Plates
Rev. 0 Page 3 IC-04
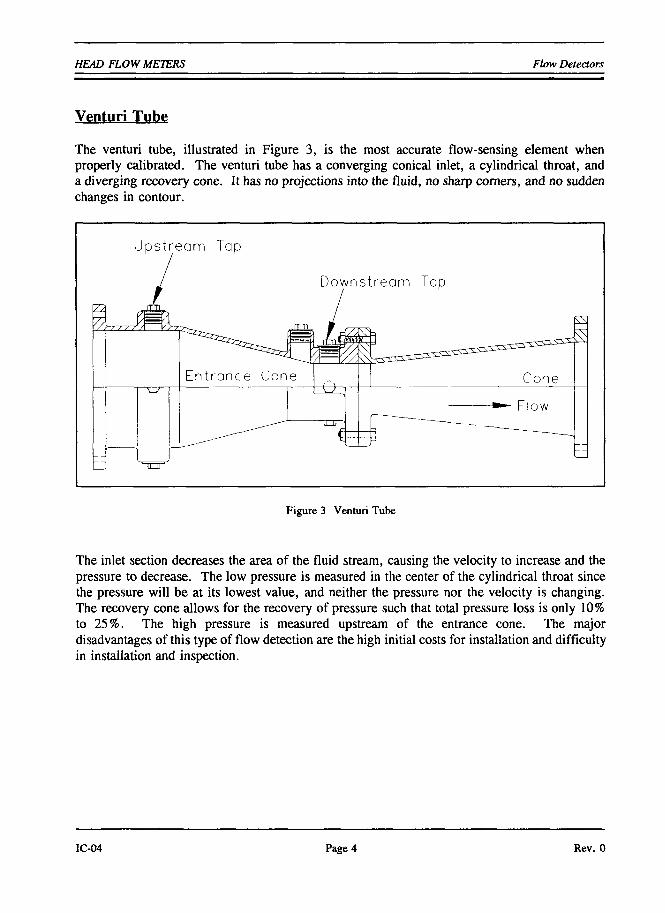
HEAD FLOW METERS Flow Deteaors
Venturi Tube
The venturi tube, illustrated in Figure 3, is the most accurate flow-sensing element when properly calibrated. The venturi tube has a converging conical inlet, a cylindrical throat, and a diverging recovery cone. It has no projections into the fluid, no sharp comers, and no sudden changes in contour.
Figure 3 Venturi Tube
The inlet section decreases the area of the fluid stream, causing the velocity to increase and the pressure to decrease. The low pressure is measured in the center of the cylindrical throat since the pressure will be at its lowest value, and neither the pressure nor the velocity is changing. The recovery cone allows for the recovery of pressure such that total pressure loss is only 10% to 25%. The high pressure is measured upstream of the entrance cone. The major disadvantages of this type of flow detection are the high initial costs for installation and difficulty in installation and inspection.
IC-04 Page 4 Rev. 0

Flow Deteaors HEAD FLOWMETERS
Dall Flow Tube
The dall flow tube, illustrated in Figure 4, has a higher ratio of pressure developed to pressure lost than the venturi flow tube. It is more compact and is commonly used in large flow applications. The tube consists of a short, straight inlet section followed by an abrupt decrease in the inside diameter of the tube. This section, called the inlet shoulder, is followed by the converging inlet cone and a diverging exit cone. The two cones are separated by a slot or gap between the two cones. The low pressure is measured at the slotted throat (area between the two cones). The high pressure is measured at the upstream edge of the inlet shoulder.
Figure 4 Dall Flow Tube The dall flow tube is available in medium to very large sizes. In the large sizes, the cost is normally less than that of a venturi flow tube. This type of flow tube has a pressure loss of about 5%. Flow rate and pressure drop are related as shown in Equation 4-3.
Kx/AP (4-3)
where
V = volumetric flow rate K = constant derived from the mechanical parameters of the primary elements AP = differential pressure
Rev. 0 Page 5 IC-04
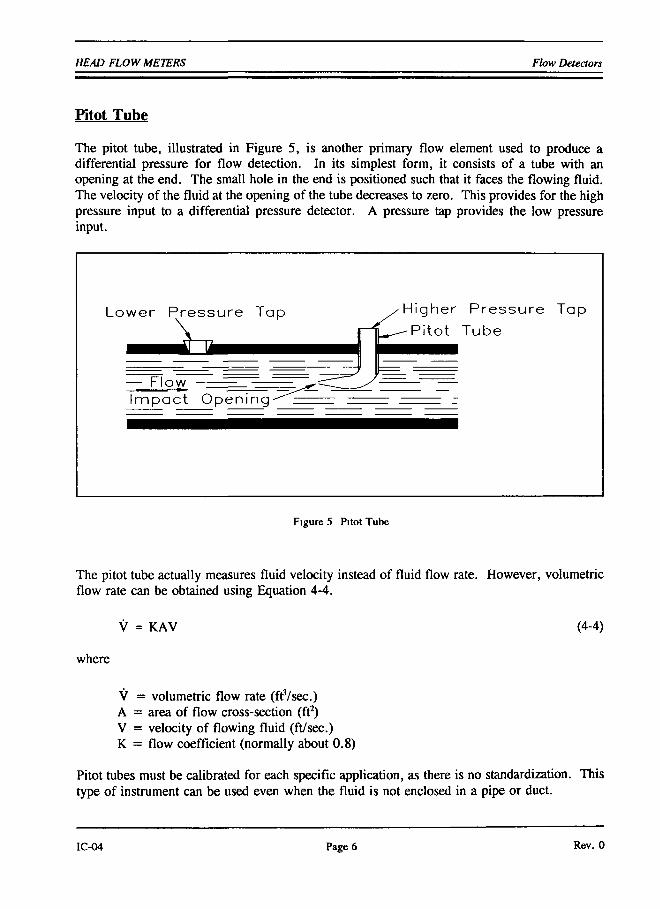
HEAD FLOWMETERS Flow Deteaors
Pitot Tube
The pitot tube, illustrated in Figure 5, is another primary flow element used to produce a differential pressure for flow detection. In its simplest form, it consists of a tube with an opening at the end. The small hole in the end is positioned such that it faces the flowing fluid. The velocity of the fluid at the opening of the tube decreases to zero. This provides for the high pressure input to a differential pressure detector. A pressure tap provides the low pressure input.
Lower P ressu re Tap
— Flow I m p a c t Open ing
Higher P ressu re Tap
P i to t Tube
Figure 5 Pitot Tube
The pitot tube actually measures fluid velocity instead of fluid flow rate. However, volumetric flow rate can be obtained using Equation 4-4.
KAV (4-4)
where
V = volumetric flow rate (ft'/sec.) A = area of flow cross-section (ft̂ ) V = velocity of flowing fluid (ft/sec.) K = flow coefficient (normally about 0.8)
Pitot tubes must be calibrated for each specific application, as there is no standardization. This type of instrument can be used even when the fluid is not enclosed in a pipe or duct.
IC-04 Page 6 Rev. 0

Flow Detectors HEAD FLOWMETERS
Summary
Head flow meters operate on the principle of placing a restriction in the line to cause a pressure drop. The differential pressure which is caused by the head is measured and converted to a flow measurement. The basic construction of various types of head flow detectors is summarized below.
Head Flow Meter Construction Summary
Orifice plates
• Flat plates 1/16 to 1/4 in. thick • Mounted between a pair of flanges • Installed in a straight run of smooth pipe to avoid disturbance of flow patterns
due to fittings and valves
Venturi tube
• Converging conical inlet, a cylindrical throat, and a diverging recovery cone • No projections into the fluid, no sharp corners, and no sudden changes in
contour
Dall flow tube
• Consists of a short, straight inlet section followed by an abrupt decrease in the inside diameter of the tube
• Inlet shoulder followed by the converging inlet cone and a diverging exit cone • Two cones separated by a slot or gap between the two cones
Pitot tube
Consists of a tube with an opening at the end Small hole in the end positioned so that it faces the flowing fluid
Rev. 0 Page? IC-04

OTHER FLOWMETERS Flow Deteaors
OTHER FLOW METERS
Two other types of mechanical flow meters which can be used are the area flow and displacement meters. In addition, there exists much more sophisticated techniques for measurement of flow rate than use of differential pressure devices, such as anemometry, magnetic, and ultrasonic.
EO 1.3 DESCRIBE the following types of mechanical flow detectors, including the basic construction and theory of operation. a. Rotameter b. Nutating Disk
Area Flow Meter
The head causing the flow through an area meter is relatively constant such that the rate of flow is directiy proportional to the metering area. The variation in area is produced by the rise and fall of a floating element. This type of flow meter must be mounted so that the floating element moves vertically and friction is minimal.
Rotameter
The rotameter, illustrated in Figure 6, is an area flow meter so named because a rotating float is the indicating element.
The rotameter consists of a metal float and a conical glass tube, constructed such that the diameter increases with height. When there is no fluid passing through the rotameter, the float rests at the bottom of the tube. As fluid enters the tube, the higher density of the float will cause the float to remain on the bottom. The space between the float and the tube allows for flow past the float. As flow increases in the tube, the pressure drop increases. When the pressure drop is sufficient, the float will rise to indicate the amount of flow. The higher the flow rate the greater the pressure drop. The higher the pressure drop the farther up the tube the float rises.
Figure 6 Rotameter
IC-04 Page 8 Rev. 0

Flow Deteaors OTHER FLOWMETERS
The float should stay at a constant position at a constant flow rate. With a smooth float, fluctuations appear even when flow is constant. By using a float with slanted slots cut in the head, the float maintains a constant position with respect to flow rate. This type of flow meter is usually used to measure low flow rates.
Displacement Meter
In a displacement flow meter, all of the fluid passes through the meter in almost completely isolated quantities. The number of these quantities is counted and indicated in terms of volume or weight units by a register.
Nutating Disk
The most common type of displacement flow meter is the nutating disk, or wobble plate meter. A typical nutating disk is shown in Figure 7.
KSSSS
Inlet
wvvvvw^vwvvvwwV
Shaft Nutating
Hole Disk
\
KSSSSSSS
, \ \ \ \ \ \ '
\V \ \ \ \ \ \ \ \ \ \V \V\ \ \^V\^ \ \ \ ^V^VM Outlet
Figure 7 Nutating Disk
This type of flow meter is normally used for water service, such as raw water supply and evaporator feed. The movable element is a circular disk which is attached to a central ball. A shaft is fastened to the ball and held in an inclined position by a cam or roller. The disk is mounted in a chamber which has spherical side walls and conical top and bottom surfaces. The fluid enters an opening in the spherical wall on one side of the partition and leaves through the other side. As the fluid flows through the chamber, the disk wobbles, or executes a nutating motion. Since the volume of fluid required to make the disc complete one revolution is known, the total flow through a nutating disc can be calculated by multiplying the number of disc rotations by the known volume of fluid.
Rev. 0 Page 9 IC-04

OTHER FLOWMETERS Flow Deteaors
To measure this flow, the motion of the shaft generates a cone with the point, or apex, down. The top of the shaft operates a revolution counter, through a crank and set of gears, which is calibrated to indicate total system flow. A variety of accessories, such as automatic count resetting devices, can be added to the fundamental mechanism, which perform functions in addition to measuring the flow.
Hot-Wire Anemometer
The hot-wire anemometer, principally used in gas flow measurement, consists of an electrically heated, fine platinum wire which is immersed into the flow. As the fluid velocity increases, the rate of heat flow from the heated wire to the flow stream increases. Thus, a cooling effect on the wire electrode occurs, causing its electrical resistance to change. In a constant-current anemometer, the fluid velocity is determined from a measurement of the resulting change in wire resistance. In a constant-resistance anemometer, fluid velocity is determined from the current needed to maintain a constant wire temperature and, thus, the resistance constant.
Electromagnetic Flowmeter
The electromagnetic flowmeter is similar in principle to the generator. The rotor of the generator is replaced by a pipe placed between the poles of a magnet so that the flow of the fluid in the pipe is normal to the magnetic field. As the fluid flows through this magnetic field, an electromotive force is induced in it that will be mutually normal (perpendicular) to both the magnetic field and the motion of the fluid. This electromotive force may be measured with the aid of electrodes attached to the pipe and connected to a galvanometer or an equivalent. For a given magnetic field, the induced voltage will be proportional to the average velocity of the fluid. However, the fluid should have some degree of electrical conductivity.
Ultrasonic Flow Equipment
Devices such as ultrasonic flow equipment use the Doppler frequency shift of ultrasonic signals reflected from discontinuities in the fluid stream to obtain flow measurements. These discontinuities can be suspended solids, bubbles, or interfaces generated by turbulent eddies in the flow stream. The sensor is mounted on the outside of the pipe, and an ultrasonic beam from a piezoelectric crystal is transmitted through the pipe wall into the fluid at an angle to the flow stream. Signals reflected off flow disturbances are detected by a second piezoelectric crystal located in the same sensor. Transmitted and reflected signals are compared in an electrical circuit, and the corresponding frequency shift is proportional to the flow velocity.
IC-04 Page 10 Rev. 0

Flow Detectors OTHER FLOWMETERS
Summary
The basic construction and theory of operation of rotameters, nutating disks, anemometers, electromagnetic flow meters, and ultrasonic flow equipment are summarized below.
Other Flow Meters Summary
Rotameter
• Consists of a metal float and a conical glass tube • Tube diameter increases with height • High density float will remain on the bottom of tube with no flow • Space between the float and the tube allows for flow past the float • As flow increases, the pressure drop increases, when the pressure drop is
sufficient, the float rises to indicate the amount of flow
Nutating Disc
• Circular disk which is attached to a central ball • A shaft is fastened to the ball and held in an inclined position by a cam, or
roller • Fluid enters an opening in the spherical wall on one side of the partition and
leaves through the other side • As the fluid flows through the chamber, the disk wobbles, or executes a nutating
motion
Hot-Wire Anemometer
• Electrically heated, fine platinum wire immersed in flow • Wire is cooled as flow is increased • Measure either change in wire resistance or heating current to determine flow
Electromagnetic Flowmeter
• Magnetic field established around system pipe • Electromotive force induced in fluid as it flows through magnetic field • Electromotive force measured with electrodes and is proportional to flow rate
Ultrasonic Flow equipment
• Uses Doppler frequency shift of ultrasonic signals reflected off discontinuities in fluid
Rev. 0 Page 11 IC-04

STEAM FLOW DETECTION Flow Detectors
STEAM FLOW DETECTION
Steam flow detection is normally accomplished through the use of a steam flow nozzle.
£ 0 1.4 DESCRIBE density compensation of a steam flow instrument to include the reason density compensation is required and the parameters used.
The flow nozzle is commonly used for the measurement of steam flow and other high velocity fluid flow measurements where erosion may occur. It is capable of measuring approximately 60% higher flow rates than an orifice plate with the same diameter. This is due to the streamlined contour of the throat, which is a distinct advantage for the measurement of high velocity fluids. The flow nozzle requires less straight run piping than an orifice plate. However, the pressure drop is about the same for both. A typical flow nozzle is shown in Figure 8.
Figure 8 Flow Nozzle
IC-04 Page 12 Rev. 0

Flow Detectors STEAM FLOW DETECTION
Since steam is considered to be a gas, changes in pressure and temperature greatly affect its density. Equations 4-5 and 4-6 list the fundamental relationship for volumetric flow and mass flow.
V = K,
and
head loss, ,. ,, h (4-5) N P
til = Vp (4-6)
where
V = volumetric flow K = constant relating to the ratio of pipe to orifice h = differential pressure p = density til = mass flow
It is possible to substitute for density in the relationship using Equation 4-7.
„ = ?•" (4-7) Re
where
p = density p = upstream pressure m = molecular weight of the gas 6 = absolute temperature R = gas constant
By substituting for density, the values are used by the electronic circuit to calculate the density automatically. Since steam temperature is relatively constant in most steam systems, upstream pressure is the only variable in the above equation that changes as the system operates. If the other variables are hardwired, measuring the system pressure is all that is required for the electronics to calculate the fluid's density.
Rev. 0 Page 13 IC-04

STEAM FLOW DETECTION Flow Detectors
As the previous equations demonstrate, temperature and pressure values can be used to electronically compensate flow for changes in density. A simple mass flow detection system is illustrated by Figure 9 where measurements of temperature and pressure are made with commonly used instruments.
Tetnp v^ Press Differential
^ Pressure (or Flow^)
X Multiplier
F2X T bquore
Root Extractor
las True Mass Flow
Figure 9 Simple Mass Flow Detection System
For the precise measurement of gas flow (steam) at varying pressures and temperatures, it is necessary to determine the density, which is pressure and temperature dependent, and from this value to calculate the actual flow. The use of a computer is essential to measure flow with changing pressure or temperature. Figure 10 illustrates an example of a computer specifically designed for the measurement of gas flow. The computer is designed to accept input signals from commonly used differential pressure detectors, or from density or pressure plus temperature sensors, and to provide an output which is proportional to the actual rate of flow. The computer has an accuracy better than +.0.1% at flow rates of 10% to 100%.
IC-04 Page 14 Rev. 0

Flow Detectors STEAM FLOW DETECTION
Pressure Transmitter
H Differential Pressure
Pressure Transmitter
P Absolute Pressure
Density Transmitter
W
Spec Grav
Transm G
f ic
t y i t ter
Compute
Ho ld '
External Contacts
Stopped Flow Circuit at 1 to 10% of AP or Q
Temperature Transmitter
T Absolute
Indicator lamp
Summing &c Current
Output Amplifiers
Flow Rate Indicator
Current "Output
Voltage to Frequency Converter
'> 10 1 IFIOW Range I Divider
Counter Trigger
Multiple Flow Rate
Counter
0 to 1/10pps
External Contacts
Moke Every 1000 5f t^ -
s
Totalized Flow Rate
Counter Sft^xlO^
0 to 0 - 1 / 1 pps '
0 to 0 - 0 1 pps
Flow Range Selection
Figure 10 Gas Flow Computer
Rev. 0 Page 15 IC-04
STEAM FLOW DETECTION Flow Detectors
Summary
Density compensation is summarized below.
Density Compensation Summary
• Changes in temperature and pressure greatly affect indicated steam flow.
• By measuring temperature and pressure, a computerized system can be used to electronically compensate a steam or gas flow indication for changes in fluid density.
IC-04 Page 16 Rev. 0

Flow Detectors FLOW CIRCUITRY
FLOW CIRCUITRY
The primary elements provide the input to the secondary element which provides for indications, alarms, and controls.
EO 1.5 Given a block diagram of a typical flow detection device, STATE the purpose of the following blocks: a. Differential pressure (DP) transmitter b. Extractor c. Indicator
EO 1.6 STATE the three environmental concerns which can affect the accuracy and reliability of flow sensing instrumentation.
Circuitry
Figure 11 shows a block diagram of a typical differential pressure flow detection circuit. The DP transmitter operation is dependent on the pressure difference across an orifice, venturi, or flow tube. This differential pressure is used to position a mechanical device such as a bellows. The bellows acts against spring pressure to reposition the core of a differential transformer. The transformer's output voltage on each of two secondary windings varies with a change in flow.
D/P Transmitter (Transducer)
H /P
L/P
E y <tracto r Ir dicotor
Figure 11 Differential Pressure Flow Detection Block Diagram
Rev. 0 Page 17 IC-04

FLOW CIRCUITRY Flow Detectors
A loss of differential pressure integrity of the secondary element, the DP transmitter, will introduce an error into the indicated flow. This loss of integrity implies an impaired or degraded pressure boundary between the high-pressure and low-pressure sides of the transmitter. A loss of differential pressure boundary is caused by anything that results in the high- and low-pressure sides of the DP transmitter being allowed to equalize pressure.
As previously discussed, flow rate is proportional to the square root of the differential pressure. The extractor is used to electronically calculate the square root of the differential pressure and provide an output proportional to system flow. The constants are determined by selection of the appropriate electronic components.
The extractor output is amplified and sent to an indicator. The indicator provides either a local or a remote indication of system flow.
Use of Flow Indication
The flow of liquids and gases carries energy through the piping system. In many situations, it is very important to know whether there is flow and the rate at which the flow is occurring. An example of flow that is important to a facility operator is equipment cooling flow. The flow of coolant is essential in removing the heat generated by the system, thereby preventing damage to the equipment. Typically, flow indication is used in protection systems and control systems that help maintain system temperature.
Another method of determining system coolant flow is by using pump differential pressure. If all means of flow indication are lost, flow can be approximated using pump differential pressure. Pump differential pressure is proportional to the square of pump flow.
Environmental Concerns
As previously discussed, the density of the fluid whose flow is to be measured can have a large effect on flow sensing instrumentation. The effect of density is most important when the flow sensing instrumentation is measuring gas flows, such as steam. Since the density of a gas is directly affected by temperature and pressure, any changes in either of these parameters will have a direct effect on the measured flow. Therefore, any changes in fluid temperature or pressure must be compensated for to achieve an accurate measurement of flow.
Ambient temperature variations will affect the accuracy and reliability of flow sensing instrumentation. Variations in ambient temperature can directly affect the resistance of components in the instrumentation circuitry, and, therefore, affect the calibration of electric/electronic equipment. The effects of temperature variations are reduced by the design of the circuitry and by maintaining the flow sensing instrumentation in the proper environment.
The presence of humidity will also affect most electrical equipment, especially electronic equipment. High humidity causes moisture to collect on the equipment. This moisture can
IC-04 Page 18 Rev. 0

Flow Detectors FLOW CIRCUITRY
cause short circuits, grounds, and corrosion, which, in turn, may damage components. The effects due to humidity are controlled by maintaining the equipment in the proper environment.
Summary
The density of the fluid, ambient temperature, and humidity are the three factors which can affect the accuracy and reliability of flow sensing instrumentation. The purpose of each block of a typical differential pressure flow detection circuit is summarized below.
Flow Circuitry Summary
The differential pressure is used by the DP transmitter to provide an output proportional to the flow.
The extractor is used to electronically calculate the square root of the differential pressure and to provide an output proportional to system flow.
The indicator provides either a local or a remote indication of system flow.
Rev. 0 Page 19 IC-04
Flow Detectors
Intentionally Left Blank
IC-04 Page 20 Rev. 0

Department of Energy Fundamentals Handbook
INSTRUMENTATION AND CONTROL Module 5
Position Indicators

Position Indicators TABLE OF CONTENTS
TABLE OF CONTENTS
LIST OF FIGURES ii
LIST OF TABLES iii
REFERENCES iv
OBJECTIVES V
SYNCHRO EQUIPMENT 1
Synchro Equipment 1
Summary 4
SWITCHES 5
Limit Switches 5 Reed Switches 6
Summary 7
VARIABLE OUTPUT DEVICES 8
Potentiometer 8 Linear Variable Differential Transformers (LVDT) 9
Summary 10
POSITION INDICATION CIRCUITRY 11
Environmental Concerns 13 Summary 13
Rev. 0 Page i • IC-05
LIST OF FIGURES Position Indicators
LIST OF FIGURES
Figure 1 Synchro Schematics 2
Figure 2 Simple Synchro System 3
Figure 3 Limit Switches 5
Figure 4 Reed Switches 6
Figure 5 Potentiometer Valve Position Indicator 8
Figure 6 Linear Variable Differential Transformer 9
Figure 7 Position Indicators 12
IC-05 Page u Rev. 0
Position Indicators LIST OF TABLES
LIST OF TABLES
NONE
Rev. 0 Page iii IC-05

REFERENCES Position Indicators
REFERENCES
Kirk, Franklin W. and Rimboi, Nicholas R., Instrumentation. Third Edition, American Technical Publishers, ISBN 0-8269-3422-6.
Academic Program for Nuclear Power Plant Personnel. Volume IV, General Physics Corporation, Library of Congress Card #A 397747, April 1982.
Fozard, B., Instrumentation and Control of Nuclear Reactors. ILIFFE Books Ltd., London.
Wightman, E.J., Instrumentation in Process Control. CRC Press, Cleveland, Ohio.
Rhodes, T.J. and Carroll, G.C., Industrial Instruments for Measurement and Control. Second Edition, McGraw-Hill Book Company.
Process Measurement Fundamentals. Volume I, General Physics Corporation, ISBN 0-87683-001-7, 1981.
IC-05 Page iv Rev. 0

Position Indicators OBJECTIVES
TERMINAL OBJECTIVE
1.0 Given a position indicating instrument, RELATE the associated fundamental principles, including possible failure modes, to that instrument.
ENABLING OBJECTIVES
1.1 DESCRIBE the synchro position indicators to include the basic construction and theory of operation.
1.2 DESCRIBE the following switch position indicators to include basic construction and theory of operation. a. Limit switches b. Reed switches
1.3 DESCRIBE the following variable output position indicators to include basic construction and theory of operation. a. Potentiometer b. Linear variable differential transformers (LVDT)
1.4 Given a diagram of a position indicator, STATE the purpose of the following components: a. Detection device b. Indicator and control circuits
1.5 STATE the two environmental concerns that can affect the accuracy and reliabiltity of position indication equipment.
Rev. 0 Page V IC-05
Position Indicators
Intentionally Left Blank
IC-05 Page vi Rev. 0
Position Indicators SYNCHRO EQUIPMENT
SYNCHRO EQUIPMENT
Position indicating instrumentation is used in DOE nuclear facilities to provide remote indication of equipment positions including control rods and major valves.
EO 1.1 DESCRIBE the synchro position indicators to include the basic construction and theory of operation.
Position indicating instrumentation is used in nuclear facilities to provide remote indication of control rod position with respect to the fully inserted position, and remote indication of the open or shut condition of important valves. This remote indication is necessary for the monitoring of vital components located within inaccessible or remote areas. Remote position indication can be used at any DOE facility, not only nuclear facilities, where valve position indication is required for safety.
Synchro Equipment
Remote indication or control may be obtained by the use of self-synchronizing motors, called synchro equipment. Synchro equipment consists of synchro units which electrically govern or follow the position of a mechanical indicator or device. An electrical synchro has two distinct advantages over mechanical indicators: (1) greater accuracy, and (2) simpler routing of remote indication.
There are five basic types of synchros which are designated according to their function. The basic types are: transmitters, differential transmitters, receivers, differential receivers, and control transformers. Figure 1 illustrates schematic diagrams used to show external connections and the relative positions of synchro windings. If the power required to operate a device is higher than the power available from a synchro, power amplification is required. Servomechanism is a term which refers to a variety of power-amplifiers. These devices are incorporated into synchro systems for automatic control rod positioning in some reactor facilities.
The transmitter, or synchro generator, consists of a rotor with a single winding and a stator with three windings placed 120 degrees apart. When the mechanical device moves, the mechanically attached rotor moves. The rotor induces a voltage in each of the stator windings based on the rotor's angular position. Since the rotor is attached to the mechanical device, the induced voltage represents the position of the attached mechanical device. The voltage produced by each of the windings is utilized to control the receiving synchro position.
Rev. 0 Page 1 IC-05
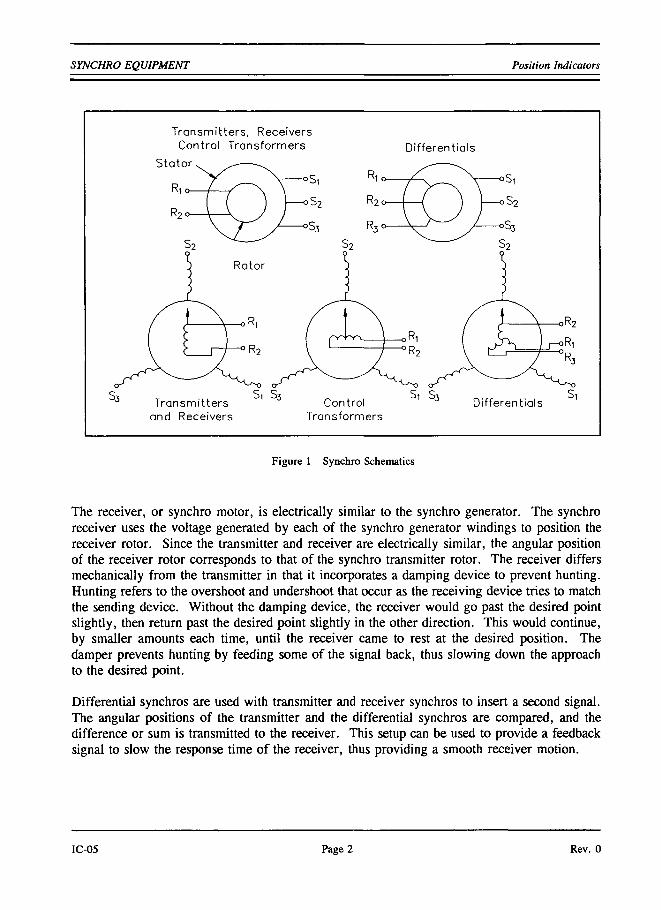
SYNCHRO EQUIPMENT Position Indicators
Figure 1 Synchro Schematics
The receiver, or synchro motor, is electrically similar to the synchro generator. The synchro receiver uses the voltage generated by each of the synchro generator windings to position the receiver rotor. Since the transmitter and receiver are electrically similar, the angular position of the receiver rotor corresponds to that of the synchro transmitter rotor. The receiver differs mechanically from the transmitter in that it incorporates a damping device to prevent hunting. Hunting refers to the overshoot and undershoot that occur as the receiving device tries to match the sending device. Without the damping device, the receiver would go past the desired point slightly, then return past the desired point slighdy in the other direction. This would continue, by smaller amounts each time, until the receiver came to rest at the desired position. The damper prevents hunting by feeding some of the signal back, thus slowing down the approach to the desired point.
Differential synchros are used with transmitter and receiver synchros to insert a second signal. The angular positions of the transmitter and the differential synchros are compared, and the difference or sum is transmitted to the receiver. This setup can be used to provide a feedback signal to slow the response time of the receiver, thus providing a smooth receiver motion.
IC-05 Page 2 Rev. 0

Position Indicators SYNCHRO EQUIPMENT
Control transformer synchros are used when only a voltage indication of angular position is desired. It is similar in construction to an ordinary synchro except that the rotor windings are used only to generate a voltage which is known as an error voltage. The rotor windings of a control transformer synchro are wound with many turns of fine wire to produce a high impedance. Since the rotor is not fed excitation voltage, the current drawn by the stator windings would be high if they were the same as an ordinary synchro; therefore, they are also wound with many turns of fine wire to prevent excessive current.
During normal operation, the output of a control transformer synchro is nearly zero (nulled) when its angular position is the same as that of the transmitter.
A simple synchro system, consisting of one synchro transmitter (or generator) connected to one synchro receiver (or motor), is shown in Figure 2.
R.
115V 60~ AC Suppty
U-,^-
/ ~ V -
rr'"̂ ^̂ LA y / -\ "— J-V_^__^
Transmitter
Sl
c
-̂̂ 3
Si
52
S3
, \ , ^ r n V V XJ \ — / ^
Receiver
• Ri
, R2
Figure 2 Simple Synchro System
When the transmitter's shaft is turned, the synchro receiver's shaft turns such that its "electrical position" is the same as the transmitter's. What this means is that when the transmitter is turned to electrical zero, the synchro receiver also turns to zero. If the transmitter is disconnected from the synchro receiver and then reconnected, its shaft will turn to correspond to the position of the transmitter shaft.
Rev. 0 Page 3 IC-05
SYNCHRO EQUIPMENT Position Indicators
Summary
Synchro equipment is summarized below.
Synchro Equipment Summary
• A basic synchro system consists of a transmitter (synchro generator) and receiver (synchro motor).
• When the transmitter's shaft is turned, the synchro motor's shaft turns such that its "electrical position" is the same as the transmitter's.
IC-05 Page 4 Rev. 0

Position Indicators SWITCHES
SWITCHES
Mechanical limit switches and reed switches provide valve open and shut indications. They also are used to determine the physical position of equipment.
EO 1.2 DESCRIBE the following switch position indicators to include basic construction and theory of operation. a. Limit switches b. Reed switches
Limit Switches
A limit switch is a mechanical device which can be used to determine the physical position of equipment. For example, an extension on a valve shaft mechanically trips a limit switch as it moves from open to shut or shut to open. The limit switch gives ON/OFF output that corresponds to valve position. Normally, limit switches are used to provide full open or full shut indications as illustrated in Figure 3.
Figure 3 Limit Switches
Many limit switches are the push-button variety. When the valve extension comes in contact with the limit switch, the switch depresses to complete, or turn on, the electrical circuit. As the valve extension moves away from the limit switches, spring pressure opens the switch, turning off the circuit.
Rev. 0 Page 5 IC-05
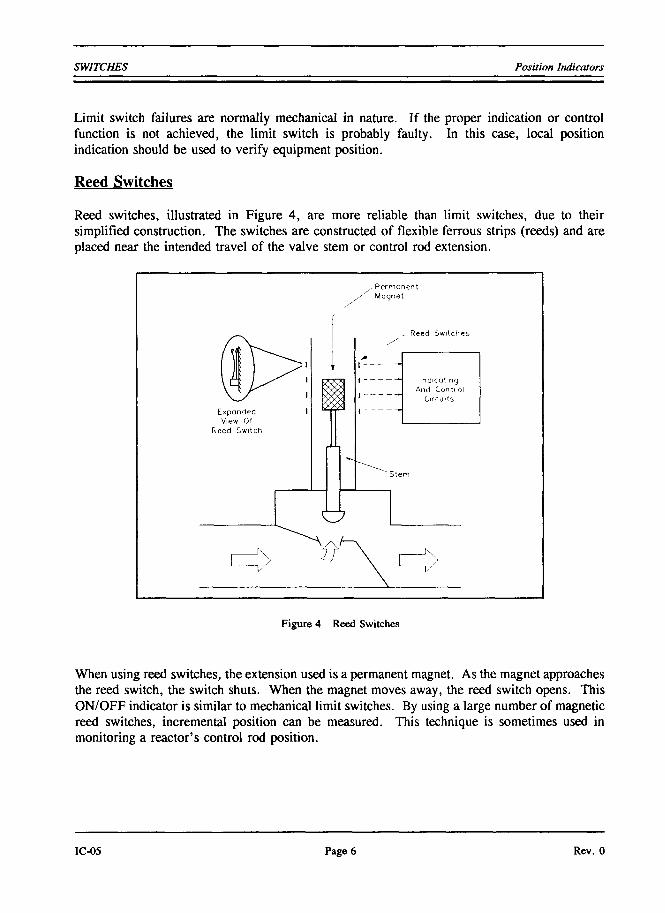
SWITCHES Position Indicators
Limit switch failures are normally mechanical in nature. If the proper indication or control function is not achieved, the limit switch is probably faulty. In this case, local position indication should be used to verify equipment position.
Reed Switches
Reed switches, illustrated in Figure 4, are more reliable than limit switches, due to their simplified construction. The switches are constructed of flexible ferrous strips (reeds) and are placed near the intended travel of the valve stem or control rod extension.
Ml \ V
^ \ ^ J>'
S / ^ ^ '
V^ • Lxpondea i View Of
Reed Switch
[z:
t
*VJ i i.
y
1 /
y Permanent y Magnet
^ Reed Switches
>
1 ~"
1
' n
And Control Cirrutts
"~Stem
\ [ IN.
V
Figure 4 Reed Switches
When using reed switches, the extension used is a permanent magnet. As the magnet approaches the reed switch, the switch shuts. When the magnet moves away, the reed switch opens. This ON/OFF indicator is similar to mechanical limit switches. By using a large number of magnetic reed switches, incremental position can be measured. This technique is sometimes used in monitoring a reactor's control rod position.
IC-05 Page 6 Rev. 0

Position Indicators SWITCHES
Failures are normally limited to a reed switch which is stuck open or stuck shut. If a reed switch is stuck shut, the open (closed) indication will be continuously illuminated. If a reed switch is stuck open, the position indication for that switch remains extinguished regardless of valve position.
Summary
Switch position indicators are summarized below.
Switch Position Indicators Summary
A limit switch is a mechanical device used to determine the physical position of valves. An extension on a valve shaft mechanically trips the switch as it moves from open to shut or shut to open. The limit switch gives ON/OFF output which corresponds to the valve position.
Reed switches are constructed of flexible ferrous strips placed near the intended travel of the valve stem or control rod extension. The extension used is a permanent magnet. As the magnet approaches the reed switch, the switch shuts. When the magnet moves away, the reed switch opens.
Rev. 0 Page 7 IC-05

VARIABLE OUTPUT DEVICES Position Indicators
VARIABLE OUTPUT DEVICES
Variable output devices provide an accurate position indication of a valve or control rod.
EO 1.3 DESCRIBE the following variable output position indicators to include basic construction and tlieory of operation. a. Potentiometer b. Linear variable differential transformers (LVDT)
Potentiometer
Potentiometer valve position indicators (Figure 5) provide an accurate indication of position throughout the travel of a valve or control rod. The extension is physically attached to a variable resistor. As the extension moves up or down, the resistance of the attached circuit changes, changing the amount of current flow in the circuit. The amount of current is proportional to the valve position.
Figure 5 Potentiometer Valve Position Indicator
Potentiometer valve position indicator failures are normally electrical in nature. An electrical short or open will cause the indication to fail at one extreme or the other. If an increase or decrease in the potentiometer resistance occurs, erratic indicated valve position occurs.
IC-05 Page 8 Rev. 0

Position Indicators VARIABLE OUTPUT DEVICES
Linear Variable Differential Transformers (LVDT)
A device which provides accurate position indication throughout the range of valve or control rod travel is a linear variable differential transformer (LVDT), illustrated in Figure 6. Unlike the potentiometer position indicator, no physical connection to the extension is required.
The extension valve shaft, or control rod, is made of a metal suitable for acting as the movable core of a transformer. Moving the extension between the primary and secondary windings of a transformer causes the inductance between the two windings to vary, thereby varying the output voltage proportional to the position of the valve or control rod extension. Figure 6 illustrates a valve whose position is indicated by an LVDT. If the open and shut position is all that is desired, two small secondary coils could be utilized at each end of the extension's travel.
LVDTs are extremely reliable. As a rule, failures are limited to rare electrical faults which cause erratic or erroneous indications. An open primary winding will cause the indication to fail to some predetermined value equal to zero differential voltage. This
. Movable Core
Primary
s
econdary 1
\ econdary 2
Indicating And Control
Circuits
'^Stem
Vy
Figure 6 Linear Variable Differential Transformer
normally corresponds to mid-stroke of the valve. A failure of either secondary winding will cause the output to indicate either full open or full closed.
Rev. 0 Page 9 IC-05
VARIABLE OUTPUT DEVICES Position Indicators
Summary
Variable output position indicators are summarized below.
Variable Position Indicator Summary
Potentiometer valve position indicators use an extension which is physically attached to a variable resistor. As the extension moves up or down, the resistance of the attached circuit changes, changing the amount of current flow in the circuit.
An LVDT uses the extension shaft or control rod as a movable core of a transformer. Moving the extension between the primary and secondary windings of a transformer causes the inductance between the two windings to vary, thereby varying the output voltage proportional to the position of the valve or control rod extension.
IC-05 Page 10 Rev. 0

Position Indicators POSITION INDICATION CIRCUITRY
POSITION INDICATION CIRCUITRY
Valve position circuitry provides indication and control Junctions.
EO 1.4 Given a diagram of a position indicator, STATE tlie purpose of the following components: a. Detection device b. Indicator and control circuits
EO 1.5 STATE the two environmental concerns which can affect the accuracy and reliability of position indication equipment.
As described above, position detection devices provide a method to determine the position of a valve or control rod. The four types of position indicators discussed were limit switches, reed switches, potentiometer valve position indicators, and LVDTs (Figure 7). Reed and limit switches act as ON/OFF indicators to provide open and closed indications and control functions. Reed switches can also be used to provide coarse, incremental position indication.
Potentiometer and LVDT position indicators provide accurate indication of valve and rod position throughout their travel. In some applications, LVDTs can be used to indicate open and closed positions when small secondary windings are used at either end of the valve stem stroke.
The indicating and control circuitry provides for remote indication of valve or rod position and/or various control functions. Position indications vary from simple indications such as a light to meter indications showing exact position.
Control functions are usually in the form of interlocks. Pump isolation valves are sometimes interlocked with the pump. In some applications, these interlocks act to prevent the pump from being started with the valves shut. The pump/valve interlocks can also be used to automatically turn off the pump if one of its isolation valves go shut or to open a discharge valve at some time interval after the pump starts.
Valves are sometimes interlocked with each other. In some systems, two valves may be interlocked to prevent both of the valves from being opened at the same time. This feature is used to prevent undesirable system flowpaths.
Control rod interlocks are normally used to prevent outward motion of certain rods unless certain conditions are met. One such interlock does not allow outward motion of control rods until the rods used to scram the reactor have been withdrawn to a predetermined height. This and all other rod interlocks ensure that the safety of the reactor remains intact.
Rev. 0 Page 11 IC-05
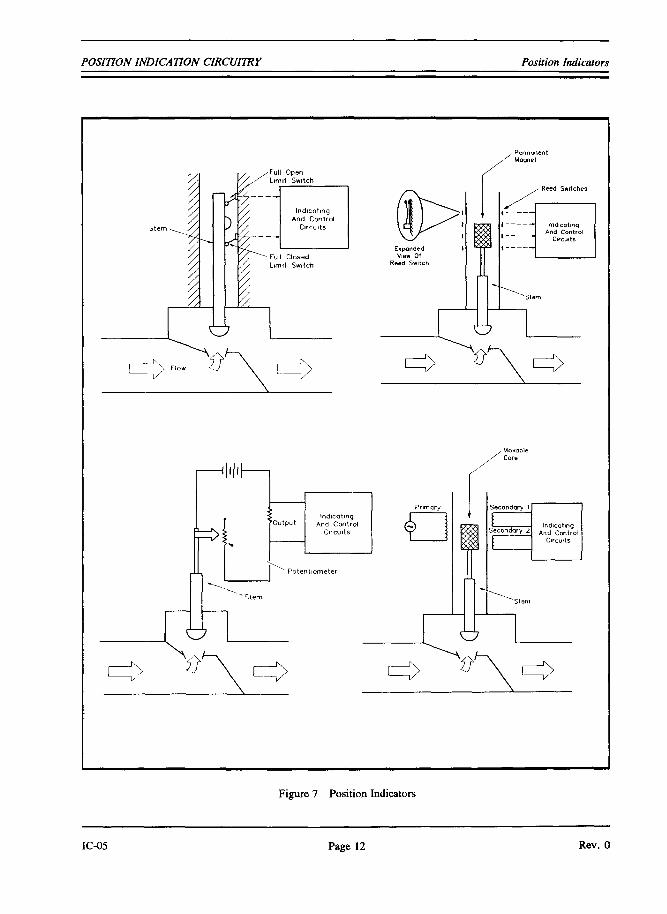
POSITION INDICATION CIRCUITRY Position Indicators
, Permonftnt Magnet
Expanded View Of
Reed Switch
\ I
- Reed Switches
Indicating And Control
Circuits
^
|̂||lh
^
C7
^ ^
Indicating And Control
Circuits
Potentiometer
f
, Movable Core
Secondary 1
\ Secondary 2
\
Indicating And Contr 1
Circuits
V
Figure 7 Position Indicators
IC-05 Page 12 Rev. 0
Position Indicators POSITION INDICATION CIRCUITRY
Environmental Concerns
Ambient temperature variations can affect the accuracy and reliability of certain types of position indication instrumentation Variations in ambient temperature can directly affect the resistance of components in the instrumentation circuitry, and, therefore, affect the calibration of electric/electronic equipment The effects of temperature variations are reduced by the design of the circuitry and by maintaining the position indication instrumentation in the proper environment, where possible
The presence of humidity will also affect most electrical equipment, especially electronic equipment High humidity causes moisture to collect on the equipment This moisture can cause short circuits, grounds, and corrosion, which, in turn, may damage components The effects due to humidity are controlled by maintaining the equipment in the proper environment, where possible
Summary
The accuracy and reliability of position indication instrumentation can be affected by ambient temperature and humidity The purposes of position indicator components are summarized below
Position Indicator Components Summary
Detection devices provide a method to determine the position of a valve or control rod
The indicating and control circuitry provides for remote indication of valve or rod position and/or various control functions
Rev 0 Page 13 IC-05

Position Irtdicators
Intentionally Left Blank
IC-05 Page 14 Rev. 0