influence of ionic strength and organic modifier concentrations on characterization of aquatic...
TRANSCRIPT

Journal of Chromatography A, 1017 (2003) 97–105
Influence of ionic strength and organic modifier concentrations oncharacterization of aquatic fulvic and humic acids byhigh-performance size-exclusion chromatography
Enamul Hoquea,∗, Manfred Wolfa, Günter Teichmanna, Ernst Pellera,Wolfgang Schimmackb, Gunnar Buckauc
a GSF-National Research Center for Environment and Health, Institute for Hydrology,Ingolstädter Landstrasse 1, D-85764 Neuherberg, Germany
b Institute for Radiation Protection, Ingolstädter Landstrasse 1, D-85764 Neuherberg, Germanyc Forschungszentrum Karlsruhe, Institut für Nukleare Entsorgungstechnik, D-76021 Karlsruhe, Germany
Received 12 March 2003; received in revised form 1 August 2003; accepted 15 August 2003
Abstract
Aquatic fulvic acid (FA) and humic acid (HA) were characterized by an aqueous high-performance size-exclusion chromatog-raphy (HPSEC) using a hydrophilic polymeric stationary phase and an aqueous eluent at neutral pH and low-ionic strength(5 mM Na2HPO4; final ionic strength, 13 mM). Employed HPSEC showed low sensitivity of FA to variations in ionic strength(13 and 100 mM) and contents of organic modifier (0.1 or 40% methanol) in aqueous eluent. Under these analytical conditions,peak maxima of relative UV signals versus molecular mass (Mr) defined asM ′
p and peak maxima of relative mass concentrationsversusMr defined asMp of FA were shown to be located at 548–690 and 500, respectively. Organic modifier concentrations of40% methanol in aqueous eluent enabled not only analysis of FA, but also analysis of some aquatic HA by HPSEC. AnalysisshowedM ′
p andMp values of aquatic HAs around 1000 and 600, respectively. Measured molecular mass data of FA were foundto be consistent with the recently published data describing low molecular masses of FA. Results recommend the use of thedescribed HPSEC as a simple, rapid, reproducible, low-cost method giving consistent molecular sizes/masses of FA and someaquatic HAs.© 2003 Elsevier B.V. All rights reserved.
Keywords: Ionic strength; Mobile phase composition; Molecular mass; Fulvic acids; Humic acids; Humic substances
1. Introduction
The ability of humic substances (HSs), e.g. to inac-tivate various pesticides and other organic pollutants
∗ Corresponding author. Tel.:+49-89-3187-2579;fax: +49-89-3187-3361.
E-mail address: [email protected] (E. Hoque).
via complexation/copolymerization[1], to influencetransport processes of organic and inorganic pollutants[2], as well as to lower bio-availability of harmfulheavy metals via complexation[3] led to world-wideinterest in research with these substances. For this pur-pose, realistic molecular masses of HSs are often re-quired for the modeling and assessment of organiccarrier-mediated migration of heavy metals as well
0021-9673/$ – see front matter © 2003 Elsevier B.V. All rights reserved.doi:10.1016/j.chroma.2003.08.038

98 E. Hoque et al. / J. Chromatogr. A 1017 (2003) 97–105
as assessment of toxicological risk potential of heavymetals in terrestrial and aquatic ecosystems (cf.[4]).
In the past, various analytical methods were de-veloped and used to characterize the HS componentsfulvic acid (FA) and humic acid (HA) (cf.[5]). Molec-ular masses/sizes of HSs were often estimated in thepast using various analytical methods. One of the mostpopular methods is the analysis by size-exclusionchromatography (SEC; cf.[6,7]) and/or HPSEC (cf.[8–10]). Due to easiness and rapidness HPSEC wasoften used for the analysis of HSs, as this method isalso thought to deliver molecular size distributions inresponse to UV signal. However, analysis of HSs bySEC or HPSEC is influenced by many parameters,as for example, type of column gel bed (stationaryphase), calibration standards, eluent, ionic strengthand organic modifier. Mostly HPSEC analysis of HSswas performed on silica-based stationary phase be-ing very sensitive to variations in ionic strength andorganic modifiers. Due to strong influences of slopesof calibration curves on relationships between molec-ular masses and hydrodynamic sizes of calibrationstandards, molecular masses of HSs determined werecontroversial in the past[11]. The hydrodynamic sizeof HSs also decreased as the pH of the aqueous elu-ent was lowered to pH 5[12]. Addition of a smallamount of CaCl2 can reduce the hydrodynamic sizewhile inducing the formation of associations withoutsubstantial aggregation[12]. The increment of ionicstrength by NaCl in the eluent led to a shift of lowermolecular size components (100–1000) to highermasses (1000–3000) while analyzing HSs by HPSEC,apparently due to aggregation[13]. A loosely boundself-association, micelle-like conformation of rela-tively small molecules of HSs in solutions similar toaggregation was also reported[14,15]. Piccolo et al.[14] and Conte and Piccolo[15] described a largeshift from high to lower molecular size of HSs whenHSs were pre-treated with organic acids.
HPSEC column was mostly calibrated in the pastusing, e.g. polystyrene sulfonate, dextran, polyacrylicacid, globular protein[6–10] as molecular size stan-dards, mostly overestimating molecular masses ofHSs. Due to intrinsic polyelectrolytic properties[16],aggregation-tendency[13–15]of HSs and dependenceof their analysis on ionic strength and hydrophobicity,a rapid, reproducible, well calibrated HPSEC methodwith high recovery rate is required to handle a large
number of samples. It should exhibit low dependenceon ionic strength and hydrophobicity of the eluent. Toachieve this goal, a careful selection of HPSEC pa-rameters (e.g. gel bed, eluent, ionic strength, organicmodifier, calibration standards) is to be developed forthe analysis of HSs.
Previously, we published first results in brief[4]about a new application of a HPSEC method[17] forthe molecular size/mass analysis of FA. Here, we de-scribe in detail selection of carboxylic acid standards,influence of ionic strengths and organic modifiers onthe molecular size/mass distributions of FA and HAby HPSEC. The suitability and reproducibility of thismethod at neutral pH for the rapid molecular size/massanalysis of FA and some HA are shown. Additionally,the method for conversion of HPSEC data of HSs intomolecular mass distribution (MMD) data is presented.
2. Experimental
2.1. Chemicals, solvents and standards
All chemicals and solvents used in the study wereof either analytical or HPLC grade and obtained fromcommercial sources (Merck, Fluka, Sigma, Aldrichand Riedel-de Haën, Germany). Polyacrylic acid andSuwannee River HSs (IHSS FA and HA) standardswere purchased from Polymer Science Labs. (TheNetherlands) and International Humic SubstancesSociety (St. Paul, USA), respectively. Polystyrenesulfonate standards were obtained from MachereyNagel (Germany).
2.2. Sampling and characterization of humicsubstances (HSs)
FA and HA were isolated from water of two peatbogs in the Dachauer Moos near Munich (FA 1.1, HA2.3.1) and Gorleben aquifer [Gohy-573(HA)]. Waterwas filtered in the field (0.3�m inorganic filter) andthe HSs were isolated in the laboratory by adsorptionon XAD-8 resin (Rohm and Haas) at pH 2. Follow-ing elution of the HSs at pH 13 and acidification topH 1, HA (insoluble at pH 1) was separated fromthe FA (soluble at pH 1) by centrifugation. Afterpurification by repeated adsorption/elution, the FAwas freeze-dried either without or after desalting on a

E. Hoque et al. / J. Chromatogr. A 1017 (2003) 97–105 99
cation-exchange resin AG MP-50 (Bio-Rad) column.The composition of the extracted HSs was about 90%FA (FA 1.1) and 10% HA, or 24% FA and 76% HA[Gohy-573(HA)]. The details are given elsewhere[18,19]. Isolated HSs were characterized by elementalanalysis, proton-exchange capacity analysis, isotopeanalysis, copper complexation properties,1H and13CNMR spectroscopy and fluorescence spectrometry[4,18–21].
2.3. Determination of molecular sizes offulvic acid
The molecular sizes of FAs were determined usingHPSEC. The results were further verified by aqueousSEC.
2.3.1. HPSECThe method was previously developed for the
analysis of water-soluble polymeric substances ofxenobiotic degradations using polystyrene sulfonate(PSS) as molecular mass calibration standards on apolymeric hydrophilic gel[17] with high tolerancesof salt concentrations up to 8 M and polar organicsolvents up to 100% (Macherey Nagel). In order toavoid overestimation of molecular sizes of the car-boxylic analyte FA, instead of frequently used PSSstandards various aliphatic and aromatic carboxylicacids including polyacrylic acid standards (PolymerLabs.) were used for molecular size calibration ofthe column after each change of eluent (see below).The discrete carboxylic compounds malic acid (Mr,134.09), benzene-1,3-dicarboxylic acid (166.13), cit-ric acid (192.13), benzene-1,2,4,5-tetracarboxylicacid (254.15), EDTA (292.25), DETPA (393.35), aswell as polyacrylic acid standardsMp 1250 and 2925were used. Effects of two different ionic strengths(13 and 100 mM) on molecular size/mass distribu-tions of HPSEC data were investigated. Addition-ally, contents of the organic modifier methanol inthe eluents were varied from 0.1 to 60%. Thus,the following aqueous eluents were used: (1) 5 mMNa2HPO4+0.1% methanol with a final ionic strengthof 13 mM (pH 7.0, adjusted with 3 N H3PO4), (2)5 mM Na2HPO4 + 0.1% methanol with a final ionicstrength of 100 mM (pH 7.0, adjusted with 3 N H3PO4and NaCl), and (3) 5 mM Na2HPO4 (pH 7.0; finalionic strength, 13 mM)+ 40% methanol. The total
permeation volume (Vp) was determined with KNO3and the void volume (V0) either with blue dextran (Mr,ca. 2× 10⁶) or with PSS standard (Mp = 780,000)[17]. Each analysis was run at least in duplicates ata flow rate of 0.5 ml/min at a constant temperatureof 30◦C. FA or HA was dissolved in the respec-tive eluent and usually a volume of 20�l containing0.4–1�g sample was injected for analysis. The UVdata (λ = 240 nm) were acquired on-line using twoHPLC systems: (1) a Hewlett-Packard HPLC system(Model HP 1090) connected to a Hewlett-Packardphotodiode array detection (DAD) system and (2) aShimadzu Inert HPLC system (Model LC-10Ai CE,Shimadzu, Germany) connected to a Shimadzu DADsystem, whereby the data from both systems wereprocessed by Shimadzu GPC software, Version 1.1,using a personal computer. Calibration curves with95% confidence limits were calculated by regressionanalysis from triplicate runs of standards (see above)after each change of eluent.
2.3.2. Aqueous SECThe SEC system (Pharmacia) consisted of a col-
umn (70 cm× 1.6 cm i.d.), a peristaltic pump (P1),a variable-wavelength monitor (Unicord VW 2251)and a fraction collector. The column was packed withSephadex G-25S (superfine) gel with a size-exclusionlimit of 5000 (Pharmacia). The eluent was usually10 mM KCl and the ionic strength of the eluent wasfurther increased to 100 mM KCl in order to assessthe effects of ionic strength on molecular size/massdistributions of HSs. The flow rate of the eluents was0.5 ml/min. The absorbance of the samples and stan-dards was recorded at 195 nm. The total volume of thecolumn was 120 ml. The void volume (V0) 44.8 ml andthe total permeation volume (Vp) 100 ml were deter-mined using blue dextran (Mr, ca. 2×10⁶) and acetone(Mr, 58.08), respectively. For molecular size calibra-tion, polyethylene glycols (PEGs) of various molecu-lar masses (Mp: 194, 200, 300, 400, 440, 600, 750, 900,1080, 1470, 1500, 2000, 3000; Macherey-Nagel andMerck) were used as standards. The reproducibility ofthe calibration values was in general±1%. Usually,18.5–185�g of FA was dissolved in the eluent anda sample volume of 500�l was injected for analysis.Calibration curves with 95% confidence limits weredetermined by regression analysis fromKd-values (cf.[17]) calculated from triplicate runs using PEGs.
100 E. Hoque et al. / J. Chromatogr. A 1017 (2003) 97–105
2.4. Calculation of molecular mass distributions
For verification of results measured by different sys-tems, relative mass concentrations versus molecularmass (Mr) of HSs were calculated from relative UVsignals and depicted againstMr (see results). Rela-tive UV signals versusMr were corrected according toEq. (1), where the SEC and HPSEC data were trans-formed to calculate the differentials to give molecularmass distributions (MMDs) corresponding toW(Mi)(cf. [22]):
W(Mi) =∣∣∣∣∣
Hi∑i=ni=1Hi
(dtR
dM
)i
∣∣∣∣∣ (1)
Here, Hi is the ith relative signal,tR the retentiontime (min) andM the uncorrected molecular mass ateach data point from calibration curves using eachtR (see above). For better verifications, the calculatedvalues were re-scaled after dtR/dMcorrections relativeto the maximum mass concentration. Peak maxima ofrelative UV signals versusMr (Da) and relative massconcentrations versusMr are defined asM ′
p andMp,respectively.
2.5. Determination of HSs recovery using HPSEC
Recovery (%) of FA and HA on the HPSEC col-umn depending on methanol concentrations in 5 mMNa2HPO4 (pH 7.0; final ionic strength, 13 mM) wasrelated to the integrated signal of HSs atλ = 240 nmwithout the column. Here, 100% recovery is definedas the peak area (integrated UV signal) of the sameconcentration of the same type of FA or HA withoutthe column.
3. Results
3.1. Molecular mass/size distribution of fulvic acid
The calibration curves logMr versustR (min) forHPSEC (various eluents, seeSection 2) and SEC (elu-ent: 10 mM KCl) systems were calculated by regres-sion analysis. The standard deviation, precision andaccuracy of the HPSEC system were<0.2,<2.9 and<7.5%, respectively[17]. As tR (or elution volume)is dependent on hydrodynamic size of analytes duringSEC or HPSEC, firstMr calculations of FA from cali-
bration curves reflect more the character of molecularsize than molecular mass. Correspondence of molec-ular size to molecular mass may show the approxima-tion of Mr to absolute molecular mass.
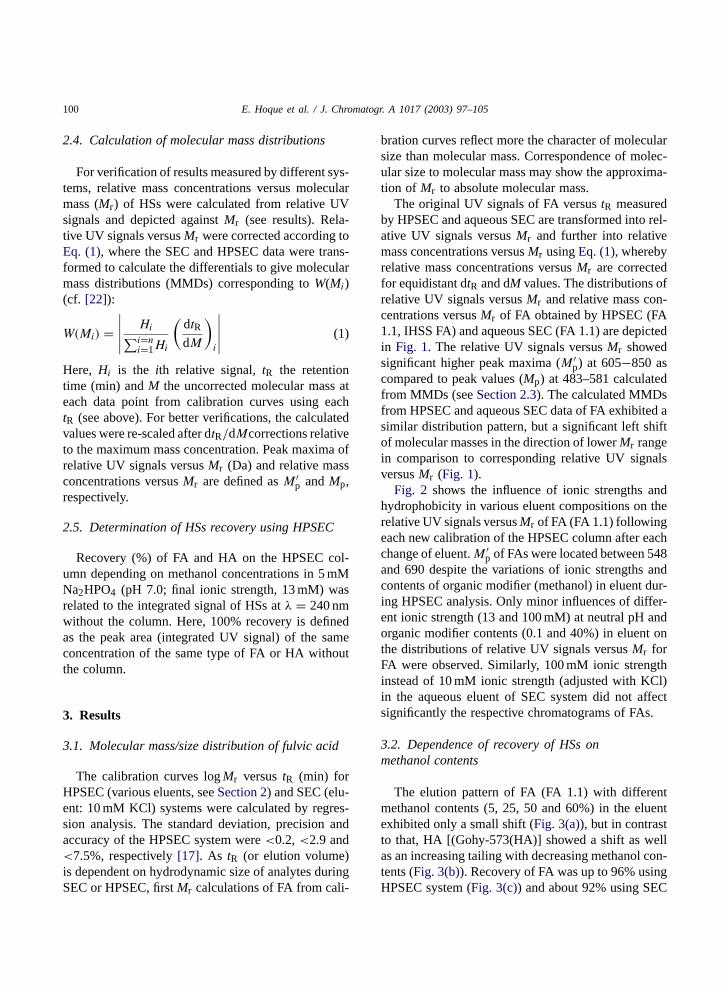
The original UV signals of FA versustR measuredby HPSEC and aqueous SEC are transformed into rel-ative UV signals versusMr and further into relativemass concentrations versusMr usingEq. (1), wherebyrelative mass concentrations versusMr are correctedfor equidistant dtR and dM values. The distributions ofrelative UV signals versusMr and relative mass con-centrations versusMr of FA obtained by HPSEC (FA1.1, IHSS FA) and aqueous SEC (FA 1.1) are depictedin Fig. 1. The relative UV signals versusMr showedsignificant higher peak maxima (M ′
p) at 605−850 ascompared to peak values (Mp) at 483–581 calculatedfrom MMDs (seeSection 2.3). The calculated MMDsfrom HPSEC and aqueous SEC data of FA exhibited asimilar distribution pattern, but a significant left shiftof molecular masses in the direction of lowerMr rangein comparison to corresponding relative UV signalsversusMr (Fig. 1).
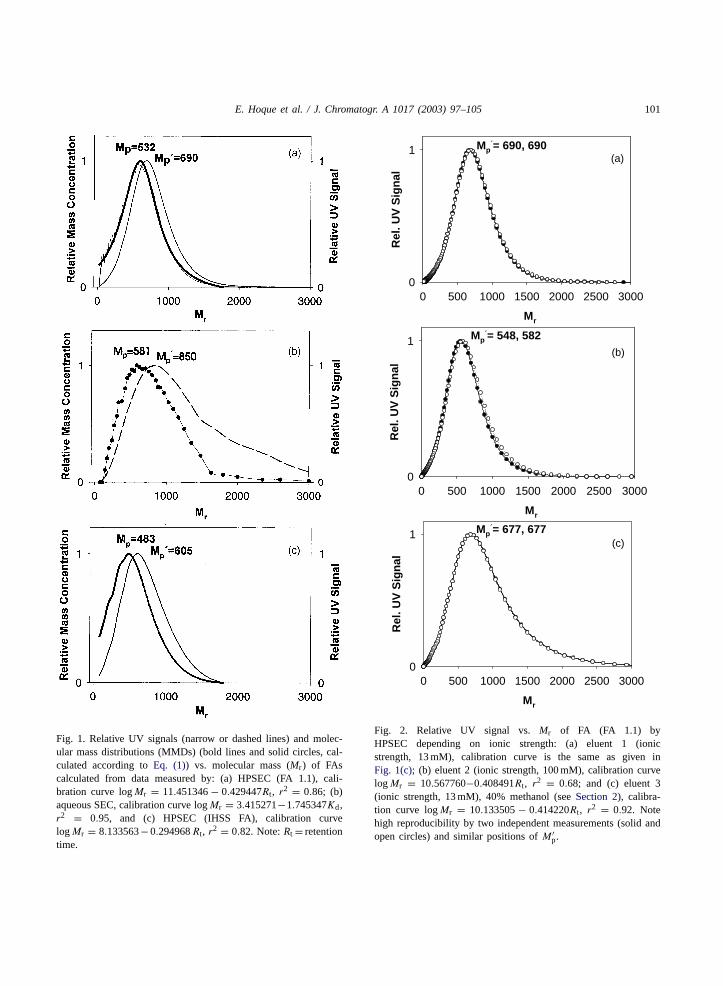
Fig. 2 shows the influence of ionic strengths andhydrophobicity in various eluent compositions on therelative UV signals versusMr of FA (FA 1.1) followingeach new calibration of the HPSEC column after eachchange of eluent.M ′
p of FAs were located between 548and 690 despite the variations of ionic strengths andcontents of organic modifier (methanol) in eluent dur-ing HPSEC analysis. Only minor influences of differ-ent ionic strength (13 and 100 mM) at neutral pH andorganic modifier contents (0.1 and 40%) in eluent onthe distributions of relative UV signals versusMr forFA were observed. Similarly, 100 mM ionic strengthinstead of 10 mM ionic strength (adjusted with KCl)in the aqueous eluent of SEC system did not affectsignificantly the respective chromatograms of FAs.
3.2. Dependence of recovery of HSs onmethanol contents
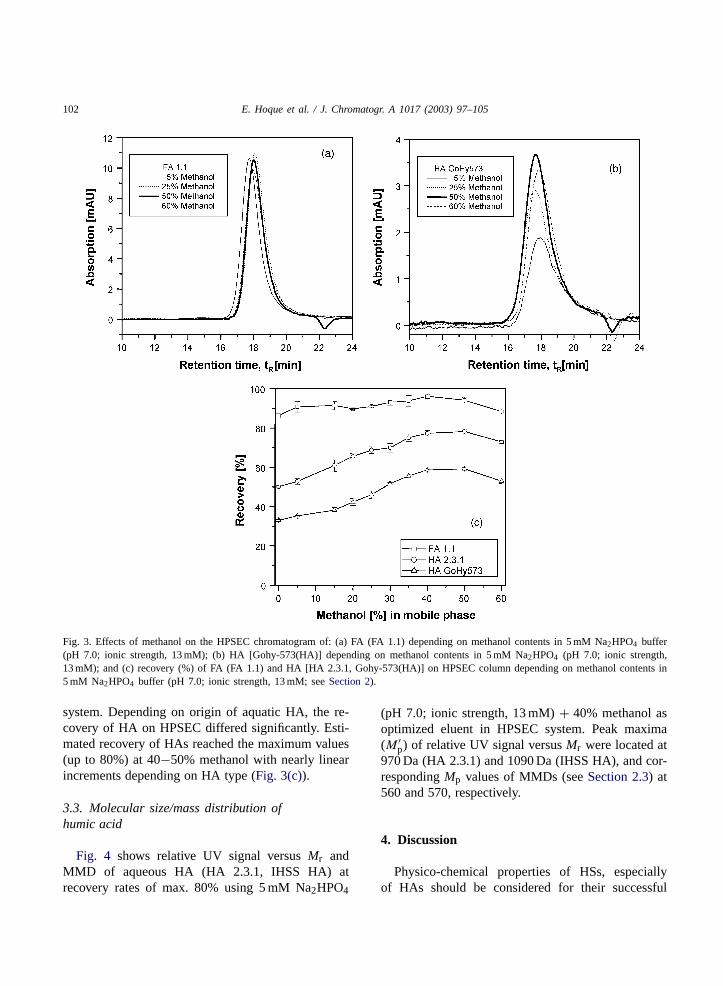
The elution pattern of FA (FA 1.1) with differentmethanol contents (5, 25, 50 and 60%) in the eluentexhibited only a small shift (Fig. 3(a)), but in contrastto that, HA [(Gohy-573(HA)] showed a shift as wellas an increasing tailing with decreasing methanol con-tents (Fig. 3(b)). Recovery of FA was up to 96% usingHPSEC system (Fig. 3(c)) and about 92% using SEC
E. Hoque et al. / J. Chromatogr. A 1017 (2003) 97–105 101
Fig. 1. Relative UV signals (narrow or dashed lines) and molec-ular mass distributions (MMDs) (bold lines and solid circles, cal-culated according toEq. (1)) vs. molecular mass (Mr) of FAscalculated from data measured by: (a) HPSEC (FA 1.1), cali-bration curve logMr = 11.451346− 0.429447Rt, r2 = 0.86; (b)aqueous SEC, calibration curve logMr = 3.415271−1.745347Kd,r2 = 0.95, and (c) HPSEC (IHSS FA), calibration curvelogMr = 8.133563−0.294968Rt, r2 = 0.82. Note:Rt = retentiontime.
Mr
0 500 1000 1500 2000 2500 3000
Rel
. UV
Sig
nal
0
1
Mr
0 500 1000 1500 2000 2500 3000
Rel
. UV
Sig
nal
0
1
Mr
0 500 1000 1500 2000 2500 3000
Rel
. UV
Sig
nal
0
1
Mp´= 690, 690
Mp´= 548, 582
Mp´= 677, 677
(a)
(b)
(c)
Fig. 2. Relative UV signal vs.Mr of FA (FA 1.1) byHPSEC depending on ionic strength: (a) eluent 1 (ionicstrength, 13 mM), calibration curve is the same as given inFig. 1(c); (b) eluent 2 (ionic strength, 100 mM), calibration curvelogMr = 10.567760−0.408491Rt, r2 = 0.68; and (c) eluent 3(ionic strength, 13 mM), 40% methanol (seeSection 2), calibra-tion curve logMr = 10.133505− 0.414220Rt, r2 = 0.92. Notehigh reproducibility by two independent measurements (solid andopen circles) and similar positions ofM ′
p.
102 E. Hoque et al. / J. Chromatogr. A 1017 (2003) 97–105
Fig. 3. Effects of methanol on the HPSEC chromatogram of: (a) FA (FA 1.1) depending on methanol contents in 5 mM Na2HPO4 buffer(pH 7.0; ionic strength, 13 mM); (b) HA [Gohy-573(HA)] depending on methanol contents in 5 mM Na2HPO4 (pH 7.0; ionic strength,13 mM); and (c) recovery (%) of FA (FA 1.1) and HA [HA 2.3.1, Gohy-573(HA)] on HPSEC column depending on methanol contents in5 mM Na2HPO4 buffer (pH 7.0; ionic strength, 13 mM; seeSection 2).
system. Depending on origin of aquatic HA, the re-covery of HA on HPSEC differed significantly. Esti-mated recovery of HAs reached the maximum values(up to 80%) at 40−50% methanol with nearly linearincrements depending on HA type (Fig. 3(c)).
3.3. Molecular size/mass distribution ofhumic acid
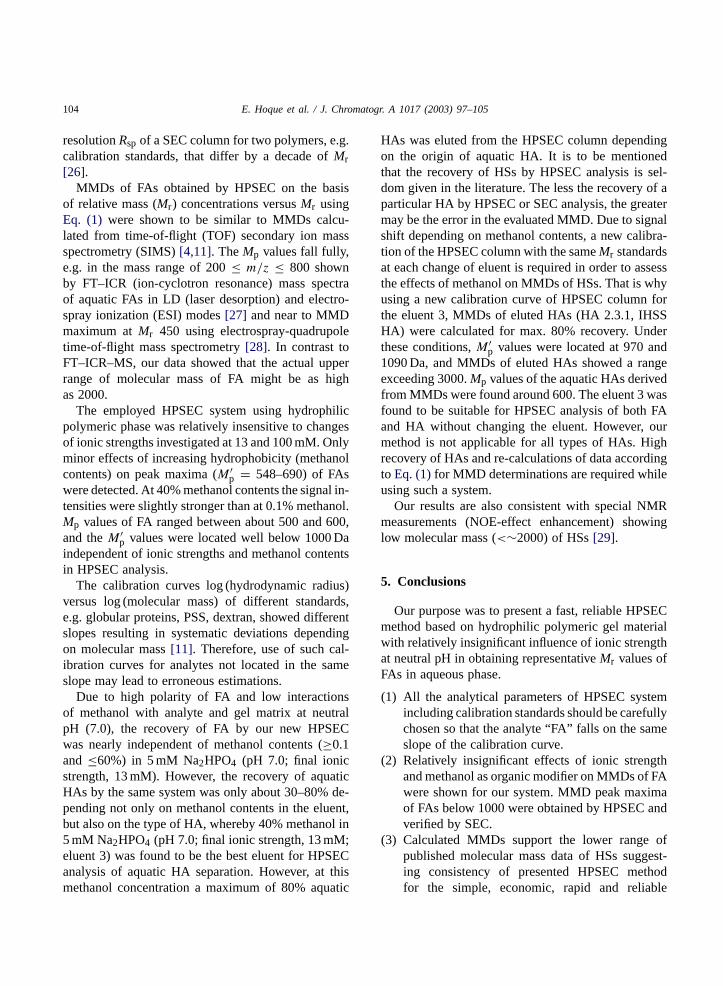
Fig. 4 shows relative UV signal versusMr andMMD of aqueous HA (HA 2.3.1, IHSS HA) atrecovery rates of max. 80% using 5 mM Na2HPO4
(pH 7.0; ionic strength, 13 mM)+ 40% methanol asoptimized eluent in HPSEC system. Peak maxima(M ′
p) of relative UV signal versusMr were located at970 Da (HA 2.3.1) and 1090 Da (IHSS HA), and cor-respondingMp values of MMDs (seeSection 2.3) at560 and 570, respectively.
4. Discussion
Physico-chemical properties of HSs, especiallyof HAs should be considered for their successful

E. Hoque et al. / J. Chromatogr. A 1017 (2003) 97–105 103
Mr
0 2000 4000 6000 8000
Rel
ativ
e M
ass
Co
nce
ntr
atio
n
0
1
0
1
Rel
ativ
e U
V S
ign
al
Mp´=1090Mp=570
Mr
0 2000 4000 6000 8000
Rel
ativ
e M
ass
Co
nce
ntr
atio
n
0
1
0
1Mp´=970
Mp=560
Rel
ativ
e U
V S
ign
al
(a)
(b)
Fig. 4. Relative UV signals (narrow lines) and molecular massdistributions (MMDs; bold lines, calculated according toEq. (1))vs. molecular mass (Mr) of HAs calculated from data measuredby HPSEC: (a) HA 2.3.1 and (b) IHSS HA at recovery rates ofmax. 80% using eluent 3 (seeFig. 3(c)). Calibration curve is thesame as given inFig. 2(c).
analysis. Generally, it is accepted that HSs have highcation-exchange capacity due to the presence of a largenumber of carboxyl and hydroxyl groups[23,24].Coulombic (ion-exchange or ion-exclusion interac-tions) and Van der Waal’s interactions including ad-sorption effects may occur between polyelectrolyticHSs and gel bed[5,6,9]. Repulsive and attractingelectrostatic forces arising from pH-dependent dis-sociations of solute molecules, the presence of ionicspecies, ion-pairing agents, etc. as well as differentionic strengths may influence stretching of solutes and,as such hydrodynamic diameters (cf.[5]). Choice ofstationary phases (gel beds) for HPSEC is an importantaspect, as some gels may exhibit non-size-exclusionbehavior requiring a careful adjustment of ionicstrength, pH, buffers, and comparable standards to
suppress the non-size-exclusion effects. Silica-basedgels with hydrophilic surfaces for HPSEC analysis ofHSs may bear a net negative charge due to the pres-ence of underivatized silanol groups and, as such givesrise to exclusion of the anionic solutes[9]. Ionic inter-actions of, e.g. glyceropropylsilyl-bonded silica-basedgels at neutral pH are almost completely neutralizedwith 83 mM ionic strengths and further more with166 mM ionic strength[9]. In contrast, polymer-basedgel beds with hydrophilic surfaces in our case donot possess underivatized silanol groups and, as suchdo not require high ionic strengths at optimum pH7.0 (cf. [17]). Perminova[25] mentioned also laterthe non-size-exclusion effects of different pH valuesother than 7.0 on the SEC behavior of HSs. Calibra-tion standards for HS analysis should be carboxylic orpolycarboxylic acids in order to be comparable withpolycarboxylic FAs and HAs to avoid overestimationof molecular sizes (cf.[4]) and deliver fast approx-imations of MMDs. Phosphate buffers rather thanbuffers with high complexing ability are preferable,as high complexing buffers may interact with, e.g. hy-droxyl groups of the analytes and, as such may changephysical–chemical properties, e.g. hydrodynamicsizes of analytes. Hydrophobicity of eluent should beadjusted to that of solutes by addition of organic mod-ifier [17] in order to achieve high recovery rate of HSsby suppression of hydrophobic adsorptions. Thesecriteria were considered in the development and theoptimization of HPSEC method described here fordeterminations of more realistic sizes/masses of HSs.
Results of HPSEC analysis of FA and HA usingthe same analytical set-up and eluents of various ionicstrengths and/or organic modifier (methanol) contentsare presented using UV detection system, as the UVsignal intensity can be related at least to a first approx-imation to the amount of HSs (cf.[5]).
Based on the ratio ofVp/(Vp − V0), which is acharacteristic constant of a SEC or HPSEC system,our HPSEC system showed about 21 and 35% higherseparation range than those of the SEC system onSephadex G-25S (superfine) (seeSection 2) and onToyopearl HW-50S[7], respectively. However, due tothe high mass transfer rate, the actual SEC resolutionpower of the HPSEC system is many times higher thanthat of any corresponding SEC system. The compar-ison of resolution of a HPSEC or SEC system usingour method is an addition to the calculation of specific
104 E. Hoque et al. / J. Chromatogr. A 1017 (2003) 97–105
resolutionRsp of a SEC column for two polymers, e.g.calibration standards, that differ by a decade ofMr[26].
MMDs of FAs obtained by HPSEC on the basisof relative mass (Mr) concentrations versusMr usingEq. (1) were shown to be similar to MMDs calcu-lated from time-of-flight (TOF) secondary ion massspectrometry (SIMS)[4,11]. TheMp values fall fully,e.g. in the mass range of 200≤ m/z ≤ 800 shownby FT–ICR (ion-cyclotron resonance) mass spectraof aquatic FAs in LD (laser desorption) and electro-spray ionization (ESI) modes[27] and near to MMDmaximum atMr 450 using electrospray-quadrupoletime-of-flight mass spectrometry[28]. In contrast toFT–ICR–MS, our data showed that the actual upperrange of molecular mass of FA might be as highas 2000.
The employed HPSEC system using hydrophilicpolymeric phase was relatively insensitive to changesof ionic strengths investigated at 13 and 100 mM. Onlyminor effects of increasing hydrophobicity (methanolcontents) on peak maxima (M ′
p = 548–690) of FAswere detected. At 40% methanol contents the signal in-tensities were slightly stronger than at 0.1% methanol.Mp values of FA ranged between about 500 and 600,and theM ′
p values were located well below 1000 Daindependent of ionic strengths and methanol contentsin HPSEC analysis.
The calibration curves log (hydrodynamic radius)versus log (molecular mass) of different standards,e.g. globular proteins, PSS, dextran, showed differentslopes resulting in systematic deviations dependingon molecular mass[11]. Therefore, use of such cal-ibration curves for analytes not located in the sameslope may lead to erroneous estimations.
Due to high polarity of FA and low interactionsof methanol with analyte and gel matrix at neutralpH (7.0), the recovery of FA by our new HPSECwas nearly independent of methanol contents (≥0.1and ≤60%) in 5 mM Na2HPO4 (pH 7.0; final ionicstrength, 13 mM). However, the recovery of aquaticHAs by the same system was only about 30–80% de-pending not only on methanol contents in the eluent,but also on the type of HA, whereby 40% methanol in5 mM Na2HPO4 (pH 7.0; final ionic strength, 13 mM;eluent 3) was found to be the best eluent for HPSECanalysis of aquatic HA separation. However, at thismethanol concentration a maximum of 80% aquatic
HAs was eluted from the HPSEC column dependingon the origin of aquatic HA. It is to be mentionedthat the recovery of HSs by HPSEC analysis is sel-dom given in the literature. The less the recovery of aparticular HA by HPSEC or SEC analysis, the greatermay be the error in the evaluated MMD. Due to signalshift depending on methanol contents, a new calibra-tion of the HPSEC column with the sameMr standardsat each change of eluent is required in order to assessthe effects of methanol on MMDs of HSs. That is whyusing a new calibration curve of HPSEC column forthe eluent 3, MMDs of eluted HAs (HA 2.3.1, IHSSHA) were calculated for max. 80% recovery. Underthese conditions,M ′
p values were located at 970 and1090 Da, and MMDs of eluted HAs showed a rangeexceeding 3000.Mp values of the aquatic HAs derivedfrom MMDs were found around 600. The eluent 3 wasfound to be suitable for HPSEC analysis of both FAand HA without changing the eluent. However, ourmethod is not applicable for all types of HAs. Highrecovery of HAs and re-calculations of data accordingto Eq. (1)for MMD determinations are required whileusing such a system.
Our results are also consistent with special NMRmeasurements (NOE-effect enhancement) showinglow molecular mass (<∼2000) of HSs[29].
5. Conclusions
Our purpose was to present a fast, reliable HPSECmethod based on hydrophilic polymeric gel materialwith relatively insignificant influence of ionic strengthat neutral pH in obtaining representativeMr values ofFAs in aqueous phase.
(1) All the analytical parameters of HPSEC systemincluding calibration standards should be carefullychosen so that the analyte “FA” falls on the sameslope of the calibration curve.
(2) Relatively insignificant effects of ionic strengthand methanol as organic modifier on MMDs of FAwere shown for our system. MMD peak maximaof FAs below 1000 were obtained by HPSEC andverified by SEC.
(3) Calculated MMDs support the lower range ofpublished molecular mass data of HSs suggest-ing consistency of presented HPSEC methodfor the simple, economic, rapid and reliable
E. Hoque et al. / J. Chromatogr. A 1017 (2003) 97–105 105
measurements of MMDs of FAs and someaquatic HAs.
Acknowledgements
The authors thank Dr. W. Szymczak for criticalreading of the manuscript, Professor K.-P. Seiler andD. Klotz for generous support of this work and D.Jurrat and V. Chanel for technical assistance.
References
[1] J.-M. Bollag, Environ. Sci. Technol. 26 (1992) 1876.[2] D. Klotz, D. Lazik, Isot. Environ. Health Stud. 31 (1995)
61.[3] P. Zitko, W.V. Carson, W.G. Carson, Bull. Environ. Contam.
Toxicol. 10 (1973) 265.[4] M. Wolf, G. Teichmann, E. Hoque, W. Szymczak, W.
Schimmack, Fresenius J. Anal. Chem. 363 (1999) 596.[5] P. Janoš, J. Chromatogr. A 983 (2003) 1.[6] R.S. Swift, A.M. Posner, J. Soil Sci. 22 (1971) 237.[7] I.V. Perminova, F.H. Frimmel, D.V. Kovalevskii, G. Abbt-
Braun, A.V. Kudryavtsev, S. Hesse, Water Res. 32 (1998)872.
[8] Y.-P. Chin, G. Aiken, E. O’Loughlin, Environ. Sci. Technol.28 (1994) 1853.
[9] J.P. Ralph, D.E.A. Catcheside, J. Chromatogr. A 724 (1996)97.
[10] D. Tonelli, R. Seeber, C. Ciavatta, C. Gessa, Fresenius J.Anal. Chem. 359 (1997) 555.
[11] M. Wolf, G. Buckau, H. Geckeis, N.M. Thang, E. Hoque,W. Szymczak, J.-I. Kim, in: E.A. Ghabbour, G. Davis (Eds.),
Humic Substances: Structures, Models and Functions, RoyalSociety of Chemistry, London, 2001, p. 51.
[12] M.E. Schimpf, M.P. Petteys, Colloids Surf. A 120 (1997) 87.[13] Y. Kaneko, W. Agui, M. Abe, K. Ogino, Yukagaku 37 (1988)
108.[14] A. Piccolo, S. Nardi, G. Concheri, Chemosphere 33 (1996)
595.[15] P. Conte, A. Piccolo, Environ. Sci. Technol. 33 (1999) 1682.[16] C.H. Lochmüller, S.S. Saavedra, Anal. Chem. 58 (1986) 1978.[17] E. Hoque, J. Chromatogr. A 708 (1995) 273.[18] M. Wolf, G. Teichmann, N. Hertkorn, Ph. Schmitt, M. Fischer,
D. Jurrat, K.-P. Seiler, Annual Report 1995, GSF-Institute ofHydrology, Neuherberg, 1996, p. 187.
[19] J.I. Kim, G. Buckau, G.H. Li, H. Duschner, N. Psarros,Fresenius J. Anal. Chem. 338 (1990) 245.
[20] G. Buckau, Ph.D. Thesis, Faculty of Chemistry, FU Berlin,1991.
[21] M. Wolf, D. Klotz, G. Teichmann, N. Hertkorn, W.Schimmack, in: Proceedings of the Series on IsotopeTechniques in the Study of Environmental Change, IAEA,Vienna, 1998, p. 888.
[22] W. Szymczak, M. Wolf, K. Wittmaack, Acta Hydrochim.Hydrobiol. 28 (2000) 350.
[23] K.C. Beck, J.H. Reuter, E.M. Perdue, Geochim. Cosmochim.Acta 38 (1974) 341.
[24] R.L. Cook, C.H. Langford, Environ. Sci. Technol. 32 (1998)719.
[25] I.V. Perminova, Soil Sci. 164 (1999) 834.[26] S. Mori, H.G. Barth, Size Exclusion Chromatography,
Springer, Berlin, 1999, p. 25.[27] A. Fievre, T. Solouki, A.G. Marshall, W.T. Cooper, Energy
Fuels 11 (1997) 554.[28] G. Plancque, B. Amekraz, V. Moulin, P. Toulhoat, C. Moulin,
Rapid Commun. Mass Spectrom. 15 (2001) 827.[29] A.J. Simpson, W.L. Kingery, M.H.B. Hayes, M. Spraul, E.
Humpfer, P. Dvortsak, R. Kerssebaum, M. Godejohann, M.Hofmann, Naturwissenschaften 89 (2002) 84.