effectivness of pnf stretching and self stretching in patients with adhesive capsulitis - a...
TRANSCRIPT

Volume 7 Number 1 January-March 2013
Published, Printed and Owned : Dr. R.K. SharmaDesigned and Printed : Devtech Publishers & Printers Pvt. Ltd., FaridabadPublished at :
Editor : Dr. R.K. Sharma, Mobile:
4 Floor, Statesman House Building,Barakhamba Road,Connaught Place,New Delhi-110 001
th
91-9971888542, Fax No: +91 11 3044 6500

Devtech Publishers & Printers Pvt. Ltd., Faridabad
Sub Editor
Kavita Behal SharmaMPT (Ortho)
4 Floor, Statesman House Building, Barakhamba Road,Connaught Place, New Delhi-110 001
th
4 Floor, Statesman House Building, Barakhamba Road,Connaught Place, New Delhi-110 001
th
Nishat Quddus, New Delhi

I
Indian Journal of Physiotherapy andOccupational Therapy
www.ijpot.com
Volume 07 Number 01 January - March 2013
1. 3 Weeks Continuous Passive Motion Vs Joint Mobilization and their Combination in ..................................................... 01Knee Stiffnes - A Comperative StudyAnil kumar, Santosh Metgud
2. Comparison of Blood Pressure and Heart Rate between Young Males and Females ......................................................... 06During Dominant and Non-Dominant Single-Leg StanceAnkita Samuel, Manish Rajput, Chhavi Gupta, Sumit Kalra
3. Effectiveness of Transcutaneous Electrical Nerve Stimulator (TENS) in Reducing ........................................................ 11Neuropathic Pain in Patients with Diabetic NeuropathyApeksha O. Yadav, G. J. Ramteke
4. Evaluation of effects of Nebulization and Breathing Control in Asthmatic Patients .......................................................... 14Kesharia, Amita Mehta
5. Effect of Neuromuscular Electrical Stimulation Combined with Cryotherapy on ............................................................. 21Spasticity and Hand Function in Patients with Spastic Cerebral PalsyChandan Kumar, Vinti
6. Phonophoresis in Continuous Mode Ultrasound has Significant effect in the Reliving .................................................... 26Pain in Upper Trapezius Tender PointChhavi Gupta, Manish Rajput, Ankita Samuel, Sumit Kalra
7. Prediction of Relationship of Visual Attention Deficits to Balance and Functional ............................................................ 31Outcome in Persons with Subacute StrokeChintan Shah, Hasmukh Patel, Komal Soni, Dhaval Desai, Harshit Soni
8. The effects of Therapeutic Application of Heat or Cold Followed by .................................................................................. 37Static Stretch on Hamstring Flexibility Post Burn ContractureEmad T. Ahmed, Safa S. Abdelkarim
9. Pulsed Electromagnetic Therapy Improves Functional Recovery in Children with Erb's Palsy ...................................... 42Reda Sarhan, Enas Elsayed, Eman Samir Fayez
10. Effectiveness of PNF Stretching and Self Stretching in Patients with Adhesive .................................................................. 47Capsulitis - A Comparative StudyHarshit Mehta, Paras Joshi, Hardik Trambadia
11. Effect of Modified Hold-Relax and Active Warm-Up on Hamstring Flexibility ................................................................. 52Swapnil U Ramteke, Hashim Ahmed, Virenderpal Singh, Piyush Singh
12. A Comparative Study of effectiveness between Superficial Heat and Deep Heat along with .......................................... 58Static Stretching to Improve the Plantar Flexors Flexibility in Females Wearing High Heel Foot WearsHasmukh Patel, Dhaval Desai, Harshit Soni, Komal Soni, Chintan Shah
Contents
Content Final.pmd 2/7/2013, 8:06 PM1

II
13. Influence of different Types of Hand Splints on Flexor Spasticity in Stroke Patients ......................................................... 65Eman Samir Fayez, Hayam Mahmoud Sayed
14. Interferential Current Therapy versus Narrow Band Ultraviolet B Radiation in the Treatment ...................................... 70of Post Herpetic NeuralgiaIntsar Salim. Waked
15. Effect of the Duration of Play on Pain Threshold and Pain Tolerance in Soccer Players ................................................... 76Shahid Raza, C.S. Ram, Jamal Ali Moiz
16. Neuromuscular Electrical Stimulation Versus Intermittent Pneumatic Compression on .................................................. 81Hand Edema in Stroke PatientsEman S.M.Fayez, Hala Ezz Eldeen
17. A Combination Approach using Manual Therapy and Exercise in the Treatment .............................................................. 87of Shoulder Impingement SyndromeAnnamma Mathew, Abedi Afsaneh
18. Musculoskeletal Pain among Computer Users .......................................................................................................................... 90Shweta Keswani, Lavina Loungni, Tiana Alexander, Hebah Hassan, Shatha Al Sharbatti, Rizwana B Shaikh, Elsheba Mathew
19. A Report of Body weight Supported Overground Training in Acute Traumatic Central Cord Syndrome .................... 96Asir John Samuel, John Solomon, Senthilkumaran, Nicole D'souza
20. Effects of Ischemic Compression on the Trigger Points in the Upper Trapezius Muscle ................................................... 99Bhavesh H. Jagad, Karishma B. Jagad
21. Prevalence of Upper Limb Dysfunction in Subjects with Chronic non Specific ................................................................ 105Neck Pain in Bangalore City, KarnatakaKinchuk DB, Soumya G, Payal D
22. Randomized Controlled trial of Group Versus Individual Physiotherapy Sessions for .................................................. 110Genuine Stress Incontinence in WomenKomal Soni, Harshit Soni, Dhaval Desai, Chintan Shah, Hasmukh Patel
23. A Study of Electromyographic Changes in Muscle Post Exercise Induced Muscle Soreness ........................................ 116Manish Rajput, Ankita Samuel, Chhavi Gupta, Sumit Kalra
24. Effect of Pelvic Floor Muscle Strengthening Exercises in Chronic Low Back Pain ........................................................... 121Manisha Rathi
25. Comparing Hold Relax - Proprioceptive Neuromuscular Facilitation and Static Stretching .......................................... 126Techniques in Management of Hamstring TightnessAli Ghanbari, Maryam Ebrahimian, Marzieh Mohamadi, Alireza Najjar-Hasanpour
26. Reliability and Feasibility of Community Balance and Mobility Scale (CB&MS) in Elderly Population ..................... 131NagaRaju, Arun Maiya, Manikandan
27. Core Stability Training with Conventional Balance Training Improves Dynamic Balance in ......................................... 136Progressive Degenerative Cerebellar AtaxiaKhan Neha Tabbassum, Nayeem-U-Zia, Harpreet Singh Sachdev, Suman K
28. Restoration of Normal Length of Upper Trapezius and Levator Scapulae in .................................................................... 141Subjects with Adhesive CapsulitisPandit Niranjan Hemant, Mhatre Bhavana Suhas, Mehta Amita Anil
29. Comparison of Vmo/Vl Ratio in Patello-Femoral Pain Syndrome (Pfps) Patients: A Surface Emg Study .................. 148Nishant H Nar
Content Final.pmd 2/7/2013, 8:06 PM2

III
30. A Study to Check Added effects of Electrical Stimulation with Task Oriented Training in ............................................ 154Hand Rehabilitation among Stroke PatientsParas Joshi
31. Relationship of Cognition, Mobility and Functional Performance to Fall .......................................................................... 160Incidence in Recovering Stroke PatientsParas Joshi, Hardik Trambadi
32. Reliability of Modified Modified Ashworth Scale in Spastic Cerebral Palsy ..................................................................... 165Divya Gupta, Pooja Sharma
33. Evaluation of Pulmonary Function Tests in Patients Undergoing Laparotomy ................................................................ 170Nahar P S, Shah S H, Vaidya S M, Kowale A N
34. Evaluation of Standardized Backpack weight and its Effect on Shoulder & Neck Posture ............................................. 176Pardeep Pahwa
35. Effect of Abductor Muscle Strengthening in Osteoarthritis Patients: A Randomized Control Trial .............................. 185Nishant H Nar
36. Effects of Scapular Stabilization Exercises and Taping in Improving Shoulder Pain & ................................................. 191Disability Index in Patients with Subacromial Impingement Syndrome Due to Scapular DyskinesisBhavesh Patel, Praful Bamrotia, Vishal Kharod, Jagruti Trambadia
37. Effects of Osteopathic Manipulative Treatment in Patients with ......................................................................................... 196Chronic Obstructive Pulmonary DiseasePraniti P. Bhilpawar, Rachna Arora
38. Comparison of Stretch Glides on External Rotation Range of Motion in ........................................................................... 202Patients with Primary Adhesive CapsulitisParas Joshi, Bhavesh Jagad
39. A Study of Electromyographic Activity of Masseter Muscle After Gum Chewing in Young Adults ............................ 208Preeti Baghel, Nidhi Kalra, Sumit Kalra
40. A Study to Evaluate the effect of Fatigue on Knee Joint Proprioception ............................................................................. 213and Balance in Healthy IndividualsPurvi K. Changela, K. Selvamani, Ramaprabhu
41. Effect of Core Stabilization and Balance-Training Program on Dynamic Balance ............................................................ 218Rabindra Basnet, Nalina Gupta
42. A Retrospective Analysis of Disability-Related Data on Disabled ....................................................................................... 223Children and their Families in TurkeyRasmi Muammer
43. Effect of Postural Brace for Correcting Forward Shoulder Posture and Kyphosis in ....................................................... 228Patients with Chronic Obstructive Pulmonary Disease: A Pilot StudyRavi Savadatti, Gajanan. S. Gaude, Prashant Mukkannava
44. Effect of Neck Extensor Muscles Fatigue on Postural Control Using Balance Master ..................................................... 234Reshma S.Gurav, Rajashree V.Naik
45. Aerobic Capacity in Regular Physical Exercise Group and Indian Classical Dancers: .................................................... 238A Comparative StudyRupali B. Gaikwad, Vijay Kumar R. waghmare, D.N. Shenvi
Content Final.pmd 2/7/2013, 8:06 PM3

IV
46. Comparative Study to Determine the Hand Grip Strength in Type-II Diabetes ................................................................ 243Versus Non-Diabetic Individuals - A Cross Sectional StudyJayaraj C. Sindhur, Parmar Sanjay
47. Study of Correlation between Hypermobility and Body Mass Index in Children aged 6-12 Years ............................... 247Parmar Sanjay, Praveen. S. Bagalkoti, Rajlaxmi Kubasadgoudar
48. Comparison of Reaction Time in Older Versus Middle-aged ................................................................................................ 250Type II Diabetic Patients - An observational StudyShruti Bhat, Sanjiv Kumar
49. Effect of Rehearsal Digit-Span Working Memory Intervention on Sensory Processing ................................................... 254Disorder in children with Autism: A Pilot StudySmily Jesu Priya V, Jayachandran V, Noratiqah S, Vikram M, Mohamad Ghazali M, Ganapathy Sankar U
50. Evaluation of Inter-Rater Reliability to Measure Hand and Arm Function in ................................................................... 259Reaching Performance Scale for Stroke PatientsSureshKumar T., Leo Rathinaraj A.S., Jeganathan A., Vignesh waran Vellaichamy
51. Effect of Incentive Spirometry on Cardiac Autonomic Functions in Normal Healthy Subjects ..................................... 264Trupti Ajudia, Pravin Aaron, Subin Solomen
52. Concurrent Validity of Clinical Chronic Obstructive Pulmonary Disease (COPD) ......................................................... 270Questionnaire (CCQ) in South Indian PopulationC.M. Herbert, V.K. Nambiar, M. Rao, S. Ravindra
53. To Study the effect of Mental Practice on one Leg Standing Balance in Elderly Population ........................................... 274Vidya V Acharya, Saraswati Iyer
54. Effect of Midprone Decubitus on Pulmonary Function Test Values in ................................................................................ 280Young Adults with Undesirable Body Mass Indices (BMI)Junaid Ahmed Fazili, Ajith S, A.M.Mirajkar, Mohamed Faisal C K, Ivor Peter D'Sa
55. Comparison of Quality of Life in off-pump Versus on-pump Coronary ............................................................................ 285Artery bypass Graft (CABG) Patients before and after Phase II Cardiac RehabilitationNikhil Vishwanath, Ajith S, Ivor Peter D'Sa, M.Gopalakrishnan, Mohamed Faisal C K
Content Final.pmd 2/7/2013, 8:06 PM4

3 Weeks Continuous Passive Motion Vs JointMobilization and their Combination in Knee
Stiffnes - A Comperative Study
Anil kumar1, Santosh Metgud2
1Post Graduate, 2Asst Prof, KLE University Institute of Physiotherapy
ABSTRACT
Study design: Randomized clinical trial.
Objectives : To determine the effect of continuous passive motion in treatment of knee joint stiffness. Todetermine the effect of joint mobilization in the treatment of knee joint stiffness. To determine thecombined effectiveness of continuous passive motion and joint mobilization in the treatment of kneejoint stiffness.
Methods : The present randomized clinical trial was conducted among 45 participants which includedboth male and female symptomatic individuals between the age of 18 to 50 years with knee jointstiffness. Pre-interventional and post-interventional outcome measurements were taken in the form ofRange Of Motion, KOSADLS.
Results : In the present study, intra - group analysis showed that improved range of motion andfunctional outcome was statistically significant in all the three groups (p=0.0001) whereas consideringthe reliability and validity of Knee Outcome Survey Of Activity Daily Living Scale, the between groupanalysis revealed that Group C was significant as compared to Group A and Group B in knee range ofmotion and in functional outcome Group B was significant compared to Group A and C .
Conclusion : In conclusion, the present randomized clinical trial provided evidence to support thephysical therapy regimen in the form of continuous passive motion with joint mobilization in improvingrange of motion, improving functional performance in subjects with post operative knee joint stiffness.
Keywords: Knee Joint Stiffness; Joint Mobilization; Continuous Passive Motion; Exercise
INTRODUCTION
The knee is a complex, compound, condyloid varietyof a synovial joint. It actually comprises three functionalcompartments: the femuro-patellar articulation consistsof the patella, and the patellar groove on the
front of the femur through which it slides; and themedial and lateral femuro-tibial articulations linkingthe femur, or thigh bone, with the tibia, the main bone ofthe lower leg.1 Knee injuries from trauma or overusecan cause pain, swelling and sometimes disability, shortor long-term depending on how bad the injury is.Injuries can occur to the bones, the ligaments, thecartilage or the tendons.2
Incidence of fractures was 100 per 10,000 populationfor males and 81 per 10,000 population for females.
Below the age of 55 years of all fractures showed ahigher incidence amongst males but amongst the over55, there was consistent fall in male:female incidenceratio with some sites showing a striking femalepreponderance.3
Continuous passive motion (CPM) refers to passivemotion performed by a mechanical device that moves ajoint slowly and continuously through a controlledrange of motion. CPM is effective in lessening thenegative effects of joint immobilization and alsoimproves the recovery rate and ROM after a variety ofsurgical procedures. It also prevents development ofadhesions and contractures and thus prevents jointStiffness. It also provides a stimulating effect on thehealing of tendons and ligaments and enhances healingof incisions over the moving joint.4 CPM is used
1. Anil Kumar 2nd april-1-5.pmd 2/7/2013, 8:08 PM1

2 Indian Journal of Physiotherapy & Occupational Therapy. January-March 2013, Vol. 7, No. 1
following various types of reconstructive joint surgerysuch as knee replacement and ACL reconstruction.5
Joint mobilization stimulates biological activity bymoving synovial fluid, which brings nutrients to theavascular articular cartilage of the joint surfaces andintra-articular fibrocartilage of the menisci6. Atrophyof the articular cartilage begins soon afterimmobilization is imposed on joints7,8,9.
Maitland techniques involve the application ofpassive and oscillatory movements to spinal, vertebraland peripheral joints to treat pain and stiffness of amechanical nature. The techniques aim to restoremotions of spin, glide and roll between joint surfacesand are graded according to their amplitude10.
METHOD
Study design is randomized clinical trial. Data wascollected from KLES Dr. Prabhakar Kore Hospital ,Belgaum. Study period of one year (Feb 2011 to Jan 2012).Sample size – Forty five (45) participants
Inclusion Criteria
• Both male and female participants with knee jointstiffness of duration more than 2 months.
• Post fracture stiffness of knee joint
• Ligament injuries of grade 1 and 2
• Age group between 18-50 years.
Exclusion Criteria
• Total Knee Replacement.
• Osteoarthritis of knee joint.
• Knee joint effusion.
• Bone tumour’s around knee joint
• Osteoporotic patients
• Knee joint malignancy
• Any local or systemic infection.
PROCEDURE
Once the patient was included in the study, thedemographic data was collected range of motion (ROM)was measured and scores on the scale was noted on
day 01 and on day 21 in the study groups. Once allmeasurements obtained subjects was randomlyallocated into 3 Groups viz. group A, Group B, andGroup C. Final scores on the scale and range of motionwas measured after 3 weeks of treatment and was thensubjected to statistical analysis
Participants of all the 3 Groups i.e.
Group A - Hot moist pack with Continuous passivemotion and exercise for affected knee joint stiffness.
Group B - Hot moist pack with Joint Mobilizationand Exercise for affected knee joint stiffness.
Group C – Hot Moist pack, Continuous PassiveMotion, Joint Mobilization and Exercise for affected kneejoint stiffness.
Moist heat therapy was given as conventionaltreatment for a period of 15 minutes, 2 sessions/day for3 weeks prior to the CPM and Joint mobilization.
The patient was asked to rest supine on thetreatment table with affected leg on CPM machine. Thespeed was kept constant, so that a full cycle lasts for 45to 60 seconds. The treatment was given for 40 minutesdaily in split sessions i.e 20 minutes in the morningand 20 minutes in the afternoon, supervised byphysiotherapist. The range was adjusted individuallyand increased gradually by 10 degrees daily withinparticipant’s limits of pain. CPM was given for 3weeksduring which various parameters was monitored.
Anterior-posterior glide
The physiotherapist performed an anteriortibiofemoral glide on participant’s operative limb, thephysiotherapist grasps the dorsal aspect of theparticipant’s proximal lower leg with one hand andholds it firmly against his body while placing his otherhand over the dorsal lateral aspect of the tibia just distalto the knee joint. He passively moves the knee joint tothe maximum available knee-extension ROM. He thenglides the participant’s tibia in an anterior directionparallel to the surface of the femoral condoyle to thepoint where the resistance provided by the knee limitedfurther movements. The mobilization was given for 10repetitions for 5 times. Total duration lasted for 20 mins.
Posterior- Anterior glide
The physiotherapist performed an posteriortibiofemoral glide on participant’s operative limb, the
1. Anil Kumar 2nd april-1-5.pmd 2/7/2013, 8:08 PM2

Indian Journal of Physiotherapy & Occupational Therapy. January-March 2013, Vol. 7, No. 1 3
physiotherapist grasps the dorsal aspect of theparticipant’s proximal lower leg with one hand andholds it firmly against his body while placing his otherhand over the dorsal lateral aspect of the tibia just distalto the knee joint. He passively moves the knee joint tothe maximum available knee-flexion ROM. He thenglides the participant’s tibia in an posterior directionparallel to the surface of the femoral condoyle to thepoint where the resistance provided by the knee limitedfurther movements. The mobilization was given for 10repetitions for 5 times. Total duration lasted for 20 mins.
Exercise like open kinetic chain exercise and closedkinetic exercise was given to the patients. Open kineticchain exercise is typically non weight bearing exercisessuch as knee extension performed when sitting on a legextension machine. Closed chain exercise includes asquat or step-up.the exercises were done twice a dayand it comprise of 3 sets of 15 repetitions with equalhold and contract time.
OUTCOMES
Range of motion was measured with a UniversalGoniometer and Physical function outcome measuredby Knee outcome survey activities of daily living scale,a well validated, self-report, self-complete questionnairewas used.
Statistical Analysis
Statistical analysis for the present study was donemanually as well as using the statistics software SPSS13 version so as to verify the results obtained. For thispurpose the data was entered into an excel spreadsheet, tabulated and subjected to statistical analysis.Various statistical measures such as mean, standarddeviation (SD) and test of significance such as pairedsample test for within group analysis and betweengroup analysis was done with Multiple Scheffe Test,ANOVA was used for age and demographicdistribution.
RESULTS
Table 1. Age distribution & Anthropometric variables
Groups Mean Age Mean Height Mean Weight Mean BMI(Years) (mts) (Kgs) (Kg/mt2)
Group A 36.80±10.23 1.67 ± 0.05 67.8 ± 10.15 24.2± 3.86
Group B 34.86 ± 7.94 1.65±0.052 65.8 ± 8.82 23.92± 2.31
Group C 32.80 ± 7.84 1.67±0.08 65.6 ± 9.06 23.37 ± 2.01
F-Value 0.785 0.512 0.253 0.513
P-Value 0.463 0.603 0.778 0.603
Table 2. Intra group mean difference
Group A p Group B P Group C P
pre Post Pre Post pre post
KOSADLS 49.2±8.47 75.6±12.83 0.00 52.5±6.9 88.2±6.37 0.00 56.3±9.90 85.6±8.5 0.00
ROM- FLEX 41.3±13.1 91.0±22.25 0.00 45.7±13.9 105±19.7 0.00 40.4±10.8 109±17.7 0.00
ROM –EXT 40.5±13.4 91.9±20.0 0.00 45.6±13.9 105±19.7 0.00 42.9±9.91 109.3±16.35 0.00
Table 3. Inter group comparison using Multiple Scheff test
Groups KOSADLS ROM
MD P Flexion Extension
MD P MD P
A-B -9.38 0.035 -10.06 0.213 -10.06 0.213
A-C -2.90 0.709 19.20 0.006 -19.20 0.006
B-C 6.48 0.190 -9.13 0.227 -9.13 0.227
DISCUSSION
Results of the study were focused on theimprovement of knee range of motion and percentageof activity of daily living based on knee outcome surveyof activity of daily living scale Score. It was notified
that there was recovery of all the above parameters inall the three groups.
Both the three groups had equal number ofparticipants and showed no statistical significancewith respect to their gender distribution, which could
1. Anil Kumar 2nd april-1-5.pmd 2/7/2013, 8:08 PM3

4 Indian Journal of Physiotherapy & Occupational Therapy. January-March 2013, Vol. 7, No. 1
have altered the results of the study and were wellmatched.
The average age in the present study was 34.82,ranging from 18-50 years. When compared between thethree groups showed equal distribution and has nostatistically significant difference in age between thegroup. A study conducted by Peter J. Millett(2004) hastaken the age group of 18-57 years with average of totalparticipants was 35.6, which coincides with the presentdata.11 .
Macrae and wright in 1969 showed a substantialdifference in stiffness between male and female kneejoint. Males are much stiffer than females even whenage, size of thigh, and size of knee is taken into account.It is interesting to note that while this work shows thatfemales are less stiff than males. The finding of thisstudy correlates with the above reference sincemaximum number of patients was males, showing morestiffness than females.12 Hutchinson M studied ongender difference in active knee joint stiffness concludedthat females have reduced active stiffness compared toage matched males. The present study correlates withthe above study in gender differences and has no effectson altering the results between the groups.13
When the intra group mean values of active kneerange of motion of flexion was analysed, it showedstatistically significant improvement in knee flexionrange of motion in both the groups pre to postintervention, with the p values of 0.000 in both thegroups, but when comparison was done inter-group,group C showed more improvement in knee range ofmotion as compared to group A and B. In the presentstudy increase in range of motion, with the applicationof continuous passive motion in one group and jointmobilization in another group is consistent with thefindings of previous studies. This is the first study tilldate has compared the combined effect of continuouspassive motion and joint mobilization. Present resultsshowed that continuous passive motion with jointmobilization is better than giving individually.
In the present study the application of moist heatfor 15 mins in all three groups prior to CPM and jointmobilization showed increase in range of motion.Knight et al. Investigated the effect of 15 min hot packapplication paired with static stretching on plantarflexor extensibility over four weeks and noted increasesin range of motion. These findings suggest that hot packapplication may be a beneficial modality whenincreased range of motion is desired.14
The results of the present study group receivingCPM, has shown that alone CPM is not a beneficialmethod to mobilize post-operative knee stiffness. Assuggested by Bearpre et. al., (2001), a prospective,
investigator-blinded RCT compared three rehabilitationregimens in patients who had undergone primary TKAfor osteoarthritis. The results suggest that adjunct CPMand adjunct SB may not provide additional therapeuticbenefit in an active mobilization regimen following TKAfor osteoarthritis. Hence the present study consistentwith the above study as the result concluded the same.The study done by Beaupre et. al., hypothesized thatcontinuous passive motion may not provide therapeuticeffect in active mobilization of post-operative kneestiffness.15
In the present study, group receiving CPM only,showed an average increase in ROM for post operativeknee stiffness of 49.733, which was less compared tothe other 2 groups ie., group B-59.80 and group C-68.93.The present study correlates with the study done byEngstrom et al. (1995) reported on a prospectiverandomized study of 34 patients with unilateralanterior cruciate ligament ruptures. Engstrom et alconcluded that after six weeks follow–up, there was nodifference in ROM between the two groups, and jointswelling was more pronounced in the early activemotion group. The data suggests that CPM did notimprove ROM.16
Randall et al, showed that in patients withsupracondylar fracture, mobilization and exercise ledto a greater increase in joint movement than exercisealone. The present study is in consistent with the abovestudy as the results concluded the same. Hence the effectof joint mobilization has an effect in increasing rangeof motion17.
Michael A. Hunt, Stephen R. found the effect ofanterior tibiofemoral glides on knee extension duringgait in patients with decreased range of motion afteranterior cruciate ligament reconstruction. The authorsconcluded that a single session of anterior tibiofemoralglides increases maximal knee extension during thestance phase of gait in patients with knee extensiondeficits. In the present study 21 sessions of mobilizationincreased maximal knee extension range of motion andcould not comment on the immediate effect of jointmobilization18.
In the present study closed kinetic chain exerciseswere performed by the participants for 10 repetitionsper session with each contraction held for 10 seconds,which is consistent with the findings of Cristina Mariaand Nunes Cabral.19
Study done by Mei Hwa Jan MS et al to investigatethe effect of weight bearing exercises on function, painand knee strength in patients with knee stiffness. Theresults showed that weight bearing exercises wereeffective in decreasing pain and disability andincreasing knee strength.20
1. Anil Kumar 2nd april-1-5.pmd 2/7/2013, 8:08 PM4

Indian Journal of Physiotherapy & Occupational Therapy. January-March 2013, Vol. 7, No. 1 5
The findings of the present study show thatimproving ROM by joint mobilization is effective whichwas due to stimulation of biological activity by movingsynovial fluid, which brings nutrients to the avasculararticular cartilage of the joint surfaces and intra-articular fibrocartilage of the menisci21.
CONCLUSION
In conclusion, the present randomized clinical trialprovided evidence to support the physical therapyregimen in the form of continuous passive motion withjoint mobilization in improving range of motion,improving functional performance in subjects with postoperative knee joint stiffness
LIMITATIONS
• Intermediate readings of the outcome measures wasnot noted.
• There was no control group in the present study
REFERENCES
1. Thieme Atlas of anatomy; Anatomy andmusculoskeletal system, Thieme.2006, ISBN 1-58890-419-429.
2. Cole PA, Ehrlich MG. Management of theCompletely Stiff Pediatric Knee. J Ped Orthop; 1997;17:67-73.
3. L J Donaldson , Acook. Incidence of fractures in ageographically defined population. Journal ofEpidemiology and Community Health;1990;44:241-245
4. Lastayo, PC; Continuous passive motion for theupper extremity. In Hunter, JM, Mackin, EJ.Callabon AD (eds) Rehabilitation of the Hand;Surgery and Therapy, 1995. ed 4.
5. O’ Driscoll, SW, Giori, NJ; Continuous PassiveMotion Theory and Principles of ClinicalApplication. J Rehabil Res Dev 2000.37 (2);179.
6. Norkin , C, Levangie, P; Joint Structure AndFunction ;A comprehensive analysis, ed 2, FA,Davis, Philaephia.1992;56-70.
7. Akeson, WH, Billot JR. Effects of immobilizationof joints. Clinical Orthop 1987:219:28.
8. Donatelli , R, Owens- Burkhart, H; effects ofimmobilization on extensibility of particular
connective tissue; J Orthop Sports PhysicalTherapy.1981.3:67.
9. Enneking, WF, Horowitz,M; The intra-articulareffects of immobilization on the human knee. JBone Joint Surgery Am.1972. 54:978.
10. G. D. Maitland. Peripheral Manipulation, 3rd
edition. 2003:250-255.11. Peter J. Millet, MD. Early ACL reconstruction in
combined ACL-MCL injuries, Journal KneeSurgerie. 2004. 17:94-98.
12. Macrae IF. The measurement of stiffness humanjoint, 2000, 24:43-47
13. Hutchinson M. Gender differences in active kneejoint stiffness. Sports Med, 1995:19:288-302
14. Knight CA, Rutledge CR. Effect of superficial heat,deep heat and active exercise warm up on theextensibility of plantar flexors. Phys Therapy,2001.81:1206-1214.
15. Beaupre CA et al. Exercise combined withcontinuous passive motion or slider board therapycompared with exercise only. Physical Therapy,2001:81(4); 1029-1037.
16. Engstrom B, Sperber A, Wredmark T. Continuouspassive motion in rehabilitation after anteriorcruciate ligament reconstruction. Knee Surg SportsTraumatol Arthrosc. 1995;3(1):18-20.
17. Randall T, Portney L, Harris BA: Effects of jointmobilization on joint stiffness and active motionof the metacarpal phalangeal joint. J Orthop SportsPhys Ther 1992, 16:30-36.
18. Michel A. Hunt. Stephen R. Effect of anterior tibio-femoral glides on knee extension during gait inpatients with decreased range of motion afteranterior cruciate ligament reconstruction; 2010.Vol-6 Pages 235-241.
19. Cristina Maria, Nunes Cabral, Effect of a closedkinetic chain exercise protocol on patellofemoralsyndrome rehabilitation, 2007 XXVISBSSymposium.
20. Mei-Hwa Jan MS PT, Effect of weight bearingversus non weight bearing exercise on function,walking speed and position sense in participantswith knee osteoarthritis. Archives of physicalmedicine and rehabilitation; 2009. vol 90, issue 6:897-904
21. Norkin, C, Levangie, P; Joint Structure andFunction: A Comprehensive Analysis, ed 2. FADavis, Philadelphia, 1992.
1. Anil Kumar 2nd april-1-5.pmd 2/7/2013, 8:08 PM5

6 Indian Journal of Physiotherapy & Occupational Therapy. January-March 2013, Vol. 7, No. 1
Comparison of Blood Pressure and Heart Rate betweenYoung Males and Females During Dominant and
Non-Dominant Single-Leg Stance
Ankita Samuel1, Manish Rajput1, Chhavi Gupta1, Sumit Kalra2
1Student-Bachelors of Physiotherapy, 2Assistant Professor, Banarsidas Chandiwala Institute of Physiotherapy
ABSTRACT
Background: It has been observed that Blood Pressure and Heart Rate of an individual changes withposture. This study is performed to study the change in Blood Pressure and Heart Rate while standingon dominant and on non-dominant single -leg stance in males and females.
Objective: The objective of this study is to compare the significant changes in Blood Pressure and HeartRate in young college going males and females while standing on there dominant and non-dominantlower limb (single-leg stance).
Subjects: 200 subjects (100-males, 100-females) of the age group of 18 to 25yrs
Study Design: Co-relational
Data Analysis: P-Value was calculated for the systolic and diastolic blood pressure separately and aswell as of Heart Rate in resting, single-leg stance on dominant leg and single-leg stance on non-dominant leg in both Males and Females.
Conclusion: From The study it can be concluded that while training any individual on single -legstance on dominant and non-dominant a therapist should take care of the blood pressure and HeartRate specially while working on hypertensive's, amputees, individuals with cardio-vascular,neurological, psychological and neuro muscular disorders.
Keywords: Heart Rate, Blood Pressure
INTRODUCTION
Human Heart rate can vary as the body’s need toabsorb oxygen and excrete carbon dioxide changes,such as during exercise or sleep.
The one-leg stance is a valid measure to assesspostural steadiness in a static position by temporalmeasurement. The examination of balance with one-leg stance test is a functional and logical approach,since transient balancing on a single limb is essentialfor normal gait and critical activities of daily living suchas turning, stair climbing and dressing and it is alsoessential for sports person who need goodproprioception to be good in their field of sports.
In addition to identifying single-leg balance testingas a reliable indicator of functional instabilities.Freeman and colleagues provided sound support forthe use of single-leg proprioceptive training to decreasethe effects of functional instabilities. Since that time,
clinicians have continued to use single-leg stancemanipulations for both the evaluation andrehabilitation of proprioceptive deficits related toorthopedic injury.
During rehabilitation, this method is used both fora baseline measurement of balance and to progresspatients as they recover.
Short-term cardiovascular responses to posturalchange involve complex interactions between theautonomic nervous system, which regulates bloodpressure, and cerebral auto regulation, whichmaintains cerebral perfusion. A physiologically basedchange is used to describe effects of gravity on venousblood pooling during postural change. Two types ofcontrol mechanisms are included:
1) Autonomic regulation mediated by sympatheticand parasympathetic responses, which affect heart
2. Ankita 5th april --6-10.pmd 2/7/2013, 8:08 PM6

Indian Journal of Physiotherapy & Occupational Therapy. January-March 2013, Vol. 7, No. 1 7
rate, cardiac contractility, resistance, andcompliance, and
2) Auto regulation mediated by responses to localchanges in myogenic tone, metabolic demand, andCO2 concentration, which affect cerebrovascularresistance.
The change on Heart Rate are due to muscularactivity changes when posture changes, abdominalwall tension increases while standing on single leg,the aortic pressure increases according to Marey’s lawand also due to carotid sinus reflex.
The Blood Pressure and Heart Rate vary inrespiratory, neurological, psychological and in cardio-vascular disorders. BMI also plays a major role when itcomes to one leg standing, the individuals with BMImore than of 25cm2/kg has a higher Blood Pressureand Heart Rate while standing on single leg.
Static contraction of muscles on a large scale, e.g.with the knees bent as described, soon causes aremarkably large rise of systolic and diastolic blood-pressures, comparable to what may be induced bystrenuous muscular exercise, but differing in certainrespects in the mechanism of its production.
Assumption of the upright posture requires promptphysiological adaptation to gravity .There is aninstantaneous descent of ~500 ml of blood from thethorax to the lower abdomen, buttocks, and legs. Inaddition, there is a 10-25% shift of plasma volume outof the vasculature and into the interstitial tissue. Thisshift decreases venous return to the heart, resulting in atransient decline in both arterial pressure and cardiacfilling. This has the effect of reducing the pressure onthe bar receptors, triggering a compensatorysympathetic activation that results in an increase inheart rate and systemic vasoconstriction (counteringthe initial decline in blood pressure). Hence,assumption of upright posture results in a 10-20 beatper minute increase in heart rate, a negligible change insystolic blood pressure, and a ~5 mmHg increase indiastolic blood pressure. Assumption of the uprightposture requires prompt physiological adaptation togravity.
The response of blood pressure to change in bodyposition is well suited as a measure of cardiovascularreactivity for epidemiological studies. Severalexperimental studies have suggested a differentialresponse of blood pressure to standing due to ethnicity1
and gender2, 3.
As it always seen that men have more muscle poweras compared to women, indirect evidence indicates19,20
that women will experience less compressive force andintramuscular pressure in the muscle21,22,23, allowinggreater perfusion and oxygen supply compared withthe men during the sustained contraction during thechange in posture.
It also seen that women have lower risks ofcardiovascular events than men. They are alsocharacterized by different spectral indexes of HRV24,and by higher HRV entropy25.
The need of this study is to have a betterunderstanding that how does Blood Pressure and HeartRate changes in young individuals who are under goingphysiotherapy to increase their proprioception, balanceand co-ordination, a hypertensive individual ,anindividual using prosthesis or an amputee (any limb),an individual under going any cardio-vascular,neurological, psychological or neuro-muscular disorderwhen they stand on there single lower limb (dominantor non-dominant) and does the gender of the individualplays in any significant role in it.
METHODOLOGY
RESEARCH DESIGN- Co-relational
SAMPLE SIZE- 200 (male-100, female-100)
SOURCE OF SUBJECTS - Students from variouscolleges in Delhi.
SAMPLE DESIGN- Random sampling
INCLUSION CRITERIA27, 28:
1. Males and Females in the age group of 18 to 25years
2. BMI between 18 to 25 kg/m2
EXCLUSION CRITERIA
1. BMI less than 18 and more than 25 kg/m2
2. A diagnosed case of any cardio-vascular,respiratory, psychological or neurological disorder.
3. Any bony/Muscular deformity present of upperlimb, lower limb or spine
4. Any pain in upper limb, lower limb or spine
5. Use of any limb prosthesis
6. Any limb amputation
7. Subjects are not involved in any physical ormuscular activity in last one hour before testing.
2. Ankita 5th april --6-10.pmd 2/7/2013, 8:08 PM7

8 Indian Journal of Physiotherapy & Occupational Therapy. January-March 2013, Vol. 7, No. 1
INSTRUMENTATION
1. The Omron M6 (HEM-7001-E) digital bloodpressure and heart rate monitor.
2. A stop watch
3. Football
4. measuring tape
5. weighing tape
INDEPENDENT VARIABLES
1. Age
2. Height
3. Weight
DEPENDENT VARIABLES
1. Blood pressure (both systolic and diastolic)
2. Heart rate
PROCEDURE
Total of 265 subjects were taken out of which 200subjects fulfilling the inclusion criteria and afterchecking that they had not gone for any vigorousphysical or muscular activity in last one hour were takeninto consideration. The procedure was explained to thesubjects and a written consent was taken afterexplaining the benefits and clearing the doubts of thesubject regarding study. To check the lower limbdominance subjects were asked to kick a football andthe leg from which he/she kicked was considered ashis/her dominant leg. After this subject’s BP and HRwas taken while sitting on chair. They were given a restperiod of 5 minutes then, they were made to stand ontheir dominant leg for a minute. After which their BPand HR was recorded in seated position, and they weremade to rest for 5 minutes again. Post rest period thesubjects were asked to stand on their non-dominant legfor a minute this time again their BP and HR were takenin seated position.
RESULT
P-value of the collected data was calculated usingSPSS software version 16
FEMALES
Table 1. Resting and Dominant
S. No. P-Value
1 Systolic 0.014
2 Diastolic 0.890
3 Heart Rate 0.291
Table 2. Resting and Non-Dominant
S. No. P-Value
1 Systolic 0.000
2 Diastolic 0.480
3 Heart Rate 0.056
Table 3. Dominant and Non-Dominant
S. No. P-Value
1 Systolic 0.197
2 Diastolic 0.072
3 Heart Rate 0.436
MALES
Table 4. Resting and Dominant
S. No. P-Value
1 Systolic 0.426
2 Diastolic 0.473
3 Heart Rate 0.737
Table 5. Resting and Non-Dominant
S. No. P-Value
1 Systolic 0.282
2 Diastolic 0.169
3 Heart Rate 0.070
Table 6. Dominant and Non-Dominant
S. No. P-Value
1 Systolic 0.198
2 Diastolic 0.073
3 Heart Rate 0.430
MALES AND FEMALES
Table 7. Resting and Dominant
S. No. P-Value
1 Systolic 0.032
2 Diastolic 0.725
3 Heart Rate 0.339
Table 8. Resting and Non-Dominant
S. No. P-Value
1 Systolic 0.001
2 Diastolic 0.27
3 Heart Rate 0.09
2. Ankita 5th april --6-10.pmd 2/7/2013, 8:08 PM8

Indian Journal of Physiotherapy & Occupational Therapy. January-March 2013, Vol. 7, No. 1 9
Table 9. Dominant and Non-Dominant
S. No. P-Value
1 Systolic 0.695
2 Diastolic 0.493
3 Heart Rate 0.171
Table 10. Dominant (male & female)
S. No. P-Value
1 Systolic 0.000
2 Diastolic 0.000
3 Heart Rate 0.05
Table 11. Non-Dominant (male & female)
S. No. P-Value
1 Systolic 0.069
2 Diastolic 0.00
3 Heart Rate 0.00
DISCUSSION
Variation of heart rate is associated with posturalchange26. In accord with previous reports, this studyshowed that HR was highest in standing on Non-Dominant leg compared to sitting or lying positions4-11.Thus, the hypothesised that the increase in HR withstanding follows a decease in venous return due to“venous pooling” in the lower limbs due togravitational effects12. The increase in peripheral venousvolume is accompanied by an increase in both venousand arterial pressure in the lower extremities. The shiftin blood volume from the central to the peripheral systeminduces a decrease in venous return and central venouspressure. The smaller the venous return, the smallerthe end-diastolic and subsequent stroke volume. Areduction in venous return will lead to a reducedcardiac output, which in turn will lead to a reductionin baroreceptor stimulation in the aorta and carotidarteries13. This reduction in baroreceptor firing resultsin decreased parasympathetic and increasedsympathetic activity14, 11. These two actions directly affectthe cardiovascular centre in the medulla oblongatawhich increases the HR, the arteriolar and venoustones, and the cardiac contractility to compensate forthe decrease in stroke volume and provide a cardiacoutput which can meet body demands. Upon returningthe posture from sitting to lying, the increase in venousreturn increases the stroke volume through the FrankStarling mechanism, thus a lower heart rate is sufficientto maintain the cardiac output demanded by the body.
In present study we can conclude that not onlythe HR but BP also changes significantly while onstanding on dominant single-leg and on non-dominantsingle-leg in Males and Females. Haemodynamics canbe disturbed even by slight movements 15. In accord withprevious findings4-11, our results showed that with
respective of the postural change, i.e. standing ondominant and non-dominant leg there was a significantincrease in HR and decrease in BP. Although muscleactivity increases body oxygen consumption and energyexpenditure, the temporal increase in HR and decreasein BP associated with changing position suggests thatit is likely to have resulted from the metabolic orhormonal consequences of increased muscle activity.We speculate that this increase was largely induced bythe skeletal muscle reflex15-17. Although anticipation ofexercise may also cause a rapid increase in heart rate18.
The changes in BP and HR were significantly seenwith respect to gender also. Both the systolic anddiastolic BP in males increases while standing on theresingle-leg and that too on there non-domianat legwhereas there was increase in HR in case of females ontheir non-dominant leg.
REFERENCES
1. Ventner CP, Joubert PH. The relevance of ethnicdifferences in hemodynamic responses to thehead-up tilt maneuver to clinical pharmacologicalinvestigations. J Cardiovasc Pharmacol.1985;7:1009 –1010.
2. Gotshall RW, Tsai PF, Bassett Frey MA. Gender-based differences to the cardiovascular responseto standing. Aviat Space Environ Med.1991;62:855–859.
3. Schondorf R, Low PA. Gender related differencesin the cardiovascular responses to upright tilt innormal subjects. Clin Auton Res. 1992;2: 183–187.
4. Hollander, A.P. and Bouman, L.N. Cardiacacceleration in man elicited by a muscle-heartreflex. J. Appl. Physiol. 38: 272-278 ,1975.
5. Iellamo, F., Legramant, J.M., Massaro, M., Galante,A., Pigozzi, F.,Nardozi, C. and Sangilli, V.Spontaneous baroreflex modulation of heart rateand heart rate variability during orthostatic stressin tetraplegics and healthy subjects. J. Hypertens.19: 2231-2240,2001.
6. Jacob, G., Ertl, A.C., Shannon, J.R., Furlan, R.,Robertson, R.M. and Robertson, D. Effect ofstanding on neurohumoral responses andplasma volume in healthy subjects. J. Appl.Physiol. 84: 914-21,1998.
7. Pump, B., Christensen, N.J., Videbaek, R., Warberg,J., Hendriksen, O. and Norsk, P. Left atrialdistension and antiorthostatic decrease in arterialpressure and heart rate in humans. J. Am. Physiol.273: H2632-H2638, 1997.
8. Pump, B., Gabrielsen, A., Christensen, N.J., Bie, P.,Bestle, M. and Norsk, P. Mechanisms of inhibitionof vasopressin release during moderateantiorthostatic posture change in humans. Am. J.Physiol. 277: R229-R235, 1999.
2. Ankita 5th april --6-10.pmd 2/7/2013, 8:08 PM9

10 Indian Journal of Physiotherapy & Occupational Therapy. January-March 2013, Vol. 7, No. 1
9. Pump, B., Kamo, T., Gabrielsen, A. and Norsk, P.Mechanisms of hypotensive effects of a posturechange from seated to supine in humans. Acta.Physiol. Scan. 171: 405-412, 2001.
10. Saborowski, F., Krahe-Fritsch, G., Krakau, M.,Wallbrueck, K. and Schaldach, M. The effects oforthostasis on the ventricular-evoked response.Eur. J. Appl. Physiol. 2: 333-338, 2000.
11. .Shamsuzzaman, A.S.M., Sugiyama, Y., Kamiya,A., FU, Q. and Mano, T. Head-up suspension inhumans: effects on sympathetic vasomotor activityand cardiovascular responses. J. Appl. Physiol.84:1513-1519, 1998.
12. Borst, C., Wieling, W., van Brederode, J.F.M., Hond,A., de Rijk, L.G. and Dunning, A.J. Mechanisms ofinitial heart rate response to postural change. Am.J. Physiol. 243: H676-H681, 1982.
13. Mohrman, D.E. and Heller, L.J. CardiovascularPhysiology 4thEdition. McGraw-Hill HealthProfessions Division, 1997: pp 179-183.
14. Ewing, D.J., Hume, L., Campbell, I.W., Murray, A.,Neilson, J.M. and Clarke, B.F. Autonomicmechanisms in the initial heart rate response tostanding. J. Appl. Physiol. 49: 809-814, 1980.
15. Kjaer, M., Hanel, B., Worm, L., Perko, G., Lewis,S.F., Sahlin, K., Galbo, H. and Secher, N.H.Cardiovascular and neuroendocrine responses toexercise in hypoxia during impaired neuralfeedback from muscle. Am. J. Physiol. 277: R 76-R85, 1999.
16. Leshonower, B.G., Potts, J.T., Garry, M.G. andMitchell, J.H. Reflex cardiovascular responsesevoked by selective activation of skeletal muscleergoreceptors. J. Appl. Physiol. 90: 308-316, 2001.
17. McArdle,W.D., Katch, F.I. and Katch, V.L.Essentials of Exercise Physiology. 2nd Edition.Philadelphia: Lippincott Williams & Wilkins. 2000.
18. Heather k. Vincen, PhD, Kelley M. Lamb, BS, Tim i.Day, PT, Susan M. Tillman, PT, Kevin R.Vincent,MD, PhD, Steven Z. George, PT, PhD.Morbid Obesity is Associated with FEAr ofMovement and Lower Quality of Life in Patientswith Knee Pain- Related diagnosis. Volume 2, Issue8, August 2010, pg713-722
19. . Hicks AL, Kent-Braun J, and Ditor DS. Sexdifferences in human skeletal muscle fatigue.Exerc Sport Sci Rev 29: 109–112, 2001.
20. . Hunter SK and Enoka RM. Sex differences in thefatigability of arm muscles depends on absoluteforce during isometric contractions. J Appl Physiol91: 2686–2694, 2001.
21. Sadamoto T, Bonde-Petersen F, and Suzuki Y.Skeletal muscle tension, low, pressure, and EMGduring sustained isometric contractions inhumans. Eur J Appl Physiol 51: 395–408, 1983.
22. Sejersted O, Hargens A, Kardel K, Blom P, JensenO, and Hermansen L. Intramuscular fluidpressure during isometric contraction of humanskeletal muscle. J Appl Physiol 56: 287–295, 1984.
23. Barnes WS. The relationship between maximumisometric strength and intramuscular circulatoryocclusion. Ergonomics 23: 351–357, 1980.
24. Sztajzel, J., Jung, M., and Bayes de, LunaA.Reproducibility and gender-related differencesof heart rate variability during all-day activity inyoung men and women. Ann NoninvasiveElectrocardiol 2008;13:270-277.
25. Ryan, S. M., Goldberger, A. L., Pincus, S. M., Mietus,J., and Lipsitz, L. A. Gender- and age-relateddifferences in heart rate dynamics: are womenmore complex than men? J Am Coll Cardiol1994;24:1700-1707.
26. Oida, E., Kannagi, T., Moritani, T. and Yamori, Y.Physiological significance of absolute heart ratevariability in postural change.Acta. Physiol. Scan.165: 421-422, 1999.
27. Heather k. Vincen, PhD, Kelley M. Lamb, BS, Tim i.Day, PT, Susan M. Tillman, PT, Kevin R.Vincent,MD, PhD, Steven Z. George, PT, PhD.Morbid Obesity is Associated with FEAr ofMovement and Lower Quality of Life in Patientswith Knee Pain- Related diagnosis. Volume 2, Issue8, August 2010, pg713-722
28. Stewart, Manual of Physiology,” Toronto, 1918, p.107.
2. Ankita 5th april --6-10.pmd 2/7/2013, 8:08 PM10

Indian Journal of Physiotherapy & Occupational Therapy. January-March 2013, Vol. 7, No. 1 11
Effectiveness of Transcutaneous Electrical NerveStimulator (TENS) in Reducing Neuropathic Pain in
Patients with Diabetic Neuropathy
Apeksha O. Yadav1, G. J. Ramteke2
1Assistant Professor, 2Director & Principal, Department of Physiotherapy, Ravi NairPhysiotherapy College, DMIMS (DU) Sawangi (M) Wardha
ABSTRACT
Objective: To evaluate the effectiveness of TENS in reducing neuropathic pain in patients with DiabeticNeuropathy.
Design: Prospective Experimental Study.
Participants and Outcome Measure: 20 Patients with a diagnosis of Diabetic Neuropathy were includedin the study and they were explained regarding the treatment & its duration. Outcome measures wererecorded before & after the treatment session using numerical pain rating scale.
Result: After collecting data statistical analysis was done using Student's paired t test to determine theeffect of TENS and it showed a significant difference in reduction in pain post treatment.
Conclusion: It can be concluded that High frequency TENS can be given to Diabetic Neuropathypatients for three weeks to achieve pain reduction.
Keywords: Diabetes, Neuropathic Pain, Transcutaneous Electrical Nerve Stimulator.
INTRODUCTION
Diabetes mellitus is caused by an insufficientinsulin-mediated response to blood glucose. Peoplewith the disorder are classified as being insulindependent (ie, having type I diabetes) or non-insulindependent (ie, having type II diabetes) depending onwhether they require exogenous insulin for survival. Afrequent sequella of both types of diabetes is thedevelopment of peripheral neuropathy in either motoror sensory nerves, or both.1 Crawford2 estimated that 13million people in the United States have diabetes, and30% to 40% of these people are believed to have at leastsensory neuropathy.3
A consequence of any neuropathy affecting motorand sensory peripheral nerves is reduction or loss ofstrength and sensation. Another potential consequenceof peripheral neuropathy in people with diabetes issevere, unremitting pain.1, 4 People with painful diabeticneuropathy describe their pain as constant, burning,or searing. Allodynia, to light touch, the experience oflight touch as painful, frequently develops, and evencontact with bedclothes can be painful. Deep pain,described as being located in the centre or marrow ofthe bone, can also occur. When pain is severe, people
with diabetic neuropathy may have difficulty sleepingand can experience depression and weight loss.1
Diabetic peripheral neuropathy (DPN) endoneurialhypoxemia – is the most common complication ofdiabetes, estimated to affect 50% to 90% of patients,depending on the criteria used for diagnosis5-10. Itsprevalence increases with the patient’s age, durationof diabetes, and poor glycemic control.11-14
DPN is often referred to as the forgotten complicationbecause, despite how commonly it occurs, it is thechronic diabetes complication that is least oftenaddressed by health care providers.15 Results of the 2005American Diabetes Association (ADA) National Surveyfound that only one in four patients surveyed whoexperience symptoms of DPN have been diagnosed withthe condition.16 This is partly because manypractitioners have had very little success with itstreatment as well as a lack of awareness of availabletreatment strategies. A wide range of treatments areavailable for neuropathic pain, however, many patientsremain inadequately treated. This prescribing patternsuggests that no one treatment addresses all factors.Foot complications are the greatest burden of all seriouschronic complications among patients with diabetes.
3. apeksha 25th may--11-13.pmd 2/7/2013, 8:08 PM11
12 Indian Journal of Physiotherapy & Occupational Therapy. January-March 2013, Vol. 7, No. 1
As many as 40% to 60% of lower-extremity amputations(LEAs) are related to DPN, and more than 50,000 LEAsare performed each year in this country.17,18
Approximately 15% of patients with diabetes willdevelop a foot ulcer and one in six will need to have anamputation. Additionally, half of those patients whodevelop an ulcer will have one on the opposite footwithin 3 years 19-21. Short of ulceration and amputation,DPN limits mobility, impairs sleep, and seriously affectsoverall QoL. It is a progressive disease that may actuallybegin before any alteration in sensation is detected.
For reduction of the symptoms of diabetic peripheralneuropathy some modalities have been used are;
- TENS
- Micro vascular therapy
- Monochromatic near infrared treatment.
By using high frequency TENS, reduction in thesymptoms of diabetic peripheral neuropathy can beachieved.
David & Somers in a case study stated that by usinghigh frequency TENS for 20 minutes daily for 3 weeksover lumbar region relieves pain of neuropathy of a 73years old lady the outcome were measured by theregular assessment and by using VAS as it is reliableand valid tool for the quantification of perceived pain,the intensity of perceived pain was reduced from 7.4 to4.6 cm on the VAS and reduction of pain was gradualin given 3 weeks22.
Dinesh Kumar, MD, Inderjeet S. Julka, MD, MichaelS. Alvaro, DPM & Howard J. Marshall, DPM, did threeindependent studies utilizing TENS & amitriptyline torelieve DPN pain was reviewed. There were 14 patientsin this group. Two of them did not tolerate amitriptyline.Symptomatic improvement occurred in 12 (85%)patients; 11 received the combination of amitriptylineand electrotherapy and 1 received electrotherapy only.Three patients improved by 3 pain grades, 8 by 2 grades,and 1 by 1 grade. Five (36%) of them experiencedcomplete symptomatic relief.
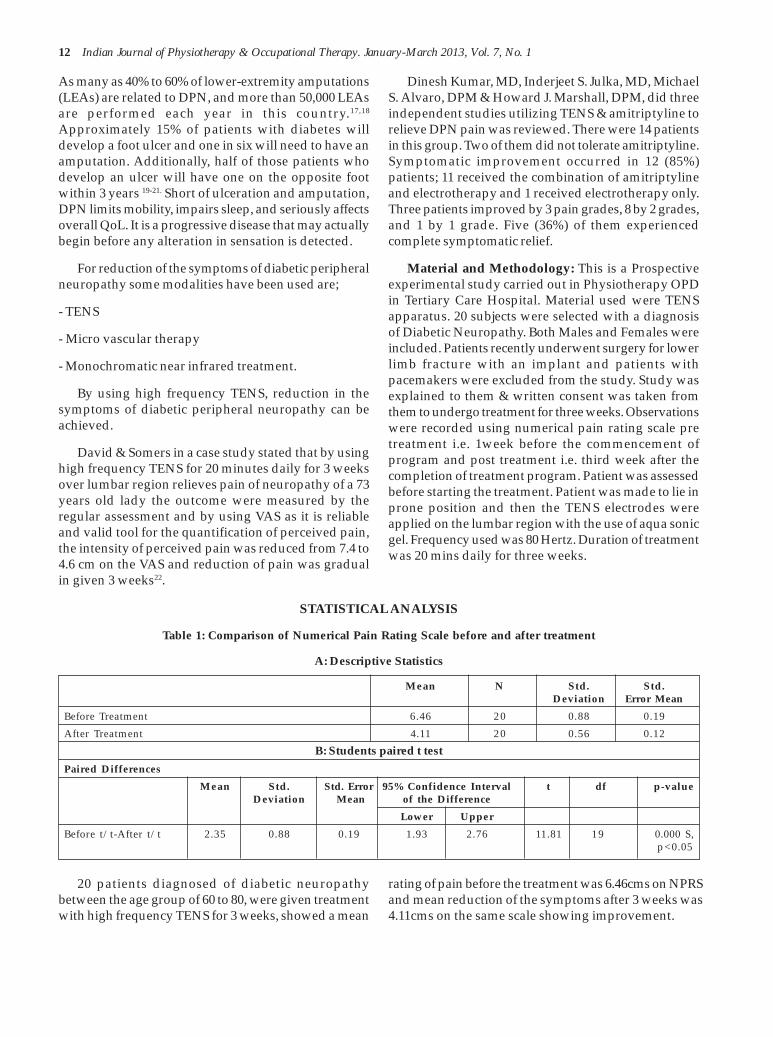
Material and Methodology: This is a Prospectiveexperimental study carried out in Physiotherapy OPDin Tertiary Care Hospital. Material used were TENSapparatus. 20 subjects were selected with a diagnosisof Diabetic Neuropathy. Both Males and Females wereincluded. Patients recently underwent surgery for lowerlimb fracture with an implant and patients withpacemakers were excluded from the study. Study wasexplained to them & written consent was taken fromthem to undergo treatment for three weeks. Observationswere recorded using numerical pain rating scale pretreatment i.e. 1week before the commencement ofprogram and post treatment i.e. third week after thecompletion of treatment program. Patient was assessedbefore starting the treatment. Patient was made to lie inprone position and then the TENS electrodes wereapplied on the lumbar region with the use of aqua sonicgel. Frequency used was 80 Hertz. Duration of treatmentwas 20 mins daily for three weeks.
STATISTICAL ANALYSIS
Table 1: Comparison of Numerical Pain Rating Scale before and after treatment
A: Descriptive Statistics
Mean N Std. Std.Deviation Error Mean
Before Treatment 6.46 20 0.88 0.19
After Treatment 4.11 20 0.56 0.12
B: Students paired t test
Paired Differences
Mean Std. Std. Error 95% Confidence Interval t df p-valueDeviation Mean of the Difference
Lower Upper
Before t/t-After t/t 2.35 0.88 0.19 1.93 2.76 11.81 19 0.000 S,p<0.05
20 patients diagnosed of diabetic neuropathybetween the age group of 60 to 80, were given treatmentwith high frequency TENS for 3 weeks, showed a mean
rating of pain before the treatment was 6.46cms on NPRSand mean reduction of the symptoms after 3 weeks was4.11cms on the same scale showing improvement.
3. apeksha 25th may--11-13.pmd 2/7/2013, 8:08 PM12

Indian Journal of Physiotherapy & Occupational Therapy. January-March 2013, Vol. 7, No. 1 13
CONCLUSION
It can be concluded that, treatment with highfrequency TENS for 3 weeks given to patients with adiagnosis of diabetic neuropathy shows significantreduction of neuropathic pain.
REFERENCES1. Watkins PJ. Natural history of diabetic
neuropathies. QJ Med. 1990; 77:1209 –1218.2. Crawford JM. The pancreas. In: Kumar V, Cotran
RS, Robbins SL, eds. Basic Pathology. 6th ed.Philadelphia, Pa: WB Saunders Co; 1997:557–578.
3. Harris M, Eastman R, Cowie C. Symptoms ofsensory neuropathy in adults with NIDDM in theUS population. Diabetes Care. 1993; 16: 1446–1452.
4. Horowitz SH. Diabetic neuropathy. Clin Orthop.1993; 296:78–85.
5. Dyck PJ, Kratz KM, Karnes JL, et al. The prevalenceby staged severity of various types of diabeticneuropathy, retinopathy, and nephropathy in apopulation-based cohort: the Rochester DiabeticNeuropathy Study. Neurology. 1993; 43: 817–824.
6. Tavaloki M, Mojaddidi M, Fadavi H, Malik RA,Pathophysiology and treatment of painful diabeticneuropathy. Curr Pain Headache Rep. 2008; 12:192–197.
7. Shaw JE, Zimmet PZ. The epidemiology of diabeticneuropathy. Diabetes Rev. 1999; 7: 245–252.
8. Gregg EW, Sorlie P, Paulose-Ram R, et al.Prevalence of lower-extremity disease in the USadult population e”40 years of age with andwithout diabetes: 1999–2000 National Health andNutrition Examination Survey. Diabetes Care.2004; 27: 1591–1597.
9. Daousi C, MacFarlane IA, Woodward A, et al.Chronic painful peripheral neuropathy in anurban community: a controlled comparison ofpeople with and without diabetes. Diabet Med.2004; 21: 976–982.
10. Davies M, Brophy S, Williams R, Taylor A. Theprevalence, severity, and impact of painful diabeticperipheral neuropathy in type 2 diabetes. DiabetesCare. 2006; 29: 1518–1522.
11. Boulton AJM. Management of diabetic peripheralneuropathy. Clin Diabetes. 2005; 23: 9–15.
12. Tamer A, Yildiz S, Yildiz N, et al. The prevalenceof neuropathy and relationship with risk factors
in diabetic patients: a single-center experience.MedPrinc Pract. 2006; 15: 190–194.
13. Valensi P, Giroux C, Seeboth-Ghalavini B, AttaliJR. Diabetic peripheral neuropathy: effects of age,duration of diabetes, glycemic control, andvascular factors. J Diabetes Complications. 1997;11: 27–34.
14. Booya F, Bandarian F, Larijani B, et al. Potentialrisk factors for diabetic neuropathy: a case controlstudy. BMC Neurol. 2005; 5:24.
15. Marks JB. The forgotten complication. Clin Diab.2005; 23: 3–4.
16. American Diabetes Association survey finds mostpeople with diabetes don’t know about highlyprevalent, serious complication.w w w . d i a b e t e s . o r g / f o r - m e d i a /2005pressreleases/ diabeticneuropathy.jsp.Accessed Sept. 21, 2009.
17. Borssen B, Bergenheim, Lithner F. Theepidemiology of foot lesions in diabetic patientsaged 15-50 years. Diabetic Med. 1990; 7: 438–444.
18. Reiber GE, Boyko EJ, Smith DG. Lower extremityfoot ulcers and amputation. In Diabetes in America.2nd ed. 1995. Washington, DC. Department ofHealth and Human Services.
19. Gordois A, Scuffham P, Shearer A, et al. The healthcare costs of diabetic peripheral neuropathy in theU.S. Diabetes Care. 2003; 26: 1790–1795.
20. Reiber GE, Vilekyte L, Bokyo EJ, et al. Causalpathways for incident lower-extremity ulcers inpatients with diabetes from two settings. DiabetesCare. 1999; 22: 157–162.
21. Pecoraro RE, Reiber GE, Burgess EM. Pathways todiabetic limb amputation. Basis for prevention.Diabetes Care.1990; 13: 513–521.
22. Somers DL, Somers MF. Treatment of neuropathicpain in a patient with diabetic neuropathy usingtranscutaneous electrical nerve stimulationapplied to the skin of the lumbar region. Phys Ther.1999; 79: 767–775.
23. Dinesh Kumar, MD, Inderjeet S. Julka, MD, MichaelS. Alvaro, DPM & Howard J. Marshall, DPM.Diabetic Peripheral Neuropathy. Effectiveness ofelectrotherapy and amitriptyline for symptomaticrelief Diabetes Care. Diabetes Care.1998; 21: 1322-1325.
3. apeksha 25th may--11-13.pmd 2/7/2013, 8:08 PM13

14 Indian Journal of Physiotherapy & Occupational Therapy. January-March 2013, Vol. 7, No. 1
Evaluation of effects of Nebulization and BreathingControl in Asthmatic Patients
Kesharia1, Amita Mehta2
1M.P.Th., Cardiovascular and Respiratory Sciences, 2Professor & Head, P.T. School and Centre, Seth G.S.M.C. andK.E.M. Hospital, Parel, Mumbai.
ABSTRACT
Background: Asthma is a disease characterized by airflow limitation that is either fully or partiallyreversible. There is a growing realization that in asthma the airflow limitation leads to further mechanicalconsequences that result in dyspnea which is also a very important domain along-with airflow limitationto build up strategies to effectively cope up with asthma. To treat asthma effectively means to achieve abetter level of control of asthma. Various strategies have been adopted by the patients themselves tokeep their asthma level in control and avoid frequent exacerbations. Asthma has many dimensions toit rather than only airway obstruction. Asthma is affected by anxiety, cold, emotional quotient & also bythe level to which other non- pharmacological means to control asthma adopted by the patient likeyoga, meditation and various breathing strategies. It was seen that pharmacological measures thoughwere very essential to treat asthma, but along-with its long term use; factors like adverse effects ofmedications, patient's non-compliance, cost effectiveness of treatment, patients sense of satisfaction oftheir disease control came into focus. Hence, various non-pharmacological measures were researchedin the past trials, of which breathing control was one of the measures used.
Purpose: The purpose of our study was to evaluate the effects of nebulization and breathing control(N+B combination) as against only breathing control(B) on airway obstruction [by measuring peakexpiratory flow rate(PEFR), forced expiratory volume in 1st second(FEV1) and dyspnea [by measuringrespiratory rate (RR) and rate of perceived exertion (RPE)] in asthmatic patients.
Method: In total, 60 patients were selected according to the inclusion and exclusion criteria. Writteninformed consent was taken from the patients and asthmatic patients were randomly allocated to twogroups either N+B or only B. Parameters PEFR, FEV1, RR and RPE on Borg's modified 10 point categoryratio scale were obtained before and after the treatment session. Data was analyzed using SPSS 15. Forstatistical significance, p value of <0.05 was considered.
Results: There was a statistically significant improvement in PEFR, FEV1, RR and RPE in both thegroups. However, there was no statistically significant difference in PEFR and FEV1 i.e. airwayobstruction between the two groups. But, there was a statistically significant difference in RR and RPEi.e. dyspnea between the two groups, with breathing control showing greater improvement in dyspnea.
Conclusion: Thus, asthmatic patients not only could reverse their airway obstruction (PEFR, FEV1)with Breathing control but also improved in terms of dyspnea (RR, RPE) as compared for Nebulizationand Breathing control group. Nebulization and Breathing control group though it showed statisticalsignificant improvement in airway obstruction(PEFR,FEV1) than only Breathing control; but the overallenergy expenditure and thermogenic effect of nebulization with salbutamol did not help reversedyspnea(RR and RPE)to the effect the breathing control could to.
Keywords: Asthmatics, Nebulization, Breathing control, Airway obstruction, Dyspnea.
INTRODUCTION
Asthma is a problem world wide, with an estimated300 million affected individuals.1The WHO hasestimated that 15 million disability adjusted life years(DALY‘S) are lost annually due to asthma. Absence fromschool and days lost from work are substantial social& economic consequences of asthma in studies fromIndia.1
In Asthma, the predominant feature clinically isepisodic shortness of breath, physiologically episodicairway obstruction characterized by expiratory airflowlimitation & pathologically airway inflammation,which persists even during the asymptomatic periods.Airway narrowing is the final common pathwayleading to symptoms and physiological changes inasthma.
4. bhakti 22ND oct--14--20.pmd 2/7/2013, 8:08 PM14

Indian Journal of Physiotherapy & Occupational Therapy. January-March 2013, Vol. 7, No. 1 15
Severity determines both the severity of theunderlying disease and its responsiveness to treatment,but it may change over months or years. Therefore,periodic assessment of asthma control is more relevantand useful. Asthma is a growing problem with a hugeeconomic burden. The annual cost of asthma to theNHS, constitutes about 83% i.e. Majority of it is due tomedications. Accordingly, the development andevaluation of interventions to prevent asthma, to reduceits severity or improve its prognosis are the priorityresearches.2
Pharmacotherapy is the mainstay of asthmamanagement, but the outcomes remain suboptimal forcomplex reasons including under treatment and non-compliance. 3 Also, many patients have concerns aboutregular medications and many use non-pharmacological and complementary therapiesincluding breathing modification techniques. 3 Therehas recently been renewed interest in the breathingtechniques used in asthma. 3
A 2000 systematic review of breathing techniquesconcluded that too few studies had been carried out towarrant firm judgments, but that collectively the dataimplied that physiotherapeutic breathing techniquesmay have some potential benefit4. A 2004 Cochranereview of breathing exercises for asthma concluded that,due to the diversity of breathing exercises and outcomesused, it was impossible to draw conclusions from theavailable evidence5.
A 2007 RCT demonstrated that breathing retrainingand relaxation significantly reduced respiratorysymptoms and improved health-related quality of lifein a cohort of patients with asthma.6 A 2008 RCT addsfurther strong support to this work, also findingsignificant reduction in asthma symptoms.7
Thus, various Physical therapy interventions aimedat overcoming dyspnea by overcoming early airwayclosure were chosen: Nebulization with selective B-2sympathomimetic bronchodilator i.e. Salbutamol &Breathing control- wherein during inspiration normaltidal volume breaths are taken; with more effective useof diaphragm as it itself is an active inspiratory muscleduring inspiration and during expiration, use of Pursedlip Breathing is emphasized.
Thus, it was important to understand the effect ofphysiotherapeutic techniques on dyspnea as a resultof airway obstruction in asthmatic patients & toappropriately emphasize breathing control techniques
in addition to pharmacological treatment & hence theabove study was undertaken.
Methodology Study design- Experimental study- ARandomized controlled trial. Study setting-Physiotherapy department, Seth G.S.M.C and K.E.M.H,Mumbai. Sample size- 60 patients with asthma whosatisfied the inclusion criteria were selected. Inclusioncriteria- Clinically diagnosed asthmatics in the agegroup of 18-35 8 years, either sex included, who werereferred for physiotherapy treatment. Exclusion criteria-Asthmatics with acute exacerbation in previous week1.Asthmatics with status asthmaticus9. Use ofbronchodilator puff, oral medications within last 6hours and patients on intravenous medications9.Patients having cardiac impairments, cardiac failure,hypertensives, those receiving Digitalis, in CorPulmonale9. Patients with other respiratory conditions,neurological, musculoskeletal and orthopediclimitations. Duration of study-2010-11
PROCEDURE
The study was approved by the ethics committee forresearch on human subjects (ECRHS) of the institute &written informed consent was taken from patients.Patients were assigned randomly in two groups bycomputer generated random number chart and given a30 minutes session:
Group I: Nebulization for 10 minutes and breathingcontrol for 20 minutes.(N+B)
Group II: Breathing control for 30 minutes. (B)
Starting position for both the groups-Patient sittingsupported with back support and hip knee flexed andboth hands placed just below the xiphisternum.
GROUP I: Asthmatic patients were given nebulizationand all the factors affecting deposition of drug particlesin the airways was taken into consideration.9 Asthmaticpatients were nebulized using salbutamol (Asthalin)with saline in the ratio of 1:1 i.e. 2 ml of Asthalin in 2 mlof saline; with Pulmomist nebulizer in relaxed sittingposition with head and neck adequately supported.Patients were asked to inhale the aerosol generated witha slight pause after inspiration9. Nebulization was givenfor 1st 10 minutes and same patients were givenbreathing control for next 20 minutes (during whichtime the peak effect of nebulization was also reached).Patients were given Breathing control immediately byusing8
4. bhakti 22ND oct--14--20.pmd 2/7/2013, 8:08 PM15

16 Indian Journal of Physiotherapy & Occupational Therapy. January-March 2013, Vol. 7, No. 1
a) Proper relaxed sitting position-sit with hip kneeflexion and lower back supported creating aposterior pelvic tilt position which facilitates use ofdiaphragm more effectively.
b) During inspiration-controlled diaphragmaticbreathing (only tidal volume breaths i.e.-normalinspiration was emphasized).
c) Relaxation of upper chest and shoulders by givingverbal commands and proprioceptive feedbackwhere necessary.
d) During expiration-pursed lips breathing (PLB) wasgiven.
Group II: Patients in this group were given 30 minutessession of breathing control only 10. The procedure forthe breathing control technique is same as above.
Parameters like –PEFR and FEV1 (using Mini-WrightDigital Peak flow meter), RPE on Borg‘s 10 point scale,
RR using watch were taken before and after theprocedure time for both the groups. Both the PEFR andFEV1 were taken in the standing position and the bestof the three efforts was taken.1 BTS Guidelines 11 werefollowed: PEF was recorded as the best of the threeforced expiratory blows from total lung capacity with amaximum pause of 2 seconds before blowing, withpatient in standing position. Further blows were doneif the larger of the 2 PEFR was not within 40 L/min.
RESULTS
Statistical analysis was done using software SPSSversion 15.The normal distribution of data was foundout with Kolmogorov-Smirnov Test. The collected datawas analyzed statistically with Paired t Test, Unpairedt Test, Mann Whitney U Test and Chi Square Test asappropriate. Characteristics of 60 asthmatic patients(Mean [95% C.I.]), Median (Range) is:
Parameters N+B B P Value Significance
No. of Cases (N) 30 30 - -
Age(years)* 30.33[27.33, 33.33] 31.37[29.21, 33.53] 0.498 Ns
Male:Female** 10:20 9:21 0.781 Ns
Severity (I:Mp:Mop:Sp)** 7:9:9:5 9:9:7:5 0.919 Ns
Pefr*( Liters/ Minute) 256.50[213.08,299.92] 278.00[235.14,320.86] 0.474 Ns
Fev1*(Liters) 1.31[1.06, 1.56] 1.60[1.34, 1.86] 0.112 Ns
Rr *(Breaths/ Minute) 32.267[30.185, 34.349] 32.667[30.572,34.581] 0.774 Ns
Rpe** (on Borgs’s 10 Point 2:0:5:12:9:2 2:0:5:10:10:3 0.75 NsScale At The Markof 0:0.5:1:2:3:4)
I:-Intermittent, MP:-Mild persistent, MoP:-Moderatepersistent, SP:-Severe persistent, NS-Non-Significant.Thus, the data for each of the parameter in N+B and Bgroup is statistically not significant & hence were
comparable. Following is the graphical representationof comparison within & between groups for all theparameters taken in the study.
1) Evaluation of peak expiratory flow Rate (PEFR) in N+B and B group
4. bhakti 22ND oct--14--20.pmd 2/7/2013, 8:08 PM16

Indian Journal of Physiotherapy & Occupational Therapy. January-March 2013, Vol. 7, No. 1 17
2) Evaluation of forced expiratory volume in 1st second (FEV1) in N+B and B group
3) Evaluation of Respiratory Rate (RR) in N+B and B group
4. bhakti 22ND oct--14--20.pmd 2/7/2013, 8:08 PM17

18 Indian Journal of Physiotherapy & Occupational Therapy. January-March 2013, Vol. 7, No. 1
DISCUSSION
To reduce the airway obstruction; two physiotherapymodalities mainly nebulization with bronchodilator andbreathing control were used. Thus, the overallcomparison between the two groups stated that: ForAirway Obstruction in two groups-
The difference in PEFR between both the groups i.e.;in nebulization and breathing control (N+B) andbreathing control (B) was not statistically significant(p=0.10). Similarly, the difference between the % changePEFR in (N+B) and (B) was not statistically significant(p=0.381). The difference in FEV1 between both thegroups i.e.; in nebulization and breathing control (N+B)and breathing control (B) was not statisticallysignificant (p=0.906). Similarly, the difference betweenthe % change FEV1 with (N+B) and (B) was notstatistically significant (p=0.21). For Breathing controlin two groups-
The difference in RR between both the groups i.e.; innebulization and breathing control (N+B) and
4) Evaluation of perceived exertion (RPE) in N+B & B group
breathing control (B) was statistically significant(p<0.001); indicating that breathing control (B) groupimproved better post intervention. The difference in RPEbetween both the groups i.e.; in nebulization andbreathing control (N+B) and breathing control (B) wasstatistically significant (p=0.028); indicating thatbreathing control (B) group improved better postintervention. Hence, both the maneuvers help effectivelyin improving airflow obstruction (PEFR, FEV1) anddyspnea (RR, RPE). Breathing control is more effectivein relieving dyspnea.
In a study done by Kendrick, et al it wasfound that the Modified Borg’s Score(MBS) is a validand reliable assessment tool for dyspnea and correlatedwell with other clinical parameters and could be usefulwhen assessing and monitoring outcomes in patientswith acute bronchospasm. In asthmatics, the mean MBSrating decreased from 5.1 at baseline to 2.4 aftertreatment. The mean PEFR increased from 286 atbaseline to 414 after treatment. In the asthma group,there was a significant negative correlation between
4. bhakti 22ND oct--14--20.pmd 2/7/2013, 8:08 PM18

Indian Journal of Physiotherapy & Occupational Therapy. January-March 2013, Vol. 7, No. 1 19
change score in MBS & change scores in the PEFR frompre-scores to post-scores (r = -.31, P < .05). As the PEFRscore increased, the MBS score decreased; thus the betterthe patients’ peak flow scores, the lower the patient’sdyspnea ratings12. Thus, the above may be one of thereasons the improvements in our study of decrease inairway obstruction and improvement in dyspnea gohand in hand.
Ambroso et al, found that inhaled salbutamolsignificantly increases the resting metabolic rate of thepatient due to thermogenic effects of salbutamolnebulization which may not effectively help to decreasethe perceived exertion and thus respiratory rate13.Theabove may be one of the reasons why nebulizationcomponent may have added the energy expenditureand hence dyspnea in terms of RR and RPE. This alsoemphasizes that PLB in our study does not increase theenergy cost of breathing as the dyspnea in terms of RRand RPE improve. By learning and understandingBreathing control, patients control their own breath,thus anxiety is also reduced; which is also one of thefactors why they perceive less dyspnea.
However, Lewis et al in a systematic reviewevaluated the short term effects on outcomes related tothe mechanism of intervention and physiologicaloutcomes. A beneficial effect was found for abdominalmovement, diaphragm excursion, respiratory rate, tidalvolume, arterial oxygen saturation. However, breathingcontrol had a detrimental effect on the work of breathingand dyspnea. The study proposed that when used as asole intervention, there was a beneficial effect onoutcomes related to the mechanism of intervention andphysiological outcomes. Only in people with severerespiratory disease, breathing control resulted in adetrimental effect on dyspnea and work of breathing.There was no clear evidence on gas exchange andenergy cost of breathing14.
Thus, the physiotherapeutic techniques used invarious above studies helps control the symptoms ofasthma and hence their manifestation. Also, most ofthe studies have evaluated the long term i.e. At least 1month and 6 month results of lung function and overallasthma control; but immediate effects of breathingcontrol were not studied. Thus, the improvements inlung function measures of PEFR and FEV1based onbreathing control techniques suggest that there isimmediate improvement in lung function measures.
Asthma is a chronic disease; the goal of treatmentshould be to decrease its overall manifestation andachieve a better level of control and hence improve the
overall Quality of life. Though, nebulization by B-2agonists showed immediate improvement in asthmasymptoms and lung function in terms of PEFR andFEV1. However, regular inhalation of B-2 agonists wasassociated with deterioration of asthma control andsuch trends in treatment may be an important causalfactor in the worldwide increase in the morbidity fromasthma. Whereas, when intervention with breathingcontrol was performed not only was there immediateimprovement in measures of PEFR and FEV1 andoverall symptoms; but also studies support the view ofregular use of breathing control techniques helps toachieve both the goals of treatment i.e. Decrease inoverall manifestation of asthma and improve Qualityof life. In view of all the above, breathing control is animportant technique to intervene dyspnea along-withproper pharmacological treatment.
CONCLUSION
All 30 patients in (N+B) and all 30 patients in (B)group responded and improved with intervention.Asthmatic patients showed statistically significantimprovement in airway obstruction and dyspnea withnebulization and breathing control and with onlybreathing control also. There was no statisticallysignificant difference between the groups in terms ofairway obstruction as measured by PEFR and FEV1.There was a statistically significant difference betweenthe groups in terms of dyspnea as measured by RR andRPE. Breathing control is more effective to reducedyspnea.
Acknowledgement - None
Conflict of interest- None
Source of support - Professor and Head ofPhysiotherapy Department.
REFERENCES
1. Global Initiative for asthma: global Strategy forAsthma Management and Prevention: GINA 2008Update. Bethesda, MD: National, Heart, Lung andBlood Institute, National Institutes of Health.Definition and Overview, Diagnosis andclassification, pg. 1-23. Available from URL: http://www.ginasthma.org
2) Cristopher A Kellett, Jacqueline A Mullan.Breathing Control Techniques in the Managementof Asthma.Volume 88, Issue 12, Pages 751-758(December 2002).
3) M Thomas, R K McKinley, S Mellor, G Watkin, EHolloway, J Scullion, D E Shaw, A Wardlaw, D
4. bhakti 22ND oct--14--20.pmd 2/7/2013, 8:08 PM19

20 Indian Journal of Physiotherapy & Occupational Therapy. January-March 2013, Vol. 7, No. 1
Price, I Pavord. Breathing exercises for asthma: arandomised controlled trial .Thorax 2009; 64:55-61.
4) E. Ernst. Breathing techniques - adjunctivetreatment modalities for asthma? A systematicreview Eur Respir J 2000; 15: 969-972.
5) Hollway E, Ram FS. Breathing exercises forasthma. Cochrane Database Syst Rev 2004;1):CD001277.
6) Elizabeth A Holloway, Robert J West. Integratedbreathing and relaxation training (the Papworthmethod) for adults in asthma with primary care: aRCT. Thorax 2007; 62: 1039-1042.
7) Cowie RL, Conley DP, Underwood MF. A RCT ofthe Buteyko technique as an adjunct toconventional management of asthma. Respir Med2008:726-732.
8) Donna Frownfelter, Elizazbeth Dean. Cardiopulmonary Pathophysiology. In Marjory Frazer,Donna Morrisey editors. Principles and practiceof Cardio pulmonary physical therapy; 3rd edition,Mosby Inc; 2006. P. 77,391,420-421.
9) R.B. Cole. Bronchodilator Drugs. In: editors.Respiratory Diseases. 2nd edition. ChurchillLivingstone Inc.; 1981:pg. no.190.
10) C A Slader, H K Reddel, L M Spencer, E GBelousova, C L Armour, S Z Bosnic-Anticevich, FC K Thien, C R Jenkins. Double blind randomisedcontrolled trial of two different breathingtechniques in the management of asthmaThorax 2006;61: 651-656.
11) Diagnosis of Asthma. Evidence 2.5.2.PeakExpiratory Flow Monitoring. Edinghburgh: SIGN2009.Available from url:http://www.sign.ac.uk/
12) Usefulness of the modified 0-10 Borg scale inassessing the degree of dyspnea in patients withCOPD and asthma Authors: San Diego, California.Karla R. Kendrick, Sunita C. Baxi, Robert M. Smith,Emergency Department and Urgent Care Clinic,Veterans Administration San Diego HealthCareSystem, San Diego, Calif.
13) P Amoroso, S R Wilson, J Moxham, J Ponte. Acuteeffects of inhaled salbutamol on the metabolic rateof normal subjects .Thorax 1993;48: 882-885.
14) Lewis LK, Williams MT, Olds T. Short-term effectson outcomes related to the mechanism ofintervention and physiological outcomes butinsufficient evidence of clinical benefits forbreathing control: a systematic review. Aust JPhysiother. 2007;53(4):219-227.
4. bhakti 22ND oct--14--20.pmd 2/7/2013, 8:08 PM20

Indian Journal of Physiotherapy & Occupational Therapy. January-March 2013, Vol. 7, No. 1 21
Effect of Neuromuscular Electrical Stimulation Combinedwith Cryotherapy on Spasticity and Hand Function in
Patients with Spastic Cerebral Palsy
Chandan Kumar1, Vinti2
1Assistant Professor, 2M.p.t (Neurology-student)), M. M. Institute Of Physiotherapy And Rehabilitation, Mullana, Ambala
ABSTRACT
Purpose: To determine the effectiveness of Neuromuscular electrical stimulation combined withCryotherapy on spasticity and hand function in patients with spastic Cerebral Palsy. Children with CPoften demonstrate poor hand function due to spasticity in wrist and finger flexors.
Methodology: This was an experimental study of 30 spastic CP patients aged 5-15 yr with mild tomoderate spasticity. All the subjects were divided into two groups (A & B) with equal subject number ineach group. Group A were treated with passive stretching, cryotherapy followed by NeuromuscularElectrical Stimulation (NMES) and Group B treated with passive stretching and cryotherapy, 3 times aweek on alternate days for 6 weeks. Spasticity and hand function were assessed pretreatment and posttreatment using the Modified Ashworth Scale (MAS) and Manual Ability Classification System (MACS).We tried to find out the additional effect of NMES on spastic CP patients.
Results: Showed that both the group improved significantly but group A improved much better thangroup B.
Conclusions: This study suggests that NMES combined with cryotherapy is more effective as comparedto cryotherapy alone in reducing spasticity and improving hand function in spastic CP patients.
Keywords: Spasticity, Cerebral Palsy, Neuromuscular Electrical Stimulation, Cryotherapy.
INTRODUCTION
Cerebral palsy is a well-recognizedneurodevelopmental condition beginning in childhood& persisting throughout the lifespan. Cerebral palsy isa group of permanent disorders of the development ofmovement and posture, causing activity limitation, thatare attributed to non-progressive disturbances thatoccurred in the developing fetal or infant brain. Themotor disorders of cerebral palsy are often accompaniedby disturbances of sensation, perception, cognition,communication, and behavior; by epilepsy, and bysecondary musculoskeletal problems.1 Cerebral palsyis the commonest physical disability in childhood,occurring in 2.0 to 2.5 per 1000 live births.2 The causesare congenital, genetic, inflammatory, infections, anoxic,traumatic & metabolic. The injury to the developingbrain may be prenatal, natal or postnatal.3 Causes ofCP were prenatal in 50% of the cases, perinatal in 33%,postnatal in 10%, and mixed in 7%.4 75% of childrenwith CP have spastic cerebral palsy.3 Spasticity isclassically defined as a tonal abnormality of skeletalmuscle characterized by a velocity-dependent
resistance to passive stretch.5 Studies done to find outdevelopment of spasticity with age shown that thedegree of muscle tone increased upto 4 year of age. After4 year of age the muscle tone decreased each year upto12 year of age.6
Physiotherapy Treatment For Spasticity
Various treatment approaches & modalities tomanage spasticity associated with spastic cerebral palsyinclude the use of oral neuropharmacological agentsor injectable materials such as botulinum-A toxin7,surgical treatment through tendon transfer8 or selectiverhizotomy9. The other treatment approaches areapplication of cryotherapy10, progressive resistiveexercises to improve muscle strength, repetitive passiverange of motion exercises to improve & maintain jointmobility. Passive, static, gentle stretches are performedon individual joints to decrease & prevent jointcontractures. Neurodevelopmental treatment (NDT),sensory integration, electrical stimulation, constrainedinduced therapy & orthosis are also used inmanagement of cerebral palsy.11, 12
5. chandan kumar 17TH april-21-25.pmd 2/7/2013, 8:08 PM21

22 Indian Journal of Physiotherapy & Occupational Therapy. January-March 2013, Vol. 7, No. 1
CRYOTHERAPY
Cold application has been used for some time toreduce spasticity clinically. Decrease in resistance topassive stretch lasts from a few minutes up to 24 hours.Cold anesthesia of peripheral sensory end-organschanges the balance of facilitatory-inhibitory influencesplaying on the anterior horn cell in favor of inhibition.Unmasking of spasticity permits strengthening ofvoluntary mechanisms normally snowed under byundesired reflexes.10
Neuromuscular Electrical Stimulation
Neuromuscular electrical stimulation has gainedsupport since its inception as a treatment for cerebralpalsy in the 1970s. With neuromuscular electricalstimulation, electrical stimulation of sufficient intensitygenerally to produce visible muscle contraction isapplied at the muscle motor point. Electrical stimulationis thought to improve strength, reduce spasticity of theantagonist muscle, reduce co-contraction, and createsoft-tissue changes permitting increased range ofmotion.13 There are few studies that report theeffectiveness of NMES and cryotherapy on reduction ofspasticity & improvement of hand function in patientswith spastic cerebral palsy and found that both themodalities used are effective and none of the twomodalities is superior to other.14 Therefore, aim of thisstudy is to determine the effectiveness ofNeuromuscular electrical stimulation combined withCryotherapy on spasticity and hand function inpatients with spastic Cerebral Palsy.
In present study, hand function is measured usingthe Manual Ability Classification System (MACS)instead of Zancolli system14 because a review ofclassification systems of upper limb function &deformity in cerebral palsy supports the use of MACSto classify upper limb function and Zancolli system isrecommended to classify thumb, hand &wristdeformity.15
METHODOLOGY
30 subjects were selected by means of conveniencesampling based on inclusion and exclusion criteria.All the parents received a written explanation of thetrial before entry into the study and then gave signedconsent to participate their children in the study. Thepatients were randomly allocated into 2 groups.
INCLUSION CRITERIA
1. Patient diagnosed with spastic cerebral palsy(quadriplegic and hemiplegic).
2. Patient having wrist flexor spasticity upto Grade 3according to Modified Ashworth Scale.
3. Age 5-15 yr, both male & female.
4. Patient who can comprehend and comply withinstructions.
5. Normal skin sensation of upper limb.
EXCLUSION CRITERIA
1. Dermatological problems
2. Seizures
3. Patients on muscle relaxing medications
4. Patient having contracture or deformity of upperlimb
5. Patient undergone any surgery for upper limb
PROCEDURE
Thirty patients of CP who fulfill the inclusion criteriawere included in this study. Total numbers of patientswere equally divided into two groups (A & B). Eachgroup contained 15 patients. All participants wereevaluated by modified ashworth scale for wrist flexorspasticity and manual ability classification system forhand function.
Modified Ashworth Scale measure spasticity and isapplied manually to determine the resistance of muscleto passive stretching. This scale has been shown toovalid and reliable.16 Manual Ability Classificationsystem describes how children with cerebral palsy (CP)use their hands to handle objects in daily activities.MACS describe five levels. The levels are based on thechildren’s self-initiated ability to handle objects andtheir need for assistance or adaptation to performmanual activities in everyday life. The objects referredto are those that are relevant and age-appropriate forthe children, used when they perform tasks such aseating, dressing, playing, drawing or writing.17 MACShas shown to be valid and reliable.18 All patients wereassessed by modified ashworth scale and manualability classification system before and after givingintervention.
5. chandan kumar 17TH april-21-25.pmd 2/7/2013, 8:08 PM22

Indian Journal of Physiotherapy & Occupational Therapy. January-March 2013, Vol. 7, No. 1 23
The technique for application of passive stretchingwas based on passive range of motion (PROM)therapeutic exercises described by Kisner and Colby.19
The PROM consists of moving the elbow, wrist, fingersand thumb passively and holding it in position for 60seconds. This procedure was repeated 5 times givingduration of 5 minutes bout. The procedure of passivestretching was given prior to every treatment session inall the subjects, both in group A & B.
Treatment procedure for group A subjects
The subject was placed in sitting position. The entireforearm from elbow to the fingers was carefully anddecently exposed. The area was cleaned with cottonwool and with methylated spirit. The upper limb of thesubject was positioned on a pillow on the plinth withthe shoulder in mild abduction. The forearm was alsopositioned in mid flexion and supination with thefingers and thumb in anatomical position .The icelollipop was applied to the flexor compartment of theforearm and gently massaged using stroking techniquefrom the proximal to the distal end of the forearm. Thiswas applied continuously for 20 minutes. The sequenceof treatment was 3 times a week on alternate days for 6uninterrupted weeks.
After cryotherapy, subjects received electricalstimulation to the dorsum of the forearm. The electricalstimulation was consist of a dual channel devise withcurrent outcome between 0 and 100 MA , pulse widthof 200 microseconds and the pulse set between 30 and40 Hz to produce tolerable muscle contraction. Theelectrical stimulation was applied for duration of30minutes, 3 times in a week on alternate days for aperiod of 6 uninterrupted weeks.
Treatment procedure for group B subjects
Following the application of passive stretching, thesubjects received Cryotherapy as describe for thesubjects in group A.
Data and Statistical Analyses
Comparison was performed between the groups firstat baseline level. Then again, comparisons were doneafter treatment at 6 week as well as from baseline to 6week and results were noted. Wilcoxon signed ranktest and Mann Whitney U test was used to analyze thepre and post treatment values of MAS scores and MACSscores within the groups and between the groupsrespectively. The level of significance was set at p<0.05.Data were analyzed using SPSS 17.0.
RESULTS
Patients in both the groups were assessed at baselinelevel for spasticity with modified ashworth scale &hand function with manual ability classification scaleprior to the commencement of the treatment sessions.Post-test measurements were taken after 6 weeks aftercompletion of treatment sessions. There were no dropouts in the study. A total of 16 female and 14 malesubjects participated in the study.
Demographic characteristics of both the group areshown in table 1.
Table: 1 Demographic characteristic of the subjects
VARIABLES GROUP A GROUP B
Sex F:M 7:8 9:6
Mean Age 7.53 ± 1.35 7.66 ± 1.63
Spastic CP (Type)
Quadriplegic (%) 8 (53%) 7 (46%)
Right Hemiplegic (%) 5 (33.3%) 5 (33.3%)
Left Hemiplegic (%) 2 (13.3%) 3 (20%)
Dominating hand (number)
Right hand 15 15
Above table showing that subjects in both the groupsare matched for baseline level
Table: 2 Baseline score of MAS and MACS ofboth the group
MAS MACS
A B A B
Mean± S.D 2.46±0.611 2.33±0.587 4.60±0.632 4.53±0.639
P value (<0.05) 0.59 0.77
Above table showing mean value of baseline scoresof MAS & MACS of both groups. After analysis, the pvalue is >0.05 which is statistically non-significant.
Table: 3 Pre and Post value of MAS and MACS ofgroup A
GROUP A
Variables Mean ± S.D p value (<0.05)
Pre value Post value
MAS 2.466±0.611 1.333±0.408 0.0003
MACS 4.60±0.632 2.53±0.833 0.0003
Above Table showing mean value of pre MAS andpost MAS & pre MACS and post MACS of group A.After analysis, p value is <0.05 which is statisticallysignificant.
5. chandan kumar 17TH april-21-25.pmd 2/7/2013, 8:08 PM23

24 Indian Journal of Physiotherapy & Occupational Therapy. January-March 2013, Vol. 7, No. 1
Table: 4 Pre & post value of MAS andMACS of group B
GROUP A
Variables Mean ± S.D p value (<0.05)
Pre value Post value
MAS 2.333±0.587 1.666±0.308 0.0008
MACS 4.53±0.639 3.46±0.828 0.0005
Above Table showing mean value of pre MAS andpost MAS & pre MACS and post MACS of group B.After analysis, p value is <0.05 which is statisticallysignificant.
Table: 5 Post intervention MAS and MACS value ofgroup A & B
MAS MACS
A B A B
Mean ± S.D 1.33±0.408 1.66±0.308 2.53±0.833 3.46±0.828
P value (<0.05) 0.02 0.01
Above Table showing mean value of postintervention scores of MAS & MACS of both groups.
The result obtained from the study data showed thatthere was significant difference within group A and Bin reducing spasticity and improving hand function.Group A showed more significant difference in outcomemeasures in comparison to group B.
DISCUSSION
In this experimental design study, result showedthe combined effect of neuromuscular electricalstimulation and cryotherapy on spasticity and handfunction in patients with spastic cerebral palsy. Theresults support the hypothesis that NMES along withcryotherapy produce good results as compared tocryotherapy alone. Cold facilitates alpha-motor neuronactivity and decreases gamma motor neuron firingthrough stimulation of cutaneous afferents. There isalso a decrease in the afferent-spindle discharge bydirect cooling of the muscle. When nerves are cooled,synaptic transmission are impeded or blocked byaltering the transmembrane ionic flow. The possibleexplanation of the mechanism of relief of spasticity canbe that cold anesthesia of peripheral sensory end-organs changes the balance of the sum of facilitatory-inhibitory influences playing on the anterior horn cellin favor of inhibition. Unmasking of spasticity permitsstrengthening of voluntary mechanisms normallysnowed under by undesired reflexes.10
The results of this study are supported by previousstudies which tell that the neuromuscular electricalstimulation is helpful in increasing muscle strength byincreasing cross sectional area of the muscle & byincreasing recruitment of Type 2 muscle fibers.12 WithNMES, unused muscles can be stimulated when neededand the sensory input from NMES can give addedsensory awareness of what is happening in the handto allow motor learning to occur and to permit motorcontrol.20 Neuromuscular electrical stimulation, whenapplied to the peripheral muscles has a direct effect onthe cerebral cortex.21 In group A as we have givencryotherapy first and after that NMES, combined effectof both the modalities leads to significant improvementin experimental group.
Result of this study showed that improvement ismore significant in subjects of group A treated withcryotherapy followed by neuromuscular electricalstimulation when compared with subjects of group Btreated with cryotherapy alone (table 5). This showedthat additional improvement in group A is because ofneuromuscular electrical stimulation. First cryotherapyhas reduced spasticity in wrist flexors and then NMESapplied to wrist extensors has further reduced spasticityin wrist flexors via reciprocal inhibition and increasedstrength in wrist extensors. Few studies have been doneon neuromuscular electrical stimulation andcryotherapy in isolation which shows their effectivenessbut the result obtained from this study is novel thatproves the combined efficacy of neuromuscularelectrical stimulation and cryotherapy on spasticity.Neuromuscular electrical stimulation is a non-invasivetherapy and offers a better clinical outcome.
CLINICAL IMPLICATION
The results of the present study enlighten the use ofcombination therapy approach (NMES+Cryotherapy)as an more effective approach than the eitherintervention alone in the clinical settings for themanagement of spasticity and hand function in patientswith spastic cerebral palsy.
Limitations of the study
Subjective measures used for measuring spasticityand hand function challenges the results obtained. Nofollow up was taken to see the long term effects.Dominating hand was only treated in quadriplegics toavoid collecting paired data.
5. chandan kumar 17TH april-21-25.pmd 2/7/2013, 8:08 PM24

Indian Journal of Physiotherapy & Occupational Therapy. January-March 2013, Vol. 7, No. 1 25
Future Research Suggestion
Future research can be done using objectivemeasures for measuring spasticity and hand function.There should be long term follow up of the patient todetermine the sustained effects of combination therapy(NMES+Cryotherapy).
CONCLUSION
This study describes the management of spasticcerebral palsy patients with hand functionimpairments, who responded favorably to anintervention program focused NMES and cryotherapy.
REFERENCES
1. R peter, P. Nigel, G murray, G martin. The Definitionand classification of cerebral palsy. DevelopmentalMedicine & Child Neurology. 2007; 49(109):8–14.
2. Reddihough Dinah S, Collins Kevin J. theepidemiology and causes of cerebral palsy.Australian Journal of Physiotherapy. 2003; 49:7-12.
3. S. chitra, M nandani. Cerebral palsy-definition,classification, etiology and early diagnosis. Indianjournal of pediatric. 2005: 865-868.
4. Holm Vanja A. the Causes of Cerebral Palsy. JAMA.1982; 247:1473-1477.
5. R Susan, G Joan T. Non operative management ofspasticity in children. Child nervous system. 2007;23:943-956.
6. H Gunnar, W philippe. Development of spasticitywith age in a total population of children withcerebral palsy. BMC Musculoskeletal Disorder.2008; 9:150-159.
7. Patel Dilip R, S olufemi. Pharmacologicalintervention for reducing spasticity in cerebralpalsy. Indian journal of pediatrics. 2005; 72:896-872.
8. Das Shakti P, Mohanthy Ram N, Das Sanjay K.Management of upper limb in cerebral palsy-roleof surgery. IJPMR. 2002 April; 13:15-18.
9. F Jean P, J abdulrehman. Selective dorsal rhizotomyin the treatment of spasticity related to cerebralpalsy. Child nervous system. 2007 July 21; 23:991-1002.
10. Mead Sedwick, Knott Margaret. TopicalCryotherapy: Use for Relief of Pain and Spasticity.California Medicine. 1966; 105(3):179-181
11. Sharan Deepak. Recent advances in managementof cerebral palsy. Indian journal of pediatric. 2005;72:969-973.
12. Patel Dilip R. Therapeutic intervention in cerebralpalsy. Indian journal pediatrics. 2005; 72:979-983.
13. Kemper Derek G, Yasukawa Audyer M. Effects ofneuromuscular electrical stimulation treatment ofcerebral palsy on potential impairmentmechanism. Pediatric physical therapy. 2006;18:31-38.
14. Akinbo S R A, Tella B A, Otunla A. Comparison ofthe effect of neuromuscular electrical stimulationand cryotherapy on spasticity and hand functionin patient with spastic cerebral palsy. Nigerianmedical practitioner. 2007; 51:128-132.
15. K McConnell, L Johnston, C Kerr. Upper limbfunction and deformity in cerebral palsy: a reviewof classification systems. Dev Med Child Neurol.2011; 53(9): 799-805.
16. Bohannon Richard W, Smith Melissa B. InterraterReliability of a Modified Ashworth Scale of MuscleSpasticity. Physical Therapy 1987 Feb; 67(2):206-207.
17. Kuijper M. A, Ketelaar M. Manual abilityclassification system for children with cerebralpalsy in a school setting and its relationship tohome self-care activities. American Journal ofOccupational therap. 2010; 64:614-620.
18. Eliasson Ann-Christin, Krumlinde-SundholmLena, Rosblad Birgit, Beckung Eva, ArnerMarianne, Ohrvall Ann-Marie, Rosenbaum Peter.The Manual Ability Classification System (MACS)for children with cerebral palsy: scale developmentand evidence of validity and reliability.Developmental Medicine & Child Neurology 2006;48(7):549-554. DOI: 10.1017/S0012162206001162
19. Kisner C, Colby L. A. Therapeutic Exercise:Foundation and Techniques. 4thed. New Delhi:Jaypee Brothers, Medical Publishers (P) Ltd; 2003.
20. Scheker L R, Ramirez S. Neuromuscular electricalstimulation and dynamic bracing as a treatmentfor upper extremity spasticity in children withcerebral palsy. Journal of hand surgery. 1999;24:226 -232.
21. Han BS, Jang SH, Chang Y, Byun WM, Lim SK,Kang DS. Functional magnetic resonance imagefinding of cortical activation by neuromuscularelectrical stimulation on wrist extensor muscles.Am J Phys Med Rehabil. 2003 Jan; 82(1):17-20.
5. chandan kumar 17TH april-21-25.pmd 2/7/2013, 8:08 PM25
26 Indian Journal of Physiotherapy & Occupational Therapy. January-March 2013, Vol. 7, No. 1
Phonophoresis in Continuous Mode Ultrasound hasSignificant effect in the Reliving Pain in Upper Trapezius
Tender Point
Chhavi Gupta1, Manish Rajput1, Ankita Samuel1, Sumit Kalra2
1Student-bachelors of Physiotherapy, 2Asst Professor, Banarsidas Chandiwala Institute of Physiotherapy
ABSTRACT
Purpose: The aim of this study was to find the significance of continous mode on the immediate effecton pain threshold and range of motion which follows a single treatment of tender points in the uppertrapezius muscle among using diclofenac sodium as coupling medium.
Methods: 30 subjects presenting with upper trapezius muscles spasm, aged 20-30 years old, participatedin this Study. Subjects underwent a screening process to establish the presence of tender points inupper trapezius muscle. Subjects were divided randomly into 2 groups.
Group A = continuous mode of ultrasound (0.8 w/cm2 for 5 minutes)
Group B = pulsed mode of ultrasound (0.8 w/cm2 for 5 minutes)
Visual Analogue Scale and Range of Motion is assessed pre treatment and immediately post treatment.
Result the p value of VAS (post treatment) and ROM (post treatment) in continous mode was 0.000
Conclusion: continous mode of ultrasound is better for immediate pain relive as compared to pulsedmode when diclofenac sodium is used as the coupling medium.
Keywords: Tender Point, Phonophoresis, Ultrasound, Diclofenac Gel.
INTRODUCTION
Neck pain is common and can limit individual’sability to participate in normal daily activities. Neckpain frequently becomes chronic1.
Tender point is defined as the places on musclesthat when touched with enough pressure, elicits afeeling of sensitivity in the location of point. Pain doesnot refer anywhere else in the body; pain is confined totender point itself. They are usually no bigger than 1cm 2.
The presence of tender points in patients is closelyassociated with their current anxiety, and patients witha history of psychological trauma associated withanxiety (for example, childhood trauma or sexual abuse)have an increased number of tender points.4
US is a modality which involves the generation ofhigh frequency sound waves, and their transmissionthrough the skin to the structures desired to be affected.US generators used clinically are limited by government
regulation to approximately 1,000,000 Hertz (1megahertz).5
Phonophoresis was first used to treat polyarthritisof the hand by delivery of hydrocortisone ointment intoinflamed areas in 1954. Since then it has been reportedto be used in the treatment of various dermatologicaland musculoskeletal disorders.7
The mechanism by which ultrasound enhances thetransdermal penetration of substances is not entirelyclear. One could think of the vasodilation observed onmacroscopic examination, but this would certainly notbe enough on its own, since it does not imply anychange of the waterproof keratin layer of the skin, whichshould necessarily be altered.8
Sodium Diclofenac was chosen for the experimentfor being a well-known and widely used nonsteroidalanti-inflammatory drug whose analgesic effectsmanifest quickly after administration.8 Evidence fromclinical and pharmacological studies imply thatDiclofenac exerts its actions by inhibiting cycloxygenase
6. chhavi gupta 5th april --26-30.pmd 2/7/2013, 8:08 PM26

Indian Journal of Physiotherapy & Occupational Therapy. January-March 2013, Vol. 7, No. 1 27
(COX) enzyme. Inhibition of COX reduces theproduction of inflammatory mediators such asprostaglandins, interleukin-6 and substance P. It is alsosuggested that Diclofenac can alter G-protein mediatedsignal transduction pathways and exerts an enhancedeffect on hyperalgic muscle by directly interacting withnociceceptors.11
Reliability of the visual analogue scale formeasurement of pain
A VAS is measurement instrument that tries tomeasure a characteristic or attitude that is believed torange across a continuum of values and can’t easily bedirectly measured.9
Operationally a VAS is usually a horizontal line,100mm in length, anchored by word descriptors at eachend. The patient marks the line the point they feel whichrepresents their perception of their current state. TheVAS score is determined by measuring inn millimetresfrom left hand end of the line to the point that the patientmarks.9
Reliability of the VAS for acute pain measurementas assessed by the ICC appears to be high. Ninetypercent of the pain ratings were reproducible within 9mm. These data suggest that the VAS is sufficientlyreliable to be used to assess acute pain.10
Reliability of Goniometer
The full-circle goniometer, or universal goniometer(UG), is a versatile device for recording measurementsof peripheral joint ROM in healthy subjects and inpatients. Based on a clinical study of 60 patients withorthopaedic disorders in a physical therapy outpatientdepartment, conclusion was drawn that AROMmeasurements on the cervical spine made by the samephysical therapist have good to high reliability,regardless of whether the therapist used the CROMdevice or the UG. Repeated measurements with the UGhad poor to fair between tester reliability.15
The purpose of this study is to compare theeffectiveness of pulsed and continuous ultrasoundwith topical Diclofenac gel as the coupling medium inthe immediate pain relive of tender point.
METHODOLOGY
Number and Source
30 subjects were taken from young population.
Inclusion Criteria
1. Male or Female with age of 20-30 years.
2. Subjects with upper trapezius muscle spasm.
Exclusion Criteria
1. Subjects with trigger point of trapezius muscle.
2. Subjects with musculoskeletal disorder that wouldlimit performance in these subjects.
3. Skin disorders which would irritate by eitherincrease in warmth of the part or by the lubricantswhich might be used, e.g. eczema.
4. In presence of malignant tumours.
5. In case of any previous fracture or surgery at neck.
6. All contraindications of ultrasonic therapy.
Method of selecting & assigning subjects to groups
40 subjects having an upper trapezius muscle spasmwere considered for this study. They were then screenedto remove the subjects who did not fulfil the criteria forthe study. After screening, the subjects they wererandomly divided into two groups.
Instruments and Tool used
1. Ultrasound machine Meditek Ultrasonic digital ,Meditek cooperation
2. Diclofenac sodium gel
3. Ultrasound gel
Research Design
It is an experimental design.
Variables
Independent variables- Ultrasonic Therapy
Dependent variables- Visual Analogue Scale
PROCEDURE
Subjects fulfilling the inclusion criteria were takeninto consideration. The procedure was explained to thesubjects and a written consent was taken afterexplaining the benefits and clearing the doubts of thesubject regarding study. After pain level assessment byhelp of visual analogue scale (VAS) and Range ofMotion using the universal goniometer they wererandomly divided into two groups namely, A and B.
6. chhavi gupta 5th april --26-30.pmd 2/7/2013, 8:08 PM27

28 Indian Journal of Physiotherapy & Occupational Therapy. January-March 2013, Vol. 7, No. 1
Group A were given pulsed ultrasound with diclofenacsodium as coupling medium and Group B were givencontinuous ultrasound with diclofenac sodium ascoupling medium. The ultrasound was given for 5minutes at 0.8 w/cm2 16. After the treatment pain leveland Range of Motion is taken again.
RESULT
A paired sample t test reveal a statistically reliabledifference between the mean number of VAS pre andpost in continous mode (M= 6.7333, s =1.03280) and(M= 3.9333, s =1.48645) that the t(14)=12.582, P(á)= .000at two tail test.
A paired sample t test reveal a statistically reliabledifference between the mean number of ROM pre andROM post in continous mode (M=27.0000, s=5.29150)and (M= 37.0667, s = 4.19977) that the t(14) = -11.093,P(á)= .000 at two tail test.
A paired samples t test reveal a statistically reliabledifference between the mean number of VAS pre andVAS post in pulsed mode (M=-6.8000, s = 1.32017) and(M 4.4000, s=1.50238) that the, t(14) =8.806, P(á) = .000.attwo tail test.
A paired samples t test reveal a statistically reliabledifference between the mean number of ROM pre andROM post in pulsed mode (M=-23.7333, s=10.73357)and (M=33.7333, s=9.51290) that the, t(14) = -10.569,P(á) = .000.at two tail test.
An independent-samples t-test was conducted tocompare VAS post treatment in pulsed mode andcontinous mode. There was a significant difference inthe scores for pulsed (M=4.4, SD=1.5) and continous(M=3.93, SD=1.48) conditions; t(28)=0.855, p = 0.400.the result suggest that VAS decreases more in continousmode than in pulsed mode.
An independent-samples t-test was conducted tocompare ROM post treatment in pulsed mode andcontinous mode. There was a significant difference inthe scores for pulsed (M=33.73, SD=9.51) and continous(M=37.06, SD=4.19) conditions; t(28)=-1.24, p=0.225.The result suggest that ROM increases more incontinous mode.
6. chhavi gupta 5th april --26-30.pmd 2/7/2013, 8:08 PM28

Indian Journal of Physiotherapy & Occupational Therapy. January-March 2013, Vol. 7, No. 1 29
Hence it can be said that continuous mode has moreof a thermal effect rather than non-thermal.
Mild heating has the effect of reducing pain andmuscle spasm and promoting healing process. Kramer(1987), investigating the increase in conduction velocityin motor and sensory nerves following therapeuticultrasound, concluded that this was likely to be relatedto the heating effect of ultrasound.12
Diclofenac sodium is a very commonly used non-steroidal anti-inflammatory drug (NSAIDs). It is ananalgesic-anti-pyretic-anti-inflammatory drug, similarin efficacy to naproxen. It inhibits PG synthesis and issomewhat COX-2 selective.13
The mechanism by which ultrasound enhances thetransdermal penetration of substances is not entirelyclear. One could think of the vasodilation observed onmacroscopic examination, but this would certainly notbe enough on its own, since it does not imply anychange of the waterproof keratin layer of the skin, whichshould necessarily be altered.18
No volunteers presented any complication of anykind nor did they report any discomfort with thetreatment at any time, all of them resuming normal lifeimmediately after the end of treatment Apart from slightredness and a temperature increase on touch, no signof local irritation was detected by macroscopicinspection of the irradiated areas.8
CONCLUSION
The study concludes that continous mode ofultrasound is better for immediate pain relive ascompared to pulsed mode when diclofenac sodium isused as the coupling medium for immediate pain relivein tender point in muscles all over the body.
REFERENCES
1. Ali Gur; Physical Therapy Modalities inManagement of Fibromyalgia; CurrentPharmaceutical Design, 2006 12, 29-35
2. Haraldsson B, Gross A, Myers CD, Ezzo J, MorienA, Goldsmith CH, Peloso PMJ, Brønfort G, CervicalOverview Group. Massage for mechanical neckdisorders. Cochrane Database of SystematicReviews 2006, Issue 3. Art. No.: CD004871. DOI:10.1002/14651858.CD004871.pub3
3. Sheila Kitchen, Electrotherapy Evidence-basedPractice, Eleventh Edition, pg 221-228
DISCUSSION
According to the unpaired t test done between postvalues of VAS in case of pulsed mode and continousmode the p value is <0.005. The post value of ROM inpulsed mode and continous mode the p value is <0.005.
In this study, the clinical efficacy of diclofenac gelas a coupling agent using continuous mode of wascompared with pulsed mode.
According to the study, by using continuous modeof ultrasound there is more pain relive rather than byusing pulsed mode.
Continuous mode has been recommended formuscular cellular disorders such as muscle spasm, jointstiffness or pain whereas pulsed mode is preferred forsoft tissue repair.12
This could be because in pulsed mode the timeaverage intensity is reduced which reduces the amountof energy available to heat the tissues while ensuringthat the energy available in each pulse is high enoughfor mechanical or non-thermal effects rather than thethermal effects to predominate.12
6. chhavi gupta 5th april --26-30.pmd 2/7/2013, 8:08 PM29

30 Indian Journal of Physiotherapy & Occupational Therapy. January-March 2013, Vol. 7, No. 1
4. Sangita Chakrabarty, Md, Msph, Roger Zoorob,Md, Mph; Fibromyalgia; American FamilyPhysician; Volume 76, Number 2 July 15, 2007
5. Sunday Akinbo, Oluwatoyosi Owoeye, SundayAdesegun; Comparison of the TherapeuticEfficacy of Diclofenac Sodium and MethylSalicylate Phonophoresis in the Management ofKnee Osteoarthritis; Turk J Rheumatol2011;26(2):111-119
6. Peter Croft, Jonathan Burt, Joanna Schollum, ElaineThomas, Gary Macfarlane, Alan Silman; Morepain, more tender points: is fibromyalgia just oneend of a continuous spectrum?; Annals of theRheumatic Diseases 1996; 55: 482-485
7. Giovana c. Rosim, Cláudio Henrique Barbieri,Fernando Mauro Lanças, and Nilton Mazzer;Diclofenac Phonophoresis In Human Volunteers;Ultrasound in Med. & Biol., Vol. 31 No. 3 pp. 337-343, 2005
8. Russell Rothenberg, MD; Fibromayalgia,pathophysiology and treatment; Fibromyalgiafrontiers, 2010, vol. 18, No. 1
9. Prerna Paul et. al.; Effect of Lumbar StabilizationExercise in Treatment of Young Individuals WithNon Specific Low Back Pain; The PhysiotherapyPost; July-September 2011. Vol 3, No. 3
10. Afyonkarahisar, Turkey; Effectiveness ofUltrasound Therapy in Cervical Myofascial PainSyndrome: A Double Blind, Placebo-ControlledStudy; Turk J Rheumatol 2010; 25: 110-5
11. Robert D Gerwin; A review of myofascial pain andfibromyalgia – factors that promote theirpersistence; ACUPUNCTURE IN MEDICINE2005; 23(3):121-134.
12. John low BA(Hons.), FCSP, DipTP, SRP, Ann ReedBA, MCSP, DipTP, SRP; Electrptherapt ExplainedPrinciples and Practice, 3rd edition, pg 172-196
13. KD Tripathi; Essentials of Medical Pharmacology;6th edition; page 184-194
14. Bijur PE, Silver W, Gallagher EJ.; Reliability of thevisual analog scale for measurement of acute pain;Acad Emerg Med. 2001 Dec;8(12):1153-7
15. James W Youdas, James R Carey and Tom RGarrett; Reliability of Measurements of CervicalSpine Range of Motion-comparison of ThreeMethods; PHYS THER. 1991; 71:98-104
16. Kamal Dua, V.K.Sharma, UVS Sara, D.K.Agrawal,M.V.Ramana; Penetration Enhancers for TDDS: ATale of the Under Skin Travelers; Adv. in Nat. Appl.Sci., 3(1): 95-101, 2009
6. chhavi gupta 5th april --26-30.pmd 2/7/2013, 8:08 PM30

Indian Journal of Physiotherapy & Occupational Therapy. January-March 2013, Vol. 7, No. 1 31
Prediction of Relationship of Visual Attention Deficits toBalance and Functional Outcome in Persons with
Subacute Stroke
Chintan Shah1, Hasmukh Patel2, Komal Soni1, Dhaval Desai1, Harshit Soni1
1Lecturer, Spb Physiotherapy College, Surat, 2Clinical Therapist, U. N. Mehta Institute ofCardiology and Research Centre, Ahmedabad
ABSTRACT
Background: Stroke is a focal neurological disorder lasting for more than twenty-four hours, giving riseto functional disabilities in speech, vision, balance and ADL. As stroke has been found to impairvision, balance and ADL, this study is done to predict the relationship of visual attention deficits tobalance and functional outcomes in persons with subacute stroke. Awareness of such relationshipmay be of useful assistance to the physiotherapists in planning treatment interventions in personswith subacute stroke.
Objective: To predict and estimate strength of the relationship of visual attention deficit to balance andfunctional outcomes in persons with subacute stroke.
Materials and Methods: 50 subjects with subacute stroke were selected for the study. All the patientswere assessed on the basis of Star Cancellation Test (SCT), Berg Balance Scale (BBS) and Barthel Index(BI) for visual attention, balance and functional outcomes respectively both at the time of dischargefrom the hospital and also after 6 months post-stroke. At the end of the study, visual attention scoreswere correlated (using Pearson product correlation "r" value) with the balance scores and functionaloutcome scores obtained at the time of discharge from the hospital and 6 months post-stroke.
Result: Mean±SD of scores for Star Cancellation test, Berg Balance scale and Barthel index measured atthe time of discharge from hospital and 6 months post stroke was 48.09±2.04, 49.86±1.91, 40.00±2.00,42.60±1.90, 70.00±10.00, 75.10±9.92 respectively. Moreover, there was strong positive and highlysignificant correlation of SCT scores with BBS scores and BI scores both at the time of discharge and 6months post stroke.
Interpretation & Conclusion: Visual attention deficit is an important factor to predict the balance andfunctional outcomes in persons with subacute stroke.
Keywords: Stroke, Visual Attention Deficit, Balance, Functional Outcome.
Corresponding author:Chintan ShahB-701, Aagam Vihar Apt, Opp Lakhoz Club, Umra,Surat-07, Gujarat, IndiaE-mail: [email protected]
INTRODUCTION
Stroke is an acute onset of neurological dysfunctiondue to an abnormality in cerebral circulation withresultant sign and symptoms that correspond toinvolvement of focal areas of brain.1 Cognitive deficitsare common after stroke2,3 and have been linked to poorrecovery of ADL (Activities of Daily Living) abilitiesand rehabilitation outcome.4,5 For many people, theseimpairments are the major obstacles preventing theirreturn to independence and quality of life.6
Attention is one of the aspects of cognitivefunctioning that has been reported as the basis for othercomponents of cognition.7 Visual attention is a type ofselective attention that lays a very important role inbalance because balance is maintained mainly byfeedback through eyes, ears and vestibular apparatus.In this visual contribution is inevitable and if there isvisual inattention, then there will be difficulty infeedback mechanism and this will directly affect thebalance and eventually ADLs. Visual impairmentscommonly encountered by patient with hemiplegiainclude poor eyesight, diplopia, homonymoushemianopia, damage to visual cortex and retinaldamage.8 In its purest form, unilateral spatialinattention is defined as a condition in which anindividual with normal sensory and motor system fails
7. chintanshah 23rd april-31-36.pmd 2/7/2013, 8:08 PM31

32 Indian Journal of Physiotherapy & Occupational Therapy. January-March 2013, Vol. 7, No. 1
to orient toward, respond to, or report stimuli on theside contralateral to the cerebral lesion.9 Attention isalso a key component in learning new motor skills,particularly in the early stages of learning.10 This clearlyportraits that attentional component plays a veryimportant role in motor learning and also depictsimportance of attention in rehabilitation of strokepatients especially in Motor Relearning Programmewhich is the latest approach in physiotherapyrehabilitation.
In stroke, physical impairments include motor,sensory, balance, urinary impairment, speech disorder,perceptual problems, etc. Balance has been defined asthe ability to maintain upright posture.11,12 In stroke,one’s ability to balance may be impaired because ofdeficits of strength, range of movements, proprioception,vision, vestibular function and endurance.13 Studieshave showed that balance and perceptual disturbanceare found as risk factors for falls in stroke patients.14
ADL are the activities necessary for daily self care,personal maintenance and independent communityliving such as feeding, bathing, dressing, hygiene, andphysical mobility.15 Studies have reported decline incognition, mobility and functional daily activity afterstroke.16 Also the presence of visual field deficit is beingreported as a significant prognostic sign, predictingboth a higher death rate following stroke and poorperformance in ADLs, even following rehabilitation.17,18
Further, attention deficits being common amonghospitalized people with stroke, a study describingassociation between distractibility, auditory selectiveattention, balance and function impairments shownthat those who scored well on the auditory selectivetest had better balance scores at the final assessmentthan those with auditory selective attention deficits ordistractibility.19
However there are no clear cut studies that showthat whether visual attention deficits correlate withbalance, and eventually functional outcomes insubacute stroke patients. Keeping in view the abovepoint, this study is set out to predict the relationship ofvisual attention deficits to balance and functionaloutcome in patients with subacute stroke.
The aims and objectives of the study were
1. To find out the relationship between visualattention deficits and balance at the time ofdischarge and after 6 months post-stroke.
2. To find out the relationship between visualattention deficits and functional performance at thetime of discharge and after 6 months post-stroke.
METHODOLOGY
Study design: An Observational Correlation study
Sample size: 50 individuals
Sampling method: Purposive sampling technique
Study Setting: Laxmi Memorial College ofPhysiotherapy and A.J. Hospital and Research Centre,Mangalore
Study duration: 6 months (from the time of discharge ofpatient from the hospital upto 6 months post-stroke).
Inclusion criteria
1. Above 50 years of age.
2. Both sexes.
3. All type of stroke and first time stroke.
4. Attention deficits should be present in the patient.
5. Deemed to be fit by the physician and medicallystable.
6. Subjects should undergo continuous conventionalphysiotherapy.
Exclusion criteria
1. Major musculoskeletal problems (amputation orrecent joint replacement surgery).
2. Any other neurological disorders in addition tostroke.
3. Severe perceptual disorders.
4. Severe cognitive deficit (Mini Mental StateExamination score < 23/30).
Materials used: Test paper of size 8.5 inch x 11 inchwith 52 large stars, 13 letters and 10 short wordsinterspersed with 56 small stars for the testing of visualattention. Other materials included were pencil, stopwatch/wrist watch, ruler, two standard chairs (onewith and one without arm-rest), foot-stool or step.(Fig: 1)
7. chintanshah 23rd april-31-36.pmd 2/7/2013, 8:08 PM32
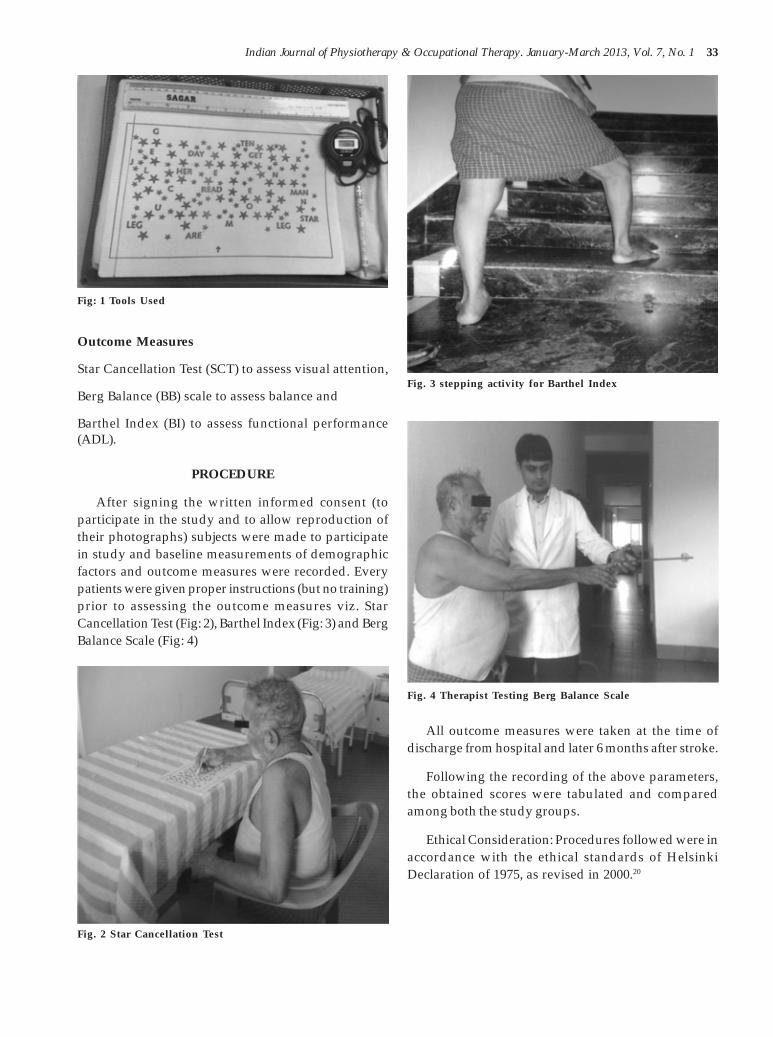
Indian Journal of Physiotherapy & Occupational Therapy. January-March 2013, Vol. 7, No. 1 33
Outcome Measures
Star Cancellation Test (SCT) to assess visual attention,
Berg Balance (BB) scale to assess balance and
Barthel Index (BI) to assess functional performance(ADL).
PROCEDURE
After signing the written informed consent (toparticipate in the study and to allow reproduction oftheir photographs) subjects were made to participatein study and baseline measurements of demographicfactors and outcome measures were recorded. Everypatients were given proper instructions (but no training)prior to assessing the outcome measures viz. StarCancellation Test (Fig: 2), Barthel Index (Fig: 3) and BergBalance Scale (Fig: 4)
All outcome measures were taken at the time ofdischarge from hospital and later 6 months after stroke.
Following the recording of the above parameters,the obtained scores were tabulated and comparedamong both the study groups.
Ethical Consideration: Procedures followed were inaccordance with the ethical standards of HelsinkiDeclaration of 1975, as revised in 2000.20
Fig: 1 Tools Used
Fig. 3 stepping activity for Barthel Index
Fig. 4 Therapist Testing Berg Balance Scale
Fig. 2 Star Cancellation Test
7. chintanshah 23rd april-31-36.pmd 2/7/2013, 8:08 PM33

34 Indian Journal of Physiotherapy & Occupational Therapy. January-March 2013, Vol. 7, No. 1
Statistical Analysis
Of the 50 participants who participated in the study,none were lost to follow up assessment at the end of thestudy.
At the end of the study, visual attention scores werecorrelated with the balance scores and functionaloutcome scores both at the time of discharge from thehospital and also after 6 months post-stroke. Pearsonproduct correlation “r” value was used to find therelationship among the variables. P value< 0.01 wastaken up for statistical significance. Data analysissoftware SPSS 13.0 version has been used for the dataanalysis of present study.
Table 1: Descriptive statistics for Outcome measures
Star Cancellation test Berg Balance Scale Barthel Index
Time of After Time of After Time of AfterDischarge 6 months Discharge 6 months Discharge 6 months
Min 45 51 37 43 55 85
Max 47 53 40 46 60 90
Mean 48.06 49.86 40.00 42.60 70 75.10
Std. Deviation 2.045 1.917 2.000 1.906 10.000 9.923
Table 2: Correlation of SCT scores with the BBS scores & BI scores at the time of discharge from the hospital
r value P Level ofSignificance/
Interpretation
Star Cancelation test Berg Balance Scale .978 .000 HS(Time of Discharge) (Time of Discharge)
Barthel Index .978 .000 HS(Time of Discharge)
As shown in table 2, there is strong positive and highly significant (p<0.01) correlation between SCT scores (atthe time of discharge) and BBS scores (at the time of discharge) and also between SCT scores (at the time ofdischarge) and BI scores (at the time of discharge).
Table 3: Correlation of SCT scores with the BBS scores & BI scores after 6 months post stroke
r value P Level ofSignificance
Star Cancelation test Berg Balance Scale(After 6 months) (After 6 months) .951 .000 HS
Barthel Index(After 6 months) .966 .000 HS
RESULTS
Graph 1: Age & Gender distribution of the subjects
As shown in table 3, there is strong positive andhighly significant (p<0.01) correlation between SCTscores (6 months post stroke) and BBS scores (6 months
post stroke) and also between SCT scores (6 monthspost stroke) and BI scores (6 months post stroke).
7. chintanshah 23rd april-31-36.pmd 2/7/2013, 8:08 PM34

Indian Journal of Physiotherapy & Occupational Therapy. January-March 2013, Vol. 7, No. 1 35
Table 4: Correlation of SCT scores at the time of discharge with theBBS scores & BI scores after 6 months post stroke
r value P Level ofSignificance
Star Cancelation test Berg Balance Scale .944 .000 HS(Time of Discharge) (After 6 months)
Barthel Index(After 6 months) .970 .000 HS
As shown in table 4, there is strong positive andhighly significant (p<0.01) correlation between SCTscores (at the time of discharge) and BBS scores (6months post stroke) and also between SCT scores (atthe time of discharge) and BI scores (6 months poststroke).
DISCUSSION
Stroke is a focal neurological disorder lasting formore than 24 hours, giving rise to functional disabilitiesin speech, vision, balance and ADL. Hence, in our studywe have tried to predict the relationship between visualattention deficits, balance and functional outcomes inpersons with subacute stroke. Results from our studyindicates that attention deficits were present among thepersons with subacute stroke, Sinclair R (1995) alsoreported similar findings using some of the samesubtests among subacute stroke patients.19 Moreover,the visual attention deficits have a significant influenceon the balance both at the time of discharge from thehospital and also after 6 months post-stroke. Sebstinaand Vyas (2001)21 also concluded that cognitive andperceptual deficits following stroke influences sittingand standing balance among patients. Visual attentionhas directly proportional relation with balance.However, findings of Stapleton and colleagues (2001)suggested a weak or no relationship between attentiondeficits and balance control, but their sample size beingtoo small (n=13) the results can be doubted for beingstatistically significancant.22
There was significant correlation between the SCTscores at the time of discharge from the hospital withthe BBS score and BI score after 6 months post-stroke.Thus, the present study not only finds the relationshipbetween visual attention, balance and functionaloutcome but it also predicts the balance and functionaloutcome after 6 months with the visual attention scoreat discharge. However, present study showed thatvisual attention deficits affect the balance andfunctional outcome significantly but visual attentiondeficit is not the only factor that can affect the balance
and functional outcome. The assessment of suchattention deficits post-stroke may be a useful tool inpredicting functional recovery and response torehabilitation. Awareness of possible deficits ofattention may be of assistance to physiotherapists inplanning interventions with patients recovering fromstroke.
Limitations of the study
• The study was done on a small sample size.
• The study only included visual attention amongthe various types of attention.
• Only old aged i.e. above 50 years patients withsubacute stroke were assessed to find the prediction,young age stroke patients were not at all assessed.
Scope of further studies
• In future studies, all types of attention (sustainedattention, divided attention, etc.) other than visualattention can be taken as predictor of balance andfunctional outcomes.
• Same study can be done in subacute stroke patientswithout ongoing physiotherapy.
• BBS does not include gait items so some other scalecan be used to assess the dynamic balance ofsubjects with stroke.
CONCLUSION
Visual attention deficits are an important factorresponsible for predicting balance and functionaloutcomes in persons with subacute stroke. There issignificant one to one relationship between visualattention deficit to balance and functional recovery inpersons with subacute stroke.
ACKNOWLEDGMENTS
We are thankful to all our subjects who participatedwith full cooperation and showed voluntary interest
7. chintanshah 23rd april-31-36.pmd 2/7/2013, 8:08 PM35
36 Indian Journal of Physiotherapy & Occupational Therapy. January-March 2013, Vol. 7, No. 1
REFERENCES1. Susan B. O’Sullivan, Thomas J. Schmitz, Physical
Rehabilitation: Assessment & treatment, 4th
Edition: Jaypee Brothers, 2001:519-5812. Hom J, Reitan RM. Generalized cognitive function
after stroke. J Clin Exp Neuropsychol. 1990Oct;12(5):644-654.
3. Pedersen PM, Jørgensen HS, Nakayama H,Raaschou HO, Olsen TS..Orientation in the acuteand chronic stroke patient: impact on ADL andsocial activities. The Copenhagen Stroke Study.Arch Phys Med Rehabil. 1996 Apr;77(4):336-339.
4. Wade DT, Skilbeck C, Hewer RL. Selected cognitivelosses after stroke. Frequency, recovery andprognostic importance. Int Disabil Stud. 1989 Jan-Mar;11(1):34-39.
5. Benson C, Lusardi P.Neurologic antecedents topatient falls. J Neurosci Nurs. 1995 Dec;27(6):331-337.
6. Polly Laidler, Stroke Rehabilitation-structure andstratergy, 1st Edition, 1994: 99-114
7. Whyte J .Attention and arousal: basic scienceaspects. Arch Phys Med Rehabil. 1992Oct;73(10):940-949.
8. Susan B. O’Sullivan, Thomas J. Schmitz, PhysicalRehabilitation: Assessment & treatment, 4th
Edition: Jaypee Brothers, 2001: 961-999. Dascy Umphred, Neurological rehabilitation, 4th
Edition:821-85110. Schmist R, Motor Control and Learning: A
behavioral emphasis (2nd Edition)Champaing, IL:Human Kinetic Publisher
11. Nashner LM (1989) Sensory, neuromuscular andbiomechanical contributions to human balance.In: Proceedings of the American Physical TherapyAssociation Forum. Nashville. TN. pp. 5-12.
12. Roberta Newton. Review of tests of standingbalance abilities. Brain Injury 1989; 3(4):335-43
13. Nashler L: Evaluation of postural stability,movement and control. In Hasson(ed): Clinicalexercise physiology, Philadelphia, CV Mosby, 1994
14. Lars Nyberg, Yngve Gustafson. Patient Falls inStroke Rehabilitation: A Challenge toRehabilitation Strategies. Stroke, 1995;26:838-42
15. Susan B. O’Sullivan, Thomas J. Schmitz, PhysicalRehabilitation: Assessment & treatment, 4th
Edition: Jaypee Brothers, 2001:328-32916. Medline plus, a service of the us national library
of medicine and the national institute of health,15th may, 2008
17. Pak R and Dombrovy ML: Stroke. In Good, DCand Couch JR(eds): Handbook ofNeurorehabilitation. Marcel Dekker, Newyork,1994:461
18. Armin F. Haerer. Visual Field Defects and thePrognosis of Stroke Patients, Stroke 1973; 4:163-168
19. Sinclair R, A study examining sitting balance andthe presence of attention deficit post-stroke, MscThesis, University of Southampton, UK, 1995.
20. WMA Declaration of Helsinki - Ethical Principlesfor Medical Research Involving Human Subjects.[59th WMA General Assembly Seoul, Korea, Oct2008]. Available from: http://www.wma.net/en/30publications/10policies/b3/
21. Sebstina A. Borges, Ona A. Vyas. Study addressingthe impact of cognitive and perceptual deficits onsitting and standing balance following CVA.Journal of occupational therapy;33(1):april- july 2001.
22. Stapleton, T., Ashburn, A. and Stack, E. (2001) Apilot study of attention deficits, balance controland falls in the subacute stage following stroke.Clinical Rehabilitation;15(4):437- 444.
7. chintanshah 23rd april-31-36.pmd 2/7/2013, 8:08 PM36

Indian Journal of Physiotherapy & Occupational Therapy. January-March 2013, Vol. 7, No. 1 37
The effects of Therapeutic Application of Heator Cold Followed by Static Stretch on Hamstring
Flexibility Post Burn Contracture
Emad T. Ahmed1, Safa S. Abdelkarim2
1Assistant Professor of Physical Therapy , Physical Therapy Department for Surgery, Faculty of Physical Therapy, Cairo University, Egypt,2Physical Therapist, Naser Hospital, Cairo , Egypt
ABSTRACT
Objective : The purpose of this study was to determine the best warming up modality prior to staticstretching exercises to increase flexibility in post burn contracture of the hamstring muscle, as measuredby knee extension range of motion.
Materials and methods: Thirty male patients ranging in age from 18 to 27 years and who had decreasedhamstring muscle flexibility as a result of partial thickness burn were classified into 3 equal groups 10of each, Group (1): received 1 minutes of stretching exercise in addition to ultrasound , Group (2):received 1 minutes of stretching exercise in addition to cold application. And Group (3): received 1minutes of sating stretching only. All groups received stretching exercises 5 days per week for 8 weeks.Measurements of knee extension range of motion were conducted before treatment, post 2 weeks oftreatment, and after 4 weeks of treatment.
Results: The one way analysis of variance was used to compare knee extension range of motion whichrevealed that both treatment group (ultrasound and cold application) had significant (P< 0.05) gains inknee extension ROM after 2 and 4 weeks post stretching exercises.
Conclusion: The results of this study suggest that either deep hot or cold application in addition tostretching exercise is more effective than static stretching alone to improve a hamstring muscle.
Keywords: : Burn, Contracture, Range of motion, Ultrasound, Cold application, Flexibility.
Corresponding author:Emad T.AhmedDesignations: Faculty of Physical Therapy,Cairo University, Cairo, EgyptAddress: Taif, KSA, Box: 2425
INTRODUCTION
Contractures are defined as an inability to performfull range of motion of a joint.1 They result from acombination of possible factors- limb positioning,duration of immobilization and muscle, soft tissue, andbony pathology. Individuals with burn injuries are atrisk for developing contractures. Patients with burnsoften are immobilized, both globally, as a result ofcritical illness in the severely burned, and focally, as aresult of the burn itself because of pain, splinting, andpositioning. Burns, by definition, damage the skin andalso may involve damage to the underlying soft tissue,muscle, and bone. All of these factors contribute tocontracture formation in burn injury.
Contractures place patients at risk for additional
medical problems and functional deficits. Contracturesinterfere with skin and graft healing. Functionally,contractures of the lower extremities interfere withtransfers, seating, and ambulation. Contractures of theupper extremities may affect activities of daily living,such as grooming, dressing, eating, and bathing, as wellas fine motor tasks.2,3
Ill treatment or inadequate splinting andrehabilitation after burn injuries inevitably result indebilitating post burn contractures that impair variousfunctional abilities of the involved limb. Among these,hamstring post burn contracture remain a frequentproblem due to difficulties of knee extension againstthe contractile evolution of the scar 4.
Historically, clinicians have prescribed differentstatic stretching techniques as a means of increasingflexibility 5. Research has shown static stretch to beeffective in increasing the length of connective tissue6.Warren et al explored the effects of stretching on rat tailtendon6.They found that low-load, long duration
8. Emad cairo-37-41.pmd 2/7/2013, 8:08 PM37

38 Indian Journal of Physiotherapy & Occupational Therapy. January-March 2013, Vol. 7, No. 1
stretching of rat tail tendon was more effective inincreasing rat tail tendon length than high load, shortduration stretching6. Therapists often use deep heatingmodalities to increase tissue extensibility to allow forincreased efficacy of stretching techniques. Wessling eta1 found that static stretch combined with ultrasoundincreased the extensibility of triceps surae muscle(measured by changes in dorsiflexion) more than staticstretch alone 7. Laboratory studies also indicate thatpassive warming of the musculotendinous unitincreases its extensibility 8.9. Noonan et al and Strickleret al interpreted their research as evidence that passivewarming may decrease the possibility of strain injurysecondary to extensibility changes 8.9.
The basis for using cold in combination withstretching, like heat, is pain reduction and decreasedmuscle guarding. Cold may relieve pain by acting as acounterirritant10
The purpose of our study was to determine if theapplication of a superficial heating or cooling modality,followed by a 1-minute static stretch to the hamstringmuscle, increases the efficacy of the hamstring stretchalone.
Subjects material and method
Subjects
Patients treated from burn injuries at El-Husseinteaching hospital were randomly selected forparticipation in this study. This study eligibilityrequired that patients be more than 18 years of age; 3 to8 months after the occurrence of the burn injury; hadunilateral scars across popliteal fossa of the knee andthe percentage of burn did not exceed 20%, and had nohistory of other lower extremity pathology.
Inclusion assessment to participate in the study,subjects must have exhibited unilateral tight hamstringmuscles. Operationally defined as having greater than30 degrees loss of knee extension . In addition, subjectswho were not involved in any exercise activity at thestart of the study had to agree to avoid lower extremityexercises and activities other than those prescribed bythe research protocol. During the 8 weeks of training 20male subjects, with age range from 18 to 32 years, metthe established criteria and completed the study.
Group assignment
To ensure equal distribution of hamstring musclecontracture, the patients were stratified into threegroups based on their degree of hamstring muscle
contracture. Patients assigned to group 1 (n=10 patients,age=23.80 years, and range=60.2) served as treatmentgroup 1 and received deep heat in addition to staticstretch for 1 minute. Patients assigned to group 2 (n=10patients, age=24.30 years, and range=60.2) served astreatment group 2 and received cold in addition to staticstretch for 1 minute. Patients assigned to group 3 (n=10patients, age=24.30 years, and range=60.2) served ascontrol group 3 and received stretch only for 1 minute.
INSTRUMENTATION
Measurement tools
A double-arm (30.5 cm) clear plastic goniometer wasused to measure knee extension ROM. Prior to datacollection; we performed a pilot study to establish intra-tester reliability of measurements of knee extensionROM. A test-retest design was used on 10 subjects ofsimilar hamstring contracture, with measurementstaken week a part. Reliability was determined using anintraclass correlation coefficient. An ICC of 0.96 wasconsidered appropriate for continuing the study.
Treatment tools
A sonopulse 434 ultrasound unit was used toadminister the deep heat as warming up prior tostretching, on the other hand, Enraf nonius chilling unitC5 was used to deliver cold at temperature average from-12°C to - 6°C prior to stretch.
Experimental procedure
Measurement protocol
Measurement of knee extension ROM was madewith the subject lying supine with the opposite lowerextremity extended and the lower extremity beingmeasured positioned at 90 degrees of hip flexion. Thegreater trochanter and lateral epicondyle of the femurand the lateral malleolus were palpated and served aslandmarks during measurement. We attempted tomaintain hip flexion at 90 degrees while the tibia wasmoved into the terminal position of knee extension,which was defined as the point at which the subjectreported feeling of discomfort. Zero degree wasconsidered to be 90 degrees of knee flexion. Thegoniometric value was recorded. The measurement ofknee extension ROM was considered to be an indirectmeasure of hamstring muscle flexibility, with hamstringmuscle tightness being the purported cause of a lack ofknee extension ROM. All subjects were measured onthe same day and at the same time, before they hadstretching for that day. Measurements were taken before
8. Emad cairo-37-41.pmd 2/7/2013, 8:08 PM38

Indian Journal of Physiotherapy & Occupational Therapy. January-March 2013, Vol. 7, No. 1 39
treatment, post 2 weeks of treatment and post 4 weeksof treatment.
Treatment protocol
Ultrasound treatments were performed using ansonopulse 434 ultrasound unit at a frequency of 1 MHzwith an intensity of 1.5 W/cm2. A water based gel,maintained at room temperature, was used as aconducting medium. A template was placed over themusculotendinous junction of the hamstring musclegroup to ensure that the treatment area remained atfour times the effective radiating area of the transducerhead. The principle investigator performed alltreatments using the same ultrasound unit which hadbeen recently calibrated. Each US treatment lasted sevenminutes. If subjects complained of intense heat or anyabnormal sensations, treatment was discontinued.
The cold treatment consisted of a -12°C gel packwrapped in one layer of a wet terry cloth towel appliedto the posterior thigh for 20 minutes. The stretch onlygroup received no modality. All subjects were in a proneposition for the duration of their treatments. At the endof 20 minutes, the hot or cold treatments were removed.All subjects then performed the static stretch to thehamstrings by the following method. In a long sitting
position, each subject rested the heel of the untreatedlower extremity along the medial surface of the treatedthigh. The subject then reached forward to grasp theankle of the treated lower extremity. Each subject thenperformed one continuous stretch to pain tolerance,without bouncing, for 1 minute.
DATA ANALYSIS
The equivalence of treatment groups regarding theamount of knee flexion contractures prior to the studywas checked by conducting one way analysis ofvariance on knee range of motion. Inferential analysisof the data obtained in this study was done via 2 X 3analysis of variance experimental design for treatments-by-treatments by subjects. For all statistical tests andall follow-up tests, the 0.05 level of probability was used.
RESULTS
The descriptive characteristics of the subjects in bothtreatment groups and control group are shown in table(1) There was no statistical difference between the twotreatment groups and control group regarding the age,depth of burn, percentage of burn and the duration postburn.
Table (1): Descriptive characteristics of patients in the three groups .
Comparison G 1 G 2 G3 P value SignificanceMean ±SD Mean +SD Mean +SD
Age in years s 22.880±2.064 22.760±2.589 23.420± 2.669 P>0.05 NS
Depth of burn in millimeters 2.519±0.3644 2.488±0.3672 2.620± 0.5714 P>0.05 NS
Duration post burn in months 4.125±0.8345 4.750± 1.035 4.375±0.9161 P>0.05 NS
% of burn 16.388±0.5463 16.375±0.9223 16.550±1.589 P>0.05 NS
Table (2): Comparison between two treatment groups and control group mean results measured before theapplication of any treatment modality.
Comparison Pre treatment measurement
G1 G2 G1 G3 G2 G3
Mean 60.780 61.620 60.780 62.520 61.620 62.520
SD 2.619 1.844 2.619 1.085 1.844 1.085
Sig. NS NS NS
P-value P>0.05 P>0.05 P>0.05
S= Significant, HS= Highly significant , NS= not significant
In the first treatment group (ultrasound andstretching), the mean values for knee extension were60.7 degrees (SD = ± 2.619), for the pre-testmeasurement, 61.620 degrees (SD = ± 1.844), for thesecond treatment group i.e: cold application and
stretching, and 62.520 degrees (SD = ± 1.085) forcontrol group i.e: stretching only. One way analysisof variance demonstrated no statistically significantdifference between the two treatment groups andcontrol group knee extension range of motion (P>0.05)table(2).
8. Emad cairo-37-41.pmd 2/7/2013, 8:08 PM39

40 Indian Journal of Physiotherapy & Occupational Therapy. January-March 2013, Vol. 7, No. 1
Table (3): Comparison between two treatment groups and control group mean results measured after 2 weeks ofthe application of any treatment modality.
Comparison Post (1) treatment measurement
G1 G2 G1 G3 G2 G3
Mean 73.450 70.190 73.450 67.380 70.190 67.380
SD 2.061 1.996 2.061 1.248 1.996 1.248
Sig. S HS S
P-value P<0.01 P<0.001 P<0.05
S= Significant, HS= Highly significant , NS= not significant
In the first treatment group (ultrasound andstretching), the mean values for knee extension were73.450 degrees (SD = ± 2.061), for the post(1) treatmentmeasurement, 70.190 degrees (SD = ± 1.996), for thesecond treatment group i.e: cold application andstretching, and 67.380 degrees (SD = ± 1.248) for control
group i.e: stretching only. One way analysis of variancedemonstrated a statistically significant differencebetween the two treatment groups and control groupregarding knee extension range of motion (P<0.01)table(3).
Table (4): Comparison between two treatment groups and control group mean results measured after 2 weeks ofthe application of any treatment modality.
Comparison Post (2) treatment measurement
G1 G2 G1 G3 G2 G3
Mean 93.290 87.960 93.290 84.830 87.960 84.830
SD 2.418 1.435 2.418 1.760 1.435 1.760
Sig. S HS S
P-value P<0.001 P<0.001 P<0.05
S= Significant, HS= Highly significant , NS= not significant
In the first treatment group (ultrasound andstretching), the mean values for knee extension were93.290 degrees (SD = ± 2.418), for the post(2) treatmentmeasurement, 87.960 degrees (SD = ± 1.435), for thesecond treatment group i.e: cold application andstretching, and 84.830 degrees (SD = ± 1.760) for controlgroup i.e: stretching only. One way analysis of variancedemonstrated a statistically significant differencebetween the two treatment groups and control groupregarding knee extension range of motion (P<0.01)table(4).
DISCUSSION
Our study was designed to obtain a more thoroughunderstanding of stretching protocols for increasingROM and how the use of therapeutic physical agentscan affect these protocols in the clinical setting.According to the data, in a treatment lasting 4 weeks orless, cold packs, or ultrasound prior to stretching orstretching alone achieved similar results in increasingknee extension ROM.
The results of the current study support the findingsof other studies that static stretching is effective inincreasing hamstring length11,12.
The results indicated that either deep heating orcold application followed by static stretching for oneminute was more effective in increasing knee extensionROM than static stretching alone for one minute after 3to 8 months post burn contracture. These results goeshand in hand with those of Wessling et al13, whoclaimed that a significant increase in ankle dorsiflexionwith the use of ultrasound combined with static stretchcompared to static stretch alone.
Ultrasound and other deep heating modalities arebelieved to cause collagen to become more extensible,thus increasing the efficacy of a stretch13,14.Fischer andSolomon suggest that heating of the skin reducesgamma motor neuron excitability15. This woulddecrease the sensitivity of muscle spindles, which maydecrease muscle guarding. On the other hand,Brodowicz et al16 observed that ice application duringstretching increased hamstring flexibility, whereas heatand static stretching was not effective.
Cold may reduce muscle guarding by reducing theactivity of the muscle spindles. Knuttsson and Mattssonsuggest that superficial cooling can cause reduction ingamma motor neuron activity through the stimulationof skin receptors17. On the other hand , Newton found
8. Emad cairo-37-41.pmd 2/7/2013, 8:08 PM40

Indian Journal of Physiotherapy & Occupational Therapy. January-March 2013, Vol. 7, No. 1 41
the use of vapocoolants, in a spray and stretchtechnique, did not increase passive hip flexion inhealthy adults18.
CONCLUSION
All experimental groups in this study producedincreases in the extensibility of the hamstring muscle,resulting in increases in PROM when compared withthe control group. The group receiving ultrasound priorto stretching obtained the greatest increases in kneeextension PROM over a 4-week period. This study willallow clinicians more options in effectively increasingthe extensibility of the hamstring muscles. In addition,the results of this study will permit the clinician thechoice of a cost-effective treatment alternative in an eraof more stringent reimbursement.
ACKNOWLEDGEMENT
We are indebted to Cairo University, Cairo, Egypt,Faculty of Physical Therapy, Department of Physicaltherapy for Surgery, for their permission tocommencement the study in the El-Hussein TeachingHospital / physiotherapy departments and to theparticipants.
Conflict of interest
We certify that there is no conflict of interest withany financial organization regarding the materialdiscussed in the manuscript.
Source of funding
This research received no specific grant from anyfunding agency in the public, commercial, or not / forprofit sectors.
Ethical clearance
We certify that this study involving human subjectsis in accordance with Helsinky declaration of 1975 asrevised in 2000 and that it has been approved by therelevant ethical committee.
REFERENCES
1. Mosby’s Dictionary. 6th ed. St. Louis: Mosby, Inc.;2002.
2. Palmieri TL, Petuskey K, Bagley A, et al. Alterationsin functional movement after axillary burn scarcontracture: a motion analysis study. J Burn CareRehabil 2003;24:104–8.
3. Kowalske KJ, Voege JR, Cromes GF Jr., et al. Therelationship between upper extremitycontractures and functional outcome after burninjury (abstr). Proc Am Burn Assoc 1996;28:55.
4. Nisanci M., Ergin E.R., Selcuk I. & Mustafa S.:Treatment modalities for post burn axillarycontractures and the versatility of the scapularflap. Burns, 28: 177-180, 2002.
5. Stanish WD, Hubley-Kozey CL: Neurophysiologyof stretching. In: D’ Ambrosia R, Drez D (eds),Prevention and Treatment of Running Injuries,Thorofare, NJ: Slack, 1989.
6. Warren CG, Lehmann JF, Koblanski JN: Elongationof rat tail tendon: Effect of load and temperature.Arch Phys Med Rehabil. 52:465-472, 1971.
7. Wessling D, DeVane D, Hylton C: Effects of staticstretch versus static stretch and ultrasoundcombined on triceps surae muscle extensibility inhealthy women. Phys Ther 67:674-679, 1987.
8. Noonan TI, Best TM, Seaber AV, Garrett WE:Thermal effects on skeletal muscle tensile behavior.Am J Sports Med 2 1 :5 17-522, 1993.
9. Strickler T, Malone T, Garrett WE: The effects ofpassive warming on muscle injury. Am J SportsMed 18:141-145, 1990.
10. Fruhstorfer H, Hermanns M, Latzke L: The effectsof thermal stimulation on clinical andexperimental itch. Pain 24:259-269, 1986
11. Gajdosik RL: Effects of static stretching on themaximal length and resistance to passive stretchof short hamstring muscles. J Orthop Sports PhysTher 14:250-255, 1991.
12. Henricson AS, Fredriksson K, Persson I ,PereiraR, Rostedt Y, Westlin N: The effect of heat andstretching on the range of hip motion. J OrthopSports Phys Ther 13:110-115, 1984.
13. Wessling D, DeVane D, Hylton C: Effects of staticstretch versus static stretch and ultrasoundcombined on triceps surae muscle extensibility inhealthy women. Phys Ther 67:674-679, 1987.
14. Lehmann JF, Masock AJ, Warren CG, Koblanski J:Effect of therapeutic temperatures on tendonextensibility. Arch Phys Med Rehabil51:481-485,1970.
15. Fischer E, Solomon S: Physiological responses toheat and cold. In: Licht S(ed), Therapeutic Heatand Cold (2nd Ed), pp 126-1 69. Baltimore, MD:Waverly Press, 1965.
16. Brodowicz, g.r., r. Welsh, and j. Wallis. Comparisonstretching with ice, stretching with heat, orstretching alone on hamstring flexibility. J. AthleticTrain. 31(4):324–327. 1996.
17. Knuttsson E, Mattsson I: Effects of local coolingon monosynaptic reflexes in man. Scand J RehabilMed 1 :126-132,1969
18. Newton RA: Effects of vapocoolants on passivehip flexion in healthy subjects. Phys Ther 65:1034 - 1036, 1985.
8. Emad cairo-37-41.pmd 2/7/2013, 8:08 PM41

42 Indian Journal of Physiotherapy & Occupational Therapy. January-March 2013, Vol. 7, No. 1
Pulsed Electromagnetic Therapy Improves FunctionalRecovery in Children with Erb's Palsy
Reda Sarhan1, Enas Elsayed2, Eman Samir Fayez2
1Physical Therapy Department, Al-Hussien University Hospital, Al-Azhar University, 2Department of Physical Therapy for NeuromuscularDisorders & Surgery, Faculty of Physical Therapy, Cairo University, Egypt
ABSTRACT
Purpose: The purpose of the study was to evaluate the influence of pulsed electromagnetic field therapy(PEMFT) on functional recovery in Erb' palsy.
Design: Randomized controlled trial.
Subjects: Thirty patients were included (16 males and 14 females) with age ranged from six to twelvemonths (mean=7.3±1.1).
Methods: Children were divided randomly into two equal groups, control and experimental. Bothgroups received a physiotherapy training program; in addition, the study group received PEMFT for 30min. Treatment regimen was once a day, three times/ week for three months. Measurements of theaffected upper extremity (length, girth and width, muscle strength and range of motion) were carriedout before and after treatment.
Results: There was significant improvement in most of the measured test parameters in the study groupcompared to those of the control group.
Conclusion: Pulsed electromagnetic therapy, in conjunction with conventional therapy program, waseffective in improving functional recovery in children with Erb's palsy.
Keywords: Pulsed electromagnetic therapy, Brachial plexus injuries, Erb's palsy.
INTRODUCTION
Obstetric brachial plexus lesions (OBPLs) aretypically caused by traction to the brachial plexusduring labor. The incidence of OBPL is about 2 per 1000births. Most commonly, the C5 and C6 spinal nervesare affected. The prognosis is generally considered tobe good, but the percentage of children who haveresidual deficits may be as high as 20% to 30%1. Theincidence ranges from 0.38 to 3 per 1000 live births inindustrialized countries. The difference in incidencemay depend on the type of obstetric care and the averagebirth weight of infants in different geographic regions.Improvements in obstetric technique have lowered theprevalence of obstetrical brachial plexus palsy to therange of 0.19-2.5 per 1000 2. The incidence of permanentimpairment is 3-25% and the rate of recovery in the firstfew weeks is a good indicator of final outcome.Complete recovery is unlikely if no improvement isnoted in the first two weeks of life 3.The neonatal injuryis clinically classified according to the nerve rootsinvolved. Injuries affecting the upper plexus(C5,C7
roots) or so-called Erb’s injuries are dominant,compared to injuries in which the C8eT1 nerve rootsare also affected 4.
Children with BPL are at risk for developingcomplications such as progressive contractures, bonydeformities, scoliosis and posterior shoulderdislocation5. Most infantile injuries to the brachialplexus predominantly involve the upper trunk (C5,6);the classic Erb’s palsy which results from excessivelateral traction on the head away from the shoulder.The infant with upper plexus palsy (C5, 6, 7) keeps thearm adducted and internally rotated with the elbowextended, forearm pronated, wrist flexed and the handin a fist. In the first hours of life, the hand also mayappear flaccid but strength soon returns 5. Papazianand associates 6 reported that unfavorable functionaloutcome is related more often to aberrant reinnervationthan to lack of reinnervation. Aberrant reinnervation isespecially common in brachial plexus lesions secondaryto the close proximity of the nerves involved.
9. Eman-42-46.pmd 2/7/2013, 8:08 PM42

Indian Journal of Physiotherapy & Occupational Therapy. January-March 2013, Vol. 7, No. 1 43
The application of pulsed electro-magnetic fieldtherapy (PEMFT) for treating specific medical problemssuch as arthritis, chronic pain syndromes, woundhealing, insomnia, headache and others has steadilyincreased during the last decade7. Results from basicscience research demonstrated certain biological effectsof PEMFT that provide a rationale for investigating morepotential clinical benefits. Human and animalorganisms consist of a large number of cells whichfunction electrically .These cells have rest potential thatis necessary for normal cellular metabolism. Diseasedor damaged cells have an altered rest potential. If theions move into an area of pulsating magnetic fields,they will be influenced by the rhythm of the pulsation.The rest potential of the cell is proportional to the ionexchange occurring at the cell membrane. The ionexchange is also responsible for the oxygen utilizationof the cell 8. Pulsating magnetic fields can dramaticallyinfluence the ion exchange at the cellular level andthereby greatly improve the oxygen utilization ofdiseased or damaged tissues. The deterioration of theoxygen utilization is known to be a problem in severalmedical branches, especially delayed healing. There areno contraindications to magnetic therapy except incases of hemorrhage or where electrical implants are inuse. Previous studies indicated that PEMF of properfrequency, intensity and duration provides beneficialeffects in a wide variety of cellular processes andmechanisms9. In the field of nervous tissue injuries,previous studies found positive effects of PEMF therapy.Byers et al 10 reported that PEMF stimulation enhancedearly regeneration of the transected facial nerve in rats.
AIM OF THE STUDY
The purpose of the study was to evaluate theeffectiveness of PEMF in improving functional recoveryof the affected upper extremity in patients with Erb’spalsy.
MATERIAL AND METHOD
Thirty patients were included (sixteen boys andfourteen girls) suffering from Erb’s palsy. Regardingthe side of injury, there were 19 patients (57%) withright side and 11patients (33%) with left side. They wereselected from different pediatrics out-patient clinics. Thechildren were divided into two equal groups (controland study groups). Inclusion Criteria: All patients werebetween six to twelve months in age, asymmetry Erb’spalsy was the sole reason for referral to the physicaltherapy out-patient clinic, onset of the injury was from
birth, all participants were having free passive ROM inall joints of the affected upper extremity, activemovement score grades ranged from two to four.Exclusion Criteria: History of malignancy,inflammatory diseases or any surgical intervention ofthe affected upper extremity. Informed consent wasobtained for all patients separately and signed by theparents of the patients.
EVALUATION
All children participated in one measurementsession before and after the suggested period oftreatment in warm environment with the affected armundressed. The affected arm length, forearm and handlength (cm), arm and forearm girth (cm) were measuredand recorded by means of tape measure. Range ofmotion of shoulder abduction and external rotation,elbow flexion and wrist extension was also evaluatedby using goniometer. The paediatric physiotherapistfacilitated maximal shoulder abduction and externalrotation, elbow flexion, forearm supination and wristextension of the affected upper extremity through play,and quantified them on the active movement scale andjoint movement grading scale.
TREATMENT
The control group was assigned for conventionalphysical therapy exercise program consisting ofpositioning, facilitatory stimuli, functionalstrengthening exercises, passive range of motionexercises, stretching exercises, scapular mobilization,manipulative exercises and splinting. The study groupwas assigned for PEMF followed by the previouslymentioned physical therapy program. During PEMFapplication, the patient was placed in the supineposition and the affected arm was comfortably placedinside a closed pediatrics circuit coil, using PEMF device(EL0064 MAGNETO II). The device generated a puremagnetic field output signal that employed directcurrent with unidirectional biological frequencies 20Hz and intensity 0.3 mT (0.03 mT=30 Gauss). Inductionof treatment took place for 30 minutes. Treatment forboth groups continued for three months, three sessionsper week, each session lasted about one hour.
Statistical Analysis
Data was presented as mean and standard deviation.Paired t-test was used to analyze the data within eachgroup and unpaired t- test was used to analyze thedata between study and groups. The p-value was <0.05.
9. Eman-42-46.pmd 2/7/2013, 8:08 PM43

44 Indian Journal of Physiotherapy & Occupational Therapy. January-March 2013, Vol. 7, No. 1
RESULTS
Upper extremity length and girth
The findings revealed significant increase in meanvalues of arm and forearm length, and arm and forearm
girth in the study group after treatment compared tothat before treatment (p=0.0001, 0.01, 0.01, 0.0001respectively). Moreover, a significant difference wasshown between the study and control groups aftertreatment (table 1).
Table (1): Comparison between study and control groups regarding upper extremity length and girth mean valuesbefore and after treatment.
Test Parameters(cm) Pre(Mean±SD) Post(Mean±SD)
Control group Study group t p Control group Study group t p
Arm length 16.27±5.27 15.33±4.53 -0.4 0.6 16.90±4.1 21.60±3.60 2.96 0.001*
Forearm length 13.4333±3.28 12.93±3.19 -0.42 0.7 13.7333±3.06 17.03±4.15 2.48 0.02*
Arm girth 16.30±2.10 15.55±2.1 -0.69 0.5 16.70±3.51 20.70±6.03 2.22 0.03*
Forearm girth 14.03±2.33 13.65±2.30 -0.47 0.6 14.33±2.60 19.03±3.70 4.04 0.0001*
Upper extremity muscle strength
The results showed significant increase in meanvalues of strength of deltoid, external rotators, bicepsbrachii, supinator, and wrist flexors of the affected arm
in the study group after treatment compared to thatbefore treatment (p= 0.001, 0.0001, 0.02, 0.0001 and0.002 respectively). Additionally, a significantdifference was shown between the study and controlgroups after treatment (table 2).
Table (2): Comparison between study and control groups regarding upper extremity muscle strength mean valuesbefore and after treatment.
Muscle Strength Pre(Mean±SD) Post(Mean±SD)
Control Study t p Control Study t p
Deltoid 3.00±0.84 3.13±0.92 -0.33 0.77 3.25±0.70 4.8±0.77 -4.05 0.0001*
External Rotators 2.60±0.74 2.6667±0.72 -0.3 0.77 2.87±0.83 4.6667±0.70 -3.7 0.0001*
Biceps Brachii 3.00±0.93 3.13±0.91 -0.44 0.66 3.33±0.72 4.13±0.1 -2.24 0.04*
Supinator 2.53±0.83 2.67±0.72 -0.45 0.7 2.87±0.74 4.40±0.91 -3.83 0.0001*
Wrist Extensors 3.67±0.49 3.67±0.49 -1.5 0.1 3.87±0.64 4.6±0.5 -2.94 0.007*
Upper extremity active ROM
There was significant improvement in the meanvalues of active ROM of the affected upper extremity in
the study group after treatment compared to thosebefore treatment (table 3).
Table (3): Comparison between mean values of active range of motion before and after treatment in thestudy and control groups
ROM Shoulder Shoulder external Elbow Forearm Wrist(degrees) abduction rotation flexion supination extension
Post Pre Post Pre Post Pre Post Pre Post Pre
0.68 ± 0.34 1.27± 0.88 0.68±0.34 1.193± 0.27 0.63± 0.32 1.31± 0.26 0.65± 0.33 1.32± 0.18 1.13± 0.3 1.67± 0.19
t 9.54 8.80 -8.80 -9.28 -2.62
p 0.06 0.16 0.7 0.3 0.002
DISCUSSION
Obstetric brachial plexus palsy (OBPP) is acomplication of childbirth, which is characterized byone or more nerve conduction blocks within the brachialplexus . These blocks range in severity and locationwithin the plexus and primarily affect the child’s ability
to move and effectively use their affected upperextremity 5.
Thirty children with OBPP participated in the study.All were able to perform elbow and shouldermovements with gravity eliminated. Most of thosechildren presented to the out-patient clinics with slightly
9. Eman-42-46.pmd 2/7/2013, 8:08 PM44
Indian Journal of Physiotherapy & Occupational Therapy. January-March 2013, Vol. 7, No. 1 45
different degrees of injury and respond differently totherapeutic interventions. Experience in treatingchildren teaches that children who present at sixmonths of age with no signs of recovery generally aresubjected to development of sequelae, including mildscapular winging, inability to fully supinate theforearm, limitation in shoulder abduction and forwardflexion. In the current study, there was no need forelectrophysiological monitoring or guide as musclestrength can be considered as an indicator for prognosisand recovery. This is supported by Yilmaz andcoworkers 11 who compared magnetic resonanceimaging (MRI), electrophysiologic studies, and musclestrength scoring in infants with BPP to determinewhich indicator provided the most accurate prognosisof the outcome at one year. They found that scoring ofmuscle strength (eg, elbow flexion; wrist, finger, andthumb extension) was the most reliable measure, with94.8% confidence at 3 months.
There have been few reports about the effect of PEMFtherapy on muscle strength and functional activities inchildren with brachial plexus injuries (Erb’s palsy). Theresults of the present study showed clearly the beneficialeffects of PEMFT on improving muscle strength, rangeof motion and functional activities of the affected upperlimb. These findings coincide with that of Zborowski etal12 who evaluated the effects of a low frequencyelectromagnetic field on fast axonal transport changesin speeds and densities of retrograde fast organelletransport in the rat sciatic nerve. Preparations weremeasured in vitro upon exposure to 15 and 50 Hz pulsedmagnetic fields with peak intensities of 4.4 and 8.8 mT.They reported that strong effects were observed inmyelinated axons. Such effects may eventually be usedas part of a neuroprosthesis to noninvasively modifyor couple to various parts of the nervous system. Thesefindings also, are supported by Sharrard et al14whoconcluded that pulsed electromagnetic fields haveencouraged healing of fractured bones and benefitedre-anastomosis of peripheral nerves after transection.
Many mechanisms could explain the improvementin children with Erb’s palsy as biological stimulationby PEMF exposures can modify cellular functions inbone and nervous tissue, and evidence is accumulatingthat the regeneration capacity of the tissue may beaffected6. For example, selective changes in levels ofcalcium , cyclic adenosine monophosphate, thesynthesis of collagen and proteoglycans, DNA, andRNAhave been demonstrated in osseous, nervous, andmesenchymal tissue 12,13,15,16,17,18.
CONCLUSION
The results of the present study showed that themain advantages of PEMFT are the enhancement andacceleration of the recovery of injured nerve tissue. Also,it indicates that PEMFT is a low-cost, non-invasive, nonthermal method of physical therapy modalities andshould be recognized as standard additional treatmentfor improving the functional recovery in patients withErb’s palsy.
ACKNOWLEDGMENT
The invaluable assistance of the paediatric physicaltherapists in the out patients clinics to the study aremuch appreciated
REFERENCES
1. Martin TA and obestetric brachial plexusinjuries.Neurosurg clin N Am.2009; 20, 1:14.
2. 3-Pollack RN, et al. Obstetrical brachial palsy:pathogenesis, risk factors, and prevention. ClinObstet Gynecol 2000;43:236-46.
3. Gilbert WM, Nesbitt TS, Danielsen B. “Associatedfactors in 1611 cases of brachial plexus injury”.Obstet Gynecol. 1999; 93(4):536-40.
4. Else Spaargaren et al , Aspects of activities andparticipation of 7-8 year- old children with anobstetric brachial plexus injury ,European journalof pediatric neurology.2011; 1 5, 345-352.
5. Alphonso DT . Causes of Neonatal BrachialPlexus Palsy. Bull NYU Hosp Jt Dis. 2011;69:11-16
6. Papazian O, Alfonso I, Yaylali I, Velez I, Jayakar P.“Neurophysiological evaluation of children withtraumatic radiculopathy, plexopathy, andperipheral neuropathy”. Semin Pediatr Neurol.2000; 7(1):26-35.
7. Marko S. Expanding Use of PulsedElectromagnetic Field Therapies. Electromagn BiolMed. 2007; 26: 257-274
8. M. Cifra et al. Electromagnetic cellular interactions.Progress in Biophysics and Molecular Biology ,2011;105 : 223-246
9. R. Lightwood. The remedial electromagnetic field.J. Biomed. Eng. 1989, 1 I:429-436.
10. Byers J, Clark K, Thompson G. “Effect of pulsedelectromagnetic stimulation on facial nerveregeneration”. Arch Otolaryngol Head Neck Surg.1998;124(4):383-9.
11. Yilmaz K, Caliskan M, Oge E, Aydinli N, TunaciM, Ozmen M. “Clinical assessment, MRI, andEMG in congenital brachial plexus palsy.” PediatrNeurol. 1999; 21(4):705-10.
9. Eman-42-46.pmd 2/7/2013, 8:08 PM45

46 Indian Journal of Physiotherapy & Occupational Therapy. January-March 2013, Vol. 7, No. 1
12. Zborowski M , Atkinson M , Lewandowski JJ ,Jacobs G , Mitchell D , Breuer A, Nosé Y. “In vitrolow frequency electromagnetic field effect on fastaxonal transport.” ASAIO Trans. 1988 Jul-Sep;34(3):669-7.
13. Bassett CA, Chokshi HR, Hernandez E, Pawluk RJ, Strop M. ”The effect of pulsing electromagneticfields on cellular calcium and calcification of non-unions”. Brighton GT, Black J, Pollack SR. eds.Electrical Properties of Bone and Cartilage:Experimental Effects and Clinical ApplicationsNew York, NY Grune & Stratton Inc1979;427.
14. Sharrard WJ, Sutcliffe ML, Robson MJ,MacEachern AG. ”The treatment of fibrous non-union fractures by pulsing electromagneticstimulation. “ J Bone Joint Surg Br. 1982;64:189-193.
15. +Fitton-Jackson S, Bassett CA. ”The response ofskeletal tissues to pulsed magnetic fields.“ Richards RJ, Rajan KT.eds. Tissue Culture inMedical Research (“International Symposium onTissue Culture in Medical Research”) .New York,NY Pergamon Press Inc1980; 21.
16. Eugene M.Goodman et al. Effects ofElectromagnetic Fields on molecules and cells,International review of cytology.1995; I58:279-338.
17. Fitton-Jackson S, Farndale R. ”The influence ofpulsed magnetic fields on skeletal tissue grownin organ culture. “ Trans Orthop Res Soc.1981;6300+
18. Shteyer A, Norton LA, Rodan GA. ”Electromagnetically induced DNAsynthesis in calvaria cells. “ J Dent Res.1980;59A:362.
9. Eman-42-46.pmd 2/7/2013, 8:08 PM46

Indian Journal of Physiotherapy & Occupational Therapy. January-March 2013, Vol. 7, No. 1 47
Effectiveness of PNF Stretching and Self Stretching inPatients with Adhesive Capsulitis - A Comparative Study
Harshit Mehta1, Paras Joshi2, Hardik Trambadia3
1Physiotherapist, Samarpan Orthopedic Hospital, Jamnagar, 2Lecturer, K K Sheth College of Physiotherapy,3Lecturer, Parul Institute of Physiotherapy, Vadodara
ABSTRACT
Background: Adhesive capsulitis of shoulder is characterized by insidious and progressive pain andloss of active and passive mobility of glenohumeral joint. In many physical therapy programs forsubjects with adhesive capsulitis of shoulder mobilization techniques are an important part of theintervention. The purpose of this study is to compare the efficacy of PNF stretching techniques and Selfstretching techniques in subjects with adhesive capsulitis.
Objective: To compare the effectiveness of PNF stretching and self stretching in improving ROM,shoulder pain & disability index in patients with adhesive capsulitis.
Method: 30 subjects diagnosed by an orthopedic surgeon as having adhesive capsulitis of shoulderjoint and who showed a typical restriction of external rotation and abduction were selected. Subjectswere randomly taken, divided into two groups each of 15 subjects. Group A: (n=15):- Treated with PNFstretching. Group B: (n=15):- Treated with self stretching. Analysis was based on ROM and ShoulderPain and Disability Index (SPADI) sub scores and total scores.
Outcome measures: The following outcome measures were measured at baseline, 2nd week and 4thweek follow up.
1. Active ROM of shoulder External rotation and Abduction.
2. Shoulder pain and disability index (SPADI).
Results: The ROM and SPADI percentage across baseline, 2nd week and 4th week follow up showed asignificant improvement statistically in their mean scores within Group A and Group B. Statisticallysignificant greater changes in score were found in PNF Stretching (Group A) for ROM and SPADI ascompared to Self Stretching (Group B).
Conclusion: The results indicate that PNF Stretching (Group A) and Self Stretching (Group B) aresignificantly effective in improving ROM and SPADI (sub scores and total scores).
However PNF Stretching (Group A) appears to be more effective in improving glenohumeral jointmobility and reducing disability as compared to Self Stretching (Group B).
Keywords: Adhesive Capsulitis, PNF Stretching, self stretching, SPADI.
INTRODUCTION
“ADHESIVE CAPSULITIS” is a common but poorlyunderstood syndrome of painful shoulder stiffness.1 Itis most common cause of pain & disability in shoulderin general population.2 Frozen shoulder syndrome wasfirst describe by Duply in 1872. He used the term peri-arthritis scapula-humerale. In 1934 Codman used theterm ‘FROZEN SHOULDER’ first time to describe thecondition.1 In 1945, Nevieser termed condition as“ADHESIVE CAPSULITIS” based on surgically
explored cases of frozen shoulder finding absence ofthe gleno- humeral synovial fluid as well as thickening& contraction of capsule which had become adherentto humeral head.3 The prevalence of frozen shoulder is2% to 3% of general population it starts between age of40- 70 years. It is more commonly seen in females thanmales.2
Currently adhesive capsulitis & frozen shoulder arethe preferred terms and can be used interchangeably.4
Adhesive capsulitis has typically been classified into 2
10. hardik 16th april--47-51.pmd 2/7/2013, 8:08 PM47

48 Indian Journal of Physiotherapy & Occupational Therapy. January-March 2013, Vol. 7, No. 1
forms, primary & secondary. In the primary form, noknown precipitating factors can be identified, so it isalso known as idiopathic type. The secondary form isassociated with other illness or events such as sometrauma or surgery.4
The classic frozen shoulder has 3 stages
Stage 1: Painful stage or Freezing phase (Lasts for 2 to 9months) 2, 6
Stage 2: Stiffness or Frozen phase (Lasts for 4 to 12months) 2, 6
Stage 3: Thawing phase (Lasts for 6 to 9 months) 2, 6
Stage 1:- The “freezing” or “painful” stage, in whichthe patient has diffuse lateral shoulder pain beginsgradually and insidiously. Pain is the main initialcomplaint. The pain is worse at night & exacerbated bylying on the affected side, is often associated withsignificant disability.2
Stage 2:- The “stiff” or “frozen” stage, in whichstiffness with decreased range of motion predominates.Pain, though still present with extreme movement,subsides and loss of movement becomes the patient’schief complaint. Ability to care for oneself and to workmight be significantly affected, especially if the patient’sdominant arm is involved.2
Stage 3:- The “thawing” stage during which,exacerbations of pain still occur, often because ofexcessive activity. Gradually pain subsides andmovement becomes almost normal.
Five methods developed to improve flexibility haveemerged: ballistic stretching, static stretching,proprioceptive neuromuscular facilitation stretchingtechniques (PNF), dynamic range of motion using activecontraction and eccentric training.14
OBJECTIVES OF THE STUDY
1. To study the effectiveness of PNF stretching inimproving ROM, shoulder pain and disabilityindex in patients with adhesive capsulitis.
2. To study the effectiveness of self stretching inimproving ROM, shoulder pain & disability indexin patients with adhesive capsulitis.
3. To compare the effectiveness of PNF stretching andself stretching in improving ROM, shoulder pain &disability index in patients with adhesivecapsulitis.
HYPOTHESIS
Null Hypothesis (H0)
There is no significant difference between theeffectiveness of PNF stretching and self stretching inimproving ROM, shoulder pain and disability index inpatients with adhesive capsulitis.
Alternate Hypothesis (H1)
There is a significant difference between theeffectiveness of PNF stretching and self stretching inimproving ROM, shoulder pain and disability index inpatients with adhesive capsulitis.
METHODOLOGY
� Study design: Experimental study.
� Inclusion criteria
• Symptomatic subjects between the age group of 40-60 (both male and female).
• Subjects having stiff and painful shoulder for morethan 1 month.
• Minimum 50 % of restriction in abduction andexternal rotation of shoulder joint.
• Unilateral involvement and stage 2 adhesivecapsulitis.
� Exclusion criteria
• History of recent shoulder trauma in and aroundshoulder joint.
• Rotator cuff injuries or previous surgery
• Intrinsic gleno- humeral pathology such asglenohumeral arthritis.
• Diabetic patients.
� Tools used for the study:
• Universal Goniometer
• Shoulder pain and disability index
10. hardik 16th april--47-51.pmd 2/7/2013, 8:08 PM48

Indian Journal of Physiotherapy & Occupational Therapy. January-March 2013, Vol. 7, No. 1 49
Method of data collection
The patients were evaluated using shoulderevaluation form. The patients were informed about thewhole procedure, the treatment merits and demerits anda written consent were obtained from them for voluntaryparticipation in the study. They were randomly dividedin two Group A and Group B of 15 subjects each. Thebase line data of ROM of all the movements of shoulderwas obtained using universal goniometer. The pain anddisability data were obtained using SPADI to check forthe functional outcome. The ROM and SPADI weretaken at the baseline, after 2 weeks of the treatment andafter 4 weeks on follow up.
Study Duration: 4 weeks.
Techniques of application
Group A: PNF stretching.
Starting position: Patient is in sitting position andtherapist in sitting at the side of the patient.
(PNF stretching) Therapist will passively move theshoulder joint in external rotation until the stretch beginto feel “uncomfortable” to the subject. Then subjectswill be asked to perform a maximal isometric contractionfor 6 seconds followed by 10 seconds of relaxation.
During the 10 seconds of relaxation a tester slowlyexternally rotates the subject’s shoulder joint, if thesubjects still consider the stretch to be uncomfortable; itis kept as previous position.
The subjects then perform 2 more 6 seconds maximalcontraction (total 3 contractions) with 10 secondrelaxation period in between.
Same procedure is done to improve shoulderabduction. In this patient is in sitting position andtherapist stands at the back of the patient on the affectedside.
Duration : It is given once in a day for 5 days in aweek for 4 weeks.
Group B: Self stretching.
Starting position: Patient is in standing position.
Subjects is asked to place the upper extremity on afirm surface at 90° of forward elevation and greater than90° of horizontal abduction while turning the trunk inthe opposite direction to improve the external rotation.
Subjects is asked to pull the elbow overhead withthe opposite arm to improve the abduction
Duration : The stretching is given 3 times for 30seconds and 10 second relaxation between 2 stretch 5days in a week for 4 weeks.
· Both the groups were given short-wave diathermybefore stretching procedure at the therapeuticfrequency of 27.12 MHz for 10 to 15 min.13
Statistical Analysis
• Post hoc analysis (Bonferroni test) is used tocompare the baseline, 15th day and 30th day scoresof ROM and SPADI within Group A and Group B.
• Two way ANOVA test is used to compare the meandifference across the time periods (Baseline, 15th dayand 30th day) between Group A and Group B.
• P value < 0.05 is taken up for statistical significance.
RESULTS
Table 1:-Multiple comparisons of ACTIVE EXTERNAL ROTATION scores across different periods within Group Aand within Group B using post hoc analysis- Bonferroni test.
Period Periods Mean Std. Error p-value Level of significance
AER in Group A Baseline 2nd wk -21.667 2.065 .000 HS at p < 0.01
4th wk -31.733 1.850 .000 HS at p < 0.01
2nd week 4th wk -10.067 .658 .000 HS at p < 0.01
AER inGroup B Baseline 2nd wk -14.400 2.908 .001 HS at p < 0.01
4th wk -21.800 2.694 .000 HS at p < 0.01
2nd week 4th wk -7.400 .466 .000 HS at p < 0.01
10. hardik 16th april--47-51.pmd 2/7/2013, 8:08 PM49

50 Indian Journal of Physiotherapy & Occupational Therapy. January-March 2013, Vol. 7, No. 1
Table 2:- Multiple comparisons of ACTIVE ABDUCTION scores across different periods within Group A andwithin Group B using post hoc analysis- Bonferroni test.
Period Periods Mean Std. Error p-value Level of significance
AAB inGroup A Baseline 2nd wk -38.200 3.151 .000 HS at p < 0.01
4th wk -48.533 2.862 .000 HS at p < 0.01
2nd week 4th wk -10.333 .779 .000 HS at P < 0.01
AAB inGroup B Baseline 2nd wk -23.000 2.556 .000 HS at p < 0.01
4th wk -31.600 2.124 .000 HS at p < 0.01
2nd week 4th wk -8.600 1.125 .000 HS at p < 0.01
Table 3:- Multiple comparisons of Total SPADI scores across different periods within Group A and within Group Busing post hoc analysis- Bonferroni test.
Period Periods Mean Std. Error p-value Level of significance
Total SPADI in Group A Baseline 2nd wk 46.800 2.387 .000 HS at p < 0.01
4th wk 50.067 2.566 .000 HS at p < 0.01
2nd week 4th wk 3.267 .330 .000 HS at P < 0.01
Total SPADI in Group B Baseline 2nd wk 37.867 1.612 .000 HS at p < 0.01
4th wk 40.000 1.721 .000 HS at p < 0.01
2nd week 4th wk 2.133 .291 .000 HS at p < 0.01
From the above Table 1, 2 & 3 multiple comparisonof active external rotation, active abduction and totalSPADI scores shows that difference is statisticallysignificant from baseline to 2nd week and 2nd week to 4th
week, but the difference from baseline to 2nd week and2nd week to 4th week is significantly higher in group Athan group B
DISCUSSION
Primary adhesive capsulitis affects 2% to 3% of thegeneral population and is the main cause of shoulderpain and dysfunction in individuals aged 40 to 70years. The etiology and pathology of this syndromeremains enigmatic. The physical therapy is commonlyprescribed for this condition. For predominant adhesivecapsulitis and associated soft tissue tightness,mobilizations techniques, PNF stretching techniqueshave been most commonly address in clinical treatmentapproaches and research studies.
The result of present study examined the efficacy ofPNF stretching to self stretching in subjects withadhesive capsulitis both within groups and betweengroups. 30 subjects are taken who were diagnosed asadhesive capsulitis of shoulder by orthopedic and werenormally assigned to either PNF stretching (Group A)or Self stretching (Group B).
PNF stretching utilizing a shortening contractionof the opposing muscle to the place the target muscleon stretch, followed by a static contraction of the targetmuscle, The inclusion of a shortening contraction of
the opposing muscle appears to have the greatest impacton enhancing ROM.17 Some researchers have foundthat the alteration of stretch perception plays aimportant role in success of contract relax PNFstretching and contract relax stretch are recommendedto get greatest ROM gain.7
PNF stretching and soft tissue mobilization is theapplication of specific and progressive forces with theintent of promoting changes in the myofascia, allowingfor elongation of shortened structures. PNF stretchingcombined with soft tissue mobilization and both areused to effect changes in myofascial length. Contract –relax PNF procedures have been shown to be effectivein increasing ROM. The immediate effects of PNFstretching and soft tissue mobilization interventionswere demonstrated in a another study using healthysubjects, where improvements were made in hip ROM.8
One study done on overhand athletes for the effectsof proprioceptive neuromuscular facilitation shows thatContract – relax and hold relax PNF stretchingtechniques are effective in increasing ROM in overhandathletes.9
Stretching import physiological changes such asremodeling of elastin and collagen molecules, thesechanges may be associated with alterations on themuscle tendon units and fascia, caused by increase ontissue elasticity. In other words, the range of motionwould be influenced by the increase on the length ofthe tissue.10
10. hardik 16th april--47-51.pmd 2/7/2013, 8:08 PM50

Indian Journal of Physiotherapy & Occupational Therapy. January-March 2013, Vol. 7, No. 1 51
In one study researchers have concluded that PNFstretching produce more tension in muscle and alsoprovide greatest potential for muscle lengthening thanstatic stretching. In another study researchers haveconcluded that PNF stretching shows greater ROMgains than static stretching.11
In one study researchers concluded that 30 secondsstatic stretch was more effective then dynamic ROMtraining for improving ROM. Given the fact that 30seconds static stretch increase ROM more than 2 timesthat of dynamic ROM training.12
Limitations
1. In present study only 2 ROM (External Rotationand Abduction) are taken in outcome measures.
2. In this study there is no control group is present.
3. It’s a short duration study as study duration is 4weeks.
4. In the present study the sample size is 30 that aresmall.
CONCLUSION
• PNF Stretching and Self stretching producedsignificant improvement in ROM and shoulderPain and Disability (SPADI Sub scores and Totalscores) values in patients with adhesive capsulitiswhen applied individually. However PNFStretching showed a significant improvement inROM and shoulder Pain and Disability Index(SPADI sub scores and total scores), when comparedto Self Stretching in individuals with adhesivecapsulitis.
REFERENCES1. Giggs SM, Ahm A and Green A. Idiopathic
Adhesive Capsulitis. A Prospective FunctionalOut Come, Study of non operative Treatment. JBone Joint Surg, Vol. 82, Oct-2000, 1398-1407.
2. H.A. Anton. Frozen Shoulder. Can Fam Physician1993;39:1773-1777.
3. R.A Donatelli, Physical Therapy of the Shoulder,3rd edition, CHARCHILL LIVINGSTONE. Pp257- 278.
4. Rick Sandor. Adhesive Capsulitis; OptimalTreatment Of “Frozen Shoulder”. THEPHYSICIAN AND SPORTSMEDICINE, Vol.28,No.9, SEP-200.
5. Henricus M Vermeulen, Wim R Obermann, Bart JBurger, Gea J Kok, Piet M Rozing, CorneliaHMvanden Ende. End- Range Mobilization techniquesin Adhesive Capsulitis of the Shoulder joint: AMultiple- Subject Case Report.
6. S.B.Brotzman, K.E.Wilk, Clinical OrthopaedicRehabilitation, 2nd edition, Shoulder Injuries, page125-250.
7. Mitchell UH, Myrer JW, Hopkins JT, Hunter I,Feland JB, Hilton SC acute stretch perceptionalteration contributes to the success of the PNF“contract-relax” stretch. J Sports Rehab. May 2007;16(2):85-92.
8. Godges JJ, Matson-Bell M ,Thorpe D; Shah D, Theimmediate effect of soft tissue mobilization withPNF on gleno humeral external rotation &overhead reach; J Orthop Sports Phys Ther, Dec2003; 33 (12) : 713-718.
9. Decico PV, Fisher MM, The effects of PNF stretchingon shoulder ROM in overhead athletes. J SportsMed Phy Fitness, Jun 2005; 45(2):183-187.
10. Luís Viveiros, Marcos Doederlein Polito, RobertoSimão and Paulo Farinatti Immediate and lateresponses of flexibility in the shoulder extensionin relation to the number of series and stretchingduration. Rev Bras Med Esporte. Nov/Dec 2004;Vol 10, N 6:464-467.
11. Funk DC, Swank AM, Mikla BM, Fagan TA, FarrBK. Impact of prior exercise on hamstringflexibility: a comparison of proprioceptiveneuromuscular facilitation and static stretching. JStrength Cond Res. 2003 Aug; 17(3):489-92.
12. Bandy WD, Irion JM, Briggler M. The effect of timeand frequency of static stretching on flexibility ofthe hamstring muscles. Phys Thera. 1998 Mar;78(3):321-2.
13. Leung MS, Cheing GL. Effects of deep andsuperficial heating in the management of frozenshoulder. J. Rehabil Med. 2008 Feb; 40(2):145-50.
14. Murphy DR.A critical looks at static stretching;are we doing our patient harm? Chriopract sportmed, 1991; 5:67-70.
10. hardik 16th april--47-51.pmd 2/7/2013, 8:08 PM51

52 Indian Journal of Physiotherapy & Occupational Therapy. January-March 2013, Vol. 7, No. 1
Effect of Modified Hold-Relax and Active Warm-Upon Hamstring Flexibility
Swapnil U Ramteke1, Hashim Ahmed2,Virenderpal Singh3, Piyush Singh4
Research Student, Jamia Hamdard, New Delhi, 2Head department of Physiotherapy, Shreya Hospital, Shalimar Garden Extension,Ghaziabad, U.P, 3Head of Department of Physiotherapy, Mata Gujri Charitable Hospital, New Delhi , 3Assistant Profesor, Indian Spinal
Injury Center of Rehabilitation, New Delhi
ABSTRACT
Objective: The study aimed to find out how long the flexibility lasted after a one time modified holdrelax stretching & active warm up and its comparison with modified hold relax technique alone.
Design: Pre-test, Post-test comparative study with repeated measures.
Setting: Mata Gujri Fitness center, Kailash colony, New Delhi.
Method: 30 male subjects were randomly assigned to two groups; Group A- Modified Hold Relax: Onthe 15 subjects a one time modified hold-relax stretching was performed.
Group B: 15 male subjects completed an active warm up on treadmill followed by modified hold relaxstretching. The pre stretch measurement was taken by Active Knee Extension (AKE) test. After both theinterventions the post stretch measurements were taken at following intervals, 0, 6, 12, 18, 24 min,respectively.
Results: A significant improvement in ROM was observed when post stretch measurements werecompared to pre test in both groups respectively. However, the flexibility lasted for longer duration thatis 12 min in group B when compared to group A that is 6 min.
Conclusion: Both the methods are equally effective to improve the range of motion. But the improvedranges can be maintained for larger duration when active warm up was implemented prior to Modifiedhold relax stretching.
Keywords: P.N.F, Active Warm up, AKE, Flexibility,
INTRODUCTION
Flexibility is an essential component for normalbiomechanical functioning in sports. The length of themuscle tissue is thought to play an important role inefficacy and effectiveness of human movement.1
Theoretically, a more flexible muscle-tendon unit shouldbe more compliant to external loads, less stiff, and lesslikely to be injured.2 In sports even small change inperformance can have a drastic effect on the outcome ofan event.
Besides hamstrings strains in the athleticpopulation, hamstrings tightness as shown in somestudies have shown that reduced hamstring flexibilityis considered to be one of the leading cause/risk factorfor patellar tendinopathy and patellofemoral pain etc..3
In the ACSM’s guidelines,a clinical evidence for
relationship between hamstring inflexibility withavulsion fractures of ischial tuberosity ,muscle strain,low back ache and increased sway back or round backposture has been mentioned.4 Proprioceptiveneuromuscular Facilitation (PNF) exercises aredesigned to promote the neuromuscular response ofthe proprioceptors.There exists a limited data regardingthe lasting effects of increased ROM post stretching.The duration of increased flexibility in the previousresearch conducted by De pino et al, after one timestatic stretching was found to be of 3 minutes, furtherSpernoga et al carried out similar study in which, afterone time modified hold relax lasting effects remainedfor 6 minutes, but this is a very short span of time, tilldate limited studies have carried out to improve thelasting effects.5, 6.Hamstring flexibility has beenmeasured by active knee extension test, passive knee
11. hashim 4th may--52-57.pmd 2/7/2013, 8:08 PM52
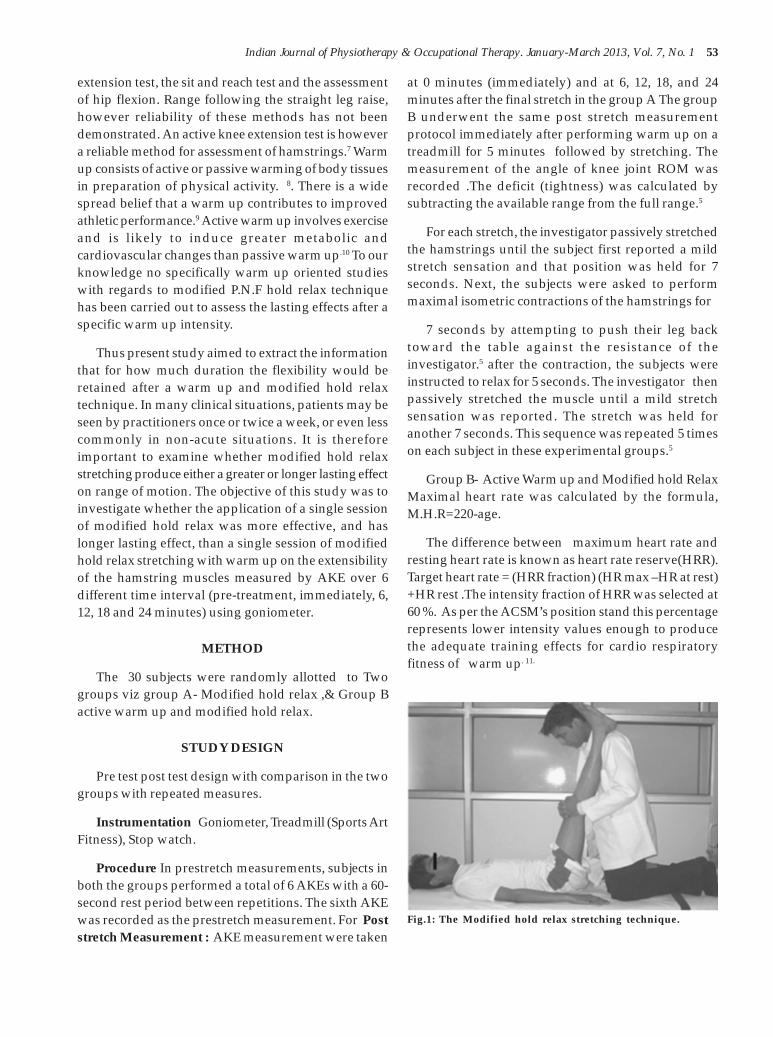
Indian Journal of Physiotherapy & Occupational Therapy. January-March 2013, Vol. 7, No. 1 53
extension test, the sit and reach test and the assessmentof hip flexion. Range following the straight leg raise,however reliability of these methods has not beendemonstrated. An active knee extension test is howevera reliable method for assessment of hamstrings.7 Warmup consists of active or passive warming of body tissuesin preparation of physical activity. 8. There is a widespread belief that a warm up contributes to improvedathletic performance.9 Active warm up involves exerciseand is likely to induce greater metabolic andcardiovascular changes than passive warm up.10 To ourknowledge no specifically warm up oriented studieswith regards to modified P.N.F hold relax techniquehas been carried out to assess the lasting effects after aspecific warm up intensity.
Thus present study aimed to extract the informationthat for how much duration the flexibility would beretained after a warm up and modified hold relaxtechnique. In many clinical situations, patients may beseen by practitioners once or twice a week, or even lesscommonly in non-acute situations. It is thereforeimportant to examine whether modified hold relaxstretching produce either a greater or longer lasting effecton range of motion. The objective of this study was toinvestigate whether the application of a single sessionof modified hold relax was more effective, and haslonger lasting effect, than a single session of modifiedhold relax stretching with warm up on the extensibilityof the hamstring muscles measured by AKE over 6different time interval (pre-treatment, immediately, 6,12, 18 and 24 minutes) using goniometer.
METHOD
The 30 subjects were randomly allotted to Twogroups viz group A- Modified hold relax ,& Group Bactive warm up and modified hold relax.
STUDY DESIGN
Pre test post test design with comparison in the twogroups with repeated measures.
Instrumentation Goniometer, Treadmill (Sports ArtFitness), Stop watch.
Procedure In prestretch measurements, subjects inboth the groups performed a total of 6 AKEs with a 60-second rest period between repetitions. The sixth AKEwas recorded as the prestretch measurement. For Poststretch Measurement : AKE measurement were taken
at 0 minutes (immediately) and at 6, 12, 18, and 24minutes after the final stretch in the group A The groupB underwent the same post stretch measurementprotocol immediately after performing warm up on atreadmill for 5 minutes followed by stretching. Themeasurement of the angle of knee joint ROM wasrecorded .The deficit (tightness) was calculated bysubtracting the available range from the full range.5
For each stretch, the investigator passively stretchedthe hamstrings until the subject first reported a mildstretch sensation and that position was held for 7seconds. Next, the subjects were asked to performmaximal isometric contractions of the hamstrings for
7 seconds by attempting to push their leg backtoward the table against the resistance of theinvestigator.5 after the contraction, the subjects wereinstructed to relax for 5 seconds. The investigator thenpassively stretched the muscle until a mild stretchsensation was reported. The stretch was held foranother 7 seconds. This sequence was repeated 5 timeson each subject in these experimental groups.5
Group B- Active Warm up and Modified hold RelaxMaximal heart rate was calculated by the formula,M.H.R=220-age.
The difference between maximum heart rate andresting heart rate is known as heart rate reserve(HRR).Target heart rate = (HRR fraction) (HR max –HR at rest)+HR rest .The intensity fraction of HRR was selected at60 %. As per the ACSM’s position stand this percentagerepresents lower intensity values enough to producethe adequate training effects for cardio respiratoryfitness of warm up. 11.
Fig.1: The Modified hold relax stretching technique.
11. hashim 4th may--52-57.pmd 2/7/2013, 8:08 PM53

54 Indian Journal of Physiotherapy & Occupational Therapy. January-March 2013, Vol. 7, No. 1
DATA ANALYSIS
The alpha level of pd” 0.05 was accepted assignificant for all analyses. Mean values and theirstandard deviations were calculated for each variable.The one way ANOVA (analysis of variance) was carriedfor both the groups to compare the ROM within eachgroups to pre stretch measurements. A t-test wasperformed to compare ROM within both the groups.The data was further analyzed by Dunnet’s post hoctest.
RESULTS
The ONE way analysis of variance revealed asignificant difference between pretest and post test ROMmeasurements within groups respectively. However aDunnet’s post hoc analysis indicated that a significant(p<0.05) increase in hamstring flexibility wasmaintained in modified hold relax group for 6 min afterstretching protocol. Similarly increase in hamstringflexibility was maintained in Active warm up &Modified hold relax group for upto 12 min.
Subject characteristics
The subjects had following characteristics as meanand standard deviations values:
Group A (Age = 23.00± 1.73) (Height=166.40, ±5.72)(Weight= 62.80 ± 6.75)(BMI= 22.67±2.16)
GroupB (Age = 22.60±1.29) (Height=161.86, ±9.69)(Weight= 61.60 ±6.21)(BMI= 23.31±3.49)
Table 1.Active Knee Extension Measurements in GroupA and Group B
Time intvl Group A Group B
Mean s.d Mean s.d
Prestretch 39.26 ± 3.76 38.66 ± 4.23
0 31.13 ± 3.75 28.73 ± 3.86
6 33.20 ± 3.87 31.20 ± 3.74
12 36.06 ± 3.36 34.20 ± 4.34
18 36.93 ± 3.80 35.60 ± 4.11
24 38.13 ± 3.48 37.46 ± 4.65
Fig. 2: The subject performing active warm up on the treadmillunder the supervision.
Figure.3: Comparison between pre-test and post-test value ofrange of motion between the groups.
Table.2: Between Group Comparison of Range ofMotion using t and p values
Time period t-test for Equalityof Means
t p-value
Pre Test 0.41 0.68
0 min 1.72 0.09
6 min 1.43 0.16
12 min 1.31 0.19
18 min 0.92 0.36
24 min 0.44 0.66
The subjects had following characteristics as meanand standard deviations values:
11. hashim 4th may--52-57.pmd 2/7/2013, 8:08 PM54

Indian Journal of Physiotherapy & Occupational Therapy. January-March 2013, Vol. 7, No. 1 55
Group A (Age = 23.00± 1.73) (Height=166.40, ±5.72)(Weight= 62.80 ± 6.75)(BMI= 22.67±2.16)
GroupB (Age = 22.60±1.29) (Height=161.86, ±9.69)(Weight= 61.60 ±6.21)(BMI= 23.31±3.49)
Table.3: Dunnett Post hoc analysis for comparinggroup B
Post Pre Mean p-Treatment treatment Difference (I-J) value
0 min Pre treatment -9.93 0.000
6 min Pre treatment -7.46 0.000
12 min Pre treatment -4.46 0.019
18 min Pre treatment -3.06 0.172
24 min Pre treatment -1.20 0.896
DISCUSSION
Various studies have been conducted in the past toassess the effects of various interventions on improvinghamstrings flexibility. However limited studies havebeen performed which evaluated the lasting effects.5,6,12
These recently conducted studies on checking acuteeffects of stretching revealed that the flexibility wouldlast for 3 min after static stretching & for upto 6 minafter one time modified hold relax stretching. Theselasting effecs were present for very less duration.The relatively short time of increased hamstringflexibility may be due to several factors The mostprominent are the viscoelastic, thixotropic, and neuralproperties of the musculotendinous unit.
Neural properties
The proposed neural inhibition reduces reflexactivity, which then promotes greater relaxation anddecreases resistance to stretch, and hence greater rangeof movement 13 moreover, other research has found PNFtechniques to promote greater relaxation.14
Viscoelastic properties
Previous researchers have attempted to explainimprovements in flexibility with viscoelastic properties,overcoming the stretch reflex, or increasing the stretchtolerance23. Musculotendinous units function in aviscoelastic manner, and, therefore, have the propertiesof creep and stress relaxation. Creep is characterizedby the lengthening of muscle tissue due to an appliedfixed load. Stress relaxation is characterized by thedecrease in force over time necessary to hold a tissue ata particular length.
The musculotendinous unit deforms or lengthensas it is being stretched and goes through elastic andthen plastic deformation before completely rupturing.Our results suggest that a single session of hold-relaxstretching does not deform tissues enough to produce apermanent change (i.e., a plastic deformation in themusculotendinous unit). Therefore, the temporaryimprovement in hamstring flexibility may be attributedto changes in the elastic region caused by a single sessionof hold-relax stretching.5
Thixotropic Properties
Thixotropy is the property of a tissue to become moreliquid after motion and return to a stiffer, gel like stateat rest. The thixotropic property of muscle is thought toresult from an increase in the number of stable bondsbetween actin and myosin filaments when the muscleis at rest. Hence, the stiffness of muscle increases.Because we asked our subjects to lie still in between thereadings, the thixotropic properties of muscle may haveplayed a part in reducing the time that hamstringflexibility was increased.
A linear relationship exists between the time amuscle remains still and the stiffness of that muscle inresponse to a stretch, and indeed, flexibility decreasedin both groups as time passed .However, with activity,the muscle becomes more fluid-like because the stablebonds are broken or are prevented from forming. Basedon thixotropic properties, we would expect thetemporary increase in flexibility to bemaintainedduring periods of activity and to decrease duringperiods of inactivity.
The present study revealed that there was nostatically significant difference in ROM gains in boththe groups. This shows that there is no extraimprovement/change in ROM when the modified holdrelax stretching was performed after the warm up. Thisfindings are similar to that of Cornelius et al in whichthey concluded that effective increases in tissue lengthwere not affected by warm up when a modified holdrelax technique was used.27
In the present study, flexibility lasted for largerduration i.e. 12 minutes in Group B (modified hold relaxand active warm up) which may be due to the variousfactors. These findings are similar to that of variousstudies conducted by Cornelius which stated that raisedtissue temperature, coupled with stretch, would result
11. hashim 4th may--52-57.pmd 2/7/2013, 8:08 PM55

56 Indian Journal of Physiotherapy & Occupational Therapy. January-March 2013, Vol. 7, No. 1
in effective tissue elongation and longer lastingflexibility.27 However; these studies did not measuredlasting effects.
Influence of active warm up
An increase in intramuscular tissue temperaturehas a beneficial effect on ability of collagen and themyotendinous junction to deform. The effect oftemperature must also be considered in relation to theinnervations of the muscle tendon unit. There arereports in the literature that sensitivity of GTO tosustained stretch is increased with increase intemperature and that the GTOs sensitivity to tension isinversely correlated with the mechanical stiffness ofthe musculotendinous structure in which it lies.
Possible effects of warm up due to elevatedtemperatures are decreased resistance of muscles andjoints, Greater release of oxygen from haemoglobin andmyoglobin,Speeding of metabolic reactions, Increased,nerve conduction rate, Increased thermoregulatorystrain.
These all factors would have played an importantrole in improvement of the flexibility for group B byreducing the resistance to stretch. 28
CONCLUSIONS
The result of our study leads to conclude that boththe techniques were equally effective for improvingROM acutely.
The important finding from this study was that ifsubject specific active warm up was performed prior tomodified hold relax stretching ,the flexibility would lastfor about double the duration ,than that of modifiedhold relax technique.
REFERENCES
1. Maximal Length and Resistance to Passive Stretchof Short Hamstring Muscles Volume 14 Number 6December 1991 JOSPT,250-55.
2. Magnusson SP, Simonsen EB, Aagaard P, GleimGW, McHugh MP, and Kjaer M. Viscoelasticresponse to repeated static stretching in the humanhamstring muscle. Scand J Med Sci Sports 5: 342-347, 1995
3. Hopper D, 2005, S Deacon, S Das, A Jain, D Riddell,T Hall, K Briffa ,Dynamic soft tissue mobilizationincreases hamstring flexibility in healthy malesubjects, Br J Sports Med 2005;39:594–598.
4. ACSM’s guidelines,1997.Exercise testing andPrescription,Lippincott Wilkins & Williams , 1997page13- 19.
5. Spernoga S.G , Timothy L. Uhl, Brent L. Arnold,and Bruce M. Gansneder Duration of MaintainedHamstring Flexibility After a One-Time, ModifiedHold-Relax Stretching Protocol ,J Athl Train. 2001Jan–Mar; 36(1): 44–48.
6. DePino G.M,2000, Duration of MaintainedHamstring Flexibility After Cessation of an AcuteStatic Stretching Protocol Journal of AthleticTraining 2000;35(1):56–59
7. Gajdosik R,1983,Hamstring Muscle TightnessReliability of an Active-Knee-Extension TestVolume 63 / Number 7, July 1983,1085-1088
8. Knudson D ,2005, NSCA Guidelines, Warm up &Flexibility , LWW,166-181.
9. Bishop, 2003 Warm Up II ,Performance ChangesFollowing Active Warm Up and How to Structurethe Warm Up, Sports Med 2003; 33 (7): 483-498
10. Bishop D, 2003 Warm Up I ,Potential Mechanismsand the Effects of Passive Warm Up on ExercisePerformance, Sports Med 2003; 33 (6): 439-454.
11. ACSM Position Stand on The RecommendedQuantity and Quality of Exercise for Developingand Maintaining Cardiorespiratory and MuscularFitness, and Flexibility in Adults. Med. Sci. SportsExerc., Vol. 30, No. 6, pp. 975–991, 1998.
12. Draper D.O.2002;The Carry-Over Effects ofDiathermy and Stretching in DevelopingHamstring Flexibility ,Journal of Athletic Training2002;37(1):37–4
13. Hutton R S 1993 Neuromuscular basis ofstretching exercises. In: Komi P V (ed). Strengthand power in sport, 1st edn, Vol 1. BlackwellScienti®c Publications, Oxford, pp 29-38;cross ref-Physical Therapy in Sport (2001) 2, 186-193.
14. Etnyre B R, Abraham L D 1986b H-reflex changesduring static stretching and two variations of PNFtechniques J Athl Train. 2001 Jan–Mar; 36(1):44–48.
15. Tanigawa MC. Comparison of the hold-relaxprocedure and passive mobilization on increasingmuscle length. Phys Ther .1972; 52 (7): 725-35
16. Markos P.D.Ipsilateral & contra lateral effects ofPNF techniques on hip motion andelectromyographic activity. Phys Ther 1979; 59 (11):1366-1373
17. Katz R, Penicaud A, Rossi A. Reciprocal Iainhibition between elbow flexors and extensorsin the human. J Physiol 1991; 437(1): 269-86
11. hashim 4th may--52-57.pmd 2/7/2013, 8:08 PM56

Indian Journal of Physiotherapy & Occupational Therapy. January-March 2013, Vol. 7, No. 1 57
18. Day BL, Marsden CD, Obeso JA, et al. Reciprocalinhibition between the muscles of the humanforearm. J Physiol 1984; 349 (1): 519-34
19. Etnyre BR, Abraham LD. Gains in range of ankledorsiflexion using three popular stretchingtechniques. Am J Phys Med pas1986; 65 (4):189-96
20. Osternig LR, Roberston RN, Troxel RK, Muscleactivation during proprioceptive neuromuscularfacilitation (PNF) stretching techniques. Am J PhysMed 1987; 66 (5): 298-307
21. Moore MA,1980, Hutton RS. Electromyographicinvestigation of muscle stretching techniques.Med Sci Sports Exerc 1980; 12(5): 322-9
22. Osternig LR,1990, Roberston RN, Troxel RK, et alDifferential responses to proprioceptiveneuromuscular facilitation (PNF) stretchtechniques. Med Sci Sports Exerc 1990; 22 (1):106-1011
23. Garrett, WE. Muscle strain injuries: Clinical andbasic aspects. Med. Sci Sports Exerc. 22:436-443.1990
24. Magnusson SP, Simonsen EB, Aagard P, et al.Mechanical and physiological responses tostretching with and without preisometriccontraction in human skeletal muscle. Arch PhysMed Rehabil 1996; 77: 373-8
25. Magnusson SP. Passive properties of humanskeletal muscle during stretching maneuvers.Scand J Med Sci Sports 1998; 8: 65-77
26. Halbertsma JP, Goeken LN. Stretching exercises:effect on passive extensibility and stiffness in shorthamstrings of healthy subjects. Arch Phys MedRehabil 1994; 75: 976-81
27. CorneliusW.L,1992 ,The Effects of a Warm -up onAcute Hip Joint Flexibility Using a Modified PNFStretching technique.,1992, Journal of athleticTraining . volume 27, number 2,112-114
28. McCardle ,Katch and Katch, 2001 , special aids toexercise training and performance ,Exercisephysiology, 5 th edition , Lippincott wilkins andWilliams, 574-575.
11. hashim 4th may--52-57.pmd 2/7/2013, 8:08 PM57

58 Indian Journal of Physiotherapy & Occupational Therapy. January-March 2013, Vol. 7, No. 1
A Comparative Study of effectiveness between SuperficialHeat and Deep Heat along with Static Stretching to
Improve the Plantar Flexors Flexibility in Females WearingHigh Heel Foot Wears
Hasmukh Patel1, Dhaval Desai2, Harshit Soni2, Komal Soni2, Chintan Shah2
1Clinical Therapist, U. N. Mehta Institute of Cardiology & Research Centre, Ahmedabad.2Lecturer, SPB Physiotherapy College, Surat
ABSTRACT
Background: Lower extremity overuse injuries commonly occurs due to decreased flexibility of plantarflexor muscles in females wearing high heeled foot wears. Plantar flexors shortening are treated byvarious physiotherapeutic techniques. Superficial heat (moist heat) and Deep heat (ultra sound) alongwith static stretching are treatment techniques used in physiotherapy.
Objective: To compare the effectiveness of superficial heat and Deep heat in combination with staticstretching in improving the plantar flexors flexibility in females wearing high heeled footwears.
Method: The study included a sample of 40 individuals those who were wearing high heel > 2 inch.Out of that 20 individuals were in superficial heating group (group A) where moist heat wasadministered for 15 minutes to Achilles tendon, and remaining 20 individuals were in deep heatinggroup (group B) where continuous ultrasound with frequency of 1 MHz at an intensity of 1.5 W/Cm2was administered for 7 minutes to the Achilles tendon. Both the groups received 30 seconds of staticstretch with 4 repetitions performed 5 times per week. The duration of entire study was 3 weeks andboth the group received 1 session per day. Analysis was based on the Goniometer test score.
Result: Both the group A and group B showed improvement in ankle ROM postintervention whencompared with preintervention measurement and 't'calculated value for pre-postintervention measureswas statistically significant as it was above the 't' tabulated value. Moreover, Mean±SD of pre-postdifference in right ankle dorsiflexion ROM for group A was 2.90±1.37 and for group B was 4.25±0.85and Mean±SD of pre-post difference in left ankle dorsiflexion ROM for group A was 3.60±1.04 and forgroup B was 4.35±0.74. 't'calculated value for pre-post ROM difference was statistically significant asit was above the 't' tabulated value of 1.96.
Interpretation & Conclusion: There was significant difference between the two groups. In conclusionboth the treatment programs are highly significant and effective in improving the ankle joint ROM, butultrasound with deep heating property was found to be more superior as compared to moist heat packwith superficial heating property in improving plantar flexors flexibility in females wearing high heelfoot wears.
Keywords: Flexibility, Ultrasound Therapy, Moist heat, Static Stretching.
Corresponding author:Hasmukh PatelD-3 Kalyan Kunj, Radhaswami Road,Ranip, Ahmedabad, Gujarat, IndiaE-mail: [email protected]
INTRODUCTION
Flexibility as defined by Gummerson1 is “Theabsolute range of movement in a joint or series of jointsthat is attainable in a momentary effort with the help ofa partner or a piece of equipment.”
The different types of flexibility according to Kurzare:
1) Dynamic flexibility
2) Static-active flexibility
3) Static-passive flexibility
Tightness is a nonspecific term referring to mildshortening of a healthy musculotendineous unit. In thehuman body some muscle or a muscle group getstightness due to lack of proper exercise.2 The plantar-flexor muscles play an important role in the gait cycle
12. Hasmukh patel 5th april--58-64.pmd 2/7/2013, 8:08 PM58

Indian Journal of Physiotherapy & Occupational Therapy. January-March 2013, Vol. 7, No. 1 59
and in postural control. Lack of extensibility in thismuscle group may cause or be related to decreases inankle dorsiflexion, and it has also been hypothesizedto contribute to Achilles tendinitis, shin splints,3 plantarfasciitis,4 and muscle strains.5
Use of high heeled footwear has become a commontrend nowadays. Biomechanical problems which seemto be associated with long term use of such foot wearsresults in shin pain, ankle sprain and altered gaitpattern.6 According to the American Orthopedic Footand Ankle Society, heel > 2 inches are consider as“high” which creates three to six times more stress onthe front of the foot than a shoe with a modest one-inchheel, and can lead to bunions, heel pain, toe deformities,shortened Achilles tendons, and Back Pain.7 ALDALI Waleed et al. confirmed significant reduction incalf flexibility and ankle dorsiflexion range of motion(ROM) in 80 healthy college female students wearinghigh heeled shoes.8
Many therapeutic maneuvers like differentstretching techniques namely static stretching, ballisticstretching, PNF stretching and cyclic stretching areuseful to increase ROM by enhancing soft tissueextensibility. Worrell TW demonstrated significantincrease in ankle dorsiflexion ROM in 11 female and 8male subjects who received 20 seconds of calf stretchingrepeated over 10 sessions followed by 10 close kineticchain gastronemius/soleus stretching sessions.9
Heating modalities used in clinical setup forenhancing flexibility of muscle and promotingrelaxation are briefly divided into superficial and deepheating modalities. Ultrasound, SWD and MWD fall inthe category of deep heating modalities. David Draperevaluated tissue temperature rise during ultrasoundtreatment in 20 males and concluded that applicationof continuous ultrasound with 1MHz frequency and1.5 W/cm2 intensity at the medial gastronemius musclefor 10 minutes in humans raised the mean temperatureto 40.3 °C, which was an increase of 4.9 °C.10 Moist pack,IRR, Wax, etc fall in the category of superficial heatingmodalities. Funk D found that 20 minute moist heatapplication produced significantly more hamstringflexibility than 30 seconds of static stretching.11
Individual studies have been done on Superficialheat combined with static stretching and Deep heatcombined with static stretching for improving flexibilityof plantar flexors muscles. But no study has been done
comparing the efficacy of these two treatmenttechniques, which signifies the need of the presentstudy.
The aims and objectives of the study were;
1. To evaluate the effectiveness of superficial heat withStatic Stretching towards improving plantar flexorsflexibility in females wearing high heel footwears.
2. To evaluate the effectiveness of Deep heat with StaticStretching towards improving plantar flexorsflexibility in females wearing high heel footwears.
3. To compare the effectiveness amongst the twogroups of females who were administered the abovementioned therapies.
METHODOLOGY
Study design: Cohort Comparative Study
Sample size: 40 individuals
Sampling method: Randomized sampling
Study Setting: Shree Devi College of Physiotherapy,Mangalore
Inclusion criteria
1. Female wearing high heel footwears >2 Inches.
2. Age: between 18 years to 30 years.
3. Individual who have ankle dorsi flexion active ROM(AROM) less than 10 Degrees with knee extension
Exclusion criteria
1. Individuals with Impaired sensation.
2. Individuals with any orthopedic problem.
3. Individuals those who are having neuromusculardisorder of hip, knee and ankle.
4. Lower extremity malignancy.
5. Individuals with ankle pathology. E.g. fractures.
Tools used
1) 360o Universal Goniometer.
2) Ultrasound, 1 MHz frequency, SL No. 2506,Ultrasonic Gel
3) Moist pack
12. Hasmukh patel 5th april--58-64.pmd 2/7/2013, 8:08 PM59

60 Indian Journal of Physiotherapy & Occupational Therapy. January-March 2013, Vol. 7, No. 1
Outcome Measures
AROM Measurements for ankle dorsiflexion of bothlegs with knee extension was taken by using a UniversalGoniometer. (Fig. 2)
The Measurement was taken Pre-treatment andPost-treatment i.e. after 3 weeks of intervention.
PROCEDURE
Prior to procedure individual those who met theinclusion criteria were assessed and evaluatedthoroughly by using the questionnaire. After signingthe consent form they were made to participate in study.
40 Individuals of 18-30 years were randomlyassigned into two groups.
Group A: Consisted of 20 Individual who wereadministered moist heat for 15 min to Achilles tendonfor 3 weeks.
Group B: Consists of 20 Individual who wereadministered continuous ultrasound with frequencyof 1 MHz at an intensity of 1.5 W/Cm2 for 7 min to theAchilles tendon for 3 weeks.
Both the groups received 30 seconds of static stretchwith 4 repetitions performed 5 times per week for 3weeks.
Superficial heat administered to Group A persons
Superficial heat was administered by hot packwhich was placed on subject’s Achilles tendon. Twolayers of terry cloth padding were placed between thehot pack and the subject. (Fig. 3)
Deep heating for persons belonging to Group B
Ultrasonic gel, the coupling medium for treatmentwas applied to Achilles tendon followed by continuousultrasound with frequency of 1 MHz at an intensity of
1.5 W/Cm2 for 7 min by using Ultra sound machine intransverse manner. (Fig. 4)
Static stretching to be administered to both the groups:
Calf stretch was performed for 20 seconds with theknee in full extension, followed by a 10-second rest.This sequence was repeated three more times, 5 daysper week for a period of 3 weeks. (Fig. 5)
Fig. 1. Tools Used
Fig. 4 Deep heat (Ultra sound)
Fig. 3. Superficial heat (Moist pack)
Fig. 2. Ankle ROM with knee extension
12. Hasmukh patel 5th april--58-64.pmd 2/7/2013, 8:08 PM60

Indian Journal of Physiotherapy & Occupational Therapy. January-March 2013, Vol. 7, No. 1 61
Following the recording of the above parameters,the obtained scores were tabulated and comparedamong both the study groups for ROM change.
Ethical Consideration: Procedures followed were inaccordance with the ethical standards of HelsinkiDeclaration of 1975, as revised in 2000.12
Statistical Analysis
All participants received full treatments and therewere no drop outs.
Data analysis was done by using SPSS 13.0 versionsoftware for present study. Unpaired t tests were usedto find out homogeneity of two groups for all theparameters at baseline and to compare the outcomemeasurement data between two groups. Paired t testswere conducted to determine whether ankle dorsiflexionROM was significantly different before and after theintervention. Each calculated t-value is compared witht-table value to test two tailed hypothesis at 0.05 level ofsignificance.
RESULTS
Mean±SD of age for group A was 21.00±1.55 andfor group B was 21.10±1.68 and ‘t’calculated value was-0.195 at n1+n2-2 degree of freedom.
Fig. 5. Static Stretching
Table 1: shows descriptive statistics of age distribution among both groups.
Descriptive Statistics
N Minimum Maximum Mean Std. Deviation
Group A 20 19.00 24.00 21.0000 1.55597
Group B 20 19.00 25.00 21.1000 1.68273
‘t’calculated value for right and left ankledorsiflexion ROM preintervention among both thegroups was 0.718 and 1.637 respectively at n1+n2-2degree of freedom. All the descriptive data for both the
groups was not significantly different, so both thegroups were homogenous for all possible confoundingfactors and were valid for comparison.
Table 2: Pre and Post Intervention Comparison of both the Groups in terms of ankle dorsiflexion ROM
Variable GROUP A GROUP B
Pre Post Change Pre Post Change
Right ankle dorsiflexion ROM 7.31±0.59 11.20±0.90 2.90±1.37 7.18±0.56 11.69±0.64 4.25±0.85
Left ankle dorsiflexion ROM 7.37±0.49 11.27±0.70 3.60±1.04 7.08±0.59 11.56±0.51 4.35±0.74
Table 2 shows changes in terms of ankle dorsiflexion ROM of both sides pre and post intervention for both thegroups.
12. Hasmukh patel 5th april--58-64.pmd 2/7/2013, 8:08 PM61

62 Indian Journal of Physiotherapy & Occupational Therapy. January-March 2013, Vol. 7, No. 1
Table 3: Paired ‘t’ test for outcome measures of both the groups
‘t’calculated value in all these cases is statistically significant as it is above the ‘t’ tabulated value; hence boththe treatments were effective in improving Ankle dorsiflexion ROM.
Table 4: Unpaired ‘t’ test for outcome measures of both the groups
Both the groups showed improvement in ankledorsiflexion ROM postintervention. Mean±SD of pre-post difference in right ankle dorsiflexion ROM for groupA was 2.90±1.37 and for group B was 4.25±0.85 and‘t’calculated value was -3.73 at n1+n2-2 degree offreedom. Mean±SD of pre-post difference in left ankledorsiflexion ROM for group A was 3.60±1.04 and forgroup B was 4.35±0.74 and ‘t’calculated value was -2.61 at n1+n2-2 degree of freedom. ‘t’calculated value inall these cases is statistically significant as it is abovethe ‘t’ tabulated value of 1.96.
DISCUSSION
Number of clinical methods and techniques areavailable to improve flexibility, viz. therapeuticapplication of heat in form of superficial and deepheating modality, different stretching technique, preexercise warm up, etc. In stretching, static stretching isthe simplest, useful and most effective technique. This
study consisted of 40 individuals, who were dividedinto 2 groups - Group A and Group B. Group A consistedof 20 individuals with mean age of 21.00 ± 1.55 andgroup B consisted of 20 individuals with mean age of21.10 ± 1.68. Group A was treated with superficial heat(moist heat pack) along with static stretching and groupB with deep heat (ultrasound) along with staticstretching for duration of 3 weeks. Ankle dorsiflexionROM with knee in extension was measured as anoutcome measure to evaluate the effect of superficialand deep heating on calf flexibility and thereby ondorsiflexion ROM. After retrieving the values, data wasstatistically compared using paired and unpaired ‘t’test for comparison within and between the groupsrespectively.
The result demonstrated that the individuals treatedwith both interventions showed improvement in meansof plantar flexors flexibility postintervention which wasevident from higher ‘t’ calculated value. Moreover
12. Hasmukh patel 5th april--58-64.pmd 2/7/2013, 8:08 PM62

Indian Journal of Physiotherapy & Occupational Therapy. January-March 2013, Vol. 7, No. 1 63
statistically when both groups were compared, GroupB showed more plantar flexor flexibility as it showedmuch greater improvement in dorsiflexion ROM ascompared to that in Group A and also the ‘t’ calculatedvalue was higher than ‘t’ tabulated value (1.96). Thiseffect of ultrasound can be attributed to the sufficientincrease in tissue temperature brought by it and hencethereby promoting greater relaxation of muscle ascompared to superficial heating modalities. Thesefindings are in line with those by David Draper (1993and 1998).13,14 Moreover findings of Hendricson et al.(1984),15 Wessling et al. (1987)16 and Rather Aijaz et al.(2007)17 also support the fact that ultrasound whencombined with static stretching as compared to staticstretching alone is more effective in improving soft tissueflexibility. Hence it is more suggestible to use acombination of ultrasound and static stretching toimprove soft tissue extensibility.
Limitations of the study
• The study was done on a small sample size.• Study was conducted for a short period of time.
Scope of further studies
• The study on the same treatment approaches withlarge treatment groups can be done.
• The study of same treatment approaches with theinclusion of control group can be done.
• A long term follow up study should be done to checkthe recurrence rate and to know the long term effectsof interventions.
CONCLUSION
The individuals were treated with superficial heatalong with stretching and deep heat along withstretching for 3 weeks and were found to be effective inimproving the ankle joint ROM in both the groups.Statistically when both the groups were compared,group B individuals showed more improvement ascompared to group A. In conclusion both the treatmentprograms are highly significant and effective inimproving the ankle joint ROM, but ultrasound withdeep heating property is found to be more superior ascompared to moist heat pack with superficial heatingproperty in improving plantar flexors flexibility infemales wearing high heel foot wears.
ACKNOWLEDGMENTS
We are thankful to all our subjects who participatedwith full cooperation. We are also grateful to authors/editors/ publishers of all those articles, journals andbooks from where the literature for this article has beenreviewed and discussed.
REFERENCES
1. Brad Appleton, Stretching and Flexibility. Version:1.18, Last Modified 94/10/12.
2. Kisner C, Colby LA. Therapeutic Exercise:Foundation and Techniques. Philadelphia, Pa: FADavis Co, 1985:172.
3. Reynolds NL, Warrell TW. Chronic Achillesperitendinitis: etiology, pathophysiology andtreatment. J Ortho Sport Phys Ther.199; 13(4):171-176.
4. Middleton JA, Kolodin EL: plantar fasciitis-heelpain in athletes. J Athl Train.1992; 27: 70-75.
5. Millar AP: strains of posterior calf musculature(“tennis leg”). Am J Sports Med.1992; 7: 172-174.
6. Franklin ME, Chenier TC, Brauninger L, et al. Effectof positive heel inclination on posture, J OrthoSports Phys Ther. 1995; Feb: 21(2):94-9.
7. Wearing high heel- Effect on body. Personal healthzone, February 2009.
8. AL DALI Waleed A, OLUSEYE Kamaldeen A.Effect of high-heeled shoes and culturallyhabitual posture on calf muscle flexibility, Arabgulf journal of scientific research.1999; vol.17 (3): 326-33
9. Worrell TW, McCullough M, Pfeiffer a. Effect offoot position on gastrocnemius/soleus stretchingin subjects with normal flexibility. J Ortho SportsPhy Ther. 1994; 19: 352-356.
10. Draper DO, Sunderland S. Examination of the lawof grotthus-draper: Does ultrasound penetratesubcutaneous fat in humans? J Athl Train 1993a;28: 246-250.
11. Funk D, Swank A, Adams K, et al. Efficacy of moistheat pack application over static stretching onhamstring flexibility. J Strength Cond Res. 2001;15: 123-126.
12. WMA Declaration of Helsinki - Ethical Principlesfor Medical Research Involving Human Subjects.59th WMA General Assembly Seoul, Korea, Oct2008. http://www.wma.net/en/30publications/10policies/b3/
12. Hasmukh patel 5th april--58-64.pmd 2/7/2013, 8:08 PM63

64 Indian Journal of Physiotherapy & Occupational Therapy. January-March 2013, Vol. 7, No. 1
13. Draper DO, Sunderland S, Kirkendall DT, RicardM. A comparison of temperature rise in humancalf muscles following applications of underwaterand topical gel ultrasound. J Orthop Sports PhysTher 1993;17: 247–251.
14. David O. Draper, Chad Anderson et al. Immediateand Residual changes in dorsiflexion range ofmotion using an ultrasound heat and stretchroutine. Journal of Athletic Traning 1998;33(2):141-144.
15. Hendricson A, Fredriksson K, Persson I, et al. Theeffect of heat and stretching on the range of hip
motion. J Ortho Sports Phys Ther. 1984; 13:110-115
16. Wessling KC, DeVane DA, Hylton CR. Effects ofstatic stretch versus static stretch and ultrasoundcombined on triceps surae muscle extensibility inhealthy women. Phys Ther 1987; 67: 674-679.
17. Rather Aijaz Y, Pooja Chaudhary. Ultrasound andprolong long duration stretching increase tricepssurae muscle extensibility more than identicalstretching alone. Indian Journal of Physiotherapyand Occupational Therapy, vol. 1, no. 3 (2007-072007-09).
12. Hasmukh patel 5th april--58-64.pmd 2/7/2013, 8:08 PM64

Indian Journal of Physiotherapy & Occupational Therapy. January-March 2013, Vol. 7, No. 1 65
Influence of different Types of Hand Splints on FlexorSpasticity in Stroke Patients
Eman Samir Fayez, Hayam Mahmoud SayedAssistant Professor in Department of Physical Therapy for Neuromuscular Disorders and its Surgery, Faculty of Physical Therapy,
Cairo University, Egypt
ABSTRACT
Objective: The aim of this study is to evaluate the efficacy of each static and dynamic splint on handflexor spasticity and to compare between their effectiveness on hemiplegic patients.
Design: Randomized controlled trial.
Subject: 29 hemiplegic (stroke) patients (45-65 Y/o) with mild to moderate spasticity of upper limb. Theonset of stroke was from 6 month to one year before starting the study.
Intervention: The patients were randomly assigned into two equal study groups of 15 (A and B). Theassessment were performed pre and post application of static splint for group A and dynamic splint forgroup B. The duration of splint application was one hour for both groups. All participants werereceiving designed program of treatment of hemiplegia after application of splint.
Outcome measures: (1 The mean of active and passive range of motion for wrist extension usinggoniometer, and 2) Grip strength by using digital hand dynamometer.
Keywords: Stroke ,Spasticity ,Static Splint And Dynamic Splint.
INTRODUCTION
Stroke, is defined as a cerebrovascular accident(CVA), it is the rapidly developing loss of brainfunctions due to disturbance in the blood supply to thebrain. As a result, the affected area of the brain is unableto function, leading to inability to move one or morelimbs on one side of the body, inability to understandor formulate speech, complications, and may lead todeath.1
Spasticity caused by an upper motoneuronsyndrome is usually defined as a velocity-dependentincrease in muscle resistance against passivelengthening because of a supraspinal disinhibition ofboth tonic and phasic stretch reflexes. This muscle overactivity may result in muscle imbalance and shortening,leading to abnormal postures 4. Pain in the hemiplegicupper limb is also widely reported to be a complicationof spasticity.2
Production of an effective powerful grip or even tomanipulate objects requires the wrist to be held in afunctional position of slight extension maintained byactivity of the wrist extensors4 .The inability to open thehand when reaching for or releasing an object andlimited grip is a common functional problem after stroke.
It may be due to weakness of the finger extensor muscles,spasticity and stiffness of the finger and wrist flexormuscles. Grip can be limited not only because of aninability to activate finger flexors but also because ofweakness of the wrist extensors (extensor carpi radialislongus, extensor carpi ulnaris).3
Splinting is commonly used by both physical andoccupational therapists to prevent joint deformities andto reduce muscle hypertonia of hemiplegic upper limbsafter stroke.4 Orthoses and splints are commonly usedto improve and correct the position, range, quality ofmovement, and function of a person’s arm or hand 5.
It is proposed that inhibition results from theapplication of splint can be due to altered sensory inputfrom cutaneous and muscle receptors during the periodof splint or cast application. Immobilization, applyinggentle continuous stretching of the spastic muscle atsubmaximal passive range of motion (PROM), is seento reduce spasticity by altering the threshold responseto stretch of the muscle spindle and Golgi tendon organsin the antagonist and agonist muscles. The effects ofneutral warmth and circumferential contact are alsothought to contribute to modification of spasticity seenfollowing casting.4
13. Eman Fayej cairo--65-69.pmd 2/7/2013, 8:08 PM65

66 Indian Journal of Physiotherapy & Occupational Therapy. January-March 2013, Vol. 7, No. 1
The biomechanical effects of splinting relate tochanges in the length and extensibility of muscle andconnective tissue. Application of low-load prolongedstretch to the contracted tissues at the end of theiravailable range allows histological changes to occur inthe tissues in response to the position imposed6. It wassuggested that the increase in passive ROM seen afterremoval of casts in hemiplegic and cerebral palsy clientsresults from the lengthening of connective tissueelements along with addition of sarcomeres to themuscle fiber5.
The types of splint designs commonly used aredynamic splint and static splint. The dynamic splintsdesigned to maintain wrist joint alignment withallowing movement at the wrist would improveperformance while maintaining activation of theforearm muscles that control the wrist. In addition, thedynamic splints would preserve and perhaps enhancegrip and manual dexterity skills7. Otherwise staticsplints are designed to be rigid for controlledimmobilization of the involved joint for improvedfunction8.
In a study comparing muscle activation patternsduring perturbed balance when static and dynamicankle splints were worn, investigators reported thatstatic splints decreased muscle activation in anklemusculature7. In contrast, dynamic splints allowedactivation of ankle muscles while improving balancefunction. In addition, proximal muscles in the trunkand thighs were more active with the static splints thanwith the dynamic splints, suggesting increased muscleactivation proximal to the joint, which is fixed orimmobilized during static splint conditions 6.
Many studies concluded the effects of dynamicsplints on upper limb in hemiplegic patients that theycould reduce swelling, improve wrist posture, andreduce wrist and finger flexor spasticity9. Other studyrecommended that daily use of static splint in post-stroke upper limb spasticity over an extended period isassociated with reduction of spasticity and pain, andwith an increase in wrist PROM8.
Also an overnight splint-wearing regimen with theaffected hand in the functional position does notproduce clinically beneficial effects in adults withacquired brain impairment10. For optimal efficacy,therapies aimed to improving function should addressboth muscle shortening and muscle over activity;measures to relax overactive muscles should becombined with physical treatment to lengthen them9.
Therefore, the goal of the current study is to evaluateand compare between the short term efficacy of
dynamic and static splints on hand flexor spasticity instroke patients.
MATERIALS AND METHOD
Subjects
Twenty nine stroke patients (17 women, 12 men)were recruited from outpatient departments in KingFahad Hospital of the University. Subjects were requiredto meet the following inclusion criteria:(1) post strokehemiplegia with duration ranged from 6 months toone year before the study; (2) upper-limb mild tomoderate spasticity (Modified Ashwarth Scale 1+ to 3at the wrist), and (3) age between 45 and 65 years .Exclusion criteria were : (1)cognitive impairment, (2)major contracture affecting muscles of the spastic armat the time recruitment; (3) Joint pathology of the upperlimb (eg, previous fractures, articular blocks); (5)Patients under antispastic drug . Informed consent wasobtained for all patients separately . Subjects werearranged randomly into two groups; group I (G1) andgroup II (G2). Group I consisted of 14 patients (9 malesand 5 females) and group II consisted of 15 patients (8males and 7 females).
INSTRUMENTATION
Hand digital dynamometer was used to measurethe grip strength of affected hand. Goniometer was usedto measure active and passive range of motion of wristextension. Two types of splints were used in this study.The static splint made from a low-temperature,nontoxic, biodegradable material produced from astrictly controlled cotton tissue, the splint held the handin the functional resting position (wrist positionedbetween at 30 degree extension), thumb in abduction 2.The dynamic splint was costumed made fromthermoplastic material and allowed 30 degrees ofmovement at the wrist and the fingers were free 9.
INTERVENTION
All patients of both groups were evaluated at thebeginning and at end of one-hour period of splintapplication. Patients of G1 were wearing static splintfor one hour while, patients of G2 were wearingdynamic splint for one hour .Changes occurring withstatic splint were then compared with changesoccurring with dynamic splint. Because the way inwhich the splint is fitted to the arm may be important,the fitting was performed by the same trainedinvestigator. All assessments were performed in a quietroom while the patient was sitting with the shouldersrelaxed and arms resting comfortably on chair’s armsupport.
13. Eman Fayej cairo--65-69.pmd 2/7/2013, 8:08 PM66

Indian Journal of Physiotherapy & Occupational Therapy. January-March 2013, Vol. 7, No. 1 67
OUTCOME MEASURE
Three outcome measures were recorded, which wereactive range of motion, passive range of motion andgrip strength .These measures were obtained before andafter application of static and dynamic splints in bothstudy groups.
Clinical and instrumental outcome goniometricmeasurements of wrist extension from full flexion ofthe patient were obtained in degrees to calculate theactive and passive range of motion. Each patient wasthen cued to start grip strength using digitaldynamometer, elbow flexed 90 degree with hand andforearm in mid position while rested on the table. Forstatistical analysis, mean of 3 consecutivemeasurements were taken to reduce possiblemeasurement errors, the number of repetitions givenwere according to standardized methods establishedduring previous studies 2, 9.
STATISTICAL ANALYSIS
For parametric data (AROM, PROM, grip strength)differences of the changes occurring after wearing staticand dynamic splints for 1-hour period of time weremeasured and compared using 2-tailed paired t tests.Statistical analysis was performed using SPSS with levelof statistical significance at Pd”0.05.
RESULTS
This study was performed to evaluate the effectof each static & dynamic splints on hand flexorspasticity in stroke patients. There were not statisticalsignificant differences between both groups beforetreatment, Demographic characteristics of both groups,were shown in Table, 1.
Table 1: Demographic Data and Clinical Data of theStudy Population
Comparison Group I Group II P value
Mean ±SD Mean ±SD
Age(year) 63.5 ± 8.1 60.83 ±6.5 0.693#
Height(cm) 170.3±5.13 173.9±8.4 0.432#
Weight(kg) 83±13.4 85.5±10.6 0.649#
Male 9 8 -
Female 5 7 -
Duration of 8.6 7.9
stroke(months)
#: Not significant.
Comparison between pre and post-application ofstatic splint in group I, the results revealed that therewere statistical significant improvement in grip strengthand active ROM, while there was highly significantimprovement of passive ROM, after application of staticsplint; data were shown in Table, 2.
Table 2: Comparison of G.S, AROM and PROM meanvalues before and after static splint application for
group1.
Variables Pre Post P value
Mean ±SD Mean ±SD
Grip strength 3.96 ± 0.61 4.9 ± 0.83 0.003*
AROM 55.24± 6.65 60.7 ± 3.5 0.001*
PROM 101.66±5.6 115.63±6.36 0.0001**
AROM: Active Range Of Motion; PROM: PassiveRange of Motion; SD: standard deviation; *: significant;**: highly significant.
Comparison between pre and post-application ofstatic splint in group I, the results revealed that therewere statistical significant improvement in grip strengthand active ROM, while there was highly significantimprovement of passive ROM, after application of staticsplint; data were shown in Table, 3.
Table 3: Comparison of G.S, AROM and PROM meanvalues before and after dynamic splint application for
group2.
Variables Pre Post P value
Mean ±SD Mean ±SD
Grip strength 4.8 ± 0.53 5.53 ± 0.49 0.001*
AROM 57.01± 7.76 70.52 ± 9.6 0. 01*
PROM 116.33±12.5 135.56±16.7 0.001**
AROM: Active Range Of Motion; PROM: PassiveRange of Motion; SD: standard deviation; *: significant;**: highly significant.
Comparison between G1 and G2, regarding activeROM, passive ROM and grip strength, the resultsrevealed that dynamic splint had significantimprovement in wrist AROM and PROM whencompared to results of static splint. However, patientswho wore dynamic splint had improvement in gripstrength when compared with those of static splint butthis improvement was not statistically significant, datawere shown in Table, 4 and figure, 1.
13. Eman Fayej cairo--65-69.pmd 2/7/2013, 8:08 PM67

68 Indian Journal of Physiotherapy & Occupational Therapy. January-March 2013, Vol. 7, No. 1
Table 4: Comparison between static and dynamic splint mean values of both groups pre and post splint
Variables Pre (Mean ±SD) P value Post (Mean ±SD) P value
Group I Group II Group I Group II
Grip strength 3.96 ± 0.61 4.8 ± 0.53 0.14 4.9 ± 0.83 5.53 ± 0.49 0.13
AROM 55.24±6.65 57.01± 7.76 0.32 60.7 ± 3.5 70.52 ± 9.6 0.05*
PROM 101.66±5.6 116.33±12.5 0.17 115.63±6.36 136.56±16.7 0.001*
AROM; Active Range of Motion, PROM; PassiveRange of Motion; SD: standard deviation; *: significant..
DISCUSSION
This study was designed to investigate the shortterm efficacy of dynamic and static splints on handflexor spasticity in stroke patient and compare betweenthem by changes in degrees of active and passive rangeof motion and grip strength. The result showed thatpatient with spastic hand in both groups haddemonstrated improvement after application of bothtypes of splints .However; the dynamic splint hadsignificant improvement in wrist AROM, PROM & gripstrength compared with static splint.
Because dynamic splints have moving parts thatallow the individual a range of voluntary controlledmovement, it has been proposed that their use mayprevent contractures while allowing opposingantagonist muscle force to counter the force of the spasticmuscle16 .
Muscle activation patterns of the upper extremitymuscles of ten children with CP were compared duringreaching with and without a hand-positioning device.Results suggested more normalized muscle activationwith the device application16 .In contrast, another studyusing static splints that immobilize wrists reporteddecreased muscle activation, which over time may leadto disuse atrophy in the wrist muscles and overuse ofmore proximal muscles.17 In contrast, dynamic wristsplints that provide wrist support for more optimalhand function allowed some movement, may notproduce this additional strain on proximal muscles19.
These finding agree with (Assunta,et al,2005)2 thatstudied the effect of volar static splint in post strokespasticity of the upper limb .The author found that therewas an increase in wrist PROM after application of acustom volar static splint for 2 to 3 hours a day in post-stroke spasticity of the upper limb . The results of thecurrent study come in accordance with (Jean , et al,2000)7 that studied the short term effects of dynamiclycra splints on upper limb in hemiplegic patients , the
study reported reduction in wrist and finger flexorspasticity when lycra garments were worn over 3 hours.
Our results disagree with (Natasha, etal 2003)6 thatstudied the effect of splinting the hand in the functionalposition after brain impairment, the study indicatedthat subjects with acquired brain impairment who wereparticipating in routine motor training and upper-limbstretches did not showed detectable or importantchanges in wrist flexor extensibility after wearing asplint daily for 4 weeks.
Also , the current results counteract with (Turtonand Britton 2006)11 that found that application of anintensive 4-week splinting program to preventcontractures in the arm after stroke did not increase theextensibility of the wrist and long finger flexor musclesin adults after stroke, this trial evaluating stretchpositioning in the upper limb, reported a loss of 13° ofwrist extension range at 8 weeks.
RECOMMENDATION
Further investigation is necessary to determineefficacy of the different splints over time and in differentfunctional activities to more clearly understandsplinting use for spastic hand in hemiplegic patient.
CONCLUSION
The study findings suggested that spastic hand inhemiplegic patient may experience improvement inPROM , AROM and hand grip strength as a result ofstatic and dynamic splint application , but better resultswere found when dynamic splint were worn duringthe same time of application .
REFERENCES
1. Donnan GA, Fisher M, Macleod M, Davis SM.Stroke. Lancet 2008; 371 (9624): 1612–1623.
2. Assunta Pizzi, Giovanna Carlucci, CatusciaFalsini, etal. Application of a volar static splint inpoststroke spasticity of the upper limb. Arch PhysMed Rehabil 2005; 86:1855-1859.
3. Ruth Turk, Jane H. Burridge, Ross Davis, etal.
13. Eman Fayej cairo--65-69.pmd 2/7/2013, 8:08 PM68

Indian Journal of Physiotherapy & Occupational Therapy. January-March 2013, Vol. 7, No. 1 69
Therapeutic Effectiveness of Electric Stimulationof the Upper-Limb Poststroke Using ImplantedMicrostimulators. Arch Phys Med Rehabil 2008;89:1913-1922.
4. Katz R, Rymer WZ. Spastic hypertonia: mechanismand measurement. Arch Phys Med Rehabil 1989;70:144-155.
5. Wilton JC: Splinting and casting in the presenceof neurological dysfunction. In: WIlton JC, Handsplinting: principles of design and fabrication.London: WB Saunders 1997; 168-197.
6. Patricia A. Burtner, Janet L. Poole, Theresa Torres,etal. Effect of wrist hand splints on grip, pinch,manual dexterity, and muscle activation inchildren with spastic hemiplegia: A PreliminaryStudy. J HAND THER 2008; 21:36–43.
7. Collins K, Oswald P, Burger G, Nolden J.Customized adjustable orthoses: Their use inspasticity, Arch Phys Med Rehab 1985;66:397-8.
8. Langlois S, Pederson L, MacKinnon J: The effectsof splintingon the spastic hemiplegic hand: reportof a feasibility study. Canadian J Occup Ther 1991;58(1):17-25.
9. Neeman R, Neeman M: Rehabilitation of a post-stroke patient with upper extremity hemipareticmovement dysfunction by orthokinetic orthoses, JHand Ther 1992; 3(5):147-155.
10. Natasha A. Lannin, Sally A, Horsley, etal.Splinting the Hand in the Functional Position afterBrain Impairment: A Randomized, ControlledTrial. Arch Phys Med Rehabil 2003; 84:297-302.
11. Jean-Michel Gracies, Jeno Emil Marosszeky, RogerRenton, etal. Short-term effects of dynamic lycrasplints on upper limb in hemiplegic patients. ArchPhys Med Rehabil 2000 ;( 81):1547-1555.
12. Lannin NA, Cusick A, McCluskey A, etal. Effectsof splinting on wrist contracture after stroke: arandomized controlled trial. Stroke 2007; 38(1):111-116.
13. Patricia A. Burtner, Jennifer Bradley Anderson,Michelle Lee Marcum, etal. A comparison of staticand dynamic wrist splints usingelectromyography in individuals withrheumatoid arthritis. J HAND THER 2003 ;(16):320–325.
14. Stern EB, Yterberg SR, Krug HE, Mullin GT,Mahowald ML. Immediate and short-term effectsof three commercial wrist extensor orthoses on gripstrength and function in patients with rheumatoidarthritis. Arthritis Care Res 1996 ;(9):42–50.
15. Turton AJ, Britton E. A pilot randomized controlledtrial of a daily muscle stretch regime to preventcontractures in the arm after stroke. Clin Rehabil2005 ;( 19):600–612.
16. Feldman P.Upper extremity splinting and casting.In: Glenn MB,Whyte J (eds). The PracticalManagement of Spasticity in Children and Adults.Malvern, PA: Lea & Febiger 1990; pp 59–166.
17. Reid DT, Sochaniwskyj A. Influences of a handpositioning device on upper extremity control ofchildren with cerebralpalsy. Int J Rehabil Res 1992;(15):15–29.
18. Bulthaup S, Cipriani DJ, Thomas JJ. Anelectromyography study of wrist extensionorthoses and upper extremity function. Am JOccup Ther 1999 ;(53):434–440.
19. Jansen CWS, Olson SL, Hasson SM. The effect ofuse of a wrist orthosis during functional activitieson surface electromyography of the wrist extensorsin normal subjects. J Hand Ther 1997 ;(10):283–289.
13. Eman Fayej cairo--65-69.pmd 2/7/2013, 8:08 PM69

70 Indian Journal of Physiotherapy & Occupational Therapy. January-March 2013, Vol. 7, No. 1
Interferential Current Therapy versus Narrow BandUltraviolet B Radiation in the Treatment of Post Herpetic
Neuralgia
Intsar Salim.WakedLecturer of Physical Therapy, Department of Physical therapy for Surgery, Faculty of Physical Therapy, Cairo University, Egypt.
ABSTRACT
Objective: To compare the efficacy of interferential current therapy versus narrow band ultraviolet Bradiation in the treatment of post herpetic neuralgia.
Subjects: Forty nine patients suffering from distressing post herpetic neuralgia. assigned randomlyinto 2 groups; interferential group and narrow band ultraviolet B group. Intensity of pain was recordedbefore and after therapy using numerical rating scale.
Results: The results of this study showed no significant difference in pain intensity post treatmentbetween both groups in acute and subacute neuralgia as p value > 0.05 while there was significantdifference between both groups in established neuralgia as p value< 0.05.
Conclusion: The study concluded that interferential current and narrow band ultraviolet B wereeffective in acute and subacute neuralgia, while only interferential is effective in established neuralgia.
Keywords: Interferential Current Therapy, Narrow Band Ultraviolet B Radiation, Numerical Rating Scale, Postherpetic neuralgia.
INTRODUCTION
Herpes zoster ( HZ ) infection is caused by areactivation of the latent varicella zoster virus thatcauses chicken pox. It appears predominantly in olderadults whose immunity for the virus has waned. Post-herpetic neuralgia (PHN) is described as sharp, burning,aching, or shooting constantly present in the dermatomethat corresponds with the herpes rash1.
Pain in HZ evolves in three phases: acute, subacute,and chronic. The acute phase occurs with the onset ofthe herpetic rash and lasts for less than 30 days, thesubacute phase lasts for 1-3 months after the onset ofthe rash, and the chronic phase, or PHN, lasts for 3months or longer after the onset of the rash2.
Post herpetic neuralgia (PHN) is a common,debilitating complication of herpes zoster that has amajor impact on patients’ quality of life. It can causeinsomnia, fatigue, depression. Predictors of PHN aregreater age, acute pain and rash severity, prodromalpain, the presence of virus in peripheral blood, as wellas adverse psychosocial factors3.
The treatment of PHN is medically challenging andoften frustrating in some situation as the exact
mechanism of neuralgia is poorly understood andmultiple and complex pathophysiology is postulatedrequiring poly pharmacy, which itself leads to manyside effects4.
Interferential current (IFC) is a commonelectrotherapeutic modality used to treat pain. IFCtherapy is the application of alternating medium-frequency current (4,000 Hz) amplitude modulated atlow frequency (0–250 Hz). Despite IFC’s widespreaduse, information about it is limited. A review of theliterature reveals incomplete and controversialdocumentation regarding the scientific support of IFCin management of post herpetic pain5.
The inflammatory response plays a major role inthe pathogenesis of acute zoster pain and PHN.Ultraviolet B radiation (UVB) may affect the course ofPHN through its suppressing effect on the inflammatoryresponse in the acute zoster attack, thus decreasing theneuronal damage contributing to PHN 6.
The purpose of this study was to evaluate theefficacy of interferential current therapy versus narrowband ultraviolet B radiation in the treatment of post –herpetic neuralgia.
14. Instar cairo--70-75.pmd 2/7/2013, 8:08 PM70

Indian Journal of Physiotherapy & Occupational Therapy. January-March 2013, Vol. 7, No. 1 71
PATIENTS AND METHOD
Subjects
Forty nine patients (24 male, 25 female) withdistressing post herpetic neuralgia were recruited fromdepartment of dermatology and the study conductedin outpatient department of physical therapy- El-Mataria Teaching Hospital after approval of theinstitutional ethical committee. The history & clinicalexamination were done for all patients. Subjects whofulfilled the following criteria were eligible forenrollment in the study; (1) age ranged from 50 to 80years, (2) elapsed time since the beginning of pain lessthan 6 months. Patients were excluded if they had (1)disseminated zoster, (2) malignancy, (3) diabetes, (4)pregnancy (5) pacemakers (7) Patients were takingimmunosuppressive medication. The patients wererandomized into two groups of equal number. (1)interferential group and (2) narrow band ultraviolet B (nbUVB) group. Pain was assessed by numerical ratingscale before starting of the treatment and at the end ofthe therapeutic period for all patients.
At the time of this study, Human Research EthicsCommittee had not been established in the faculty ofphysical therapy, but the study was approved by thedepartmental council of physical therapy for surgeryand all patients signed an informed consent at the firstvisit to the physical therapy clinic .
Outcome measures
Measurement of pain intensity by Numeral RatingScale
Numeral Rating Scale (NRS) is a common andpractical method for assessing pain severity. It is themost widely used pain rating scale in clinical practice.There is evidence, which supports the validity andreliability of the NRS in younger. and older patients.The reliability of the NRS is acceptable and it has ahigh internal consistency, with a Cronbach á range of0.86 to 0.88 7.
The NRS is an 11-point pain scale, where patientsare requested to quantify the intensity of their pain on ascale from zero to 10 (from 0 = no pain to 10 = worstpain imaginable). The NRS scale can also be usedvisually with both words and numbers along a verticalor horizontal line. Patients are asked to express anumber that relates best to their pain intensity8.
Treatment procedures
Interferential current Therapy (IFC)
Description of apparatus
SONOSTIM ( Class 1-type BF, Norm: 601-1) was a
combined unit used to introduce interferential currentfor group 1. This unit introduced a quadripolar IF aswell as bipolar mode. The unit was provided with twooutput channels for interferential currents.
Treatment parameters
The parameters used were; frequency 250 Hz, apulse duration 120ì, 30 minutes. The treatment wasgiven for 3 sessions per week for 5 weeks. Intensity ofthe impulse varied according to the patient’s tolerance9.
Electrodes placement
• The dermatome that was affected by the shingles isthe treatment path for electrotherapy. Each channelhas one electrode that emits electricity and the otherelectrode is the ground.
• One electrode, from channel 1, was placed directlybeside the origin point where the dermatome exitsthe spinal cord. The other electrode for channel 1was placed about 2/3rds of the way down thedermatome.
• On channel 2 one electrode was placed betweenthe two electrodes of the first channel approximately1/3rd down, and the other electrode from channel2 was placed at the distal end of the dermatome,.This electrode placement now covers the entiredermatome 5.
Narrow Band Ultraviolet B Radiation Therapy (nUVB)
Narrow band UVB apparatus (Waldmann - UV100L) was used to introduce nbUVB (311-312nm) topatients in group 2. The starting dose was 0.21 J/cm2
and gradually increasing the dose by 10 mJ/cm2 eachsession to a maximum dose of 100 mJ/cm2. (as long asthere is no adverse effects reported such as persistenterythema, burn, itching)10.
Patients were instructed to expose the involved bodypart while the rest of the body was covered usingclothing. Patients were instructed to wear protectivegoggles to avoid damage of the cornea. Treatmentsessions were repeated three times a week.
Statistical Analysis
Data were coded and entered to a statistical packageof social science (SPSS, version 16). Mann-Whitney Utest was used to assess the difference in sex, type ofpain, type of neuralgia, affected dermatome as well asthe intensity of pain in acute, subacute and establishedneuralgia between both groups, while wilcoxon test wasused to assess the intensity of pain within each group.All p values less than 0.05 were considered to bestatistically significant.
14. Instar cairo--70-75.pmd 2/7/2013, 8:08 PM71

72 Indian Journal of Physiotherapy & Occupational Therapy. January-March 2013, Vol. 7, No. 1
RESULTS
A total of 49 patients was screened for eligibility,and 47 subjects fulfilled the inclusion criteria. Threesubjects of 47 reported poor adherence to the treatment,(a participant with poor adherence to the programdefined as missing more than three consecutive sessionsor more than 20% of all sessions) and excluded from
the study, and their data were not used in the statisticalanalysis. A total of 44 subjects completed the study andwere initially randomized into two groups of equalnumber. IF group (n=22), and nbUVB group (n=22).Table (1) presents the characteristics of the patientscompleting the study. Both groups were comparable atthe baseline regarding to the demographic and clinicalcharacteristics.
Table 1: Demographic and clinical characteristics
Variables IF group nbUVB group P values
Age (years) (mean ±SD) 60.90±7.19 59.90±8.39 0.673*
Duration of pain (day) 103.05±62.00 98.50±68.84 0.819*(mean±SD)
Type of neuralgia (%) Acute 5(22.7%) acute 7(31.8%) 0.633*
Subacute 5(22.7%) subacute 4(18.2%)
Established 12(54.5%) established 11(50%)
Sex (Male - Female) Male 10(45.5%) Male 11(50%) 0.765*
Female 12(54.5%) Female 11(50%)
Affected dermatome Cervical 3(13.6%) Cervical 5(22.7%) 0.891*
Thoracic 7(31.8%) Thoracic 5(22.7%)
Lumbar 2(9.1%) Lumbar 1(4.5%)
Rt upper limb 6(27.3%) Rt upper limb 6(27.3%)
Lt upper limb 4(18.2%) Lt upper limb 5(27.7%)
Type of pain ( %) Continuous burning 8(36.4%) Continuous burning 7(31.8%) 0.591*
Intermittent burning 6(27.3%) Intermittent burning 5(22.7%)
Continuous stabbing 5(22.7%) Continuous stabbing 6(27.3%)
Intermittent stabbing 3(13.6%) Intermittent stabbing 4(18.2%)
Intensity of pain Acute 8.00±.8366 Acute 8.00±1.11 0.932*(median±SD)
Subacute 8.00±.8366 Subacute 8.50±0.577 0.190*
Established 8.00±.866 Established 8.00±0.894 0.558*
* No significant differences SD; standard deviation
Measurements of pain intensity
In table (2); The results showed significant reductionin pain intensity post treatment in IF group whatevertype of neuralgia ( acute, subacute, chronic) as p value
<0.05. In nbUVB group; the results showed significantreduction of pain intensity post-treatment in acute andsubacute neuralgia as p value <0.05 however nosignificant difference in established neuralgia as pvalue > 0.05..
Table 2: pain intensity within both groups pre and post treatment.
Acute neuralgia Subacute neuralgia Established neuralgia
pre post pre post pre post
IF Group 8.0±0.83 2.0±1.14 8.0±0.83 3.0±0.84 8.0±0.87 2.0±0.94
P value 0.043** 0.041** 0.002**
NBUVB 8.0±1.11 3.0±0.899 8.0±0.57 3.5±0.96 8.0±0.89 7.5±1.00
P value 0.018** 0.039** 0.55*
* No significant difference * * Significant difference
14. Instar cairo--70-75.pmd 2/7/2013, 8:08 PM72

Indian Journal of Physiotherapy & Occupational Therapy. January-March 2013, Vol. 7, No. 1 73
IF group nbUVB group
Percentage of improvement in acute neuralgia
IF group nbUVB group
Percentage of improvement in subacute neuralgia
IF group nbUVB group
Percentage of improvement in established neuralgia
14. Instar cairo--70-75.pmd 2/7/2013, 8:08 PM73
74 Indian Journal of Physiotherapy & Occupational Therapy. January-March 2013, Vol. 7, No. 1
In table (3); The results showed no significantdifference in pain intensity post treatment between bothgroups in acute and subacute neuralgia as p value >0.05 but significant difference between both groups posttreatment as regard to established neuralgia as p value<0.05.
Table 3: Comparison of pain intensity between bothgroups post treatment
IF Group NBUVB P value
Acute neuralgia 2.0±1.14 3.0±0.899 0.442*
Subacute neuralgia 3.0±0.84 3.0±0.96 0.439*
Established neuralgia 2.0±0.94 7.5±1.00 0.001**
* No significant difference * * Significant difference
DISCUSSION
Postherpetic neuralgia is the major chroniccomplication and is a difficult management problem.The aim of this study was to compare the effects ofinterferential current therapy versus narrow bandultraviolet B radiation in the treatment of post herpeticneuralgia. A prospective study of forty nine subjectswas carried out. Subjects were divided into two groups;IF group that received interferential therapy and nbUVBgroup that received narrow band UVB sessions.Outcome measures were assessed using numericalrating scale to assess pain intensity pre and posttreatment.
The results of the study showed that there wassignificant reduction in pain intensity post treatmentin IF group in acute, subacute and chronic neuralgia asp value <0.05. This support the efficacy of interferentialfor minimizing pain and this may be attributed toanalgesic effects of interferential therapy.
The analgesic effect of interferential therapy can beexplained in part by Wednesky inhibition of Type Cnociceptive fibres, although other mechanisms arecertainly involved. ‘Pain gate’ theory, proposed byMalzack and Wall11 remains central to this explanation.Another system that helps to reduce pain is the‘descending pain suppression mechanism’, which ismediated by the endogenous opiates12.
Number of previous studies demonstrated theeffectiveness of inferential current therapy in order toreduce neuropathic pain. Babu and Murali;13 andBurchiel;14 analyzed analgesic effects of IFC in chronicand acute neuropathic pain. Natarajan;15 also foundpositive results of interferential currents in diabeticneuropathy and post-herpetic neuralgia. Nabila; et al;9
concluded that Interferential therapy is an effective,easy to use therapy with minimal side effects in patientssuffering from trigeminal neuralgia that not respondingto conventional treatment.
In a study compared IF with transcutanous electricalnerve stimulation (TENS) Cheing and Hui-Chan;16confirmed the analgesic effects of IF and TENSin their study and concluded that both TENS and IFincreased the heat pain threshold to a similar extentduring stimulation. However, the post-stimulationeffect of IF lasted longer than that of TENS.
As regard to the efficacy of nbUVB; the results ofstudy showed that there was significant reduction ofpain intensity in acute and subacute neuralgia howevernon significant differences in chronic neuralgia. Theimprovement in acute and subacute neuralgia may beattributed to the anti-inflammatory effect of UVB. UVBmay affect the course of PHN through its suppressingeffect on the inflammatory response in the acute zosterattack thus decreasing the neuronal damagecontributing to PHN17.
Langerhans cell (LCs) play an important role in PHNas several molecules that sensitize cutaneousnociceptors are released by LCs. And the langerhansmay be activated in acute PHN. UVB radiationsuppresses antigen presentation of LCs in differentways. It stimulates keratinocytes and mast cells tosecrete immunosuppressive cytokines such as IL-10,TNF-á, IL-4, PG-E2, á-MSH or CGRP, which inhibit theantigen-presenting function of LCs. Furthermore, itcauses depletion of the LCs in the epidermis 18, whichmay also explain the improvement induced by UVB inPHN.
Also UVB modifies the T-cell response to persistentVZV particles in nerve fibers, which might be involvedin the pathogenesis of PHN. UVB induces a shift from aTh-1 immune response to a Th-2 response in differentways19.
Two studies correlate with the results of this study.Jalali et al;20 who reported 58.33 and 83.33% completepain relief at 1 month and 3 months follow up,respectively. And concluded that UVB phototherapy inthe acute stage of zoster rash might reduce the incidenceand severity of PHN. Treatment after 3 months does notseem to have a significant beneficial effect. Also El-Nabarawy; 10 who used nbUVB for 17 patients withpost herpetic neuralgia and the results showed morethan 50% improvement was achieved in 6 (35.29%) and8 (47.06%) patients, at the end of therapy and after 3
14. Instar cairo--70-75.pmd 2/7/2013, 8:08 PM74

Indian Journal of Physiotherapy & Occupational Therapy. January-March 2013, Vol. 7, No. 1 75
months follow up, respectively. And concluded thatnbUVB may provide a potential tool in the managementof PHN.
To the best of our knowledge, there is no studycomparing the efficacy of interferential therapy versusnarrow band ultraviolet B radiation. The results of thisstudy showed no significant difference in pain intensitypost treatment between both groups in acute andsubacute neuralgia as p value > 0.05 but significantdifference in established neuralgia as p value< 0.05.This confirm the efficacy of both interferential andnbUVB for acute and subacute neuralgia, while onlyinterferntial is effective in established neuralgia. Thelimitations of our study were no control group includedand no period of follow-up. Further studies includingcontrol group and follow-up are needed to furthervalidate our findings.
Conflict of interest
There is no interest of conflict with any organization,and this research is not funded
ACKNOWLEDGEMENTS
We express our gratitude to all those who havecontributed in completing this research work, especiallyall the subjects who willingly agreed to participate inthis study.
REFERENCES
1. De Benedittis G, Besana F, Lorenzetti A “A newtopical treatment for acute herpetic neuralgia andpost-herpetic neuralgia: the aspirin/diethyl ethermixture. An open-label study plus a double-blindcontrolled clinical trial”. Pain; (1992); 48 (3):383–390.
2. Dworkin RH, Portenoy RK. Proposedclassification of herpes zoster pain. Lancet1994;343:1648.
3. Johnson RW, Whitton TL. Management of herpszoster (shingles) and postherpetic neuralgia.Expert Opin Pharmacother (2004);5:551-9.
4. Fashner J, Bell AL. Herpes zoster and postherpeticneuralgia: prevention and management. Am FamPhysician. (2011) Jun 15;83(12):1432-1437.
5. Kitchen S, Palmer S, Martin D,. Interferentialcurrent for pain control. In: KitchenS ed.Electrotherapy Evidence-based Practice. 11th ed.Edinburgh, Scotland: Churchill Livingstone;2002:287–298.
6. EL-Ghor AA, Norval M. Biological effects ofnarrow-band (311nm TL01) UVB irradiation: areview. J Photochem Photobiol B 1997;38:99-106.
7. Lara-Munoz C, De Leon SP, Feinstein AR, PuenteA, Wells CK: Comparison of three rating scales formeasuring subjective phenomena in clinicalresearch, Use of experimentally controlledauditory stimuli. Arch Med Res 2004, 35(1):43-48.
8. Hartrick CT, Kovan JP, Shapiro S: The numericrating scale for clinical pain measurement: a ratiomeasure? Pain Pract 2003, 3(4):310-316.
9. Nabila S; Muhammad H; Faisal Y; Rukhsana B;Efficacy of interferential current on trigeminalneuralgia. 2012; NEURALGIA MC Vol. 19 - No.2;33 – 35.
10. El-Nabarawy E. The use of narrow band ultravioletlight B in the prevention and treatment ofpostherpetic neuralgia (A pilot study). Indian JDermatol;2011;56:44-7.
11. Kloth, L. Interference current. In: ClinicalElectrotherapy Nelson, R.M., Currier, D.P. (Ed.) Ch9, 183-207, Appleton and Lange, 1987. Norwalk,Connecticut, USA.
12. Watson, J. Pain mechanisms: a review. 3.Endogenous pain mechanisms Aust J. Physiother1982, 28 (2), 38-45
13. Babu R, Murali R. “Arachnoid cyst of thecerebellopontine angle manifestingascontralateral trigeminal neuralgia: case report”,Neurosurgery 2010; Jun; 28(6): 886-7.
14. Burchiel KJ. “A new classification for facial pain”,Neurosurgery 2001; Nov; 53(5):1164-6.
15. Natarajan, M “Percutaneous trigeminal ganglionballoon compression: experience in 40 patients”.Neurology (Neurological Society of India)(2001)’;48 (4):330–2.
16. Cheing GL, Hui-Chan CW. Analgesic effects oftranscutaneous electrical nerve stimulation andinterferential currents on heat pain in healthysubjects. J Rehabil Med. 2003 Jan;35(1):15-9.
17. Misery L. Langerhans cells in the neuron-immuno-cutaneous system. J Neuroimmunol 1998;89:83-7.
18. Shreedhar V, Giese T, Sung VW, Ullrich SE. Acytokine cascade including prostaglandin E2, il-4, IL-10 is responsible for UV-induced systemicimmunosuppression. J Immunol 1998;160:3783-9.
19. Schwarz T. Mechanisms of UV-inducedimmunosuppression. Keio J Med 2005 ; 54:165-71.
20. Jalali MH, Ansarin H, Soltani-Arabshahi R. Broad-band ultraviolet B phototherapy in zoster patientsmay reduce the incidence and severity ofpostherpetic neuralgia. PhotodermatolPhotoimmunol Photomed. 2006 Oct;22(5):232-7.
14. Instar cairo--70-75.pmd 2/7/2013, 8:08 PM75

76 Indian Journal of Physiotherapy & Occupational Therapy. January-March 2013, Vol. 7, No. 1
Effect of the Duration of Play on Pain Threshold and PainTolerance in Soccer Players
Shahid Raza1, C.S. Ram2, Jamal Ali Moiz3
1Physiotherapist, Centre for Physiotherapy and Rehabilitation Sciences, Jamia Millia Islamia, 2Director, Department of Physiotherapy ITSParamedical college, Ghaziabad, 3Assistant Professor, Centre for Physiotherapy and Rehabilitation Sciences, Jamia Millia Islamia
ABSTRACT
Background: The athlete's capacity to tolerate pain is one of the most important features of sportingsuccess. Research suggest that a verity of pain suffers can benefit from exercise. Duration of play mayincrease in pain threshold and pain tolerance in soccer players.
Objective: The purpose of this study was to evaluate the effect of pain threshold and pain tolerance onparticipation in playing soccer.
Design: This was a same subject pre-test post-test trial.
Setting: The study was conducted at Siri Fort Sports Complex and Jawaharlal Nehru Stadium (SportsAuthority of India) New Delhi.
Participants: Thirty healthy male district level soccer player (aged 17-22 years) participated in thestudy.
Measurements: A gross pressure device was used to induce pain, and to measure pain threshold andpain tolerance. It consisted of a sphygmomanometer and rubber coated steel cleat. Cleat along withshin guard was placed of the medial surface of the tibia approximately in the middle portion. Pain wasinduced by inflating the sleeve at 10 mmHg every 10 seconds. The subjects were asked to inform whenthey first sense pain. The pressure was noted as pain threshold reading. Pressure was further increasedtill the subject cannot endure it readings were noted as pain tolerance and pressure was released. Thereadings were taken before, between and after the game.
Results: Compared with three readings of pain threshold and pain tolerance a repeated measure ofANOVA showed a significant difference. A bonferroni test was used for post hoc pair wise comparisonamong all three conditions showed a significant difference among three possible pairs.
Limitations: Further work is needed to determine whether sex differences in pain coping mechanismexist before, during after competition.
Conclusion: The present data suggest that changes in pain threshold and pain tolerance in soccerplayer depend on the duration of play. The result of this study proves that the participation in game toimprove the pain threshold and pain tolerance in soccer players.
Keywords: Soccer, Pain Threshold, Pain Tolerance Introduction.
INTRODUCTION
The athlete’s capacity to tolerate pain is among themost important features of sporting success.Researchers contended that the pain tolerance is the
Corresponding author:Jamal Ali MoizAssistant Professor,Centre for Physiotherapy and Rehabilitation Sciences,Jamia Millia Islamia (Central University),New Delhi-110025,India, E-mail: [email protected]: +91 (011) 26980544, Fax: +91 (011) 26980544
most critical differentiator between successful andunsuccessful athletes in endurance sports. The abilityto tolerate pain is often inherent in competitive sportssuccess. Performing physical skills at the optimal efforts,particular when the movement involves contact withother participants, virtually maintaining other effortand skilled performance after experiencing pain duringthe contest, and after rehabilitation.1
Dramatic anecdotes of dancers or athletes whocontinue strenuous exercise in the face of severe injuriesand later report that they felt no pain have contributedto the notion that exercise can increase pain tolerance.
15. Jamal ali Moitz--76-80.pmd 2/7/2013, 8:08 PM76

Indian Journal of Physiotherapy & Occupational Therapy. January-March 2013, Vol. 7, No. 1 77
Such anecdotal evidence has been linked to theory todata which indicate that exercise releases endorphinsand that endorphins reduce pain. This proposedlinkage has, intern, led to a belief that exercise-inducedanalgesia is an established phenomenon.2
Ronalds Melzack,3 founder of pain gate theory haddescribed pain in his own words in the following ways“ it is not a fixed response to a noxious stimulus ;itsperception is modified by past experiences, expectationsand even by culture. It has a protective function,warning us that something biologically harmful ishappening. But anyone who has suffered prolongedpain would regard it as “Evil”, punishing affection thatis harmful in its own right”.
It has been reported by Raithel that most painmanagement programmers prescribe some kind ofexercise regimen, some include aerobic exercise, othersinclude resistance exercise, and still others use acombination of aerobic and resistance exercise.Research has been conducted into whether aerobicexercise, such as cycling and running , is associatedwith an analgesic effect, and has indicated that aerobicexercise at a sufficient intensity (>70% of maximumaerobic capacity) has been associated with increases inpain threshold.4
The Literature regarding whether or not exercise –induced analgesia is an established phenomenon inhumans is equivocal. Haier et al (1981)5 have reportedchanges in pain threshold following exercise, whileothers have not. a number of investigators have studiedchanges in pain threshold using a dental pulpstimulation. Pertovara et al. (1985)6 al investigatedchanges in dental pain threshold during exercise atdifferent intensities and found that dental painthreshold tends to increase with increasing workload.
The experiments are typical studies investigatingpost-exercise analgesia. Their emphasis was not onsupporting the casual role of exercise in the analgesiceffect, but instead focused on whether the analgesiceffect is mediated by release of endorphins. However,while these studies appear to support the analgesiceffect of exercise, a causal interpretation is limited bythe failure to include a no exercise control group.7
Willium P. Margan(1984)8 examined the “effectivebeneficence of vigorous physical activity” andconcluded that distraction, release of monoamine aswell as endorphins during vigorous physical activities,act synergistically to produce the analgesic effect.Ashley Grossaman and John R. Sutton(1984) 9
investigated the relationship between the endorphinrelies and their role in exercise and found that theendorphin concentration in the blood increasesconsiderably with exercise and play an important rolein regulation of ventilation especially at higher intensityexercise , where they appear to inhibitory.
Another study by Conard Droste (1990)10 onexperimental pain threshold and plasma beta –endorphine level dosages does not correlatesignificantly with pain threshold, though short term,exhaustive physical exercise can evoke transient painthreshold. This exercise induced elevation in painthreshold does not however, appear to be directly relatedto plasma endorphine level.
Maria Gurevich (1994)11 and colleagues found thatsubmaximal exercise intensity produces analgesiasuggesting the possibility of using moderate exercisein therapeutic intervention. Another study by Mark HAand Kenith Russel (1994)1 confirmed that resistiveaerobic exercises can result in greater pain tolerance.
Though the growing body of research suggest that avariety of pain sufferer can benefit from exercise, and agreater reliance upon exercise as an effective , healthyand less intrusive pain management alternatives, oradjunctive, to pharmacological analgesics can be laid.However relatively little research has been devoted toexamining the effectiveness of exercise on influencingthe person’s threshold and tolerance of pain,particularly acute.
PURPOSE
The purpose of this study was to evaluate the effectof pain threshold and pain tolerance on participationin playing soccer.
HYPOTHESIS
Duration of play will increase the pain thresholdand pain tolerance in soccer players.
METHOD
Subjects
A total number of 30 healthy male district level soccerplayers were selected for the study from Siri Fort sportscomplex and Jawaharlal Nehru stadium (sportsauthority of India) New Delhi. Ethical approval wasobtained from the university ethical committee prior torecruiting subjects. The mean age of the selected sample
15. Jamal ali Moitz--76-80.pmd 2/7/2013, 8:08 PM77

78 Indian Journal of Physiotherapy & Occupational Therapy. January-March 2013, Vol. 7, No. 1
was 18.6 +1.4 ranging from 17to 22 years of age. Aninformed consent was taken from all the participantsafter describing in detail the procedure and purpose ofthe study to all of them. The subjects were selectedaccording to the following inclusion and criteria.
Inclusion criteria
• Age group between 16 to 25 years
• Healthy district level soccer players
• Only males
Exclusion criteria
• Subjects taking pain killers or muscle relaxant drugs
• Any recent or previous injury
• Non co-operative persons
• Those subjects whose pain tolerance exceeded morethan 300 mmHg(maximum rereading for thesphygmomanometer) during pre-test
DESIGN OF THE STUDY
A same subject pre-test post test design was selectedfor testing the hypothesis. A baseline reading was takenprior to start of the game, a second reading of thedependent variable were taken during the half time ofthe game and final reading immediately after the gamewas over. Only one subject was selected formeasurement of dependent variable during a singlegame. These readings were then compared to find outthe effect of independent variables. The outcomemeasure or dependent variables, selected for this studywere pain threshold and pain tolerance.
Instrument and tool
• Sphygmomanometer
• Rubber coated steel football cleat
• Soccer shin guard
• Digital stopwatch to record time
PROCEDURE
Before the warm-up a baseline measurement of painthreshold and pain tolerance was taken from theselected subject. The selected subject has been giveninstructions regarding not to exercise, not to smoke, not
to consume alcohol or caffeine at least two hours beforethe game. The subjects were made to lye supine on theground to make them comfortable and also to ensurethat they cannot see the sphygmomanometer readingsto avoid giving any visual feedback. A gross pressuredevice was used to induce pain, and measure painthreshold and pain tolerance. It consisted of asphygmomanometer and rubber coated steel cleat alongwithin the shin guard was placed on the medial surfaceof the tibia approximately in the middle portion. Thesleeve of the sphinomanometer was fastened aroundthe shin guard and was inflated.
Pain was induced by inflating the sleeve at 10mmHg every 10 seconds, which compressed the steelcleat against the shin causing pain. The subjects wereasked to inform when the first sense the pain. thepressure reading of the mercury column of thesphygmomanometer was noted as pain thresholdreading. The pressure was increased further till thesubject cannot endure it. At this point again thesphygmomanometer readings were noted as paintolerance and pressure was released.
Methods of instruction was standardized by givingthe subjects the following commands “ this apparatus,using pressure for investigation of sensitivity to painyou have to say “start” as soon as you are not able tobear the pain . These readings were taken before gameagain during half time and after the end of the game.
DATA ANALYSIS
Data analysis was done using SPSS software.Demographic data of patient including age , sex weredescriptively summarised. A repeated measure ofANOVA was performed to analysed the difference inpain threshold and pain tolerance. An alpha level of0.05 was used to determine statistical significance. Allpossible pair wise post hoc analysis was conducted onthe significant dependant variable in order to comparedifference among duration of game.
RESULTS
A total thirty (n=30) district level soccer player withmean+ SD age 18.6+14 years were selected for theanalysis. Before warm-up, prior to the game, during thehalf time of the game and at the end of the game bothpain threshold and pain tolerance are summarised inmean and standard deviation in table 1.
15. Jamal ali Moitz--76-80.pmd 2/7/2013, 8:08 PM78

Indian Journal of Physiotherapy & Occupational Therapy. January-March 2013, Vol. 7, No. 1 79
To find out the difference among all the threereadings of pain threshold and pain tolerance arepeated measure of ANOVA shows statisticallysignificant difference among all the three readings ofboth pain threshold (F=17.05,p<0.0001)and paintolerance (F=19.69, p<0.0001). A bonferonnin post hocpair wise comparison shows significant differenceamong three pairs before game vs. between game (painthreshold p=0.02,pain tolerance =0.001) before gamevs. after game (pain threshold p<0.0001, pain tolerancep<0.0001) and between game vs. After game (painthreshold p=0.033, pain tolerance p=0.019) which ispresented in figure 1.
DISCUSSION
The results of this study suggest that competitionmodulate pain threshold and pain tolerance responsesto noxious stimuli. Soccer player exhibits higher painthreshold and pain tolerance during and after the gamecompared to before the game.
We believe that the stress component of competitioncontributes to the pain inhibition associated withphysical exertion. In soccer scoring chances are rare, adefensive mistake in soccer, for example, may carry moreimportance and cause a higher degree of anxiety and adefensive mistake in a basketball game. If a defensivemistake in a basketball game results in a basket for theopposition, many opportunities to make up the deficitare likely to occur. Soccer is a “player’s game,” duringa game, athletes are expected to make their owndecisions concerning what to do in every situation.Athlete, who participated in soccer or basketball,however experienced similar levels of analgesia priorto game situations. The study provides evidence thatthe competitive aspects of competition and its physicalstressors aroused the SIA mechanism. Much of theexisting research on anxiety in sports is too focused onthe characteristics of the athlete, while ignoring thecharacteristics of the environment in which thebehaviour took place. Situational variables have beenshown to effect emotions elicited by the variouscompetitive environment.12
Winning experiences, social context, coaching style,and the nature of sports all play a role in athlete painresponse to meaningful competition and shouldtherefore be considered in athletes who claim to feel nopain following an injury. Exercise induced analgesiais only produced in humans following high level ofexercise with a work load of at least 74% aerobiccapacity. Each testing session was not aerobicallychallenging for the participants, and therefore wasunlike to lead to significant changes in pain thresholdand pain tolerance due to exercise.13
Athletes display a rise in pain threshold (analgesia)in response to athletic completion as compared withnon competitive testing session. Hormonal levels insoccer players, in game compared to before. Cortsol hasbeen identified as a reliable marker of stress. Bothanalgesia and elevated cortisol levels measured beforegames suggest that game situations can be consideredas reliable stressors. Many outside factors alsocontribute to overall physiological status of a playerincluding conditioning activities, practice schedules,academic demands, and physiological stressors, inaddition to completion. Such factors consistently affectan athlete’s overall level of stress and confoundpossible cortisol elevations in anticipation of practice.14
Research suggests that environmental stress is anatural triggers of the inhibition of pain sensation. Itfollows the athletes experienced both analgesia priorto the game and elevated cortisol level due to the stressof athletic competition. Stress is believed to activate theendogenous opoid system which will cause theobserved analgesic response.15 Cortsol “the stresshormone” is the dominant form of glucocorticiods inhumans. ACTH and â-endorphine have roles in theregulation of stress; Both ACTH and â-endorphine haveroles in the regulation of stress; ACTH stimulates theadrenal which releases cortisol and â-endorphinebindsto opoid receptors which produce analgesia. Thus, theanalgesic findings from the study could be due to thestress elicited from comparative situations, which inturn caused analgesia and subsequently higher painthreshold and pain tolerance. The study supports the
Table 1. Results of pain threshold and pain tolerance at before game, between game and after game
BGM+SD BTM+SD AFM+SD ANOVA Bonferroni
F P BF Vs.BT BFVs.AF BTVs.AF
Pain threshold 151+20.6 158.5+21.8 164+25.84 17.05 0.000 0.002 0.000 0.033
Pain tolerance 188.2+27.9 200.2+28.6 209.5+30 19.69 0.000 0.001 0.000 0.019
Significant at p<0.05; BF= before game; BT= between game; AF= after game
15. Jamal ali Moitz--76-80.pmd 2/7/2013, 8:08 PM79

80 Indian Journal of Physiotherapy & Occupational Therapy. January-March 2013, Vol. 7, No. 1
hypothesis that the duration of play increase painthreshold and pain tolerance in soccer players. 14
Competition can be considered a stressor significantenough to evoke analgesia in athletes. The study foundthat the soccer players have higher pain threshold andpain tolerance after the game compared to before andbetween games.
CONCLUSION
The present data suggest that changes in painthreshold and pain tolerance in soccer player dependon the duration of play. The changes may be related tostress mechanism that involves within the competition.The result of this study proves that the participation ingame to improve the pain threshold and pain tolerancein soccer players.
ACKNOWLEDGEMENTS
The authors wish to acknowledge the co-operationof all the participants who participated in this study.The authors extend their thanks to M.S. Basins, seniorPhysiotherapist, Sports Authority of India, for his co-operation throughout this study process.
Conflict of Interest
The authors have no conflict of interest to declare.
REFERENCES
1. Anshel M H , Russell KG. Effect of aerobic andstrength training on pain tolerance, pain appraisaland mood of unfit males as a function of painlocation. Journal of Sports Sciences (1994); 12:535-547.
2. Wendy J. Padawer and Fredric M. Levine Exercise-induced analgesia: fact or artifact? Pain(1992);48:131-135
3. Melzack R, Wall PD. Pain mechanisms: a newtheory. Science (1965); 150 (3699):971–9.
4. Raithel KS.Chronic pain and exercise therapy,Physician and Sports Medicine (1998);17203-10
5. Haier RJ, Quaid K, Miller JS. Naloxone alters painperception after jogging. Psychiatr. Res.(1981);5:231-232
6. Modification of dental pain and cutaneousthermal sensitivity by physical exercise in men.Brain Research. (1985);360:33-40
7. Bartholomew JB, Lewis BP, Linder DE, Cook DB.Post exercise analgesia: replication and extension.Journal of Sports Science. (1996); 14:329-334
8. Morgan PW affective benefits of vigorous physicalactivity. Medicine Science in Sports and exercise.(1998);17(1):94-100
9. Grossman A, Sutton JR. Endorphins: What theyare? How are they measurement? What is theirrole in exercise? Medicine Science in Sports andExercise (1984);17(1)74-81.
10. Droste C, Greenlee MW, Schrech M, Roskamm H.Experimental pain threshold and plasma beta-endorphin level during exercise. Medicine Sciencein Sports and Exercise. (1990);23(3):334-342
11. Gurevich M, Kohn PM, Davis C. Exercise inducedanalgesia and role of reactivity in pain sensitivity.Journal of Sports Sciences (1994);12:549-559.
12. Darlene Hartline, Randalph,Kesler M.Management of common MusculoskeletalDisorders. 2nd edition, J.B Lippincott, New York2000.
13. Pertovara A, Huopaniemit, Virtanen A, JohnssonG, The influence of exercise on dental painthreshold and the release of stress hormones.Physical Behavior (1984);33(6),923-926
14. Stern berg WF, Brokat C, Kass L, Alaboyadjian A,Grecely RH. Sex dependent components of theanalgesia produced by athletic competition. Pain(2001);2(1) 65-74.
15. Koltyn KF. Analgesia following exercise a review.Sports Medicine (2000); 29(21) 85-98.
15. Jamal ali Moitz--76-80.pmd 2/7/2013, 8:08 PM80

Indian Journal of Physiotherapy & Occupational Therapy. January-March 2013, Vol. 7, No. 1 81
Neuromuscular Electrical Stimulation Versus IntermittentPneumatic Compression on Hand Edema in Stroke
Patients
Eman S.M.Fayez1, Hala Ezz Eldeen2
1Assistant Professor in Department of Physical Therapy for Neuromuscular Disorders and its Surgery, Faculty ofPhysical Therapy, Cairo University, 2Professor in Department of Cardiopulmonary Rehabilitation and Geriatrics.
Faculty of Physical Therapy, Cairo University
ABSTRACT
Objective: the purpose of this study was to evaluate and compare between the effect of application ofneuromuscular electrical stimulation and intermittent pneumatic compression on reducing hand edemain stroke patients.
Subjects: Thirty stroke patients of both sexes (18 females and 12 males).They assigned randomly into2 study groups each one composed of 15 patients.
Method: Group I received intermittent pneumatic compression therapy and group II receivedneuromuscular electrical stimulation three times per week for twelve weeks. The patients were assessedfor hand volume by using the volumetric measurement and by hand held dynamometer to measurehand grip strength before and after the end of treatment period.
Results : The results of this study revealed that application of intermittent pneumatic compressiontherapy had a significant effect on reducing hand edema in stroke patients than receiving neuromuscularelectrical stimulation .While hand function measured by hand grip strength was improved moresignificantly with receiving neuromuscular electrical stimulation than the group who receivedintermittent compression therapy.
Conclusion: Application of intermittent pneumatic compression therapy was more effective in reducinghand edema than neuromuscular electrical stimulation while application of neuromuscular electricalstimulation resulting in greater improvement in hand grip strength and hand function.
Keywords: Stroke, Hand Edema, Hand Function, Neuromuscular Electrical Stimulation and IntermittentPneumatic Compression Therapy
INTRODUCTION
In hemiplegic patients, swelling of the affected handis a recognized phenomenon. The mechanism ofswelling is uncertain, but it had many predisposingfactors as immobility, dependency, impaired venousreturn and paralysis of the sympathetic control ofvasculature.1
Edema in paretic hand may be attributed to acombination of dependency and insufficient musclepump resulted from hemiplegia that will hampervenous return in the affected limb which in turn willincrease the capillary filtration resulting in edemawhich can be the main mechanism of hand edema inthat cases.3-4
Pain and disfigurement resulted from edema whichin chronic cases may predispose to contractures. Thiscombined with the increased weight of the limb, whichmay interfere with the rehabilitation of the limb andaffect hand function 5.
Hand edema following stroke is associated with painand stiffness, which can lead to a decrease in activemotion and disuse. The most widely acceptedexplanation is due to increase venous congestion relatedto prolonged dependency and loss of muscle pumpingfunction in the paretic limb6.
In stroke rehabilitation neuromuscular electricalstimulation (NMES) can be used to modulate neuralactivity to either regain voluntary muscle contraction
16. Eman Fayej cairo--81-86.pmd 2/7/2013, 8:08 PM81

82 Indian Journal of Physiotherapy & Occupational Therapy. January-March 2013, Vol. 7, No. 1
or to prevent abnormal muscle reaction due to weaknessand spasticity7 .It was found that application of (NMES)had a significant effect in reducing hand edema poststroke because it produce an active muscle pumpresulted in removing excess fluid 8-9. Others studied theapplication of intermittent pneumatic compression(IPC) in treating hand edema following stroke but theyfound that (IPC) had a limited role in reducing edema ifit used solely1. The aim of this study was to evaluateand compare between effect of application of (NMES)and (IPC) on reducing hand edema and improvinghand function in stroke patients.
MATERIAL AND METHOD
Subject selection
• Thirty patients of both sexes (18 females and 12males) who were diagnosed as stroke and referredby a neurologist. All of the participants complainedfrom wrist and hand edema. The mean age was54±7 years. They were selected from the out-patientclinic of the faculty of physical therapy, CairoUniversity. CT was performed for all patients toconfirm the diagnosis. All patients had grade 1 to 2of spasticity according to the modified AshworthScale10. Subjects were excluded if they had majorcognitive impairment, heart failure, myocardialinfarction, lymphedema, or trauma, . The patientswere assigned into 2 groups equal in number groupI which composed of 15 patients (10 females and 5males ) and they received (IPC) .Group II composedof 15 patients (8 females and 7 males ) and theyreceived (NMES).
Equipments
Volumeter which is used to objectively measure thevolume of body parts by using the fluid displacementmethod1. Hand digital dynamometer was used tomeasure the grip strength in affected hand to measurethe impact of treatment on hand function12. Vasotrain447, Enraf-Nonius apparatus for application of (IPC).The 2-channel Respond Select II electrical stimulator(Texas, USA) was used for application of (NMES) .
Procedures
All patients received the same standard physicaltherapy treatment designed for stroke patients, for 30min on 3 days each week for 12 weeks, respectively.Group I patients received (IPC) therapy as follows, astockinet layer was applied to the hemiplegic limb toabsorb moisture and a full arm-inflatable sleeve was
applied over this and attached to the compressionpump. The pressure levels were set as an intermittentcompression manner which composed of a pressure of80-120 mmHg for 40 seconds as compression phaseand a pressure of 40 mmHg for 20 seconds as deflationphase 1.Each patient in both study groups receivedtreatment once a day, 3 sessions weekly for 12 weeks.
The patients in (group II) were given (NMES). Thesurface electrodes were applied on hand flexor musclegroup. This stimulation pattern will be administered tothis muscle group for approximately 20 minutes.Electrodes will then be repositioned and applied to theextensor muscle group for approximately 20 minutes.The stimulation was at a frequency of 30 Hz, with apulse width of 300 ìs. The amplitude of the current wasadjusted to the maximal tolerance of the patient, in arange up to 90 micro ampere , with a duty cycle of 5second on and 5 second off. The total stimuli were 180cycles during the treatment session. Patients werefocusing on the movement induced by (NMES) duringthe treatment. Treatment lasted for 30 min., 3 days perweek for 12 weeks.
The outcome data were measured as follows thevolumeter was placed on a horizontal stable surfaceand filled with tap water to the level of the spout. Thepatient was asked to lower his hand into the volumeter.This made the water to displace from the spout to becollected into a graduated glass container. The collectedwater in the graduated container which referred topatient’s hand volume was measured. For measuringhand grip strength each patient was instructed to startgrip strength measures by using digital dynamometer,while elbow flexed 90 degree with hand and forearm inmid position and rested on the table.
The measurements were repeated three times andan average measure was taken for the hand volumeand hand grip strength.
Statistical analysis
The data were descriptively analyzed bycalculating: Mean ± Standard deviation. Student t. testwas used to compare the mean of pre and post studymeasurements of hand volume and hand grip strengthin each group .The statistical significance differencewas determined with P value d”0.05.Unpaired t.testwas used to compare these findings between studygroups. Pairson correlation was used to measure therelationship between hand volume and hand gripstrength in each group.
16. Eman Fayej cairo--81-86.pmd 2/7/2013, 8:08 PM82

Indian Journal of Physiotherapy & Occupational Therapy. January-March 2013, Vol. 7, No. 1 83
RESULTS
I – Anthropometric characteristics of both groups:
Table (1) Anthropometric characteristics of the patients in the two groups represented in table (1)
Comparison Group I Group II P value
Mean ±SD Mean ±SD
Age 47.5 ± 6.1 48.3 ±4.5 0.693
Height 170.3 ±5.13 173.9 ±8.4 0.432
Weight 83 ±13.4 85.5 ±10.6 0.649
Male 5 - 7 -
Female 10 - 8 - -
BMI 23.7 ±4.1 25.6 ±2.8 0.635
II – Comparison between the pre, and post hand, wrist volume and grip strength in group I.
Table (2) shows comparison between the pre, and post hand, wrist volume and grip strength in group I. There was asignificant decrease in hand and wrist volume. Also, there was a significant increase in hand grip strength in group
I who received (IPC)
Mean hand SD (cm³) Mean hand grip SDvolume (cm³) strength (Newton) (Newton)
Pre 469.50 13.329 4.33 1.49
Post 421.40 19.687 6.65 2.41
P value 0.0001** 0.0475*
**highly significant * significant
III– Comparison between the pre, and post hand , wrist volume and grip strength in group II.
Table (3) shows comparison between the pre, and post hand, wrist volume and grip strength in group II. There wasa significant decrease in hand and wrist volume. Also, there was a highly significant increase in hand grip strength
in group II who received (NMES)
Mean hand SD (cm³) Mean hand grip SDvolume (cm³) strength (Newton) (Newton)
Pre 464.67 15.562 5.13 1.51
Post 447.00 14.938 7.35 1.91
P value 0.0032* 0.0001**
**highly significant * significant
IV– comparison between the pre, and post values of hand, wrist edema and hand grip strength in both studygroups
Table (4) reveals the pre, and post values of hand, wrist edema and hand grip strength in both study groups. There wasstatistically significant decrease in hand volume in group I who received (ICP) when compared with group II whoreceived (NMES). While there was statistically significant improvement in hand grip strength in group II when comparedwith group I.
Table (4) comparison between the pre, and post values of hand, wrist edema andhand grip strength in both study groups
Mean hand P value Mean hand grip P valuevolume (cm³) strength (Newton)
Group I Group II Group I Group II
Pre 469.50 464.67 0.4060 4.33 5.13 0.1185
Post 421.40 438.00 0.0356* 6.65 7.35 0.0008**
**highly significant * significant
16. Eman Fayej cairo--81-86.pmd 2/7/2013, 8:08 PM83

84 Indian Journal of Physiotherapy & Occupational Therapy. January-March 2013, Vol. 7, No. 1
V- Correlation between hand volume and hand grip strength in both study groups:
Table (5) There was a statistically significant correlation between hand volume and hand grip strength in group I.While there was none statistically significant correlation between hand volume and hand grip strength in group II.
Group I R P value Group II R P value
Hand Hand grip Hand Handgripvolume strength volume strength
421.40 6.65 -0.6301 0.0118 438.00 7.35 -0.3979 0.1588
**highly significant * significant
Figure (4) Correlation between hand volume and hand grip strength in both study groups
DISCUSSION
Edema of the hand is one of the complications thatcan developed after stroke. The etiology of edemaformation might be due to dependency and loss ofmuscle pump efficiency due to hemiplegia will hamperthe return of blood in the veins of the affected limb20.
Because there was great contradictions about theeffect of both IPC and NMES on reduction of edema instroke patients’ hand . So, this study was conducted tohelp in determination the most effective modality withmore prolonged effects on the edema of the hand instroke patients. The study was performed on 30 strokepatients (18 females and 12 males) complicated withhand and wrist edema. Group I received therapy, whilegroup II received (NMES). Both groups underwent theirprograms 3 times a week for 12 weeks. The collecteddata included values of hand, wrist volumes and handgrip strength which were measured before and afterthe treatment program.
Looking for group I, showed reduction of mean valueof hand volume from the statistical analysis of data ofgroup I showed improvement of hand edema after threemonths of treatment.
These results can be attributed to the evidence that(IPC) increases venous velocity, reduces edema,enhances fibrinolytic activity and reduces the damagingeffect of white cell activity13.
It can also be due to the increased venous andlymphatic return as a result of external pressure on alimb. This external compression not only moves thelymph and fluids along, but also it may spread theintercellular edema over a larger area, enabling morelymph and venous capillaries to become involved inremoving the plasma proteins and water 21.
The mechanism of improving hand edema by theuse of intermittent pneumatic compression therapy canalso be explained as intermittent high pressurecompression allows limb salvage in patients withhemostasis and limb-threatening ischemia who are notcandidates for revascularization.14.
The results of this study agree with (Armstrong andNguyen 2001)19 who reported that pneumaticcompression is an effective tool for the reduction ofedema.
On the other hand there was contradiction with(Roper et al,1999)1 in his previous study for thetreatment of the edematous stroke hand withintermittent pneumatic compression (IPC)using apressure of 50 mmHg, applied with 30 sec inflationand 20 sec deflation duty cycle treatment compriseddaily for 1 month. This study showed no influenceneither on edema reduction nor upper limb function. Itseems that good results in our study were obtainedbecause we used higher pressure levels (a pressure of80-120 mmHg for 40 seconds as compression phase I
16. Eman Fayej cairo--81-86.pmd 2/7/2013, 8:08 PM84

Indian Journal of Physiotherapy & Occupational Therapy. January-March 2013, Vol. 7, No. 1 85
and a pressure of 40 mmHg for 20 seconds ascompression phase II, deflation) and longer treatmentperiods (session period was 30 minutes, one session aday, 3 days weekly for 12 weeks).
Concerning group II neuromuscular electricalstimulation, their data showed reduction hand volume.However the reduction in hand edema in group II maybe resulted from production of an active muscle pumpwhich cause removing excess fluid during applicationof neuromuscular stimulation induced contraction ofthe paralyzed muscles7. Also, application ofneuromuscular stimulation resulted in increasedmuscle bulk and strength. This will also lead to greatercapillary density and therefore improved local bloodsupply and tissue condition17. Neuromuscular electricalstimulation had also been reported to modulate edemaby reducing capillary permeability22.
The results of the present study were in accordancewith Gad e al16 who reported that application ofneuromuscular electrical stimulation can improveselected hand functions and impairment of chronicstroke survivors.
This finding was also supported by previous study,which reported reduction in hand volume due tocompression and squeezing of venous and lymphaticvessels caused by skeletal muscles contraction thatresults from the electrical stimulation. These repetitivecontractions may promote reabsorption of leakage fluidand proteins with subsequent edema reduction11.
Our results demonstrated that there was asignificant increase in hand grip strength as anindicator of hand function 12in both groups but thisimprovement was significantly higher in group II thanin group I. These results may be attributed to improvingstrength, voluntary movement, force production, andfunctional skill abilities in the upper extremity resultedfrom application of neuromuscular electricalstimulation15.
Thus the present study revealed (IPC) was moresignificantly effective than NMES in reducing handedema in stroke patients .Perhaps, this differenceresulted from increased venous and lymphatic flow dueto application of external compression was higher thanthat caused by muscle pumping due to electricalstimulation. Although NMES had an effect on reducingcapillary permeability this effect didn’t cause edemareduction as compression therapy.
RECOMMENDATION
It is recommended to use intermittent compressiontherapy in conjunction with neuromuscular electricalstimulation especially in patients who have been failedin controlling their hand edema with standard therapymodalities. Further studies needed to compare betweendifferent types of current stimulation and thesummation effect of both therapy modalities.
REFERENCES
1. Roper TA, et al. Intermittent compression for thetreatment of the edematous hand in hemiplegicstroke: a randomized controlled trial, Age andaging; 1999; 28:9-13.
2. Boomkamp k., et al: post stroke hand swelling andedema: prevalence and relationship withimpairment and disability. Clinical rehabililtation;2005; 19:552-559.
3. Wang JS, et al: Neuromuscular electric stimulationenhances endothelial vascular control andhemodynamic function in paretic upperextremities of patients with stroke. Arch Phys MedRehabil; 2004; 85:1112-1116.
4. Leibovitz A, et al. Edema of the paretic hand inelderly poststroke nursing patients. Arch GerontolGeriatr. ; 2007; 44:37-42.
5. Faghri PD, The effects of neuromuscularstimulation-induced muscle contraction versuselevation on hand edema in CVA patients. J HandTher; 1997; 10:29-34.
6. Chae J. A critical review of neuromuscularelectrical stimulation for treatment of motordysfunction in hemiplegia. Asst Technol; 2000; 12:33-49.
7. Maram J, et al. Neuromuscular stimulation afterstroke: from technology to clinical deployment.Expert. Rev. Neurother, 2009; 4-9.
8. Ashworth MS and Tardieu .Their ClinicalRelevance for Measuring Spasticity in Adult andPediatric Neurological Populations. PhysicalTherapy Reviews; 2002; 1: 53-62.
9. Griffin JW, et al .Reduction of post traumatic handedema: A comparison of high voltage pulsedcurrent, intermittent pneumatic compression andplacebo treatments. Phys Ther; 1996; 70; 5:279-285.
10. Alan S. et al. Arm functions after Stroke .Anevaluation of grip strength as a measure of recoveryand a prognostic indicator. J Neurol, Neurosurg,and Psychiatry; 1989; 52:1267-1272.
11. Vowden K .The use of intermittent pneumaticcompression in venous ulceration. Br. J. Nurs. ;2001; 10; 8: 491-509.
16. Eman Fayej cairo--81-86.pmd 2/7/2013, 8:08 PM85

86 Indian Journal of Physiotherapy & Occupational Therapy. January-March 2013, Vol. 7, No. 1
12. Bemellen V, et al .Intermittent high-pressurecompression in homeostasis. Arch Surg; 2001;136:1280-1285.
13. Ziling L and Tiebin Y.Long term effectiveness ofneuromuscular electrical stimulation forpromoting motor recovery of the upper extremityafter stroke. J Rehabil Med; 2011; 43:506–510.
14. Gad A.et al. A home based self administeredstimulation program to improve selected handfunctions of chronic stroke. Neuro Rehabilitation;2003; 18:215–225.
15. Chae J, Yu D. A criical review of neuromuscularelectrical stimulation for treatment of motordysfunction in hemiplegia. Asst Techno; 2000; 12:33-49.
16. Winsor T. et al .The effect of venous compression
on the circulation of the extremities. Arch PhysMed Rehab; 1999; 34: 559-565.
17. Armstrong DG, Nguyen HC .Improvement inhealing with aggressive edema reduction afterdebridement of foot infection in persons withdiabetes. Arch Surg.; 2001; 135:1405-1409.
18. Boomkamp KH et al, Post stroke hand swellingand edema: prevalence and relationship withimpairment and disability .Clinical Rehabilitation;2005; 19:552-559.
19. Wilkerson J External compression for control oftraumatic edema. Phys Sports Med.; 2001;13(6):97-106.
20. Bettany JA,etal Influence of high voltage pulseddirect current on edema formation followingimpact injury. Phys Ther; 1990; 70(4):219-224.
16. Eman Fayej cairo--81-86.pmd 2/7/2013, 8:08 PM86

Indian Journal of Physiotherapy & Occupational Therapy. January-March 2013, Vol. 7, No. 1 87
A Combination Approach using Manual Therapy andExercise in the Treatment of Shoulder Impingement
Syndrome
Annamma Mathew1, Abedi Afsaneh2
1Assistant Lecturer, College of Allied Health Sciences, Gulf Medical University, Ajman, UAE2Physiotheapist, Gulf Medical College Hospital and Research Center, Ajman, UAE
ABSTRACT
The purpose of this case study was to compare the effectiveness of traditional physical therapyinterventions of using therapeutic modality and exercise versus a combined approach usingmobilization with movement and exercises in the treatment of shoulder impingement syndrome. Atotal of 5 patients diagnosed with shoulder impingement syndrome were selected from the hospital.Patients then participated in the programs, which were held twice a week for two months. Mainoutcome measures included 24-hour pain (VAS), shoulder active range of motion (AROM), and shoulderfunction (SPADI). Repeated-measures analysis indicated significant decreases in pain, improvedfunction, and increases in AROM. The MWM had a higher percentage of change from pre- to post-treatment on pain measures pain (VAS): 0.6 to 0.2 following 4 session treatment, higher percentage ofchange on the SPADI and in AROM.
This study suggests that performing glenohumeral mobilizations with movement (MWM) in combinationwith a supervised exercise program may result in a greater decrease in pain and improved functionalthough studies with larger samples and discriminate sampling methods are needed.
Keywords: Exercise, Glenohumeral Mobilization, Mobilization with Movement.
Corresponding author:Mrs. Annamma MathewCollege of Allied Health SciencesGulf Medical UniversityAjman, UAEEmail: [email protected]
INTRODUCTION
Shoulder impingement syndrome, the most commondiagnosis of shoulder dysfunction1, is often de-scribedas shoulder pain exacerbated by overhead activities.Primary shoulder impingement occurs when the rotatorcuff tendons, long head of the biceps ten-don,glenohumeral joint capsule, and/or subacromial bursabecome impinged be-tween the humeral head andanterior ac-romion. Primary impingement may be dueto intrinsic factors: rotator cuff weak-ness2, chronicinflammation of the rota-tor cuff tendons and/orsubacromial bursa, rotator cuff degenerativetendi-nopathy, and posterior capsular tight-nessleading to abnormal anterior/supe-rior translation of
the humeral head. It may also be due to extrinsic factors:possession of a curved or hooked acro-mion, acromialspurs, or postural dysfunction. Secondary shoulderim-pingement is defined as a relative de-crease in thesubacromial space due to glenohumeral joint instabilityor abnor-mal scapulothoracic kinematics. Commonlyseen in athletes engaging in overhead throwingactivities, second-ary impingement occurs when therota-tor cuff becomes impinged on the poste-rior-superior edge of the glenoid rim when the arm is placedin end-range ab-duction and external rotation. Thisposi-tioning becomes pathologic during excessiveexternal rotation, anterior cap-sular instability, scapularmuscle imbal-ances, and/or upon repetitive over-loadof the rotator cuff musculature. Physical therapy hasbeen found to be effective in reducing pain anddisability in patients with shoulder impingement.Effective interventions include therapeutic exercisesfocusing on strengthening the rotator cuff and scapularstabilizing musculature3, stretching to decreasecapsular tightness, scapular taping techniques, andpatient education of proper posture.
17. JAYAKUMARI--87-89.pmd 2/7/2013, 8:08 PM87

88 Indian Journal of Physiotherapy & Occupational Therapy. January-March 2013, Vol. 7, No. 1
CASE PRESENTATION
The present study was conducted on five femalepatients, aged 32-45 (mean 39.8 years) with chiefcomplaint of intermittent catching pain on shoulder,complaint of night pain and unable to sleep on involvedside, who were diagnosed as having shoulderimpingement syndrome. The effect of treatment wasassessed based on the following dependent variables:pain intensity measured with VAS scale; pain-activeROM measured with a standard goniometer for flexionand abduction; and a measurement of shoulder functionassessed with the Shoulder Pain and Disability Index(SPADI)4-5. These traditional interventions includedTENS, posterior capsule stretching, postural correctionexercises, and an exercise program focusing on rotatorcuff strengthening and scapular stabilization. A manualtherapy approach to treating shoulder dysfunction isthe Mulligan concept of mobilization with movement(MWM)6. The goal of per-forming MWM is immediateand sus-tained improvement in joint pain and mobility.Mulligan’s techniques6 entail having the physicaltherapist apply an accessory mobilization to aperipheral joint while the patient simultaneouslygenerates active movement. This procedure wasrepeated for a total of 3 sets of 10 repetitions as long aspain-free motion was sustained; if pain commencedduring any repetition of any set, the technique wasterminated. This technique involved the therapistapplying a sustained posterior accessory glide to theglenohumeral joint while the subject simultaneouslyactively flexed the shoulder to the pain-free endpointand applied a gentle overpressure force using thecontralateral arm. Total abolition of pain during thetechnique was mandatory; if the patient started toexperience pain during active motion, the therapistwould investigate different force planes and/or gradesof force until pain-free motion was restored.
Table 1. Baseline demographics and pre-treatmentmeans
DVs Mobilisation
with Movement
VAS 6/10
Flexion 900
Abduction 800
SPADI 48.6%
Age 39.8 years
VAS = visual analog scale;
SPADI = Shoulder Pain and Disability Index.
The study shows, significant decrease in pain (VAS):0.6 to 0.2 following 4 session treatment spread over 3weeks and increases in function (SPADI): 0.48 to 0.25.2and Abduction ROM: 96 to 166 within 8 sessiontreatment following 5 weeks, compared to traditionalintervention, which was done without manual therapytechnique.
Table 2. Changes after treatment
DVs Exercise MWM
VAS 3/10 2/10
Flexion 1500 1700
Abduction 1620 1670
SPADI 34.2% 15%
MWM = mobilization with-movement group;
VAS = visual analog scale;
SPADI = Shoulder Pain and Disability Index.
The MWM (mobilization with movement) had ahigher percentage of change from pre- to post-treatmenton pain measures pain (VAS 6/10 to 2/10) followingfour session treatment, and a higher percentage ofchange on the SPADI and in AROM.
DISCUSSION
The purpose of this case study was to describe theeffect of exercise therapy combined with manualtherapy in treatment of patients with shoulderimpingement. It appears that the combined interventionof manual therapy and exercises for five weeks providedsignificant reductions in pain measures in subjects tothose received only modality and exercise alone. It isimportant to note that the patients underwenttraditional physiotherapy for an extended period withminimal improvement. Where as in patients who hadundergone physical therapy intervention of manualtherapy and exercise their end of treatment assessmentscore reflected improvement in the symptoms such assignificant difference in the VAS, SPADI and AROM.Thus the combined treatment of manual therapy andexercises has proven to be effective in management ofshoulder impingement syndrome.
CONCLUSION
In summary, the physical therapy inter-ventions ofManual therapy base on MWM in combination withan exercise program resulted in decreasing pain andimproving function compared to traditional physicaltherapy intervention.
17. JAYAKUMARI--87-89.pmd 2/7/2013, 8:08 PM88
Indian Journal of Physiotherapy & Occupational Therapy. January-March 2013, Vol. 7, No. 1 89
REFRENCES
1. Millar AL, Jasheway PA, Eaton W, et al. Aretrospective, descriptive study of shoulderoutcomes in outpatient physical therapy. J OrthopSports Phys Ther 2006;36:403-14.
2. McClure PW, Michener LA, Karduna AR. Shoulderfunction and 3-dimensional scap-ular kinematicsin people with and without shoulderimpingement syndrome. Phys Ther 2006;86:1075-1090.
3. Belling SAK, Jorgensen U. Secondary impingementin the shoulder. Scand J Med Sci Sports 2000;10:266-278.
4. Williams JW, Holleman DR, Simel DL. Mea-suringshoulder function with the shoulder pain anddisability index. J Rheumatol 1995;22:727-32.
5. Ludewig PM, Borstad JD. Effects of a home exerciseprogram on shoulder pain and functional statusin construction workers. Occup Environ Med2003;60:841-849.
6. Mulligan BR. Manual Therapy Nags, Snags,Mwm, etc, 4th editon. Wellington, NZ: Plane ViewSeries Ltd, 1999.
17. JAYAKUMARI--87-89.pmd 2/7/2013, 8:08 PM89

90 Indian Journal of Physiotherapy & Occupational Therapy. January-March 2013, Vol. 7, No. 1
Musculoskeletal Pain among Computer Users
Shweta Keswani1, Lavina Loungni1, Tiana Alexander1, Hebah Hassan1, Shatha Al Sharbatti2,Rizwana B Shaikh3, Elsheba Mathew4
1MBBS students, College of Medicine, Gulf Medical University, Ajman, UAE2Professor and Head, 3Assistant Professor, 4Professor, Department of Community Medicine, College of Medicine,
Gulf Medical University, Ajman, UAE
ABSTRACT
Objective: The objective was to assess muscle pain as an effect of utilizing computers for more than fivehours and identify the variables associated with the occurrence of pain and the measures taken toprevent.
Methods: It is a descriptive study conducted on 249 subjects in different private organizations in UAE.All those who mentioned wrist, back or neck pain without any pre-existing musculoskeletal problemsamong those who work on computer for more than 5 hours were included in the study. Questionnaireswere distributed to all those who satisfied the inclusion criteria in each of the offices identified.
Results: A significant association was noticed between age and wrist pain and no significant associationwas observed between gender, onset of pain and wrist pain. Higher frequency of back pain was noticedin older age group compared to younger. Neck pain was found to be higher among participants between60-69 years of age. The incidence of pain in the wrist was more in men than in women and a similarpattern was seen in hand and back pain too. Our study shows a positive relation between sleep hoursand musculoskeletal pain.
Conclusion: We concluded that wrist, neck and back pain is more prevalent in younger age groups andit increases as the duration of computer use increases. Pain was a problem in majority of peopleworking on computer for more than 5 hours.
Keywords: Musculoskeletal pain, Computer users, Duration of computer use
Corresponding author:Shatha Al SharbattiProfessor and HeadDept. of Community MedicineGulf Medical UniversityAjman, United Arab EmiratesP O Box: 4184Email: [email protected]
INTRODUCTION
Musculoskeletal disorders affect all age groups andfrequently cause disability, impairments, andhandicaps. They consist of a variety of different diseasesthat cause pain or discomfort in the bones, joints,muscles, or surrounding structures, and can be acuteor chronic, focal, or diffuse. In one study among Detroitresidents who kept track of daily health symptoms in adiary, musculoskeletal symptoms constituted the mostfrequent category of health symptoms1.
Musculoskeletal disorders (MSDs) are highlyprevalent; because of their association with aging, theyare likely to become more prevalent as the populationages throughout the world. While many of thesedisorders are not devastatingly disabling to affectedindividuals, their prevalence is so great that moremobility and other limitations are accountable to thesedisorders than to any other type. While much of thesubstantial cost of these disorders is due to the medicalcare and medications and other treatments required bypatients, the preponderance of costs is due to work loss,which is a frequent consequence of these disorders. Notonly do MSDs cause personal suffering and loss ofincome, but they also cost businesses and affect nationaleconomies. Any worker can be affected, yet MSDs canbe prevented by assessing work tasks, putting in placepreventive measures, and checking that these measuresstay effective.
Most work-related MSDs are cumulative disorders,resulting from repeated exposure to high or low
18. JAYAKUMAR--90--95.pmd 2/7/2013, 8:08 PM90

Indian Journal of Physiotherapy & Occupational Therapy. January-March 2013, Vol. 7, No. 1 91
intensity loads over a long period of time. However,MSDs can also be acute traumas, such as fractures, thatoccur during an accident2.
These disorders mainly affect the back, neck,shoulders and upper limbs, but can also affect the lowerlimbs. Some MSDs, such as carpal tunnel syndrome inthe wrist, are specific because of their well-defined signsand symptoms. Others are nonspecific because onlypain or discomfort exists without evidence of a clearspecific disorder3. Different groups of factors maycontribute to MSDs, including physical andbiomechanical factors, organizational and psychosocialfactors, individual and personal factors .These may actuniquely or in combination.
An integrated management approach is necessaryto tackle MSDs. This approach should consider not justthe prevention of new disorders, but also the retention,rehabilitation and reintegration of workers who alreadysuffer from MSDs4. Individuals with musculoskeletalcomplaints should be evaluated with a thorough history,a comprehensive physical examination, and, ifappropriate, laboratory testing. The initial encountershould determine whether the musculoskeletalcomplaint is (1) articular or nonarticular in origin, (2)inflammatory or noninflammatory in nature, (3) acuteor chronic in duration, and (4) localized or widespread(systemic) in distribution5. The present study wasconducted to assess the musculoskeletal problemsamong computer users and rationalize the variablesthat play a part in the occurrence of the pain and, to
assess the knowledge of face such problems and, toevaluate the measures taken to tackle and preventmusculoskeletal problems.
MATERIALS AND METHOD
This descriptive study was conducted in thefollowing settings viz. Ajman chamber of commercebuilding, Alco Shipping Services (Ajman), TNT branch(Deira), Ocean View Real Estate (Dubai), OmanInsurance (Ajman branch), AMB constructions, GulfChain, GMU and GMCHRC. Total 249 employees inthe above settings participated in the study and thedata was collected from 2009 March to 2010 January.We selected all those people who mentioned wrist, backor neck pain without any pre-existing musculoskeletalproblems and those who work on computer for 5 hoursor more. All those who had previous musculoskeletalproblems, and who work less than 5 hours on thecomputer were excluded. A questionnaire was used fordata collection including variables like Age, Sex,Nationality, Smoking status, Alcohol status, Diabetes,People with Wrist, Back and Neck pain.
The questionnaires were distributed to differentoffices, selecting one office at a time to those who usedthe computer for 5 hours or more and the completedquestionnaires were collected within two – three days.The whole process was repeated in all the abovementioned offices. The data from the questionnaire wasthen entered in an excel sheet and analyzed using PASW18.0 version.
RESULTS
Table- 1. Distribution of wrist pain according to gender, age and duration of computer use
Variables Group Wrist pain
Yes No
Number Percent Number Percent
Gender Male 82 61.2 73 63.5
Female 52 38.8 42 36.5
Age group 20-29 61 45.5 46 40.0
30-39 47 35.1 34 29.6
40-49 16 11.9 15 13.0
50-59 10 7.5 13 11.3
60-69 —- —- 07 6.0
Duration of computer use < 5 hrs 14 43.8 18 56.3
5-7 hrs 26 40.0 39 60.0
7-9 hrs 55 59.8 37 40.2
> 9 hrs 39 65.0 21 35.0
18. JAYAKUMAR--90--95.pmd 2/7/2013, 8:08 PM91

92 Indian Journal of Physiotherapy & Occupational Therapy. January-March 2013, Vol. 7, No. 1
Table 1 shows distribution of the study subjects bywrist pain and gender. Higher
frequency of wrist pain was noticed among femaleswhen compared with males. No
significant association was noticed between wristpain and gender (P>0.05). Distribution of the studiedsample by wrist pain and age shows a higher frequencyof wrist pain was noticed in younger age groups
compared with older ones. Statistically significantassociation was found between age and wrist pain(P<0.05). Distribution of the studied sample by wristpain and duration of computer use for the onset of painshows higher frequency of wrist pain was noticedamong worker after working for more than 5 hours. Nosignificant association was noticed between wrist painand duration for the onset of pain. (p>0.05)
Table 2. Distribution of Back pain according to gender, age, and duration of computer use
Variables Group Back pain
Yes No
Number Percent Number Percent
Gender Male 113 61.1 42 65.6
Female 72 38.9 22 34.4
Age group 20-29 81 43.8 26 40.6
30-39 54 29.2 27 42.2
40-49 25 13.5 06 9.4
50-59 20 10.8 03 4.7
60-69 05 2.7 02 3.1
Duration of computer use < 5 hrs 17 53.1 15 46.9
5-7 hrs 50 76.9 15 23.1
7-9 hrs 66 71.7 26 28.3
> 9 hrs 52 86.7 08 13.3
Higher frequency of back pain was noticed amongfemales compared with males. No
significant association was noticed between wristpain and gender (P>0.05). Higher frequency of backpain was noticed in 50-60 years of age group. No
significant association was found between age andback pain (P>0.05). Higher frequency of back pain wasnoticed among worker after working for more than5hours. Significant association was noticed betweenwrist pain and duration for the onset of pain. (p<0.05)(Table 2).
Table- 3. Distribution of neck pain according to gender, age and duration of computer use
Variables Group Neck pain
Yes No
Number Percent Number Percent
Gender Male 114 61.6 41 64.1
Female 71 38.4 23 35.9
Age group 20-29 80 43.2 27 42.2
30-39 62 33.5 19 29.7
40-49 20 10.8 11 17.2
50-59 16 8.6 7 10.9
60-69 7 3.8 —- —
Duration of computer use < 5 hrs 19 59.4 13 40.6
5-7 hrs 45 69.2 20 30.8
7-9 hrs 69 75.0 23 25.0
> 9 hrs 52 86.7 08 13.3
18. JAYAKUMAR--90--95.pmd 2/7/2013, 8:08 PM92

Indian Journal of Physiotherapy & Occupational Therapy. January-March 2013, Vol. 7, No. 1 93
Table 3 - Shows distribution of neck pain by gender.Higher frequency of neck pain was noticed among thestudied females compared with males. No significantassociation was noticed between wrist pain and gender.(P>0.05)
Higher frequency of neck pain was noticed in 60-69years age group. Statistically no significant associationwas found between age and neck pain. Higherfrequency of neck pain was noticed in 60-69 years agegroup. No significant association was found betweenage and neck pain.
Higher frequency of neck pain was noticed amongworker after working for more than 5 hours. Significantassociation was noticed between neck pain andduration for computer use. (p<0.05). Lowest frequencyof headache was noticed in more than 60 years agegroup. Significant association was found between ageand headache. Higher frequency of headache wasnoticed among the studied females compared withmales.
Significant association was noticed betweenheadache and gender. (P<0.05). Highest frequency ofheadache was seen in the age group 30-39 years.Significant association was noticed between headacheper week and age group. (P<0.05). The higher frequencyof headache was noticed to be twice per week for malesand four times per week for females. Significantassociation was found frequency of headache andgender. Higher frequency of headache was observedamong participant who had neck pain. No significantassociation was found between headache and neckpain (P>0.05). Lower frequency of wrist pain wasnoticed when ergonomic facilitates were available atwork place however no significant association wasfound between availability of ergonomic facilities atwork place and wrist pain (P>0.05). No significantassociation was found between availability ofergonomic facilities at work place and back pain(P>0.05). Lower frequency of neck pain was noticedwhen these facilitates were available at work place.Significant association was found between availabilityof ergonomic facilities at work place and neck pain(P>0.05). No Significant association was found betweenavailability of break in between work and wrist pain(P>0.05). Lower frequency of back pain was noticedwhen these breaks were available between work.Significant association was found between availabilityof break in between work and back pain. (P<0.05). No
Significant association was found between availabilityof break in between work and neck pain (P>0.05).Significant association was found between neck painand sleep hours. (P>0.05). Higher frequency of peoplewith wrist pain had complained of work affecting sleep.Significant association was found between wrist painand work affecting sleep (P<0.05). Higher frequency ofpeople with back pain had complained of workaffecting sleep. Significant association was foundbetween back pain and work affecting sleep (P<0.05).No Significant association was found between neckpain and work affecting sleep (P>0.05). No Significantassociation was found between change in postureduring work and wrist pain (P>0.05). Lower frequencyof back pain was noticed when change in postureapplied during work No Significant association wasfound between change in posture during work and backpain (P>0.05). No significant association was seenbetween weight gain and breaks between work hours(P>0.05). Higher frequency of diabetics had back pain,but there is no significant association between the two(P>0.05).
Higher frequency of diabetics had neck pain, butthere is no significant association between the two(P>0.05). Highest frequency of moderate wrist pain wasobserved with alcohol consumption. There is nosignificant association between alcohol consumptionand severity of pain. Highest frequency of moderateback pain was observed with alcohol consumption.There is no significant association between alcoholconsumption and severity of pain. Highest frequencyof moderate neck pain was observed with alcoholconsumption. There is no significant associationbetween alcohol consumption and severity of pain.Lower frequency of wrist pain was noticed whenchange in posture applied during work.
Significant association was found between changein posture during work and back pain.
(P<0.05). Significant association was found betweenchange in posture during work, neck pain and jobsatisfaction (P>0.05). Lower frequency of neck painwas noticed among job satisfied participants. Nosignificant association was found between neck painand job satisfaction (P>0.05). Higher job satisfactionwas noticed when facilities are available. Significantassociation was found between facilities and jobsatisfaction (P<0.05).
18. JAYAKUMAR--90--95.pmd 2/7/2013, 8:08 PM93

94 Indian Journal of Physiotherapy & Occupational Therapy. January-March 2013, Vol. 7, No. 1
Figure 1: Showing distribution of study sampleaccording to nationality
This chart shows the distributions of our studysample to gender. Female population was seen to behigher than the male population. (Fig-3)
Figure 4: Showing distribution of study sampleaccording to duration on computer
This chart shows the distribution of our sampleaccording to nationality. The highest frequencies werefound to be Indians and the lowest were Iranians.(Fig-1)
Figure 2: Showing distribution of study sampleaccording to age group
This chart shows the distribution of our studysample according to age. The highest frequencies wereseen in the age groups 20-29 and 30-39 whereas thelowest frequencies were in the higher age groups.(Fig-2)
Figure 3: Showing distribution of study sampleaccording to gender
This chart shows the distribution of our studysample according to the duration on computer. A greaterfrequency was found among the sample working formore than 5 hours on the computer. (Fig-4)
Figure 5: Showing distribution of musculoskeletalpain among the study sample
Chart showing the distribution of musculoskeletalpain among the studied sample. It was seen that backand neck pain has a greater frequency while wrist painwas lower. (Fig-5)
Figure 6. Distribution of the study sample withfrequency of exercise and musculoskeletal disorders
18. JAYAKUMAR--90--95.pmd 2/7/2013, 8:08 PM94

Indian Journal of Physiotherapy & Occupational Therapy. January-March 2013, Vol. 7, No. 1 95
41% of population who exercised twice a monthsuffered from wrist pain whereas approximately 37%of the population who exercised 4 times a monthsuffered from back and neck pain.(Fig-6)
DISCUSSION
As the continuing use of machines and computersincreases in today’s world there is a need for the generalmasses to be educated about the increasing incidenceof musculoskeletal disorders. Many people have thetendency to overlook all these hazards as trivial and donot get it checked and hence end up with a series ofmechanically restricting injuries.
MSD ranks first in prevalence as the cause ofchronic health problems, long term disabilities andconsultations with a healthy professional and rankedsecond for restricted activity all day and use ofprescription medications and drugs. Hence society hascome up with the intervention of ergonomics amongthe working masses.
There were many factors that we had to take intoconsideration for the completion of our study. Thesewere Age, Nationality, Sex, Duration of work, Sleephours, Pain intensity, Exercise, Diet, Smoking / Alcoholetc. Average duration of computer use in our study was5 hours. This was in accordance with Bureau of LabourStatistics which said that average time of employeesworking on computer is 35 hours per week6.
Through our study showed that there was a higherincidence of pain among the males and femalesalthough affected were not so severe. The incidence ofpain in wrist to be more in men (61%) than in women(39%) and a similar pattern was shown in the handand back pain too. This was not in confirmation withthe other studies that we had gone through on MSDs. Astudy done in Europe found a higher prevalence ofdisorders in women (45%) than men (39%). Thisdifference could have occurred in the study as they useda larger population for their study whereas our samplesize was comparatively smaller. Our study shows apositive relation between sleep hours andmusculoskeletal pain similar results was seen in a studyby the psychosomatic research7.
CONCLUSION
From our study we concluded that wrist, neck andback pain is more prevalent in younger age groups andit increased as the duration of computer use increased.The variables, age, duration of computer use, facilitiesat work place, sleep hours, diabetes and job satisfactiondid play a part in occurrence of pain. The result showedthat the commonest complaints were back pain andneck pain. Wrist pain was the least complained whenoperating on a computer system. Pain was more severein people working for more than 5 hours. The result ofthis study can help in preventing occupational injuryassociated with the use of computer with emphasis ongood posture, work station ergonomics.
REFERENCES
1. OSHA [Online]. European Agency for Safety andHealth at Work, 2010 [cited 2010 September 20].Available from URL: http://osha.europa.eu.
2. Gerr F, Marcus M, Ensor CBS, et al. A prospectivestudy of computer users: Study design andincidence of musculoskeletal symptoms anddisorders. Am J Ind Med 2002;41:221-35.
3. Pillinger J, Rutherford. Computer and neck pain.Health News 2003;39:12-4.
4. European Agency for Safety and Health at Work[Onine]. Research on work-related low backdisorders, 2000 [cited 2010 September 20].Available from URL: http://osha.europa.eu/en/publications/reports/204.
5. Uhlenberg P. International handbook ofpopulation aging, 1st edition. New York, Springer,2009;772.
6. US Deprtment og Labour [Onine]. Bureau of labourstatistics, 2007 [cited 2010 September 20].Available from URL: www.bls.gov/news.releaseiatus.nrO.htm.
7. Akerstedta T, Knutssonb A, Westerholmc P, et al.Sleep disturbances, work stress and work hours:A cross-sectional study. J Psychosom Res2002;53(3):741-8.
18. JAYAKUMAR--90--95.pmd 2/7/2013, 8:08 PM95

96 Indian Journal of Physiotherapy & Occupational Therapy. January-March 2013, Vol. 7, No. 1
A Report of Body weight Supported Overground Trainingin Acute Traumatic Central Cord Syndrome
Asir John Samuel1, John Solomon2, Senthilkumaran3, Nicole D'souza4
1Lecturer, Alva's College of Physiotherapy, Moodabidri, India, 2Associate Professor, Department of Physiotherapy,Manipal College of Allied Health Sciences, Manipal University, Manipal, India, 3Associate Professor, Department of
Physiotherapy, Manipal College of Allied Health Sciences, Manipal University, Manipal, India, 4Neurophysiotherapist,Parkinson's Disease & Movement Disorder Society, Mumbai, India
ABSTRACT
Study design: A case report of a patient with Traumatic Central Cord Syndrome (TCCS)
Objective: To analyse the benefits of BWSOT in early ambulation and gait performance.
Setting: Tertiary care, University teaching hospital.
Methods: A 25-year old man with TCCS at the C4 level, grade B on the American Spinal InjuryAssociation (ASIA) Impairment Scale (AIS) participated in BWSOT. Following the immobilizationphase, he underwent two BWSOT sessions per day (20 minutes each), six days a week, for three weeks.AIS motor score, 10-m walk test, Walking Index for Spinal cord Injury-version II (WISCI-II), Spinal cordIndependence Measure-version III (SCIM-III) and Functional Independence Measure (FIM) were recordedat the time of initiating of BWSOT and at the end of three weeks. He received regular physiotherapy andoccupational therapy during the entire hospital stay.
Results: Three weeks of BWSOT resulted in an increase in all the outcome measures. At the time ofinitiating BWSOT, AIS motor score, 10-m walk test, WISCI-II, SCIM-III and FIM were 45/100, 3 min 14sec, 3/20, 30/100 and 60/126 and by the end of three weeks, they were 68/100, 1 min 41 sec, 17/20,50/100 and 72/126 respectively.
Conclusion: BWSOT may allow therapists to initiate gait training programs at an earlier stage amongthose with stable TCCS with promising outcomes.
Keywords: Spinal Cord Injury, Central Cord Syndrome, Overground Training, Gait Training, Rehabilitation,Locomotor Training.
Corresponding author:D. A. Asir John SamuelLecturer,Alva's college of Physiotherapy, Moodabidri - 574 227,South Canara District, Karnataka, India.Contact No. +91 9481939806Email: [email protected]
INTRODUCTION
Traumatic Central Cord Syndrome (TCCS) is themost common incomplete Spinal Cord Injury (SCI) withthe incidence varying from 15.7% to 25%.1 As the lowerlimbs (LL) are less affected, early gait training can beinitiated. However, poor trunk control is a major obstaclein achieving this goal. This can be overcome bystabilizing the trunk using a body weight supportedapproach.
To date, only a limited number of studies havecompared the benefits of task specific activities like body
weight supported treadmill walking and BWSOT inincomplete SCI. However, the use of BWSOT has notbeen documented in incomplete TCCS.
CASE REPORT
A 25-year-old male presented with severe neck painand quadriplegia after sustaining a fall from a heightof 15m. He was managed conservatively and referredto the Neuro Rehabilitation Unit within 24 hours ofinjury. The patient was examined at the time of referralby a qualified physiotherapist. His vitals were stable.Neurological examination revealed normal higherfunctions and cranial nerves. His tone was flaccid inthe upper limbs (UL) and increased in the LL at thistime. Sensory and muscle power evaluation revealed asensory and motor level of C4 with sacral sparing.American Spinal Injury Association Impairment Scale(AIS), motor score was 10/100 comprising 0/50 for ULand 10/50 for LL. Using AIS he was graded as AIS B.Deep tendon reflexes were absent in the UL and brisk
19. Asir John--96--98.pmd 2/7/2013, 8:08 PM96

Indian Journal of Physiotherapy & Occupational Therapy. January-March 2013, Vol. 7, No. 1 97
in the LL. He had a flaccid bladder for which he wascatheterized.
His cervical spine x-ray showed no bonyabnormalities. Magnetic Resonance Imaging showedan area of increased signal intensity on the T2-weightedimages of the sagittal sections of the cervical cord.
He was immobilized with a Philadelphia collar fortwo weeks during which time he received conventionalphysiotherapy. By the end of 4th week ASI motor scoreimproved to 45/100 with normal sensation below thelevel of lesion bringing him to AIS grade C. As trunkhas not improved compared to lower limbs, we lookedfor the method to make him walk which providesupports to trunk. Hence we devised Body weightsupported overground training (BWSOT) system.
Fig 1 shows the BWSOT which consists of overheadsuspension system and harness to support a percentageof the patient’s body weight as the patient walks on aparallel bar and progressively decreasing the amountof body weight supported as the gait pattern improves.The body weight unloading is high in the beginning oftraining and decreased gradually. The harness wasattached to an overhead suspension, usually a systemcomposed of ropes and pulleys (rope-and-pulleysystem) connected to a counterweight. A counterweightwas used to dynamically unload part of the patient’sbody weight.
sessions per day (20 minutes each), six days a week, forthree weeks. Baseline and at the end of 3 weeks trainingof AIS motor score, 10-m walk test, WISCI-II, SCIM andFIM were recorded and showed improved in all theoutcome measures. By 8th week he was able to walkwith minimal pelvic support, Fig 2. At the time ofdischarge he was graded on AIS as AIS D with normalbladder function.
Fig. 2. Ambulation at the time of discharge.
Fig. 1. Gait training using BWSOT with pelvic support (a)anterior view and (b) posterior view.
Informed consent was obtained from the patientprior to initiating therapy. He performed two BWSOT
DISCUSSION
This case study highlights three important findings.First, BWSOT found to accelerate the improvementsresulted in improved muscle power, gait speed, andfunctional independence. Second, this set up uses a
19. Asir John--96--98.pmd 2/7/2013, 8:08 PM97

98 Indian Journal of Physiotherapy & Occupational Therapy. January-March 2013, Vol. 7, No. 1
simple and inexpensive device which can be used insmall set up. Third, it reduces the risk of secondarycomplications. Improvements seen in muscle power,gait and function could be due to the normal neurologicalrecovery process due to the decrease in cord edema.2
However; the addition of BWSOT initiated within threeweeks of injury could have augmented the observedchanges.
In developing countries, the uses of cost effectivemethods, which produce significant results with regardto patient outcomes are important. This simple andinexpensive device appears to play a vital role inimproving the quality of rehabilitation and also infacilitating early mobilization which would in turnprobably be cost-effective.
Cervical cord injuries have a higher risk ofsecondary complications.3 Early mobilization and gaittraining using the BWSOT may have a role in preventingthese complications. However, larger studies with longterm follow up will be required to test this hypothesis.
CONCLUSION
This case highlights the importance of BWSOT inearly rehabilitation of patients with stable TCCS in
initiation of gait training programs, as early as threeweeks post injury.
ACKNOWLEDGEMENT
The authors express special thanks AbrahamSamuel Babu, MPT, FCR, (PhD) for content review.
Conflict of Interest
The authors declare no conflict of interest and haveno disclosures.
REFERENCES
1. McKinley W, Santos K, Meade M, Brooke K:Incidence and outcomes of spinal cord injuryclinical syndromes. J Spinal Cord Med 2007, 30:215-224.
2. Uribe J, Green B, Vanni S, Moza K, Guest J, Levi A.Acute traumatic central cord syndrome-experience using surgical decompression withopen-door expansile cervical laminoplasty. SurgNeurol. 2005; 63:505–510.
3. Sekhon HS, Fehlings M G. Epidemiology,Demographics, and Pathophysiology of AcuteSpinal Cord Injury. Spine 2001; 26: S2-S12.
Table 1: Outcome of the patient following BWSOT
Weeks ASIA MS 10-m WT WISCI-II SCIM-III FIM
1 10/100 NA 0/20 10/100 50/126
4 45/100 3 min 14 sec 3/20 30/100 60/126
7 68/100 1 min 41 sec 17/20 50/100 72/126
Abbreviations: ASIA MS, America Spinal cord Injury Association Motor Score; WT, Walk Test; WISCI-II, Walking Index for Spinalcord Injury-version II; SCIM-III, Spinal cord Independence Measure-version III; FIM, Functional Independence Measure.
19. Asir John--96--98.pmd 2/7/2013, 8:08 PM98

Indian Journal of Physiotherapy & Occupational Therapy. January-March 2013, Vol. 7, No. 1 99
Effects of Ischemic Compression on the Trigger Points inthe Upper Trapezius Muscle
Bhavesh H. Jagad, Karishma B. JagadLecturer, Shri K. K. Sheth Physiotherapy College, Rajkot, Gujarat, India
ABSTRACT
Background and Purpose of The Study: A myofascial trigger point has been described as a hyperirritablespot, usually within a taut band of skeletal muscles or in the muscles fascia. The myofascial triggerpoint in the upper trapezius is most commonly found at the midpoint of the upper boarder of themuscle.
The objective of the study is to determine the effectiveness of ischemic compression for the treatment ofmyofascial trigger points in upper trapezius.
Method: 30 subjects were randomly assigned to either treatment group (group 1) or a control group(group 2). Subjects in group 1 received ischemic compression on the primary trigger point followed bystretching of the upper trapezius muscle. Subjects in group 2 received active neck exercise followed bystretching. All the patients of group 1 and 2 received treatment for 7 days. Pressure Pain Threshold(PPT) measured by pressure algometer was used to measure trigger point sensitivity and VisualAnalogue Scale(VAS) was scored as a measure of pain intensity on day 1 and day 8 in both the groups.
Results: In the treatment group (group 1) significant improvement was evident in the pressure painthreshold values (t=7.02, p<0.05), however no such improvement was found in the control group(group 2). Comparison between the two groups also showed significant difference in the pressure painthreshold measurement.
Significant improvement was noted in the visual analogue scale score of group 1 (T=120, p<0.001) andgroup 2 (T= 66, p<0.001) both; however greater improvement was noted in treatment group (group 1).
Conclusion: Ischemic compression technique is highly effective in reducing the trigger point sensitivityand pain intensity in the trapezius muscle.
Keywords: Ischemic Compression, Upper Trapezius, Trigger Point.
INTRODUCTION
Neck pain is very commonly shown by most peopleto be in the region of the back of the neck and betweenthe bases of the neck to the shoulder, primarilyindicating the region of the trapezius muscle1. Abouttwo thirds of people will experience neck pain at sometime.2,3 Prevalence is highest in middle age with womenbeing affected more the men. The prevalence of neckpain varies widely between studies, with mean pointprevalence of 13% (range 5.9 – 38.7%) and mean lifetimeprevalence of 50% (range 14.2 – 71.0%). In someindustries neck related disorders account for as manydays of absenteeism as low back pain4,5.
The myofascial trigger point in the trapezius is mostcommonly found at the midpoint of the upper border ofthe muscle. It has been described as a hyperirritable
spot, usually within a taut band of skeletal muscles orin the muscles fascia. The spot is painful oncompression and can give rise to characteristics referredpain, tenderness and autonomic phenomena.6 There ispain with passive or active stretching of the musclesand limited range of motion.6,7
Several trigger point treatment methods have beenstudied for effectiveness. These methods includeinjection or dry needling8,9, spray and stretch10,transcutaneous electrical nerve stimulation(TENS)31,41,42, and post isometric relaxation43. Injectionand spray and stretch are reported as the most commonforms of therapy for trigger points.6,11,12,13,14
Ischemic compression has been studied by severalauthors to treat myofascial pain, fibromyalgia andparaesthesias. It is a non invasive technique and does
20. Karishma--99-104.pmd 2/7/2013, 8:08 PM99

100 Indian Journal of Physiotherapy & Occupational Therapy. January-March 2013, Vol. 7, No. 1
not produce muscle soreness. However due todifference in study population and outcome measuresused to assess the effectiveness, there is lack of rigorousevidence for use of ischemic compression in clinicalpractice. The objective of the study is to determine theeffectiveness of ischemic compression for the treatmentof myofascial trigger points in upper trapezius.
MATERIALS & METHOD
Subjects
The study was conducted in Shri K. K. ShethPhysiotherapy College, Rajkot, India. 30 volunteersubjects who participated in the study were selectedfrom the patients attending OPD department of thecollege.
EXCLUSION CRITERIA
-History of orthopedic surgery to neck or back
-Cardiovascular or neurological conditions
-Clotting disorders and
-Treatment of myofascial pain or trigger points at thetime of the study.
INCLUSION CRITERIA
-A palpable tender spot in the neck or upper back
-Reproduction of the subject’s pain upon palpation
-A jump sign characterized by patient vocalization orwithdrawl5, 7
INSTRUMENTATION
The pressure algometer was used in the study tomeasure pressure pain threshold as an index of triggerpoint sensitivity. It is a reliable technique, demonstratinghigh interrater and intrarater reliability.15,16,17
Figure-1
Form, and Assessment Form.
METHOD
An experimental study was conducted to study theeffectiveness of ischemic compression on the triggerpoints in trapezius muscle. Each subject was randomlyassigned to treatment group (group 1) and control group(group 2).
The subject was required to complete the informedconsent form. Then the subject was asked to mark avisual analogue scale with the average pain intensityfor their pain over past 24 hours. The subjects werethen acquainted with the sensation of pressurealgometer on an unaffected part of the body beforetesting for pressure pain threshold of primary triggerpoint. The pressure algometer was placedperpendicular to the area to be tested, increasing thepressure steadily at the rate of approximately 1 Kg/sec.Examiner palpated the region of trapezius and markedall the trigger points that matched the inclusioncriteria with a non permanent marker. Pressure painthreshold was measured for each marked trigger point.The trigger point with the lowest pressure painthreshold was considered as primary trigger point andwas marked with Reynolds permanent marker.
Figure-2 Placement of Algometer for Measurementof PPT
A Visual Analogue Scale was used to measureintensity of the subject’s pain.
Other materials used include Reynolds Marker,Kodak C875 Zoom Digital Camera, Paper, Pen, Consent
Group 1 - With the patient in comfortable sittingposition on an armless chair and both feet firmlyplanted on the floor, gradual pressure was applied tothe primary trigger point using the right thumb withthe left thumb reinforcing it from the top. The patientwas asked to side bend the neck to the opposite side inorder to place mild stretch on the primary trigger point.Pressure was gradually increased to produce localizeddiscoloration as well as symptoms in the target area.The same pressure was held till the patient reported
20. Karishma--99-104.pmd 2/7/2013, 8:08 PM100

Indian Journal of Physiotherapy & Occupational Therapy. January-March 2013, Vol. 7, No. 1 101
easing of local and referred pain followed by a releaseof 10 seconds. The same sequence of ischemiccompression was repeated three times per session withthe pressure of ischemic compression increasing as thepatient’s tolerance increased.7,18 Ischemic compressionwas followed by sustained stretch to the uppertrapezius. The stretch was maintained for 30 secondsfollowed by rest of 10 seconds. The procedure wasrepeated 5 times per session.
Group 2 - The patients were asked to perform activeneck flexion, neck lateral flexion, neck extension andneck rotation while seated near the edge on an armlesschair with both the feet firmly planted on the floor. Thepatients performed these exercises 10 times each.Sustained stretch to the upper trapezius was given inthe same manner as described above.
All the patients of group 1 and 2 received treatmentfor 7 days. No treatment was given on the 8th day todetermine the short term effects of the interventionwithout confounding effects from the treatment justcompleted. On day 8, the therapist again obtainedmeasurements for each subject A Pressure PainThreshold measurement of primary trigger point and avisual analogue scale score for the average painintensity for the past 24 hours were recorded.
RESULTS
Wilcoxon signed rank test, wilcoxon sum rank testand student’s T test were used to analyze the data. Thepaired and unpaired t-tests were performed using SPSSstatistics 17.0
Table 1. Gender distribution of 30 subjects whoparticipated in the study.
Gender Group 1 Group 2
Male count% 533% 533%
Female count% 1067% 1067%
Total 15 15
Table 2. Mean age of subjects in group l and group 2
Group 1 Group 2
Mean age(Years) 28.73 29.53
There was no significant age difference seen acrosstwo groups
Pretreatment and post treatment means and SD ofPPT value and VAS score of each group are shown inchart 2 and chart 3 respectively. The scores reflect greaterimprovement for group 1 than for group 2 on all thevariables.
Chart-1 Raw score Means for Pre-treatment andPost-treatment PPT of group 1 and group 2
Chart-2 Raw score Means for Pre-treatment andPost-treatment VAS of group 1 and group 2
Table 3. Calculated and Observed ‘t’ values for difference of PPT withinand between group 1 and group 2
CALCULATED OBSERVED
Group 1 (t14) 6.910 2.15 P<0.001 Highly significant
Group 2 (t14) 1.871 2.15 P>0.05 Not significant
Between Groups 1&2 (t28-) 6.40 2.05 P<0.001 Highly significant
Table 4. T value calculated by Wilcoxon Signed Rank Test for group 1 and group 2
VAS T value Probability (P)
Group 1 120 <0.01
Group 2 66 <0.01
20. Karishma--99-104.pmd 2/7/2013, 8:08 PM101

102 Indian Journal of Physiotherapy & Occupational Therapy. January-March 2013, Vol. 7, No. 1
Table-5 ‘z’ value calculated by Wilcoxon Rank SumTest for between group comparison
Score ‘z’ value Probability (P)
VAS 3.44 <0.0003
DISCUSSION
Point prevalence of neck pain is nearly 13%19,20 andlifetime prevalence is 50%.21 In females, the fiber-typedistribution pattern of trapezius is similar to male butthe mean cross-sectional area of the fibers isconsiderably smaller. The significantly smaller cross-sectional fiber area, which indicates a lower functionalcapacity, may be of importance in the development ofneck and shoulder dysfunction in females.22
Researchers also found that shoulder abduction torqueand trapezius EMG amplitude were significantlylower in the women with myalgia compared withthose without the muscle pain.23 Higher incidence ofneck pain in female population can be accounted forthe higher number of female subjects in the presentstudy.
Garvey et al found injection of a local anesthetic,injection of a local anesthetic plus steroid,acupuncture (dry needling), and acupressure withvapocoolant spray to be effective in relieving pain.8
This conclusion is also supported by authors likeRubin D (1981)12 Imich D et al (2002)24 and Hong C(1994)9. Garvey et al reported that the acupressure plusvapocoolant spray was the most effective at relievingpain. This led them to propose that relief is likely due tomechanical stimulation of the trigger point by the needleor the acupressure, not the injection of a particularsubstance. Hong C also suggested that, localvasodilatation and removal of metabolites along withmechanical disruption of abnormal functioning ofcontractile elements or nerve endings is responsiblefor trigger point inactivation by injection method.However the treatment involves invasive procedureand to the varying degree produces post injectionsoreness and muscle necrosis.
When ischemic compression is used on the triggerpoints, local chemistry changes due to blanching of thenodules followed by hyperemia when the compressionis released. This flushes out the muscle inflammatoryexudates and pain metabolites, breaks down thescar tissue, desensitizes the nerve endings and reducesthe muscle tone. Thus the ischemic compression hasessentially the same mechanism of action on thetrigger point as the injection therapy. Howeverischemic compression is a non invasive technique that
does not produce post treatment soreness orhemorrhage.
Stretching of the affected muscle is believed bysome -authors to be an integral part of trigger pointtherapy.6,10,13,14,25 Techniques like post isometricrelaxation, strain/ counter strain, reciprocal inhibition,passive stretching of the affected muscle and ‘spray-stretch have been found to be effective in reducing thepain intensity and trigger point sensitivity.7,18,26 Simons(1981) hypothesized that stretching a muscle releasesthe locked actin and myosin heads, allowing the ATPto form. The ATP allows the sarcoplasmic reticulum toreturn to normal and circulation to improve.27 Howeverthe stretch works better when there are nerve impulsesfrom the skin being sent to the brain and inhibitingthe reflex pathway that produces trigger point activityand pain messages. These conflicting skin impulsesare most viewed as a sustained stretch to a specificpoint in the muscle and it gets right to the tight orrestricted area in a muscle. The conclusion would seemto be that stretching alone is not enough but that as anadjunct to ischemic compression it is helpful.
The present study demonstrates significantimprovement in pain intensity and pain threshold ingroup 1 treated with ischemic compression andtrapezius stretching compared to group 2 treated withactive neck exercises and trapezius stretching. Researchin 1993 by Hong et al lends credibility to the statementthat ischemic compression is superior to other physicalmedicine modalities for treating trigger points. Similarresult has been obtained by Jamie Dearing (2007)28
CONCLUSION
The results of this study indicate that ischemiccompression is highly effective in the short termmanagement of trigger point in the upper trapezius byreducing the trigger point sensitivity and average painintensity.
Limitations And Future Suggestions
The study did not examine effectiveness relative toany other outcome such as functional limitation ordisability.
The long term effects of the ischemic compressionon the trigger point sensitivity needs to be investigatedfurther.
The study includes a small sample size
The duration of pain relief associated with the
20. Karishma--99-104.pmd 2/7/2013, 8:08 PM102

Indian Journal of Physiotherapy & Occupational Therapy. January-March 2013, Vol. 7, No. 1 103
control of contributing factors to the development oftrigger point needs to be investigated.
REFERENCES
1. Jennifer Chu, Neck Pain- Trapezius, http://ezinearticles.com/?expert=Jennifer Chu
2. Makela M et al, Prevalence, Determinants, AndConsequences Of Chronic Neck Pain In Finland,Am J Epidemiol 1991; 134: 1356-1367.
3. Cote P et al, The Saskatchewan Health and BackPain Survey: The Prevalence of Neck Pain andRelated Disability in Saskatchewan Adults, Spine1998; 23:1689-1698.
4. Fejer R et al, The Prevalence Of Neck Pain InThe World Population: A Systematic CriticalReview Of The Literature, Eur Spine J 2006;15: 834-848.
5. Peter D Aker, Anita R Gross et al, ConservativeManagement of Mechanical Neck Pain: SystematicOverview and Meta-Analysis, BMJ 1996; 313:1291-1296.
6. Travell JG et al, Myofascial Pain and Dysfunction:The Trigger Point Manual, The Upper Extremities,Baltimore, Md: Williams & Wilkins, 1983: 5-90.
7. Siobahn Maguire, Myofacial Therapy AndPodiatry: A Literature Review http://p o d i a t r y . c u i t i n . e d u . a u /encyclopedialmyofascial/#intro
8. Garvey TA et al, A Prospective, Randomized,Double-Blind Evaluation Of Trigger-PointInjection Therapy For Low-Back Pain, Spine, 1989,14: 962-964.
9. Hong C, Lidocaine Injection Versus DryNeedling To Myofascial Trigger Point: TheImvortance Of The Local Twitch Response, Am JPhys Med Rehabi1, 1994,·74: 262-263.
10. Jaeger B et al, Quantification Of Changes InMyofascial Trigger Point Sensitivity With ThePressure Algometer Following Passive Stretch,Pain, 1986, 27:203-210.
11. Grosshandler SL et al, Chronic Neck and ShoulderPain: Focusing On Myofascial Origins, PostgradMed, 1985,77: 149-158.
12. Rubin D, Myofacial Trigger Point Syndromes: AnApproach To Management: Arch Phys MedRehabil, 1981 Mar; 62(3): 107-110.
13. Fricton JR, Management of myofascial painsyndrome. In: Fricton JR, Awad EA, eds.,Advances in Pain Research and Therapy, NY:Raven Press; 1990, 17: 325-346.
14. McClaflin RR, Myofascial Pain Syndrome:Primary Care Strategies for Early Intervention,Postgrad Med, 1994, 96: 56-73.
15. Reeves JI et al, Reliability Of The PressureAlgometer As A Measure Of Myofascial TriggerPoint Sensitivity, Pain, 1986, 24: 313- 321.
16. Fischer AA, Documentation of Myofascial TriggerPoints, Arch Phys Med Rehabil, 1988, 69: 286-291.
17. Stuart Cathcart et al, Reliability Of Pain ThresholdMeasurement In Young Adults: The InternetJournal Of Pain, Symptom Control And PalliativeCare, 2005, 4.
18. Leon Chaitow, Integrated treatment of myofascialtrigger points, http://www.healingpeople.com/i n d e x . p h p ? o p t i o n = c o mcontent&task=view&id=361&itemi
19. Bovim G et al, Neck Pain in The GeneralPopulation, Spine 1994, 19:1307-1309.
20. Van der et al,The Associations Of Neck Pain WithRadiological Abnormalities Of The Cervical SpineAnd Personality Traits In A General—
Population. J Rheumatol1991, 18: 1884-1889.21. Peter D et al, Conservative Management Of
Mechanical Neck Pain: Systematic Overview AndMeta-Analysis, BMJ, 1996, 313: 1291-1296.
22. R. Lindman et al, Fiber type composition of thehuman female trapezius muscle: Enzyme-histochemical characteristics, Am J Anat, 2005,190: 385-392
23. Kristen J. Light, Exertion Provokes Pain In MyalgiaPatients, BioMechanics Archives, 2008.
24. Irnich D et al, Is Acupuncture At Distant PointsReally Superior To Dry Needling Of Trigger PointsIn Chronic Neck Pain?, pain, 2002, 83: 991-992.
25. Fricton JR, Clinical Care For Myofascial Pain, DentClin North Am, 1991, 35: 1-28.
26. Lewit D et al, Myofascial Pain: Relief by Post-Isometric Relaxation, Arch Phys Med Rehabil,1984, 65: 452—456.
27. Simons D, Myofacial Trigger Points: A Need forUnderstanding, Arch Phys Med Rehabil, 1981, 62:97-99.
28. Jamie Dearing, An Examination Of Pressure PainThreshold At Myofacial Trigger Points FollowingMuscle Energy Technique Or IschemicCompression Treatment, Chiropractic, Osteopathyand Physiotherapy Annual Conference, 2007, 4:14.
29. Fricton JR, Myofascial Pain Syndrome:Characteristics and Epidemiology. In: Fricton JR,Awad EA, Advances in Pain Research andTherapy, Vo117, NY: Raven Pres; 1990: 107-127.
30. Simons DG, Muscular Pain Syndromes, In: FrictonJR, Awad EA, eds. Advances in Pain Researchand Therapy, Vol17, New York, NY: Raven Press;1990: 1-41.
20. Karishma--99-104.pmd 2/7/2013, 8:08 PM103

104 Indian Journal of Physiotherapy & Occupational Therapy. January-March 2013, Vol. 7, No. 1
31. Han SC et al, Myofascial Pain Syndrome andTrigger-Point Management, Reg Anesth, 1997, 22:89-101.
32. Travell JG et al, Letter to The Editor, Pain, 1981, 10:106—109.
33. Travell JG, Myofascial Trigger Points: ClinicalView, In: Bonica JJ, Albe-Fessard D, Eds.,Advances In Pain Research and Therapy, NY:Raven Press; 1976, 1: 919-926.
34. Nice D et al, Intertester Reliability Of JudgementsOf The Presence Of Trigger Points In ..T.. )patients
With Low Back Pain, Arch Phys Med Rehabil,1992, 73: 893-898.
35. Graff-Radford SB et al, Effects Of TranscutaneousElectrical Nerve Stimulation On Myofascial Pain AndTrigger Point Sensitivity, Pain, 1989, 37: 1-5.
36. Melzack R, Prolonged Relief Of Pain By Brief,Intense Transcutaneous Somatic Stimulation, Pain,1975, 1: 357-373.
37. Hameroff SR et al, Comparison Of Bupivacaine,Etidocaine, And Saline For Trigger-Point Therapy,Anesth Analg, 1981, 60: 752-755
20. Karishma--99-104.pmd 2/7/2013, 8:08 PM104

Indian Journal of Physiotherapy & Occupational Therapy. January-March 2013, Vol. 7, No. 1 105
Prevalence of Upper Limb Dysfunction in Subjects withChronic non Specific Neck Pain in Bangalore City,
Karnataka
Kinchuk DB1, Soumya G2, Payal D3
1Student, MSc. Clinical Physiotherapy, International School of Physiotherapy, a Collaborative Programme of GokulaEducation Foundation and Coventry University, Bangalore, Karnataka, 2Lecturer, International School of PhysiotherapyGEF - CU Collaborative Programme Bangalore, 3Lecturer, International School of Physiotherapy GEF - CU Collaborative
Programme Bangalore.
ABSTRACT
Study design: Cross sectional study
Objective: To find out the prevalence of upper limb dysfunction in subjects with non specific neck pain.
Summary of the background data: Non specific neck pain is highly prevalent in women particularlyof working age. Upper limb disorder and disability/ dysfunction are one of the most important factorsthat have been discovered in the management outcome for nonspecific neck pain. Single Arm MilitaryPress (SAMP) test has been used to measure the level of upper limb dysfunction in neck pain population.With a high prevalence of non specific neck pain in India either due to their occupation or age itbecomes important to quantify the rate of upper limb dysfunction in Indian population in their workingenvironment so that further measures can be taken to address upper limb dysfunction in the course ofmanagement of non specific neck pain.
Method: Seventy two (72) subjects fulfilling the inclusion criteria and exclusion criteria were taken upfor the study. The upper limb dysfunction was measured for all the subjects for both the hands. Descriptivestatistical analysis was carried out for this study. Results on continuous measurements are presentedon Mean SD (Min-Max) and results on categorical measurements are presented in Number (%) withlevel of significance set at 0.05. The comparison between the categorical measurements has been analyzedusing one sample t- test.
Results: Of the 72 subjects 93.1% had upper limb dysfunction as determined by the test scores. Themean and standard deviation of SAMP score for the right hand was 20.44 ± 5.25 and for the left handit was 18.49 ± 4.49. The comparison between the mean scores of right and left upper limb was done toshow a cumulative finding using one sample t- test and it was found to be statistically significant (p <0.001).
Conclusion: Upper limb dysfunction has been found to be highly prevalent in subjects with non specificneck pain working women in Bangalore city, India.
Keywords: Ischemic Compression, Upper Trapezius, Trigger Point.
INTRODUCTION
Non specific neck pain is a common occurrence ingeneral population and the incidence appears to berising1,2 .Most of the working aged women have beencomplaining of neck pain to the physicians 3,4 and thefrequency has increased since past two decades 5,6.Women are found to be having lower strength of theirneck muscles when compared to men 7,8,9,10.
There is evidence to understand the relationshipbetween the neck pain and upper limb dysfunction assummarized by McLean et al.11. Any mechanicalloading of the articular structures results in a protective
spasm that invariably restricts the upper limb inperforming its functions. Static positioning of the upperlimbs during working like using computers could leadto deconditioning of the upper limb eventually reducingthe strength and endurance 12.
The Single Arm Military Press (SAMP) test, whichis strength and endurance performance based outcomemeasure, is more valid and reliable tool than DASH toquantify the level of upper limb dysfunction 13. UKStudies have found 67% of the population sufferingfrom non specific neck pain having problems regardingupper limb functions14.
21. Kinchuk Dolma--105-109.pmd 2/7/2013, 8:08 PM105

106 Indian Journal of Physiotherapy & Occupational Therapy. January-March 2013, Vol. 7, No. 1
Despite the high prevalence of neck pain in India,limited literature is available regarding the presence ofupper limb dysfunction among neck pain population.Thus, the present study intends to find out theprevalence of upper limb dysfunction among subjectswith non specific neck pain by evaluating the strengthand endurance of upper limb using SAMP test.
MATERIALS AND METHOD
Methods Of Data Collection
Method of sampling : Convenience sampling
Type of the study : Cross sectional
Sample size : 72 (seventy two)
Inclusion criteria
• Mechanical/non specific neck pain
• Chronic pain (i.e., should have had pain more than3 months)
• No disabling pain at the time of study
• Working women (age 30-55 years)
• No previous physiotherapy treatment taken
• English speaking
Exclusion criteria
• Traumatic neck pain e.g., whiplash associateddisorder
• Old/recent trauma to the shoulder, elbow and hand
• Acute neck pain (less than 3 months)
• Cervical spondylosis
• Radiculopathy
• Neurogenic pain
• Any other systemic illness
• Psychological disorders
Procedure of data collection
A cross sectional study on 72 symptomatic subjectswith non specific neck pain was carried out in variousinstitutions in Bangalore city, India. The institutionsincluded primary and secondary school, privateworkplace, private hospitals and clinical diagnosticcentres. An ethical clearance for Research study wasobtained from M S Ramaiah Medical College andHospital, Bangalore, Karnataka, India. Approval forconducting the study was taken from the Principals of
the respective institutions. All the participants wereprovided with a copy of the detailed informed consentform. Purpose of the study was explained and a writteninformed consent was obtained from the subjects.Seventy two women of age ranging between 30 to 55years fulfilling the inclusion criteria and exclusioncriteria were taken up for the study. Following a formalintroduction, a brief demographic data of the subjectsparticipating in this study was noted. The procedure ofthe SAMP test was explained and demonstrated. Thistest required the subjects to complete as many repetitionsof the SAMP technique as possible within 30 secondsusing a 3kg weight [see figures (1) and (2)] with boththe upper limbs separately. All participants wereinstructed to do the test as fast as possible but couldstop and start at anytime during the 30 seconds, thoughthe timing continues. This was one time performedtechnique and the cut off number of repetitions was 25,the number of repetitions subjects were able to do wasdocumented.
MEASURES
To assess the baseline dysfunction of upper limb insubjects with neck pain a performance based outcomemeasure was used viz., Single Arm Military Press(SAMP) test. This SAMP test has a cut off point i.e. 25.This means that the scoring less than 25 was consideredto be having upper limb dysfunction amongst thesubjects and a score of 25 and above meant the subjectdid not have upper limb dysfunction.
MATERIALS REQUIRED
A set up was organized taking the participantsprivacy into consideration in the various workinginstitutions for the study. Three kilogram dumbbell anda stop watch along with documentation sheet werearranged.
STATISTICAL METHOD
Descriptive statistical analysis has been carried outfor the present study. Results on continuousmeasurements (i.e. Age and score of right and left upperlimb) are presented on Mean ± SD (Min-Max).Percentage enumeration has been carried out forcategorical measurements (presence of upper limbdysfunction) as significance is set 0.05. The comparisonbetween the categorical measurements has beenanalyzed using one sample t- test. The followingassumptions on data are made, Assumptions: 1.Dependent variables should be normally distributed,2. Samples drawn from the population should berandom, and 3. Cases of the samples should beindependent.
21. Kinchuk Dolma--105-109.pmd 2/7/2013, 8:08 PM106

Indian Journal of Physiotherapy & Occupational Therapy. January-March 2013, Vol. 7, No. 1 107
RESULTS
The basic demographic characteristics of the studypopulation: All the seventy two subjects were workingsymptomatic females of middle age ranging from 30 -55 years (Mean 40.09 ± 7.029 SD), right hand dominant.
Table 1: mean and standard deviation (MIN-MAX) ofage.
Age (years) Mean ± SD
30- 55yrs 40.09 ± 7.029
Table 1. Shows the mean and standard deviation of the age ofthe subjects who participated in the study.
Table 2: SAMP score of right upper limb inpercentage.
Right Total numberSAMP Score of subjects
% of % ofsubjects subjectswith score with score(d”24) (e”25)
57 15 72(79.2%) (20.8) (100.0%)
Table 2. Shows the Percentage of scores of right upper limb ofthe subjects who participated in the study. Out of 72 (100%)subjects 57 (79.2%) of them had a score less than equal to 24and 15 (20.8%) of them had score more than equal to 25.
Fig.1. Start position for SAMP test showing (a) anterior view and (b) lateral view
Fig. 2. Finish point for SAMP test showing (a) anterior view (b) lateral view
21. Kinchuk Dolma--105-109.pmd 2/7/2013, 8:08 PM107
108 Indian Journal of Physiotherapy & Occupational Therapy. January-March 2013, Vol. 7, No. 1
Table 3: SAMP score of left upper limb in percentage.
Left Total numberSAMP Score of subjects
% of % ofsubjects subjectswith score with score(d”24) (e”25)
65 7 72
(90.3%) (9.7%) (100%)
Table 3. Shows the Percentage of scores of left upper limb ofthe subjects who participated in the study. Out of 72 (100%)of the subjects 65 (90.3%) had score less than equal to 24 and7 (9.7%) had scores more than equal to 25.
Table 4. Comparison of Mean score between rightand left upper limb.
Mean Std. Error p Value(One sample
t- test)
Score Right Total 20.44 0.619 <0.001(N = 72) (SD ± 5.25)
Score Left Total 18.49 0.53 <0.001 (N = 72) (SD ± 4.49)
Total 1.09 0.03516(72) (SD± 0.29)
Table 4. Shows the Mean and Standard Deviation of the scoresin right and left upper limb of the study population. Since onlyone group of subjects were there, one sample t- test has beenused to compare the Mean between the scores of right and leftupper limb. With Standard of error 0.619 and for right and leftupper limb respectively the p value is <0.001.
Table 5. Percentage enumeration of upper limbdysfunction in subjects after combining both right and
left scores.
Total Combination Score
Upper limb NoDysfunction Dysfunction
Present of Upper Limb
Total Count 72 67 5 (100%) (93.1%) (6.9%)
Table 5. Shows the Percentage of presence of upperlimb dysfunction of the subjects who participated inthe study. 67 persons that accounts for 93.1% of thetotal subjects had upper limb dysfunction and 5 personsthat amount to 6.9% of the total subjects had no observedupper limb dysfunction.
DISCUSSION/CONCLUSION
In the present study 72 working women from variousoccupations with chronic non specific neck pain weretaken up. These subjects were evaluated for their upperlimb dysfunction using SAMP test as an outcome
measure. The ones who performed repetitive action lessor equal to twenty four (d”24) were considered to haveupper limb dysfunction and the ones who out performedthis test twenty five or more (e”25) times wereconsidered to be not having any upper limb dysfunction.
The results suggests that middle aged workingwomen with chronic non specific neck pain presentswith upper limb dysfunction with the percentageprevalence of 93.1% (67 subjects) and without upperlimb dysfunction percentage prevalence of 6.9% (5subjects) after combining the mean scores of both rightand upper limb (Refer Table 5). This finding is inaccordance with the literature that concluded thatwomen older than 37 years of age independent ofoccupation were susceptible of acquiring chronic neckpain which could probably result in upper limbdysfunction 15,16,17
Studies have shown that with increase in age therewill be a steady drop in SAMP test score11 and theassessment of work and non work related factorsparticularly in women is essential18. Since the presentstudy was just to find the prevalence of upper limbdysfunction in non specific neck pain population, noother outcome measures were used other than SAMPtest. This study suggests performing a detailedbiomechanical and functional analysis of the specificarea of problem (neck) as well as associated part (upperlimb) of the musculoskeletal system, in order to planout a rehabilitative protocol / strategy for any workingindividual with neck pain.
Further studies can be done by
• Considering larger subjects with similar condition.
• Comparing upper limb dysfunction in dominantand non dominant hand.
• Further validating the clinical use of SAMP test asan outcome measure of upper limb dysfunction/disability.
ACKNOWLEDGEMENT
I would like to extend my gratitude towards ourCourse Coordinator Prof. Savita Ravindra, CourseDirector Dr. Sudha Suresh, Associate prof communitydepartment Dr. Nanda Kumar B.S., internet searchengines Google Scholar, PubMed Central, Mendeley, mycolleagues and parents and the subjects who willinglyparticipated in my study
21. Kinchuk Dolma--105-109.pmd 2/7/2013, 8:08 PM108
Indian Journal of Physiotherapy & Occupational Therapy. January-March 2013, Vol. 7, No. 1 109
REFERENCES
1. Hakala P, Rimpela A, Salminen JJ, Virtanen SM,Rimpela M. Back, neck, and shoulder pain inFinnish adolescents: national cross sectionalsurveys. BMJ. 2002; 325:743.
2. Bot SD, Waal JM, Terwee CB, Windt DA, SchellevisFG, Bouter LM, Dekker J. (2005) Incidence andprevalence of complaints of the neck and upperextremity in general practice. Ann Rheum Dis.2005; 64(1):118-123.
3. Rekola K. Health service utilization formusculoskeletal disorders in Finnish primaryhealth care. Acta Univ Oul. 1993; D259:53-59.
4. Mantyselka PT. Patient pain in general practice.1998 Kuopio, Finland. Kuopio UniversityPublications.
5. Ferrari R, Russell AS. Regional musculoskeletalconditions: neck pain. Best Pract Res ClinRheumatol. 2003; 17:57–70.
6. Ihlebaek C, Brage S, Eriksen HR. Health complaintsand sickness absence in Norway, 1996-2003.Occup Med (Lond). 2007; 57;43–9.
7. Staudte HW, Duhr N. Age- and sex-dependentforce-related function of the cervical spine. EurSpine J. 1994; 3:155–161.
8. Ylinen J, Takala EP, Nykanen M, Hakkinen A,Malkia E, Pohjolainen T, Karppi SL, KautiainenH, Airaksinen O. Active Neck Muscle Training InThe Treatment Of Chronic Neck Pain In Women.JAMA. 2003; 289(19):2509-16.
9. Taimela S, Takala EP, Asklöf T, Seppälä K. Activetreatment of chronic neck pain: a prospectiverandomized intervention. Spine. 2000; 25(8):1021–1027.
10. Bernard B. Musculoskeletal disorders andworkplace factors- A critical review ofepidemiologic evidence for work-relatedmusculoskeletal disorders of the neck, upperextremity, and low back. Cincinnati (OH): UnitedStates Department of Health and Human Sciences,National Institute for Occupational Health andSafety. 1997; 2.1—2.90.
11. McLean SM, Taylor J, Balasoobramanien T,Kulkarni M, Patekar P, Darne R, Jain V. Measuringupper limb disability in non-specific neck pain: Aclinical performance measure. InternationalJournal of Physiotherapy and Rehabilitation. 2010;1(1):44-52.
12. Frank AO, De Souza LH, Frank CA. Neck painand disability: a cross-sectional survey of thedemographic and clinical characteristics of neckpain seen in a rheumatology clinic. InternationalJournal of Clinical Practice. 2005; 59(2):173-182.
13. McLean S. Conservative management of non-specific neck pain: Effectiveness of treatment,predictors of treatment outcome and upper limbdisability. PhD dissertation, University of Hull;Hull. 2007.
14. McLean SM, Moffett JK, Sharp DM, Gardiner E.An investigation to determine the associationbetween neck pain and upper limb disability forpatients with non-specific neck pain: A secondaryanalysis. Manual Therapy. 2011; 16:434-439.
15. Daffner SD, Hilibrand AS, Hanscom BS, BrislinBT, Vaccaro AR, Albert TJ. Impact Of Neck AndArm Pain On Overall Health Status. Spine. 2003;28(17):2030-2035.
16. Cassou B, Derrienmic F, Monforz C, Norton J,Touranchet A. Chronic neck and shoulder pain,age and working conditions; longitudinal resultsfrom a large random sample in France. OccupEnviron Med. 2002; 59:337-544.
17. Andersson IH, Ejlertsson G, Leden I, RosenbergC. Chronic pain in a geographically-definedgeneral population: Studies on differences in age,gender, social class, and pain localization. ClinicalJ Pain. 1993; 9:174-82.
18. Fredriksson K, Alfredsson L, Köster M,Thorbjörnsson CB, Toomingas A, Torgén M, KilbomA. Risk factors for neck and upper limb disorders:results from 24 years of follow up. Occup EnvironMed. 1999; 56:59–66.
21. Kinchuk Dolma--105-109.pmd 2/7/2013, 8:08 PM109

110 Indian Journal of Physiotherapy & Occupational Therapy. January-March 2013, Vol. 7, No. 1
Randomized Controlled trial of Group Versus IndividualPhysiotherapy Sessions for Genuine Stress Incontinence
in Women
Komal Soni1, Harshit Soni2, Dhaval Desai1, Chintan Shah1, Hasmukh Patel3
1(Lecturer), 2(Tutor), SPB Physiotherapy College, Surat, 3Clinical Therapist, U. N. Mehta Institute of Cardiology &Research Centre, Ahmedabad
ABSTRACT
Background: Pelvic floor muscle exercises are used since 1948 as first-line treatment for management ofgenuine stress incontinence in women. This pelvic floor muscle exercises can be deliveredsimultaneously to a group of women or individually on a one to one basis.
Objective: The purpose of this study was to compare the effects of group physiotherapy and individualphysiotherapy sessions on the severity of incontinence & quality of life in patients with genuine stressincontinence.
Materials and Methods: 40 women with chronic genuine stress incontinence were randomized intoGroup A - where women were delivered the pelvic floor muscle exercises in a group of 10 (n=20) &Group B - where pelvic floor muscle exercise on a conventional one to one basis, the individual approach(n=20) were administered. Outcome measures which included VAS for measuring severity ofincontinence & King's health questionnaire for assessing quality of life were taken at baseline & at theend of 3 months intervention program.
Results: Both the group A and group B showed improvement in severity of incontinence and quality oflife postintervention when compared with preintervention measurement and 't'calculated value forpre-postintervention measures was statistically significant as it was above the 't' tabulated value.Moreover, Mean±SD of pre-post change in VAS for group A was 2.02±0.46 and for group B was 1.94±0.43and King's Health Questionnaire scores for group A was 30.09±5.3 and for group B was 21.51±6.73.'t'calculated value for pre-post changes was statistically not significant as it was below the 't' tabulatedvalue of 2.576.
Conclusion: Both group and individual physiotherapy pelvic floor muscle exercises for women withgenuine stress incontinence are equally effective. One may choose anyone of it to gain benefits.
Keywords: Genuine Stress Incontinence, Pelvic Floor Muscle Exercise, Group Physiotherapy, IndividualPhysiotherapy.
Corresponding author:Komal Soni543, Jalaramnagar, GHB, Ganeshpura, Amroli,Surat - 394107,Gujarat, India, Mobile No: 9904157300E-mail: [email protected]
INTRODUCTION
GSI (Genuine stress incontinence); also known asStress urinary incontinence is defined as an involuntaryloss of urine that occurs during physical activity, suchas coughing, sneezing, laughing, or exercise.1 GSI isfound to be commonest, with its prevalence beinggreatest in 5th decade of life.2 WHO’s 1st InternationalConsultation on Incontinence estimated that bladder
problems affects approximately 200 million peopleworldwide, with 10 to 30% of women between the agesof 20 and 55 years, and in up to 40% of older women.3
Although not a life-threatening condition, GSIcauses various physical, psychological & sexualproblems for millions of women & their families. GSIthus has a negative impact on Quality of Life (QoL) &most affected domains are physical health & mobility.4
Hence the need for the effective management of thiscondition is vital, not only for the relief of symptomsbut perhaps more importantly, for the prevention ofrecurrent episodes of leakage, personal suffering, andlost work productivity.
Studies have found out that women withurinary incontinence have a significant reduction of
22. komal soni--110-115.pmd 2/7/2013, 8:08 PM110
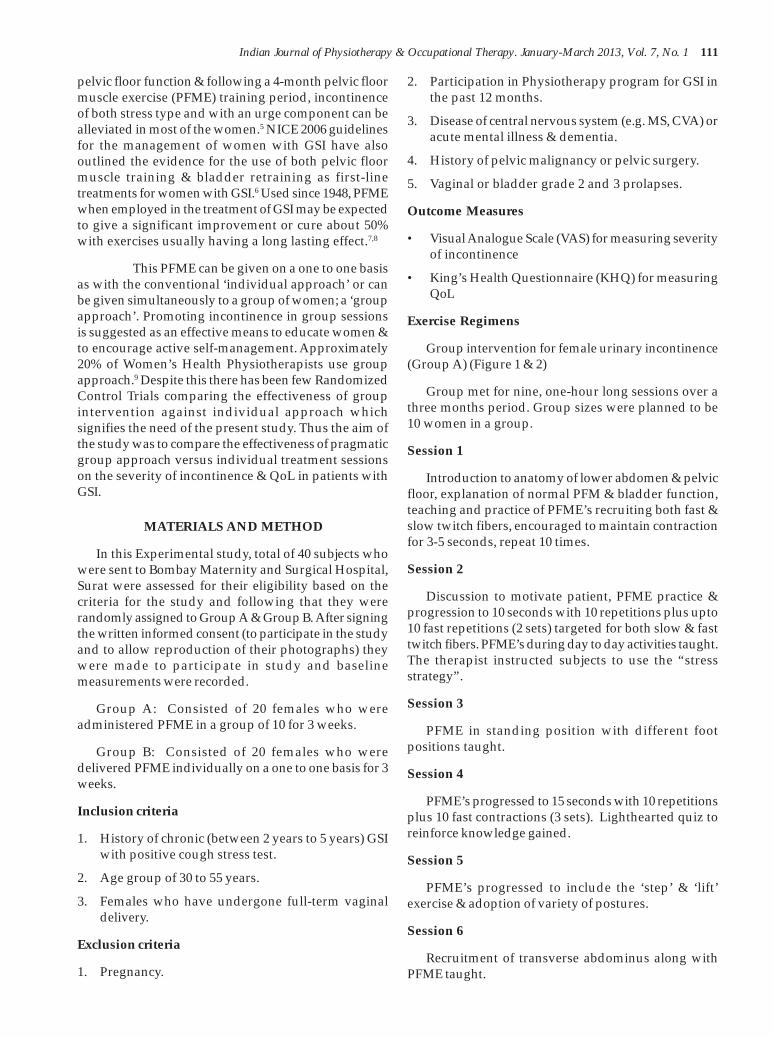
Indian Journal of Physiotherapy & Occupational Therapy. January-March 2013, Vol. 7, No. 1 111
pelvic floor function & following a 4-month pelvic floormuscle exercise (PFME) training period, incontinenceof both stress type and with an urge component can bealleviated in most of the women.5 NICE 2006 guidelinesfor the management of women with GSI have alsooutlined the evidence for the use of both pelvic floormuscle training & bladder retraining as first-linetreatments for women with GSI.6 Used since 1948, PFMEwhen employed in the treatment of GSI may be expectedto give a significant improvement or cure about 50%with exercises usually having a long lasting effect.7,8
This PFME can be given on a one to one basisas with the conventional ‘individual approach’ or canbe given simultaneously to a group of women; a ‘groupapproach’. Promoting incontinence in group sessionsis suggested as an effective means to educate women &to encourage active self-management. Approximately20% of Women’s Health Physiotherapists use groupapproach.9 Despite this there has been few RandomizedControl Trials comparing the effectiveness of groupintervention against individual approach whichsignifies the need of the present study. Thus the aim ofthe study was to compare the effectiveness of pragmaticgroup approach versus individual treatment sessionson the severity of incontinence & QoL in patients withGSI.
MATERIALS AND METHOD
In this Experimental study, total of 40 subjects whowere sent to Bombay Maternity and Surgical Hospital,Surat were assessed for their eligibility based on thecriteria for the study and following that they wererandomly assigned to Group A & Group B. After signingthe written informed consent (to participate in the studyand to allow reproduction of their photographs) theywere made to participate in study and baselinemeasurements were recorded.
Group A: Consisted of 20 females who wereadministered PFME in a group of 10 for 3 weeks.
Group B: Consisted of 20 females who weredelivered PFME individually on a one to one basis for 3weeks.
Inclusion criteria
1. History of chronic (between 2 years to 5 years) GSIwith positive cough stress test.
2. Age group of 30 to 55 years.
3. Females who have undergone full-term vaginaldelivery.
Exclusion criteria
1. Pregnancy.
2. Participation in Physiotherapy program for GSI inthe past 12 months.
3. Disease of central nervous system (e.g. MS, CVA) oracute mental illness & dementia.
4. History of pelvic malignancy or pelvic surgery.
5. Vaginal or bladder grade 2 and 3 prolapses.
Outcome Measures
• Visual Analogue Scale (VAS) for measuring severityof incontinence
• King’s Health Questionnaire (KHQ) for measuringQoL
Exercise Regimens
Group intervention for female urinary incontinence(Group A) (Figure 1 & 2)
Group met for nine, one-hour long sessions over athree months period. Group sizes were planned to be10 women in a group.
Session 1
Introduction to anatomy of lower abdomen & pelvicfloor, explanation of normal PFM & bladder function,teaching and practice of PFME’s recruiting both fast &slow twitch fibers, encouraged to maintain contractionfor 3-5 seconds, repeat 10 times.
Session 2
Discussion to motivate patient, PFME practice &progression to 10 seconds with 10 repetitions plus upto10 fast repetitions (2 sets) targeted for both slow & fasttwitch fibers. PFME’s during day to day activities taught.The therapist instructed subjects to use the “stressstrategy”.
Session 3
PFME in standing position with different footpositions taught.
Session 4
PFME’s progressed to 15 seconds with 10 repetitionsplus 10 fast contractions (3 sets). Lighthearted quiz toreinforce knowledge gained.
Session 5
PFME’s progressed to include the ‘step’ & ‘lift’exercise & adoption of variety of postures.
Session 6
Recruitment of transverse abdominus along withPFME taught.
22. komal soni--110-115.pmd 2/7/2013, 8:08 PM111
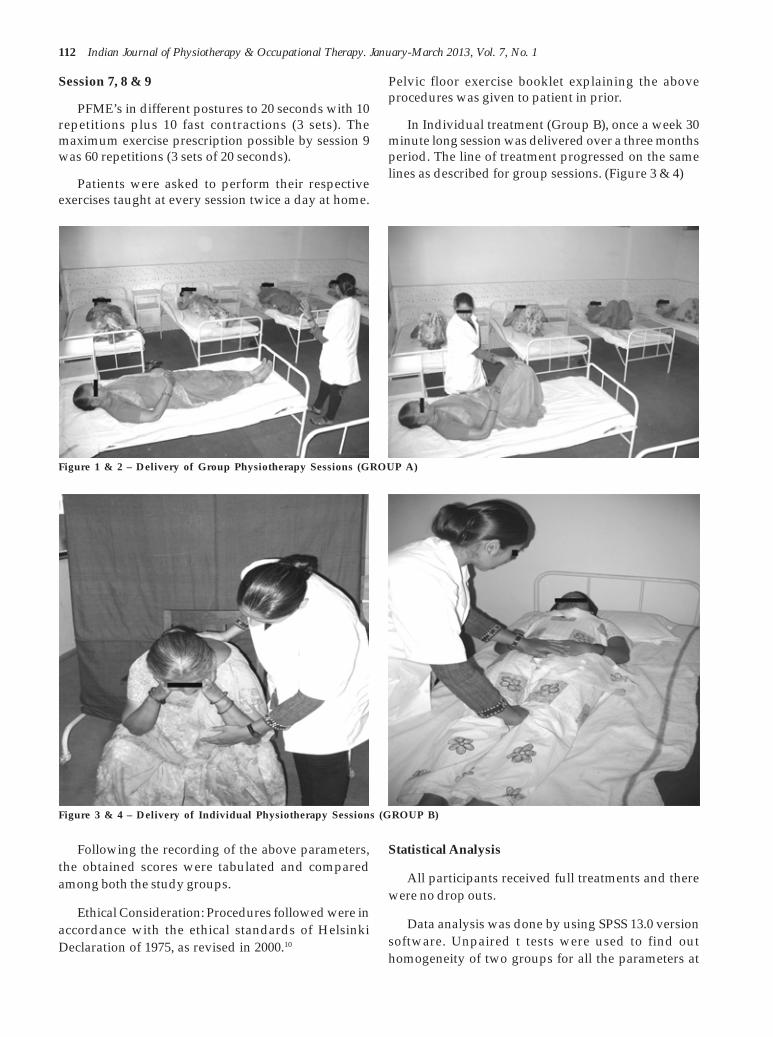
112 Indian Journal of Physiotherapy & Occupational Therapy. January-March 2013, Vol. 7, No. 1
Session 7, 8 & 9
PFME’s in different postures to 20 seconds with 10repetitions plus 10 fast contractions (3 sets). Themaximum exercise prescription possible by session 9was 60 repetitions (3 sets of 20 seconds).
Patients were asked to perform their respectiveexercises taught at every session twice a day at home.
Pelvic floor exercise booklet explaining the aboveprocedures was given to patient in prior.
In Individual treatment (Group B), once a week 30minute long session was delivered over a three monthsperiod. The line of treatment progressed on the samelines as described for group sessions. (Figure 3 & 4)
Following the recording of the above parameters,the obtained scores were tabulated and comparedamong both the study groups.
Ethical Consideration: Procedures followed were inaccordance with the ethical standards of HelsinkiDeclaration of 1975, as revised in 2000.10
Statistical Analysis
All participants received full treatments and therewere no drop outs.
Data analysis was done by using SPSS 13.0 versionsoftware. Unpaired t tests were used to find outhomogeneity of two groups for all the parameters at
Figure 1 & 2 – Delivery of Group Physiotherapy Sessions (GROUP A)
Figure 3 & 4 – Delivery of Individual Physiotherapy Sessions (GROUP B)
22. komal soni--110-115.pmd 2/7/2013, 8:08 PM112

Indian Journal of Physiotherapy & Occupational Therapy. January-March 2013, Vol. 7, No. 1 113
baseline and to compare the outcome measurement databetween two groups. Paired t tests were conducted todetermine whether VAS and KHQ scores weresignificantly different before and after the intervention.Each calculated t-value is compared with t-table valueto test two tailed hypothesis at 0.01 level of significance.
RESULTS
Table-1. Demographic Data for both the groups
GROUP A GROUP B
Mean±SD Range Mean±SD Range
Age (years) 42.0±4.96 34-52 42.5±6.0 33-51
BMI 27.01±1.02 25.01-29.14 26.74±1.02 24.89-28.14
Duration of 39.25±7.18 26-57 38.5±8.88 27-54the symptoms(months)
Parity 2.35±0.67 1-4 2.5±0.97 1-4
‘t’cal value at n1+n2-2 degree of freedom for age, BMI,duration of symptoms and parity was 0.243, -0.693, -0.249 and 0.496 respectively. Also the ‘t’ cal value atn1+n2-2 degree of freedom among both the groups forvarious preintervention measures like VAS, KHQ, KHQ
variables viz. general health perception, incontinenceimpact, role limitations, physical limitations, sociallimitations, personal relationships, emotions, sleep/energy, severity measures for incontinence was -0.921,-1.313, 0.000, -0.190, -0.305, -1.46, -2.53, -1.792, -0.384, -0.545 and -1.646 respectively. Hence, all the descriptivedata for both the groups was not significantly different,so both the groups were homogenous for all possibleconfounding factors and were valid for comparison.
Graph 1: Comparison of pre-post Mean VASbetween both the groups
Table-2: Comparison of KHQ Scores between two groups
GROUP A GROUP B
Variables Pre Post ‘t’ cal value Pre Post ‘t’ cal value
KHQ Mean 52.43±7.78 22.34±5.05 17.01 47.05±9.50 25.54±4.04 9.57
General Health Perception 57.5±18.31 25.0±11.47 12.36 57.5±12.07 27.5±7.90 9.00
Incontinence Impact 54.99±22.36 28.33±12.21 5.81 53.32±23.3 26.66±14.05 4.00
Role Limitations 53.33±12.79 26.66±8.37 10.46 51.66±16.57 28.32±8.05 6.33
Physical Limitations 54.16±11.93 24.99±8.55 8.81 48.33±5.27 28.32±8.05 9.00
Social Limitations 55.27±14.24 17.22±11.09 9.12 41.10±14.85 25.55±9.14 3.67
Personal Relationships 40.83±16.64 14.99±7.45 7.21 29.99±13.14 18.32±5.27 2.83
Emotions 54.99±11.66 23.88±9.02 12.07 53.32±10.20 31.1±4.68 7.74
Sleep/Energy 38.33±16.31 15.41±7.29 7.75 34.99±14.59 20.82±7.08 3.97
Severity Measures 62.49±15.64 24.58±8.32 15.25 53.33±11.25 23.33±6.57 10.30
As evident from graph 1 and table 2, ‘t’ calculatedvalue of pre-post intervention VAS and KHQ scores wereabove the ‘t’ tabulated value of 2.576 and hence were
statistically significant, so both the treatments wereeffective in improving the severity of incontinence andQoL.
22. komal soni--110-115.pmd 2/7/2013, 8:08 PM113

114 Indian Journal of Physiotherapy & Occupational Therapy. January-March 2013, Vol. 7, No. 1
Graph 2: Comparison of mean Pre-post change ofVAS between both the groups
Moreover, both the strategies being equally effective,group therapy can be considered as a convenient optionas it may be more cost effective, but the cost-effectivenessof group therapy needs to be assessed. The findings ofstudies done by LA Hill et al. (2007)13 and SE Lamb etal. (2009)14 showed cost-effectiveness of group therapyand hence gave preference towards it.
As seen from our study, while considering QoL itcan be seen that some domains of QoL like physicallimitations, social limitations and personalrelationships showed improvement better in group thanindividual sessions. This can be attributed to betterdelivery of information in group sessions and hencehigh level of satisfaction associated with group therapyas suggested by B Aston et al. (2007).15 Previous worksdone by Frances Griffiths et al. (2009)16 showed thatwomen who had preference for individual therapywhen given group sessions exhibited their experienceof group sessions as good but also stated that for groupsessions, its effectiveness lies in its proper designing. Ifthe designing of group therapy is not proper thanembrassement associated with group sessions may leadto failure in delivery of effective treatment.
Hence, both the treatments being equally effective,either one can be used for benefit of the patients. Butfactors should be sought that can predict theeffectiveness of therapy and thus better select thosepatients most likely to benefit from specific treatmentprogram.
Limitations of the Study
1. This study only included women with GSI betweenage group of 30-55 years as GSI is most common inthat age women & also a big age difference inwomen receiving group therapy may lead toimproper delivery of exercise to patient.
2. This study only included a smaller population asstudy sample & also the time duration chosen waslimited, thus giving only short-term benefits.
Future Implications
1. Study can be explored for both the sex and for allage groups & all types of incontinence to know theeffects of these exercise interventions.
2. In future study, a larger population can be studiedthus giving more standardized results.
3. In future studies, electromyography could be usedconcurrently to provide additional information onmuscle activation associated with the Pelvic FloorMuscle Exercises.
TABLE 3 - Comparison of pre-post change in KHQscores between two groups
Variable GROUP A GROUP B ‘t’ calPre-Post change Pre-Post change value
KHQ 30.09±5.30 21.51±6.73 1.63
General Health Perception 32.5±11.75 30±10.54 0.56
Incontinence Impact 26.66±20.51 26.66±21.08 0.00
Role Limitations 26.66±12.56 23.33±11.65 0.00
Physical Limitations 29.16±14.17 20.00±10.54 2.30
Social Limitations 38.05±15.42 15.55±7.76 3.30
Personal Relationships 25.83±15.74 11.66±11.25 3.00
Emotions 31.1±9.26 22.22±9.07 1.50
Sleep/Energy 22.91±13.21 14.16±12.45 0.80
Severity Measures 37.91±11.93 30.0±11.24 0.80
As shown in graph 2 and table 3, ‘t’ calculated valueof pre-post intervention change in VAS and KHQ scoreswere below the ‘t’ tabulated value of 2.576 and hencewere statistically not significant (except for sociallimitations and personal relationships), so both thetreatments were equally effective in improving theseverity of incontinence and QoL.
DISCUSSION
Following a 3 months intervention with GroupPhysiotherapy sessions & Individual Physiotherapysessions, the women showed significant reduction inseverity of incontinence & improvement in QoL.However there were no significant differences foundbetween the two groups treated individually or ingroup, thus suggesting that both individual & groupphysiotherapy sessions are equally effective inmanagement of women with GSI. These findings are inline with the findings of previous studies done by SaraDemain et al. (2001),9 Janssen et al. (2001)11 & FlaviaCamargo et al. (2009).12
22. komal soni--110-115.pmd 2/7/2013, 8:08 PM114

Indian Journal of Physiotherapy & Occupational Therapy. January-March 2013, Vol. 7, No. 1 115
CONCLUSION
This study concluded that both theapproaches – group and individual are equally effectiveto reduce severity of incontinence & improve quality oflife in women with GSI. However factors should be sortfor each specific patient so that they can benefitmaximum from the intervention.
ACKNOWLEDGMENTS
We are thankful to all our subjects who participatedwith full cooperation, extended thanks to Mrs. DhartiHingarajia for her valuable help. We are also grateful toauthors/ publishers of all those articles, journals andbooks from where the literature for this article has beenreviewed and discussed.
REFERENCES
1. Stress Incontinence – medlineplus. Available at:http://www.nlm.nih.gov/medlineplus/ency/article/000891.htm
2. Minassian VA, Stewart WF, Wood GC. Urinaryincontinence in women: variation in prevalenceestimates and risk factors. Obstet Gynecol. 2008Feb;111:324-31.
3. Hunskaar S, Burgio K, Diokno AC, etal. Epidemiology and natural history of urinaryincontinence. Urology October 2003;62(4):16-23.
4. Rehab Ali Mohamed, Ahmed Mahmoud Mostafa– The impact of urinary incontinence on qualityof life of women attending family practice centerat Fanara village – Ismailia governorate. Availablefrom: http://www.scribd.com/doc/28184727/Impact-of-Incontinence-on-Quality-of-Life
5. Marianne Gunnarsson, Pia Teleman , AndersMattiasson , Jonas Lidfeldt , Christina Nerbrand ,Göran Samsioe . - Effects of Pelvic Floor Exercisesin Middle Aged Women with a History of NaiveUrinary Incontinence: A Population Based Study.Eur Urol. 2002 May;41(5):556-61.
6. NICE guidelines for management of women withurinary incontinence (NICE 2006), Journal of theAssociation of Chartered Physiotherapists inWomen’s Health, Autumn 2007;101:37-43.
7. H. Cammu & M. Van Nylen - Pelvic floor muscleexercises in genuine urinary stress incontinence.Int Urogynecol J, September 1997;8(5):297-300.
8. Chantale Dumoulin, Marie-Claude Lemieux –Physiotherapy for persistent postnatal SUI: arandomized controlled trial. American College ofObstetricians & Gynecologists, September2004;104(3):504-10 .
9. Sara Demain, Jan Fereday Smith, Louise Hiller,Krysia Dziedzic – Comparison of group &individual Physiotherapy for female urinaryincontinence in primary care. Physiotherapy, May2001;87(5):235-42.
10. WMA Declaration of Helsinki - Ethical Principlesfor Medical Research Involving Human Subjects.[59th WMA General Assembly Seoul, Korea, Oct2008]. Available from: http://www.wma.net/en/30publications/10policies/b3/
11. C. C. M. Janssen, A. L. M. Lagro-Janssen & A. J. A.Felling – the effects of physiotherapy for female UIindividual compared with group treatment. BJUInternational(2001); 87:201-6.
12. Flávia de Oliveira Camargo,A n d r e a M o u r a R o d r i g u e s ,Raquel Martins Arruda, Marair Gracio FerreiraSartori, Manoel João Batista Castello Girão andRodrigo Aquino Castro - Pelvic floor muscletraining in female stress urinary incontinence:comparison between group training andindividual treatment using PERFECT assessmentscheme; Int Urogynecol J, December2009;20(12):1455-62.
13. L. A. Hill, J. Fereday Smith, J. C. Knights, A. J.Williams, S. E. Lamb, J. Pepper, M. Clarke –bladders behaving badly: a randomized controlledtrial of group versus individual intervention inmanagement of female urinary incontinence.Journal of the Association of CharteredPhysiotherapists in Women’s Health, Autumn2007;101:30-36.
14. SE Lamb, J Pepper, R Lall, EC Jørstad-Stein, MDClark, L Hill, and J Fereday-Smith - Grouptreatments for sensitive health care problems: arandomised controlled trial of group versusindividual physiotherapy sessions for femaleurinary incontinence. BMC WomensHealth(2009);9:26.
15. B. Aston & S. Moulder – Is group treatmentacceptable in the management of women withpelvic floor dysfunction? Journal of theAssociation of Chartered Physiotherapists inWomen’s Health, Autumn 2007; 101:37-43.
16. Frances Griffiths, Jo Pepper, Ellen C Jorstad-Stein, Jan Fereday Smith, Lesley Hill & Sarah ELamb - Group versus individual sessions deliveredby a physiotherapist for female urinaryincontinence: an interview study with womenattending group sessions nested within arandomised controlled trial. BMC Women’sHealth 2009;9:25.
22. komal soni--110-115.pmd 2/7/2013, 8:08 PM115

116 Indian Journal of Physiotherapy & Occupational Therapy. January-March 2013, Vol. 7, No. 1
A Study of Electromyographic Changes in Muscle PostExercise Induced Muscle Soreness
Manish Rajput1, Ankita Samuel1, Chhavi Gupta1, Sumit Kalra2
1Student BPT, Banarsidas Chadiwala Institute of Physiotherapy,2Assistant Professor, Banarsidas Chadiwala Institute of Physiotherapy
ABSTRACT
Aim and objective: To analyze electromyographic changes in muscle post Exercise Induced MuscleSoreness (EIMS).
Methodology: 80 subjects(age group 21-30yrs, BMI 18-29kg/m2) free of any musculoskeletal/Neuromuscular/psychological disorder, took part in the study. After checking for leg dominancy andcalculation of BMI, the subjects were asked to perform one single squat up to 900 of hip and knee flexionwhile an EMG of the Rectus Femoris and Vastus Medialis Obliqus (both parts of quadriceps muscle)was recorded simultaneously. Another EMG reading was taken in the similar manner after confirmingthe development of muscle soreness on a graphic pain rating scale following the exercise protocol.
Results: The mean value of peak EMG of Rectus Femoris pre exercise is 508.69mV (microvolt) and postexercise induced muscle soreness is 686.60 mV. The mean of peak EMG amplitude of Vastus MedialisObliqus came out to be as 379.81 mV pre exercise and 472.70 mV post exercise induced muscle soreness.The p value for RF pre and post was 0.000 and for VMO pre and post was 0.034.
Conclusion: The conclusion drawn from the study is that there is a significant increase in peak EMGamplitude of the muscles (RF and VMO) post exercise induced muscle soreness.
Keywords: Exercise Induced Muscle Soreness (EIMS), RF, VMO, EMG
INTRODUCTION
At one time or another, each one of us must haveexperienced muscle soreness following everydayactivities that are not associated with participation insports or in formal exercise programs for e.g.: downhillwalking etc. Although muscle soreness usually occursin less physically trained individuals, most people,including elite athletes can experience this soreness aswell. Since the soreness is experienced in the time periodfollowing any strenuous work, it is termed as exerciseinduced muscle soreness (EIMS).
Exercise-induced muscle soreness is a commonoccurrence in daily routine. It can be classified as acuteor delayed onset muscle soreness.1-4. Acute onset occursduring exercise and may last four to six hours post-exercise before subsiding. Delayed onset musclesoreness (DOMS) typically appears approximately 12hours after activity and may last for several daysfollowing exercise.1,2 It is perhaps one of the mostcommon and recurrent forms of sports injury.2
All forms of exercise, if carried out vigorouslyenough, can become painful. But only one form ofexercise, eccentric exercise5, 6, if we are unaccustomedto it, leaves us stiff and sore the next day. In eccentricexercise the contracting muscle is lengthened; inconcentric exercise it shortens. These eccentric actionsproduce micro-injury to the active muscle fibers, 7-10
exhibiting muscular soreness, loss of joint range ofmotion, swelling, and decreased force production.8, 11-16
The muscle soreness usually manifests as a dull,aching pain combined with tenderness and stiffness.Clinical signs of muscle soreness include increases inplasma enzymes12, 14, 16 muscular fiber degeneration, 17
and the protein degradation18 that accompanies thedegeneration to favor sarcomere disruption as thestarting point for the damage. As well as damage tomuscle fibers there is evidence of disturbance of musclesense organs and of proprioception.19
Accompanying the muscle soreness is muscleweakness”20, 21 which persists long after the muscle
23. Manish--116-120.pmd 2/7/2013, 8:08 PM116

Indian Journal of Physiotherapy & Occupational Therapy. January-March 2013, Vol. 7, No. 1 117
soreness has receded, prolonged strength loss, areduced range of motion, and elevated levels of creatinekinase in the blood. These are taken as indirectindicators of muscle soreness, and biopsy analysis hasdocumented damage to the contractile elements.22
A measure to quantify muscle soreness is a Graphicpain rating scale33 which is a 12 cm line between nopain and unbearable pain. Pain was quantified bymeasuring the distance (to the nearest 1/2 cm) from theextreme left to the mark made by subjects to describetheir perception of pain. The length was multiplied bytwo, yielding scores from 0 = no pain to 24 = unbearablepain.
Electro-myography (EMG) is the study ofmuscle function that involves recording the actionpotentials (or electrical currents) that activate skeletalmuscle fibers23, 24.
After fatiguing muscle with exercise, there is adecrease in maximal force production, which has beenobserved as early as l hour after exercise. The surfaceelectromyographic (EMG) activity is modified duringmuscle Fatigue (Big1and-Ritcgie, 1981).The EMG powerspectrum is shifted towards the lower frequencies asexemplified by the fall in mean power frequency (MPF)during static contractions as well as during dynamicexercise. The EMG spectrum from eccentric, concentricmuscle contractions under human were studied as afactor of mechanical damage of muscle fiber andfunctional change of metabolic tissue. The primarypurpose of the study was to examine the relationshipbetween DOMS in after exercise and EMG change induring exercise. A secondary purpose was to examinetheir relationship to local muscle fatigue and perceivedscale of DOMS. We hypothesized that if exercise-induced muscle soreness is associated with musclefatigue then the localized DOMS to muscle contractionswould be accompanied by attenuated response in indexof muscle fatigue.
The quadriceps Femoris muscle plays an importantrole in explosive and powerful actions of the leg duringsport and daily activities. Eccentric contraction iscommonly used during training programs which oftenleads to fiber injury and muscle soreness. The dominantleg was chosen as there is enough evidence that injuriesare most common on the dominant limb.25
AIMS AND OBJECTIVE
To study the electromyographic changes in musclepost exercise induced muscle soreness.
H1- (EXPERIMENTAL HYPOTHESIS)
There is significant change in EMG analysis ofquadriceps muscle post exercise induced musclesoreness.
H0- (NULL HYPOTHESIS)
There is no significant change in the EMG analysisof quadriceps muscle post exercise induced musclesoreness.
METHODOLOGY
Research design- comparative
Number and Source of subjects
80 (male) college going students took part in thestudy.
Inclusion Criteria
1. Body Mass Index(BMI)26 should be within the rangeof 18-29 kg/m2
2. Asymptomatic male subjects between age group 21-3027 years.
3. Not involved in unaccustomed eccentric muscleaction over past 6 months.28
Exclusion Criteria
1. History of lower limb injury , surgery or anyimplant28
2. All contraindications to EMG
3. Any visible deformity of the upper limb/lower limb
4. Obesity
5. Athletes
6. A diagnosed case of any musculoskeletal/neurological/ psychological/ cardio-pulmonarydisorder and psychiatric disease
Instrumentation
1. Neurotrac EMG machine
2. Weighing machine
3. Measuring tape
4. Football
5. Barbell
6. Ice pack
23. Manish--116-120.pmd 2/7/2013, 8:08 PM117
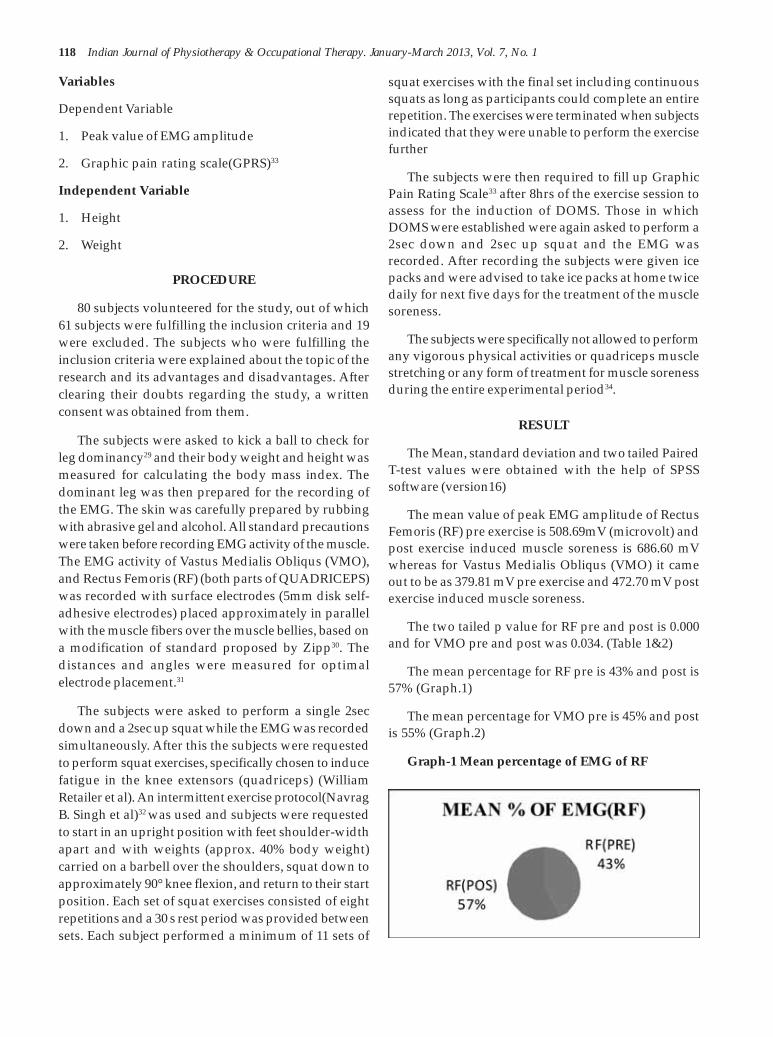
118 Indian Journal of Physiotherapy & Occupational Therapy. January-March 2013, Vol. 7, No. 1
Variables
Dependent Variable
1. Peak value of EMG amplitude
2. Graphic pain rating scale(GPRS)33
Independent Variable
1. Height
2. Weight
PROCEDURE
80 subjects volunteered for the study, out of which61 subjects were fulfilling the inclusion criteria and 19were excluded. The subjects who were fulfilling theinclusion criteria were explained about the topic of theresearch and its advantages and disadvantages. Afterclearing their doubts regarding the study, a writtenconsent was obtained from them.
The subjects were asked to kick a ball to check forleg dominancy29 and their body weight and height wasmeasured for calculating the body mass index. Thedominant leg was then prepared for the recording ofthe EMG. The skin was carefully prepared by rubbingwith abrasive gel and alcohol. All standard precautionswere taken before recording EMG activity of the muscle.The EMG activity of Vastus Medialis Obliqus (VMO),and Rectus Femoris (RF) (both parts of QUADRICEPS)was recorded with surface electrodes (5mm disk self-adhesive electrodes) placed approximately in parallelwith the muscle fibers over the muscle bellies, based ona modification of standard proposed by Zipp30. Thedistances and angles were measured for optimalelectrode placement.31
The subjects were asked to perform a single 2secdown and a 2sec up squat while the EMG was recordedsimultaneously. After this the subjects were requestedto perform squat exercises, specifically chosen to inducefatigue in the knee extensors (quadriceps) (WilliamRetailer et al). An intermittent exercise protocol(NavragB. Singh et al)32 was used and subjects were requestedto start in an upright position with feet shoulder-widthapart and with weights (approx. 40% body weight)carried on a barbell over the shoulders, squat down toapproximately 90° knee flexion, and return to their startposition. Each set of squat exercises consisted of eightrepetitions and a 30 s rest period was provided betweensets. Each subject performed a minimum of 11 sets of
squat exercises with the final set including continuoussquats as long as participants could complete an entirerepetition. The exercises were terminated when subjectsindicated that they were unable to perform the exercisefurther
The subjects were then required to fill up GraphicPain Rating Scale33 after 8hrs of the exercise session toassess for the induction of DOMS. Those in whichDOMS were established were again asked to perform a2sec down and 2sec up squat and the EMG wasrecorded. After recording the subjects were given icepacks and were advised to take ice packs at home twicedaily for next five days for the treatment of the musclesoreness.
The subjects were specifically not allowed to performany vigorous physical activities or quadriceps musclestretching or any form of treatment for muscle sorenessduring the entire experimental period34.
RESULT
The Mean, standard deviation and two tailed PairedT-test values were obtained with the help of SPSSsoftware (version16)
The mean value of peak EMG amplitude of RectusFemoris (RF) pre exercise is 508.69mV (microvolt) andpost exercise induced muscle soreness is 686.60 mVwhereas for Vastus Medialis Obliqus (VMO) it cameout to be as 379.81 mV pre exercise and 472.70 mV postexercise induced muscle soreness.
The two tailed p value for RF pre and post is 0.000and for VMO pre and post was 0.034. (Table 1&2)
The mean percentage for RF pre is 43% and post is57% (Graph.1)
The mean percentage for VMO pre is 45% and postis 55% (Graph.2)
Graph-1 Mean percentage of EMG of RF
23. Manish--116-120.pmd 2/7/2013, 8:08 PM118

Indian Journal of Physiotherapy & Occupational Therapy. January-March 2013, Vol. 7, No. 1 119
Graph-2Mean & standard deviation of RF CONCLUSION
The p value for pre n post exercise induced musclesoreness EMG recordings is less than 0.05 for both RF& VMO, which by conventional criteria is consideredto be extremely statistically significant. Thus theexperimental hypothesis for the study holds true i.e;there is significant change in the peak EMG amplitudeof the muscle post exercise induced muscle soreness.
The percentage increase in peak EMG activity of RFis 14 %( Graph.1)
The percentage increase in peak EMG activity ofVMO is 10 %( Graph.3)
A reduction in force output by an injured partof a muscle may lead to compensatory recruitment froman uninjured area of a muscle, or from other muscles35.
This leads to a marked increase in EMG activity(hyperactivity), altered EMG ratios and increased forceproduction of the compensating muscles.
FUTURE RESEARCH
1. The EMG of the non-dominant leg can be recordedafter post exercise induced muscle soreness
2. A comparison can be carried out by recording theEMG activity at the origin and insertion of themuscle.
3. The same study can be carried on females.
REFERENCES
1. Isabell, W.E., E.Durrant, W.Myrer, and S.Anderson.1992. The effects of ice massage, ice massage withexercise, and exercise on the prevention andtreatment of delayed onset muscle soreness. J AthlTrain. 27(3):208-217.
2. Prentice, W.E. 2009. Arnheim’s Principles ofAthletic Training. 13th ed. Mcgraw-Hill, NewYork. 273pp.
3. .Gulick, D.T., I.Kimura, M.Sitler, A.Paolone, andJ.Kelly. 1992. Various treatment techniques onsigns and symptoms of delayed onset musclesoreness. J Athl Train. 31(2):145-152.
4. Kuligowski, L.A., S.M. Lephart, F.P. Giannantonio,and R.O. Blanc. 1998. Effect of whirlpool therapyon the signs and symptoms of delayed-onsetmuscle soreness. J Athl Train. 33(3):222-228.
5. Armstrong RB. Mechanisms of exercise-induceddelayed-onset muscular soreness: a brief review.Med Sci Sports Exerc. 1984; 16:529-538.
6. Clarkson PM, Nosaka K, Braun B. Muscle functionafter exercise-induced muscle damage and rapidadaptation. Med Sci Sports Exec. 1992; 24:512-520.
Graph-3 Mean percentage of EMG of VMO
Graph-4 Mean & standard deviation of VMO
Table-1 p value for RF pre-post
Paired Differences
Pre-post (RF) 95% ConfidenceInterval of
the Difference
Lower Upper T Sig(2-tailed)
-266.11 -89.69 -4.03 .000
Table-2 p value for VMO pre-post
Paired Differences
Pre-post (RF) 95% ConfidenceInterval of
the Difference
Lower Upper T Sig(2-tailed)
-178.57 -7.21222 -2.16 .034
23. Manish--116-120.pmd 2/7/2013, 8:08 PM119

120 Indian Journal of Physiotherapy & Occupational Therapy. January-March 2013, Vol. 7, No. 1
7. Armstrong RB, Ogilvie RW, Schwane JA. Eccentricexercise-induced injury to rat skeletal muscle. JAppl Physiol. 1983; 54:80-93.
8. Friden J, Sjostrom M, Ekblom B. Myofibrillardamage following intense eccentric exercise inman. Int J Sports Med. 1983; 4:170-176.
9. Kuipers H, Drukker J, Frederik PM, Geurten P, vanKranenburg G. Muscle degeneration after exercisein rats. Int J Sports Med. 1983; 4:45-51.
10. Smith LL. Causes of delayed-onset musclesoreness and the impact on athletic performance:a review. J Appl Sport Sci Res. 1992; 6:135-141.
11. Clarkson PM, Tremblay I. Exercise-induced muscledamage, repair, and adaptation in humans. J ApplPhysiol. 1988; 65:1-6.
12. Nosaka K, Clarkson PM. Effect of eccentric exerciseon plasma enzyme activities previously elevatedby eccentric exercise. Eur J Appl Physiol. 1994;69:492-497.
13. Rodenburg JB, Steenbeek D, Schiereck P, Bar PR.Warm-up, stretching and massage diminishharmful effects of eccentric exercise. Int J SportsMed. 1994; 15:414-419.
14. Saxton JM, Donnelly AE. Light concentric exerciseduring recovery from exercise-induced muscledamage. Int J Sports Med. 1995; 16:347-351.
15. Smith LL. Acute inflammation: the underlyingmechanism in delayed onset muscle soreness?Med Sci Sports Exec. 1991; 23:542-551.
16. Takahashi H, Kuno S, Miyamoto T, et al. Changesin magnetic resonance images in human skeletalmuscle after eccentric exercise. Eur J Appl Physiol.1994; 69:408-413.
17. McCully KK, Faulkner JA. Injury to skeletal musclefibers of mice following lengthening contractions.J Appl Physiol. 1985; 59: 119-126.
18. Thompson HS, Scordilis SP. Ubiquitin changes inhuman biceps muscle following exercise-induceddamage. Biochem Biophys Res Commun. 1994;204:1 193-1198.
19. U. Proske and D. L. Morgan. Muscle damage fromeccentric exercise: mechanism, mechanical signs,adaptation and clinical applications. Journal ofPhysiology (2001), 537.2, pp.333–345
20. Newham, D.J., Jones, D.A. and Edwards, R.H.T.Large delayed plasma creatine kinase changesafter stepping exercise Muscle Nerve 1983, 6, 380-385
21. New ham, D.J., Jones, D.A. and Clarkson, P.M.Repeated high-force eccentric exercise: effects onmuscle pain and damage J Appl Physiol 1987, 63,1381-1386
22. J Sports Med Phys Fitness. 1994 Sep; 34(3):203-16.Exercise-induced muscle pain, soreness, andcramps. Miles MP, Clarkson PM.
23. Basmajian & deluca: A fundamental EMGtextbook. Definition Muscles Alive (2 - p. 1)
24. DE LUCA, C.J. The use of surfaceelectromyography in biomechanics. J. Appl.Biomech. 13:135 – 163. 1997.
25. Kieran O’Sullivan et al, The relationship betweenprevious hamstring injury and the concentricisokinetic knee muscle strength of Irish Gaelicfootballers, BMC Musculoskeletal Disorders 2008,9:30 doi:10.1186/1471-2474-9-30
26. Heather k. Vincen, PhD, Kelley M. Lamb, BS, Tim i.Day, PT, Susan M. Tillman, PT, Kevin R.Vincent,MD, PhD, Steven Z. George, PT, PhD.Morbid Obesity is Associated with Fear ofMovement and Lower Quality of Life in Patientswith Knee Pain- Related diagnosis. Volume 2, Issue8, August 2010, pg713-722
27. Dawn T. Gulick, Michael Sitler, Albert Paolone,John D. Kelly. Journal of Athletic Training Volume31 * Number 2 * June 1996
28. Michelle A. Cleary; Michael R. Sitler; Zebulon V.Kendrick. Dehydration and Symptoms of Delayed-Onset Muscle Soreness in Normothermic Men.Journal of Athletic Training 2006;41(1):36–45
29. Cameron M, Adams R, Maher C: Motor controland strength as predictors of hamstring injury inelite players of Australian football. PhysicalTherapy in Sport 2003, 4:159-166
30. ZIPP, P. Recommendations for the standardizationof lead position in surface electromyography. Eur.J. Appl. Physiol. 50:41–54, 1982.
31. STENSDOTTER, A.-K., P. W. HODGES, R.MELLOR, G. SUNDELIN, and C. HA¨ GER-ROSS.Quadriceps Activation in Closed and in OpenKinetic Chain Exercise. Med. Sci. Sports Exec., Vol.35, No. 12, pp. 2043–2047, 2003
32. Singh NB et al.philos transact A MATHphys.sci.2010 jun 13;368(1920)2783-98[PMID-20439273]
33. Craig R. Denegar, PhD, ATC David H. Perrin, PhD,ATC,Effect of Transcutaneous Electrical NerveStimulation, Cold, and a Combination Treatmenton Pain, Decreased Range of Motion, and StrengthLoss Associated with Delayed Onset MuscleSoreness, Volume 27 * Number 3 * 1992 * Joumalof Athletic Training(pg no.200-206)
34. Philippou, M. Maridaki, G. Bogdanis, A. HalapasAnd M. Koutsilieris [Department of ExperimentalPhysiology, Medical School, National andKapodistrian University of Athens, Goudi,Athens; Department of Sports Medicine andBiology of Physical Activity, Faculty of PhysicalEducation and Sport Science, National andKapodistrian University of Athens, Dafni,Greece](in vivo 23: 859-866 (2009)
35. Edgerton VR, Wolf SL, Levendowski DJ, et al.Theoretical basis for patterning EMG amplitudesto assess muscle dysfunction. Med Sci Sports Exec1996; 28 (6): 744-51
23. Manish--116-120.pmd 2/7/2013, 8:08 PM120

Indian Journal of Physiotherapy & Occupational Therapy. January-March 2013, Vol. 7, No. 1 121
Effect of Pelvic Floor Muscle Strengthening Exercises inChronic Low Back Pain
Manisha RathiAssociate Professor, Padmashree Dr. D. Y. Patil College of Physiotherapy, Pimpri, Pune
ABSTRACT
Low back pain (LBP) is a condition of localized pain to the lumbar spine. The pelvic floor muscle (PFM)have an important role in proper muscular activation for lumbar stabilization and also in unloadingthe spine. It was hypothesized that PFM exercise could be of benefit for patients with chronic LBP. Afterethical approval, a randomized controlled trial was carried out on 30 females with chronic LBP. Patientswere randomly allocated into two groups: an experimental and a control group. The control group wasgiven conventional physiotherapy treatment including modality and exercises; and the experimentalgroup received PFM strengthening with conventional therapy for 5 times per week upto 4 weeks. Painintensity and functional disability by Oswestry Disability Index were measured before and afterintervention . In both groups pain and functional disability were significantly reduced followingtreatment (p < 0.01). Also the significant difference was found between the two groups (p > 0.05). Itseems that the PFM exercise combined with conventional treatment was effective over conventionaltreatment alone in females with chronic LBP.
Keywords: Pelvic floor muscle, LBP.
INTRODUCTION
Low back pain (LBP) is a condition of localized painto the lumbar spine with or without symptoms to thedistal extremities whose etiology is commonlyunknown. 1 More than 80% of the population willexperience an episode of LBP at some time during theirlives. 2 For most, the clinical course is benign, with 95%of those afflicted recovering within a few months ofonset. 3 Some, however, will not recover and will developchronic LBP (ie, pain that lasts for 3 months or longer).Recurrences of LBP are also common, with thepercentage of subsequent LBP episodes ranging from20% to 44% within 1 year for working populations tolifetime recurrences of up to 85%. 4 In the United Statesit is the most common cause of job-related disability, aleading contributor to missed work, and the secondmost common neurological ailment — only headacheis more common.
Lower back pain may be classified by the durationof symptoms as acute (less than 4 weeks), sub acute (4–12 weeks), chronic (more than 12 weeks).6 Causes oflower back pain are varied. Most cases are believed tobe due to a sprain or strain in the muscles and softtissues of the back.8 Others may have pain from theirsacroiliac joint, where the spinal column attaches tothe pelvis, called sacroiliac joint dysfunction. Physical
causes may include osteoarthritis, rheumatoid arthritis,degeneration of the discs between the vertebrae or aspinal disc herniation, a vertebral fracture (such as fromosteoporosis), or rarely, an infection or tumor. In thevast majority of cases, no noteworthy or serious causeis ever identified. If the pain resolves after a few weeks,intensive testing is not indicated.9
It has been suggested that the overall mechanicalstability of the spinal column, especially in dynamicconditions and under heavy loads, is provided by thespinal column and the precisely coordinatedsurrounding muscles. 10 The spinal stabilizing systemof the spine was primarily suggested by Panjabi (1992),consisting of three subsystems: the spinal columnproviding intrinsic stability; spinal muscles,surrounding the spinal column, providing dynamicstability; and the neural control unit evaluating anddetermining the requirements for stability andcoordinating the muscle response11,12 . Under normalconditions, the three subsystems work in harmony andprovide the needed mechanical stability 13,14
Among various documented risk factors for LBPsuch as smoking 15 obesity 16, pregnancy 17, physicalactivity18, mental health 19, recent research done by Smithet al. 2009 and Hodges et al., 2007 has focused on therelationship between LBP and respiratory disorders,
24. Manisha Rath-121-125.pmd 2/7/2013, 8:08 PM121

122 Indian Journal of Physiotherapy & Occupational Therapy. January-March 2013, Vol. 7, No. 1
incontinence and gastrointestinal problems from theAustralia.20 A longitudinal study on women’s healthreported that women with pre-existing incontinence,gastrointestinal problems and breathing disorderswere more likely to develop LBP than women withoutsuch problems. 21 This was considered to be a result ofchanges in control of the trunk muscles followinginvolvement with incontinence, respiratory andgastrointestinal problems. Changes in morphology andaltered postural activity of the trunk muscles includingmuscles of respiration and continence which providemechanical support to the spine and pelvis has beenshown to be related to the development and occurrenceof LBP (Hides et al., 2001, Cholewicki et al., 2005).
Apart from the role of pelvic floor muscle (PFM) inpatients with urinary and faecal incontinence, the PFMhave also an important role in proper muscularactivation for lumbar stabilization and also inunloading the spine (Sapsford and Hodges, 2001,Sapsford et al., 2001). The pelvic floor forms the base ofthe abdominal cavity and during different tasks thatelevate intra-abdominal pressure, muscles mustcontract to maintain continence and contribute topressure increases (Gilpin et al., 1989). In a smallexperimental trial of healthy subjects, strong voluntaryabdominal muscle contraction caused PFM activity atthe same intensity as maximal PFM’s effort (Sapsfordand Hodges, 2001). Morkved et al. (2007) haveinvestigated the effect of group training duringpregnancy in prevention of lumbopelvic pain. Self-reported symptoms of lumbopelvic pain, sick leave, andfunctional status were measured on 301 healthynulliparous women who were randomly allocated intoa training group (148) or a control group (153). Thecontrol group received daily PFM training at home, andthe training group was given weekly group trainingover 12 weeks including aerobic exercises, PFM andadditional exercises, and information related topregnancy. They reported that at 36 weeks of gestationwomen in the training group were significantly lesslikely to report lumbopelvic pain and had significantlyhigher scores on functional status but there was nodifference in sick leave during pregnancy. However, theyconcluded that a 12-week specially designed trainingprogram during pregnancy was effective in preventinglumbopelvic pain in pregnancy.
Sapsford et al. (2001) investigated the co-activationpattern of the pelvic floor and the abdominal musclesvia needle electromyography (EMG) for the abdominalsand surface EMG for the pelvic floor. They found thatthe abdominals contract in response to a pelvic floor
contraction command and that the pelvic floor contractsin response to both a “hollowing” and “bracing”abdominal command. The results from this researchsuggest that the pelvic floor can be facilitated by co-activating the abdominals and vice versa.
However, very few published evidence was foundto assess the function of PFM in patients with LBP or toevaluate the effect of PFM exercises in the treatment ofsuch patients. The need to carry out this study was toinvestigate the effect of PFM exercise in the treatment ofpatients with chronic Low back pain specially infemales . As PFM has an important role in lumbar spinestability, and lumbar instability was suggested to beone of the causes for LBP, it was hypothesized that PFMexercise could be of benefit for patients with chronicLBP.
MATERIALS AND METHOD
This experimental study was carried out inPhysiotherapy OPD of Dr. D. Y. Patil College ofPhysiotherapy, Pune. Ethical approval was taken fromInstitutional Ethical Committee. 30 married femaleswith chronic low back pain fallowing in the age groupbetween 20 to 40 years were selected and divided byrandom allocation into two groups- group A with 15females and group B with 15 females. Pregnant females,females with any Urogenital Dysfunction like UVProlapsed, Pelvic Inflammatory disease, Nerve injuryto pelvic floor muscle, any pathology of spine, lowerlimb were excluded from the study. Informed consentwas obtained from all the females. Females from GroupA received conventional physiotherapy treatment whichincluded Short wave diathermy or Interferentionaltherapy , Abdominals and back extensors strengtheningexercises, Stretching exercises along with core stabilizers(Transverse abdominals and multifidus) for 5 timesper week upto 4 weeks.
Females from Group B received conventionalphysiotherapy treatment as mentioned above alongwith pelvic floor muscle strengthening exercises for 5times per week up to 4 weeks.Pelvic Floor strengtheningexercises were given initially in supine position. Beforestarting, patients were instructed to evacuate theirbladder, relax as much as possible, not to hold breathingand concentrate only at pelvic floor muscles. Patientwas instructed to contract pelvic floor muscles, holdthe contraction for 5 seconds and then relaxation for 5seconds. She was further instructed to repeat thecontraction for 10 times. As the strength was increasing,contraction time was increased and relaxation time was
24. Manisha Rath-121-125.pmd 2/7/2013, 8:08 PM122

Indian Journal of Physiotherapy & Occupational Therapy. January-March 2013, Vol. 7, No. 1 123
reduced from time to time. All the pelvic floor exerciseswere repeated 3 times in a day(21).
Pain was assessed by using Visual Analogue Scaleand Functional Disability was assessed by OswestryDisability Index on the 1st day of visit to thephysiotherapy department and at the end of 4 weeks.
RESULTS
Graph 1 :- Showing pre and post score of VAS ingroup A and B
was 24.07 + 3 .24 . This difference showed significantimprovement in reduction in pain as p < 0.05 withCI at 95%.
DISCUSSION
Present study showed the effect of pelvic floor musclestrengthening exercises in chronic Low back ache. Thisstudy showed that PFM exercise combined withconventional physiotherapy treatment had asignificant effect over the conventional physiotherapyprogram alone in the treatment of patients with chronicLow back pain .
A study done by Eliasson et al. (2008) concludedthat the prevalence of urinary incontinence and signsof PFM dysfunction were greatly increased in the LBPgroup compared with the reference group. It appearsthat LBP is a risk factor for urinary incontinence andassessment of PFM function may be of value whentreating patients with LBP. Evidence suggest that theexercise of the abdominal muscles may be beneficial inmaintaining PFM coordination, support, endurance,and strength. Hence these exercise has the potential tobe useful in the rehabilitation of persons withsymptoms of PFM dysfunction. A few studies bySapsford et al., 2001 and Neumann and Gill, 2002 havedemonstrated the synergy between abdominal musclesand PFM in healthy volunteers. EMG activity of PFMand abdominal muscles showed that during voluntaryactivity of PFM all abdominal muscles were activatedat different levels. The PFM seems to be an integral partof trunk and lumbopelvic stability in addition tocontributing continence. As there are the strong evidencesupports the co-contraction of PFM and abdominalmuscles, the results of the present study showed theconsistent result that these co-contractions have an effecton patients with chronic LBP and reducing disability.
One of the functions of PFM is to unload the spine.The static pressure created by a rigid abdominal cylindercan act to support the upper part of the body andtherefore unload the spine. This involves abdominal,dorsal, diaphragmatic and PF muscles( Grillner et at1978). Studies also indicates that the co-activation ofall these muscle is an essential prerequisite fordeveloping appropriate IAP, thus supporting the spine.When strengthening of the PFM occurs, the load on thelumbar spine decreases. This may be the cause forreliving LBP in the present study.
Sapsford et al 2001 suggested that recruitment ofabdominal muscles function in association withvoluntary contraction of PFM may be affected by spine
Graph 2 :- Showing Pre and Post score of OswestryDisability Index in Group A and Group B
The Graph 1 showed that the mean difference inpain in patients who received PFM strengtheningexercises along with conventional therapy was3.8 + 0.96 whereas differences in pain at VAS in groupA was 2.867 + 0 .83 . This difference showed significantimprovement in reduction in pain as p < 0.05 withCI at 95%.
The Graph 2 showed that the mean difference inODI in patients who received PFM strengtheningexercises along with conventional therapy was19.73 + 3.58 whereas differences in ODI in group A
24. Manisha Rath-121-125.pmd 2/7/2013, 8:08 PM123

124 Indian Journal of Physiotherapy & Occupational Therapy. January-March 2013, Vol. 7, No. 1
position. Placing the lumbar spine in flexion orextension would change the length-tension propertiesof the abdominal muscles and may have an influenceon their response to PFM contraction. As Sapsford et al.(2001) highlighted that increase in TransverseAbdominals activity with PFM activity wassignificantly greater compared with External Obliqueand Rectus Abdominal in lumbar extension. It wassuggested that a neutral or extended lumbar spineposition is preferable for PFM exercise. In addition, thesefindings indicate that contraction of the PFM may beused to initiate contraction of the abdominal muscles.A RCTby Richardson et al., 1999 indicates that specifictraining of the Transverse Abdominals can assist withthe management of LBP. The results of their investigationrevealed that this could be best achieved by contractionof the PFM with the spine positioned in either a neutralor extended position. In the present study patients wereinstructed to perform PFM exercise in supine position (Neutral Position). This can results in improvement inLBP by strengthening transverse abdominals.
CONCLUSION
This study showed significant improvement inchronic low back pain in females after giving pelvicfloor strengthening exercises with conventional therapythan the conventional therapy alone.
LIMITATIONS
Objective outcome measures such as muscle activityand muscle thickness using EMG or ultrasound wasnot done. Also the measurement of pain intensity andfunctional disability was done in subjective way in thepresent study.
ACKNOWLEDGEMENT
The author acknowledges the Dr. D. Y. PatilVidyapeeth, Pimpri, Pune for financial support of thisstudy.
Conflict of interest
The authors declare no conflict of interest.
REFERENCES
1. Rubin DI. Epidemiology and risk factors for spinepain. Neurol Clin. 2007;25(2): 353-371.
2. Carey TS, Garrett J, Jackman A, McLaughlin C,Fryer J, Smucker DR. The out- comes and costs of
care for acute low back pain among patients seenby primary care practitioners, chiropractors, andorthopedic surgeons: the North Carolina Back PainProject. N Engl J Med. 1995;333(14):913-917.
3. van Tulder M, Koes B, Bombardier C. Low backpain. Best Pract Res Clin Rheumatol. 2002;16(5):761-775.
4. Richardson C, Jull G, Hodges P, Hides J.Therapeutic exercise for spinal segmentalstabilization in low back pain. ChurchillLivingstone, Edinburgh; 1999.
5. “Lower Back Pain Fact Sheet. nih.gov”.. Retrieved2008-06-16.
6. Bogduk M (2003). “Management of chronic lowback pain”. Medical Journal of Australia 180 (2):79–83.
7. Floyd, R., & Thompson, Clem. (2008). Manual ofstructural kinesiology. New York, NY: McGraw-Hill Humanities/Social Sciences/Languages.
8. Atlas SJ (2010). “Nonpharmacological treatmentfor low back pain”. Journal of Musculoskeletal
9. Eliasson K, Elfving B, Nordgren B, Mattsson E.Urinary incontinence in women with low backpain. Manual Therapy. June 2008;13(3):206-212.
10. Panjabi MM. The stabilizing system of the spine.Part 1. Function, dysfunction, adaptation andenhancement. Journal of Spinal Disorders1992;5:383–9.
11. Samuelsson EC, Victor AFT, Tibblin G, SvardsuddKF. Signs of genital prolapse in a Swedishpopulation of women 20 to 50 years of age andpossible related factors. American Journal ofObstetrics and Gynecology 1999;180:299–305.
12. Bergmark A. Stability of the lumbar spine. A studyin mechanical engineering. Acta OrthopaedicaScandinavia Supplement. 1989;230:1–54
13. Barr KP, Griggs M, Cadby T. Lumbar stabilization:core concepts and current literature, Part 1.American Journal of Physical Medicine andRehabilitation. 2005;84:473–480
14. Mikkonen P, Leino-Arjas P, Remes J, Zitting P,Taimela S, Karppinen J. Is smoking a risk factorfor low back pain in adolescents? A prospectivecohort study. Spine. 2008;33:527–532
15. Mirtz TA, Greene L. Is obesity a risk factor for lowback pain? An example of using the evidence toanswer a clinical question. Chiropractic andOsteopathy. 2005;13:2
16. Mohseni-Bandpei M, Fakhri M, Ahmad-Shirvani M, Bagheri Nessami M, Khalilian A,Shayesteh-Azar M, et al. Low back pain in 1100
24. Manisha Rath-121-125.pmd 2/7/2013, 8:08 PM124

Indian Journal of Physiotherapy & Occupational Therapy. January-March 2013, Vol. 7, No. 1 125
Iranian pregnant women: prevalence and riskfactors. Spine Journal. 2009;9:795–801
17. Hartvigsen J, Christensen K. Active lifestyleprotects against incident low back pain in seniors:a population based 2-year prospective study of1387 Danish twins aged 70–100 years. Spine.2007;32:76–81
18. Strine TW, Hootman JM. US national prevalenceand correlates of low back and neck pain amongadults. Arthritis and Rheumatism. 2007;57:656–665
19. Smith MD, Russell A, Hodges PW. Doincontinence, breathing difficulties, andgastrointestinal symptoms increase the risk offuture back pain?. The Journal of Pain.2009;10:876–886
20. Hodges PW, Sapsford R, Pengel L. Feedforwardactivity of the pelvic floor muscles precedes rapidupper limb movements. Australian PhysiotherapyAssociation Conference, Sydney; 2002,
21. J Laycock , D. Jerwood (2001) Pelvic Floor muscleassessment: The PERFECT Scheme,Physiotherapy December 2001, volume 87, no. 12
24. Manisha Rath-121-125.pmd 2/7/2013, 8:08 PM125

126 Indian Journal of Physiotherapy & Occupational Therapy. January-March 2013, Vol. 7, No. 1
Comparing Hold Relax - Proprioceptive NeuromuscularFacilitation and Static Stretching Techniques in
Management of Hamstring Tightness
Ali Ghanbari1, Maryam Ebrahimian2, Marzieh Mohamadi3, Alireza Najjar-Hasanpour4
1Rehabilitation School, Shiraz University of Medical Sciences, Iran, 2Rehabilitation School, Shiraz University of MedicalSciences, Iran, 3Rehabilitation School, Shiraz University of Medical Sciences, Iran, 4Student Research Committee,
Rehabilitation School, Shiraz University of Medical Sciences, Iran
ABSTRACT
Introduction: Hamstring tightness may result in several conditions of the knee and spine such asanterior knee pain and low back pain. Stretching is a preventive and therapeutic technique in thesesituations. The aim of this study is to compare the effectiveness of static stretching and hold-relax PNFon increasing the extensibility of hamstring muscles.
Method & material: 51 male subjects in the age range of 18 to 30 entered to the study and randomlyassigned to one of the three groups of static stretching, hold-relax PNF and control. The extensibility ofhamstring was assessed by Active Knee Extension Test (AKET). The treatments in both static stretchingand PNF groups were applied for six sessions during the study.
Findings: At the end of the treatment period, we found a significant difference in hamstring extensibilityamong the study groups. Hamstring extensibility was significantly larger in both treatment groupscompared to the control group (p<0.001). Moreover, the subjects in PNF group showed significantlygreater hamstring extensibility compared with the static-stretch group (p=0.015).
Conclusion: The present study suggests that hold relax - PNF is more effective than static stretching inincreasing the hamstring extensibility. Therefore, application of this technique and education of thatmay be more useful for either patients with hamstring contracture or athletes.
Keywords: Hamstring Extensibility, Static Stretching, Proprioceptive Neuromuscular Facilitation (PNF), HoldRelax
Corresponding author:Marzieh MohamadiRehabilitation School of Shiraz University of MedicalSciences, Abiverdi Street, Chamran Boulevard,Shiraz, Iran.Email: [email protected] No.: 987116271551, Fax: 98711627249
INTRODUCTION
The two-joint hamstring muscle group is the kneeflexor and hip extensor. The complete range of kneeflexion rarely occurs in activity daily living; thereforethe complete contraction and stretching of this musclegroup is rare. In this type of muscles, failure may beoccur under rapid and stressful situations(1).
Hamstring tightness may result in severalconditions of the knee and spine. The Resultant flexion
moment following hamstring tightness may causeanterior knee pain owing to excessive patellofemoralforces(1-2). Furthermore, decrement in rang of kneeextension may result in plantar fasciitis due toabnormal loading on forefoot(3). In patients withhamstring tightness, anterior pelvic tilt is decreasedduring trunk forward bending(4); therefore mobility inlumbar vertebrae would be increased(4), and lead to lowback pain(4-6). Because of these problems, it is importantto consider the length of the hamstring muscle group.
Stretching is a preventive and therapeutictechnique(7-8) which is applied musculotendinousstructures in order to change their length, improve jointrange of motion, reduce stiffness, improve performance,decrease risk of injuries, improve posture and promoterelaxation(8-10). There are different types of stretching
25. marzeih iran-126-130.pmd 2/7/2013, 8:08 PM126

Indian Journal of Physiotherapy & Occupational Therapy. January-March 2013, Vol. 7, No. 1 127
techniques including static, active, passive,proprioceptive neuromuscular facilitation (PNF) andballistic(7, 10-11). Static stretching is the most common formof stretching technique because of its safety,effectiveness and easy performance(10). PNF stretchinginvolves active muscle contraction and neuromuscularreflexes which decrease the resistance againststretching(10, 12).
In spite of many research studies performed on theissue of stretching, there are still disagreements aboutthe most effective and safe method, intensity, durationand frequency of stretching(10, 13). Several studies havefocused on comparing the different methods ofstretching. Some of these studies have found that PNFstretching and static stretching were equally effectivein improvement of muscle extensibility(7, 13-14). Othershave shown that PNF is more effective than staticstretching(9, 15). On the contrary, Davis et al reported thatstatic stretching is more effective(16).
The controversy around this issue was a motive forconducting the present study. One limitation of theprevious studies, comparing the different techniquesof stretching, was that the intervention was appliedonly for one Session. In this study, we aimed to comparethe effectiveness of several sessions of static stretchingand hold-relax PNF on increasing the extensibility ofhamstring muscles.
MATERIAL & METHOD
Subjects
We recruited a convenience sample of 51 malesubjects in the age range of 18 to 30, who were thestudents of a local university. Exclusion criteria weremusculoskeletal or neuromuscular disorders, a historyof fracture or dislocation in lower extremity and activeparticipation in sports or exercise activities thatrequired regular hamstring stretching. We definedactive participants as those who were involved inregular exercise activities in at least 2 sessions during aweek.
PROCEDURE
After signing a consent form, the subjects wererandomly assigned to one of the three groups of staticstretching, hold-relax PNF and control. At the beginningof the first session, the extensibility of hamstring wasassessed for every participant. We used Active Knee
Extension Test (AKET) for this purpose. The subject liedin supine position with his hip and knee in 90 degreeflexion and ankle in plantar flexion. Then, he was askedto extend his knee as far as he could and in this position,popliteal angle was measured by a goniometer. Tomeasure this angle, a long-arm goniometer was utilized.One arm was located on the line connected the greatertrochanter and the lateral femoral condyle.The otherarm was along the line from the lateral malleolus to thelateral condyle of tibia.
After the initial measurement, the subjects in eitherof the two intervention groups (i.e. static stretching andPNF groups) received the treatments as following:
Static stretching group
The subject was supine with his hip in 90 degree offlexion. Therapist passively extended the subject’s kneeup to a point where the subject reported a mild tomoderate stretching sensation without any pain. Thetherapist held this position for 30 seconds and thenrepeated the procedure three times with 10 seconds restbetween successive stretches.
PNF group
The subject was supine with his hip in 90 degree offlexion. The Therapist extended the subject’s knee untilthe subject felt a very mild stretching sensation in hishamstring muscles. Then, the therapist asked the subjectto flex his knee against the resistance applied by thetherapist’s hand. The subject was asked to use a forcearound 50% of his maximal strength. No movementwas allowed to occur in the knee joint so that anisometric form of contraction was gained in hamstringmuscles. The subject holds the contraction for 8 secondsand then, on the command of the therapist relaxed thehamstrings muscle. Immediately after the musclerelaxation the therapist stretched the hamstring musclesup to a point where the subject reported a mild tomoderate stretching sensation without any pain andhold this position for 30 seconds. The therapist repeatedthis procedure three times in every session.
The treatments in both static stretching and PNFgroups were applied for three sessions in one week withone day rest between two sessions. The treatmentscontinued for two successive weeks, and thus everysubject received 6 sessions of treatment during the study.At the end of the last session, the popliteal angle wasmeasured again in the similar way as that of the firstsession.
25. marzeih iran-126-130.pmd 2/7/2013, 8:08 PM127

128 Indian Journal of Physiotherapy & Occupational Therapy. January-March 2013, Vol. 7, No. 1
The subjects in the control group received notreatment during a two weeks period. At the end of thesecond week, the therapist measured the popliteal anglesimilar to what he did for the other two groups.
Statistical analysis
Due to non-normal distributions of the study data,we used Kruskal-wallis test with Bonferroni correctionto compare the hamstring extensibility among the threestudy groups.
FINDINGS
The mean age of the subjects and the mean angle ofknee extension at the baseline of the study werecompared by Kruskal-wallis and ANOVA tests (Table1).There were no significant differences between the threegroups in this regard. At the end of the treatment period,we found a significant difference in the angle of kneeextension among the study groups (Table2). A post hoctest using Mann-Whitney test with Bonferroni correctionshowed significant differences in pair wisecomparisons of the study groups. Since there were threepairs of comparison, the alpha level was set on 0.0167(á level =.05/3= .0167). The angle of knee extensionwas significantly larger in both treatment groupscompared to the control group (p<0.001). Moreover, thesubjects in PNF group showed significantly greaterangle compared with the static-stretch group (p=0.015).
Muscle, fascia, capsule and tendon are the primarylimiting factors of joint movement. Therefore, it isnecessary to consider the muscle spindle and Golgitendon organ in the ability of muscles to lengthen inresponse to stretch, as well as the passive structures.PNF stretching techniques focus on active componentsand static stretching address the passive componentswhich limit the range of motion(17).
In static stretching, the inverse myotatic reflex resultsin muscle relaxation and further stretch and range ofmotion. In hold relax – PNF, the neural inhibitionreduces reflex activity(13). An inhibitory interneuronreduces á-motoneuron activity of antagonist muscle(8)
which results in muscle relaxation and decreasedresistance to stretch(13).
Our study found that hold relax – PNF was moreeffective in increasing hamstring extensibility. Theprevious studies on this issue, have found no differencebetween these two methods of stretching(7). Thediscrepancy between our study and the previous onescould be explained by several issues. The subjects onour study were relatively young (i.e. 18-30), comparedto the Feland’s study which were on 55 to 79 years oldpeople. Feland et al, has stated that PNF stretching inthe younger patients is more effective than in older ones.This is due to the age-related neurophysiologic andmusculoskeletal changes such as motor neuron deathand increased collagen of the skeletal muscle, in olderpeople(13). In the O’Hora’s study that was on 21 to 35years old people, the results was similar to our study(15).
Another explanation for the disagreement betweenthis and the previous studies, could be that weperformed the intervention techniques in severalsessions, while, other studies used the techniques inonly one session(7-8, 13, 15). Probably, the effects of thestretching techniques have been accumulated duringthe six sessions of our study. We may propose that, ifthere is a real difference between the two techniques ofstretching, one session of treatment might not beenough in detecting that small difference. When thetreatment effects are accumulated during severalsessions, then, the difference between the twotechniques get larger and hence statistically significant.
The superiority of PNF technique on static stretchingobserved in our study may be due to the different effectsof these techniques on the blood flow of muscles(11, 18).The resultant muscle relaxation following PNFtechniques can cause changes in blood flow. PNFtechnique increase motor activity that can affectvascular function. The muscle activation may increase
Table1: The mean age of the subjects and the meanangle of knee extension at the baseline of the study.
Group PNF Static stretch control P.Value
number 17 17 17
Age 23.59±2.26 22.71±2.56 22.06±1.29 0.117
Angle ofknee extension 150.29±6.98 147.47±8.69 152.18±8.08 0.231
DISCUSSION
This study showed significant increases in thehamstring extensibility in both static stretching andhold relax – PNF technique groups in comparison withthe control group.
Table2: The comparison of the angle of knee extensionafter treatment among the study groups
Group Mean Median P.Valuedifference difference
PNF 4.59±1.94 5 <0.001
Static stretch 3±1.22 3
control 0±0.5 0
25. marzeih iran-126-130.pmd 2/7/2013, 8:08 PM128
Indian Journal of Physiotherapy & Occupational Therapy. January-March 2013, Vol. 7, No. 1 129
the release of vasoactive substances which results invascular dilation(18). On the other hand, the muscleextension due to static stretching decreases muscleblood flow(11, 19) because of two physical changes: 1)longitudinal extension of blood vessels with the muscleextension and 2) the increase of intramuscular pressureduring the stretching(19). Hyperactivity or hyperemiacan affects the muscular temperature(20). During theexercise, muscle temperature increase from 35 to 40degrees due to elevation in plasma ATP. The increasedtemperature of collagen will increase tissue elasticity(21).
CONCLUSION
The present study suggests that hold relax – PNF ismore effective than static stretching in increasing thehamstring extensibility. Therefore, application of thistechnique and education of that may be more useful foreither patients with hamstring contracture or athletes.
ACKNOWLEDGEMENT
This work was based on the dissertation of theAlireza Najar Hasanpour at Shiraz University ofMedical Sciences (SUMS), faculty of rehabilitationsciences. The authors are thankful to Miss YasamanKhademolhoseini and the Rehabilitation ResearchCenter staff. Financial support from the SUMS 88-4649grant made this research possible.
Conflict of Interest
The authors declare that there is no conflict of interest
REFERENCES
1. Morgan-Jones R, Cross T, Cross M. Hamstringinjuries. Critical Reviews in Physical andRehabilitation Medicine. 2000;12(4):277-82.
2. Piva SR, Goodnite EA, Childs JD. Strength aroundthe hip and flexibility of soft tissues in individualswith and without patellofemoral pain syndrome.J Orthop Sports Phys Ther. 2005;35(12):793-801.
3. Harty J, Soffe K, O’Toole G, Stephens MM, editors.The role of hamstring tightness in plantarfasciitis2004: JBJS (Br).
4. Norris CM. Back stability: integrating science andtherapy: Human Kinetics Publishers; 2008.
5. McGill S. Low back disorders: evidence-basedprevention and rehabilitation: Human KineticsPublishers; 2007.
6. Hoskins WT, Pollard HP. Successful managementof hamstring injuries in Australian Rulesfootballers: two case reports. Chiropr Osteopat.
2005;13(1):4.7. Puentedura EJ, Huijbregts PA, Celeste S, Edwards
D, In A, Landers MR, et al. Immediate effects ofquantified hamstring stretching: Hold-relaxproprioceptive neuromuscular facilitation versusstatic stretching. Physical Therapy in Sport. 2011.
8. Schuback B, Hooper J, Salisbury L. A comparisonof a self-stretch incorporating proprioceptiveneuromuscular facilitation components and atherapist-applied PNF-technique on hamstringflexibility. Physiotherapy. 2004;90(3):151-7.
9. Rashad AK, El-Agamy MI. Comparing TwoDifferent Methods of Stretching on ImprovementRange of Motion and Muscular Strength Rates.World. 2010;3(4):309-15.
10. Armiger P. Stretching for Functional Flexibility:Wolters Kluwer Health/Lippincott, Williams, &Wilkins; 2010.
11. Gremion G. The effect of stretching on sportsperformance and the risk of sports injury: a reviewof the literature. Schweiz Z Med Traumatol.2005;53(1):6-10.
12. Colby LA, Kisner C. Therapeutic Exercise:Foundations and Techniques. FA Davis; 2007.
13. Feland JB, Myrer J, Merrill R. Acute changes inhamstring flexibility: PNF versus static stretch insenior athletes* 1,* 2,* 3,* 4. Physical Therapy inSport. 2001;2(4):186-93.
14. Yuktasir B, Kaya F. Investigation into the long-termeffects of static and PNF stretching exercises onrange of motion and jump performance. Journalof Bodywork and movement therapies.2009;13(1):11-21.
15. O’Hora J, Cartwright A, Wade CD, Hough AD,Shum GLK. Efficacy of Static Stretching andProprioceptive Neuromuscular FacilitationStretch on Hamstrings Length After a SingleSession. The Journal of Strength & ConditioningResearch. 2011;25(6):1586.
16. Davis DS, Ashby PE, McCale KL, McQuain JA,Wine JM. The Effectiveness of 3StretchingTechniques on Hamstring Flexibility UsingConsistent Stretching Parameters. The Journal ofStrength & Conditioning Research. 2005;19(1):27-32.
17. Weng M-C, Lee C-L, Chen C-H, Hsu J-J, Lee W-D,Huang M-H, et al. Effects of Different StretchingTechniques on the Outcomes of Isokinetic Exercisein Patients with Knee Osteoarthritis. TheKaohsiung Journal of Medical Sciences. [doi:10.1016/S1607-551X(09)70521-2]. 2009;25(6):306-315.
25. marzeih iran-126-130.pmd 2/7/2013, 8:08 PM129

130 Indian Journal of Physiotherapy & Occupational Therapy. January-March 2013, Vol. 7, No. 1
18. Escobar-Hurtado C, Ramírez-Vélez R.Proprioceptive neuromuscular facilitation (PNF)and its impact on vascular function. ColombiaMédica. 2011;42(3):373-378.
19. Otsuki A, Fujita E, Ikegawa S, Kuno-MizumuraM. Muscle Oxygenation and Fascicle LengthDuring Passive Muscle Stretching in Ballet-Trained Subjects. International journal of sportsmedicine. 2011;32(07):496-502.
20. Barão VAR, Gallo AKG, Zuim PRJ, Garcia AR,Assunção WG. Effect of occlusal splint treatmenton the temperature of different muscles in patientswith TMD. Journal of Prosthodontic Research.2011;55(1):19-23.
21. Lounsberry NL. Therapeutic Heat: Effects ofSuperficial and Deep Heating Modalities onHamstring Flexibility the osprey journal of ideas& inquiry. 2008 All Volumes (2001-2008): 138.
25. marzeih iran-126-130.pmd 2/7/2013, 8:08 PM130

Indian Journal of Physiotherapy & Occupational Therapy. January-March 2013, Vol. 7, No. 1 131
Reliability and Feasibility of Community Balance andMobility Scale (CB&MS) in Elderly Population
NagaRaju1, Arun Maiya2, Manikandan3
1MPT, Department of Physiotherapy, Manipal College of Allied Health Sciences, Manipal, Karnataka,2Associate Dean and Head of Physiotherapy Department, Manipal College of Allied Health Sciences,
Manipal, Karnataka, 3Associate Professor, Department of Physiotherapy, Manipal College of Allied Health Sciences,Manipal, Karnataka
ABSTRACT
The objective was to determine the reliability and feasibility of Community Balance and Mobility Scale(CB&MS) as a screening instrument for identifying balance dysfunction in elderly population in anIndian situation. An observational study was conducted in community and old age homes residingelderly population, involving 33 elderly individuals aged 60 years and above, selected by conveniencesampling method. CB&MS and Computerized Static Posturography measures were used for assessment.Intraclass Correlation Coefficient and spearman's correlation coefficient were used for analysis. Resultsshowed high test-retest reliability (0.985) but no correlation with velocity moment measure ofComputerized Static Posturography. Our findings demonstrated that CB&MS is reliable and feasibleand hence could be applicable in the community for assessing balance and mobility of young oldelderly population.
Keywords: Test -Retest Reliability, Balance, Challenging Tasks, Community Setting.
INTRODUCTION
Ageing, in its broadest sense is the continuous andirreversible decline in the efficiency of variousphysiological processes2.The average life expectancyis around 60 years now and the way health care facilitiesare expanding with better income levels and access tomedicare, the life expectancy may rise between 70 and75 by 20208.India had the second largest number ofelderly (60+) in the world.The size of India’s elderlypopulation aged 60 and above is expected to increasefrom 77 million in 2001 to 179 million in 2031 and furtherto 301 million in 2051. The proportion is likely to reach12 per cent in 2031 and 17 per cent in 2051 17.
A decline in all the major systems for example,cardiovascular, metabolic, respiratory, andneuromuscular contributes to weakness, fatigue, andslowing of movement that have been the hallmarks ofaging14.
Older adults have impaired balance recovery due toan age-related decline in the ability to rapidly andefficiently contract the muscles of the lower extremities.These physiologic changes of normal aging mayincrease the risk of falls13.This led to increase in thenumber of older persons with disability9.
Among community-dwelling older people over 64years of age, 28-35% fall each year. Of those who are 70years and older, approximately 32%-42% fall each year.Older people who are living in nursing homes fall moreoften than those who are living in the community.Approximately 30-50% of people living in long termcare institutions fall each year, and 40% of themexperienced recurrent falls20. Balance disturbancesfrequently cause elderly people to seek medical adviceand admission to hospitals and residential homes3.
Although a number of procedures have beendescribed to assess balance, many of these techniquespresent difficulty in application due to cost, subjectivity,specificity of assessment or other problems6. In spite oflaboratory measures of balance offer greater precisionand potential to detect subtle or sub clinical balanceimpairments, Clinical and Functional tests of balance(static and dynamic) share the advantages of ease ofadministration, low cost and more directly interpretablefunctional relevance16.
Computerized Posturography is the gold standardtool to evaluate postural sway and quantify balance. Itis simple and efficient tool and offers technology for theobjective assessment and comprehensivedocumentation of postural control7. Amplitude and
26. Naga Raju--131-135.pmd 2/7/2013, 8:08 PM131

132 Indian Journal of Physiotherapy & Occupational Therapy. January-March 2013, Vol. 7, No. 1
velocity of anterior-posterior and medial-lateral swayduring standing in different positions are measuredusing Posturography. The general census is thatcomputerized measures have a greater precision andpotential to detect sub clinical balance impairments1.
Role of Posturography in elderly population to detectbalance impairments has gained importance in therecent years. However the balance measures wereassessed in clinical set up where the elderly individualdoes not encounter barriers that challenge his balanceabilities. This necessitates the assessment of balance incommunity environment.
CB&MS is a tool used to measure balance andmobility of individual in the community setting. Thescale has been used and found to be valid and reliablein high functioning patients with traumatic braininjury10. This scale has not been tested for its usefulnessin Indian elderly population and no literature isavailable to correlate this scale with the postural swaymeasures of Posturography. Our study aims to find thereliability and feasibility of CB&MS and its correlationwith postural sway measures using StaticPosturography.
MATERIAL AND METHOD
An observational study with convenience samplingmethod was conducted at department of Physiotherapy,MCOAHS, Manipal, India. The sample size for thestudy was estimated from the previous existing study,consisted of 33 (20 males and 13 females) elderlypersons aged above 60 years and were able tounderstand and follow commands. Subjects who hadacute illness on the day of assessment, foot ulcers, acutelabyrinthine disorders, functional hearing & visualdeficits, cognitive impairments and non-cooperativeparticipants were excluded from the study.
PROCEDURE
The study protocol was presented and approvalwas obtained to conduct the study by the ethicalcommittee of Manipal University. Elderly subjects inthe age group of 60 years and above were identifiedfrom the community and old age homes after whichthey were screened for inclusion and exclusion criteria.The selected subjects were explained about the studyand informed consent was obtained for theirparticipation. The subjects were assessed for thefollowing measures as explained below.
Community Balance and Mobility Scale (CB&MS)
An 8 meter track with duct tape was made which isof 5cm width on the floor with a perpendicular startline and finish line. Markings done at 1m, 2m, 4m and
6m with a tape perpendicularly. A 40cm bare spot wasplaced for item 3 and 4 after 6m mark. The visual targetfor items 8 and 11 was placed at the 4m mark, atindividual’s eye level and 1m from the outside edge ofthe track. Individuals were advised to wear comfortableclothes. All items (total 13) were scored in the first trailafter explaining each one task and ensuring rest periodsin between tasks as required.
The set up resembles as
Initial evaluation using CB&MS was done andrevaluation was done after a period of one week fordetermining the test –retest reliability.
Postural sway amplitude and velocity
After measuring the height, weight and age, subjectswere instructed to stand with normal base of supporton the force platform of Posturography machine witharms folded in front of chest. Subjects were instructedto stand relaxed on force platform, bare foot, with thehead in a straight head position. They were asked tofocus on specific point (2 m distance) at their eye levelduring eyes open conditions and the timer is started.After 30 seconds, the timer is stopped and the subject isrested for two minutes.
The same procedure is repeated with subjectstanding with normal base- eye closed for 30 seconds,tandem stance –the heel of one foot touches great toe ofother foot, the foot position according to convenience ofpatient (eyes open and eyes closed) and both right andleft single leg stance while opposite leg flexed at kneefor 20 seconds. Two minutes of rest was given inbetween each position. The subjects who did not standfor 30 seconds in normal stance eyes open and eyesclosed and 20 seconds in remaining testing positionseven after two trials, the test is stopped and noted downas unable to test. After all the testing positions weredone, velocity moment noted down from the computer.These readings were used to correlate with CB&MS andTinetti POMA balance subscale measures.
Data analysis
Data was analyzed using SPSS version 16.Test retestreliability of CB&MS was analyzed using IntraclassCorrelation Coefficient. Concurrent validity of CB&MSwith posturography measure (Velocity Moment) was
26. Naga Raju--131-135.pmd 2/7/2013, 8:08 PM132

Indian Journal of Physiotherapy & Occupational Therapy. January-March 2013, Vol. 7, No. 1 133
analyzed using Spearman’s correlation coefficient. Thelevel of significance was kept at P value less than orequal to 0.05.
RESULTS
Descriptive statistic on the anthropometrics data,balance subscale of Tinetti POMA and CB&MS totalscores of the study subjects is shown in table 1.
Table 1: Demographic characteristics, median CB&MSand POMA scores of elderly subjects (n=33)
Variables Male Female
Gender 20 13
Age in years (Mean + SD) 66.25+7.25 68.00+5.68
Height in cms (Mean + SD) 164.58+ 5.44 149.89+ 4.32
Weight in kgs (Mean + SD) 60.03+ 11.61 51.07+7.26
CB&MS score(Median , IQR) 50.50 (43.25+57.00) 40.00 (34.50+46.00)
Balance subscaleof Tinetti POMA 16(16+16) 16(16+16)
Above table suggests that study group populationconsist predominately males, scored higher in CB&MSthan females. It also shows all the all subjects scoredfull on the balance subscale of Tinetti POMA.
Phase1: Test-retest reliability of CB&MS
Table 2: Intra-class correlation coefficient (ICC) valuesfor test –retest CB&MS in elderly subjects (n=33).
Item No Item name ICC value
I Unilateral stance right 0.871
Unilateral stance left 0.910
II Tandem walking 0.994
III 1800Tandem pivot 0.960
IV Lateral foot scooting :Right 0.981
Lateral foot scooting :Left 0.953
V Hopping forward: Right 0.976
Hopping forward: Left 0.960
VI Crouch and walk 0.959
VII Lateral dodging 0.934
VIII Walking& looking :Right 0.939
Walking& looking :Left 0.969
IX Running and controlled stop 0.860
X Forward to back ward walking 0.944
XI Walk ,look & carry: Right 0.983
Walk ,look & carry: Left 0.981
XII Descending stairs 0.889
XIII Step ups × 1 step: Right 1.000
Step ups × 1 step: Left 0.973
Total 0.985score
Above table shows high test-retest reliability of bothtotal score and individual items.
Phase 2: Correlation of CB&MS total score withposturography velocity moment in different positions
Table 3: Correlation of CB&MS total score withposturography velocity moment in different positions
Posturography Correlation p valueconditions with
CB&MSr value
Normal stance eyes open(NSEO) 0.078 0.672
Normal stance eyes closed(NSEC) -0.033 0.859
Tandem stance eyes open(TSEO) -0.092 0.617
Tandem stance eyes closed(TSEC) 0.307 0.087
Single leg stance Rt eyes open(SL rt EO) 0.556 0.001
Single leg stance Lt eyes open(SL lt EO) 0.049 0.791
Single led stance Rt eyes closed(SL rt EC) 0.308 0.086
Above table displays significant low positivecorrelation of CB&MS total score with posturographysingle leg stance right side in eyes open condition. Inaddition to that it also shows negative correlation withnormal stance eyes closed and tandem stance eyes openbut not statistically significant.
Table 4: Correlation of individual items of CB&MSwith posturography velocity moment
Item Item Posturography r value P valueNo name conditions
I Unilateral stance (Left) SL lt EO 0.406 0.021
III 180 Tandem pivot SL rt EO 0.500 0.004
IV Lateral foot scooting (Left ) SL rt EO 0.542 0.001
V Hopping forward NSEC -0.423 0.016
SL rt EO 0387 0.029
VI Crouch and walk SL rt EO 0.492 0.004
IX Running with controlled stop SL rt EO 0.389 0.028
Table shows significant positive correlation ofindividual item of CB&MS with posturography velocitymoment except hopping forward with normal stanceeyes closed showed negative correlation.
DISCUSSION
The study participants were young-old with fullscore in Tinetti POMA balance subscale, which impliesparticipants were highly functional. Males scoredsignificantly higher in CB&MS than females.
Our phase 1 results showed high test-retestreliability of CB&MS in elderly subjects suggesting thatit could be a reliable tool to assess balance and mobilityfunction in them. CB&MS is simple and feasible test as
26. Naga Raju--131-135.pmd 2/7/2013, 8:08 PM133

134 Indian Journal of Physiotherapy & Occupational Therapy. January-March 2013, Vol. 7, No. 1
it does not require any special equipment to beperformed in the community setting. Uneven surfacesin community could be utilized since people wouldhave accommodated to that specific environment. Thisalso leads to evaluation in actual real life setting insteadof clinical setting. All subjects completed the test withoutany adverse events and hence it is safe to be used inyoung old elderly population.
CB&MS has items which represents the underlyingmotor skills necessary for function within thecommunity. For example Single leg stance is necessaryduring stance phase of gait cycle and for publictransportation.,etc.
In spite of being healthy elders, subjects could notattain full score in CB&MS. A number of factors couldhave contributed to the decrease in successfulperformance and not attaining full score in CB&MS.First, the tasks were challenging as certain items aretime scored, in which (item no I-right and left, VI, VII-right and left, IX,X,XI-right and left ,XIII-right and left)they have to complete the tasks within the time limit inorder to attain full score. Second, the complexity of taskswhich include hopping forward, crouch and walk,running with controlled stop, and lateral dodgingwhich requires good strength ,balance andcoordination. These observations were supported byearlier study done by Scott J.Butcher et al 2004. Althoughnot tested in this study, the fact that women tend tohave lower muscle strength than men15 could explaintheir lower performance on these items in the 60 to 72year age category (table1). Slow speed of performance,particularly for item 7(lateral dodging), could also beattributed to slowness in reaction time with increasingage5. A decrease in speed has previously been attributedto age-related reduction in muscle fibre size, particularlyin type II fibres, which are primarily responsible forspeed of movement 20.
We observed that the subjects were motivated,enthusiastic and enjoyed the part of the test, whichcould be due to dynamic and challenging tasksinvolved in the scale. This might be the reason foradherence to retest evaluation of our study except nineparticipants who could not attend the retest due topersonnel problems.
The average time taken to complete the testadministration was approximately 30 minutes.This ismore compared to other assessment measures in elderlywhich could be explained by the progressive difficultyin task items. Some of the items were scored based onduration, which requires the subject to complete the
minimum time of 45 seconds (SLS).Some items need tobe performed four (Lateral dodging) or five (Step ups)times and walk for seven consecutive steps (tandemwalking) which further increased the assessment time.Rest periods given in between tasks could also haveincreased the test duration.
In our phase results, we did not find any correlationbetween items of CB&MS and Posturography measureswhich could be explained by the difference inmeasurement surface, environment and non-familiarization of Posturography. Posturographymeasures were taken on force platform in well designedand organized laboratory setting as against to CB&MSwhich was performed in real setting.
Poor correlation between CB&MS andPosturography could also be attributed to the differentcomponents of balance being assessed by two tests, thatis Posturography measures static balance while,CB&MS measures dynamic balance and mobility tasks.
LIMITATION
Our results were restricted to young-old elderlypopulation and hence cannot be generalized to old-old. However, we would like to recommend furtherstudies to test the feasibility of CB& MS in old-oldsubjects.
CONCLUSION
CB&MS showed excellent test –retest reliabilityhence it could be feasible in the community for assessingbalance and mobility of young-old elderly population.
REFERENCES
1. Alan H Feiveson , E Jeffrey Metter ,Williams HPaloski .member IEEE (2003). A statistical modelfor inter predating computerized dynamicposturography data.IEEE transactions onBiomedical Engineering.Vol49, no 4. 300-309.
2. Balcombe NR, Sinclair A (2001). Ageing:definitions, mechanisms and the magnitude of theproblem. Best Pract Res Clin Gastroenterol. 15:835-849.
3. Bischoff ,Hannes B.Stahelin et al(2003).Identify acut off point for normal mobility. A comparison ofthe timed ‘U…....,Age and aging .32;3;proquestmedical library pg 315.
4. Faber MJ, Bosscher RJ, vanWieringen PCW (2006).Clinimetric properties of the Performance-Oriented Mobility Assessment.Phys Ther.86:944–954.
26. Naga Raju--131-135.pmd 2/7/2013, 8:08 PM134

Indian Journal of Physiotherapy & Occupational Therapy. January-March 2013, Vol. 7, No. 1 135
5. Fozard JL, Vercruyssen M, Reynolds SL, HancockPA, Quilter RE(1994).Age differences and changesin reaction time; Baltimore Longitudinal Study ofAging. J Gerontol.49;P179-89.
6. Gary Kamen ,Carylon pattern ; C. DFuke Du;Steven sison(1998) :An accelerometry basedsystem for the assessment of balance and posturalsway. Gerontology . 44, 1; proquest medical library;pp.40.
7. Goidie PA.Bach TM Evans OM (1982) :Forceplatform measures evaluating postural control:reliability and validity. APMR.70;510-517.
8. Governance in India: vision 2020.9. Harada N.W, Chiu V , Damron –Rodriquez J, et al
(1995) .screening for balance and mobilityimpairment in elderly individuals living inresidential care facilities. Phys Ther .75:462-469.
10. Howe JA, EL Inness, A Venturini J I Williams andMC Verrier (2006): The community balance andmobility scale – a balance measure for individualswith traumatic brain injury, the clinicalrehabilitation.20; 885.
11. Inui N (1997). Simple reaction times and timing ofserial reactions of middle-aged and old men.Percept Mot Skills.84; 219-25.
12. Kauranen K, Vanharanta H (1996): Influences ofaging, gender, and handedness on motorperformance of upper and lowerextremities.Percept Mot Skills.82; 515-25.
13. Maki BE, McIlroy WE(1996). Postural control inthe older adult. Clin Geriatr Med Nov.12(4):635–658.
14. Payton OD, Poland JL (1983): Aging process:Implications for clinical practice. PhysTher. 63: 41–48.
15. Pincivero DM, Goelho AJ, Campy RM (2003). Kneefiexor torque and perceived exertion; a gender andreliability analysis. Med Sci Sports Exerc.35;1720-1726.
16. Sadashiv Ram Aggarwal, Deepak Kumar (2006):Lower extremity muscle strength and balanceperformance in Indian community dwellingelderly men aged 50 years and above; IndianJournal of Physiotherapy and OccupationalTherapy. Vol. 0, No. 0
17. The 2001 census: Aging population of India –ananalysis of the 2001 census data.
18. Tinetti, M.E(1987). Factors associated with seriousinjury during falls by ambulatory n u r s i n ghome residents. J Am Geriatr Soc. 35(7): p. 644-8.
19. Tinetti,M,et al (1988):Identifying mobilitydysfunction in elderly patients :standardneuromuscular examination or direct assessment.JAMA .259:119.
20. Vandervoort A (2002). Aging of the humanneuromuscular system. Muscle Nerve .25; 17-25.
26. Naga Raju--131-135.pmd 2/7/2013, 8:08 PM135

136 Indian Journal of Physiotherapy & Occupational Therapy. January-March 2013, Vol. 7, No. 1
Core Stability Training with Conventional BalanceTraining Improves Dynamic Balance in
Progressive Degenerative Cerebellar Ataxia
Khan Neha Tabbassum1, Nayeem-U-Zia2, Harpreet Singh Sachdev3, Suman K4
1Student (M.P.T Neurology), Dept. of Rehabilitation Sciences, Hamdard University, New Delhi, 2Lecturer, Dept. ofRehabilitation Sciences, Jamia Hamdard, New Delhi, 3Consultant physiotherapist, Neurology Dept.,
A.I.I.M.S., New Delhi, 4Co- Guide, Associate Professor, Neurology Dept., IHBAS hospital, New Delhi
ABSTRACT
Background and Purpose: Disorder of balance and gait is the commonest feature found in Cerebellarataxia patients. Purpose was to see the effect of Core stability training along with balance training ondynamic balance in progressive degenerative Cerebellar Ataxia.
Methods: 20 subjects of progressive Degenerative condition (18 SCA subjects and 2 olivopontocerebellaratrophy) were systematically assigned in two groups, group A (n=10) in core and balance training andgroup B (n=10) in balance and relaxation training. Treatment was given 1 hour per session for eachgroup, 3 days a week for 4 weeks. The outcomes of the study were measured by Balance EvaluationSystem Test (BESTest) and Modified falls efficacy scale (MFES).
Results: Core stability training group showed significant improvement on BESTest at follow upcompared to conventional balance training group. There was no statistical difference found in theMFEscale among the two groups but the results were clinically significant till follow up for core stabilitytraining group.
Conclusion: Core stability training can be included as an adjunct to conventional balance training inimproving dynamic balance in patients with progressive degenerative Cerebellar ataxia.
Keywords: Cerebellar Ataxia, Core Stability Training, Dynamic Balance, Falls
INTRODUCTION
Cerebellar ataxia indicates dysfunction of thecerebellum. Ataxia literally means ‘without order’. Theterm ataxia refers mainly to inaccuracy of movementtowards a target, to rhythmic limb movements eitherduring a sustained posture or when the patient attemptsto reach a target, inability to perform smooth alternatemovements and loss of coordination of muscle groupsin multi joint movements.1
Patients with degenerative cerebellar lesions showglobal impairment of balance with greater instabilityin anterior- posterior direction than medio- lateraldirections.2, 3 important factor contributing to instabilityis decreased knee and ankle flexion when tested throughperturbations 3. Individuals with cerebellar ataxia showmore co-contraction modes of muscles resulting instiffness of muscles of major joints e.g. knee stiffnessand result in impaired coordination during feedbackand feed forward postural control4Studies revealcerebellar gait ataxia is more related to balance deficitsthan voluntary leg coordination deficits.5
Systems approach describes, dynamic balance is aresult of interaction of the individual, task &environment. Ankle, hip, suspensory and steppingstrategies keep centre of gravity over the base of support,anticipatory postural adjustments occur before theactual disturbance, volitional postural movements areunder conscious control are the motor components ofbalance that support postural orientation & automaticpostural reactions.6
The muscles stabilizing lumbar spine form the coremuscles. This muscular control is required aroundlumbar spine to maintain functional stability.7 Corestability is defined as the ability of the lumbopelvic-hip complex to prevent buckling of the vertebral columnand return it to equilibrium following perturbation.8
Core stability (spinal stabilization)techniquesincorporated in Low Back Pain subjects have found toimprove the stability of spine by improving the co-contraction of trunk muscles, recovery in the size ofmultifidus muscle, also resulted in motor learning byretaining appropriate coordination of deep and
27. Neha Tabussam--136-140.pmd 2/7/2013, 8:08 PM136

Indian Journal of Physiotherapy & Occupational Therapy. January-March 2013, Vol. 7, No. 1 137
superficial muscles for gaining spinal stability9,10,11.Core strengthening improves dynamic postural controlin rehabilitation of athletic injury.12
The purpose of this study was to determine whetherthe addition of Core stability training to conventionalbalance training in patients with Progressivedegenerative cerebellar ataxia has any benefit ondynamic balance as compared with conventionalbalance training alone. Dynamic balance is a problemin patients with Progressive Degenerative CerebellarAtaxia. The trunk muscles form the basis of core whichacts as the powerhouse for force production and co-ordinated limb movements during locomotion.13 CoreStability training it is aimed to create awareness ofmuscle contractions around the spine which haveeventually weakened due to chronic nature of disease.2,3
Also in progressive degenerative Cerebellar Ataxia thesynergies required for maintaining Dynamic Balanceare altered.4 The synergies can be strengthened throughtraining of Core muscles.14 If the study reveals positiveeffects of core stability training on dynamic balance,treatment protocols can be developed to improvedynamic balance with ease in every clinical setting.
METHOD
A sample of 20 subjects with progressivedegenerative Cerebellar ataxia (18 subjects were SCAand 2 were olivopontocerebellar atrophy) participatedin the study. Out of 20, 15 were male whereas 5 werefemale. 18 subjects suffered from SCA’s (type 1, 2, 3)and two from olivo-ponto cerebellar atrophy. A sampleof convenience was taken.
Subjects in group A were treated with core stabilitytraining which included back stabilization exercises,single leg slides, leg loading, facilitation of Transversusabdominis, bridging, Pelvic floor exercises anddiaphragmatic Breathing while balance trainingincluded turning, walking sideways, heel to toewalking, sit to stand, heel lifts, toe lifts, single legstanding ,leg swings, stair climbing. Subjects in GroupB treated with balance training and relaxationtraining15, 16,17,18,19 at Institute of Human Behaviour andAllied Sciences Hospital, Delhi.
Subjects with Progressive degenerative ataxia ofcerebellar origin diagnosed by neurologist, age rangefrom 18-50, MMSE score e” 24,Chronic cases havingsymptoms more than a year, SARA score 15-23,20
Subjects should be able to walk minimum distance of10 meters with or without walking aid were includedin the study.20
Subjects diagnosed as Afferent/ sensory ataxia, anyother neurological or orthopaedic disorder affecting gaitor balance, severe Low back pain, Already undergoing
physiotherapy intervention for last 3 months,Uncorrectable visual or hearing loss, Subjects unwillingto follow the exercise regime were excluded. It was aprospective repeated measure experimental groupdesign. Instrument used for exercise regime waspressure biofeedback device16, 21 (Chattanooga group).A duly signed consent form was obtained from thesubjects. A detailed assessment of every subject wasdone using neurological evaluation form. All thesubjects were assessed for inclusion and exclusioncriteria. The mini mental status examination was done.Demographic data of the subjects were collected.Subjects were assigned systematically into two groups– group A experimental and group B conventionaltreatment groups.
The treatment sessions for both the groups weregiven for 1 hour per day, 3 times per week for 4 weeksThe performance of the two groups was examined onthe following scales: Dynamic Balance was tested onBalance Evaluation System Test(BESTest)22 and for fearof Falls Modified Falls efficacy scale (MFES) 23wasused..The outcomes were taken 3 times during treatmentfirst before treatment, second immediately after the 4weeks of treatment and third after a month’s follow up.The treatment was given n the physiotherapydepartment of the IHBAS hospital. The study wasreviewed by the ethical board of Jamia HamdardUniversity, New Delhi.
DATA ANALYSIS
The data was analysed using SPSS software version15. Independent T-test was used to see the differencebetween the effects training between group A andB.Effectiveness of treatment within the groups wasmeasured using repeated measure ANOVA. The resultswere checked at P<0.05 level of significance.
RESULTS
The change in the Dynamic Balance and Fear of fallswas measured at three levels of the treatment phases,initially at pre treatment, then post treatment and lastat follow up
BETWEEN GROUP
The Mean ± SD values for BESTest in experimentalgroup after 1 month of treatment was 63.50 ± 15.757and conventional group was 50.00 ± 11.981.Thisdifference in values was statistically significant p=0.045.The Mean ± SD values for experimental group from preintervention to Follow Up was 55.60 ± 17.602 the resultwas statistically significant (P=0.024) and conventionalgroup was 40.10 ± 9.327.This difference in values wasstatistically significant (p=0.024), indicating that the
27. Neha Tabussam--136-140.pmd 2/7/2013, 8:08 PM137

138 Indian Journal of Physiotherapy & Occupational Therapy. January-March 2013, Vol. 7, No. 1
experimental group showed more improvement inBalance than the conventional group. Although therewas no statistically significant improvement in thescores at post treatment (p=0.433) and at follow up(p=0.154) after treatment.
Table. 1.1 Comparison between pre, post and followup scores of experimental and conventional groups on
BESTest scale
Dependent Experimental Conventional P valuevariables Mean ± SD Mean ± SD
Pre BESTest total 35.60 ± 12.616 38.10 ± 10.503 0.636
Post BESTest total 63.50 ± 15.757 50.00 ± 11.981 0.045*
Follow up BESTest total 55.60 ± 17.602 40.10 ± 9.327 0.024*
Table 1.2 Comparison between pre, post and follow upscores of experimental and conventional groups on
MFE Scale
Dependent Expt Conv P valuevariables Mean ± SD Mean ± SD
Pre MFES 52.80 ± 20.137 59.10 ± 14.395 0.431
Post MFES 77.80 ± 30.724 68.80 ± 17.725 0.433
Follow Up MFES 78.50 ± 32.857 59.90 ± 21.957 0.154
DISCUSSION
The key findings that emerged from the study werethat core stability training is effective in improvingDynamic balance in progressive degenerative cerebellarataxia. Core stability training group showed significantimprovement on BESTest till follow up compared toconventional balance training group. There was nostatistical difference found in the MFEscale among thetwo groups but the results were clinically significant atfollow up for core stability training group.
Liebenson found trunk stabilization exercisesresulted in reduction of low back pain, by increasingthe kinaesthetic awareness necessary to maintain safeneutral spine which is ideal for rehabilitation.24 NicoleL et al. studied on dynamic balance testing amongyoung healthy adults and found that core strengtheningimproves dynamic postural control duringrehabilitation of athletic injury.12 The diaphragm servesas the roof of the core; stability is augmented on thelumbar spine by contraction of diaphragm andincreasing intraabdominal pressure.13 Pelvic floormusculature is co activated with the Transversusabdominis contraction.13
The results found this study are supported by thework of Paul W. Hodges which provided the rationaleof core stability training, that stability of spine dependson both the muscle activation and CNS control.14 Thecore stability training results in motor learningsequentially through skill learning, precision training,activation in variety of contexts, integration of skills
into tasks that includes coordination of deep andsuperficial trunk muscles is maintained in functionalcontext balance.14 Konin JG et al. al described diagonalorientation of core muscles resemble a serape,producing a serape effect connecting the stability forupper and lower extremities and maintaining muscularcontrol around the spine and maintaining functionalstability.25
In this study the pressure biofeedback was used forcore training including abdominal hollowing a basicexercise taught initially and then hollowing associatedwith lower limb movements. It activated TransversusAbdominis (TrA) muscle, which is important muscleforming core.26 It is found that the patient with cerebellarataxia uses restricted synergies i.e. stiffening of pelvis,knees, and ankles during challenging tasks.27 It has alsobeen found that practice could lead to transition fromco-contraction to reciprocal patterns on the basis ofuncontrolled manifold (UCM) hypothesis.28 This studyincluded patients with chronic progressive disease, asabove study mentioned that these patients use restrictedsynergies to maintain balance. Practice of core trainingalong with lower limb activities provided in this studymight have helped patients to develop reciprocal musclepattern rather than the stiffening of the joints.28 resultingin reduction of synergies and their strengthening whichare essential for dynamic balance control.28
The rationale behind the fact that patients did notreturn to pre treatment level or their condition did notdecline due to progression of disease, is that the naturalprogression of degeneration in Cerebellar ataxia is 0.6-2.5 points 1 year as found on SARA scale depending ongenotypes (data of EUROSCA natural history. ThomasKlockgether, 2008).5 Long term effects of intensiveexercise training have been proven in research onprogressive degenerative cerebellar disease even aftera year of training.29
There was no statistical significance in improvementof the falls score at post treatment (p=0.433) and atfollow up (p=0.154).However experimental groupshowed clinical improvement in falls score. Whenbaselines (fig.1.2) were compared for both the groups itcan be observed that the difference for improvementwas more in Experimental group than the conventionalgroup.
The results obtained may be attributed to the 1)gender differences, in experimental group there were 3females and conventional group there were 2 females,because the females were seen to have less confidencethan males of same severity.23, 30 2) Considering agedifferences, in conventional group 3 patients were ofage 45years and above, while in experimental there were4 patients having age 45years and above. 3) Considering
27. Neha Tabussam--136-140.pmd 2/7/2013, 8:08 PM138

Indian Journal of Physiotherapy & Occupational Therapy. January-March 2013, Vol. 7, No. 1 139
disease severity, in conventional group 4 subjects wereabove 16 scoring of SARA scale, while in experimentalthere were 5 subjects scoring more than 16. The abovefactors may be the possible causes of difference of MFEsscore at pre treatment level that led to no statisticalsignificance even though the experimental groupimproved more than conventional group.
CONCLUSION
The results obtained show that the core stabilitytraining improves dynamic balance. However it wasseen that although there was clinical improvement ofscores on MFEScale, but no statistical significance wasobserved. Thus it is concluded that in rehabilitation ofdynamic balance in patients with progressive Cerebellarataxia, core stabilization programme can be includedas an adjunct to conventional balance training.
LIMITATIONS OF STUDY
1. The subjects included in this study were moderatelydisabled (rated on SARA scale). The results of thisstudy cannot be generalized to severely disabledpatients.
2. Scale for measurement of fear of falls taken wassubjective.
3. The sample size was smaller.
ACKNOWLEDGEMENTS
Sincere thanks to Physiotherapy Dept. IHBAS, JamiaHamdard, New Delhi.
REFERENCES
1. M.Halliet.Hand book of ClinicalNeurophysiology.Elsevier2003; 1: 498.
2. Ganesan Mohan, Pramod Kumar Pal,Kumar R.Sendhil, Kandavel Thennarasu, B.R. Usha.Quantitative evaluation of balance in patients withspinocerebellar ataxia type 1: A case control study.Parkinsonism and Related Disorders 2009; 15:435–439.
3. Maaike Bakker, John H.J. Allum, Jasper E. Visser,Christian Grüneberg, Bart P. van de Warrenburg,Berry H.P. Kremer, et al. Postural responses tomultidirectional stance perturbations in cerebellarataxia. Experimental Neurology 2006; 202: 21–35.
4. Asaka T, Wang Y, Fukushima J, Latash ML.Learning effects on muscle modes and multi-modepostural synergies. Exp Brain Res. 2008 Jan;184(3):323-38.
5. Susanne M.Morton, AmyJ.Bastain. Relativecontributions of balance and voluntary leg-
coordination deficits to cerebellar gait ataxia. J.Neurophysiol 2003;89:1844-1856
6. Darcy Ann Umphred PT PhDFAPTA.Neurological Rehabilitation. 5th Ed.
7. DeLisa, Joel A.; Gans, Bruce M.; Walsh, Nicolas E.;Bockenek et al. Physical Medicine &Rehabilitation: Principles and Practice, 4th EditionLippincott Williams & Wilkins2005
8. John D. Willson, MSPT, Christopher P. Dougherty,DO, Mary Lloyd Ireland, MD, and Irene Mc ClayDavis, PhD, PT Volume 13,. J Am Acad OrthopSurg 2005;13:316- 325.
9. Gardner-Morse MG, Stokes IA. The effects ofabdominal muscle co activation on lumbar spinestability. Spine (Phila Pa 1976). 1998 Jan 1;23(1):86-91.
10. Libenson.C Spinal stabilization training. Journalof bodywork and movement therapy 1997; 1(2):87-90.
11. Danneels LA, Vanderstraeten GG, Cambier DC,Witvrouw EE, Bourgois J, Dankaerts W et al.. Effectsof three different training modalities on the crosssectional area of the lumbar multifidus muscle inpatients with chronic low back pain. Br J SportsMed. 2001 Jun; 35(3):186-91.
12. JNicole L. Kahle, BS; Phillip A. Gribble. CoreStability Training in Dynamic Balance TestingAmong Young, Healthy Adults. Athletic Training& Sports Health Care 2009; 1(2):
13. Akuthota V, Nadler SF. Core strengthening. ArchPhys Med Rehabil 2004; 85(3 Suppl1):S86-92.
14. Hodges PW. Core stabilization exercises inChronic Low Back Pain. Orthopaedic Clinics ofNorth America2003; 34:245-254Mario-UbaldoManto, Massimo Pandolfo. The Cerebellum andits disorders. Cambridge 2002.
15. Jull GA, Richardson C, Toppenberg R, ComerfordM and Bui B: Towards a measurement of activemuscle control for lumbar stabilization. Australianjournal of physiotherapy 1993;39: 187-193
16. Richardson C, Jull G, Toppenberg R, ComerfordM. Techniques of active lumbar stabilization forspinal protection: A pilot study. Australian Journalof Physiotherapy 1992; 38(2): 105-112
17. Clinical sports medicine 3 Ed; Mc Graw HillProfessional. Brukner and Khan.
18. Shirley Sahrmann. Treatment and Diagnosis ofMovement Impairment Syndromes, Mosby,
19. Zampieri C, Di Fabio RP. Balance and eyemovement training to improve gait in people withprogressive supranuclear palsy: quasirandomizedclinical trial. Phys Ther. 2008;88:1460–1473
20. Ilg W, Synofzik M, Brötz D, Burkard S, Giese MA,Schöls L. Intensive coordinative training improvesmotor performance in degenerative cerebellardisease. Neurology. 2009 Dec 1; 73(22):1823-30.
27. Neha Tabussam--136-140.pmd 2/7/2013, 8:08 PM139

140 Indian Journal of Physiotherapy & Occupational Therapy. January-March 2013, Vol. 7, No. 1
21. Sullivan.P, Towmey.L, Allison.G. Alteredabdominal muscle recruitment in patients withchronic low back pain following a specific exerciseintervention. Journal of Sports Physical Therapy,1998; 27(2):114-124.
22. Horak FB, Wrisley DM, Frank J.The BalanceEvaluation Systems Test (BESTest) to differentiatebalance deficits. Phys Ther. 2009 May; 89(5):484-98.
23. Hill KD, Schwarz JA, Kalogeropoulos AJ, GibsonSJ. Fear of falling revisited. Arch Phys Med Rehabil.1996 Oct; 77(10):1025-9.
24. C. Libenson. Spinal stabilization training. Journalof bodywork and movement therapy 1997; 1(2):87-90.
25. Konin JG, Beil N, Werner G. Functionalrehabilitation. Facilitating the serape effect toenhance extremity force production. AthlTherToday 2003;8:54-6
26. Carolyn Richardson, Gwendolen Jull, Rowena
Toppenber, Mark Comerford. Techniques of activelumbar stabilization for spinal protection: A pilotstudy. Australian Journal of Physiotherapy 1992;38(2): 105-112
27. Tadayoshi Asaka, Yun Wang. Feed forwardpostural muscle modes and multi-modecoordination in mild cerebellar ataxia. Exp BrainRes 2011; 210:153-163.
28. Tadayoshi Asaka, Yun Wang, E, JunkoFukushima, E Mark, L. Latash. Learning effectson muscle modes and multi- mode posturalsynergies. Exp Brain Res 2008; 184:323-338.
29. Winfried Ilg PhD, Doris Brötz PT, Susanne BurkardPT, Martin A. Giese PhD, Ludger SchölsMD,*,Matthis Synofzik MD. Long-term effects ofcoordinative training in degenerative cerebellardisease.2010; 25 (13):2239–22462000997
30. Hill K. Studies of balance in older people. [PhD].The University of Melbourne, 1998.
27. Neha Tabussam--136-140.pmd 2/7/2013, 8:08 PM140

Indian Journal of Physiotherapy & Occupational Therapy. January-March 2013, Vol. 7, No. 1 141
Restoration of Normal Length of Upper Trapezius andLevator Scapulae in Subjects with Adhesive Capsulitis
Pandit Niranjan Hemant1, Mhatre Bhavana Suhas2, Mehta Amita Anil3
1Physiotherapist - Mumbai Cricket Association, Cricket Centre, Wankhede Stadium, 'D' Road, Churchgate,Mumbai, - Jaslok hospital & Research Centre, 15 - Dr. Deshmukh Marg, Pedder Road, Mumbai,
2Associate Professor, P.T School and Centre, Seth Dhurmal Bajaj Orthopaedic Centre, 3Professor and Head, P.T School andCentre, Seth Dhurmal Bajaj Orthopaedic Centre, Seth G.S.Medical College and KEM hospital, Parel, Mumbai
ABSTRACT
Study Design: Prospective clinical trial of subjects with Adhesive Capsulitis
Objective: To find the effect of restoration of length of the shortened upper trapezius and levatorscapula muscle with muscle energy technique and sustained passive stretching techniques along withMaitland joint mobilization for glenohumeral joint as compared to Maitland joint mobilization aloneon range of motion and scapular position at rest in subjects with unilateral adhesive capsulitis.
Background: The glenohumeral hypomobility in adhesive capsulitis causes excessive scapular motionto compensate for the reduced gleno-humeral motion. The resulting tightness of upper trapezius andlevator scapula causes an altered scapular position at rest. Restoring normal length of upper trapeziusand levator scapulae will help to restore an optimal length-tension relationship and scapular positionresulting in better improvement of glenohumeral range of motion.
Methods and measures: 60 male subjects with unilateral adhesive capsulitis were divided into groupI and group II of 30 each. Baseline outcome measures assessed were shoulder ROM of flexion, abductionand external rotation and resting position of the scapula using the Lennie test. Group I received MuscleEnergy Technique (MET) for upper trapezius and levator scapula along with Maitland joint mobilizationfor the glenohumeral joint. Group II received Maitland mobilization for the gleno-humeral joint.Outcomes were reassessed at 6 weeks.
Results: The results showed statistically significant improvement ROM in both groups withimprovement being more in group I as compared to group II. However scapular position showedstatistically significantly improvement only in group I with no improvement in group II.
Conclusion: Adding muscle energy techniques to the treatment of adhesive capsulitis gives betteroutcomes compared to treating with joint mobilization alone.
Keywords: Adhesive Capsulitis, Muscle Energy Techniques, Upper Trapezius, Levator Scapula, Joint Mobilization
INTRODUCTION
Adhesive capsulitis is a condition causing painfuland restricted motion of the glenohumeral joint.Normally the entire glenohumeral joint in the restingposition (arm dependent at the side) is surrounded bya large, loose capsule that is taut superiorly and slackanteriorly and inferiorly (redundant folds or axillarypouch) 1. Hyaluronic acid with water is the lubricantbetween the collagen fibres that allows the free glidingto occur 2.The pathogenesis of adhesive capsulitisinvolves the entire capsule with more involvement ofthe antero-inferior axillary folds which are shrunkenand fibrosed 3,4.
The impairments are pain and loss of active andpassive mobility of the glenohumeral joint. Abnormalscapular motion, such as excess elevation and increasedoutward rotation of the scapula during elevation of thearm, is generally thought to be a compensation strategyfor a limited glenohumeral motion, muscle imbalanceand pain 3. In a trial of ten patients with unilateral frozenshoulder syndrome for 3 months early scapular lateralrotation of the frozen shoulder during elevation of thearm using an electromagnetic tracking device wasdocumented 5.
Research supports the view that patients sufferingfrom frozen shoulder syndrome compensate for
28. Niranjan Pandit-141-147.pmd 2/7/2013, 8:08 PM141

142 Indian Journal of Physiotherapy & Occupational Therapy. January-March 2013, Vol. 7, No. 1
impaired glenohumeral motion via the use of accessorymusculature i.e. increased trapezius muscle activity 6.The upper trapezius and levator scapulae areconsidered to be postural muscles and hence undergoshortening in response to stress or overuse 7. Thescapula on the involved side is usually elevated,laterally rotated and abducted 2. Studies on treatmentof adhesive capsulitis concentrate on treatingglenohumeral joint. But little attention is paid tonormalize scapular static and dynamic mechanicswhich are essential for normal glenohumeral rhythm.Hence the focus of this study was to find the effect ofrestoration of length of the shortened upper trapeziusand levator scapula muscle with muscle energytechnique and sustained passive stretching techniquesalong with Maitland joint mobilization forglenohumeral joint as compared to Maitland jointmobilization alone on pain scores, range of motion andscapular position at rest in subjects with unilateraladhesive capsulitis.
We begin with the null hypothesis that there is norelation between combining muscle energy techniquesfor upper trapezius and levator scapula and Maitlandjoint mobilizations for glenohumeral joint as comparedto treating glenohumeral joint alone with Maitland jointmobilization.
MATERIALS AND METHODOLOGY
• Prospective clinical trial of 60 male subjects withadhesive capsulitis from the outpatient departmentof physiotherapy at Seth G.S. Medical college &K.E.M. hospital Mumbai.
Inclusion criteria
• Patients with unilateral adhesive capsulitis.
Exclusion criteria
• Bilateral adhesive capsulitis
• Dorsal spine scoliosis as spine was taken as themidline reference
• Associated pathology of the cervical spine.
• Post fracture stiffness
• Rotator cuff tendinosis or tears
• Shoulder instability
• Complex regional pain syndrome
• Neurovascular neoplastic or infectious conditions
of or around shoulder
• Adhesive capsulitis along with neurologicalconditions like hemiplegia
The material used
• Universal goniometer
• Vernier caliper
• Wrist watch
• Skin markers
• Manual therapy table
• 10 centimeter visual analogue scale (VAS)
• Assessment proforma.
Informed consent was obtained from subjects priorto their inclusion in the study. Approval was takenfrom Ethics Committee for Research on Human subjects(ECRHS) of K.E.M. Hospital Mumbai.
The following outcome measures were assessed onday 1 and at the end of 6 weeks (18th treatment session).
• Flexion, abduction and external rotation ROM usinggoniometer.
• Position of the scapula on the thorax at rest usingthe Lennie test 8 (Fig 1)
Markers were put on the skin overlying the affectedand non-affected scapulae for the superiorangle, root of the scapular spine and inferior angle.
Three measurements of scapular position in thefrontal plane were obtained for both sides.
• Midline to superior angle distance
• Midline to root of the spine of scapula distance
• Midline to inferior angle distance.
• In addition, height difference between scapulae(defined as difference between the vertical positionsof the inferior angles of the affected and the non-affected scapula) was measured with the caliperusing the midline marks corresponding to the twoinferior angles.
Subjects were divided into group I and group II of30 each and assigned alternately into groups i.e. evennumbers into group I and odd numbers in Group II.
Group I received: Muscle energy techniques for upper
28. Niranjan Pandit-141-147.pmd 2/7/2013, 8:08 PM142

Indian Journal of Physiotherapy & Occupational Therapy. January-March 2013, Vol. 7, No. 1 143
trapezius and levator scapulae along with Maitlandjoint mobilization
• Muscle Energy Technique for upper trapezius andlevator scapula 7: (Fig 2)
Subject performed a sub-maximal isometriccontraction in supine position for the respective muscleagainst resistance commencing with the muscle at theresistance barrier and maintained it for 10 seconds.Following relaxation, muscle was stretched beyond thebarrier till a new barrier was reached and stretch wasmaintained for 30 seconds. The sequence was repeated3 times for upper trapezius and levator scapula.
• Maitland joint mobilization: (Fig 3)
• Anteroposterior (AP), posteroanterior (PA) andinferior glide
• Grade 3 and 4 Maitland joint mobilizations for thegleno-humeral joint.
• 3 sets of 30 oscillations per minute per glide 9.
Group II received: Maitland joint mobilization.
• Maitland joint mobilization: (Fig 3)
• Anteroposterior (AP), posteroanterior (PA) andinferior glide
• Grade 3 and 4 Maitland joint mobilizations for thegleno-humeral joint.
• 3 sets of 30 oscillations per minute per glide 9.
Both groups were given hydrocollator packs for theshoulder joint for 10 minutes in sitting position beforetreatment 10.
Home exercise program 11
Both the groups were given home exercise programwith the following exercises:
1) Shoulder girdle retraction and depression(scapularsetting).
2) Wand exercise to improve shoulder flexion andshoulder rotation with both hands.
3) Active assisted shoulder extension in standing.
The subjects were asked to repeat each exercise tentimes twice a day.
They were told to take hot packs at home beforeexercising to reduce pain and relieve spasm.
Data analysis and results
56 patients completed the study. Two subjects ineach group were lost to follow up before 6 weeks. Sothere data was not taken into consideration in statisticalanalysis. For the values of shoulder range of motionand scapular position, paired “t” test (pre-post withingroup comparison) and unpaired “t” test (inter-groupcomparison) was used.
Table 1: Baseline values of the two groups - unpaired ‘t’ test.
The baseline mean values for the parameters did not show a statistically significant difference (p > 0.05).
Variables Group I Group II p value Significance
Mean SD Mean SD
ROM
FlexionActivePassive 102.86112.14 13.5013.57 98.93108.57 12.3510.35 0.26090.2731 NS
AbductionActivePassive 78.9388.75 14.3012.22 73.7585.36 10.8510.09 0.13270.2622 NS
External rotationActivePassive 7.1414.46 7.266.98 4.8212.14 4.615.17 0.15880.1632 NS
Scapular position
SA 6.3368 0.2099 6.2829 0.1700 0.2955 NS
IA 7.2882 0.3194 7.2261 0.2593 0.4276 NS
I I’ 0.9811 0.1765 0.9779 0.1734 0.9576 NS
NS – Not Significant, SA – Superior angle, IA – Inferior Angle, I I’ – Difference in Inferior angle levels
28. Niranjan Pandit-141-147.pmd 2/7/2013, 8:08 PM143

144 Indian Journal of Physiotherapy & Occupational Therapy. January-March 2013, Vol. 7, No. 1
Analysis of scapular position change
Table 2. Inter-group comparison of reduction of distance of Superior and Inferior Angle from midline andDifference between Inferior angles
Mean SA Pre SA Post IA Pre IA Post II’ Pre II’ Post
Group I 6.3368 6.2418 7.2882 6.7500 0.9811 0.3836
Group II 6.2829 6.2821 7.2261 7.2175 0.9779 0.9729
t- value # 1.05 1.39 0.79 6.43 0.05 15.66
p- value 0.2955 0.1697 0.4276 0.0001 0.4276 0.0001
* - Results analysed using paired t test
# - Results analysed using unpaired t test
These results indicate that only treatment receivedby group I was effective in bringing about change in thescapular position (p < 0.05) while no statistically
significant effect was seen in scapular position byintervention given in group II (p > 0.05).
Analysis of abduction range of motion
Table 3. Intergroup comparison between abduction ROM before and after treatment.
Mean Active Pre Active Post Passive Pre Passive Post
Group I 78.93 110.54 88.75 121.07
Group II 73.75 100.00 85.36 111.79
t – value # 1.52 2.70 1.13 2.81
p – value 0.1327 0.0091 0.2622 0.0068
* - Results analysed using paired t test
# - Results analysed using unpaired t test
Shoulder ROM of abduction showed extremelystatistically significant improvement within both thegroups post treatment (p < 0.05). In inter- group
comparison, group I showed more highly statisticallysignificant improvement in abduction as compared togroup II (p < 0.05).
Analysis of flexion range of motion
Table 4 – Intergroup comparison between flexion ROM before and after treatment.
Mean Active Pre Active Post Passive Pre Passive Post
Group I 102.86 137.86 112.14 146.96
Group II 99.64 114.82 108.57 125.89
t - value 1.13 6.21 1.10 6.42
p - value 0.2609 0.0001 0.2731 0.0001
* - Results analysed using paired t test
# - Results analysed using unpaired t test
Shoulder ROM of flexion showed extremelystatistically significant improvement within both thegroups post treatment (p < 0.05). In inter- group
comparison, group I showed more highly statisticallysignificant improvement in flexion as compared togroup II (p < 0.05).
28. Niranjan Pandit-141-147.pmd 2/7/2013, 8:08 PM144

Indian Journal of Physiotherapy & Occupational Therapy. January-March 2013, Vol. 7, No. 1 145
Analysis of external rotation range of motion
Table 5 – Intergroup comparison between external rotation ROM before and after treatment.
Mean Active Pre Active Post Passive Pre Passive Post
Group I 7.14 35.54 14.46 43.57
Group II 4.82 23.04 12.14 33.75
t – value # 1.42 4.46 1.41 4.71
p - value 0.1588 0.0001 0.1632 0.0001
* - Results analysed using paired t test
# - Results analysed using unpaired t test
Shoulder ROM of external rotation showedextremely statistically significant improvement withinboth the groups post treatment (p < 0.05). In inter- groupcomparison, group I showed more highly statisticallysignificant improvement in external rotation ascompared to group II (p < 0.05).
DISCUSSION
Both the groups showed a significant improvementshoulder range of motion. Intergroup comparisonindicates that group I showed significant improvementpost treatment at the end of 6 weeks (18th session) onthe above mentioned outcome when compared to groupII. However, the improvement of scapular position posttreatment was seen only in group I
Scapular position improvement was seen secondaryto the treatment of the upper trapezius and levatorscapula muscle using muscle energy technique couldbe attributed to the therapeutic effects of muscle energytechniques. Many authors have proposed that METtechniques facilitate stretching by producingneurological reflex muscle relaxation 7 followingisometric muscle contractions mediated by Golgitendon organs. Connective tissue elongation is timedependent, and if a constant stretching force is loadedon the tissue, the tissue will respond with slowelongation or creep causing greater deformation i.e.there is viscoelastic or muscle property change 7.Myofascial structures have two distinct connectivetissue arrangements: elastic ‘parallel’ fibres, arrangedparallel to the muscle fibres, and the stiffer ‘in series’fibres that lie perpendicular to muscle fibres and foundmainly at the tendinous junctions. Passive stretchingwould elongate the parallel fibres but have little effecton the ‘in series’ fibres; however, the addition of anisometric contraction would place loading on thesefibres to produce viscoelastic or plastic change aboveand beyond that achieved by passive stretching alone.Literature suggests that MET methods produce a greaterchange in stretch tolerance 7 than passive stretching bydecreasing an individual’s perception of muscle pain.
Stretching and isometric contraction stimulate jointmuscle and joint mechanoreceptors and proprioceptors,and it is possible that this may attenuate the sensationof pain.
The above mentioned mechanisms contributed toreduce over activity and increased length of the uppertrapezius and levator scapula muscle. This wasreflected on the scapular position in Group I on theLennie test. Literature supports the view that abnormalcompensatory scapular movements in patients withshoulder stiffness can be reduced. In a particular study,it was demonstrated that with simple motor controlinstruction, the subjects reduced the amount of scapularelevation and retained relative timing and control 12.
The primary role of mobilization is to restore jointplay and facilitate joint movement by restoringarthrokinematics. The neurophysiologic effect is basedon the stimulation of the peripheral mechanoreceptorsand inhibition of nociceptors. The biomechanical effectis based on breaking up adhesions in the capsule,collagen fibre realignment and improving interfibreglide 2. A multiple-subject case report concluded thatthere seems to be a role for intensive mobilizationtechniques in the treatment of adhesive capsulitis 13.Hence there was increase in ROM of the shoulder overa period of 6 weeks.
The underlying basis for the use of hot packs is theability of heat to elevate pain threshold, alter nerveconduction velocity and change in muscle spindle firingrate 10.
Thus the null hypothesis was rejected and theexperimental hypothesis was proved.
CONCLUSION
Restoring length of upper trapezius and levatorscapula is essential when treating patients withadhesive capsulitis. While assessing patients withadhesive capsulitis attention needs to be given toassessment of abnormal scapular position. Treatment
28. Niranjan Pandit-141-147.pmd 2/7/2013, 8:08 PM145

146 Indian Journal of Physiotherapy & Occupational Therapy. January-March 2013, Vol. 7, No. 1
should be focused on treating the glenohumeral jointalone but also incorporate techniques to restore alteredscapular mechanics.
Limitations of the study
The study did not take into account the strength ofmuscles like middle and lower trapezius, rhomboids,serratus anterior.
Also the influence of other muscles which becometight in adhesive capsulitis like pectorals, subscapularis,and teres major on glenohumeral range of motion wasnot taken into account.
Implication for future studies
Studying the EMG activity before and postintervention for the upper trapezius and levatorscapula would be helpful in understanding themechanism of improvement in the length of thesemuscles post MET.
Interest of conflict: We, Pandit N, Mhatre B andMehta A state that there is no conflict of interests withother people or organizations about our work.
Upper trapezius
Fig. 2. Muscle energy techniques
Levator scapula
ACKNOWLEDGEMENTS
We are heartily thankful to the staff of PT Schooland Centre, KEM hospital, who supported us from thepreliminary stages of the project.
Fig. 1. Lennie test
28. Niranjan Pandit-141-147.pmd 2/7/2013, 8:08 PM146

Indian Journal of Physiotherapy & Occupational Therapy. January-March 2013, Vol. 7, No. 1 147
Fig. 3. Glenohumeral mobilization
Anteroposterior glide Posteroanterior glide
Inferior glide
REFERENCES
1. Norkin C. and Levangie P. 3rd edition. JaypeeBrothers 2001.
2. Donatelli R.A. Physical therapy of the shoulder,3rd edition; Churchill Livingstone 1997.
3. Reeves B. Arthrographic changes in frozenshoulder and post traumatic stiff shoulders. ProcSoc Med 59:827, 1966.
4. Neviaser J. S. Adhessive capsulitis of the shoulder:
A study of the pathological findings in periarthritisof the shoulder. JBJS Am. 1945;27:211-222.
5. Vermeulen H.M. Stokdijk M. Eilers P.H.C. MeskersC.G.M. Rozing P.M. Vliet Vlieland T.PM.Measurement of three dimensional shouldermovement patterns with an electromagnetictracking device in patients with a frozen shoulder.Ann. rheum. Dis. 2002;61:115-120
6. Jiu-Jenq Lin. Ying-Tai Wu. Shwu-Fen Wang. Shiau-Yee Chen. Trapezius muscle imbalance inindividuals suffering from frozen shouldersyndrome. Clin Rheumatol 2005;24:569–575.
7. Chaitow L. Muscle energy techniques, 3rd edition;Churchill Livingstone 2006.
8. Sobush D. C. Simoneau G.G. Deitz K.E. LeveneJ.A. Grossman R.E. Smith W.B. The Lennie Test formeasuring scapular position in healthy youngadult females: A reliability and validity study,JOSPT Vol. 23 No. 1 Jan 1996.
9. Maitland G.D. Peripheral manipulation, 3rdedition.
10. Michlovitz S. Thermal agents in rehabilitation. 3rdedition FA Davis Co. Philadelphia 1990
11. Kisner C. and Colby L. Therapeutic exercise, 5thedition 2007.
12. 15 Babyar S. R. Excessive scapular motion inindividuals recovering from painful and stiffshoulders: Causes and treatment strategies, PhysTher. 1996;76:3.226-238.
13. Vermeulen H.M. Obermann W.R. Burger B.J. KokG.L. Rozing P.M. van den Ende C.HM. End-rangemobilization techniques in adhesive capsulitis ofthe shoulder joint: A multiple-subject case report.Phys Ther. 2000;80:12.1204-1213.
28. Niranjan Pandit-141-147.pmd 2/7/2013, 8:08 PM147

148 Indian Journal of Physiotherapy & Occupational Therapy. January-March 2013, Vol. 7, No. 1
Comparison of VMO/VL Ratio in Patello-Femoral PainSyndrome (PFPS) Patients: A Surface EMG Study
Nishant H NarConsultant Physiotherapist Wockhardt Hospital, Rajkot
ABSTRACT
Background: PFPS describes anterior and retro patellar knee pain in the absence of other pathology.PFPS is one of the most common disorders of the knee accounts for 25% of knee injuries in sportsmedicine clinics. Prevalence rate is 20% in USA students and morbidity is directly related to activity ofpatients. EMG studies of normal subject have revealed that VMO /VL ratio is about 1:1 (power CM et al)
Objective: To study the VMO/VL ratio during ECCENTRIC, CONCENTRIC, ISOMETRIC exercise andQ-angle in PFPS patients and control groups.
Materials & Method: SUBJECTS; 25 diagnosed with PFPS and 25 asymptomatic control were recruitedfor study. EMG activity of VMO VL was recorded by surface electrodes.EMG data were analyzed inthree activities for both groups, ISOMETRIC, CONCENTRIC and ECCENTRIC exercise. Outcomemeasure was EMG MUAP amplitude and Q-angle.
Results: Results showed that VMO/VL ratio is lower in PFPS subjects. And static and dynamic Q-angle is higher for PFPS groups.
Conclusion: There was significant difference in VMO/VL ratio and Q-angle in both groups.
Keywords: VMO, Surface EMG, Q-angle.
INTRODUCTION
PFPS describes anterior or retro patellar knee painin the absence of other pathology. PFPS which is one ofthe most common disorders of the knee accounts for25% of all knee injuries treated in sports clinics. [1]
Female patient are particularly more affected thanmale [2]. Incidence rate is 7% and 10% in young maleand female. [2]
Prevalence rate is 20% in students in USA andmorbidity is directly proportional to activity of Patients[3]
In one study done by Winslow et al 1995 out of 16,748patients presenting with sports related musculoskeletalproblems, 11.3% had an anterior knee pain. Incidenceof PFPS in general population is reported in somestudies to be high as one in four with proportionincrease in athletes. (Levine 1979, Outbridge 1984)
In orthopedics sports medicine, the most commonreasons for anterior knee pain are, [4]
Overuse
Mal-alignment
Trauma
Studies on the natural history of PFPS report that ingeneral it is a benign condition that may improve orpersist over time serious disability is uncommon. PFPSis a condition of both malalignment and musculardysfunction.
Rehabilitation exercises can restore PF jointhomeostasis although the anatomical malalignment ofPFPS may not be corrected. [5]
Symptoms of anterior knee pain are brought on byoveruse stress; PFPS is an ideal condition forprerehabilitation. [6]
Total or near total recovery was noted in 22% at 16years ( Noman et al 1998)
70 % at 3 years (Kanmus et al 1994), 81% at 12 years( jensssen et al 1990), 85% at 11 years (Karlsson et al1996 ).
29. Nishant--148-153.pmd 2/7/2013, 8:08 PM148

Indian Journal of Physiotherapy & Occupational Therapy. January-March 2013, Vol. 7, No. 1 149
The basic origin and exact pathogenesis of PFPS areunknown but many predisposing factors have beenproposed including[7]
Acute trauma, knee ligament injury, instability,overuse, immobilization, overweight, malalignment ofextensor mechanism.
In many cases, however there are no obvious reasonsfor the symptoms, there is no clear association betweenseverity of the symptoms and the radiologic andarthroscopic findings.
Some theories for the origin of non- traumaticgradual onset of PFPS are [8]
Neuromuscular imbalance of VMO VL, Tightnessof lateral retinaculum, Hamstrings , Iliotibial band,Overpronation of subtalar joint.
Several authors have exposed the theory thatabnormal patellar alignment is the root of pain [8]
Patients usually complain of insidious onset ofvague, activity related pain coupled with evidence ofwasting of Vastus medialis.[9]
EMG studies of normal subjects have revealed thatVMO/VL activity ratio is about 1:1,
Whereas EMG recording in patients havingPFPS has shown that the ratio of VMO/VL is le than1:1. [10] [11].
Controversy exist in the literature as to the normalrelationship between the timing of EMG activity of theVMO and VL and whether this difference in populationwith PFPS.[12, 13]
Many rehabilitation strategies have implemented forpatients with PFPS. In general the goals of patellafemoral rehabilitation are to maximize quadricepsstrength while minimizing the patella femoral jointreaction force and stress.[14, 15]
Recently EMG biofeedback is also useful method toactivate VMO muscle. Selina Lm Yip et al concludedthat EMG biofeedback + exercise programme isbeneficial than alone exercise in PFPS patients.[16]
Other investigators [17, 18] have examined VMO andVL EMG levels in the patients with PFPS, but have notused control groups. Approximately 70% of patellafemoral disorder will improve with conservativemanagement.
Also in outpatient department the cases of PFPS isincreasing day by day, and so the clinical assessmentand treatment of the condition are extremelychallenging because of the multiple forces affecting thepatella femoral joints.
MATERIALS AND METHODOLOGY
STUDY DESIGN
Cross sectional study
STUDY SETTING
This study was conducted at Physiotherapy Instituteof Ahmedabad. All the patients were referred fromOrthopedic Out patient Department of V.S Hospital,Ahmedabad.
SAMPLE SIZE: 25 Subjects in each group
SUBJECTS: Male and Female with clinicaldiagnosis of PFPS who were referred to physiotherapyOPD
INCLUSION CRITERIA
1) Age between 25-40 year
2) Anterior knee pain more than 1 month
3) Knee pain atleast 2 of the following activities
Ascending stairs
Descending stairs
Squatting
Kneeling
4) Diagnostic tests were positive for PFPS
5) Subjects willing to participate in study
EXCLUSION CRITERIA
1) Any trauma around knee joint
2) Any previous surgery around knee joint
3) Neurological disorder
4) Skin abrasion around knee
5) Previous physiotherapy taken in past 6 months forknee
29. Nishant--148-153.pmd 2/7/2013, 8:08 PM149

150 Indian Journal of Physiotherapy & Occupational Therapy. January-March 2013, Vol. 7, No. 1
MATERIALS USED IN STUDY
Electrode, electrode gel, goniometer, measure tape,micro pore, plinth, consent form, Pencil, Papersassessment charts and recording sheets.
APPARATUS USED IN STUDY
EMG Machine with Neuro Perfect Plus Software
Computer System with printer
OUTCOME MEASURES
EMG amplitude
Q- Angle: static and dynamic
PROCEDURE
Twenty five subjects diagnosed with PFPS on thebasis of clinical examination and referred fromorthopedic OPD, and 25 asymptomatic controls wererecruited for the study. Subjects were selected on thebasis of inclusion and exclusion criteria. Detailedassessment of patients with diagnostic tests for PFPSand radiological examination was done. All subjectswere provided written informed consent. Then patient’sdata was entered to EMG programme (Neuro Perfectplus Software) in computer. Then EMG surfaceelectrodes with gel were placed over the selected muscle.Micropore tape was used to adhere the electrodes onskin.
EMG parameters were SWEEP -10ms, SENSITIVITY100micro volts, LOW CUT 100Hz, HIGH CUT 5 KHz,PULSE/ SEC- 1, PULSE WIDTH-0.02ms
VMO placed over the muscle belly approximately 4cm superior to and 3 cm medial to the superomedialpatellar border and oriented 55 degrees to vertical. [19]
(Fig 2)
EMG amplitude was recorded during ISOMETRIC,CONCENTRIC and ECCENTRIC exercises.
EMG MUAP Amplitudes were identified fromindividual trials and averaged over the 5 repetition.
After that electrodes were removed and placed forVL muscle and MUAP amplitude was recorded duringabove described three exercises.
The electrode for VL was placed 10 cm superior and6-8 cm lateral to the superior border of the patella, andoriented 15 degrees to vertical. [19] (Fig 1)
Averaged EMG Amplitude was taken for both VMOand VL and then VMO/VL ratio was calculatedmanually.
Static and Dynamic Q-angle was measured for bothgroups. For static Q-angle measured with knee in fullextension with subject in supine position. ASIS (anteriorsuperior iliac spine), centre of patella and tibialtuberosity was marked with pencil. The angle formedby the intersection of line from ASIS to centre of patellawith centre of patella to tibial tuberosity was measuredin degrees with universal goniometer. [Fig-3]
Dynamic Q-angle was measured with staticquadriceps contraction in supine position with kneeextended. Procedure of measurement was same as forstatic Q-angle.
VL electrode placement
Fig. 1. VMO electrode placement
Fig. 2. Q-angle measurement
29. Nishant--148-153.pmd 2/7/2013, 8:08 PM150

Indian Journal of Physiotherapy & Occupational Therapy. January-March 2013, Vol. 7, No. 1 151
RESULTS
In this study all the tests were performed manuallyas well as with the use of Graph pad software.
To analyze the value of static and dynamic Q-anglewithin the groups for control and PFPS groups pairedt-test was used, as the data is normally distributed.
To analyze the static Q-angle between groups mann-whitney U-test was used as the data is non parametric.
To analyze the dynamic Q-angle between groupsmann-whitney U- test was used as the data is nonparametric.
To analyze the value of VMO/VL ratio betweencontrol and PFPS groups during isometric exerciseunpaired t-test was used, as the data is normallydistributed.
To analyze the value of VMO/VL ratio betweencontrol and PFPS groups during concentric exerciseunpaired t-test was used, as the data is normallydistributed.
To analyze the value of VMO/VL ratio betweencontrol and PFPS groups during eccentric exerciseunpaired t-test was used, as the data is normallydistributed.
Table-1 Age distribution of both group patients
Groups Mean SD
Control 32.56 5.324
Experimental 33.12 4.825
The mean age of the control group was 32.56 ± 5.324and in the PFPS patients, the mean age was 33.12 ±4.825 No significant difference was seen across the twogroups.
Fig. 3
Table 2. Comparison of static and dynamic Q-angle in PFPS patients
Q-angle mean SD Test used t-value p-value significance
Static 16.12 2.789 paired t-test t=3.663 P=0.0006 Extremelysignificant
Dynamic 19.52 3.709
Here the paired t-test was used as the data is normally distributed. Mean value for static and dynamic Q-anglewere respectively 16.12 ± 2.789 and 19.52 ± 3.709. t=3.663 and p=0.0006 so the difference was extremely significantat 95% confidence interval.
Table -3 Comparison of static and dynamic Q-angle in control group
Q-angle mean SD Test used t-value p-value significance
Static 14.36 3.390 paired t-test t=0.8088 P=0.4272 Not significant
Dynamic 15.12 3.321
Here the paired t-test was used as the data is normally distributed. Mean value for static and dynamic Q-anglewere respectively 14.36 ± 3.390 and 15.12 ± 3.321. t=0.8088 and p=0.4272 so the difference was not significant at95% confidence interval.
Table -4 Comparison of static Q-angle in PFPS and control groups
Q-angle mean SD Test used U-value p-value significance
PFPS 16.12 2.789 Mann whitney U= 210 P=0.0475 Considered significantU test
Control 14.36 3.390
Here the Mann Whitney U test was used as the data is non-parametric. Mean value of static Q-angle for controland PFPS groups respectively were 16.12 ± 2.789 and 14.36 ± 3.390. Difference was significant at 95% confidenceinterval.
29. Nishant--148-153.pmd 2/7/2013, 8:08 PM151

152 Indian Journal of Physiotherapy & Occupational Therapy. January-March 2013, Vol. 7, No. 1
Table -5 Comparison of dynamic Q-angle in PFPS and control groups
Q-angle mean SD Test used U-value p-value significance
PFPS 19.52 3.709 Mann whitney U= 120.50 P=0.0002 Extremely significantU test
Control 15.12 3.321
Here the Mann Whitney U test was used as the data is non-parametric. Mean value of static Q-angle for controland PFPS groups respectively were 19.52 ± 3.709 and 15.12 ± 3.321. Difference was significant at 95% confidenceinterval.
Table 6. Comparison of VMO/VL ratio during ISOMETRIC exercise in PFPS and control
Groups mean SD Test used t-value p-value significance
Control 0.9260 0.0482 Unpaired t-test t=5.136 P=0.0001 Extremely significant
Experimental 0.8124 0.0995
Here the un paired t-test was used. Mean value of VMO/VL in control group was 0.9260 ± 0.0482 and PFPSgroup was 0.8124 ± 0.0995. t=5.136 and p < 0.0001. so the difference was extremely significant at 95% confidenceinterval.
Table 7. Comparison of VMO/VL ratio during CONCENTRIC exercise in PFPS and control groups
Groups mean SD Test used t-value p-value significance
Control 0.9484 0.0300 Unpaired t-test t=4.976 P=0.0001 Extremely significant
Experimental 0.8336 0.1113
Here the un paired t-test was used. Mean value of VMO/VL in control group was 0.9484 ± 0.0300 and PFPSgroup was 0.8336 ± 0.1113. t=4.976 and p < 0.0001. so the difference was extremely significant at 95% confidenceinterval.
Table -8 Comparison of VMO/VL ratio during ECCENTRIC exercise in PFPS and control groups
Groups mean SD Test used t-value p-value significance
Control 0.9505 0.0374 Unpaired t-test t=7.457 P=0.0001 Extremely significant
Experimental 0.8126 0.0844
Here the un paired t-test was used. Mean value ofVMO/VL in control group was 0.9505 ± 0.0374 andPFPS group was 0.8126 ± 0.0844. t=7.457 and p < 0.0001.so the difference was extremely significant at 95%confidence interval.
Graph 1. Comparison of mean of VMO/VL ratiobetween control and experimental groups
CONCLUSION
This is a cross sectional study comparing the VMO/VL ratio and Q-angle in PFPS and control groups on 50total subjects.
There was a statistically significant difference inVMO/VL ratio between control and PFPS subjectsduring ISOMETRIC, CONCENTRIC and ECCENTRICexercise, so null hypothesis was rejected andexperimental hypothesis was accepted.
There was a statistically significant difference instatic and dynamic Q-angle in both groups. Static anddynamic Q-angle value was higher in PFPS patients.
ACKNOWLEDGEMENTS
I would like to thank Dr Nehal shah (PG teacher)and I am grateful to all my patients for their kindcooperation and willingness to participate in this study,without whom this study would not have materialized.
29. Nishant--148-153.pmd 2/7/2013, 8:08 PM152

Indian Journal of Physiotherapy & Occupational Therapy. January-March 2013, Vol. 7, No. 1 153
Conflict of Interest : Nil
REFERENCES
1. Baquie P, Brukner P: Injuries presenting to anAustralian sports medicine centre: A 12-monthstudy. Clin J Sport Med 1995;7:28–31
2. Fulkerson JP, Arendt EA: Anterior knee pain infemales. Clin Orthop 372: 69–73, 2000
3. Wilk KE ,Davies GJ, Mangine et al: patella femoraldisorder, A classification system and clinicalguidelines for non-operative rehabilitation ,jorthop physiotherapy 1998,28 : 307-22.
4. Powers CM , Mortensons , Nishimoto d,Simon D :criterion relaterd validity of clinical measurementto determine medial/lateral component of patellaorientation, J orthop sports phys ther 1999; 29 :372-377
5. Salaki N,Luo Z-P,Rand JA,An K-N: The influenceof weakness in the
i. vastus medialis oblique muscle on the patellafemoral joint: an vitro
ii. biomechanical study.clin biomech 2000;15:335-339.
6. Mirzabeigi E,Jordan C,Groneley JK et al: Isolationof vastus medialis oblique muscle during exercise.Am J Sports Med 1999; 27: 50-53
7. Natri A, Kannus P, Jarvinen M. Which factorspredict the longterm outcome in chronicpatellofemoral pain syndrome? A 7-yr prospectivefollow-up study. Med Sci Sports Exerc 1998; 301572-7.
8. Blond L, Hansen L. Patellofemoral pain syndromein athletes: a 5.7 year retrospective follow-up studyof 250 athletes. Acta Orthop Belg 1998;64:393-400
9. Garrick JG: Anterior knee pain (chondromalaciapatella). The physian and sports Medicine, 1989,17: 75-84.
10. Powers CM, Landel DR perry J:timing and
intensity of vastus muscle activity duringfunctional activities in patients with and withoutpatellofemoral pain.Phys Ther,1996,76:946-955
11. Miller JP,Sedory D,Croce RV:vastus medialisobliquus and vastus lateralis activity in patientswith and without patellofemoral pain syndrome.Jsports Rehabil,1997a,6:1-10.
12. Voight M, Weider D. Comparative reflex responsetimes of the vastus medialis and the vastuslateralis in normal subjects and subjects withextensor mechanism dysfunction. Am J SportsMed 1991;10:131-7.
13. Witvrouw E, Sneyers C, Lysens R, Victor J,Bellemans M. Reflex response times of vastusmedialis oblique and vastus lateralis in normalsubjects with patellofemoral pain syndrome. JOrthop Sports Phys Ther 1996;24:160-5.
14. Braddom R. Physical medicine and rehabilitation.In: Casazza B,Young J, editors. Musculoskeletaldisorders of the lower limbs 2nd ed. Philadelphia:WB Saunders; 2000. p 834-7.
15. Bechman M, Craig R, Lehman RC. Rehabilitationof patellofemoral dysfunction in the athlete. ClinSports Med 1989;8:841-60.
16. Selina Lm Yip et al; Biofedfback supplementationto physiotherapy programme for rehabilitation ofpatellofemoral pain syndrome: ClinicalRehabilitation, Vol. 20, No. 12, 1050-1057 (2006)
17. Wild J , franklin T,woods W.patellar pain andquadriceps rehabilitation : an EMG study.Am Jsports Med .1982; 10:12-15
18. Moller B, krebs B, Tidermand Dal c,aaris k,isometric contractions in the patella femoral painsyndrome.arch orthop trauma a surg,1986: 105:24-27
19. Lam PL,Ng GYF: Activation of quadriceps muscleduring semisquatting with different hip and kneepositions in patients with anterior knee pain. AmJ Phys Med Rehabil,2001,80:804-808
29. Nishant--148-153.pmd 2/7/2013, 8:08 PM153

154 Indian Journal of Physiotherapy & Occupational Therapy. January-March 2013, Vol. 7, No. 1
A Study to Check Added effects of Electrical Stimulationwith Task Oriented Training in Hand Rehabilitation
among Stroke Patients
Paras JoshiAssistant professor, Shree K K Sheth Physiotherapy College, Rajkot
ABSTRACT
Back ground: stroke patients are having variety of disable functions, including limited hand functionswhich has key role to do activities of daily living.
Objective: To determine the added effects of electrical stimulation combined with task oriented trainingin stroke patients.
Methods: 30 subjects were selectively divided in to two groups. Group A received Eletrical stimulationwith Task oriented training while Group B received only task oriented training. Outcome measureswere grip strength, Box and Block test, 9 hole peg and ROM.
Findings: statistical significant difference found for all the variables used in methods in between thegroups.
Conclusion: Electrical stimulation with task oriented training improves hand functions more effectivelycompared to only task oriented training in stroke patients.
Keywords: Electrical Stimulation, Task Oriented Training, Hand Rehabilitation
INTRODUCTION
Stroke is an acute onset of neurological dysfunctiondue to an abnormality in cerebral circulation withresultant sign and symptoms that correspond toinvolvement of focal areas of the brain. The termcerebrovascular accidents (CVA) are usedinterchangeably with stroke to refer to thecerebrovascular conditions that accompany eitherischemic or hemorrhagic lesions. To be classified asstroke, focal neurological deficits must persist for at least24 hours. 1
Stroke is the third leading cause of death inindustrialized countries and the leading cause of adultdisability. Half of all stroke survivors are left with majorfunctional problems in their hands and arms.2
Although initial neurological loss in arm is generallythought to be predictive factor for overall recovery ithas been reported that the recovery of the upperextremity function is independent of the overall level ofstroke severity. 3
Numerous studies have suggested that electricalstimulation improve muscle strength motor controlrange of motion and reduced the spasticity of pareticlimb 4, 5
Electrical stimulation of spastic wrist flexor muscleswas compared with passive stretch of wrist flexor byking who reported a significantly greater effect ofelectrical stimulation on flexor spasticity.6 Howeveralfier10 stated that “no direct stimulus must be allowedto reach spastic muscle” and he reported a reduction inflexor spasticity after electrical stimulation of extensormuscles.
Electrical stimulation at wrist in combination withother rehabilitation strategies can result in increase gripstrength and improve motor function.7
The exact mechanism underline the action ofelectrical stimulation has not been elucidated butneurophysiologic models produce arguments in favorof each strategy improvement in extensor musclestrength through electrical stimulation of extensor
30. Paras Joshi--154-159.pmd 2/7/2013, 8:08 PM154

Indian Journal of Physiotherapy & Occupational Therapy. January-March 2013, Vol. 7, No. 1 155
might provide sufficient power to overcome flexorspasticity.8
Its central tenet is the idea that the interactingsystems within the CNS are organized around essentialfunctional tasks and the environment in which the taskis performed. Thus an understanding of tasks, theessential elements within each task, and theenvironment is key to understanding and promotingmotor control. This approach is also based on the theorythat action system within the CNS are organized tocontrol function9.
Patients are instructed to practice those tasks thatpresent difficult for them, and to practice them invarying environments. Different strategies may be usedby the different individual and should be allowed ifthey achieve the desired functional outcome.11
So the aim of this study was to check the addedeffects of electrical stimulation combined with taskoriented training in hand rehabilitation in strokepatients.
METHOD AND MATERIALS
Study design: Experimental study.
Sampling technique: Purposive samplingtechnique.
Samples: A total of 30 subjects were included fromK K Sheth Physiotherapy center, Rajkot andsurrounding the city in 2 years framework.
Prior to participation in study the subjects wereexplained about the procedure of physiotherapeutictreatment with therapeutic electrical stimulation of themuscle and task related training. Informed consent wasobtained from all the subjects.
Inclusion Criteria
• Unilateral ischemic stroke
• Grade 4 or 5 Brunnstrom assessment scale
• MMT of muscle around the shoulder and elbowjoint minimum grade 3
• Above 40 years of age, both the sexes
Exclusion Criteria
• Sensory impairment
• Chronic stroke patients. (> 1 year of stroke)
• Uncontrolled blood pressure
• Severely impaired cognition and communication
• Traumatic brain injury
• Clinical evidence of limited joint range of motion ofwrist joint
• Clinical evidence of shoulder subluxation
The 30 subject selected were randomly divided intothe group (group A and B of 15 each).
Group A
Fifteen subjects received electrical stimulation alongwith task related training.
Group B
Fifteen subjects received only task related training.
Subjects were kept blind about the different treatmentprotocols for two groups
Measurements for grip strength was taken by handheld dynamometer and hand functions were taken byBox and block test12, 9 hole peg test13, wrist extensionand radial deviation pre intervention(baseline) and postintervention (4th week)
Experimental procedure
Electrical stimulation technique: The researcherhimself performed the electrical stimulation of wristextensor. Subjects were seated in straight backed chairwith the feet flat on the floor. Subject was seated next tothe supported surface and the forearm rest on supportedsurface. The wrist remains freely suspended at the edgeof the plinth to allow for movement due to electricalstimulation.
The bipolar electrode placement was used to delivera motor level stimulus to the wrist and finger extension.One electrode was placed over the lateral epicondyle ofhumerus and active electrode was placed distally onwrist and finger extensor (extensor carpi radialis longusand bravis, extensor carpi ulnaris, extensor digitorumcommunis). The electrode skin coupling medium wasan electrolytic gel. To fix the electrodes elastic Velcrostraps were used.
The stimulus was provided by an electricalstimulation (vectorstim) providing a maximum outputintensity of 50 MA. This stimulator operated on preprogrammed protocols which were enlisted in the usermanual provided by the manufacture. The researcherused protocol for the experimental group A protocol no14 (50 HZ) was employed for stimulation of wrist and
30. Paras Joshi--154-159.pmd 2/7/2013, 8:08 PM155

156 Indian Journal of Physiotherapy & Occupational Therapy. January-March 2013, Vol. 7, No. 1
finger extensor. The intensity was gradually increasedas per the tolerance of each subject, achieving themaximal intensity to produce motor response.
Electrical stimulation parameters
• type of current : short interrupted direct current(faradic)
• waveform: monophasic
• current modulation: surged
• pulse duration: 0.7ms
• inter pulse duration:19 ms (50 hz)
• surge duration: 0.07ms
• inter surge duration:3ms
• on/off time:0.5 sec/3 sec (1:6)
• intensity : as tolerated by patients
• Duration of treatment: 30 min/day
Treatment was given for 5 days in a week to eachsubject for 4 weeks.
TASK RELATED TRAINNING
Subjects were asked to identify daily activities thatcould be difficult to perform and that they would like toimprove.
The four or more of the following tasks wereadministered / trained for the subjects.
• manipulate tools for specific purpose ( tooth brush,comb ,knife, fork, coin, clothpin ,button)
• Grasp and release the different objects, or differentshapes, sizes.
• Transport an object from one place to another.
• Subjects were asked to lift glass up and to lower itwithout loosing control at his wrist.
Goal is to push the glass along the table by extendingwrist with forearm in mid position.
• Subjects were asked to practiced picked uppolystyrene cup around the rim without deformingit between thumb and each finger.
• Peg board exercises.
Subjects performed their most difficult exercise for10 repetitions each. Unsuccessful attempt was notcounted; however a subject is advised to change theexercise if he/she is not able to do at al.
Treatment was given for 5 times in a week for 4weeks.
Paired an unpaired t tests were used for thestatistical analysis.
FINDINGS
Table I. Comparison of Strength scores within Group A and within Group B
Group Intervention N Mean Standard t- value Level ofPeriod Deviation significance
A Pre 15 7.84 1.62 8.98 SS SS at p < 0.05
Post 15 9.46 1.50
B Pre 15 7.79 1.62 8.93 SS SS at p < 0.05
Post 15 8.81 1.40
Graph 1. The female count in group A was 5 (33%)and that of the group B was 6 (40%). The male count ingroup A was 10 (67%) and that of the group B was 9(60%). The total count of females in this study was about11 (36%) and male was about 19(63%). The total countof male and female subjects in this study was about 30(100%).
30. Paras Joshi--154-159.pmd 2/7/2013, 8:08 PM156

Indian Journal of Physiotherapy & Occupational Therapy. January-March 2013, Vol. 7, No. 1 157
Table II. Comparison of Box ‘N’ Block and 9 Hole Peg Test Scores within Group A and within Group B
Group Variables Intervention N Mean Standard t- value Level ofPeriod Deviation significance
A Box ‘N’ Block Pre 15 16.53 2.41 17.83 SS SS at p < 0.05
Post 15 19.27 2.21
9 Hole Peg Test Pre 15 2.04 .33 11.50 SS SS at p < 0.05
Post 15 1.78 .30
B Box ‘N’ Block Pre 15 16.80 2.24 7.17 SS SS at p < 0.05
Post 15 18.47 2.03
9 Hole Peg Test Pre 15 2.08 .31 14.10 SS SS at p < 0.05
Post 15 1.99 .31
Table III. Comparison of Wrist Extension and Radial Deviation Scores within Group A and within Group B
Group Variables Intervention N Mean Standard t- value Level ofPeriod Deviation significance
A Wrist extension Pre 15 26.93 2.46 13.25 SS SS at p < 0.05
Post 15 30.07 2.63
Radial deviation Pre 15 5.80 1.01 11.37 SS SS at p < 0.05
Post 15 7.87 .91
B Wrist extension Pre 15 27.20 2.51 8.08 SS SS at p < 0.05
Post 15 29.00 2.29
Radial deviation Pre 15 7.13 1.06 4.58 SS SS at p < 0.05
Post 15 7.73 .79
Table IV: Comparison of Change in Strength, Box ‘N’ Block , 9 Hole Peg Test , Wrist Extension and Radial Deviationscores across the Intervention Period between Group A and Group B
Change in Variable Group N Mean Standard t-value Level ofbetween Pre & Post Difference deviation significanceIntervention
Change inStrength A 15 1.62 .69 2.81 SS SS at p < 0.05
B 15 1.02 .44
Change in Box‘N’ Block A 15 2.73 .59 3.83 SS SS at p < 0.05
B 15 1.67 .90
Change in9 Hole Peg Test A 15 .26 .08 7.67 SS SS at p < 0.05
B 15 .08 .02
Change in Wrist Extension A 15 3.13 .91 4.11 SS SS at p < 0.05
B 15 1.80 .86
Change in Radial Deviation A 15 2.07 .70 6.55 SS SS at p < 0.05
B 15 .60 .50
SS: Statistical significant
Graph 1. The female count in group A was 5 (33%)and that of the group B was 6 (40%). The male count ingroup A was 10 (67%) and that of the group B was 9(60%). The total count of females in this study was about11 (36%) and male was about 19(63%). The total countof male and female subjects in this study was about 30(100%).
DISCUSSION
Within the two groups, both electrical stimulationcombined with task related activity ( groupA) and task
related activity alone (group B ) proved to be effective.This was reflected in the pre intervention and postintervention measurements of grip strength, box andblock test, 9 hole pack test and active wrist extensionand radial deviation range of motion.
However between group comparisons of meanscores of wrist extension and radial deviation ( AROM), grip strength , box and block test , 9 hole peg test – subscores and total percentage showed that subjectsreceiving electrical stimulation combined with taskrelated training ( group A) had clinically and
30. Paras Joshi--154-159.pmd 2/7/2013, 8:08 PM157

158 Indian Journal of Physiotherapy & Occupational Therapy. January-March 2013, Vol. 7, No. 1
statistically significant improving in wrist extensionand radial deviation ( AROM) grip strength , box andblock test, 9 hole peg test –sub score and total percentagewhen compared to subjects receiving task relatedtraining ( group B) across base line and 4th week(table ) (p<0.05).
Electrical therapy has been applied as a therapy inhumans with central nervous system (CNS) injuriesalthough there is no conclusive direction as to whichtechnique works the best for a given indication. Thereare convincing studies available to show that electricalstimulation can strengthen atrophied muscles, changein muscles property, increase the muscle bulk, andimprove the circulation and the change in themetabolism.10
There is evidence that repetitive active movement,mediated by neuromuscular stimulation can enhancemotor relearning after CNS damage. The additionalcomponent of movement provides augmented sensoryfeedback and propioceptive afferent stimulation. Thereis reorganization of cortical representations for bodyparts basal upon the afferent input that they contributeas well as the amount of motor activation they undergo.With electrical stimulation there is evidence that itequally influence this reorganization. This can be highlyadvantageous in limbs that are impaired to such adegree that a voluntary movement could be impossible.Because of significant amount of hemiparesis that iscaused by stroke, the use of electrical stimulation togenerate movement provides the means of inducingpositive motor changes associated with motion.16
Cauraugh14 et al focused on less severely affectedsubjects, like those in the present trial spasticity werenot assessed; they reported improvement in sustainedcontraction of wrist extensor muscles and in function(box and block test) but no effect on motor control. Fromthe publication, it is not clearly whether there was nogain in motor control or no difference in gain. In a lettertrail function improvement was confirmed but theclinical relevance of this improvement was notdiscussed. In this study it seems that functionalimprovement can be clinically relevant for subjects.
People with a brain injury have deficit in motorprogrammes, motor memory and associated feedbackand feed forward mechanism, which largely impedetheir functional performance. 14 The motor relearningapproach promotes the regaining of normal motor skillthrough task oriented training with appropriatefeedback and the active participants of the patients. Inthis study, the motor relearning program was structured
in such a way that patient had ample opportunity togain this experience. First the patients were involved inidentifying their own problems in performance. Theseproblems are called the missing performancecomponent. The selection of task used for training wasmeant to target those missing performance componentstraining in the functional tasks followed through onthe same missing components. The incorporation ofthis strategy turned the programme into a client centeredintervention. The training thus become moreanticipatory for the patients and hence was more self-initiated, targeted and effective.15 Limitation of the studywas absence of control group; neither patients nor thetherapist were blinded.
CONCLUSION
Both electrical stimulation along with task orientedtraining and only task oriented training were useful toimprove hand functions.
Electrical stimulation with task oriented trainingimproves hand functions more effectively compared toonly task oriented training in stroke patients.
ACKNOWLEDGEMENT
I am sincerely thankful to Dr Saralaben Bhatt,Principal K K Sheth Physiotherapy College, Rajkot fortheir guidance and support
REFERENCES
1. Susan B. O’Sullivan, Thomas Schmitz. Physicalrehabilitation: assessment of treatment
2. Hacke W, Kaste M,Olsen TS ,orgogozo JM,Bbogousslavsky j.empfehlumg der europaesschenschjaganfall initiative zur versorgumg andbehandlung des schlaganfalls.intensivmed2001;38:454-70
3. Wade DT, Langeton-hewer R et al; The hemiplegicarm after stroke :measurement and recovery . J.neurol. Neurosurg. Psychetric. 1983;46:521-24
4. Glanz M, Klawansky S ,et al; functional electricalstimulation In post of rehabilitation : a metaanalysis of randomized control trials .arch physmed rehabil 1996;77:549-53
5. JR de Kroon,J H Van der lee et al;theraputicselectrical stimulation to improve motor functionalabilities of the upper extremity after stroke clinicalrehabili .2002;16:350-60
6. King TI: The effect of neuro muscular electricalstimulation in reducing tone.am j occupation ther1996; 50:62-64
7. Joanna Powell, MCSP; A. David Pandyan,et al;Electrical Stimulation of Wrist Extensors in
30. Paras Joshi--154-159.pmd 2/7/2013, 8:08 PM158

Indian Journal of Physiotherapy & Occupational Therapy. January-March 2013, Vol. 7, No. 1 159
Poststroke Hemiplegia; Stroke. 1999; 30:1384-1389.)
8. De Kroon JR, Ijzerman MJ, Lankhorst GJ, ZilvoldG.:electrical stimulation of upperlimb instroke:stimulation of extensors of the handvs.alternate stimulation of flexors andextensors.Am.J.Phys.med.rehab. 2004;83:592-600
9. Green p:prombles of organization of motor system.In Rosan R,and Snell:Progress in theoreticalbiology. Academic press.San Diego 1972.p 304
10. Alfieri V: Electrical treatment of spasticity Scand JRehabili med. 1982;14:177-82
11. Horak ,F:Assumptions underlying motor controlfor neurologic rehabilition .In :contemporarymanagement of motor control problems.proceedings of the 2 step conference. APTA,Alexandri 1992
12. Desrosiers J, Bravo G, Hébert R, Dutil E, MercierL. Validation of the Box and Block Test as a measure
of dexterity of elderly people: reliability, validity,and norms studies. Arch Phys Med Rehabil. 1994Jul;75(7):751-5.
13. Mathiowetz, V., Kashman, N., et al. (1985). “Gripand pinch strength: normative data for adults.”Arch Phys Med Rehabil 66(2): 69-74
14. Chronic motor dysfunction after stroke : recoveringwrist and finger extension by electro myographytriggered neuro muscular stimulation .Stroke 2000June ;30 (6) :1360-1364
15. Catherine M . Dean, Carol L. Richards et al .Taskrelated circuit training improves performance oflocomotor task in chronic stroke : a randomizedcontrolled pilot trial .arch phy med rehab2000;81:409-17
16. N M Salback, N E Mayo et al.A task orientedintervention enhances walking distance andspeed in the 1 st year post stroke : a randomizedcontrolled trial.Clinical rehab 2004 ;18:509-519
30. Paras Joshi--154-159.pmd 2/7/2013, 8:08 PM159

160 Indian Journal of Physiotherapy & Occupational Therapy. January-March 2013, Vol. 7, No. 1
Relationship of Cognition, Mobility and FunctionalPerformance to Fall Incidence in Recovering Stroke
Patients
Paras Joshi1, Hardik Trambadi2
1Lecturer, Shree K K sheth physiotherapy college, Rajkot, 2Lecturer, Parul institute of Physiotherapy, Vadodara
ABSTRACT
Background: People with stroke are at risk of falls. The majorities of individual with stroke has somedegree of residual impairment, but regain walking ability and will be discharged home. Three quartersfell in the first six month after their discharge from hospital. Identify increased knowledge of incrementalrisk factors for falling and the assumption that some of the identified risk factors can be modified maylead to development of intervention to reduce number of falls
Objective: To explore the relationship between cognition, mobility and functional performance withrespect to fall incidence in recovering stroke patients.
Methods: 110 subjects with stroke completed the study. Subjects were assessed on the basis of cognition,mobility and functional performance during 4th week after stroke incidence. Information regardingnumber of falls and characteristic of fall gained during a personal interview after six month fromstroke. Number of falls correlated with baseline scores.
Findings: There is a significant good correlation found between cognition, mobility, and functionalperformance to number of falls in recovering stroke patients.
Conclusion: Cognition, mobility and functional performance might contribute to fall risk and fallrelated injuries in recovering stroke patients.
Keywords: Stroke, Fall Incidence, Cognition, Mobility, Functional Performance.
INTRODUCTION
Stroke is an acute onset of neurological dysfunctiondue to an abnormality in cerebral circulation withresultant sign and symptoms that correspond toinvolvement of focal areas of the brain. The termcerebrovascular accidents (CVA) are usedinterchangeably with stroke to refer to thecerebrovascular conditions that accompany eitherischemic or hemorrhagic lesions.1 Stroke is the mostcommon cause of chronic disability.2 People with strokeare at risk of falls.3,4 The majority of individuals withstroke will have some degree of residual impairment,but will regain walking ability and will be dischargedhome following hospitalization. Although impairmentis common, most people with stroke will regain walkingability; however poor balance and impaired gait canpersist. 5
Studies reported that patients with stroke threequarters fell in the first six months after discharge fromhospital. Stroke patients in acute care and rehabilitationare at high risk of falling and remain a high-risk group
of the first few months after they are discharged tohome. 6-10 Apart from age, osteoporosis, previousfractures, and falls are independent risk for hipfractures.10 Side of the fracture is positively correlatedwith the side of hemi paresis. 11
Patients with stroke have up to a 4 fold increasedrisk of hip facture because of their high incidence offalls.12 It has been shown that stroke patients in additionhave reduced bone mass in their paretic extremities,that this development of hemi osteoporosis is extensiveand pronounced, and that begins early after strokeonset.13
Furthermore, stroke has proved to be a factor for hipfracture among women in case control study14, andsubjects with previous strokes have been overrepresented in a sample of femoral neck fracturepatients.15
Stroke has a relative high risk for falling. Increasedknowledge of incremental risk factors for falling andthe assumption that some of the identified risk factors
31. paras joshi--160-164.pmd 2/7/2013, 8:08 PM160
Indian Journal of Physiotherapy & Occupational Therapy. January-March 2013, Vol. 7, No. 1 161
can be modified may lead to development ofintervention to reduce number of falls.16,17 Fall incidencerates between 23% and 50% have been reported instudies of people with chronic stroke (> 6 months poststroke). 18-21 This rate is much higher than rates reportedfor older community dwelling adults without stroke(11%-30%). 22-24 but lower than rates for people with subacute stroke (1-6 months post stroke) (25%).25 Injury is afrequent consequences of falls in people with chronicstroke, with up to 28% reporting an injury.19
Studies shown that cognitive deficit 18,21,26 functionalimpairments26 and impaired balance 7,26 are related tofall history in people with acute stroke.25 Andcognition18, balance impairment18 and ADL19,21 –increased fall risk in people with chronic stroke.
The identification of fall- prone stroke patients is ofgreat importance. The issue has already been studiedto some extent, and a number of risk factors have beensuggested.27
Postural sway8, increased motor response time tovisual stimuli28, and right ward orienting bias amongright hemisphere stroke patients29 have been associatedwith an increased fall risk.
A multi factorial case control study concluded thata history of falls, impaired decision making ability,perceptual impairment, restlessness, generalizedweakness and abnormal hemocritic level wereindependent fall risk factors among stroke patients inacute care.29,30
Studies shown that 37% stroke survivors reportedat least one fall during the first six months after theirstroke. Among whom those fell, 37 percent suffered aninjury that require medical treatment, and 8 percentsuffered a fracture. Among those who fell, about halffell only once, but 12 percent fell more than five times.The study also found that 77 percent of patients fell athome.31
Study showed that cognition, mobility andfunctional daily activity tend to decline after stroke. 31
The purpose of this study is to correlate thecognition, mobility and functional performance to fallincidence in recovering stroke patients.
OBJECTIVES OF THE STUDY
To explore the relationship between cognition,mobility and functional performance with respect tofall incidence in recovering stroke patients.
HYPOTHESIS
Null hypothesis (H0): There will be no significant
relationship existing between cognition, mobility,functional performance with respect to fall incidenceamong recovering stroke patients.
Alternate hypothesis (H1): There will be asignificant relationship existing between cognition,mobility, functional performance with respect to fallincidence among recovering stroke patients.
MATERIALS AND METHOD
A Prospective observational study was used withpurposive heterogeneous sampling technique.
One hundred and eighteen people with stroke wererecruited on a voluntary basis from vadodara city andsurrounding villages between oct 2009 to may 2011
A written consent was sought from subjectsparticipating in the study.
Selected one hundred and eighteen subjects met theestablished criteria and one hundred and ten (77 maleand 33 female) out them completed the study. Fivesubjects got an addition stroke and three of them weredied.
Subjects who were already diagnosed as stroke byphysician participated in the study. Subjects of bothsexes and either side of paresis, fulfilling the criteriawere taken for the study.
Inclusion Criteria
1. Above 50 years of age.2. With ability to walk 8m (with assistive device, if
required).3. Deemed to be fit for the study and mentally stable.
Exclusion Criteria
1. Major musculoskeletal problems (e.g. amputationor recent joint replacement surgery).
2. Neurological disorder in addition to stroke.3. More than one attack of stroke during study period.4. Perceptual disorders.5. Sever communication problem.
EXAMINATION
Patients were assessed on the basis of cognition,functional performance and mobility during 4th weekafter stroke incidence.
Cognition, Mobility and Functional performancewere assessed by Mini Mental Status Examination(MMSE), Performance Oriented Mobility Assessment(POMA) and Barthel Index respectively.
31. paras joshi--160-164.pmd 2/7/2013, 8:08 PM161

162 Indian Journal of Physiotherapy & Occupational Therapy. January-March 2013, Vol. 7, No. 1
Patients and caretakers were asked to maintain thechart for recording the number of falls, side of fall andinjury if any during the study period.
Patients were informed that a fall was defined ascoming to rest on the floor or another lower level butwas not due to seizures, stroke or myocardial infraction,or an overwhelming displacing force (e.g. earthquake.)
Number of falls recorded between one month poststroke to six month post stroke (20 weeks).
Information regarding number of falls andcharacteristic of falls were gained during a screeninginterview with the patient, six month after stroke.
Assessment for the baseline score and interview forthe number and characteristics of falls were done bydifferent individuals.
Numbers of falls were correlated with the baselinescores
FINDINGS
Table 1. Gender distribution
Males 77
Females 33
Subjects participated in the study with mean age of66.91±7.14. Pearson’s correlation coefficient was usedto determine the relationship among cognition, mobilityand functional performance in relation to occurrenceof falls. P value was kept at 0.01 for statisticalsignificance. SPSS software was used for the statisticalsignificance.
Table 2. Variable analysis
Variable N Mean Standard Pearson’s Correlation Level ofDeviation Coefficient significance
Number of Falls 110 3.0 2.19 — —
MMSE 110 23.57 2.47 -0.76 SS at 0.01statistically significant
POMA 110 21.73 4.33 -0.75 SS at 0.01statistically significant
BI 110 74.25 8.15 -0.64 SS at 0.01statistically significant
Table 3. Characteristics of subjects participated in the study
Right Side Hemiparesis, 45% Left side hemiparesis, 55%
Using walking devices, 65% Independent Walking, 35%
Fallers, 67% Non fallers, 33%
Fall on hemiplegic side, 60% Fall on non hemiplegic side, 7%
Reported serious injuries which required medical treatment, 17% Injuries required no medical intervention, 50%
Reported Fracture because of fall, 11% Fall without fracture, 56%
1 Fall during study period, 45% More than 1 fall, 22%
DISCUSSION
Most of the patients with stroke are prone to fallincidence during recovery stage. The purpose of thisstudy was to determine whether cognition, mobility andfunctional performance could explain falls inindividual with recovering stroke.
It has been found that falls were common occurrencein recovering stroke patients. Most of the patientsreported at least one fall during study period. Subjectswho experienced fall, most of them fell on the pareticside.
In addition, fall related injuries were common,although serious injury was less frequently reported. It
has been found that most of the falls occurred in homeduring walking activities.
In this study measure of cognition, functionalperformance and mobility were clearly able to explainfalls in this population or to discriminate between thosewho had fallen and had not fallen.
It has been hypothesized that MMSE, POMA andBarthel Index score would be associated with fallincidence and be a risk factor for falls in recoveringstroke patients, and result supported the hypothesis.
Some authors32 have suggested that the recall methodof information gathering can produce recall bias but toavoid that patients were asked to maintain chart in terms
31. paras joshi--160-164.pmd 2/7/2013, 8:08 PM162

Indian Journal of Physiotherapy & Occupational Therapy. January-March 2013, Vol. 7, No. 1 163
of calendar and similar explanation was given to thecaregivers.
Comparing age as a risk factor for fall, studiesshowed that fall incidence rate is much lower in oldercommunity dwelling adults without stroke (11%-30%)than rates for people with subacute stroke (25%)4.Reason behind that is pathophysiology of stroke thatchanges the mental state dramatically.2
The scales which have been used for the study areeasily applicable to the patients within short time span,having good reliability33-35 and found useful tool toidentify the subject who has more chances to fallfollowing hospitalization in this study. Howevercognition, mobility and functional performance are notthe only factors responsible for fall incidence, otherfactors needed to be rule out.
LIMITATIONS
The clinical information (cognition, mobility andfunctional status) collected at the time of discharge mayhave been different at the time of fall. But the studyoutcome gave the predictive information about thefuture fall incidence (i.e. six month) with thesemeasures.
During the 20 weeks time frame used for fall history,participants could have experienced on illness (e.g. flu,cold) or an exacerbation or worsening of an existingcondition (e.g. arthritis, dementia) that could havenegatively influenced their functional status at the timeof fall(s). In contrast, participants might have been inworse physical or mental condition at the time ofexamination that at the time of the fall(s).
Fallers who had fractures (11%) must have hadreduce mobility and affected the mobility componentand functional performance (our baseline scores)
With increasing age the cognition, functional statusand mobility level tend to decline, however stroke canworsen the mental status dramatically. Factors such asvestibular function, sensation, perception and homeenvironment have not been assessed in this populationin relation to fall risk.
Clinical implication
Cognition, mobility and functional status level areable to explain the number of falls.
MMSE, POMA I and Barthel Index are easilyapplicable tools and can be applied within minutes.Patients with relative low scores can be advised to becareful or to take further inpatient rehabilitation. Hipprotectors can be given to the patients in order to avoidthe fall related injuries.
Further recommendation
1. Factors such as sensation, perception and homeenvironment can be included in this population.
2. Combination of multiple risk factors can be checkedin relation to fall incidence.
3. Correlation of the variables studied can be done instroke subjects with and without physiotherapyinterventions.
CONCLUSION
MMSE, POMA and Barthel index are able to explainthe fall incidence in recovering stroke patients. There isa significant relationship between cognition, mobilityand functional performance to fall incidence.Cognition, Mobility and functional performance aresome of the factors responsible for falls in recoveringstroke patients, and might contribute to fall and fallrelated injuries.
ACKNOWLEDGEMENT
Sincere thanks to Dr Praful Bamrotia for helping usin data collection.
REFERENCES
1. Susan B. O’ Sullivan, Thomas Schmitz. PhysicalRehabilitation: 5th Edition.
2. Wolf, C: The impact of stroke. Br Med Bul. 2000;56: 275.
3. Post stroke Rehabilitation Guideline panel: Poststroke Rehabilitation clinical practice Guideline.Aspen, Gaitherburg, MD, 1996.
4. Jocelyn E Harris et al. Relationship of balance andmobility to fall incidence in people with chronicstroke, Physical therapy. 2005; 85: 150-158.
5. Jorgense HS et al. Stroke. Neurologic andfunctional recovery- the cogenhagen stroke study.Phy med rehabil clin N Am. 1999; 10: 887-906
6. Anne Forster, John young. Incidence andconsequences of falls due to stroke, a systemicinquiry, BMJ. 1995; 311: 83-86.
7. Nyberg L, Gustafon Y. Patients falls in strokerehabilitation: A challenge to rehabilitationstrategies. Stroke. 1995; 26: 838-842.
8. Sackely CM. Falls, sway and symmetry of weightbearing after stroke. Int. Disabil Stud. 1991; 13:1-4.
9. Byers V et al. Predictive risk factors associated withstroke patients falls in acute care settings. JNeurosci Nurs. 1990; 22: 147-154.
10. Tutuarima JA, Van der Mevlen Jhet al. Risk factorsfor falls of hospitalized stroke patients. Stroke.1997; 28: 297- 301.
31. paras joshi--160-164.pmd 2/7/2013, 8:08 PM163

164 Indian Journal of Physiotherapy & Occupational Therapy. January-March 2013, Vol. 7, No. 1
11. H.C. White: Archives of orthopeadic and Traumasurgery. 1998; 107: 345- 387.
12. Anna Ramnemark, Mikael Nilson et al. Stroke, amajor and increasing risk factor for femoral neckfracture. Stroke. 2003; 31: 157- 168.
13. Hamdy R C, Moore SW et al. Long term effects ofstroke on bone mass. Am J Phys Med Rehabil.1995; 74: 351-356.
14. Grisso JA, Kelsey JL et al. Risk factors for falls as acause of hip fracture in women. N Engli Med. 1991;324: 1326- 1331.
15. Gustasfron Y, Brannstrom B et al. A geriatricanesthesiologic program to reduce acuteconghesional state in elderly patients treated forfemoral neck fractures. J Am Geriatic Soc. 1991;39: 655- 662.
16. Ramnemark A, Nyberg L et al. Progressivehemiosteoporosis on paretic side and increasedbone mineral density in non paretic arm the firstyear after sever stroke. Osteoporos Int. 1999; 9:269- 275.
17. Cahit Ugur, Demet Gucuyener et al. Chracteristicsof falling in patients with storke. J NeurologyNeuro surgery Psychiatry. 2000; 69: 649- 651.
18. Jorgensen L, Engstad Tet al. Higher incidences offalls in long term stroke survivors than inpopulation controls. Depressive symptoms predictfalls after stroke. 2002; 33: 542- 547.
19. Lamb SE, Ferrucci L et al. Risk factors for falling inhome dwelling older women with stroke. Thewomen’s health and aging study. Stroke. 2003; 34:494- 501.
20. Hyndman D, Ashburn A, Stack E. Fall eventsamong people with stroke living in the community.Circumstances of falls and characteristics offallers. Arch Phys Med. Rehabil. 2002; 83:165- 170.
21. Hyndman D, Ashburn A. People with stroke livingin the community: attention deficits, balance, ADLability, and falls. Disabil Rehabil. 2003; 25:817- 822.
22. Graafmans WC, Ooms Me et al. Falls in the eldery.A prospective study of risk factors and risk profiles.Am J Epidemial 1996; 143: 1129- 1136.
23. Bogle Thorbahn LD et al. Use of the Berg balancetest to predict falls in eldery persons. Phy. Ther.1996; 76: 576- 586.
24. Tinnetti ME, Speechley M, Ginter SF. Risk factorsfor falls among eldery persons living in thecommunity. N Engl J M ed 1998; 319: 1701- 1707.
25. Stalpheton T, Ashburn A, Stack E. A pilot study ofattention deficits, balance control and falls insubacute stage following stroke. Clini Rehab. 2001;15: 437- 444.
26. Tea sall R, MC Rac M et al. The incidence andconsequences of falls in stroke patients duringinpatient rehabilitation. Factors associated withhigh risk. Arch Phys Med Rehabil. 2002; 83:329- 333.
27. Lars Nysberg, Yngve Gustafson. Fall predictionindex for patient in stroke rehabilitation. 1997; 28:716- 721.
28. Mayo NE, Lorner Bitensky N, Kaizer F.Relationship between response time and fallsamong stroke patients undergoing physicalrehabilitation. Int J Rehabil Res. 1990; 13: 47- 55.
29. Webster JS et al. Rightward orienting bias, wheelchair maneuring, and fall risk. Archy Phy MedRehabil. 1995; 76: 924- 928.
30. Rapport LJ et al. Predictors of falls among righthemisphere stroke patients in the rehabilitationsetting. Arch Phys Med Rehabil. 1993; 74:621- 626
31. Medline Plus. A service of the U. S. National libraryof medicine and the national institute of Health.15th may 2008.
32. Peeel N. Validating recall of falls by older people.Accidental Analysis and Prevention. 2000; 32:371-372.
33. Marjan J Faber, et al: Clinimetric properties of thePOMA, physical therapy 2006; 86: 944-954.
34. Hsuch I P, Lee M, Hsieh C L. Psychometriccharacteristics of the barthel activities of dailyliving index in stroke patients. J formas Med assoc.2001; 100 (80): 526-532.
35. Folstein MF et al. Mini mental state. A practicalmethod for grading cognitive state of patients forthe clinician, J psychiatr Res 1975; 12: 189
31. paras joshi--160-164.pmd 2/7/2013, 8:08 PM164

Indian Journal of Physiotherapy & Occupational Therapy. January-March 2013, Vol. 7, No. 1 165
Reliability of Modified Modified Ashworth Scale inSpastic Cerebral Palsy
Divya Gupta1, Pooja Sharma2
1Post Graduate student, Amity Institute of Physiotherapy, Amity University Uttar Pradesh, 2Assistant professor, AmityInstitute of Physiotherapy, Amity University, Noida, Uttar Pradesh,
ABSTRACT
Background & Objectives: In assessment of spasticity in the pediatric population, methods used inpractice are ordinal scales that lack reliability. Being a recent scale, Modified Modified Ashworth Scalehas not been used in pediatric population as yet. This study aimed to assess inter- and intra-raterreliability of MMAS in assessing children with spastic cerebral palsy and also compare results withthose of AS and MAS.
Methods & Materials: The study included 40 children with spastic CP with mean age 7.75 yrs.Functional levels of children were classified according to the Gross Motor Function ClassificationSystem. Spasticity in wrist, elbow and knee flexors was assessed according to the AS, MAS, andMMAS.
Results: Interrater reliability and intrarater reliability of MMAS varied from moderate to good.
Conclusions & Interpretations: The MMAS is a reliable tool in assessing children with spastic CP andso are AS and MAS.
Keywords: Spasticity, Cerebral Palsy, Ashworth Scale
Corresponding author:Pooja sharmaAssistant professorAmity institute of physiotherapy, Amity university, NoidaE mail: [email protected]
INTRODUCTION
Cerebral Palsy is defined as a non-progressive groupof disorders of movement and posture due to a defect orlesion of the immature brain.1 It can be further definedas a group of disorders of development of movement,posture and coordination with varied etiologicalassociations and much phenotypic differences in theclinical presentation.2 Of the many types and subtypesof CP, none of them has a known medical cure andtreatment is mainly symptomatic .3,4 One of the majormanifestations of a sufficient intra-partum compromiseof fetal cerebral perfusion include abnormal tone.However a study on the Indian population concludedthat spastic quadriplegia constituted the predominantgroup ( 61%), followed by spastic diplegia (22%).5, 6, 7
Spasticity may be defined as velocity-dependentincrease in muscle tone with exaggerated stretchreflexes.8,9 The nature of spasticity has prompted in a
range of assessment and management techniques.Different methods of spasticity assessment includeelectrophysiological tests, electromyography, dynamicflex meter, myometer, plasticity measurement system,and pendulum test and is kinetic dynamometer.However, they have limited clinical use. Methods mostcommonly used in clinical practice are the AshworthScale, the Modified Ashworth Scale, the Tardieu Scaleand the Modified Tardieu Scale.10 When using clinicalmeasures to assess spasticity, one assesses theresistance to imposed passive movement when the limbis briskly stretched through the full range of availablemovement about a joint.10 The Ashworth scale wascreated in the mid-1960s by Dr Bryan Ashworth as away of judging the effectiveness of anti-spastic drugs.11
It is a 5-point ordinal scale and has been usedextensively since then to assess increase in muscle tonein a range of neurological disorders. The ModifiedAshworth Scale was created in 1987 by Bohannon andSmith who introduced a 1+ grade to increase thesensitivity of the original scale thus making it a 6-pointnominal scale.12 With the MAS grades of ’1’, ’1+’ and’2’ having been questioned as hierarchical levels ofspasticity, recently the Modified Modified Ashworth
32. Pooja Sharma-165-169.pmd 2/7/2013, 8:08 PM165

166 Indian Journal of Physiotherapy & Occupational Therapy. January-March 2013, Vol. 7, No. 1
Scale (MMAS) was created where grade ‘1+’ wasomitted and the grade ‘2’ redefined in the MAS.13 Validand reliable assessment tools are a pre-requisite inestablishing baseline functions and monitoringdevelopmental gains and also to contributing to anincreasing body of evidence-based recommendationsfor CP. 14 Reliability of AS and MAS have been found tobe poor to good as assessed in patients with variousconditions.15,16, 17 18, 19 with values of MAS being slightlyhigher. The existing data suggests that the reliability ofMMAS in patients with lower-limb muscle spasticity isvery good, and it can be used as a measure of spasticityover time.20 21 . Although there are studies that concludeboth AS and MAS are not reliable for the assessment ofmuscle spasticity, however experience and trainingmay improve agreement between the raters.22,23,24 Thereis a need to standardize methods to apply these scalesin clinical practice and research.25, 26, 27 Being a recentscale, the Modified Modified Ashworth Scale has notbeen used in the pediatric population as yet. It providesclearly defined and distinct grades to rate spasticity.Also, the other two scales i.e. AS and MAS give arguableresults over their reliabilities in the same population.The present study aims to assess and the inter- andintra-rater reliability of the MMAS in three differentmuscle groups i.e. the wrist flexors, elbow flexors andknee flexors of children with spastic CP and alsocompare the results with those of the AS and the MASwhich have already been used in the population underconsideration.
METHODOLOGY
Subjects with spastic cerebral palsy belonging to agegroup 4 to 14 years were recruited from Special schoolsin Delhi and NCR whose informed consent had beenattained. All subjects with history of any orthopedicsurgery , botulinum toxin injection or those on oral orintrathecal myorelaxant drugs , mentally retarded wereexcluded. The procedure was explained to the subjectsand their parents. The functional level of participantswas classified according to the expanded and revisedGross Motor Function Classification System ( GMFCS -E & R ). Each subject was assessed by two raters in twodifferent sessions randomly . Both the raters arephysical therapists who are well-versed with theprocedure of the assessment and blinded to the resultsof each other. For the inter-rater reliability componentof the study, a 30-minute interval period is addedbetween the assessments. For the intrarater reliabilitycomponent of the study, one of the raters repeated theprocedure the next day. The measurements were
performed in a quiet environment . Subjects wore looseand comfortable clothing which did not pose anyhindrance to the passive movements. Testingcommenced five minutes after the subjects had beenpositioned. One repetition was done per joint. Thescores for AS, MAS and MMAS were determinedaccording to the level of resistance during the passivemovement of the antagonistic muscles. The musclegroups tested were wrist flexors, elbow flexors, and kneeflexors in the same order. Each test movement wasperformed over a duration of 1 second ( by counting“one thousand one”). A separate recording sheet wasused for each session of each subject. As passivestretching is considered to affect the measurementresults, measurements were repeated once on twodifferent days of the study. To minimize thedisadvantage of stretching of the spastic muscle, faststretching was avoided. The data obtained was laterstatistical analyzed using the SPSS software.
Fig. 1. Testing wrist flexors
Fig. 2. Testing elbow flexors
32. Pooja Sharma-165-169.pmd 2/7/2013, 8:08 PM166

Indian Journal of Physiotherapy & Occupational Therapy. January-March 2013, Vol. 7, No. 1 167
Patient positioned supine on a padded mat table.The patient’s shoulder was in mid-rotation, forearm inmid-pronation and hand was in functional positionwith the distal limb held vertical. Passive movementwas achieved by the rater grasping the hand justproximal to the MCP joints . Movement was from fullflexion to full extension over one second.26
Patient positioned supine on a padded mat table.The patient’s shoulder was in mid-rotation, the forearmin mid-pronation and the hand was in functionalposition. The patient’s elbow was extended passivelyfrom a position of maximal possible flexion to maximalpossible extension over a duration of about one second.The lateral aspect of the forearm was grasped distallywhile applying a constant extensor rotational forceabout the elbow. While the elbow was extended, thearm was also stabilized proximal to the elbow.26
The subject was in a seated position. The distal legwas suspended vertically with the foot off the floor. Thetrunk was stabilized by means of a padded strap drawncomfortably tight around the pelvis and the hip wasstabilized by means of a padded strap comfortably tightacross the proximal legs, half-way between the kneesand the hips. Passive movement was achieved by therater grasping the posterior aspect of the distal leg just
proximal to the ankle and applying a constant extensorrotational force about the knee. Movement is from 90°flexion to full extension over 1 second.26
RESULTS
A total of 40 children were evaluated .AS, MAS, andMMAS scores were considered ordinal and a value of1.5 for MAS were assigned to ratings of 1+ to maintainequal intervals.
TABLE 1 : Mean and standard deviation of age andGMFCS level
Age ( years ) GMFCS level
Mean 7.775 2.375
Standard Deviation 2.823 1.147
TABLE 2 : Interrater reliability of A s,MAS AND MMAS in wrist flexors, ELBOW FLEXORS
AND KNEE FLEXORS
As Wrist Elbow KneeFlexors Flexors Flexors(ICC) (ICC) (ICC)
Single Measures .750 .757 .359
Average Measures .857 .861 .528
MAS
Single Measures .397 .787 .738
Average Measures .569 .881 .849
MMAS
Single Measures .336 .866 .605
Average Measures .503 .928 .754
TABLE 3: Intrarater reliability of AS , MAS ,MMAs inwrist flexors, elbow flexors AND KNEE FLEXORS
As Wrist ELBOW KneeFlexors Flexors Flexors(ICC) (ICC) (ICC)
Single Measures .786 .890 .379
Average Measures .880 .942 .550
MAS
Single Measures .630 .910 .692
Average Measures .773 .953 .818
MMAS
Single Measures .874 .986 .735
Average Measures .933 .993 .847
DISCUSSION
The results of the present study are in accordancewith the existing literature which demonstrate goodinter- and intra-rater reliability for AS, MAS has goodintra- and moderate inter-rater reliability, and MMAShas good intra- and moderate inter-rater reliability inwrist flexors.22,23 For the elbow flexors, all the three scalesAS, MAS, and MMAS have good inter-and intra-rater
Fig. 3. Testing Knee flexors
32. Pooja Sharma-165-169.pmd 2/7/2013, 8:08 PM167

168 Indian Journal of Physiotherapy & Occupational Therapy. January-March 2013, Vol. 7, No. 1
reliability. AS is found to be moderately reliable withMAS and MMAS highly reliable in the knee flexors forlower limbs. Various factors may affect the measurementresults of reliability. While investigating the reliabilityof scales, related joints, anatomical and biomechanicalcharacteristics of muscle groups as well as interraterand intrarater change and biological change should betaken into consideration. Low reliability results ofordinal scales are related to problems which occurduring the measurement of spasticity as well as theenvironment and general condition of the patient. Tominimize this, the measurements were performed in aquiet environment and screened from other patients andtherapists and one repetition was performed per joint.The error with repeated measurements taken ondifferent days would be probably due to systematicchanges in the participant status leading to change inthe tone. However, we considered it was important todocument test-retest variability of repeatedmeasurements by inclusion of an intervening timeperiod because in clinical practice, results from repeatedmeasurements are rarely compared without anintervening time interval. This interval has contributedto an underestimation of intrarater reliability scores inthis study because fluctuations of tone during a singleday as well are well established. For this, grading onthe second day was done at the same time of the day ason the first day. 24 Tone is not static and may changewith time,17 this factor may contribute to low agreementbetween the raters. It is therefore essential that repeatedmovements are kept to a minimum.25 It is not surprisingthat the interrater reliability is higher than the intraraterreliability indicating that these scales should beinterpreted with caution and even the same rater haspossibility of making an error. One possible reason couldbe the clinical environment in the hospital. 26 Findingsof this study are consistent with the previous studiesshowing very good inter- and intra-rater reliabilityscores in elbow flexors for all the three scales AS, MAS,and MMAS; scores for MMAS being the highest. Thecurrent study does not observe any association betweenthe limbs, upper or lower, as well. This is probably dueto the fact that only one muscle group i. e. knee flexorswere investigated in the present study. Future studiesshould include more muscle groups to investigate theeffect of limb, upper or lower, on the reliability scores.The results of the present study are little variant fromthe previous studies due to the age of the populationincluded .Younger kids would be easier to move due tosmaller limbs but would be harder to test due to reasonsof adherence. Out of a total of 40, 10 subjects were inGMFCS level I, 14 in level II, 9 in level III, 5 in level IV,
and 2 in level V. MMAS shows moderate interraterreliability in level II for wrist flexors, and moderate inter-and intra-rater reliability in level III for knee flexors.Reliability of MMAS in levels I and II for all the musclegroups under study was good. It could not be assessedin groups IV and V owing to very small sample size.Hence future studies should assess the reliability witha large sample size of at least 40 in each level. The degreeof training and preparation to use the scales probablyexceeds the preparation of most clinicians using thescales.
CONCLUSION
MMAS is a reliable tool in assessing spasticity inelbow flexors, wrist flexors and knee flexors of childrenas compared to AS and MAS in spastic CP.
Conflict of interest - Nil
REFERENCES
1. P O D Pharaoh, T Cooke, L Rosenbloom. Acquiredcerebral palsy. Arch Dis Child. 1989;64:10103-10116.
2. Carr LJ, Reddy SK, Stevens S, Blair E, Love S.Definition & classification of cerebral palsy. DevMed Child Neurol. 2005; 47: 508-510.
3. Reddihough DS, Collins KJ. The epidemiology andcauses of cerebral palsy. Australian Journal ofPhysiotherapy. 2003;49:7-12.
4. Gad M, Bailik, Uri Givon. Cerebral palsy:Classification and etiology. Acta Orthopaedica etTraumatologica Turcica. 2009; 43: 77-80.
5. Bax M, Tydeman C, Flodmark O. Clinical and MRIcorrelates of cerebral palsy: The European CerebralPalsy study. JAMA. 2006; 296:1602-1608.
6. Singhi PD, Ray M, Suri G. Clinical spectrum ofcerebral palsy in north India- an analysis of 1,000cases. J Trop Pediatr. 2002; 48:162-166.
7. Srivastava VK, Laisram N, Srivastava RK. CerebralPalsy. Indian Pediatr. 1992; 29:993-996.
8. Karen W Krigger. Cerebral palsy : an overview.Am Fam Physician. 2006; 73:91-100.
9. Samuel R Pierce, Richard T Lauer, Patricia AShewokis, Joseph A Rubertone, Margo N Orlin.Test-Retest reliability of isokinetic dynamometerfor the assessment of the spasticity of the kneeflexors and knee extensors in children withcerebral palsy. Arch Phys Med Rehabil. 2006;87:697-702.
10. Mutlu A, Livanelioglu A, Gunel MK. Reliability ofAshworth and Modified Ashworth Scales inchildren with spastic cerebral palsy. BMCMusculoskeletal Disorders. 2008; 9:44.
11. Ashworth B. Preliminary trial of carisoprodol in
32. Pooja Sharma-165-169.pmd 2/7/2013, 8:08 PM168

Indian Journal of Physiotherapy & Occupational Therapy. January-March 2013, Vol. 7, No. 1 169
multiple sclerosis. Practitioner. 1964; 192:540-542.12. Bohannon RW, Smith MB. Interrater reliability of
modified ashworth scale for muscle spasticity.Phys Ther. 1987; 67:206-207.
13. Ansari NN, Naghdi S, Hasson S, Mousakhani A,Nouriyan A, Omidvar Z. Inter-rater reliability ofthe Modified Modified Ashworth Scale as aclinical tool in measurements of post-stroke elbowflexor spasticity. Neurorehabilitation. 2009;24:225-229.
14. Kothari CR, Research Methodology; Methods andTechniques. New Age International Publishers,New Delhi, 2007.
15. Brashear A, Zafonte R, Corcoran M, Jimenez NG,Gracies JM, Williams M, Chia-Ho Lee, Turkel C.Inter- and intrarater reliability of the AshworthScale and the Disability Assessment Scale inpatients upper-limb post-stroke spasticity. ArchPhys Med Rehabil. 2002; 83:1349-1354.
16. Damiano DL, Quinlivan JM, Qwen BF, Payne P,Nelson KC, Abel MF. What does the AshworthScale really measure and are instrumentedmeasures more valid and precise? Dev Med ChildNeurol. 2002; 44:112-118.
17. Gregson JM, Leathley M, Moore AP, Sharma AK,Smith TL, Watkins CL. Reliability of the ToneAssessment Scale and the Modified AshworthScale as clinical tools for assessing post strokespasticity. Arch Phys Med Rehabil. 1999; 80:1013-1016.
18. Fosang AL, Galea MP, McCoy AT, Reddihough DS,Story I. Measures of muscle and joint performancein the lower limb of children with cerebral palsy.Dev Med Child Neurol. 2003; 45:664-670.
19. Clopton N, Dutton J, Featherston T, Grigsby A,Mobley J, Melvin J. Interrater and intrarater
reliability of the modified ashworth scale inchildren with hypertonic. Pediatr Phys Ther. 2005;17:268-274.
20. Ghotbi N, Ansari NN, Naghdi S, Hasson S.Measurement of lower-limb muscle spasticity:Intrarater reliability of Modified ModifiedAshworth Scale. J Rehabil Res Dev. 2011; 48:83-88.
21. Fleuren JF, Voerman GE, Erren-Wolters CV, SnoekGJ, Rietman JS, Hermens HJ, Nene AV. Stop usingthe Ashworth scale for the assessment of spasticity.J Neurol Neurosurg Psychiatry. 2010; 81:46-52.
22. Ansari NN, Naghdi S, Hasson S, Fakhari Z,Mashayekhi M, Herasi M. Assessing the reliabilityof the Modified Modified Ashworth Scale betweentwo physiotherapists in adult patients withhemiplegia. Neurorehabilitation. 2009;25:235-240
23. Ansari NN, Naghdi S, Moammeri H, Jalaie S. Acomparative study on the inter-rater reliability ofthe Ashworth scales in assessment of spasticity.Acta Medica Iranica. 2006; 44:246-250.
24. Haas BM, Bergstrom E, Jamous A, Bennie A. Theinterrater reliability of the original and of themodified ashworth scale for the assessment ofspasticity in patients with spinal cord injury.Spinal cord. 1996; 34:560-564.
25. Pandyan AD, Johnson GR, Price CIM, Curless RH,Barnes MP, Rodgers S. A review of the propertiesof limitations of the Ashworth and modifiedAshworth scales as measures of spasticity. ClinRehabil. 1999; 13:373-83.
26. Blackburn M, van Vliet P, Mockett SP. Reliabilityof measurements obtained with the modifiedAshworth scale in the lower extremities of peoplewith stroke. Phys Ther. 2002; 82:25-34.
32. Pooja Sharma-165-169.pmd 2/7/2013, 8:08 PM169

170 Indian Journal of Physiotherapy & Occupational Therapy. January-March 2013, Vol. 7, No. 1
Evaluation of Pulmonary Function Tests in PatientsUndergoing Laparotomy
Nahar P S1, Shah S H2, Vaidya S M3, Kowale A N4
1Assistant Professor, Department of Physiology, BJ Medical College, Pune, 2Assistant Professor, Department ofPhysiology, BJ Medical College, Pune, 3Professor and Head of the Department, BJ Medical College, Pune, 4Professor and
Head of the Department, Government Medical College, Kolhapur
ABSTRACT
Background: Postoperative pulmonary complications are the most common cause of postoperativemortality and morbidity. In this study we tried to identify patients at high risk of developing postoperativepulmonary complication.
Objectives:1. To compare and evaluate preoperative and postoperative values of pulmonary function tests
parameters.
2. To study the effect of gender difference, site of surgery and body mass index on postoperativepulmonary function parameters.
Methods: Pulmonary Function Parameters were recorded preoperatively one day prior to surgery andpostoperatively on 5th day. PFTs were recorded using RMS Helios spirometer and all the tests wereconducted according to ATS/ERS guidelines.
Parameters recorded : TV,ERV,IRV,IC,VC,MVV,FVC,FEV1,FEV1/FVC,PEFR,PIFR
Statistical analysis were carried out by using t test
Results: We found statistically significant decrease in all the pulmonary function parameters inpostoperative period except that of FEV1/FVC. When we did intergroup statistical analysis, we foundmore decrease in PFT parameters in Male patients, Patients undergoing Upper abdominal surgery andin Obese patients.
Conclusion: Thus after laparotomy there are Restrictive type of ventilatory changes due to pain, alteredpattern of ventilation and diphragmatic weakness.
Male patients, patients undergoing upper abdominal surgeries & obese patients are high risk patientsfor pulmonary complications.
Since these postoperative pulmonary changes can be easily diagnosed by spirometer, all patientsundergoing laparotomy should undergo preoperative and postoperative spirometry.
Also prophylactic preoperative physiotherapy and postoperative deep breathing exercises, incentivespirometry and chest physiotherapy can be beneficial in patients of laparotomy.
Keywords: Laparotomy, Pulmonary Function Tests, Postoperative
Corresponding author:Nahar PradeepDepartment of Physiology, B.J. Medical College, PunePhone numbers - 08237010726E-mail: [email protected]
INTRODUCTION
Nowadays, the scope of surgery has widenedtremendously. But along with this, the increased toll ofcomplications has also come into focus. Even in theface of good surgery, these post-operative complicationscan tilt the balance between success and failure, and
among these, post-operative pulmonary complicationsare especially notorious. Occurrence of these post-operative pulmonary complications can be easilydiagnosed by spirometry. Also these complications canbe prevented by simple pre-operative training andregular post- operative physiotherapy in high riskpatients.
In this study, we hypothesized that after laparotomyin post-operative period there will be decrease inPulmonary function test (PFT) parameters. We alsobelieved that this decrease in PFT parameters is themajor culprit for post-operative pulmonary
33. pradeep nahar--170-175.pmd 2/7/2013, 8:08 PM170

Indian Journal of Physiotherapy & Occupational Therapy. January-March 2013, Vol. 7, No. 1 171
complications. In order to indentify the high riskpatients we also studied the effect of gender difference(Male, Female), site of surgery (Upper abdomen, Lowerabdomen) and BMI (Obese, Non obese) on post-operative PFT parameters.
Aims and objectives
1) To record various pulmonary function parameters(TV, ERV, IRV, VC, IC, MVV FVC, FEV1, FEV1/FVC,PEFR and PIFR) preoperatively and postoperativelyin patients undergoing laparotomy.
2) To compare and evaluate alterations betweenpreoperative and postoperative values ofpulmonary function parameters.
3) To study the effect of gender difference, site ofsurgery and Body Mass Index on postoperativepulmonary function parameters as compared totheir preoperative values.
MATERIALS AND METHOD
The study protocol was approved by theInstitutional Ethics Committee. Patients were selectedfrom those admitted to Surgery and Gynaecology wardof the Sassoon General hospital. 28 males and 22females of the age group 30-60 years undergoingplanned laparotomy were selected for the study. Thestudy protocol was explained in detail to the selectedpatients. All the patients willing to participate in thestudy were asked to fill an informed consent form.Pulmonary function parameters were recorded pre-operatively on one day prior to surgery and the post-operative readings were taken on fifth post-operativeday. The PFTs were measured using a computerizedportable RMS Helios 702(Chandigarh) spirometer(Photograph 1). This spirometer is automated and hasa flow sensor which converts the airflow signals todigital signals. Values obtained were in litres and theywere compared with the existing database for the normalhealthy Indian population depending on age, sex,height and weight. Patients with history of cardio-respiratory diseases, diabetes mellitus or hypertensionwere excluded from the study. Also patients who hadintra-operative complications, post-operativepulmonary, cardiac or surgical complications wereexcluded.
The tests were conducted according to the AmericanThoracic Society/ European Respiratory Society (ATS/ERS) task force guidelines. The pulmonary functionswere recorded in the sitting position and before thesubject had lunch. The subjects were instructed to wearloose clothes on the day of test. Name, age, sex, height
and weight were entered in the spirometer. Theprocedures of all maneuvers were demonstrated to thesubject using disposable mouthpiece.
The Slow Vital Capacity (SVC) maneuver wasconducted in the following order:
Subjects were instructed to breathe normally throughthe mouthpiece. After the three normal breaths, theywere asked to take deep inspiration followed by forcefulexpiration. And again they were asked to take threenormal breaths without removing the mouthpiece.Parameters recorded in this manoeuvre were Tidalvolume (TV) in litres, Expiratory reserve volume (ERV)in litres, Inspiratory reserve volume (IRV) in litres,Inspiratory capacity (IC) in litres, Vital capacity (VC) inlitres.
The Forced Vital Capacity (FVC) maneuver wasconducted in the following order:
Subjects were instructed to take slow and deepinspiration. Then subjects were instructed to hold themouthpiece in the mouth with lips pursed around itand asked to blow forcefully into the mouthpiece aslong as possible without hesitation and coughing. Thenwithout removing the mouthpiece from the mouth, theywere instructed to inspire maximally through themouthpiece. Parameters recorded in this maneuverwere Forced vital capacity (FVC) in litres, Forceexpiratory volume in one second (FEV1) in litres, FEV1/FVC in %, Peak expiratory flow rate (PEFR) in litre persecond and Peak inspiratory flow rate (PIFR) in litreper second.
The Maximum Voluntary Ventilation (MVV)maneuver was conducted in following order:
Subjects were instructed to breathe in and out asrapidly and deeply as they can for a period of 15seconds through the mouthpiece. All the recordedmaneuver results were analyzed for acceptability andrepeatability. Three acceptable readings were taken andtheir mean values were calculated and analyzed.
Statistical analysis was carried out by Student’s ttest SPSS software( version 11).
FINDINGS
We found that post-operatively there is decrease inTV by 21.87%, ERV by 22.01%, IRV by 23.64%, IC by26.23%, VC by 25.54%, MVV by 26.28%, FVC by 26.32%,FEV1 by 28.97%, FEV1/FVC by 3.48%, PEFR by 32.31%and PIFR by 41.73%. All these differences werestatistically significant except that in FEV1/FVC. (Table1, Figure 1)
33. pradeep nahar--170-175.pmd 2/7/2013, 8:08 PM171

172 Indian Journal of Physiotherapy & Occupational Therapy. January-March 2013, Vol. 7, No. 1
Intergroup statistical analysis between Male andFemale patients showed that post-operative percentagedecrease was more in Male patients as compared tothat in Female patients. (Table 2, Figure 2)
Intergroup statistical analysis between patientsundergoing upper abdominal surgery and patientsundergoing lower abdominal surgery showed that post-
operative percentage decrease was more in patientsundergoing upper abdominal surgery. (Table 3,Figure 3)
Intergroup statistical analysis between obese andnon obese patients showed that post-operativepercentage decrease was more in obese patients ascompared to the non obese patients. (Table 4, Figure 4)
Table 1: Mean preoperative and postoperative values of pulmonary function parameters with postoperativepercentage decrease
Parameter Mean SD Preoperative Postoperative mean p valuedifference (Percentage %)
TV_PRE (in Lit.) 0.352 0.06 0.077 (21.87%) < 0.05*
TV_POST (in Lit.) 0.275 0.04
ERV_PRE (in Lit.) 0.763 0.18 0.168 (22.01%) < 0.05*
ERV_POST (in Lit.) 0.595 0.15
IRV_PRE (in Lit.) 2.580 0.26 0.610 (23.64%) < 0.05*
IRV_POST (in Lit.) 1.970 0.21
IC_PRE (in Lit.) 2.893 0.34 0.759 (26.23%) < 0.05*
IC_POST (in Lit.) 2.134 0.28
VC_PRE (in Lit.) 3.640 0.52 0.930 (25.54%) < 0.05*
VC_POST (in Lit.) 2.710 0.30
MVV_PRE (Lit/min.) 91.320 7.91 24.000 (26.28) < 0.05*
MVV_POST (Lit/min.) 67.320 6.90
FVC_PRE (in Lit) 3.230 0.42 0.850 (26.32) < 0.05*
FVC_POST (in Lit) 2.380 0.36
FEV1_PRE (in Lit.) 2.830 0.42 0.820 (28.97) < 0.05*
FEV1_POST(in Lit.) 2.010 0.32
FEV1/FVC_PRE (in %) 86.700 4.82 3.020 (3.48) > 0.05
FEV1/FVC_POST (in %) 83.680 6.01
PEFR_PRE (Lit/sec.) 6.072 1.31 1.962 (32.31) < 0.05*
PEFR_POST (Lit/sec.) 4.110 1.04
PIFR_PRE (Lit/sec.) 6.072 1.31 2.534 (41.73) < 0.05*
PIFR_POST (Lit/sec.) 3.538 0.88
Pre: Preoperative
Post: Postoperative
*< .05: statistically significant
Table 2: Postoperative Percentage decrease in pulmonary function parameters in relation to the gender difference
Parameters MALE, Postoperative FEMALE ,Postoperativepercentage decrease percentage decrease
TV 25.00 20.00
ERV 24.44 18.64
IRV 25.45 21.85
IC 28.01 23.30
VC 27.59 22.76
MVV 28.15 23.61
FVC 27.66 24.57
FEV1 30.23 27.41
FEV1/FVC 4.22 2.56
PEFR 34.31 29.44
PIFR 43.74 38.60
33. pradeep nahar--170-175.pmd 2/7/2013, 8:08 PM172

Indian Journal of Physiotherapy & Occupational Therapy. January-March 2013, Vol. 7, No. 1 173
Table 3: Postoperative Percentage decrease in pulmonary function parameters in relation to the site of surgery
Parameters UPPER ABDOMAN, LOWER ABDOMAN,Postoperative Postoperative
percentage decrease percentage decrease
TV 26.47 20.00
ERV 24.32 20.77
IRV 25.09 21.40
IC 29.65 22.02
VC 29.47 21.85
MVV 27.81 24.19
FVC 29.79 23.05
FEV1 32.35 26.19
FEV1/FVC 3.69 3.28
PEFR 35.96 28.87
PIFR 45.70 37.90
Table 4: Postoperative Percentage decrease in pulmonary function parameters in relation to the BMI
Parameters OBESE, Postoperative NON OBESE,percentage Postoperative percentage
decrease decrease
TV 23.52 19.44
ERV 22.97 21.51
IRV 24.80 22.48
IC 28.32 23.50
VC 26.40 24.86
MVV 27.98 24.53
FVC 28.52 24.08
FEV1 30.85 27.11
FEV1/FVC 4.50 2.34
PEFR 35.57 28.91
PIFR 43.80 39.58
DISCUSSION
To the best of our knowledge no one has studied allthe PFT parameters as a whole in postoperative periodas we did. Few authors have studied some parametersin laparotomy patients. Beecher HK [2] found a greaterdecrease in TV, ERV, IRV and VC as compare to ourstudy. This may be due to the fact that their studymeasured PFT parameters on 2nd postoperative daywhile ours was on 5th postoperative day. Similar studyconducted by Collins et al [3] on FVC, FEV1, FEV1/FVCand PEFR showed lower decrease in PFT parametersthis may be due to they have studied it on 7th
postoperative day. Very few authors have studied effectof laparotomy on PIFR.
We found that post-operatively there wasstatistically significant decrease in all PFT values exceptthat of FEV1/FVC. Thus post-operatively there isrestrictive type of ventilatory dysfunction which isresponsible for various post-operative pulmonarycomplications. The various mechanisms responsible for
this post-operative pulmonary dysfunction are:
Impaired ventilation in post-operative period dueto diaphragmatic dysfunction which can be proved by:a) Decreased diaphragmatic excursions [4] b)Paradoxical motion of the diaphragm [5] c) Loss of thediaphragm’s normal inspiratory - expiratory phasicactivity [6] d) Decrease in trans-diaphragmatic pressureby almost 70% [7]
Adaptation of shallow breathing pattern withoutperiodic deep breathing in post-operative period resultsin decreased surfactant secretion by type II alveolarepithelial cells. This decrease in surfactant secretioncauses post-operative atelectasis, thus decreasing PFTvalues.[8]
It has been proved that there is dysfunction ofintercostal muscles in post-operative period. Intercostalmuscles play an important role in forceful respiration.So their dysfunction results in decrease in PFTvalues.[8] The situation is further aggravated by certain
33. pradeep nahar--170-175.pmd 2/7/2013, 8:08 PM173

174 Indian Journal of Physiotherapy & Occupational Therapy. January-March 2013, Vol. 7, No. 1
post-operative factors such as prolonged recumbency,supine position and tight dressing over abdomen.[9]
Intergroup statistical analysis showed that malepatients are more severely affected than female patients.Various reasons that can be put forward for thisdifference are
1) Type of breathing[10], Normally during quietrespiration males show abdomino-thoracic type ofbreathing, while females have thoraco-abdominaltype of breathing. Thus abdominal component ispredominant in males and this abdominalcomponent is mainly affected during laparotomy.
2) Progesteron, the female sex hormone, has its owninfluence on chemoreceptor cells in medulla.Progesterone increases sensitivity of respiratorycenter to CO2. So whenever there are postoperativeventilation abnormalities in females, it causesstimulation of respiratory center due to progesteroneand this may improve postoperative pulmonaryfunction in them.[11]
Patients undergoing upper abdominal surgery aremore affected than that of lower abdominal surgeries
This can be explained by the fact that thediaphragmatic weakness is the main cause of post-operative pulmonary dysfunction and thisdiaphragmatic dysfunction mainly depends uponproximity of operative site to diaphragm. The proximityof operative site is inversely related to diaphragmaticfunction. This finding has been supported by thedecrease in maximum inspiratory pressure, trans-diaphragmatic pressure and expiratory muscle pressureobserved after upper abdominal surgery in severalstudies. [ 12 13,14,15] This decrease is sustained for 48 hoursafter surgery and may persist for a week. [16,17]
Furthermore, upper abdominal surgeries causepredominantly rib cage breathing in post-operativeperiod, as shown by an increase in the ratio ofoesophageal to gastric pressure swings (ÄPoes/ÄPga)and by decrease in the abdominal to rib cage excursions.This indicates that the intercostal inspiratory musclesare more active after upper abdominal surgery. [12,14] Thisis because the diaphragm is the muscle that is mainlyaffected during upper abdominal surgery. Themechanism that underlies the reduction indiaphragmatic strength and the shift to predominantlyrib cage breathing is not fully understood, butanaesthesia and pain are definitely responsible for thisdysfunction, some studies in animals and humans alsoshowed that an inhibitory reflex generated during the
surgical procedure is the major mechanism.Manipulation of the splanchnic organs duringlaparotomy causes reflex inhibition of the phrenic nerveoutput decreasing diaphragmatic function. [15]
Thus upper abdominal operations are associatedwith substantially worse diaphragmatic functionpostoperatively than are lower abdominal operations,and the risk of postoperative pulmonary complicationsis accordingly higher by a factor of 1.5. [18]
CONCLUSION
We found after laparotomy in postoperative period,there are restrictive type of ventilatory changes. All thesepostoperative PFT decrease are more in male patients,in patients undergoing upper abdominal surgeries andin obese patients.
All these changes are favorable for producingpostoperative pulmonary complications. These changesare mainly due to altered pattern of ventilation inpostoperative period.
Since these postoperative pulmonary changes canbe easily diagnosed by spirometer, all patientsundergoing laparotomy should undergo preoperativeand postoperative spirometry. Also prophylacticpreoperative physiotherapy and postoperativeinterventions such as deep breathing exercises,incentive spirometry and chest physiotherapy shouldbe advised to all patients undergoing laparotomy. Thesesimple and inexpensive procedures can make asignificant difference in patients outcome afterlaparotomy.
This will definitely reduce mortality and morbidityafter laparotomy and will give very good results tosurgeon who had used good surgical technique andalert mind for betterment of his patients.
REFERENCES
1. Miller MR, Hankinson J, Brusasco V, Burgos F,Casaburi R, Coates A et al. Standardization ofspirometry. Eur Respir J 2005;26:319-38
2. Beecher HK. Effect of laparotomy on lung volume:Demonstration of a new type of pulmonarycollapse. J Clin Invest 1933;651:12.
3. Collins CD, Darket MD, knowelden J. Chestcomplications after upper abdominal surgery:Their anticipation and prevention. Brit Med J 1968;1: 401-06.
33. pradeep nahar--170-175.pmd 2/7/2013, 8:08 PM174

Indian Journal of Physiotherapy & Occupational Therapy. January-March 2013, Vol. 7, No. 1 175
4. Rehder K, Sessler AD, Marsh HM. Generalanesthesia and the lung. Am Rev Respir Dis 1975;112:541-63.
5. Marsh HM, Rehder K, Sessler AD, Fowler WS.Effects of mechanical ventilation, muscle paralysisand posture on ventilation-perfusionrelationships in anesthetized man.Anesthesiology 1973; 38(1): 59-67.
6. Russel WJ. Position of patient and respiratoryfunction in immediate postoperative period.BMJ1981;283:1079-80
7. Simonneau G, Vivien V, Saltine R. Diaphragmaticdysfunction induced by upper abdominal surgery:role of postoperative pain. Am Rev Respir Dis 1983;128:899
8. Rehder K. Anesthesia and the respiratory system.Can Anesth Soc J 1979; 26(6):451-62.
9. Brook lord. Abdominal operations.1969.5th ed.New York. p 484-91
10. Guyton and Hall. Textbook of Medical Physiology.11th ed. Elsevier Pvt. Ld.;2006: p 471-80.
11. Keele C, Neil E, Joels N. Samsung Wrights AppliedPhysiology. 13th ed. Oxford University Press;2000p 584
12. Ford GT, Whitelaw WA, Rosenal TW, Cruse PJ,Guenter CA. Diaphragm function after upper
abdominal surgery in humans. Am Rev Resp Dis1983; 127: 431-36.
13. Celli BR, Rodriguez KS, Snider GL. A controlledtrial of intermittent positive pressure breathing,incentive spirometry, and deep breathing exercisesin preventing pulmonary complications afterabdominal surgery. Am Rev Resp Dis 1984; 130:12-15.
14. Ford GT, Rosenal TW, Clergue F. Respiratoryphysiology in upper abdominal surgery. ClinChest Med 1993;14:237–52.
15. Watters JM, Clancey SM, Moulton SB. Impairedrecovery of strength in older patients after majorabdominal surgery. Ann Surg 1993; 218:380–90.
16. Putensen-Himmer G, Putensen C, Lammer H.Comparison of postoperative respiratory functionafter laparoscopy or open laparotomy forcholecystectomy. Anesthesiology 1992; 77:675–80.
17. Siafakas NM, Stoubou A, Stathopoulou M. Effectof aminophylline on respiratory muscle strengthafter upper abdominal surgery: a double blindstudy. Thorax 1993; 48:693–7.
18. Mitchell C, Garrahy P, Peake P. Postoperativerespiratory morbidity: identification and riskfactors. Aust N Z J Surg 1982; 52:203–9.
33. pradeep nahar--170-175.pmd 2/7/2013, 8:08 PM175

176 Indian Journal of Physiotherapy & Occupational Therapy. January-March 2013, Vol. 7, No. 1
Evaluation of Standardized Backpack weight and itsEffect on Shoulder & Neck Posture
Pardeep PahwaLect. in Physical Therapy, Composite Regional Centre for Persons with Disabilities (Ministry of Social Justice &
Empowerment , Govt of India) Sundernagar (HP)
ABSTRACT
The Backpack is one of several forms of manual load carriage that provides versality and is often usedby hikers, backpackers, and soldiers as well as school student. Students have emerged as anotherpopulation of backpackers who carry their school supplies in book bags which are backpacks. As thestudents progress through the school grades the amount of homework and backpack loads of schoolage children increases. We all want our children to do well in school.16 To initiate an educationalprogram regarding school backpack safety in our area, it is essential to know the 'weight' of backpackstudents are currently carrying.
Keywords: Backpackpack, Craniohorizontal angle, Craniovertebral angle, Sagittal Shoulder posture, AnteriorHead Alignment.
INTRODUCTION
The Backpack is one of several forms of manual loadcarriage that provides versality and is often used byhikers, backpackers, and soldiers as well as schoolstudent. The Backpack is an appropriate way to loadthe spine closely and symmetrically, whilstmaintaining the stability. However, musculoskeletalproblems associated with backpack use have becomean increasing concern with school children.1
Students have emerged as another population ofbackpackers who carry their school supplies in bookbags which are backpacks. Carriage of backpack appliesa substantial load to spine to school children.2
As the students progress through the school gradesthe amount of homework and backpack loads of schoolage children increases. As a result the students carryall their materials in book bags. This has lead to physicalcomplaints in the form of muscle soreness (67.1%), backpain (50.8%), numbness (24.5%) and shoulder pain(14.7%). The most commonly reported medical problemis plexus or peripheral nerve injury. Physicalexamination can often reveal weakness, numbness andpossible muscle atrophy.3 The Backpack loadingproduce changes in standing posture when comparedwith unloaded standing posture which has been relatedto spinal pain.4
Although it is unclear whether backpacks can causepermanent damage, the healthcare costs associated
with strain and pain could be enormous.5 School bagsare felt to be heavy by 79% of children, to cause fatigueby 65.7%10.
We all want our children to do well in school.7 Toinitiate an educational program regarding schoolbackpack safety in our area, it is essential to know the‘weight’ of backpack students are currently carrying.This information could be incorporated into schoolcurriculum or distributed as a handout for children totake home to their parents. Many researches have beendone on amount of load carried by student and theireffect on shoulder and neck alignment is between 10%and 17% of students’ body weight.1
Chansirinukor et al6 suggested that a backpack loadof 15% body weight is too heavy for adolescents tomaintain a prolonged standing posture.
Furjuouh el al5 reported that backpack carried bymajority of school students, in the sample are no longerheavier than 10% of body weight which is associatedwith complaints of pain in back, shoulder, neck or otherareas of body. Pascoe et al6 reported that mean weightof school bags was 17% of students mean body weight.
The previous study done by Chansirinukor et al1
showed that carrying a load of less than 15% of bodyweight should be recommended, but none of study hasshown the particular amount of backpack weight, fromwhere the change in craniohorizontal andcarniovertebral angle starts which leads to change incervical and shoulder posture.
34. Pradeep pehwa--176-184.pmd 2/7/2013, 8:08 PM176

Indian Journal of Physiotherapy & Occupational Therapy. January-March 2013, Vol. 7, No. 1 177
Aims and Objectives
• To determine the particular amount of backpackweight carried by students that does not changethe students cervical and shoulder posture.
• To implement and recommend maximum weight ofbackpack that should be carried by students.
Statement of Question
• How much percentage of backpack weight shouldbe carried by students that does not change studentposture?
METHODOLOGY
Sample
A total of 10 school boys aged between 13 and 17years old recruited as subjects. They were recruited fromthe G.N.D public school, Dehradun. This study wasconducted at gymnasium of Dolphin Institute,Dehradun.
Inclusion Criteria
1. Subjects with in age group of 13-17years.
2. Height of subjects 90-160 cms .
3. Weight of subjects 30-60 kg.
Exclusion Criteria
1. Subjects with postural abnormality , LLD, cervicaland shoulder pain
2. Balance disorder
3. Congenital abnormality such as spina bifida,cervical rib, deformity of spine.
4. Subjects with forward head posture, history ofrecent fracture.
Instrumentation
1. Metter Digital Electronic Scale
2. Digital Video Camera
3. Height Statuometer
4. Adhesive Markers
5. Book Bags
6. Educational Material
7. Motion Analysis Software
Study Design
This study was an observational study design.
PROCEDURE
All the subjects were tested in DIBNS gymnasiumTo capture postural information on body segments,clothing was rearranged so that shoulder and upperhalf body exposed. With the subjects standing, adhesivemarkers (Bindis) were placed on anatomical pointscomprising :-
1. The External canthus of right eye.
2. Right tragus of the ear.
3. Inferior margins of both ears.
4. A midpoint between greater tuberosity of humerusand posterior aspect of acromion process of rightshoulder; and
5. Spinous process of C7.
A small reflective ball was placed over the spinousprocess of C7 The lateral malleoli were placed betweenparallel lines, which are perpendicular to frontal Plane,2 cm apart. The photographs were obtained using adigital kodak camera that was attached to tripod. Thetripod was secured in correct position on floor by usingmasking tape for the sagittal view photography, thesubject were placed 2.8 m from the camera and 1.8 mfrom the camera for frontal view photography. Thenthe subject were photographed from both lateral viewand from anterior aspect at same time with
1. Unloaded
2. Carrying a backpack weighing 8% to 20% of bodyweight by adding 1% weight of body weight & soon.
In order to evaluate posture of cervical and shoulderregion, motion analysis software (protrainer 6.1 sportsmotion) was employed to calculate the angles from eachanatomical landmark from the photographs. The anglesin the lateral and frontal view thus calculated andreadings taken for the data analysis.
The four angles of measurement are
Craniohorizontal Angle1
The angle formed at intersection of a horizontalline through tragus of ear and a line joining the tragusof ear and external canthus of eye. It is believed to providean estimation of head on neck angle or position of uppercervical spine
34. Pradeep pehwa--176-184.pmd 2/7/2013, 8:08 PM177

178 Indian Journal of Physiotherapy & Occupational Therapy. January-March 2013, Vol. 7, No. 1
Craniovertebral Angle1
It is angle formed at the intersection of a horizontalline through the spinous process of C7 and a line to thetragus of ear. This is believed to provide an estimationof neck on upper trunk position.
Sagittal Shoulder Posture1
The angle formed by intersection of horizontal linethrough C7 and a line between the mid point of greatertuberosity of humerus and posterior aspect of acromion.This angle provides a measurement of forward shoulderposition
Anterior Head Alignment1
A line drawn between the inferior tip of left and rightears, and the angle of this line to horizontal. Thismeasurement described how level the head was whenviewed from the frontal.
DATA ANALYSIS
The significance of postural changes from wherethe change starts in data were estimated by using pairedt-test on each postural angle within which plannedcontrast were made of unloaded condition with loadedbackpack weight from pair 1 to pair 13 including 8%upto 20% of body weight. The statistical significant levelof this study was set at 0.025.
RESULTS
The mean and standard deviation for physicalcharacteristics of all the 10 subjects were taken i.e. age(14.1 + 1.19) yrs, weight (44.3 + 7.84) kg and height(145.4 + 8.60) cms. The mean and standard deviation ofboth unloaded and loaded CHA, CVA, SSP and AHAfrom pair 1 to pair 13 were analysed by using paired ‘t’test.
Table: 1 Showing comparison of mean and standard deviation for each unloaded and loaded condition ofCraniohorizontal angle at different percentages of body weight (8%-20%)
Variable Mean±SD t-value p-value Variable Mean±SD t-value p-value
Pair 1 Pair 8
ULCHA 16.4±2.5 2.53 .032 ULCHA 16.4±2.5 8.29 .000
LCHA8 19.0±3.9 LCHA15 24.2±1.98
Pair 2 Pair 9
ULCHA 16.4±2.5 6.10 .000 ULCHA 16.4±2.5 8.33 .000
LCHA9 21.2±2.2 LCHA16 25.8±3.0
Pair 3 Pair 10
ULCHA 16.4±2.5 3.86 .004 ULCHA 16.4±2.5 15.73 .000
LCHA10 21.3±4.3 LCHA17 27.4±2.3
Pair 4 Pair 11
ULCHA 16.4±2.5 4.02 .003 ULCHA 16.4±2.5 16.14 .000
LCHA11 22.9±4.8 LCHA18 27.7±1.8
Pair 5 Pair 12
ULCHA 16.4±2.5 4.81 .001 ULCHA 16.4±2.5 12.75 .000
LCHA12 24.1±4.9 LCHA19 28.0±2.1
Pair 6 Pair 13
ULCHA 16.4±2.5 6.74 .000 ULCHA 16.4±2.5 11.69 .000
LCHA13 25.3±3.7 LCHA20 28.1±2.9
Pair 7
ULCHA 16.4±2.5 7.20 .000
LCHA14 25.0±3.0
34. Pradeep pehwa--176-184.pmd 2/7/2013, 8:08 PM178

Indian Journal of Physiotherapy & Occupational Therapy. January-March 2013, Vol. 7, No. 1 179
Graph: 1 Showing comparison of backpack load at different percentage of body weight with unloaded condition forCraniohorizontal Angle.
0
5
10
15
20
25
30
8 9 10 11 12 13 14 15 16 17 18 19 20
Percentage of body weight
De
gre
e
Table: 2 Showing comparison of mean and standard deviation for each unloaded and loaded condition ofCraniovertebral angle at different percentages of body weight (8%-20%)
Variable Mean±SD t-value p-value Variable Mean±SD t-value p-value
Pair 1 Pair 8
ULCVA 48.7±3.9 .937 .373 ULCVA 48.7±3.9 3.80 .004
LCVA8 47.9±4.4 LCVA15 42.9±6.8
Pair 2 Pair 9
ULCVA 48.7±3.9 .929 .377 ULCVA 48.7±3.9 4.65 .001
LCVA9 47.2±6.4 LCVA16 42.8±6.2
Pair 3 Pair 10
ULCVA 48.7±3.9 1.27 .235 ULCVA 48.7±3.9 3.75 .006
LCVA10 46.7±6.6 LCVA17 42.0±6.6
Pair 4 Pair 11
ULCVA 48.7±3.9 2.74 .023 ULCVA 48.7±3.9 4.89 .001
LCVA11 45.4±5.8 LCVA18 41.8±6.4
Pair 5 Pair 12
ULCVA 48.7±3.9 3.32 .009 ULCVA 48.7±3.9 4.311 .002
LCVA12 43.4±6.9 LCVA19 42.3±6.9
Pair 6 Pair 13
ULCVA 48.7±3.9 2.90 .017 ULCVA 48.7±3.9 4.451 .002
LCVA13 43.3±7.14 LCVA20 41.1±7.6
Pair 7
ULCVA 48.7±3.9 3.47 .007
LCVA14 43.0±6.737
34. Pradeep pehwa--176-184.pmd 2/7/2013, 8:08 PM179

180 Indian Journal of Physiotherapy & Occupational Therapy. January-March 2013, Vol. 7, No. 1
Graph: 2 Showing comparison of backpack load at different percentage of body weight withunloaded condition for Craniovertebral Angle
35
37
39
41
43
45
47
49
51
8 9 10 11 12 13 14 15 16 17 18 19 20
Percentage of body weight
De
gre
e
Table: 3 Showing comparison of mean and standard deviation for each unloaded and loaded condition of Sagittalshoulder posture at different percentages of body weight (8%-20%)
Variable Mean±SD t-value p-value Variable Mean±SD t-value p-valuePair 1 Pair 8
ULSSP 59.1 ± 6.2 1.66 0.131 ULSSP 59.1 ± 6.2 .478 0.644
LSSP8 56.9 ± 6.1 LSSP15 58.6 ± 6.3
Pair 2 Pair 9
ULSSP 59.1 ± 6.2 .246 0.811 ULSSP 59.1 ± 6.2 .599 0.564
LSSP9 56.9 ± 5.08 LSSP16 59.7 ± 7.04
Pair 3 Pair 10
ULSSP 59.1 ±6.2 .969 0.358 ULSSP 59.1 ± 6.2 .073 0.944
LSSP10 57.8 ± 5.5 LSSP17 59.2 ± 6.3
Pair 4 Pair 11
ULSSP 59.1 ± 6.2 .793 0.448 ULSSP 59.1 ± 6.2 .209 0.839
LSSP11 59.8 ± 5.9 LSSP18 58.8 ± 6.3
Pair 5 Pair 12
ULSSP 59.1± 6.2 .194 0.850 ULSSP 59.1 ± 6.2 .635 0.541
LSSP12 59.3 ± 7.1 LSSP19 60.0 ± 7.2
Pair 6 Pair 13
ULSSP 59.1 ± 6.2 .588 0.571 ULSSP 59.1 ± 6.2 .082 0.936
LSSP13 58.2 ±7.1 LSSP20 59.0 ± 6.6
Pair 7
ULSSP 59.1± 6.2 .085 0.934
LSSP14 59.2 ± 6.4
34. Pradeep pehwa--176-184.pmd 2/7/2013, 8:08 PM180

Indian Journal of Physiotherapy & Occupational Therapy. January-March 2013, Vol. 7, No. 1 181
Graph: 3 Showing comparison of backpack load at different percentage of body weight with unloadedcondition for Sagittal shoulder posture.
0
10
20
30
40
50
60
8 9 10 11 12 13 14 15 16 17 18 19 20Percentage of body weight
Degre
e
Table: 4 Showing comparison of mean and standard deviation for each unloaded and loaded condition of Anteriorhead alignment at different percentages of body weight (8%-20%)
Variable Mean±SD t-value p-value Variable Mean±SD t-value p-value
Pair 1 Pair 8
ULAHA 1.0± .66 1.0 0.34 ULAHA 1.0± .66 4.9 0.001
LAHA8 1.2 ±.42 LAHA15 2.3± .82
Pair 2 Pair 9
ULAHA 1.0± .66 1.9 0.081 ULAHA 1.0± .66 4.8 0.001
LAHA9 1.3 ± .48 LAHA16 2.2 ± .63
Pair 3 Pair 10
ULAHA 1.0± .66 1.8 0.104 ULAHA 1.0± .66 4.7 0.001
LAHA10 1.4 ± .51 LAHA17 2.6 ± 1.07
Pair 4 Pair 11
ULAHA 1.0± .66 1.8 0.096 ULAHA 1.0± .66 8.5 0.000
LAHA11 1.5 ± .70 LAHA18 2.3 ± .67
Pair 5 Pair 12
ULAHA 1.0± .66 2.2 0.051 ULAHA 1.0± .66 9.7 0.000
LAHA12 1.6 ± .57 LAHA19 2.6 ± .51
Pair 6 Pair 13
ULAHA 1.0± .66 3.2 0.011 ULAHA 1.0± .66 7.2 0.000
LAHA13 1.8 ± .78 LAHA20 2.8 ± .42
Pair 7
ULAHA 1.0± .66 3.3 0.008
LAHA14 2.0 ± .94
34. Pradeep pehwa--176-184.pmd 2/7/2013, 8:08 PM181
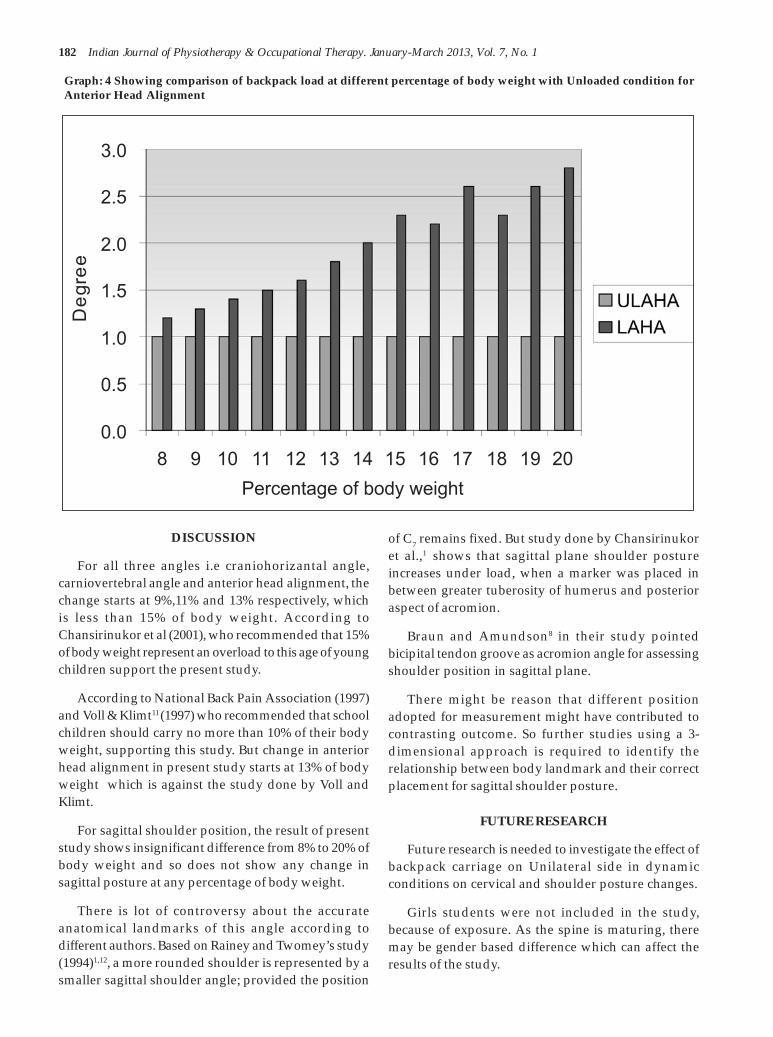
182 Indian Journal of Physiotherapy & Occupational Therapy. January-March 2013, Vol. 7, No. 1
Graph: 4 Showing comparison of backpack load at different percentage of body weight with Unloaded condition forAnterior Head Alignment
0.0
0.5
1.0
1.5
2.0
2.5
3.0
8 9 10 11 12 13 14 15 16 17 18 19 20
Percentage of body weight
De
gre
e
DISCUSSION
For all three angles i.e craniohorizantal angle,carniovertebral angle and anterior head alignment, thechange starts at 9%,11% and 13% respectively, whichis less than 15% of body weight. According toChansirinukor et al (2001), who recommended that 15%of body weight represent an overload to this age of youngchildren support the present study.
According to National Back Pain Association (1997)and Voll & Klimt11 (1997) who recommended that schoolchildren should carry no more than 10% of their bodyweight, supporting this study. But change in anteriorhead alignment in present study starts at 13% of bodyweight which is against the study done by Voll andKlimt.
For sagittal shoulder position, the result of presentstudy shows insignificant difference from 8% to 20% ofbody weight and so does not show any change insagittal posture at any percentage of body weight.
There is lot of controversy about the accurateanatomical landmarks of this angle according todifferent authors. Based on Rainey and Twomey’s study(1994)1,12, a more rounded shoulder is represented by asmaller sagittal shoulder angle; provided the position
of C7 remains fixed. But study done by Chansirinukoret al.,1 shows that sagittal plane shoulder postureincreases under load, when a marker was placed inbetween greater tuberosity of humerus and posterioraspect of acromion.
Braun and Amundson8 in their study pointedbicipital tendon groove as acromion angle for assessingshoulder position in sagittal plane.
There might be reason that different positionadopted for measurement might have contributed tocontrasting outcome. So further studies using a 3-dimensional approach is required to identify therelationship between body landmark and their correctplacement for sagittal shoulder posture.
FUTURE RESEARCH
Future research is needed to investigate the effect ofbackpack carriage on Unilateral side in dynamicconditions on cervical and shoulder posture changes.
Girls students were not included in the study,because of exposure. As the spine is maturing, theremay be gender based difference which can affect theresults of the study.
34. Pradeep pehwa--176-184.pmd 2/7/2013, 8:08 PM182

Indian Journal of Physiotherapy & Occupational Therapy. January-March 2013, Vol. 7, No. 1 183
Relevance to Clinical Practice
The carriage of heavy school bag coupled with longcarriage duration and lack of access of lockers in Indianschools may represent an daily physical stress for schoolstudents and could lead to musculoskeltal symptoms.
Therefore, if preventive measures can be introducedwith regard to safe load carriage in school students. Itwill not only help to protect students while they arestill developing but it will also ensure that theprinciples they learn now are carried through toworkplace as adults.
RECOMMENDATIONS
1. Wear padded, wide shoulder straps both sides.
2. Backpack should not too heavy than 10% of studentbody weight.
3. Advice the students to keep the load close to thebody.
Limitations of Study
1. If the number of subjects had been more, resultswould have been better enhanced.
2. The study was limited to only one school andparticular age group. So, results may not begeneralized to the source population.
CONCLUSION
Previous studies suggest that postural response inhigh school students are sensitive to load carriageequivalent to 15% of body weight. The amount of weightthat does not change the student’s head and neckposture, that can be recommended lies between 9-10%of body weight. So, up to 10% of body weight, there issafeguard limit for adolescents.
According to these results, teachers, children andfamilies should be equally involved in safe carrying ofbackpack load. As a part of physiotherapy intervention,students were often advised about their habitualposture in relation to carrying backpack load.
REFERENCES
1. Wunpen Chansirinukor, Dianne Wilson, KarenGrimmer and Brenton Dansie., Effects ofBackpacks on students: Measurement of cervicaland shoulder posture. Australian Journal ofphysiotherapy, 47, 110-116. 2001.
2. Yong Tai wang, D.D. Pascoe, W. Weimar. ,Evaluation of Book Back pack load during walkingErgonomics , 44 (9), 858 – 869, 2001
3. David D. Pascoe, Donna E. Pascoe, Yong Tai Wang,Dong-Ming-Shim and Chang K. Kim., Influenceof carrying book bags on gait cycle and posture ofyouths. Ergonomics, 40, (6 ),631-641, 1997.
4. Karen Grimmer, brenton dansie, S. Milanese, U.Pirunson and Patricia trott., Adolescent standingpostural response to backpack loads: arandomized controlled experimental study.BMCMusculoskeltal Disorders, 3, 1-10, 2002
5. Forjuoh SN, Lane BL, Schuchmann J., Percentageof Body weight carried by students in their schoolbackpacks.Am. J Phys. Med. Rehabil , 82, 261– 266,2003.
6. Youlian Hong, Chi-kin Cheung., Gait and postureresponses to backpack load during level walkingin children. Gait and posture, 17,28-33, 2003.
7. Richard- Pistolese., Backpacks- Your child’s spineat risk.International chiropractic pediatric association-ICPA, 3,1-2, 2000
8. Barbara lafferty brawn, Louis R. Amundson.,Quantitative assessment of head and shoulderposture. Arch. Phys. Med. Rehabil, 70, 322-329,1998.
34. Pradeep pehwa--176-184.pmd 2/7/2013, 8:08 PM183

184 Indian Journal of Physiotherapy & Occupational Therapy. January-March 2013, Vol. 7, No. 1
9. Daniel H.K. Chow, Monica L.Y Kwok, AlexanderC.K., A.V. Yang, Andrew D. Holmes, Jack Y Cheng,Y.D. YAO. M.S Wong., The Effect of backpack loadon the gait of normal adoloscent girls. Ergonomics,48 (6) , 642 – 656, 2005.
10. Stefano Negrini, Roberta carabalona., Back packson ! School Children’sPerception of Load, Associations with Backpain
and factors determining the load. Spine, 27,187-195, 2002
11. J.K. Whittfield, S.J. Legg, DI Hedderley., The weightand use of school bags in Newzealand SecondarySchools. Ergononics , 44 (9) , 819- 824, 2001
12. Raine S, Twomey Lt .,Posture of Head Shouldersand thoracic spine in comfortable erect standing.Australlian J. Physiotherapy , 40 (1) , 25-32, 1994.
34. Pradeep pehwa--176-184.pmd 2/7/2013, 8:08 PM184

Indian Journal of Physiotherapy & Occupational Therapy. January-March 2013, Vol. 7, No. 1 185
Effect of Abductor Muscle Strengthening in OsteoarthritisPatients: A Randomized Control Trial
Nishant H NarConsultant Physiotherapist Wockhardt Hospital, Rajkot
ABSTRACT
Background: Osteoarthritis is a chronic, localized joint disease affecting approximately one-third ofadults, with the disease prevalence increasing with advancing age. OA affects many joints includingthe large, weight bearing joints of the hips and knees and also the spine, hands, feet and shoulders. Theknee is the most common weight bearing joint affected by OA, with the disease predominantly affectingthe medial compartment of the tibio-femoral joint. Patients with knee OA frequently report symptoms ofknee pain and stiffness as well as difficulty with activities of daily living such as walking, stair-climbing and house keeping.
Objectives: To compare the effectiveness of hip abductor muscle strengthening exercises andconventional physiotherapy treatment with conventional physiotherapy treatment alone in peoplewith unilateral medial compartment knee osteoarthritis.
Materials and Methodology: Study included 30 (Thirty) subjects with unilateral medial compartmentknee OA, aged 45 years or above. The subjects were randomly divided into 2 groups: Group -A andGroup -B. The subjects were treated for a period of 6 weeks, 6 days a week, once daily. Pain wasassessed by VAS score and physical function was assessed by WOMAC Index of Osteoarthritis.
Results: The results were analyzed by Wilcoxon Signed Rank Test. Group A showed significantimprovement in pain (T=120, p<0.05) and physical function (T=120, p<0.05). In Group B, resultsshowed significant improvement in pain (T=91, p<0.05) and physical function (T=120, p<0.05).
Comparison of Group A and Group B was done with Wilcoxon Sum Rank Test (Mann Whitney U Test),Group A showed significant improvement in pain (z = -2.82, p<0.0052) and physical function (z = -3.56, p<0.0004).
Conclusion: Hip abductor muscle strengthening exercises showed over all improvement in pain andphysical function and is a useful adjunct exercise therapy in treating patients with unilateral medialcompartment knee osteoarthritis.
Keywords: Shortwave Diathermy (SWD), Visual Analoge Scale (VAS), WOMAC
INTRODUCTION
The term arthritis literally means inflammation of ajoint, but is generally used to describe any condition inwhich there is damage to the cartilage. The cartilagecoats the joint surfaces to absorb stress, and allowsmooth joint movement. The proportion of cartilagedamage and synovial inflammation (the lining and fluidin the joint capsule) varies with the type and stage ofarthritis. Usually the early pain is due to inflammation.Later in the disease, pain is from the irritation of theworn joint structures and inability of the joint to moveproperly.
Osteoarthritis (OA) is a chronic, localized jointdisease affecting approximately one-third of adults, with
the disease prevalence increasing with advancingage[1]. Concomitant with this high prevalence is a largeeconomic cost, with direct and indirect costs estimatedto be $23.9 billion in Australia in 2007[2]. Indeed, giventhe changing demographics of the adult population[3],expectations are for the prevalence of disease and itsburden on the health care system to increase in comingdecades[4].
The knee is the most common weight bearing jointaffected by OA, with the disease predominantlyaffecting the medial compartment of the tibio-femoraljoint[5,6]. Patients with knee OA frequently reportsymptoms of knee pain and stiffness as well as difficultywith activities of daily living such as walking, stair-climbing and house-keeping[7].
35. nishant--185-190.pmd 2/7/2013, 8:08 PM185

186 Indian Journal of Physiotherapy & Occupational Therapy. January-March 2013, Vol. 7, No. 1
To date, most knee OA research examining treatmentfor knee OA has focused on surgical or pharmacologicalstrategies. Although effective, these types ofinterventions have many potential side effects and areexpensive[8]. Thus, recent knee OA clinical guidelinesreinforce the importance of non-pharmacologicalstrategies in the management of the condition[9,10].However, there is an absence of high quality evidenceto support the use of such therapies[9].
There are several reasons for the development of OAincluding age, being overweight, heredity factors, andjoint damage from a previous injury or during earlydevelopment of a joint. Increased loading across thejoint has been implicated in the progression of knee OAseverity[11]. In knee OA, the medial tibiofemoralcompartment is the most common site of disease. Thesusceptibility of the medial compartment to OAdevelopment may relate to greater load distribution (i.e.,60–80%) to the medial than the lateral compartment,even in healthy knees, during gait. Excessive medialcompartment loading is widely believed to contributeto medial OA progression. Because direct measurementof knee load is invasive, external knee adductionmoment during gait, a correlate of medial load, has beenused in knee OA studies[12]. The role of gait analysis inthe quantification of dynamic joint load has receivedmuch attention in the literature in light of the difficultyin performing in vivo measurement of joint loadingduring movement[13, 14, 15]. From the research, the externalknee adduction moment, an indirect measure of load inthe medial compartment of the tibio-femoral joint[16], hasemerged as an important and widely acceptedbiomechanical marker of knee load.
Cross-sectional studies demonstrate that patientswith knee OA have a higher peak knee adductionmoment during walking when compared to healthy age-matched controls[17, 18]. It is also likely that the higherprevalence of medial compared with lateral tibiofemoraljoint OA is the result of differences in the relative loadingwithin the tibiofemoral joint. The external kneeadduction moment determines load distribution acrossthe medial and lateral tibial plateaus[12, 19, 20], with forceacross the medial compartment almost 2.5 times that ofthe lateral[16]. It has also been reported that for patientswith knee OA, the magnitude of the adduction momentis predictive of clinical outcomes such as severity ofknee pain and radiographic disease[21, 22].
A variety of exercise programs for knee OA have beendescribed in the literature. These have included generalaerobic exercise programs such as walking or cycling
as well as more specific programs involvingstrengthening of particular muscle groups and/orflexibility exercises.
The primary aim of this study is to determinewhether strengthening of the hip abductor muscles inpeople with medial compartment knee OA can reduceknee pain and improve physical function. It ishypothesized that a 6-week programme ofstrengthening the hip abductor muscles will improvepain and physical function in people with medialcompartment knee OA.
AIMS AND OBJECTIVE
1) To determine the effectiveness of hip abductormuscle strengthening in people with medialcompartment knee osteoarthritis.
2) To compare the effectiveness of hip abductor musclestrengthening and conventional treatment withconventional treatment in people with medialcompartment knee osteoarthritis.
STUDY DESIGN AND MATERIALS
Study Design
An Experimental study was conducted to study theeffects of hip abductor muscle strengthening exercisesin patients with osteoarthritic knee joints.
Study Setting
All patients were referred from Orthopaedic Out-patient Department, Civil Hospital, Ahmedabad to B1ward, Physiotherapy Department, Civil Hospital,Ahmedabad where they all were treated during studyperiod.
Sample Selection
The sample size consisted of 30 (thirty) patients, whowere diagnosed with unilateral medial compartmenttibiofemoral OA, as per the Inclusion Criteria and theExclusion Criteria.
Study Duration
The total duration of the study was 6 months. Thesubjects were treated for a period of 6 weeks, 6 days aweek, one session daily.
Sample Size
The sample size of 30 (thirty) patients was dividedin to two groups.
35. nishant--185-190.pmd 2/7/2013, 8:08 PM186

Indian Journal of Physiotherapy & Occupational Therapy. January-March 2013, Vol. 7, No. 1 187
Group A: 15 patients.
Group B: 15 patients.
Age Group
45 years or older.
Gender: Both sexes
Male: 14
Female: 16
SELECTION CRITERIA
Inclusion Criteria
1. Age greater than or equal to 45 years.
2. Unilateral medial compartment tibiofemoral OAwithout involvement of any other compartment ofknee joint.
3. Duration of symptoms: Chronic according to IASPclassification.
4. At least some difficulty in daily function due to kneeOA.
5. Both genders are included.
6. Kellgren-Lawrence radiographic grade I, II and III.
7. Patients who are able to comprehend commands.
8. Willingness to participate in the study.
Exclusion Criteria
1. History of trauma within one year to affected kneejoint.
2. Associated with any other pathological conditionsuch as neoplasm, osteomyelitis, vascular problemetc.
3. Low back pain radiating to knee joint.
4. Knee surgery or intra articular corticosteroidinjection within 6 months to affected knee joint.
MATERIALS USED IN THE STUDY
Consent form, universal goniometer, vas scale,weight cuffs, WOMAC Index of Osteoarthritis,Examination Table, Thera-bands, Short-waveDiathermy Machine, Kodak C875 Zoom Digital Camera,Paper, Pencil, Scale, Pins.
Description of the Tools
Visual Analog Scale (VAS)
WOMAC Index of Osteoarthritis
METHODOLOGY
Ethical clearance was obtained from the EthicalClearance Committee of wockhardt hospitals,rajkotprior to the study. Those who fulfilled the inclusioncriteria were taken up for the study. The whole procedureof the study was explained to all the subjects. A writteninformed consent of all the subjects was taken prior tothe study. All the subjects were assessed as per theassessment form.
30 (thirty) subjects were taken for the study withdiagnosis of unilateral medial compartment knee OA;14 male and 16 female. They were randomly divided into two groups for the study. Each subject of the studywas treated for a period of 6 weeks, 6 days a week, onesession daily. An assessment was done prior to startingof treatment and weekly assessment was taken for thesesubjects.
EXERCISE PROTOCOL
All the subjects were informed in detail about thetype and nature of the study. The subjects were dividedin to two groups; Group A and Group B, 15 patients ineach group. All the subjects were randomly selectedand assigned in to each group.
Group A
The subjects in Group A were given hip abductormuscle strengthening exercises and conventionalphysiotherapy treatment.
Group B
The subjects in Group B were given conventionalphysiotherapy treatment.
Conventional Physioterapy Treatment for BothGroup -a & Group -b: - (Ref)
A. Short wave Diathermy
B. Stretching Exercises
1) Standing Calf Stretch
2) Supine Hamstring Stretch
3) Prone Quadriceps Stretch
35. nishant--185-190.pmd 2/7/2013, 8:08 PM187

188 Indian Journal of Physiotherapy & Occupational Therapy. January-March 2013, Vol. 7, No. 1
C. Range of Motion Exercises
1) In long sitting position, knee mid-flexion to endrange extension
2) In long sitting position, knee mid-flexion to endrange flexion
3) Stationary bicycle
D. Strengthening Exercise
1) Static quadriceps sets in knee extension
2) In high sitting position knee mid-flexion to endrange extension with weight cuff
3) In prone position knee end range extension to mid-flexion with weight cuff
Hip Abductor Muscle Strengthening Exercises forGroup -a
Subjects in Group A were given a series of threeexercises designed to strength the hip abductor muscles,6 days a week for 6 weeks.
Type of exercise
1) Abduction in side lying
2) Abduction in standing
Unilateral hip abduction performed in standing atmoderate resistance
With the use of resistance band.
3) Standing wall isometric hip abduction:
Performed in unipedal stance with the opposite limbin 90 degrees of hip and knee flexion.
The whole study was extended for a period of 6months. The duration of treatment programme for eachsubject was 6 weeks. All the thirty (30) subjectscompleted the whole treatment programme of 6 weekswith out any discomfort.
RESULTS
Table 1 show the gender distribution of the 30subjects who participated in the study. In the Group Awhere the subjects underwent hip abductor musclestrengthening exercises and conventionalphysiotherapy treatment had 8 males and 7 femalesand in the Group B where the subjects underwentconventional physiotherapy treatment alone had 6males and 9 females. There was no significantpredominance of sex.
Table 1 Gender Distribution of the Subjects:
Gender Group A Group B
Male count% 853.33% 640%
Female count% 746.66% 960%
Total 15 15
Table 2 displays the statistics of age distribution ofthe 30 subjects. Among the 30 subjects, the mean age of15 subjects in Group A was 51.33 with a standarddeviation (SD) of 5.2326, and the mean age of 15 subjectsin Group B was 52 with a standard deviation of 5.0142.No significant age difference was seen across the twogroups.
Table 2 Age Distribution of the Subjects:
Group N Mean SD
Group A 15 51.33 5.2326
Group B 15 52 5.0142
Wilcoxon Signed Rank Test (1,2) was applied inGroup A and in Group B for with-in group analysisand it is as follows:
In Group A, results showed significant improvementon VAS score (T = 120 > 95, p < 0.05).
In Group A, results showed significant improvementon WOMAC score (T = 120 > 95, p < 0.05).
In Group B, results showed significant improvementon VAS score (T = 91 > 74, p < 0.05).
In Group B, results showed significant improvementon WOMAC score (T = 120 > 95, p < 0.05).
Wilcoxon Sum Rank Test (Mann Whitney ‘U’ Test)(1,2) was applied for between-group comparison ofGroup A and Group B, and it is as follows:
On comparing Group A and Group B for post-treatment VAS score, results showed significantdifference in improvement (z = -2.82, p = 0.0052).
On comparing Group A and Group B for post-treatment WOMAC score, results showed significantdifference in improvement (z = -3.56, p = 0.0004).
For Group A
Score PreMean + SD PostMean + SD T p <
VAS 7 + 1.690 2 + 1.463 120 0.05
WOMAC 66.66 + 6.986 27.66 + 4.237 120 0.05
For Group B:
Score PreMean + SD PostMean + SD T p <
VAS 6.93 + 1.387 4.066 + 1.907 91 0.05
WOMAC 67.13 + 6.577 37.46 + 6.356 120 0.05
35. nishant--185-190.pmd 2/7/2013, 8:08 PM188

Indian Journal of Physiotherapy & Occupational Therapy. January-March 2013, Vol. 7, No. 1 189
On comparing Group A and Group B:
Score z Value p Value
VAS -2.82 0.0052
WOMAC -3.56 0.0004
The ‘z’ values (corresponding to ‘p’) are highlysignificant which suggest that hip abductor musclestrengthening exercises are effective in reduction of painand improvement of physical function along withconventional physiotherapy treatment.
Hence, Null Hypothesis of no significant effect ofhip abductor muscle strengthening exercises can berejected and Alternative Hypothesis of , there is anadditive effect of hip abductor muscle strengtheningexercises on reduction of pain and improvement ofphysical function can be accepted.
REFERENCES
1. Felson DT, Naimark A, Anderson J, Kazis L,Castelli W, Meenan RF: The prevalence of kneeosteoarthritis in the elderly. The FraminghamOsteoarthritis Study. Arthritis and Rheumatism1987, 30:914-918.
2. Australia A: Painful Realities: The economicimpact of arthritis in Australia in 2007. 2007.
3. Hamerman D: Clinical implications ofosteoarthritis and aging. Annals of the RheumaticDiseases 1995, 54:82-85.
4. Badley E, Wang P: Arthritis and the agingpopulation: projections of arthritis prevalence inCanada 1991 to 2031. Journal of Rheumatology1998, 25(1):138-144.
5. Ledingham J, Regan M, Jones A, Doherty M:Radiographic patterns and associations ofosteoarthritis of the knee in patients referred tohospital. Ann Rheum Dis 1993, 52(7):520-526.
6. Iorio R, Healy WL: Unicompartmental arthritis ofthe knee. J Bone Joint Surg Am 2003, 85-A (7):1351-1364.
7. Guccione AA, Felson DT, Anderson JJ, AnthonyJM, Zhang Y, Wilson PWF, Kelly-Hayes M, WolfPA, Kreger BE, Kannel WB: The effects of specificmedical conditions on the functional limitationsof elders in the Framingham study. AmericanJournal of Public Health 1994, 84:351-358.
8. Dieppe PA, Ebrahim S, Martin RM, Juni P: Lessonsfrom the withdrawal of rofecoxib. Bmj 2004,329(7471):867-868.
9. Jordan K, Arden N, Doherty M, Bannwarth B,Bijlsma J, Dieppe P, Gunther K, Hauselmann H,Herrero-Beaumont G, Kaklamanis P, et al.: EULARrecommendations 2003: an evidence basedapproach to the management of kneeosteoarthritis: report of a task force of the StandingCommittee for International clinical StudiesIncluding Therapeutic Trials (ESCISIT). Annals ofthe Rheumatic Diseases 2003, 62:1145-1155.
10. OA ASo: Recommendations for the medicalmanagement of osteoarthritis of the hip and knee.2000 update. Arthritis and Rheumatism 2000,43(9):1905-1915.
11. Miyazaki T, Wada M, Kawahara H, Sato M, BabaH, Shimada S: Dynamic load at baseline canpredict radiographic disease progression inmedial compartment knee osteoarthritis. AnnRheum Dis 2002, 61:617-622.
12. Hurwitz D, Sumner D, Andraicchi T, Sugar D:Dynamic knee loads during gait predict proximaltibial bone distribution. Journal of Biomechanics1998, 31:423-430.
13. Andriacchi T, Lang P, Alexander E, Hurwitz D:Methods for evaluating the progression ofosteoarthritis. J Rehabil Res Dev 2000, 37(2):163-170.
14. Andriacchi T, Mundermann A: The role ofambulatory mechanics in the initiation andprogression of knee osteoarthritis. CurrentOpinion in Rheumatology 2006, 18:514-518.
15. Sharma L, Kapoor D, Issa S: Epidemiology ofosteoarthritis: an update. Current Opinion inRheumatology 2006, 18:147-156.
16. Schipplein OD, Andriacchi TP: Interactionbetween active and passive knee stabilizers duringlevel walking. Journal of Orthopaedic Research1991, 9:113-119.
17. Bailunas A, Hurwitz D, Ryals A, Karrar A, Case J,Block J, Andriacchi T: Increased knee joint loadsduring walking are present in subjects with kneeosteoarthritis. Osteoarthritis & Cartilage 2002,10:573-579.
18. Hurwitz D, Ryals A, Case J, Block J. Andriacchi T:The knee adduction moment during gait insubjects with knee osteoarthritis is more closelycorrelated with static alignment than radiographicdisease severity, toe out angle and pain. J OrthopRes 2002, 20:101-108.
35. nishant--185-190.pmd 2/7/2013, 8:08 PM189

190 Indian Journal of Physiotherapy & Occupational Therapy. January-March 2013, Vol. 7, No. 1
19. Jackson B, Teichtahl A, Morris M, Wluka A, DavisS, FM C: The effect of the knee adduction momenton tibial cartilage volume and bone size in healthywomen. Rheumatology 2004, 43:311-314.
20. Wada M, Maezawa Y, Baba H, Shimada S, SasakiS, Nose Y: Relationships among bone mineraldensities, static alignment and dynamic load inpatients with medial compartment kneeosteoarthritis. Rheumatology 2001, 40:499-505.
21. Shrader M, Draganich L, Pottenger L, Piotrowski
G: Effects of knee pain relief in osteoarthritis ongait and stair-stepping. Clinical Orthopaedics andRelated Research 2004, 421:188-193.
22. Sharma L, Hurwitz DE, Thonar E, Sum JA, LenzME, Dunlop DD, Schnitzer TJ, Kirwanmellis G,Andriacchi TP: Knee Adduction Moment, SerumHyaluronan Level, and Disease Severity in MedialTibiofemoral Osteoarthritis. Arthritis &Rheumatism 1998, 41(7):1233-1240.
35. nishant--185-190.pmd 2/7/2013, 8:08 PM190

Indian Journal of Physiotherapy & Occupational Therapy. January-March 2013, Vol. 7, No. 1 191
Effects of Scapular Stabilization Exercises and Taping inImproving Shoulder Pain & Disability Index in Patients
with Subacromial Impingement Syndrome due toScapular Dyskinesis
Bhavesh Patel1, Praful Bamrotia2, Vishal Kharod3, Jagruti Trambadia4
1Physiotherapist, Mahavir Physiotherapy Clinic, Mumbai, 2Tutor, Parul Institute of Physiotherapy, Vadodara, 3JuniorLecturer, Shri K K Sheth Physiotherapy College, Rajkot, Gujarat, 4Physiotherapist, Shri Sai Physiotherapy and
Rehabilitation Center, Vadodara
ABSTRACT
Background & purpose: Shoulder disorders are among the most common of all peripheral jointcomplaints1,2, with Subacromial Impingement Syndrome considered to be one of the most commonforms of shoulder pathology3, accounting for 44% to 60% of all complaints of shoulder pain duringarm elevation or overhead activities4. Researches for Subacromial Impingement Syndrome due toScapular Dyskinesis show that scapular stabilization exercises provide good results39. On the otherhand one of the study shows that effect of changing posture by taping will reduce the symptoms ofSubacromial Impingement Syndrome41. So the study is to compare the effectiveness of ScapularStabilization Exercises and Taping in improving shoulder pain & disability index in patients withSubacromial Impingement Syndrome due to Scapular Dyskinesis.
Objective: To check the effect of Scapular Stabilization Exercises and Taping in improving shoulderpain & disability index in patients with Subacromial Impingement Syndrome due to Scapular dyskinesis.
Method: A total of 60 patients were taken for the study. All subjects were diagnosed with SubacromialImpingement Syndrome due to Scapular Dyskinesis. The purpose of the study was explained to all thesubjects and informed consent was taken from each subject. All subjects were randomly assigned toeither Scapular Stabilization Exercises group (Group A) and Taping group (Group B). The base linedata of SPADI was obtained to check for the pain functional outcome. SPADI was later taken at the endof the treatment after 6 weeks on follow up.
Study design: Experimental design
Sampling technique: Purposive sampling technique
Outcome measure: Spadi Score Measurement
Result: Results show that Scapular Stabilization Exercises showed a significant improvement ShoulderPain and Disability Index (SPADI sub scores and total scores), when compared to Taping in individualswith Subacromial Impingement Syndrome.
Conclusion: Scapular Stabilization Exercises showed a significant improvement Shoulder Pain andDisability Index (SPADI sub scores and total scores), when compared to Taping in individuals withSubacromial Impingement Syndrome.
Keywords: Subacromial Impingement Syndrome, Adhesive Tapes, Shoulder Pain and Disability Index.
INTRODUCTION
Shoulder disorders are among the most common ofall peripheral joint complaints1, 2, with SubacromialImpingement Syndrome considered to be one of the mostcommon forms of shoulder pathology3, accounting for44% to 60% of all complaints of shoulder pain duringarm elevation or overhead activities4.
The disorder was first recognized by Jarjavay in1867, and the term Impingement Syndrome waspopularized by Neer in the 1970’s5.
Subacromial Impingement Syndrome refers toencroachment of the coraco-acromial arch on theunderlying mechanism of the rotator cuff5. TheImpingement Syndrome can be diagnosed by certain
36. Praful Bamrotia--191--195.pmd 2/7/2013, 8:08 PM191

192 Indian Journal of Physiotherapy & Occupational Therapy. January-March 2013, Vol. 7, No. 1
impingement tests, that is, Neer test, Kennedy –Hawkin’s test and the Cross – Over Impingement(Horizontal adduction) test6.
Shoulder impingement disorders are currentlyclassified as primary or secondary7.
Primary shoulder impingement occurs when therotator cuff tendons, long head of the biceps tendon,glenohumeral joint capsule, and/or subacromial bursabecome impinged between the humeral head andanterior acromion8. Secondary shoulder impingementis defined as a relative decrease in the subacromial spacedue to glenohumeral joint instability or abnormalscapulothoracic kinematics8.
Some evidence exists that; Scapular dysfunction isassociated with Shoulder Impingement9.
Scapular Dyskinesis is the alteration in the normalstatic or dynamic position or motion of the scapuladuring coupled scapula-humeral movements. Othernames given to this catch-all phrase include: “FloatingScapula” and “Lateral Scapular Slide”10.
The scapular muscles facilitate upper extremitymovement via the scapular motions of protraction,retraction, upward (lateral) rotation, and downward(medial) rotation. The main muscles providing scapularstabilization are the rhomboids, trapezius, and serratusanterior17. Researches for Subacromial ImpingementSyndrome due to Scapular Dyskinesis show thatscapular stabilization exercises provide good results39.One of the study shows that effect of changing postureby taping will reduce the symptoms of SubacromialImpingement Syndrome12. Taping is particularly usefulin addressing movement faults at the scapula-thoracic,gleno-humeral and acromio-clavicular joints13. Thebasic rationale for taping is to provide protection andsupport for a joint while permitting optimal functionalmovement. It is assumed that external support increasesjoint stability by reinforcing the ligaments and restrictingmotions14.
OBJECTIVES
1. To study the effectiveness of Scapular StabilizationExercises in improving Shoulder pain anddisability index in patients with SubacromialImpingement Syndrome due to ScapularDyskinesis.
2. To study the effectiveness of Taping in improvingShoulder pain & disability index in patients withSubacromial Impingement Syndrome due toScapular Dyskinesis.
3. To compare the effectiveness of ScapularStabilization Exercises and Taping in improvingShoulder pain & disability index in patients withSubacromial Impingement Syndrome due toScapular Dyskinesis.
HYPOTHESIS
Null hypothesis (H0) There is no significantdifference between the effectiveness of ScapularStabilization Exercises and Taping in improvingShoulder pain and disability index in patients withSubacromial Impingement Syndrome due to ScapularDyskinesis.
Alternative hypothesis (H1) There is a significantdifference between the effectiveness of ScapularStabilization Exercises and Taping in improvingShoulder pain and disability index in patients withSubacromial Impingement Syndrome due to ScapularDyskinesis.
Study Design – Experimental design
Sampling Technique – Purposive samplingtechnique
Samples – 60 patients were taken for the study thatwere diagonesed as having subarcromail impingementsyndrome and were randomly devided into two groupsof 30 each
Age Group – 35 to 60 years.
Inclusion Criteria
• Pain produced or increased during flexion and /or abduction of the symptomatic shoulder.
• And at least 4 of the following :
• Positive Neer Impingement Sign.
• Positive Hawkins Sign.
• Pain produced during Supraspinatous Empty-Cantest.
• Painful Arc of movement between 60 and 120degrees.
• Pain with palpation on greater tuberosity of thehumerus
Exclusion Criteria
• Patient suffering with any shoulder fracture.
• Patient suffering with Frozen Shoulder or AdhesiveCapsulitis.
36. Praful Bamrotia--191--195.pmd 2/7/2013, 8:08 PM192

Indian Journal of Physiotherapy & Occupational Therapy. January-March 2013, Vol. 7, No. 1 193
• Patient suffering with any neurological condition.
• Pregnancy.
• Known allergies to taping.
• Presence of a Positive Sulcus Sign
METHOLOGY
A total of 60 patients were taken. The purpose of thestudy was explained to all the subjects and informedconsent was taken from each subject. All subjects wererandomly assigned to either Scapular StabilizationExercises group (Group A) and Taping group(Group B).
PROCEDURES
The patients were informed about the wholeprocedure, the treatment merits and demerits and areturn consent were obtained from them for voluntaryparticipation in the study. They were randomly dividedinto Group A and Group B of 30 subjects each. The baseline data of SPADI was obtained to check for the painfunctional outcome. SPADI was later taken at the endof the treatment after 6 weeks on follow up.
Techniques of application
Group A – Scapular Stabilization Exercises along.
The Scapular Stabilization Exercises are given forthe muscles that include Upper Trapezius, MiddleTrapezius, Lower Trapezius, Rhomboids, SerratusAnterior.
Duration of Exercises : the scapular stabilizationexercises are given for six weeks.
Group B – Taping
Taping is given for the muscles that include UpperTrapezius, Middle Trapezius, Rhomboids, SerratusAnterior
Duration of Taping : Taping is given for two timesa week for six weeks.
Ultrasound was given to both the groups once daily5 times a week for six weeks. Pulsed mode was given ata frequency of 1Mhz for 10 minutes.
Tools used for the study
1. Ultrasound Therapy Unit
2. Adhesive Tapes
3. Shoulder Pain And Disability Index.
Assessment of Pain and Disability Evaluation.
SPADI SCORE MEASUREMENT
Pain and disability is evaluated by using SPADI. Itconsists of 2 self report sub scales of pain and disability.The items of both scales are VAS (Visual Analogue Scale)and the 5 items pain subscales asks people about theirpain during ADLs (Activities of Daily Livings) and eachitem is anchored by the descriptions “no pain” (leftanchor) and “ worst pain imaginable” (right anchor).The 8 disability items ask people about their difficultyin performing ADL. Higher scores on the sub scaleindicate greater pain and greater disability. To obtainthe total score of SPADI both the pain and disabilitysubscales are averaged.
Study Duration: 6 weeks.
Procedures of Scapular Stabilization Exercises
For Upper Trapezius
It is done by Prone Row Exercise, where the patientlies prone over the edge of the bed with the affectedlimb out of the bed, and performs rowing movement.
For Lower Trapezius
It is done by, patient lying prone at the edge of thebed, with the affected limb out of the bed and thenperforms overhead arm raise in line with lowertrapezius
For Middle Trapezius and Rhomboids
It is done by, patient lying prone at the edge of thebed, with the affected limb out of the bed and thenperforms horizontal abduction neutrally.
One of the functional exercise for Serratus Anterior: The patient performs stepping alternating punchexercise, with a resisted Thera tube.
Procedure of Taping target muscles
Taping for Upper Trapezius
From anterior aspect of upper trapezius just abovethe clavicle over the muscle belly to approximately thelevel of rib seven in a vertical line. Once partiallyattached, a firm downward pull is applied and the tailof the tape attached.
Taping for Middle Trapezius and Rhomboids
From the anterior aspect of the shoulder, 2 cm medial
36. Praful Bamrotia--191--195.pmd 2/7/2013, 8:08 PM193

194 Indian Journal of Physiotherapy & Occupational Therapy. January-March 2013, Vol. 7, No. 1
to the joint line, around deltoid muscle just belowacromial level to T6 area without crossing midline. Tapepull is into retraction.
Taping for Serratus Anterior
From 2 cm medial to the scapula border, followingthe line of the ribs down to the mid-axillary line. Fourone-third overlapping strips are applied with the originand insertion pulled together and bunching the skin.
RESULTS
Table1: Average improvement in pain, disability andtotal SPADI score in group A
SPADI Average Z-value p-value Resultimprovement
Pain 54 4.813 0.000 p<0.05 significant
Disability 60 4.813 0.000 p<0.05 significant
Total 56.93 4.800 0.000 p<0.05 significant
Table2:- Average improvement in pain, disability andtotal SPADI score in group B
SPADI Average Z-value p-value Resultimprovement
Pain 40 4.832 0.000 P<0.05 significant
Disability 53.75 4.808 0.000 P<0.05 significant
Total 48.46 4.807 0.000 P<0.05 significant
Table 3:- Comparison of Pain, Disability and TotalSPADI before and after the treatment within Group-A
and Group-B using Mann-Whitney U test:-
SPADI Average Averag U-value p-value Resultimprovement(A) improvement(B)
Pain 54 40 263.50 0.005 P<0.05significant
Disability 60 53.75 254.00 0.003 P<0.05significant
Total 56.93 48.46 239.00 0.002 P<0.05significant
DISCUSSION
Subacromial impingement syndrome is caused bynarrowing of the subacromial space with secondaryimpingement of the bursal surface of the rotator cuff onthe undersurface of the acromion16. Some evidenceexists that, Scapular dysfunction is associated withShoulder Impingement9.
Clinical authorities have suggested that poor upperbody posture and muscle imbalance may cause orperpetuate Subacromial impingement syndrome. Theaim of many conservative rehabilitation programs is tocorrect posture and muscle imbalance using musclestrengthening, muscle stretching, and joint mobilizationtechniques. The evidence to support the efficacy of theseclinical practices is limited12.
Therapeutic exercises have previously beendetermined to have long-term benefits for patients withshoulder impingement syndrome8. The therapeuticexercise stretches the anterior and posterior shouldergirdle, relaxes the muscle, helps in motor learning tonormalize dysfunctional patterns of motion, andstrengthening the rotator cuff and scapular muscles,which leads to improvements in pain, levels of disabilityand functional loss, strength, shoulder range of motion,pain with subacromial compression4.
A potential mechanism by which proprioceptiveshoulder taping may be effective is via augmentedcutaneous input. Tape is applied in such a way thatthere is little or no tension while the body part is held ormoved in the desired position or plane. It will thereforedevelop more tension when movement occurs outsideof these parameters. This tension will be sensedconsciously thus giving a stimulus to the patient tocorrect the movement pattern. Over time and withenough repetition and feedback, these patterns canbecome learned components of the motor engrams forgiven movements. It also causes increase in length anddecrease in tension thereby producing greater forcedevelopment in the inner range through optimised actin-myosin overlap during the cross-bridge cycle13. One ofthe study demonstrated that taping was effective indecreasing Upper Trapezius and increasing LowerTrapezius activity in individuals with shoulderimpingement during overhead reaching tasks, thusimproving scapular dyskinesis15.
Here, both the groups had received Ultrasoundtherapy as a modality in the treatment, as it is effectivein healing process, helps in decreasing inflammationand swelling.
In present study, the results shows that ScapularStabilization Exercises is more effective than Taping inpatients with Subacromial Impingement Syndrome dueto Scapula Dyskinesis.
LIMITATIONS
1. In present study only SPADI is taken in outcomemeasures.
2. In this study there is no control group is present.
3. It’s a short duration study as study duration is 6weeks.
CONCLUSION
Scapular Stabilization Exercises and Taping
36. Praful Bamrotia--191--195.pmd 2/7/2013, 8:08 PM194

Indian Journal of Physiotherapy & Occupational Therapy. January-March 2013, Vol. 7, No. 1 195
produced significant improvement in Shoulder Painand Disability (SPADI Sub scores and Total scores)values in patients with Subacromial ImpingementSyndrome due to Scapula Dyskinesis, when appliedindividually. However Scapular Stabilization Exercisesshowed a significant improvement Shoulder Pain andDisability Index (SPADI sub scores and total scores),when compared to Taping in individuals withSubacromial Impingement Syndrome.
REFERENCES
1. Chard MD, Hazleman BL, King RH, Reiss BB.Shoulder disorders in the elderly : a communitysurvey. Arthritis Rheum. 34:766-769.1991.
2. Herberts P, Kadefors R, Andersson G, Petersen I.Shoulder pain in industry : an epidemiologicalstudy on welders. Acta Orthop Scand. 52:299-306.1981.
3. Ashim Bakshi. A combination approach usingManual Therapy and Supervised Exercises.Management of Subacromial ImpingementSyndrome. Journal of Exploring Hand Therapy.7(2):1-5.2007.
4. Lori A Michener, Matthew K. Walsworth, EvinBurnet. Effectiveness of Rehabilitation for patientswith Subacromial Impingement Syndrome : Asystemic review. Journal of Hand Therapy. 17:152-164.2004.
5. David Morrison, Anthony.D.Frogameni and PaulWoodworth. Non-Operative Treatment OfSubacromial Impingement Syndrome. Journal ofBone Joint Surgery Am. 79:732-737.1997.
6. Palmer LM and Epler ME : Fundamentals ofMusculoskeletal Assessment techniques 2nd ed.Lippincott, Williams and Wilkins. 106-124.1998.
7. Fu FH, Harner CD, Klein AH. ShoulderImpingement : a critical review. Clin Orthop.269:162-173.1991.
8. Neer CS. Anterior acromioplasty for the chronicimpingement syndrome in the shoulder: Apreliminary report. J Bone Joint Surg Am. 54:41–50.1972.
9. Philip W McClure, Jason Bialker, Nancy Neff,Gerald Williams, Andrew Karduna. ShoulderFunction and 3-dimensional kinematics in peoplewith Shoulder Impingement Syndrome before andafter a 6-week Exercise Program. Physical Therapy.84(9):832-848.2004.
10. W. Ben Kibler, John McMullen. ScapularDyskinesis And its Relation to Shoulder Pain.Journal Of American Academy Of OrthopaedicSurgery. 11:142-151.2003.
11. Farhad O Moola. Orthopaedic SurgeryDepartment. Scapular Stabilizing Muscles :Rehabilitation Protocol. New West Orthopedic andSports Medicine Center. University Of BritishColumbia.
12. Jeremy S. Lewis, Christine Wright, Ann Green.Subacromial Impingement Syndrome : The effectof changing posture on shoulder range ofmovement. Journal Of Orthopaedic and SportsPhysical Therapy. 35:72-87.2005
13. Dylan Morrissey. Proprioceptive shoulder taping.Journal of Bodywork and Movement Therapies.4(3),189-194.2000.
14. A.M.Cools, E.E. Witvrouw, L.A. Danneels,D.C.Cambier. Does Taping influenceelectromyographic muscle activity in the Scapularrotatorsin healthy shoulders?. Manual Therapy.7(3)154-162.2002.
15. Selkowitz DM, Chaney C, Stuckey SJ, et al. Theeffects of scapular taping on the surface ofelectromyographic signal amplitude of shouldergirdle muscles during upper extremity elevationin individuals with suspected shoulderimpingement syndrome. J Orthop Sports PhysTHer. 37:694-702.2007.
16. Benjamin Blair, Andrew S. Rokito, Frances Cuomo,Kenneth Jarolem and Joseph D. Zuckerman.Efficacy of Injections of Corticosteroids forSubacromial Impingement. J Bone Joint Surg Am.78:1685-9.1996.
17. Jason Brumitt, Erika Meira. Scapula StabilizationRehab Exercise Prescription. Strength andConditioning Journal. 28(3):62-65.2006.
36. Praful Bamrotia--191--195.pmd 2/7/2013, 8:08 PM195

196 Indian Journal of Physiotherapy & Occupational Therapy. January-March 2013, Vol. 7, No. 1
Effects of Osteopathic Manipulative Treatment in Patientswith Chronic Obstructive Pulmonary Disease
Praniti P. Bhilpawar1, Rachna Arora2
1M. P. Th. from T.N. Medical College and B.Y.L. Nair Hospital, Mumbai, 2Asst. Professor in T.N. Medical College andB.Y.L. Nair Hospital, Mumbai
ABSTRACT
Background: The study was carried out to assess the effects of osteopathic manipulative treatment inpatients with chronic obstructive pulmonary disease.
Subjects: 30 patients with chronic obstructive pulmonary disease were selected for the study.
Method: Patients were selected from the respiratory OPD at a tertiary care centre using conveniencesampling technique. The patients were recruited after signing the ethics approved consent forms.Outcome measures: chest expansion, peak expiratory flow rate and respiratory rate were assessed anddocumented prior to and following the intervention. The subjects were given seven osteopathicmanipulative techniques. The entire duration for osteopathic manipulative treatment session wasapproximately 20 minutes for each subject.
Results: Significant improvements were found in chest expansion at axillary and xiphisternal level,peak expiratory flow rate and significant decrease in respiratory rate after single session of osteopathicmanipulative treatment.
Conclusion: Osteopathic manipulative treatment increases chest expansion at both axillary andxiphisternal level and peak expiratory flow rate and leads to reduction in respiratory rate in patientswith COPD.
Keywords: Chronic Obstructive Pulmonary Disease (COPD), Osteopathic Manipulative Treatment, PEFR
INTRODUCTION
Chronic obstructive pulmonary disease (COPD)refers to a group of disorders characterized by chronicairflow obstruction/limitation. It includes two distinctpatho-physiological processes—chronic bronchitis andemphysema1, 2, 3, 4. It is associated with an abnormalinflammatory response of the lungs to noxious particlesor gases, especially tobacco smoke and air pollution -both indoor and outdoor.
The term COPD was accepted in the British ThoracicSociety (BTS) guidelines on management of this disease5.Chronic obstructive pulmonary disease (COPD) iscurrently the fourth leading cause of death worldwide.The male to female ratio varied from 1.32:1 to 2.6:1 withmedian ratio of 1.6:11.
The disadvantages of bio mechanical alterations ofhyperinflation are compounded by the increaseddemand for ventilation in COPD. More work is requiredof a less effective system. The energy cost of ventilation,
or the work of breathing, in COPD is markedlyincreased.
Conventional management of COPD includessmoking cessation, pharmacological therapy, long-termoxygen therapy, and pulmonary rehabilitation. COPDhave been shown to decrease compliance of the chestwall, force-generating capacity of the diaphragm,residual volume (RV) increases, and forced vitalcapacity (FVC). Therefore, the therapeutic interventioncommonly done for chest wall and related structuresare respiratory muscle stretching exercises. They havebeen reported to improve chest wall mobility, improvevital capacity, and decrease dyspnea6. However, COPDis an important disease whose incidence is risingworldwide and that there is a need to develop newtreatments to prevent the progression of the disease7.
The osteopathic medical profession has developeda variety of techniques for the specific purpose ofimproving chest expansion, quality of life andpulmonary function. These techniques are well
37. praniti--196-201.pmd 2/7/2013, 8:08 PM196

Indian Journal of Physiotherapy & Occupational Therapy. January-March 2013, Vol. 7, No. 1 197
described and target various aspects of themusculoskeletal, neuronal and lymphatic componentsof the pulmonary system. The efficacy of osteopathicmanipulative treatment (OMT) is thought to beenhanced by using techniques in combination, whereone technique works synergistically with another toachieve an overall therapeutic effect8.
Masarsky CS, Weber M, Virginia ChiropracticAssociation Research Committee, Vienna 22180,studied Chiropractic management of chronicobstructive pulmonary disease. They noted that apatient with a history of chronic obstructive pulmonarydisease going back more than 20 years was treated witha combination of chiropractic manipulation,nutritional advice, therapeutic exercises, and inter-segmental traction. Improvements were noted in forcedvital capacity, forced expiratory volume in one second,coughing, fatigue, and ease of breathing9.
The study was thus designed in order to determineif one session of OMT treatment could produceimmediate changes on chest expansion, respiratory rateand PEFR in patients with COPD.
MATERIAL AND METHOD
Study design: An Experimental hospital based studyPlace of study: Physiotherapy OPD of TopiwalaNational Medical College & Nair Hospital Mumbai.Type of Sampling: convenience non-random samplingOperational definitions were provided.
Inclusion criteria
Patients with Chronic Obstructive PulmonaryDisease with FEV1/FVC < 70%.
Exclusion criteria
• Unstable medical condition.
• Acute bronchitis.
• Pneumonia.
• Acute Exacerbation within 1 month of datacollection.
• Chest wall deformity.
Measurement tool• Measuring tape.• Peak flow meter.• Watch with seconds hand.
Outcome measures• Chest expansion at axillary, xiphisternal level
(using measuring tape).• Peak expiratory flow rate (using peak flow meter).• Respiratory rate (for 1 minute)
Thirty patients with COPD were selected andincluded in the study after signing ethics approvedconsent forms. The patients were evaluated prior totreatment and data was documented. The subjects weregiven seven osteopathic manipulative techniques. Theduration of entire osteopathic manipulative treatmentsession was approximately 20 minutes for each subject.The outcome measures were documented posttreatment. The patient was instructed to inform thetherapist immediately any discomfort during treatmentsession. All the subjects in the study were able to toleratethe manipulative techniques with no sign of anydiscomfort.
Techniques of Osteopathic manipulation
1. Soft tissue kneading (paraspinal muscles in lowercervical and thoracic region bilaterally)
2. Rib raising3. “Redoming” the abdominal diaphragm (indirect
myofascial release)4. Suboccipital decompression5. Thoracic inlet myofascial release6. Pectoral traction7. Thoracic lymphatic pump with activation
DATA ANALYSIS
Data analysis was performed by using Paired t-testand Wilcoxon Sign rank test.
Table No 1: Distribution of study group as per sexshows the distribution of sex in the study group. Study
group consists of 7% female and 93% male.
Sex Count Percent
Female 2 7%
Male 28 93%
Total 30 100%
37. praniti--196-201.pmd 2/7/2013, 8:08 PM197

198 Indian Journal of Physiotherapy & Occupational Therapy. January-March 2013, Vol. 7, No. 1
Table No 2: Comparison of Chest expansion (axillary) ‘before’ and ‘after’ treatment: shows that there is statisticallysignificant improvement in chest expansion (axillary level) after single session of osteopathic manipulative
treatment, p value=1.17E-05 (<0.05)
Chest Expansion (Axillary) N Mean SD Median IQR Wilcoxon Signed p value Rank Test
Pre treatment 30 1.13 0.46 1 0.6 -4.383 1.17E05
Post treatment 30 1.43 0.50 1.4 0.65 Difference is significant
Table No 3: Comparison of Chest expansion (Xiphisternal) ‘before’ and ‘after’ treatment: shows that there isstatistically significant improvement in chest expansion (xiphisternal level) after single session of osteopathic
manipulative treatment, p value= 3.06E-05 (<0.05)
Chest Expansion N Mean SD Median IQR Wilcoxon Signed p value(Xiphisternal) Rank Test
Pre treatment 30 1.19 0.45 1.2 0.6 -4.169 3.06E-05
Post treatment 30 1.48 0.51 1.6 0.8 Difference is significant
Table No 4: Comparison of PEFR l/min ‘before’ and ‘after’ treatment: shows there is statistically significant improvementin peak expiratory flow rate after single session of osteopathic manipulative treatment, p value= 2.84E-04 (<0.05)
PEFR l/min N Mean SD Median IQR Wilcoxon Signed p value Rank Test
Pre treatment 30 159.74 54.65 150 64 -3.629 2.84E-04
Post treatment 30 171.47 60.45 160 82.5 Difference is significant
Table No 5: Comparison of RR/min ‘before’ and ‘after’ treatment: shows that there is statistically significant decreasein respiratory rate after single session of osteopathic manipulative treatment, p value= 4.50E-03 (<0.05)
Respiratory Rate (per min) N Mean SD Median IQR Paired T test p value
Pre treatment 30 25.37 7.50 24 9 3.08 4.50E-03
Post treatment 30 23.23 5.56 23 8 Difference is significant
DISCUSSION
The results of the present study indicate that thereis statistically significant increase in chest expansionat axillary and xiphisternal level. Also an increase isseen in peak expiratory flow rate and decrease inrespiratory rate after osteopathic manipulativetreatment, thereby supporting the experimentalhypothesis. In this study, the mean age of the patientsranged from 37-81 years of age. The distribution ofpatients, according to sex is 93% male and 7% female.
The ventilation depends on the rib motion,diaphragm function, muscles of respiration andmechanical properties of the airways10. In COPD thereis hyperinflation of lungs and therefore chest wall isfixed in inspiration (barrel shaped chest) 11. This resultsin shortening of soft tissue of upper chest. COPDpatients generally have a kyphotic posture withrounded shoulders (pectoral tightness) and elevatedshoulder girdle (trapezius tightness) to effectively useaccessory muscle of respiration. When the muscles arein a shortened position, the fascia overlying the musclealso gets shortened. Due to the barrel shaped chest, theribs are horizontally oriented. This further reduces the
excursion of ribs during inspiration. There by reducingchest expansion.
According to handbook of osteopathic technique byLaurie Hartman, kneading of paraspinal muscles relaxthem by reducing fluid congestion and tonic irritability.The underlying mechanism is thought to be due to reflexbalancing or from fluid interchange and lymphaticdrainage within the tissues12. Luce Helen and RobinsonMark stated that soft tissue kneading decreases musclespasm, stretches and improves elasticity of soft tissues,improves circulation, improves venous and lymphaticdrainage and promotes relaxation13.
Principles and practices of therapeutic massage bySinha states that kneading produces a local increase inthe flow of blood due to pumping action, liberation ofH substance and elicitation of axon reflex. This alsodecreases the stagnation of fluid and oedema as wellas improves the nutrition of the area. It stretches thetight fascia and helps in restoration of mobility of skinand subcutaneous fascia. The intermittent pressure mayalso stimulate tension dependent mechanoreceptor, i.e.Golgi tendon organ, etc. and decreases the excitabilityof motoneuronal pool in neurologically healthy
37. praniti--196-201.pmd 2/7/2013, 8:08 PM198

Indian Journal of Physiotherapy & Occupational Therapy. January-March 2013, Vol. 7, No. 1 199
individuals. This helps in decreasing the tension ofmuscles.14
Pectoral traction technique, a Myofascial releasetechnique, also helps in increasing chest expansion bylengthening the tight structures12.The combination oftraction and respiratory motion releases the upperanterior thoracic muscle tension15.
In COPD there is increase in sympathetic nervoussystem activity leads to release of catecholamines intothe blood stream and there is narrowing of airwayswhich leads to reduction in peak expiratory flow rate.7
Paraspinal muscle kneading and rib raising probablystimulate Chapman’s reflexes. Suboccipitaldecompression probably improves parasympatheticfunction by releasesing restricted tissues around vagusnerves.13, 16 This may lead to normalization ofsympathetic tone and which in turn may increase PEFRand reduce RR.
The American Academy of Osteopathy states thatthe rib raising technique improves movement of ribsand thoracic cage by mechanical stimulation ofsympathetic chain ganglia and related structures. Thisresults in improved sympathetic tone in lung. This issupported by the study done by Aaron T. Hendersonwhich shows that sympathetic nervous system activitymay decrease immediately after rib raising17.
Effective lymphatic drainage of the lungs is normallyachieved by contraction of the diaphragm and thoraciccage movement during respiration. However, in patientswith COPD, both of these mechanisms may becompromised, leading to impaired lymphatic drainage.There are several OMT techniques which address theproblem of lymphatics such as rib raising, diaphragmrelease, and lymphatic pumps18.
Numerous techniques are given in osteopathic textsfor controlling circulation and drainage. Chapman’sreflexes are one example that has already beenmentioned. Kuchera also gives ideas for detailedtreatment of lymphatic system dysfunction. The threebasic goals are:
a. To promote the free flow of lymph through itslymphatic vessels and fascial pathways.
b. To improve function of the abdominal diaphragm,the extrinsic pump for the lymphatic system.
c. To reduce sympathetic outflow19.
Treatment techniques include manipulation of thethoracic inlet, stretching the abdominal diaphragm,fascial releases and thoracic lymphatic pump. Kuchera
and Kuchera have this to say regarding lymphaticdrainage and the lungs.
Myofascial release techniques such as diaphragmrelease and thoracic inlet release also contributes toincrease in chest expansion and improves motion ofdiaphragm. It releases connective tissue tension withinstructures of thorax. It helps in removing restriction tolymphatic flow. It releases tissue restriction, improveslymphatic drainage and improves mechanics ofrespiration.11, 14
According to handbook of osteopathic technique byLaurie Hartman, myofascial release techniquesattempts to ‘normalize’ these areas by allowingimproved circulation and ‘re-setting’ of the neuralcontrol of tendons and muscles. Its main action is onconnective tissues, fascia and muscle attachments10.
The reduction in RR could be attributed tonormalization of sympathetic tone through Chapman’sreflexes. The increase in chest expansion probablysuggests that the patients tidal breathing has increasedand therefore reflected as reduced RR.
Donald R. Noll studied the Efficacy of OsteopathicManipulation in Chronic Obstructive PulmonaryDisease. He stated that OMT sessions are designed toimprove chest wall compliance and diaphragmaticfunction which produce an immediate positive changein pulmonary function parameters and chest wallmobility20.
As this study supported our experimentalhypothesis OMT can be used as an adjunct treatmentin COPD along with pulmonary rehabilitation.
Conclusion: Osteopathic manipulative treatmentincreases chest expansion at both axillary andxiphisternal level in patients with COPD. There isincrease in peak expiratory flow rate followingosteopathic manipulative treatment in patients withCOPD. Osteopathic manipulative treatment leads toreduction in respiratory rate in patients with COPD.
Limitations of the study
• Small sample size
• Patients are not divided according to GOLDclassification
• Occupational background and socioeconomicstatus were not considered
37. praniti--196-201.pmd 2/7/2013, 8:08 PM199

200 Indian Journal of Physiotherapy & Occupational Therapy. January-March 2013, Vol. 7, No. 1
SUMMARY
In order to investigate the effects of osteopathicmanipulative treatment in patients with chronicobstructive pulmonary disease, 30 patients wereenrolled in this study. The patients were given singlesession of Osteopathic manipulation techniques suchas soft tissue kneading, rib raising, “Redoming” theabdominal diaphragm, suboccipital decompression,thoracic inlet myofascial release, pectoral traction andthoracic lymphatic pump with activation. The outcomemeasures of chest expansion at axillary andxiphisternal levels, peak expiratory flow rate andrespiratory rate were measured pre and post treatment.
The mean pre treatment and post treatment score ofchest expansion at axillary level were analysed usingthe Wilcoxon signed ranks test and the improvement inchest expansion was found to be significant, pvalue=1.17E-05 (< 0.05).
The mean pre treatment and post treatment score ofchest expansion at xiphisternal level were analysedusing the Wilcoxon signed ranks test and theimprovement in chest expansion was found to besignificant, p value= 3.06E-05 (< 0.05).
The mean pre treatment and post treatment score ofpeak expiratory flow rate were analysed using theWilcoxon signed ranks test and increase in PEFR wasfound to be significant, p value= 2.84E-04 (< 0.05).
The mean pre treatment and post treatment score ofrespiratory rate were analysed using paired t-test andreduction in RR was found to be significant, p value=4.50E-03 (< 0.05).
Therefore these results support the hypothesis ofthe study that Osteopathic manipulative treatmentshows improvement in Chest Expansion, PeakExpiratory Flow Rate and reduction in Respiratory Rate.
Conflict of Interest Statement
I, Dr. Praniti P. Bhilpawar (PT) the primaryinvestigator hereby declare that there are no conflicts ofinterest and the present study is an original work.
REFERENCES
1. Murthy KJR, Sastry JG. Economic burden ofchronic obstructive pulmonary disease. NCMHBackground Papers· Burden of Disease in India;2005.
2. Seaton Anthony, Seaton Douglas, Leith Gordon.Crofton And Douglas’s Respiratory Disease 1. 5th
ed. London: Blackwell Science; 2000. p. 616-679.3. Fishman Alfred, Elias Jack. Fishman’s Pulmonary
Disease And Disorders. 3rd ed. US: McGraw-Hill;1998. p. 645-681.
4. Boon Nicholas A, College Nicki R, Walker BrianR, Hunter John. Davidson’s Principles AndPractice Of Medicine. 20th ed. Philadelphia:Churchill Livingstone; 2006. p. 678-684.
5. British Thoracic Society. Guidelines For TheManagement Of Chronic Obstructive PulmonaryDisease. Thorax 1997; 52.
6. Celli BR, MacNee W. Standards for the diagnosisand treatment of patients with COPD: a summaryof the ATS/ERS position paper. Eur Respir J 2004;23: 932–946.
7. Barnes Peter J. Chronic Obstructive PulmonaryDisease. NEJM 2007 Jul 27;343(4):269-280.
8. Noll Donald R, Brian F Degenhardt, Jane CJohnson, Selina A. Burt. Immediate Effects ofOsteopathic Manipulative Treatment in ElderlyPatients with Chronic Obstructive PulmonaryDisease. JAOA 2008 May;108(5):259.
9. Masarsky CS, Weber M. Chiropractic managementof chronic obstructive pulmonary disease. JManipulative Physiol Ther. 1988 Dec;11(6):505-10.
10. Halma Kelly D. The Osteopathic Approach to theChest Pain Patient.
11. Rosenow Edward C. Barrel chest. MFMER. 2010Aug 7.
12. Hartman Laurie. Handbook of OsteopathicTechnique. 3rd ed. UK: Chapman & Hall; 1997.
13. Luce Helen, Robinson Mark. IntegratingOsteopathic Manipulative Treatment into ClinicalCare. University of Wisconsin Department ofFamily Medicine STFM Annual Meeting – Denver,CO;April 29, 2009.
14. Sinha Akhoury. Principles and practices oftherapeutic massage. 1st ed. New Delhi: Jaypee;2001. p. 57.
15. Hruby Raymond J, Hoffman Keasha N. Avianinfluenza: an osteopathic component to treatment.Osteopath Med Prim Care 2007;1.
16. American Academy of Osteopathy. An Overviewof Osteopathic Manipulation Techniques.3500DePauw Boulevard, Suite 1080 Indianapolis,Indiana 46268-1136(317) 879-1881.
17. Henderson Aaron T et al. Effects of Rib Raising onthe Autonomic Nervous System: A Pilot Study
37. praniti--196-201.pmd 2/7/2013, 8:08 PM200

Indian Journal of Physiotherapy & Occupational Therapy. January-March 2013, Vol. 7, No. 1 201
Using Noninvasive Biomarkers. JAOA 2010Jun;110(6):324-330.
18. Sutphin Dean, Chair Kerry Redican, DavidHarden, Billie Lepczyk. The Use of OsteopathicManipulation in a Clinic and Home Setting toAddress Pulmonary Distress as Related to Asthmain Southwest Virginia: 2009 Jan.
19. Mein Eric A. Physiological Regulation Through
Manual Therapy. Philadelphia: PhysicalMedicine and Rehabilitation; 2000.
20. Noll Donald R et al. Efficacy of osteopathicmanipulation as an adjunctive treatment forhospitalized patients with pneumonia: arandomized controlled trial. Osteopath Med PrimCare. 2010;4:2.
37. praniti--196-201.pmd 2/7/2013, 8:08 PM201

202 Indian Journal of Physiotherapy & Occupational Therapy. January-March 2013, Vol. 7, No. 1
Comparison of Stretch Glides on External Rotation Rangeof Motion in patients with Primary Adhesive Capsulitis
Paras Joshi, Bhavesh JagadLecturer, Shree K K Sheth Physiotherapy College, Rajkot
ABSTRACT
Back ground: Adhesive capsulitis, most commonly referred to as frozen shoulder (FS), is an idiopathicdisease with 2 principal characteristics: pain and contracture, affecting the external rotation most. Incontrast to traditional mobilization technique andrea et al found posterior glide more effective inimproving external rotation ROM and pain.
Objective: To find out the effective stretch glide for external rotation ROM and pain in patients withprimary adhesive capsulitis.
Methods: 30 subjects were divided into two groups called Anterior stretch glide (ASG) and Posteriorstretch glide (PSG). Each group received ultrasound, same exercise protocol along with their designatedglides for 2 weeks. Outcome measures were External Rotation ROM and VAS. Data was analyzed byusing the SPSS software. Wilcoxon signed rank and rank sum tests were used to measure the differencesin VAS and Paired and unpaired t tests were used for ROM evaluation.
Findings: There was a significant difference in External Rotation ROM and VAS in both the groupsafter the intervention, even there is a significant difference between the groups.
Conclusion: anterior stretch glide is very effective in reducing pain or unpleasantness intensity andincreasing external rotation range of motion at shoulder in patients with primary adhesive capsulitis.
Keywords: Primary Adhesive Capsulitis, Stretch Glides, External Rotation
INTRODUCTION
Frozen shoulder, or idiopathic adhesive capsulitisis a condition of uncertain etiology characterized bysubstantial restriction of both active and passiveshoulder motion that occurs in the absence of a knownintrinsic shoulder disorder1
Although adhesive capsulitis is generallyconsidered to be a self-limiting condition that can betreated with physical therapy, the best treatment hasbeen the subject of extensive investigation2
The types of treatment have included benignneglect, chiropractic manipulation, oral corticosteroids,injection of corticosteroids, physical therapy exercisesand modalities, manipulation under anesthesia,mobilization and arthroscopic and open releases of thecontracture2-6
Adhesive capsulitis is caused by inflammation ofthe joint capsule and synovium that eventually resultsin the formation of capsular contractures. The capsule
does not become adhered to the humerus, as the termadhesive implied, but the contracted capsule holds thehumeral head tightly against the glenoid fossa.Clinically, there is global loss of both passive and activeROM of the glenohumeral joint, with external rotationusually being the most restricted physiologicmovement.2,7,8
In physiotherapy exercises, massage and modalitieshave been shown effective to improve ROM at shoulderjoint, except rotational components. 9
Traditionally anterior glide of GH joint is used toimprove External Rotation ROM based on convexconcave concept.10 Where as Roubal11 and Andrea J12 etal have found posterior glide more effective based oncapsular constrain mechanism.13
Purpose of this study was to find out the directionof movement for GH joint glide that would result insignificant improvement in shoulder External rotationROM in individual with primary adhesive capsulitis.
38. Paras Joshi--202-207.pmd 2/7/2013, 8:08 PM202

Indian Journal of Physiotherapy & Occupational Therapy. January-March 2013, Vol. 7, No. 1 203
OBJECTIVES
1. To check the effectiveness of anterior stretch glideon External Rotation ROM and pain orunpleasantness in patients with primary adhesivecapsulitis.
2. To check the effectiveness of posterior stretch glideon External Rotation ROM and pain orunpleasantness in patients with primary adhesivecapsulitis.
3. To compare the effectiveness of anterior andposterior stretch glide on External Rotation ROMand pain or unpleasantness in patients withprimary adhesive capsulitis.
HYPOTHESIS
Null Hypothesis: There will be no significantdifference between Anterior Stretch Glide and PosteriorStretch glide on External Rotation ROM and pain orunpleasantness in patients with primary adhesivecapsulitis.
Alternate Hypothesis: There will be significantdifference between Anterior Stretch Glide and PosteriorStretch glide on External Rotation ROM and pain orunpleasantness in patients with primary adhesivecapsulitis.
MATERIALS AND METHOD
Total 55 Subjects with primary adhesive capsulitis,fulfilling the criteria of the study were selected betweenmarch 2011 to February 2012 from Shree K K ShethPhysiotherapy Center, Rajkot. 30 Subjects havecompleted the study and taken for final analysis.
Study design: Experimental study.
Inclusion criteria
1. Idiopathic or Primary Adhesive Capsulitis(insidious onset, no history of trauma)
2. Age between 30 to 55 years
3. Unilateral condition
Exclusion Criteria
1. Any previous history of surgery to affected side
2. Cervical radiculopathy affecting the study
3. History of neurological conditions affecting thestudy (i.e stroke, Parkinson’s)
4. History of steroid injection
5. Muscular tightness affecting the study (i.esubscapularis)
Consent forms were signed by the Subjects beforeparticipation in the study.
Subjects were randomly (by using the randomnumber, i.e. 1, 2) assigned to one of the two treatmentgroups:
Group 1: Anterior Stretch Glide (ASG), (6 male, 9female =15)
Group 2: Posterior Stretch Glide (PSG), (5 male, 10female =15)
3 subjects have reported having diabetes and takingmedications for the same (2 from ASG and 1 from PSG)
Subjects were advised not to do exercises at homenor were any written guidelines given.
MEASURES
Subjects were exclusively evaluated for only ExternalRotation ROM and unpleasantness on VAS.
External Rotation ROM
External Rotation ROM was assessed at the baselineand at the end of the 6th treatment session by Hjelm’sprotocol.15 All Measurements were taken in supineposition.
Baseline: Humerus was placed in full availableAbduction passively, and active External Rotation ROMwas measured. Available abduction at baseline wasrecorded for each subject.
At the end of 6th session: Passively the humerus isabducted to baseline abduction and active ExternalRotation ROM was measured again.
All measurements were taken by therapists havingmore than 5 years of clinical experience by standardgoniometer. Therapists were kept blind about the groupsand to avoid subjective bias Subjects were instructed tolook opposite side during measurements.
VAS
Subjects were asked to mark VAS before the 1st
treatment and after the last treatment; we asked thesubjects to mark on 10cms vertical line the relativeunpleasantness.16
38. Paras Joshi--202-207.pmd 2/7/2013, 8:08 PM203

204 Indian Journal of Physiotherapy & Occupational Therapy. January-March 2013, Vol. 7, No. 1
Targeted capsule (anterior or posterior) waspreheated before glide by 1 MHz 19Ultrasound, in orderget the maximum effect of stretch glide.17 Ultrasoundwere applied at 1.5 w/cm2 in continuous mode for 10minutes (Electroson 608, 35mm diameter of head, 12acoustic watts max). Capsule region was effectivelycovered and subjects were asked to report discomfort ifany. However no such reports were found during thestudy.
In this study we used Kaltenborn grade III technique,applying the force to stretch tissues crossing the joints.18
We used stretch glide like Andrea J and al; no oscillatorymotions were performed, only end range stretchposition was held for 1minute at least. During eachtreatment session total 15 repetitions were given. Eachsubject was treated for 6 sessions on alternate days, in2 weeks.
Group 1: ASG group
Subjects were positioned in prone; with maintainedlateral humeral distraction (mid range position), whileanterior stretch glides was performed to end range, atthe end range of abduction and external rotation.
Group 2: PSG group
Subjects were positioned in supine; with maintainedlateral humeral distraction (mid range position), whileposterior stretch glide was performed to end range, atthe end range of abduction and external rotation.
Followed by the stretch glides subjects wereparticipated in traditional ROM exercises whichinclude rope and pulley, finger ladder, wand exercises,pendular exercises 20 repetitions for each exercise.
DATA ANALYSIS
For each subject, the number corresponding to thesubject’s mark on the visual analogue scale wasrecorded. Raw score means and standard deviations ofthe visual analogue scale score and external rotationrange of motion were calculated. In order to determinewhether there was a significant difference within thetwo groups between the pre-treatment visual analoguescale scores and the post treatment visual analoguescale scores, Wilcoxon Signed Rank Test wasperformed. The difference between pretreatment visualanalogue scale scores and post treatment visualanalogue scale scores in ASG group was compared withthat of PSG group using Wilcoxon Rank Sum Test. Thisanalysis was done to determine whether the differencein the scores between the two groups is significant ornot. The pretreatment external rotation range of motionwas compared with the post treatment external rotationrange of motion within two groups using two tailedStudent’s paired t-test. Between groups comparison ofdifference in external rotation range of motion was doneby performing two tailed student’s unpaired t-test. Thepaired and unpaired t-tests were performed using spssstatistics 14.0.
RESULTS
Table 1. Gender distributions of 30 subjects whoparticipated in the study
Gender ASG GROUP PSG GROUP
Male 6 (40%) 5 (33%)
Female 9 (60%) 10 (67%)
Total 15 15
Mean age with SD 43.095±11.38 44.295±10.6
Table 2. Mean±SD for External Rotation ROM and VAS.
PRETREATMENT POSTTREATMENT DIFFERENCE
MEAN SD MEAN SD MEAN SD
ER ROM
ASG 39.33 14.98 60.33 12.16 -21 2.82
PSG 45.66 13.34 50.00 12.39 -4.34 0.95
VAS
ASG 5.66 1.71 3.80 1.82 1.86 -0.11
PSG 5.53 1.50 4.93 1.22 0.60 0.28
Table 3. T values for the External Rotation ROM.
Calculated Observed
ASG Group (t14) 5.37 2.14 P<0.005Highly significant
PSG Group (t14) 2.54 2.14 P<0.05 Significant
Between groups ASG & PSG 2.86 2.05 P<0.01 Significant
38. Paras Joshi--202-207.pmd 2/7/2013, 8:08 PM204

Indian Journal of Physiotherapy & Occupational Therapy. January-March 2013, Vol. 7, No. 1 205
Table 4. T value and z value calculated by WilcoxonSigned Rank Test and Rank sum test respectively for
VAS
VAS T value Probability (P)
ASG Group(within group) 110 <0.01 S
PSG Group (within group) 60 <0.05 S
Between groups ASG & PSG 3.21 (z value) <0.001 HS
Table 1 shows the gender distributions and meanage with standard deviations respectively. ASG groupcontained 6 (40%) male and 9 (60%) female with meanage of 43.095±11.38 years, where as PSG groupcontained 5 (33%) male and 10 (67%) female with meanage of 44.295±10.6 years.
There was no significant age difference seen acrosstwo groups.
Table 2 and Table 3
Shows pre treatment, post treatment and differencemeans and standard deviations of visual analoguescale score for pain or unpleasantness intensity andthe external rotation range of motion values of eachgroup. Scores reflect greater improvement for ASGgroup than for PSG group on all variables.
The two tailed paired t-test has showed significantdifference between pre and post-treatment externalrotation range of motion in ASG and PSG group at 5%significant limit. Comparison showed significantdifference between these groups. Calculated t valuesfor the difference of External rotation ROM within ASG& PSG groups at 5% significance limit and t values forcomparison of difference between two groups and valueof probability of occurance by chance.
Table 4
Wilcoxon signed rank test was applied in ASG andPSG group for within group comparison of visualanalogue scale score and the result showed significantimprovement in visual analogue scale scores in ASG(T=110>105, P<0.01) and PSG (T=60, P<0.05)
Wilcoxon Rank Sum Test (Mann Whitney ‘U’ Test)was applied for comparison between ASG and PSG forpost treatment visual analogue scale scores. The resultreflects significant difference in the improvementbetween ASG and PSG Groups
Above results suggests that anterior stretch glide ismore effective in improving shoulder external rotationand pain or unpleasantness as compared to posteriorstretch glide.
Hence, the null hypothesis of no difference withinand between groups is rejected and alternativehypothesis is accepted.
DISCUSSION
Study was done to investigate the effectiveness ofanterior versus posterior stretch glide on ExternalRotation ROM and pain or unpleasantness in patientswith adhesive capsulitis. We found that anterior stretchglide combined with ultrasound and exercises weresuperior in treating External Rotation ROM deficitscommonly found in patients with adhesive capsulitis.
We have excluded the patients who have musculartightness affecting the study. i.e. subscapularis.Glenohumeral external rotation ROM deficit wasattributed to muscle flexibil-ity deficit (eg, subscapularisflexibility deficits) if the glenohumeral external rotationROM deficit became less as the shoulder wasabducted.12
These findings are against of Roubal11 et al andAndrea12 et al, who found marked increase in ExternalRotation ROM with posterior glide. Our findingssupport the traditional convex concave rule.13, 18
Andrea et al have chosen flexion as additionalcomponent to increase effectiveness for mobilizationusing posterior stretch glide which could have affectedtheir outcome; where as we have not added the flexionin posterior glide no matter whatever the progressionis. Present study includes only those patients who havefinished the protocol despite having vigorous stretchprotocol for 1 min at least without compromising theintensity of stretching; where as Andrea et al have usedthe vigorous protocol in a minimal number of patientsonly.
Novotny et al7 studied the gleno-humeral joint invitro using techniques in which only the capsule andarticular surface contact controlled the motion of thehumerus. They found that at low mo-ments the humeralhead initially trans-lates across the glenoid surface inthe direction opposite to the motion, due to the jointsurface geometry, as consistent with the concave-convexrule. Then, with increasing moment and angle ofrota-tion, the humeral head changes direc-tion as thecapsule tightens, “pushing the humeral head backalong the glenoid surface.” Thus, it is thought that thetension in the capsular tissues rather than joint surfacegeometry controls the translatory movements of thehumeral head. Asymmetrical capsular tight-ness hasthe potential to impact humeral head motion, especially
38. Paras Joshi--202-207.pmd 2/7/2013, 8:08 PM205

206 Indian Journal of Physiotherapy & Occupational Therapy. January-March 2013, Vol. 7, No. 1
when tension in the capsule increases as the arm istak-en further into elevation, which supports the andreaet al results however we dint get such results and notable to clearly explain the why this mechanism has notbeen taken place in our patients.
We found anterior stretch glide more effective basedon traditional covex concave rule and naturallyelongated anterior capsule provide more space for headof humerus when subject actively externally rotate thearm in contrast to capsular constrain mechanism.13
Moreover in adhesive capsulitis fibrous adhesion takesplace surrounding the joint capsule, we believe thatanterior stretch glide may be more effective in breakingthose adhesion and allow normal kinetics when patientattempts active external rotation.7
Joint mobilization techniques are assumed to inducevarious beneficial effects. The neurophysiologic effectis based on the stimulation of peripheralmechanoreceptors and the inhibition of nociceptors. Inaddition obermann et al found high grade traditionalmobilization found effective to treat the patients withprimary adhesive capsulitis.20 Our results supports itin terms of pain and ROM.
LIMITATIONS
Dominance of hand is of much importance inadhesive capsulitis, we have not considered it in ourstudy.
Abduction and Internal Rotation could haveincluded in this study as outcome measures.
Functional outcome measure was not included inthis study.
Further recommendations
Multi angle glides should be checked in largerpopulation.
Effects of glides can be checked with thickness ofcapsule and movement pattern in further studies.
CONCLUSION
The ASG group showed significant improvementin the External Rotation ROM as well as VAS scorecompare to PSG group. The results of this study indicatethat anterior stretch glide is very effective in reducingpain or unpleasantness intensity and increasingexternal rotation range of motion at shoulder in patientswith primary adhesive capsulitis.
ACKNOWLEDGEMENTS
We would like to thank management of Shree K KSheth trust and Dr. Sarala bhatt for their support andguidance.
REFERENCES
1. Zuckerman, J. D., and Cuomo, F.: Frozen shoulder.In The Shoulder: A Balance of Mobility andStability, pp. 253-267. Edited by F. A. Matsen, III, F.H. Fu, and R. J. Hawkins. Rosemont, Illinois,American Academy of Orthopaedic Surgeons,1993.
2. Roy, S., and Oldham, R.: Management of painfulshoulder. Lancet, 1: 1322-1324, 1976.
3. Ekelund, A. L., and Rydell, N.: Combinationtreatment for adhesive capsulitis of the shoulder.Clin. Orthop., 282: 105-109, 1992.
4. Neviaser, R. J., and Neviaser, T. J.: The frozenshoulder. Diagnosis and management. Clin.Orthop., 223: 59-64, 1987.
5. Ozaki, J.; Nakagawa, Y.; Sakurai, G.; and Tamai,S.: Recalcitrant chronic adhesive capsulitis of theshoulder. Role of contracture of the coracohumeralligament and rotator interval in pathogenesis andtreatment. J. Bone and Joint Surg., 71-A: 1511-1515,Dec. 1989.
6. Matsen, F. A., III; Lippitt, S. B.; Sidles, J. A.; andHarryman, D. T., II: Evaluating the shoulder. InPractical Evaluation and Management of theShoulder, pp. 1-17. Philadelphia, W. B. Saunders,1994.
7. Novotny JE, Nicholoas CE. Normal kinematics ofuncontrained glenohumeral joint under coupledmoments loads. J shoulder elbow surg. 1998;629-39.
8. Wamer et al. Adhesive capsulitis of shoulder. Jbone joint surgery AM. 1996; 78:1808-16
9. Jurgel J, Rannama L, et al. Shoulder functions inSubjects with frozen shoulder before and after 4week rehabilitation. Medicina 2005;41:30-38
10. Curl LA, Warren RF. Glenohumeral joint stability.Selective cutting studies on static capsularrestraings
11. Roubal PJ et al. Glenohumeral glidingmanipulation following interscalene brachialplexus block in Subjects with adhesive capsulitis.
12. Andrea J, Joseph J et al. The effect of anterior versusposterior glide joint mobilization on externalrotation range of motion in Subjects with adhesivecapsulitis. JOSPT 2007;37;3.
38. Paras Joshi--202-207.pmd 2/7/2013, 8:08 PM206

Indian Journal of Physiotherapy & Occupational Therapy. January-March 2013, Vol. 7, No. 1 207
13. Donatelli RA, Wooden MJ. Orthopaedics physicalthera. 2nd edi. :Churchill Liningstone; 1994
14. Harryman DT et al. translation of the humeral headon the glenoid with passive glenohumeral motion.J Bone joint Surg Am. 1990;72:1334-43
15. Hjelm, Draper C et al. anterior inferior capsularlength sufficiency in the painful shoulder. J orthoSport Phys Ther. 1996;23:216-22
16. Price DD, Mc Grath PA et al. the validation ofvisual analogue scales as ratio scale measures forchronic and experimental pain. Pain. 1983;17:45-56
17. Reed B, Ashikaga T. The effects of heating withultrasound on knee joint displacement. J OrthoSports ther. 1997;26:131-7
18. Kaltenborn FM. Manual Therapy of the Extremityjoints. Oslo, Norway: Olaf Norlis, Bokhandel;1973.
19. Gann N. Ultrasound: current concepts. ClinManage1991;11:64–9.
20. Obermann et al. Comparison of High-Grade andLow-Grade Mobilization Techniques in theManagement of Adhesive Capsulitisof theShoulder: RandomizedControlled Trial. Physthera. 2006; 86:355-368.
38. Paras Joshi--202-207.pmd 2/7/2013, 8:08 PM207

208 Indian Journal of Physiotherapy & Occupational Therapy. January-March 2013, Vol. 7, No. 1
A Study of Electromyographic Activity of MasseterMuscle After Gum Chewing in Young Adults
Preeti Baghel1, Nidhi Kalra2, Sumit Kalra2
1BPT Student, 2Assistant Professor, Banarsidas Chandiwala Institute of Physiotherapy (Maa Anandmai marg,Chandiwala estate, Kalkaji, New Delhi
ABSTRACT
Background: Habitual gum chewing is considered as one of the causes which can lead to thedevelopment of Temporomandibular disorder (TMD). Previous studies have compared the effect ofchewing induced masticatory muscle pain in females and males using different methods but this studycompares the electromyographic behaviour of masseter muscle in females with males who do gumchewing.
Aims and Objective: To compare the effect of gum chewing on masseter muscle in females with malesby analyzing its electromyographic behaviour.
Subjects: 60 young adults (30 females and 30 males) who do gum chewing took part in this studywhich was allotted to two groups: Group A- Females and Group B- Males.
Research Design: Comparative study
Methodology: The device used in this study is a single channel EMG. The subjects were given chewinggum and asked to chew gum at least one hour before coming for the study. All monitoring was performedwith the patients in a sitting position. Two self-adhesive surface electrodes were utilized and placed onthe midsubstance of muscle belly of right masseter muscle in line with muscle fibers. The EMG recordingof masseter muscle was done at most comfortable position of jaw i.e., at rest position and the EMGactivity was recorded after 30 seconds.
Data Analysis: Data are expressed as mean, standard deviation and 95% confidence interval. Theindependent t- test or Levene's test for equality of variances was used to determine the normal distributionof the variance (P < 0.05).
Results: The independent t-test indicates a significant increase in the motor activity of the massetermuscle in females than in males as t-test reveal statistically reliable difference between the mean numberof POST TEST - A has (M = 2.171, s = 101.76) and that the POST TEST - B has (M = 1.62, s = 75.57), t(58)= 2.367, P = .05.
Conclusion: Electromyographic behaviour of the masseter muscle in individuals who do gum chewingis found to be significantly increased in females than in males. This can result in the development of thesigns and symptoms of the temporomandibular disorders. Therefore, it can be concluded from thepresent study that one should avoid gum chewing especially females on the regular basis so as toprevent their jaw from the risk of developing TMD at an early age.
Keywords: Electromyography, Mastication, Muscle fatigue, Chewing.
INTRODUCTION
Chewing is an oral function that is of vitalimportance for the biological and social life of humanbeings. As a pre-requisite for this function, a healthymasticatory system characterized by the absence of painat rest and during functional movements of themandible is required.1, 2
The Masseter muscle is an integral part of the oralfacial complex and one of the major muscles ofmastication. It functions with other masticatory muscles
in moving and posturing the mandible. When a patienthas temporomandibular dysfunction (TMD) or amyogenic disorder, the integrity of the masseter musclecan be compromised resulting in pain, malfunction,inflammation and swelling. TMJ syndrome occurs inyounger patients mostly women, typically between theages of 20 and 40. A careful evaluation of the massetermuscle is necessary in facial pain patients since thepain can originate from a distant site and be referred tothis area.3, 4, 5, 6
39. Preeti Bhagel-208-212.pmd 2/7/2013, 8:08 PM208

Indian Journal of Physiotherapy & Occupational Therapy. January-March 2013, Vol. 7, No. 1 209
Gum Chewing like any product has positive andnegative effects. Surprisingly, the positive effects of gumchewing are many; however excessive use can presentproblems. The type and duration of chewing are whatdetermine how healthy or unhealthy gum chewing willbe for an individual.6
Women are more likely to experience disability dueto TMDs, and they represent over 80% of the patientswho receive treatment of TMDs.9, 10 In 2003; H. Karibel,G. Goddard and R. W. Gear11 studied the sex differencesin masticatory muscle pain after chewing. They testedthe hypothesis that physiologically relevant exercise(i.e., chewing bubble gum for 6 min) increasesmasticatory muscle pain in patients, but not inasymptomatic control subjects, and that female patient’sexperience a significantly greater increase than males.These results suggested greater susceptibility inwomen.
Obviously, further research must be done on thesepossible negative side effects of constant gum chewing.But for now, the idea of research is to study the long-term effects of gum chewing on motor activity of themasseter muscle by comparing its electromyographicbehaviour in females with males who do gum chewing.
AIMS AND OBJECTIVE
To compare the effect of gum chewing on massetermuscle in females with males by analyzing itselectromyographic behaviour.
NULL HYPOTHESIS (H0): Effect of gum chewingon masseter muscle in males is same as that of femalesas EMG indicates almost similar motor activity in boththe males and females.
EXPERIMENTAL HYPOTHESIS (H1): Effect ofgum chewing on masseter muscle in females is morethan that of males as EMG indicates greater motoractivity in females.
ALTERNATE HYPOTHESIS (H2): Effect of gumchewing on masseter muscle in males is more than thatof females as EMG indicates greater motor activity inmales.
METHODOLOGY
The subjects for the present study were selected fromvarious colleges of Delhi. 60 young adults (Group A-30 females and Group B- 30 males) took part in thisstudy on the basis of following criteria:
Inclusion criteria (4, 12, 13)
• Age group of 20 to 25 years.
• Free of dental pathologies.
• Individuals who chew gum regularly. (3-5 sticks ofgum a day)
Exclusion criteria(1, 14, 15, 16)
• TMJ Dysfunction.
• Sleep rated or waking bruxism.
• Medical systemic problems that could affectmuscular function such as myalgia, myositis andfibromyalgia of masseter muscle.
• History of severe head and neck trauma (fracturesor whiplash injury).
• History of orthognatic surgery.
• Using any medication that could interfere in muscleactivity such as antihistamines, sedatives etc.
• Receiving any kind of treatment during the courseof study that could directly or indirectly interfere inmuscle activity such as speech therapy andotorhinolaryngology treatment.
• Subjects having any neurological, psychological orpsychiatric disorder.
Instrumentation
• Electromyography machine -NeuroTracTM
MyoPlus4 attached with an desktop display.
• Two Self-adhesive surface electrodes, round shapedwith a diameter of approximately 30mm.
• A chair (Adjustable in height).
Research design
• Comparative Design.
Variables
• Dependent variable: EMG activity.
• Independent variable: Gum chewing.
PROCEDURE
Subjects fulfilling the inclusion criteria were takeninto consideration. The procedure was explained to thesubjects and a written consent was taken afterexplaining the benefits and clearing the doubts of thesubjects regarding study.
39. Preeti Bhagel-208-212.pmd 2/7/2013, 8:08 PM209

210 Indian Journal of Physiotherapy & Occupational Therapy. January-March 2013, Vol. 7, No. 1
EMG RECORDING
The device used in this study is a single channelEMG. The subjects of both the groups were givenchewing gum and asked to chew gum at least one hourbefore coming for the study. All monitoring wasperformed with the patients in a sitting position. Thesubjects were seated comfortably upright in a chair ofadjustable height at a desk of 30-inch height on whichthe EMG attached to an desktop display is placed.17
Back of their heads were supported and their feet wasinsulated from the floor.18 The subjects were asked tomake no head or body movements during therecordings.19 Position of the head was kept vertical andno movement was allowed as jaw muscles respond tochange in head position 20, 21 and facial muscles shouldbe relaxed, keeping lips closed. Questions wereanswered after the instructions were given to be certainthat the instructions were understood. Two self-adhesive surface electrodes were utilized and placedon the midsubstance of muscle belly of right massetermuscle in line with muscle fibers. 22, 23 One electrodewas at the level of the lower border of the mandible,and the other 25 mm above this, close to the motor point.Preliminary experiments showed that with thisplacement, the waveform obtained by triggering anaverage of the surface EMG on the spikes of a singlemasseter motor unit was biphasic and approximatelysymmetrical. 23 The EMG recording of masseter musclewas done at most comfortable position of jaw (i.e., atrest position which is the habitual postural position ofthe mandible when at rest is in the upright positionand the condyles are in a neutral unstrained positionin the mandibular fossae). It was made sure that properelectrode placement is done and then EMG activity wasrecorded. The recording time for each analysis was 30seconds.
DATA ANALYSIS
Data are expressed as mean, standard deviation and95% confidence interval. The independent t- test orLevene’s test for equality of variances was used todetermine the normal distribution of the variance (P <0.05).
RESULTS
· All the subjects who took part in this studywere analyzed.
· A t-test reveal statistically reliable differencebetween the mean number of POST TEST – A has (M =
2.171, s = 101.76) and that the POST TEST – B has (M =1.62, s = 75.57),t(58) = 2.367, P = .05.
• The independent t-test indicates a significantincrease in the motor activity of the masseter musclein females than in males.
Graph 1: Right masseter muscle mean and standarddeviation
CONCLUSION
Electromyographic behaviour of the masseter musclein individuals who do gum chewing is found to besignificantly increased in females than in males. Theindependent t-test indicates that females show higherelectromyographic activity of masseter muscle thanmales which means masseter muscle functions at ahigher pace in females who chew gum continuouslywhich may lead to the wear and tear of thetemporomandibular joint. This can result in thedevelopment of the signs and symptoms of thetemporomandibular disorders.1 Therefore, it can beconcluded from the present study that one should avoidgum chewing especially females on the regular basisso as to prevent their jaw from the risk of developingTMD at an early age.
DISCUSSION
In this study, the effect of gum chewing on motoractivity of the masseter muscle which is considered asthe primary chewing muscle was compared in femaleswith males who do gum chewing using EMG since it iswell known that the amplitude of EMG is related tocertain extent to the force a muscle may generate.15, 24
The temporomandibular joint is used throughout theday to move the jaw, especially in biting, chewing,talking and yawning. Slow and painful failure of jawjoint function is termed as temporomandibularsyndrome/disorder. Habitual gum chewing isconsidered as one of the causes which can lead to thedevelopment of TMJ disorders.25 In this study we found
39. Preeti Bhagel-208-212.pmd 2/7/2013, 8:08 PM210

Indian Journal of Physiotherapy & Occupational Therapy. January-March 2013, Vol. 7, No. 1 211
significant increase in the activity of masseter musclein females who do gum chewing for prolonged time.
For most people, pain in the area of the jaw joint ormuscles does not signal a serious problem. Generally,discomfort from these conditions is occasional andtemporary, often occurring in cycles. The paineventually goes away with little or no treatment. Somepeople, however, develop significant, long-termsymptoms.4,9 Many studies have also shown that womenshow a tendency to report significantly elevated levelsof muscle pain after a heavy chewing exercise, whilemen do not.11 But, still neither the etiology of musclerelated temporomandibular disorders nor the reasonfor the disproportionate number of women sufferingfrom these disorders is well established.
Further research is of course required but the presentstudy suggests that one should avoid gum chewing onthe regular basis especially females as continuouschewing has a harmful effect on the masseter muscleactivity. In individuals who do continuous chewing,masseter muscle continues to function at a higher pacegetting no time to recover between the meals. Thus,gradually it can lead to the development of signs andsymptoms of temporomandibular disorders.
CLINICAL RELEVANCE
Many other conditions can cause similar symptomsto TMD – including a toothache, sinus problems,arthritis, or gum disease. Therefore, health professionalneeds to conduct a careful patient history and clinicalexamination to determine the cause of the symptoms.9
Researchers throughout the health sciences are workingtogether not only to gain a better understanding of thetemporomandibular joint and muscle disease process,but also to improve the quality of life for people affectedby these disorders. Simple self-care activities are ofteneffective in maintaining oral health and also preventingjaw from the risk of developing TMDs. Nowadays, gumchewing is considered as the major culprit as it leads tothe over usage of the jaw therefore it should be avoided.
REFERENCES
1. M. Koutris et al: Effects of intense chewing exerciseson the masticatory sensory-motor system. JDR2009; vol.88 (7), pg.658-662.
2. Paul Ingraham: Massage therapy for Bruxism, jawclenching and TMJ syndrome, 2010.
3. John S.Dupont, Christopher E. Brown: Massetertenomyositis, The J. cranio. Prac.2009/July.
4. Temporomandibular joint syndrome: chew on this:your jaw joint can be a source of painful arthritis.Arthritis today 2007/july-aug.
5. Renata Cunha Matheus Rodriques Garcia:Influence of female hormonal fluctuation onmaximum bite force and masticatory efficiency-comparison between subjects with and withouttemporomandibular disorder. Virtual library2008/july 08/03106-6, 01.
6. Robert P Sheon, MD: Temporomandibular jointdysfunction syndrome. Uptodate 2012/Jan.
7. http://www.ehow.com/list_6457095_effects-excessive-gum-chewing.html (Gail Sessons: Theeffects of excessive gum chewing).
8. http://www.askmen.com/sports/foodcourt/foodcourt11.html (Health and sports: Lose weightby chewing gum).
9. National Institute of Dental and Craniofacialresearch: TMJ & Muscle disorders 2010/March,pub no. 10-3487.
10. De Rossi SS, Stoopler ET, Sollecito TP:Temporomandiblar disorders and migraineheadaches: co-morbid conditions? The internetjournal of dental sciences 2005; vol.2, no.1.
11. H. Karibel, G. Goddard, R.W Gear (2003): Sexdifferences in masticatory muscle pain afterchewing. JDR 2003/Feb, vol.82, no. 2112-116.
12. A. Gavish, M. Halachmi, E. Winocur and E. Gazit:Oral habits and their association with the signsand symptoms of temporomandibular disordersin adolescent girls. J. oral rehab. 2010; vol.27,22-32.
13. Regiane Cristina Mendonca et al:Electromyographic assessment of chewinginduced fatigue in TMD patients- a pilot study.Braz. J.oral sci. 2005/oct-dec, vol.4, no.15.
14. Macarena Venegas et al: Clenching and grinding:Effect on masseter and sternocleidomastoidelectromyographic activity in healthy subjects. J.Cranio. Prac.2009/july.
15. Dahlstrom L: Electromyographic studies ofcranimandibular disorders- a review of theliterature. J. oral rehabil 1989/Jan, vol.16 (1),pg.1-20.
16. Selma Seissere et al: Electromyographic activity ofmasticatory muscles in women with osteoporosis.Braz Dent. J. 2009; vol.20, no.3.
39. Preeti Bhagel-208-212.pmd 2/7/2013, 8:08 PM211

212 Indian Journal of Physiotherapy & Occupational Therapy. January-March 2013, Vol. 7, No. 1
17. Robert H. Jebsen, Neal Taylor et al: An objectiveand standardized test of hand position. Archivesof physical medicine & rehab 1969/June.
18. Marie- Agnes Peyron et al: Influence of age onadaptability of human mastication. J. neurophysio.2004/Aug; vol.92 (2), pg.773-779.
19. Simona Tocco, Stefano Teta and Felice Festa :Electromyographic evaluation of masticatory, neck& trunk muscle activity in patients with posteriorcrossbites. European J. orthodontics, vol.32,issue.6, pg.747-752.
20. HD Adhikari et al: Electromyographic pattern ofmasticatory muscles in altered dentition-part II. J.conserv. dent. 2011; vol.14, issue.2, pg. 120-127.
21. Ray La Touche et al: The influence ofcraniomandibular posture on maximal mouthopening and pressure pain threshold in patients
with myofascial temporomandibular paindisorders. Clinical journal of pain 2011/Jan, vol.27,no.1.
22. Paul Canavan and Jessica Capurso: Protocol foruse of EMG and tactile biofeedback in treatmentof temporomandibular disorders and orofacialpain.
23. Timothy S. Miles, Andrew V. Poliakov and MichaelA. Nordstrom: Responses of human massetermotor unit to stretch. The journal of physiology1995/Feb, vol.483, pg.251-264.
24. Claudia Maria de felicio et al: Reliability ofmasticatory efficiency with beads andcorrelational with the muscle activity. Pro-FonoR. Atual. Cient 2008; vol.20, no.4, 225-30, oct/dec.
25. William C. Sheil Jr. MD, FACP, FACR:Temporomandibular joint disorder.
39. Preeti Bhagel-208-212.pmd 2/7/2013, 8:08 PM212

Indian Journal of Physiotherapy & Occupational Therapy. January-March 2013, Vol. 7, No. 1 213
A Study to Evaluate the effect of Fatigue on Knee JointProprioception and Balance in Healthy Individuals
Purvi K. Changela1, K. Selvamani2, Ramaprabhu3
1Lecturer, Shri K K Sheth Physiotherapy College, Rajkot, 2Assoc. Prof., Srinivas College of Physiotherapy, Mangalore,3Assoc. Prof., Srinivas College of Physiotherapy
ABSTRACT
Introduction: Balance and proprioceptive testing is more commonly used in clinical settings to evaluateinjured athletes to return to activity. Muscle fatigue produces neuromuscular deficiency within themuscle , thus predispose a joint to injury and decrease the athletic performance. A finding of previousstudies shows contradictory findings of effect of muscle fatigue on proprioception and balance.
Aims & Objectives: A study to investigate the effect of fatigue on knee joint proprioception and balancein healthy individuals.
Materials & Methods: An observational study was conducted on 30 healthy subjects ( age 18-30 years)from Srinivas college of physiotherapy, Mangalore. Subjects was selected by simple random samplingtechniques. Fatigue was induced in the subjects by cycling upto level of exceeding 60% of predictedHRmax (14-17 PRE). Subjects were tested to estimate reproduction error by using weight bearing jointposition sense test at 30 0 of knee flexion , by goniometric evaluation accompanied by photographicmethod and the balance assessment was done on force platform with the measurement of anteroposterior,lateral CoP excursion and stability score in single limb stance, before and after fatigue protocol.
Results: After inducing fatigue,significant reproduction error was found for perception of joint positionsense (t=-4.103) with significant changes were found in AP (t=3.997), lat CoP excursion (t=10.949) andstability score (t=11.785) at p>0.05.
Conclusion: A study revealed that moderate exercises can reduce proprioception which affects theneuromuscular control of joint making individual more suspectible to injury.
Keywords: Fatigue, Proprioception, Balance, Dynamic Stability.
INTRODUCTION
Muscular fatigue is most often defined as an exerciseinduced reduction in the ability of a muscle to generateforce.1 It is caused by a combination of differentphysiological mechanisms occurring at both the centralthrough the impairment of central drive and peripherallevel through the impairment of muscle function.2 Thehigh incidence of injuries occur during later session ofsports suggest that fatigue may predispose a joint toinjury and decrease the athletic performance.3 The studyof fatigue relative to performance of different skills inthe sports has long been a subject of practical interest.4
Since sports activities are strongly promoted, the riskof sport injuries is likely to increase. It is reported thatknee joint injuries are the common injuries among allsports injury, 39.8% of all sports injuries involve theknee.5 It has been suggested that a higher incidence ofinjuries at the last third of match could be related toalteration of the lower limb neuromuscular control and
altered ability to dynamically stabilize the knee jointbut exactly how this impairment comes about is lessclear.6 It is possible that one factor is reducedproprioceptive acuity.7
In 1906, Sherrington defined “Proprioception” asthe perception of positions and movements of the bodysegments in relation to each other, without the aid ofvision, touch or the organs of equilibrium.7 Theimportance of the proprioception in knee function,stability, injury prevention has been studied extensivelyin literatures. The current consensus is that the sense ofproprioception originates in the simultaneous activityof a range of different types of receptors located inmuscles, joints, and skin.8 Some of these receptors havebeen shown in animal studies to be affected by musclefatigue9 and/or by increased intramuscularconcentrations of substances (Arachnoid acid, KCL, 5-HT, Bradykinin) released during muscle contractions10
which have a direct impact on the discharge pattern ofmuscle spindles that represent the peripheral
40. purvi --213-217.pmd 2/7/2013, 8:08 PM213

214 Indian Journal of Physiotherapy & Occupational Therapy. January-March 2013, Vol. 7, No. 1
component of fatigue and efferent as well as afferentneuromuscular pathways are modulated withexcessive fatigue via reflexes originating from small-diameter muscle afferents (group III and IV afferents)could modify the central processing of proprioception.11.Although it is reasonable to assume that these receptorsare affected in a similar way in humans, comparablylittle is known about the fatigue effects on humanproprioception.12
The perception of movement or joint position inclinical measurements reflects the status of the wholesystem, or that measured proprioceptive defects areconnected to functional disability.13 It is believed thatthe Central Nervous System (CNS) links togetherafferent proprioceptive feedback from multiple joints ofa limb segment and redundancy of the afferentinformation can be used as an “error check” to improveproprioceptive feedback in order to maintain function.8
Reproduction ability is decreased; possibly due toincreased sensitivity of capsular receptors from musclefatigue-induced laxity.3 The assessment of potentialinjury risk before sports participation followed byintervention may decrease the relative injury incidencein athletes.14
The integrity and control of the proprioceptive acuityis essential for the maintenance of balance.15 Balance isdefined as person’s ability to maintain an appropriaterelationship between the body segments and betweenthe body and the environment and to keep the body’scenter of mass over the base of support when performinga task.16 It is assumed that some form of muscle spindledesensitization or perhaps ligament relaxation andGolgi tendon desensitization occurs with excessivefatigue which leads to decreased efferent muscleresponse and poorer ability to maintain balance.17
Balance testing is more commonly used in the clinicalsetting to establish gains in the proprioceptive capacityof injured limbs and helps to evaluate injured athlete toreturn to activity.15 Measures of postural control suchas center of pressure (CoP) excursion which may be amore sensitive measure of postural control thatincorporates proprioception have been used clinicaly.18
In humans, the effect of fatigue on proprioceptionhas been investigated at various joints. Findings ofdisturbed proprioception and balance are frequent inthe literatures, but together they are not conclusive. Sothe purpose of this study is to investigate the effect ofmuscular fatigue on proprioception and balance inhealthy individuals.
METHODOLOGY
Study design: Observational study design
Sampling Technique: Simple Random Sampling
Sample collection: 30 healthy subjects in age groupof 18-30 yrs of both sex were taken for the study fromSrinivas College of Physiotherapy, Mangalore.
Inclusion Criteria
1. Age group: 18-30 years
2. Both male and female were included.
Exclusion Criteria
1. Knee joint pathology
2. Musculoskeletal disease of lower limb
3. Neurological condition
4. Respiratory and heart problem
Materials used
• Static cycle
• Reference markers
• Universal Goniometer
• Video camera
• HR assessment apparatus (cardio-vigil)
• Two dimensional digitizing software of the peakmeasurement system (UTHSCSA Image Tool version3)
• Force Platform (BERTEC, Columbus, OH 43229,U.S.A.)
TESTING PROCEDURE
The proposed title and procedure was beingapproved by ethical committee members , writtenconsent was taken from subjects who fulfilled theinclusion and exclusion criteria and they wererandomly selected. Subject’s age, sex, height, weight,body mass index (BMI), resting heart rate was recordedprior to the test. Borg scale of perceived rate of exertion(PRE) was clearly explained to all the subjects beforecycling. Right lower limb was used for measurement ofproprioception and balance test.
Fatigue was induced by asking the subject to performcycling on a static cycle as fast as possible, the level of
40. purvi --213-217.pmd 2/7/2013, 8:08 PM214

Indian Journal of Physiotherapy & Occupational Therapy. January-March 2013, Vol. 7, No. 1 215
fatigue was indicated and measured by using “Borg’sRate of Perceived Exertion (RPE) scale” and HR wasmonitored using cardio-vigil. Fatigue was induced inthe subjects by cycling. When subjects reached uptolevel of exceeding 60% of predicted HRmax and a levelof exertion of 14-17 on the RPE scale, immediately thesubjects were asked to discontinue cycling.19
Proprioception and balance tests were performedbefore and after fatigue protocol and scores wererecorded.
Subjects were tested to estimate reproduction errorby using weight bearing joint position sense test at 30 0
of knee flexion , by goniometric evaluation accompaniedby photographic method.The subject was given threetrials to identify and reproduce knee joint position (300
knee flexion) initially with eyes open followed by eyesclosed. After trials of test positions, reference markerswere placed along the lateral aspect of the lower limbfor photographic evalution: a) over the greatertrochanter, b) over the iliotibial tract proximal to thesuperior border of the patella and c) over the neck offibula.20
The balance assessment was done on force platformwhile the leg was flexed to 90°at the hip and knee joints,with both arms hanging relaxed at the sides in single-limb stance with the measurement of AP, Lat CoP
excursion and Stability score in single-limb stance onthe force platform after the JPS test following fatigueprotocol.21
DATA ANALYSIS
The demographic data were analyzed using pairedt-test for comparison of pre and post fatiguemeasurement.The data analysis was done using SPSSsoftwear package version 14.level of significance wasset at d” 0.05 with Cl of 95%
RESULTS
Table 1: Distribution of age groups
Age Frequency Percent Valid Percent
19 3 10.0 10.0
20 5 16.7 16.7
21 13 43.3 43.3
22 6 20.0 20.0
23 3 10.0 10.0
Total 30 100.0 100.0
Table 2: Gender Proposition
Frequency Percent
male 21 70.0
female 9 30.0
Total 30 100.0
Table 3: Comparison of pre and post fatigue joint position sense (JPS) test score, AP CoP excursion, Lateral CoPexcursion and stability score.
Mean Std. Deviation Std. Error Mean t df p
Pre fatigue JPS test score 6.7370 3.04761 .55641 -4.103 29 .000VHS
Post fatigue JPS test score 8.7197 3.04767 .55643
Pre fatigue AP CoP excursion 1.2777 .27712 .05060 -10.949 29 0.000VHS
Post fatigue AP CoP excursion 1.7620 .32318 .05900
Pre fatigue LAT CoP excursion .4590 .32341 .05905 -3.997 29 .000VHS
Post fatigue LAT C oP excursion .6820 .44055 .08043
Pre fatigue stability score 86.6090 2.84795 .51996 11.785 29 .000VHS
Post fatigue stability score 81.7803 2.75167 .50238
VHS=very highly significant
The above table shows the mean of pre JPS test scorei.e. 6.7370 ±3.04761 (SD) and post JPS test score i.e.8.7197±3.04767 which shows significant differences (t= -4.103, p<0.05) (figure 1), mean of pre AP CoPexcursion i.e. 1.2777± 0.27712 (SD) and post APexcursion i.e. 1.7620±0.32318 which shows significantdifference (t = -10.949, p < 0.05) (figure 2), mean of preLat Cop excursion i.e. 0.4590 ± 0.32341 (SD) and postLat excursion i.e.0.6820 ±0.44055 (SD) which showssignificant difference (t = -3.997, p < 0.05) ( figure 3),
mean of pre stability score i.e. 86.6090 ± 2.84795 (SD)and post stability score i.e. 81.7803 ±2.75167 (SD) whichshows significant difference for pre and post stabilityscore (t = 11.785, p < 0.05) (figure 4) for the present study.
DISCUSSION
The results of the present study indicated thatfatigue reduces knee joint proprioception i.e. higherreproduction error was found for perception of joint
40. purvi --213-217.pmd 2/7/2013, 8:08 PM215

216 Indian Journal of Physiotherapy & Occupational Therapy. January-March 2013, Vol. 7, No. 1
position sense (t = -4.103, p < 0.05) thereby supportingthe experimental hypothesis.
The findings of David Roberts et al. (2003) onhealthy young persons, to estimate threshold forperception of movement before and after fatigue showsstatically significant difference in threshold value, afterinducing fatigue which support the results of ourstudy.22 However, Marks and Quinney (1993) providedcontradictory findings suggested that muscle fatiguehad a negligible effect on knee JPS. However, theyinduced fatigue by having the subject contract thequadriceps muscle 20 times, which likely was lessfatiguing and that mainly affected the anteriorstructures of the thigh. Therefore, the posteriorstructures, which are of afferent importance duringextension, were probably less affected by fatigue.23
An important issue here in this present study is,whether the effects of fatigue on position sense of kneecan be attributed to central fatigue or to muscle fatigue.Central fatigue may have accompanied peripherallyelicited effects, but there is a chain of evidence indicatingthat alterations in the proprioceptive inflow fromperipheral muscle receptors have contributedconsiderably to the central fatigue effects.10
Djupsjobacka M. et al. (1995) suggested that musclespindles are strongly affected by metabolic products ,such as bradykinin, 5-HT, and lactic acid, theproprioceptive inflow from spindle afferents during theJPS test is likely to have been affected by fatigue.24
Different methods have been used to assessproprioceptive acuity in various studies. Amongst them,Goniometric evaluation for measuring the angleaccompanied by video films is an adequately accuratemethod of measuring the joint angle. Berry C. Stillmanet al. (2001) explained that WB assessments ofproprioception which is more functional might havegreatest relevance in the area of sports medicine .Theoretically, fatigue may increase the time of reaction,which, in the present study, would be seen as higherreproduction error scores. 20
The results of the present study also indicated thatfatigue reduces balance performance (t= 11.785; p <0.05). There are several possible reasons why muscularfatigue affects balance performance. It seems plausiblethat some form of muscle spindle desensitization orperhaps ligament relaxation and Golgi tendondesensitization occurs with excessive fatigue. Theincreased AP and Lat CoP excursion observed aftercycling in the present study may be explained by a
decrease in muscle response and a delay in musclereaction and poorer ability to maintain balance.17 EvaAgeberg et al. (2003) found that short-term cyclingdecrease ability to maintain balance in single limbstance in healthy subjects 30 support the result of presentstudy . 21
We found that a short period of moderate exercisecan reduce proprioception, which may affect theneuromuscular control of the knee joint andsignificantly affects the ability of an individual tomaintain balance on force platform device, thus, maymake it more susceptible to injury.
CLINICAL IMPLICATION
Balance and Proprioceptive testing can be used inthe clinical setting to evaluate injured athlete to returnto activity.
CONCLUSION
The knee joint proprioception and balance areaffected after fatigue in healthy individuals.
ACKNOWLEDGEMENT
I wish to express my thanks to respectable PrincipalRamprasad M. Srinivas College of Physiotherapy,Mangalore , to my respected Guide Assoc. Prof. K.Selvamani and all my respected teachers for their helpand valuable suggestions.We gratefully acknowledgeour respected principal Dr. Sarla Bhatt for their kindsupport and guide in the journal publication.
REFERENCES1. Vollestad NK. Measurement of human muscle
fatigue. J Neurosci Methods June 1997; 74 (2):219-227.
2. Noakes TD. Physiological models to understandexercise fatigue and the adaptations that predictor enhance athletic performance. Scand J Med SciSports June 2000; 10 (3): 123-145.
3. Hiemstra LA., Lo IK., Fowler PJ. Effect of fatigueon knee proprioception: implications for dynamicstabilization. J Orthop Sports Phys Ther Oct 2001;31(10): 598-605.
4. Mark Lyons, Yahya Al-Nakeeb, Alan Nevill. Theimpact of moderate and high intensity total bodyfatigue on passing accuracy in expert and novicebasketball players. J of Sports Sci and Med June2006; 5: 215-227.
5. Majewski M., Susanne H., Klaus S. Epidemiology
40. purvi --213-217.pmd 2/7/2013, 8:08 PM216

Indian Journal of Physiotherapy & Occupational Therapy. January-March 2013, Vol. 7, No. 1 217
of athletic knee injuries: A 10-year study. J KneeJune 2006; 13(3): 184-188.
6. Ribeiro Fernando1, Santos Fernando2, OliveiraJose. Effects of a volleyball match induced fatigueon knee joint position sense. 12th AnnualCongress of the ECSS, 11–14 July 2007, Jyvaskyla,Finland.
7. Martin B. Jorklund. Effects of repetitive work onproprioception and of stretching on sensorymechanisms. Umea university medicaldissertation, new series no. 877 –91. 2004; 90:7305-604.
8. Grigg P. Peripheral neural mechanisms inproprioception. J. Sport Rehab Feb 1994; 3 (1):2-17.
9. L. Hayward, U. Wesselmann and WZ. Rymer.Effects of muscle fatigue on mechanically sensitiveafferents of slow conduction velocity in the cattriceps surae. J Neurophysiol 1991; 65 (2): 360–70.
10. Pedersen, Jonas, Lonn, Johan, Hellstorme, Fredric,Djupsjobacka, Mats, Johansson, Hakan. Localizedmuscle fatigue decreases the acuity of themovement sense in the human shoulder. Williamsand Wilkins July 1999; 31(7): 1047-52.
11. Solomonow M., R. Baratta, BH. Zhou. Thesynergistic action of the anterior cruciate ligamentand thigh muscles in maintaining joint stability.Am J Sports Med May-June 1987; 15 (3): 207-13.
12. Meral Bayramoglu, Reyhan Toprak and SeyhanSozay. Effects of osteoarthritis and fatigue onproprioception of the knee joint. Arch of Phys Medand Rehab Mar 2007; 88(3): 346-50.
13. Ashton Miller JA., Wojtys EM., Huston LJ., Fry-Welch D. Can proprioception really be improvedby exercises? Knee Surg Sports Traumatol ArthroscMay 2001; 9 (3): 128-136.
14. Chandy TA. and Grana WA. Secondary schoolathletic injury in boys and girls: A three-yearcomparison. Phys Sports Med 1985; 13: 106–11.
15. Peggy A. Houglum and David H. Perrin.Therapeutic exercises for athletic injuries.United
States. First edition. Human Kinetics 2001: 272-3.16. Shumway Cook A. and Woollacott M. Control of
posture and balance. Motor control. Theory andpractical application. Second edition. Baltimore,Williams and Wilkins 1995; 120-121.
17. Johnston, Richard B., Howard, Mark E., Cawley,Patrick W., Losse, Gary M. Effect of lower extremitymuscular fatigue on motor control performance.Med Sci Sports Exerc Dec 1998; 30 (12): 1703-1707.
18. Gandevia SC. Spinal and supraspinal factors inhuman muscle fatigue. Physiol Rev Oct 2001; 81(4): 1725-1789.
19. J.E. Bullock Saxton, WJ. Wong, N. Hogan. Theinfluence of age on weight-bearing joint repositionsense of the knee. Exp Brain Res Jan 2001; 136(3):400-406.
20. Barry C. Stillman and Joan M. McMeeken. The roleof WB in the clinical assessment of knee jointposition sense. Austr J of Physiotherapy 2001; 47:247-253.
21. Eva Ageberg, David Roberts, Eva Holmstrom,Thomas Friden. Balance in single-limb stance inhealthy subjects - Reliability of testing procedureand the effect of short-duration Sub-maximalCycling. BMC Musculoskeletal Disorders June2003; 4: 14.
22. David Roberts, Eva Ageberg, Gert Andersson,Thomas Friden. Effects of short-term cycling onknee joint proprioception in healthy youngpersons. Am J of Sports Med 2003; 31: 990-994.
23. Marks R., Quinney HA. Effect of fatiguing maximalisokinetic quadriceps contractions on ability toestimate knee-position. Percept Mot Skills Dec1993; 77 (3 pt 2):1195-202.
24. M. Djupsjobacka, H. Johansson and M.Bergenheim. Influences on the ã-muscle spindlesystem from muscle afferents stimulated byincreased intramuscular concentrations ofarachidonic acid. Brain Res Nov 1994; 663 (2):293–302.
40. purvi --213-217.pmd 2/7/2013, 8:08 PM217

218 Indian Journal of Physiotherapy & Occupational Therapy. January-March 2013, Vol. 7, No. 1
Effect of Core Stabilization and Balance-Training Programon Dynamic Balance
Rabindra Basnet1, Nalina Gupta2
1BPT Student, 2HOD Department of Physiotherapy, College of Applied Education and Health Sciences,Meerut, Uttar Pradesh
ABSTRACT
Introduction: Over the years, injury rehabilitation has changed from strengthening the body usingstrength training to achieve functional kinetic chain movements using neuromuscular training, whichincludes balance and proprioception. Neuromuscular control is the motor response to the sensoryinput of the muscles, whereas balance is a state of bodily equilibrium. The purpose of this study was tofind out the effect of core stabilization and balance training on dynamic balance.
Method: subjects were randomly assigned to one of the two groups: Group A-core stabilization groupand Group B-Balance training group. Both groups were given exercise program for six days per weeksfor two weeks. Pre and post analysis was done by using Star Excursion Balance Test.
Result: Paired T-test was used within the group and p value was found to be less than .05 in both thegroups and independent sample T-test was used between the groups where p value was found to bemore than .05.
Conclusion: Our study concluded that there was no statistical significant difference between corestabilization group and balance training group.
Keywords: Core-Stability Training, Balance Training, Neuromuscular Control
INTRODUCTION
Balance is a key component of normal dailyactivities. In the simplest terms, balance can be definedas “the ability to maintain the body’s centre of gravitywithin the limits of stability as determined by the baseof support”. Balance, or postural control, can bedescribed as either dynamic or static. Static posturalcontrol is attempting to maintain a base of support whileminimizing movement of body segments and the centreof mass; while dynamic postural control involves thecompletion of a functional task with purposefulmovements without compromising an established baseof support.1
To maintain balance, it is necessary to have afunctional awareness of the base of support to betteraccommodate the changing centre of gravity. The goalof balance training is to improve balance throughperturbation of the musculoskeletal system that willfacilitate neuromuscular capability, readiness, andreaction.2
Panjabi describes ‘‘clinical instability as the loss ofthe spine’s ability to maintain its patterns ofdisplacement under physiologic loads so there is noinitial or additional neurologic deficit, no majordeformity, and no incapacitating pain’’. The spinestability system consists of the following interactingelements Neuromuscular control (neural elements),Passive subsystem (osseous and ligamentous elements)& Active subsystem (muscular elements).3
The human core is described as the human low back-pelvic-hip complex with its governing musculature. Thecore is important because it is the anatomical locationin the body where the centre of gravity is located, thuswhere movement stems. The core functions to maintainpostural alignment and dynamic postural equilibriumduring functional activities, which helps to avoid serialdistortion patterns. Core stability is the motor controland muscular capacity of the lumbopelvic-hip complex.4
The core is split into two different regions, the localand global musculature. The multifidus, transverse
41. Rabindra--218-222.pmd 2/7/2013, 8:08 PM218

Indian Journal of Physiotherapy & Occupational Therapy. January-March 2013, Vol. 7, No. 1 219
abdominus, internal oblique and quadrates luborumconstitute the local stabilizing system. The longissimusthoracis, rectus abdominus and external oblique makeup the global system. The local system is responsiblefor segmental spine stability while the global system isresponsible for isometric and isotonic contraction inthe spine. Both of these regions play a role not only indaily and athletic movement but also potentially ininjury prevention.6
A useful method of measuring dynamic balance isthe Star Excursion Balance Test.1 The test provides aquantifiable way to measure dynamic balance. Thissingle leg standing and contralateral reaching test canbe used to determine the dynamic stability of anindividual as they perform a functional movement task.SEBT requires a participant to maintain a base ofsupport with one leg while maximally reaching indifferent directions with the opposite leg without losingbalance or significantly altering the base of support inthe stance leg.6
According to Kibler et al, core stability and strengthis an important component to maximize efficientbalance and athletic function in upper and lowerextremity movements. The same authors suggest thatthe core acts as a base for motion of the distal segments,or “proximal stability for distal mobility.7
Logically, strengthening core muscles will improvestability of the lumbar spine. What has been researchedin much less detail is the effect core strengthening willhave on tasks that encompass whole body movementand dynamic postural control.7
Thus, the aim of this study was to find out the effectof core stability and balance training on dynamicbalance.
MATERIALS AND METHOD
It was an experimental study. Thirty normal healthysubjects of CAEHS, Meerut of both the gender with age18 to 25 years were included in the study. Subjects
having injury and pathology of Hip, Knee and Ankle,deformities such as Genu valgum & varum etc, Sharpacute pain, recent hematoma of knee, hip & ankle andany acute inflammatory condition, history of LBP withsciatica and subject with neurological impairmentswere excluded from the study.
All the subjects were explained about the procedureand were made to fill the consent form. Subjects weredivided into two groups: Group A (n=15) - Corestabilization group and Group B (n=15) - Balancetraining group. Pre evaluation was done by using StarExcursion Balance Test.
Group A received core stability exercises of 3 sets for30 seconds/session once a day 6 days a week for 2weeks. Exercises given to this group were Plank Jao,Side Plank, Bridge, Superman, Sideline Hip Abduction,Oblique Crunch, Straight Leg Rise and LyingWindscreen Wipers Wipers.
Group B received Balance Training exercise of 3 setsfor 30 seconds/session once a day 6 days a week for 2weeks, exercises are Tandem Standing, One LimbBalance, Hip Rise, Knee Band, Standing Kick, Side Kick,Standing On Foam, One Leg Standing On Foam, BackKick with Band and Side Kick With Band Band.
After two weeks, both the groups were evaluatedagain using SEBT.
DATA ANALYSIS AND RESULT
Data analysis was done by using SPSS software.
Paired T-test was used within the group and p valuewas found to be less than 0.05 in both the groups. Therewas significant difference within the groups as seen inTable 1 & 2.
Independent sample T- test was used between thegroups where p value was found to be more than 0.05.There was no statistical significant difference betweenthe groups as seen in table 3.
41. Rabindra--218-222.pmd 2/7/2013, 8:08 PM219

220 Indian Journal of Physiotherapy & Occupational Therapy. January-March 2013, Vol. 7, No. 1
Table 1 Mean and Pre-Post analysis of Group A
Mean Sig.
Pair 1 RtANTpreA 58.9333 .000
RtANTpostA 80.8667
Pair 2 RtALpreA 60.2667 .000
RtALpostA 80.0667
Pair 3 RtLATpreA 61.5333 .000
RtLATpostA 77.5333
Pair 4 RtPLpreA 60.3333 .000
RtPLpostA 75.8667
Pair 5 RtPOSTpreA 54.2667 .000
RtPOSTpostA 70.7333
Pair 6 RtPMpreA 49.0000 .000
RtPMpostA 70.0667
Pair 7 RtMEDpreA 48.2000 .000
RtMEDpostA 66.8667
Pair 8 RtAMpreA 55.6000 .000
RtAMpostA 74.8000
Pair 9 LtANTpreA 58.5333 .000
LtANTpostA 85.0000
Pair 10 LtALpreA 55.8000 .000
LtALpostA 75.2000
Pair 11 LtLATpreA 47.6000 .000
LtLATpostA 65.6000
Pair 12 LtPLpreA 50.6000 .000
LtPLpostA 70.8000
Pair 13 LtPOSTpreA 52.9333 .000
LtPOSTpostA 71.5333
Pair 14 LtPMpreA 58.6000 .001
LtPMpostA 73.6000
Pair 15 LtMEDpreA 60.8000 .000
LtMEDpostA 76.7333
Pair 16 LtAMpreA 61.6000 .000
LtAMpostA 78.8667
Table 2 Mean and Pre-Post analysis of Group B
Mean Sig.
Pair 1 RtANTpreB 56.0000 .000
RtANTpostB 73.7333
Pair 2 RtALpreB 54.4000 .000
RtALpostB 74.1333
Pair 3 RtLATpreB 53.8000 .001
RtLATpostB 69.8667
Pair 4 RtPLpreB 51.2667 .001
RtPLpostB 66.0667
Pair 5 RtPOSTpreB 49.3333 .000
RtPOSTpostB 64.6667
Pair 6 RtPMpreB 48.2000 .000
RtPMpostB 61.4667
Pair 7 RtMEDpreB 46.1333 .000
RtMEDpostB 58.0667
Pair 8 RtAMpreB 54.5333 .000
RtAMpostB 71.5333
Pair 9 LtANTpreB 57.0000 .000
LtANTpostB 71.6667
Pair 10 LtALpreB 52.1333 .000
LtALpostB 69.2000
Pair 11 LtLATpreB 47.6667 .000
LtLATpostB 64.0667
Pair 12 LtPLpreB 47.0667 .000
LtPLpostB 62.6667
Pair 13 LtPOSTpreB 52.4667 .000
LtPOSTpostB 64.4667
Pair 14 LtPMpreB 54.9333 .000
LtPMpostB 66.3333
Pair 15 LtMEDpreB 53.7333 .003
LtMEDpostB 67.2000
Pair 16 LtAMpreB 53.2667 .005
LtAMpostB 71.6000
41. Rabindra--218-222.pmd 2/7/2013, 8:08 PM220

Indian Journal of Physiotherapy & Occupational Therapy. January-March 2013, Vol. 7, No. 1 221
Table 3 Independent T-Test between the Groups
Sig.(2-tailed)
RtANTpre .482
RtANTpost .105
RtALpre .188
RtALpost .215
RtLATpre .082
RtLATpost .133
RtPLpre .034
RtPLpost .033
RtPOSTpre .132
RtPOSTpost .157
RtPMpre .818
RtPMpost .075
RtMEDpre .632
RtMEDpost .086
RtAMpre .767
RtAMpost .555
LtANTpre .733
LtANTpost .008
LtALpre .443
LtALpost .204
LtLATpre .988
LtLATpost .745
LtPLpre .460
LtPLpost .052
LtPOSTpre .892
LtPOSTpost .092
LtPMpre .458
LtPMpost .069
LtMEDpre .108
LtMEDpost .103
LtAMpre .048
LtAMpost .151
DISCUSSION
This study was an attempt to find out the effect ofcore stabilization and balance training on dynamicbalance. In our study we found significant differencewithin the group and we did not find any significancebetween the groups. This is in agreement with the studydone by Kimberly et al. in 2005. They also specified intheir study that, although the results of study betweengroups were not significant, enhancement of dynamicbalance may result if the core stabilization trainingprogram is applied in the clinical settin.4
Core stability improves static and dynamic balanceand could be beneficial for improving balance bystrengthening those muscles most often associated withlumbar spine control.
By just training the core, overall dynamic stabilitycan be positively affected with strong magnitude ofchange. There is also evidence that a 4 week interventionmight be enough to cause a significant training effect,with a strong magnitude of change in core globalmuscular endurance.6
When the transverse abdominus contracts, the intra-abdominal pressure increases and tenses thethoracolumbar fascia. These contractions occur beforeinitiation of limb movement allowing the limbs to havea stable base for motion and muscle activation. Therectus abdominus and oblique abdominals areactivated in specific patterns with respect to limbmovement that also provide postural support.9
Piegaro et al in 2003 stated in their study that thereis a trend towards improving dynamic balance withcore stability exercises and balance training exercises.8
Zech A, et al in 2010 concluded that Balance trainingis effective at improving static postural sway anddynamic balance in both athletes and non-athletes. Butbalance training exercises should be given for longerduration for finding it to be effective.21
Limitation of the study: Sample size was small andstudy was done in a shorter duration.
Future research: In future, combined effect of corestability and balance training exercises on dynamicbalance can be done. Study can be done on geriatricpopulation. Bio feedback can also be incorporated inthe study. Study can be done for longer duration.
CONCLUSION
Our study concluded that there was no statisticalsignificant difference between core stabilization andbalance training program.
REFERENCES
1. Kahle N. The Effects of Core Stability Training onBalance Testing in Young, Healthy Adults.2009.Available at [http://etd.ohiolink.edu]
2. Yaggie, JA, and Campbell BM. Effects of balancetraining on selected skills. J. Strength Cond. Res.2006;20(2):422-428.
3. Akuthota V, Ferreiro A, Moore T, and FredericsonM. Core stability exercise principles. Curr. SportsMed.Rep., 2008;7(1)39-44.
4. Samson KM, BS, ATC, PES. The Effects of a Five-Week Core Stabilization-Training Program on
41. Rabindra--218-222.pmd 2/7/2013, 8:08 PM221

222 Indian Journal of Physiotherapy & Occupational Therapy. January-March 2013, Vol. 7, No. 1
Dynamic Balance in Tennis Athletes.2005Available at [http://wvuscholar.wvu.edu.]
5. Akuthota V, Nadler SF. Core strengthening. ArchPhys Med Rehabil 2004;85(3 Suppl 1):S86-92.
6. McCaskey A,The Effects of Core Stability Trainingon Star Excursion Balance Test and Global CoreMuscular Endurance,2011 Available at [http://etd.ohiolink.edu]
7. Bashiri J, Hadi H, Razavi SD, Bashiri M. Effect ofResistance-Balance training on dynamic balancein active elderly males. Annals of BiologicalResearch, 2011; 2(5):689-695.
8. Piegaro AB, JR., BS, ATC. The comparative effectsof four-week core stabilization & balance-trainingprograms on semi dynamic & dynamic
balance,2003 Available at [http://www.portalsaudebrasil.com]
9. Robinson R, Gribble P. Support for a reduction inthe number of trials needed for the Star ExcursionBalance Test. Arch Phys Med Rehabil. 2008;89(2):364-370.
10. Hessari FF, Norasteh AA, Daneshmandi H,Ortakand SM. The effect of 8 weeks corestabilization training program on balance in deafstudents. Medicina Sportiva, 2011;15 (2): 56-61.
11. Zech A. Balance training for neuromuscularcontrol and performance enhancement: asystematic review. J Athl Train, 2010 Jul-Aug:45(4):392-403.
41. Rabindra--218-222.pmd 2/7/2013, 8:08 PM222

Indian Journal of Physiotherapy & Occupational Therapy. January-March 2013, Vol. 7, No. 1 223
A Retrospective Analysis of Disability-Related Data onDisabled Children and their Families in Turkey
Rasmi MuammerAssistant Professor, Yeditepe University, Faculty of Health Sciences, Department of Physiotherapy and Rehabilitation
TR-34755, Istanbul, Turkey
ABSTRACT
Purpose: The aim of this study was to investigate and analysis the data and records of disabledchildren and their families.
Materials and Methods: Records and data of 116 patients with different neurological conditions seenat the Physiotherapy Department at a special education centre between August 2004 and August 2008were investigated. Obtained data and records included: age, gender, mode of delivery, diseasesdistribution , types of cerebral palsy and related factors, education level and job status of the parents,intermarriage, therapy interest rate.
Results: The most prevelant mode of delivery was as a vaginal delivery in 68 (59%) cases while acaesarean section seen in 47 (41%) cases in addition to one adoption case with unknown delivery type.29 (25%) of this deliveries were as a premature while 2 (2%) deliveries were as late deliveries. Cerebralpalsy was the most prevalent (61%) cause of physiotherapy attendance. The spastic type also representedthe most type of cerebral palsies with prevelant of 57%. The most prevelant parents educational levelincluded the primary school (mothers-fathers, 56%-47%). There was also intermarriage betweeen 33pairs with cousin relation in 28 pairs and 5 pairs with distant relation. Most of the mothers werehousewifes (%97) and attendance to therapy realized by 91% of the mothers.
Conclusion: Many factors are related to physiotherapy attendance of the paediatric neurologicalconditions. Parents low educational level, intermarriage, high percentage of house- wifes, free- workerposition of fathers and high percentage of mothers who attend to children care may reflect socio-economic level of this population.
Keywords: Cerebral Palsy; Parents
INTRODUCTION
A wide spectrum of motor impairments affectfunction in children and adolescents which may becongenital and acquired conditions such as cerebralpalsy, traumatic brain injury, myelomeningocele, spinalcord injury, Down Syndrome, and neuromusculardisease. Many of these disorders result from dysgenesisor injury to developing motor pathways in the cortex,basal ganglia, thalamus, cerebellum, brainstem, centralwhite matter, or spinal cord. These conditions areassociated with motor impairments including muscleweakness, abnormal muscle tone, decreased joint rangeof motion, and decreased balance and coordination.There are variations in severity within each of theseconditions. Many children with impairmentsattributable to these conditions will have some degreeof disability that may limit their normal developmentand functions and should benefit from physical,
occupational, and/or speech-language therapyservices.1,2 The amount of the physiotherapy may beintensive or routine amounts with long or short termtherapy3 and a specific and measurable goals of thetherapy are essenetial for evaluation of improvementin motor function.4,5 Also the goal of treatment ofchildren with motor disorders mirrors the managementof other forms of chronic disease and disability2.Establishing such goals are related to many factors andto each condition of the wide spectrum of the diseaes inwhich cerebral palsy is the most frequent diagnosis ofchildren who receive physiotherapy.6 However havinga sufficient knowledge about rare cases related topediatric physiotherapy has a key role of setting theobjective goals.
MATERIALS AND METHOD
This retrospective study was conducted at a special
42. Rasmi Turkey-223-227.pmd 2/7/2013, 8:08 PM223

224 Indian Journal of Physiotherapy & Occupational Therapy. January-March 2013, Vol. 7, No. 1
education centre, Istanbul, Turkey. The centre providesphysiotherapeutic services as well as a specialeducation according to the patients needs who werereffered from guidance and research centers with adiagnosis from an official institution. Records and dataof 116 infant, children and young with differentneurological conditions seen at the physiotherapydepartment between August 2004 and August 2008were investigated. Obtained data and records included:age, gender, mode of delivery, diseases distribution ,types of cerebral palsy and related factors, educationlevel and job status of the parents, intermarriage,therapy interest rate. Physical therapy a patient receivedwas based on the evaluation of the physical therapistand the severity of the problems including classicphysiotherapy in addition to neurodevelopmentaltherapy. Data were analyzed using descriptive statisticsof mean and standard deviation. Range andpercentages, and the frequency distributions of thevarious data were calculated and presented in tablesand figures.
RESULTS
One hundred and sixteen paediatric patients weremanaged at the physiotherapy department of a specialeducation centre between August 2004 and August2008. 44% of the cases were females while the malesrepresented 56% with mean age of 22.35±29.95 monthsfor females and and 24.35±33.56 months for males atthe entry. The most prevelant mode of delivery was as avaginal delivery in 68 (59%) cases while a caesareansection seen in 47 (41%) cases in addition to one caseadoption with unknown delivery type. 29 (25%) of thesedeliveries were as a premature while 2 (2%) deliverieswere as late deliveries (Table 1a,1b).
Table 1a: Mode of Delivery
Mode of Delivery N %
Vaginal Delivery 68 59%
Caesarean Section 47 41%
Unknown(Adoption) 1 < 1%
Table 1b: Mode of Delivery
Premature 29 25%
Late Delivery 2 2%
Diseases distribution is presented in Table 2.Cerebral palsy was the most prevalent (61%) cause ofphysiotherapy attendance, Down Syndrome prevalent12%, spina bifida 16%, myopathies 10%, whilePoliomyelitis comprised the least frequent (1%).
Table 2: Diseases distribution (CP: Cerebral Palsy, DS:Down Syndrome, SB: Spina Bifid, Myopathy:
Myopathy, Polio: Poliomyelitis
Diseases N %
CP 71 61%
DS 14 12%
SB 18 16%
Myopathy 12 10%
Polio 1 1%
The spastic type also represent the most type ofcerebral palsies with prevelant of 57%, hypotonic typeprevalent 21%, mixed type 7%, athethoid type 6%,ataxic type 6% and unknown 3% (Table 3).
Table 3: Types of Cerebral Palsies
Type N %
Spastic 41 57%
Hypotonic 15 21%
Mixed 5 7%
Athethoid 4 6%
Ataxic 4 6%
Unknown 2 3%
Result of factors related to cerebral palsy showedthat the widespread prenatal, perinatal and postnatalfactors as causes of cerebral palsy showed a rate of 41%were seen in 29 cases, Kernicterus (6%) was seen in 4cases, Rett Syndrome (1%) was seen in 1 case, MappleSyrup Urine disease (3%) was seen in 2 cases,Cytomegalovirus infection (3%) was seen in 2 cases,Pelizaeus-Merzbacher (1%) was seen in 1 case, trauma(6%) was seen in 4 cases, West syndrome (8%) was seenin 6 cases and others related to genetic factors,chromosome anomalies or unknown factors (31%) seenin 22 cases (Table 4).
Table 4: Result of factors related to cerebral palsy
N %
Pre, peri, post natal Factors 29 41%
Kernicterus 4 6%
Rett Syndrome 1 1%
Mapple Syrup Urine disease 2 3%
Cytomegalovirus Infection 2 3%
Pelizaeus-Merzbacher 1 1%
Trauma 4 6%
West syndrome 6 8%
Others 22 31%
The parents educational level is seen in (Figure 1)and the most prevelant included the primary school.
42. Rasmi Turkey-223-227.pmd 2/7/2013, 8:08 PM224

Indian Journal of Physiotherapy & Occupational Therapy. January-March 2013, Vol. 7, No. 1 225
Figure 1: The figure shows the parents educationallevel and the most prevelant included the primaryschool for both mothers (56%) and fathers (47%). Theother levels respectively are: None-education (4%, 3%),Secondary School (22%,22%), High School (13%, 24%)and Collage (5%, 4%).
Figure 3: Most of the fathers were workers (%94), therate of the state officers is 3% and fathers of none-job is3%.
There was also intermarriage betweeen 33 (28%)pairs with cousin relation in 28 pairs and 5 pairs withdistant relation (Table 5).
Table 5: Intermarriage betweeen pairs
N %
Non- intermarriage 83 72%
intermarriage 33 28%(28 pairs cousin, (85% cousin,5 pairs distant 15% distant
relation) relation)
Most of the mothers were house wifes (%97), whilemost of the fathers were workers (%94) (Figure 2, 3).
Figure 2: Most of the mothers were house wifes(97%), the rate of the state officers is 2% and mothers offree job is 1%.
Attendance to therapy realized by 105 (91%)mothers, 7 fathers (6%) and 4 others (3%) (Figure 4).
Figure 4: Attendance to therapy realized by 105(91%) mothers, 7 fathers (6%) and 4 others (3%).
DISCUSSION
Paediatric Neurological diseases affect the mentalmotor development of the patients resulting in variousimpairments of the ability to co-ordinate muscle actionto maintain normal posture and movement.7 Muscleweakness, abnormal muscle tone, restricted joint range,and decreased balance and coordination are associatedwith motor impairments. Cerebral palsy, Downsyndrome and central nervous system infections aresome of the pediatric neurological condition. Cerebralpalsy is the most common condition responsible forphysiotherapy attendance8 and affects as estimated
42. Rasmi Turkey-223-227.pmd 2/7/2013, 8:08 PM225
226 Indian Journal of Physiotherapy & Occupational Therapy. January-March 2013, Vol. 7, No. 1
500,000 Americans.9 Furthermore spastic type wasfound to be the most common type.8,10 In this study wefound that cerebral palsy was the most prevalent causeof physiotherapy attendance. The spastic type alsorepresents the most type of cerebral palsies. Thesefindings correlated with findings in the literature.
Brain damage causing cerebral palsy may developduring the prenatal, perinatal or postnatal periods.Prenatal factors have a significant role in the cases.Prenatal factors lead to premature birth and/orintrauterine retardation of the infant.11 This researchshowed that 29 (25%) of these deliveries were as apremature while 2 (2%) deliveries were as late deliveries.It is also found that factors related to central nervoussystem infection, metabolic, storage disorders,congenital, developmental disorders, hereditary,familial genetic and chromosome anomalies disordersincluded a several conditions with different rates thatcaused brain damage and retardation such asKernicterus, Rett Syndrome, Mapple Syrup Urinedisease, Cytomegalovirus infection, and Pelizaeus-Merzbacher. Trauma, West syndrome and othersunknown factors was recorded. In addition to theprevious factrors of course the widespread prenatal,perinatal and postnatal factors such as pregnancy rsikfactors, delivery risk factors, asphyxia, infections andinjuries are common causes.12
Down Syndrome, spina bifida, and miopathiesaccounted for 12%, 16%,10% respectively of casesreviewed. Although these children experience posturaland movement abnormalities which benefit fromphysiotherapy and rehabilitation13,14,15, the lowprevalence seen in this study may be due however tothe low prevalence of the condition in generalpopulation.8.Poliomiyalitis has the least percentagebetween the conditions which reflects its terminationin the public.
The negative impact of socioeconomic deprivationhas been shown for many aspects of child
mortality and morbidity but the relation betweensocioeconomic status and the risk of cerebral palsy isnot clear. Low birth weight and prematurity are thestrongest risk factors for cerebral palsy. Given theobserved association between these factors andsocioeconomic status, an increased prevalence ofcerebral palsy with low socioeconomic status isexpected. A strong association was observed betweensocioeconomic status and the risk of cerebral palsy.16
Other factors in child disability include poverty, lack ofexercise, bad housing and poor diet are being
important.17 Marrying within family; genetic risksincrease the chance of children being born withdisabilities.
Parents low educational level, intermarriagebetweeen the family, high percentage of housewifes,free- worker position of fathers and high percentage ofmothers who attends to children care may reflect a lowsocioeconomic level.
ACKNOWLEDGEMENT
The auther appreciate the cooperation of Prof. Dr.Ertuðrul KILIÇ at Yeditepe University-Ýstanbul, andM.Yýldýrým Special Education centre and allphysiotherapists at department of physiotherapy,Ýstanbul, Turkey.
REFERENCES
1. Michaud LD Prescribing Therapy Services forChildren with Motor Disabilities, Pediatrics 2004;113 (6): 1836-1838.
2. Sanger T D, Delgado M R, Spira D G , Hallett M,Mink J W Classification and Definition ofDisorders Causing Hypertonia in Childhood,Pediatrics 2003; 111 (1): 89-97.
3. Bower E, Michell D, Burnett M, Campbell MJ,McLellan DL Randomized Controlled Trial ofPhysiotherapy in 56 Children with Cerebral PalsyFollowed for 18 Months, Dev Med Child Neurol2001;43 (1): 4–15.
4. Kolobe H A, Palisano R J, Stratford PWComparison of Two Outcome Measures for InfantsWith Cerebral Palsy and Infants with MotorDelays, Physical Therapy 1998; 78 (10): 1062-1072.
5. Bower E, McLellan DL, Arney J, Campbell MJ Arandomised Controlled Trial of Different Intensitiesof Physiotherapy and Different Goal-SettingProcedures in 44 Children with Cerebral palsy,Dev Med Child Neurol 1996; 38 (3): 226–237.
6. Hayes M S, Mc Ewen I R, Lovett D Next step: Surveyof Pediatric Physical Therapists EducationalNeeds and Perceptions of Motor Control, MotorDevelopment and Motor Learning as They Relateto Services for Children with DevelopmentalDisabilities, Pediatric Physical Therapy 1999;11(4): 164 – 182.
7. Hurand J, Cochrane R Academic Performance ofChildren with Cerebral Palsy: A Comarative Studyof Conductive Education and British SpecialEducation Programmes, The British Journal ofDevelopmental Disabilities 1995; 41 (80): 33-41.
42. Rasmi Turkey-223-227.pmd 2/7/2013, 8:08 PM226

Indian Journal of Physiotherapy & Occupational Therapy. January-March 2013, Vol. 7, No. 1 227
8. Peters G.O., Adetola A.,Fatudimu M.B Review ofPaediatric Neurological Conditions Seen in thePhysiotherapy Department of a Children’sHospital in Ibadan, Nigeria, African Journal ofBiomedical Research 2008; 11 (3): 281 – 284.
9. Nelson K B, Grether J K Causes of Cerebral palsy,Current Opinion in Pediatrics 1999; 11 (6):487-491.
10. Kerem M M, LivanelÝoðlu A, Aysun S Importanceof Eearly Diagnosis and Rehabilitation of CerebralPalsy, Turkiye Klinikleri J Pediatr 2000; 9 (1): 23-7.
11. EL Ö, Peker Ö, Bozan Ö, Berk H, Koþay C GeneralFeatures of Cerebral Palsied Patients, DEÜ TýpFakültesi Dergisi 2007; 21 (2): 75 – 80.
12. Reddihough D S, Collins K J The epidemiologyand causes of cerebral palsy, Australian Journalof Physiotherapy 2003; 49 (1): 7-12.
13. Boureau F, Eymard B., Laforet P, Cottrel F Clinical
Study of Chronic Pain in Hereditary Myopathies,Eur J Pain 2004; 8 (1): 55-61.
14. McDonnell G V, McCann J P Issues of MedicalManagement in Adults with Spina bifida, Child’sNerv Syst 2000 16 (4): 222–227.
15. Lauteglager PEM, Vermeer A, Helders PSMDisturbances in the Motor Behavior of Childrenwith Down’s syndrome: The Need for a TheoreticalFramework, Physiotherapy 1998; 84 (1): 5-13.
16. Sundrum R, Logan S, Wallace A, Spencer NCerebral palsy and socioeconomic status: aretrospective cohort study, Arch Dis Child 2005;90 (1):15–18 doi:10.1136/adc.2002.018937
17. Gyan S, Peter C, Subesinghe D, Wild J, Levene M IPrevalence and Type of Cerebral Palsy in a BritishEthnic Community: The Sole of Consanguinity,Developmental Medicine & Child Neurology 1997;39 (4): 259-262.
42. Rasmi Turkey-223-227.pmd 2/7/2013, 8:08 PM227

228 Indian Journal of Physiotherapy & Occupational Therapy. January-March 2013, Vol. 7, No. 1
Effect of Postural Brace for Correcting Forward ShoulderPosture and Kyphosis in Patients with ChronicObstructive Pulmonary Disease: A Pilot Study
Ravi Savadatti1, Gajanan. S. Gaude2, Prashant Mukkannava3
1Principal, SDM College of Physiotherapy, Dharwad, 2HOD Respiratory Medicine, JNMedical College Belgaum, KLEUniversity, 3Assistant professor, SDM College of Physiotherapy, Dharwad
ABSTRACT
Objectives: 1.To evaluate the effect of postural brace in correcting forward shoulder posture and kyphosisin patients with chronic obstructive pulmonary disease.( COPD)
2. To evaluate the effect of postural correction on inspiratory muscle strength in COPD patients.
Design: A Pilot study comparing baseline values with post-test values.
Subjects: A total of 30 subjects between age group of 45-60 years of either gender, diagnosed to haveCOPD with forward shoulder posture and Kyphosis were studied.
Methods: Daily inspiratory muscle training(IMT) sessions of 30 minutes' duration and weekly trainingload increments of -2 to -4cmH2O over a 8-week period with the training device at loads of >30% ofbaseline maximal inspiratory pressure (PImax) was given. Posture was corrected by a brace and patientswere asked to wear it throughout the day for 8 weeks.
Outcome measures: Posture was assessed by Plumbline (PL), intra scapular distance(ISD) andpercentage of kyphotic index(KI). Inspiratory muscle strength was measured by deriving maximalinspiratory pressure (PIMax)
Results: All subjects tolerated the training load, improved their inspiratory muscle strength, and reportedcorrection of posture.
Conclusion: A combination of posture correction by a brace and inspiratory muscle training usingTIMT is beneficial in improving posture and the strength of inspiratory muscles of COPD patients.
Keywords: COPD, Posture, Kyphosis, Forward Shoulder Posture, Maximal Inspiratory Pressure
INTRODUCTION
There is decreased strength and endurance ofdiaphragm in COPD.1,2 The inspiratory muscles areplaced at a suboptimal length for generation of muscletension due to overinflation.3 Hence the diaphragm issusceptible to fatigue as a result of increased loadingand diminished “capacity” to produce inspiratoryforce.3,5,6 Inspiratory muscle strength and endurancehave been shown to be reduced in COPD.4,7 Patientsexperiencing dyspnea in COPD benefit from IMT, asstrong inspiratory muscles help decrease dyspnea.8
However the efficacy of IMT is controversial and its usein a clinical setting is limited in patients with COPD.Patients with COPD will attend forward head, roundedand elevated shoulders. Posture such as Kyphosis, and
forward shoulder posture (FSP) affects the respiratoryvalues in COPD.1,11 There is excessive thoracic flexionin kyphosis and thoracic supportive device such aspostural brace can be used to prevent excessive thoracicflexion, thus correcting posture.14 Taking intoconsideration, the beneficial effects of IMT on strengthof inspiratory muscles and the ill effects of bad posturein the form of dorsal Kyphosis and FSP on respiratoryvalues in COPD, It is legitimate to question whetheraddition of postural correction with IMT has anybeneficial effects in rehabilitation patients with COPD.Till date to our knowledge, none of the studies havereported weather IMT along with upper thoracicposture correction by a brace can have an additionaleffect on the strength of the inspiratory muscles inCOPD. Hence the aim of this study was to evaluate the
43. Ravi Savaddati--228-233.pmd 2/7/2013, 8:08 PM228

Indian Journal of Physiotherapy & Occupational Therapy. January-March 2013, Vol. 7, No. 1 229
effect of adding postural correction to IMT in patientswith COPD.
METHODOLOGY
Subjects: 30 subjects between age group of 45-60years of either gender, diagnosed to have COPD withFSP and Kyphosis, from Physiotherapy OPD of S.D.M.Hospital, were studied and taken as per their inclusionand exclusion criteria.
Inclusion and exclusion criteria: Inclusion criteria:Subjects having mild to moderate COPD (as per GOLDstandards)9with FSP and Kyphosis. Subjects wereexcluded if they had any respiratory conditions otherthen COPD, cardiovascular, neuromuscular, ororthopedic diseases. All the individuals with fixeddeformities of shoulder girdle and upper quadrant werealso excluded from the study.
Procedure: A routine method of evaluation andcollecting data on COPD with FSP and kyphosis wasdone. Outcome measures such as Plumb line (PL), ISD(inter scapular distance) was assessed to know FSP.Kyphotic index(KI) was derived to know the percentageof kyposis and maximal inspiratory pressure (PI Max)was measured to know the strength of the inspiratorymuscles. After briefing the subjects about the study, theirwritten consent was taken and ethical clearance wasobtained prior to the study. A plumb line was hung 3feet in front of a wall with the plumb bob approximatelya quarter inch off the floor anterior to the lateral mellolus.This point was considered as a reference point forassessing posture in lateral view. The subject’s were inbare feet, wearing clothing that allowed for visualobservation of body landmarks and standing betweenthe wall and the plumb line. Subjects were asked toexpose the external auditory meatus. The tip of theacromian process was marked with a skin marker. Thedistance from the tip of the shoulder (acromion processesand is termed as “landmark”) and the plumb line wasmeasured with a scale. For the purpose of analysis,FSP was graded as normal or mild that is considered tobe within normal limits(WNL) or grade 1 and wasmeasured from center of landmark in line with or up to1cm anterior to the plumb line, moderate deviations orgrade 2 was measured from posterior border oflandmark in line with or displaced up to 1 cm anteriorto the plumb line , and severe or grade 3 was measuredfrom posterior border of bony landmark displaced morethan 1 cm beyond the plumbline.13,15 For measuring ISDthe subject was made to stand in his or her relaxedposture with back exposed.The horizontal distance
between T3 spinous process and the vertebral border ofboth the scapulae was measured by an cloth inch tape.The distance was calculated in inches.15,16 Measurementof kyphotic index was done using a flex curve ruler of60 cms. Initially, the subjects were asked to expose theirspine and adopt their normal posture. C7 spinousprocess and posterior superior iliac spine(PSIS) levelwere marked.17 The flexicurve ruler was pressed againsttheir back with the top end placed against the C7spinous process in the midline. The ruler was moldedinto the shape of the subject’s spine in the midline tothe level of the PSIS. The flexicurve ruler was removedand the shape of the spine was then traced on a paperconsisting of the horizontal line.The cervical end of theflexi curve was placed on the line and the distal end ofthe ruler was made to coincide with the other end of thehorizontal line .The curvatures were then traced on thepaper. Thoracic height (H) and thoracic length (L) wasmeasured. The KI (%) was calculated as18
KI (%)= Thoracic height X 100
Thoracic length
The larger the KI, the more marked is the Kyphosis.
Inspiratory muscle strength was derived as PI Maxwhich was measured with a Magnehelic pressuregauge(No. 2000-200cm) at residual volume (RV) withthe highest pressure generated in five trials taken asPIMax. Initially the subject was made to sit and askedto exhale slowly and completely (to RV). Then he/shewas asked to seal the lips firmly around the mouthpiece(to prevent air leak), and then inhale forcefully throughthe mouthpiece (as if he/she is trying to “pull in hard,like you are trying to suck up a thick milkshake”). Thelargest negative pressure sustained for 1 second on thepressure gauge was recorded. The participant wasallowed to rest for about 1 minute, and then repeatedthe maneuver 5 times. The highest value recorded, wastaken for the study. The mechanical pressure gauge hasminor tick marks at 5cmH2O increments, so results wererounded to the nearest 5cmH2O
19,20
Intervention: Threshold inspiratory muscle trainingdevice (TIMT) was used to training the inspiratorymuscles. Subjects inhaled through the spring-loadedTIMT device that provides resistance to inspiratorymuscles. The pressure settings are adjustable in -2cmH2O increments (range, -7cmH2O to-41cmH2O).Thesubjects were asked to inspire hard enough throughthe mouth piece to open the valve in the device andpermit inspiration against that force. Nose clip wereused to occlude nasal air flows. The initial training load
43. Ravi Savaddati--228-233.pmd 2/7/2013, 8:08 PM229

230 Indian Journal of Physiotherapy & Occupational Therapy. January-March 2013, Vol. 7, No. 1
(resistance) was attempted at 30% of the patient’sbaseline PI Max. As the strength improved to the pointwhere subject were exercising for continuous of 30minutes, then the pressure load was increased by-2cmH2O. The advance in the pressure was up to, -40cm H2O. TIMT was given with an intensity of 30% ofPIMax for 30 min/ day for 8 weeks10
Posture was corrected with subject standing inupright posture and was asked to wear the brace (Visscoposture brace) that fitted best in upper thoracic regionfor a whole day (except while lying down) for 8 weeks.The outcome measures were measured at baseline(before intervention)and at the end of 8 weeks and 3months of intervention.
Data analysis: All analyses were done using SPSSVer-sion 16. Descriptive statistics are reported as meansand SD (standard deviation). A repeated measuresanalysis of variance for each individual outcomemeasure time was performed to determine if there wasany change in scores at three time periods. The repeatedmeasures of time were baseline, 8 weeks postintervention and 3 months post intervention. The datasphericity was tested using the Mauchly test. When thetest results were statistically significant, the data werecorrected using the Greenhouse-Geisser correction todetermine if significant differences existed betweenconditions. For significant main effects, pairwisecomparisons were performed between levels using ttests with a modified Bonferroni procedure. Significancewas set at p < 0.05.
To determine inter-rater reliability, the measurementsfrom all the outcome parameters obtained by rater 1and rater 2 at baseline, 8weeks and 3 months weresub-jected to statistical analysis using IntraclassCorrelation Coe-fficient type 3,1 (ICC3,1)
21. To determine
intra-rater reliability, the measurements from all theoutcome parameters obtained in the first evaluation ofrater 1 and in the second evaluation of the same rater atbaseline, 8weeks and 3 months were analyzed using(ICC1,1)
21. Utilizing data from SPSS, Standard Error ofMeasurement (SEM)22 as a measurement of the withinsubject re-test variation ( )23
were obtained.
Table 1: Discrpitive analysis and baselinecharacterstics:
Mean ± SD
n 30
Age in years 52.87 ± 5.04
Sex M/F 20 (67%)/10(33%)
ISD in inches 5.35 ± 0.71
Plumb line in grades 1.97 ± 0.76
Kyphotic index (%) 11.20 ±0.90
PI Max in cm H2O 60.33 ±12.79
For values ranged from 1.0 to 0.81, the reliabilitywas conside-red excellent; from 0.80 to 0.61, very good;from 0.60 to 0.41, good; from 0.40 to 0.21, reasonableand, finally, from 0.20 to 0.00, poor1
RESULTS
Descriptive statistics of all subjects is given in Table1.The means and standard deviations for all outcomemeasures at baseline, 8 weeks and 3 months are shownin Table 2. The Repeated measures ANOVA for the ISDscores revealed a significant difference((F1.03,30.01)=71.08,p<0.000) among three time periods. A post hocpair-wise t test showed means of ISD scores for allthree time periods(at baseline, 8 weeks post interventionand 3 months post intervention) were significantlydifferent from one another (Table 2).
Table 2 Descriptive statistics [mean & SD] for the outcome measures for forward shoulder posture, kyphosis andinspiratory muscle strength between three time periods
1 2 3
Outcome Baseline 8WeeksPost intervention 3 MonthsPost intervention p-value*
Measures Mean SD Mean SD Mean SD
ISD (Inches) 5.35 (0.71) 4.73 (0.54) 5.08 (0.61) 0.000 (1-2, 1-3,2-3)
PL Scores(Grade) 1.97 (0.76) 1.27 (0.64) 1.53 (0.63) 0.000 (1-2, 1-3)
0.090 (2-3)
KI Scores(%) 11.20 (0.90) 10.38 (1.11) 10.85 (0.98) 0.000 (1-2, 1-3,2-3)
PIMax Scores(Cm H2o) 60.33 (12.79) 90.67 (19.82) 81.17 (18.41) 0.000 (1-2, 1-3,2-3)
43. Ravi Savaddati--228-233.pmd 2/7/2013, 8:08 PM230

Indian Journal of Physiotherapy & Occupational Therapy. January-March 2013, Vol. 7, No. 1 231
*Repeated measures analysis of variance .Post-hoct tests with a modified Bonferroni procedure p < 0.05statistically significant.
ISD=Intrascapular Distance; PL= Plumbline;KI=Khyphotic index; PiMax=Maximal Inspiratorypressure
There was 11.5% significant reduction (p<.000) ofISD scores after 8 weeks post intervention. The Repeatedmeasures ANOVA for the PL scores revealed asignificant difference ((F 2,58)= 22.06,p<0.000) amongthree time periods. A post hoc test showed means of PLscores differed at all three time periods (Table2).Therewas a statistical significant reduction(p<.000)ofplumbline measurement after 8weeks of intervention
with improvement scores of 35.53%. The Repeatedmeasures ANOVA for the KI scores revealed asignificant difference ((F1.56,45.39)= 62.05,p<0.000) amongthree time periods. A post hoc pair-wise t test showedmeans of KI scores for all three time periods weresignificantly different from one another (Table 2).Kyphotic index scores reduced 7.3% significantly(p<0.000) following 8 weeks of post intervention. TheRepeated measures ANOVA for the PIMax scoresrevealed a significant difference ((F 1.21,35.22)=195.78,p<0.000) among three time periods. A post hocpair-wise t test showed means of PIMax scores for allthree time periods were significantly different from oneanother.
Table 3 Inter-Rater Reliability (ICC 3,1) for all OutcomeMeasures
Outcome Rater 1 Rater 2
Measures Mean SD Mean SD ICC 3,1 95%CI SEM
ISD (Inches) Baseline 5.34 0.71 5.48 0.69 0.946 (.873; .976) 0.16
8th week 4.73 0.54 4.72 0.49 0.942 (.878; .972) 0.12
3months 5.08 0.61 5.18 0.68 0.929 (.850; .966) 0.18
PL Scores Baseline 1.96 0.76 1.96 0.76 0.943 (.938; .986) 0.18
(Grades) 8th week 1.26 0.63 1.36 0.61 0.933 (.857; .968) 0.16
3months 1.53 0.62 1.63 0.66 0.937 (.867; .970) 0.17
KI Baseline 11.2 0.89 11.5 0.81 0.835 (.678; .966) 0.33
(%) 8th week 10.37 1.11 10.3 1.05 0.944 (.883; .973) 0.26
3months 10.85 0.97 10.77 0.96 0.993 (.981; .997) 0.09
PIMax Baseline 60.3 12.7 61.5 10.5 0.923 (.840; .963) 3.3
(Cm H2O) 8th week 90.66 19.8 88.16 18.21 0.927 (.847; .965) 5.38
3months 81.16 18.41 79.16 15.09 0.914 (.821; .959) 5.05
ISD=Intrascapular Distance; PL= Plumbline; KI=Khyphotic Index; PiMax=Maximal Inspiratory Pressure;SEM= Standard Errorof Measurement
(Table 2).The maximal inspiratory pressureincreased significantly by 50.29% following 8 weeks(p<0.000).The improvement was carried over till 3months of followup in all variables except for PLscores(table 2).Inter-rater and intra-rater reliabilityestimates of all outcome measures at baseline, 8weeksand 3 months are shown in Table 3 and Table 4respectively. Interrater ICC scores were Excellent,ranging from 0.83 to 0.94 for all measures with SEMranging from 0.09 to 5.38 (table 3).Similarly Intra rarterICC scores were Excellent, ranging from 0.956 to 0.999for all measures with SEM ranging from 0.02 to 1.84(table 4).
Discussion: COPD is the leading cause of morbidityand mortality worldwide.12 Patients with COPD tendto develop FSP and Kyphosis.1,11, 24 these posturaldeviations affect the respiratory values1. This studydemonstrates an 8-week intervention program with a 3
month follow up. Following intervention, both postureand inspiratory muscle strength improved in adultCOPD patients after 8 weeks and the improvement wasretained till 3 months of followup. Posture was correctedby a brace and correction of posture was associatedwith decrease in the intra scapular distance, kyphoticindex and plumb line. IMT was given by a TIMT deviceand improvement in the inspiratory muscle strengthwas associated with increase in the maximalinspiratory pressure. Previous report10 havedemonstrated the use of TIMT device for traininginspiratory muscles. IMT of 5 to 30 minutes’ for 6 weeksat loads of >30% of baseline PIMax improved patients’inspiratory muscle strength, similar effects were foundwith 8 weeks of intervention and 3 months of follow upin this study (table 2).Poor posture along with weakback muscles, causes inability to straighten the upperback, which in turn limits the ability to raise and expandthe chest and maximize the lung capacity.13
43. Ravi Savaddati--228-233.pmd 2/7/2013, 8:08 PM231

232 Indian Journal of Physiotherapy & Occupational Therapy. January-March 2013, Vol. 7, No. 1
Table 4 Intrarater Reliability (ICC 1,1) for all Outcome Measures
Outcome Rater1 (day1) Rater1 (day2)
Measures Mean SD Mean SD ICC 3,1 95%CI SEM
ISD (inches) Baseline 5.34 0.71 5.35 0.7 0.999 (.997; .999) 0.07
8th week 4.73 0.54 4.73 0.54 0.997 (.995; .999) 0.02
3months 5.08 0.61 5.11 0.61 0.998 (.996; .999) 0.02
PL Baseline 1.96 0.76 1.93 0.78 0.957 (.909; .979) 0.17
(grades) 8th week 1.26 0.63 1.26 0.63 0.956 (.907; .979) 0.13
3months 1.53 0.62 15.3 0.62 0.956 (.908; .979) 0.14
KI Baseline 11.2 0.89 11.2 0.89 0.999 (.997; .999) 0.08
(%) 8th week 10.37 1.11 10.38 1.1 0.999 (.998; 1.00) 0.11
3months 10.85 0.97 10.88 0.97 0.999 (.998; .999) 0.09
PiMax Baseline 60.3 12.7 60.5 12.6 0.999 (.997; .999) 1.27
(Cm H2O) 8th week 90.66 19.8 90.83 20.3 0.997 (.995; .999) 1.09
3months 81.16 18.41 81.5 18.38 0.999 (.997; .999) 1.84
ISD=Intrascapular Distance; PL= Plumbline; KI=Khyphotic Index; PiMax=Maximal Inspiratory Pressure;SEM= Standard Errorof Measurement
We assume that correction of posture with brace,would have aided in straightening the upper back andexpanding the chest, thus having an additionalbeneficial effect on inspiratory muscle force generatedby the inspiratory muscles. Hence postural correctionmight have influenced the increase in the PIMax valuesalong with inspiratory muscle training. In this studywe found a high inter rater(ICC 3,1)and intra rater (ICC1,1) reliability ( table 3,4) for all measurements toevaluate posture and strength of the inspiratorymuscles in COPD patients.
CONCLUSION
The results of this pilot study suggest that, TIMTdevice can be used to improve the strength of theinspiratory muscles. With addition of posturalcorrection by a brace, not only improved posture butalso aided in increasing the inspiratory muscle strength.Hence, posture correction needs to be given adequateimportance in pulmonary rehabilitation of patients withCOPD, however, despite the lack of a control group andthe small size of the sample studied, we suggest thatfurther study is warranted.
REFERENCE
1. Hillegass and Sadowsky. Essentials of cardiopulmonary physiotherapy, 2nd ed. WB Saunderscompany,2001.p. 742.
2. Verheul AJ, Dekhuizen PN.Diaphragmdysfunction in patients with COPD. Ned TijdschrGeneeskd.2003;147(18): 855-60.
3. Roussos CS, Macklem PT. The RespiratoryMuscles. N Engl J Med 1982;307:786-97.
4. Arora NS, Rochester DF. COPD and humandiaphragm muscle dimensions. Chest1987;91:719-24.
5. Rochester DF, Braun NMT, Arora NS. Respiratorymuscle strength in chronic obstructive pulmonarydisease. Am Rev Respir Dis 1979;199(suppl):151-154.
6. Bellemare F, Grassino A. Force reserve of thediaphragm in patients with chronic obstructivepulmonary disease.J Appl Physiol 1983;55:8-15.
7. Morrison NJ, Richardson J, Dunn L, Pardy R.Respiratory muscle performance in normal elderlysubjects and patients with COPD. Chest 1989; 95:90–91.
8. Hamilton AL, Killian KJ, Summers E, Jones NL.Muscle strength, symptom intensity, and exercisecapacity in patients with cardio respiratorydisorders. Am J Respir Crit Care Med1995;152:2021-31.
9. Global Initiative for Chronic Obstructive LungDisease. Global strategy for the diagnosis,management, and prevention of chronicobstructive pulmonary disease 2010. Available at(http://www.goldcopd.org/uploads/users/files/GOLDReport_April112011.pdf).October 19,2011.
10. Nield MA. Inspiratory muscle training protocolusing a pressure threshold device: effect ondyspnea in chronic obstructive pulmonarydisease. Arch Phys Med Rehabil. 1999;80:100-2.
43. Ravi Savaddati--228-233.pmd 2/7/2013, 8:08 PM232

Indian Journal of Physiotherapy & Occupational Therapy. January-March 2013, Vol. 7, No. 1 233
11. Kisner C, Colby LA. Therapeutic exercise:Foundations and techniques.3rded:Philadelphia:FADavisCo;1996.p.111-710
12. Gaude G S, Nadagouda S. Nebulizedcorticosteroids in the management of acuteexacerbation of COPD. Lung India.2010 oct-dec;27(4): 230-235.
13. Kendall FP, Kendall E, Provance PG, RodgersMM,RomaniWA. Muscles testing and functionwith posture and pain. 5th ed. Baltimore,MD:Lippincott Williams and Wilkins;2005.p.49-244.
14. Hall MC,BrodyTL. Therapeutic exercise. Movingtoward function. Philadelphia: LippincottWilliams &Wilkins. Publ;1999:.p.557-60
15. Peterson DE, Blankenship KR, Robb BJ, WalkerMJ, Bryan JM, Stetts DM, Mincey LM, Simmons G.Investigations of the validity and reliability of fourobjective techniques for measuring forwardshoulder posture. JOSPT.(25).1997.p.34-41.
16. Sobush DC, Simoneau GG, Dietz KE, Levene JA,Grossman RE, Smith WB. The Lennie test formeasuring scapular position in healthy youngadult females: A reliability and validity study.JOSPT.1996;23(1):39-50.
17. Ensurd KE, Black DM, Harris F, Ettinger B,CummingS SR, Colrelates of Kyphosis in olderwomen. The fracture intervention trial researchgroup.J Am Geriatri Soc,1997;45:682-87.
18. Bembalgi V. A cross sectional study of skeletaldeformities in post menopausal women in urbanand rural areas.Indian journal of physiotherapyand occupational therapy,2010 june; 4(2): 87-88.
19. Sachs CM, Enright LP ,Hinckley Stukovsky KD,Rui Jiang and R Graham B, for the Multhi-EthnicStudy of Atherosclerosis Lung Study. Performanceof Maximal Inspiratory Pressure Tests andMaximal Inspiratory Pressure ReferenceEquations For 4 Race/Ethnic Groups. RespiratoryCare 2009;54(10):1321-1328,
20. Wen AS, Woo MS, Keens TG. How manymaneuvers are required to measure maximalrespiratory pressure accurately? Chest 1997;111:802-807.
21. Weir JP. Quantifying test-retest reliability using theintraclass correlation coefficient and the SEM. JStrength Cond Res. 2005;19(1):231-40.
22. Peat JK, Mellis C, Williams K, Xuan W. Healthscience research: a handbook of quantativemethods. London: SAGE Publications; 2002.
23. Harvill L. Standard error of measurement. EducMeas. 1991;10:33-41.
24. O’Sullivan BS, Schmitz JT. Physical rehabilitationassessment and treatment. 4th ed. Philadelphia:FA Davis Company. publ; 2001:445-465.
43. Ravi Savaddati--228-233.pmd 2/7/2013, 8:08 PM233

234 Indian Journal of Physiotherapy & Occupational Therapy. January-March 2013, Vol. 7, No. 1
Effect of Neck Extensor Muscles Fatigue on PosturalControl Using Balance Master
Reshma S.Gurav1, Rajashree V.Naik2
1Lecturer, MGM College of Physiotherapy, Kamothe, Navi Mumbai, 2HOD and Professor, L.T.M.C. and Sion Hospital,Sion, Mumbai
ABSTRACT
Background: Poor postural performance is observed in patients suffering from neck pain and followingWhiplash injuries. Fatigued muscles following the neck pathology are unable to transmit somatosensoryinformation to the central nervous system, and hence upright postural control may be compromised.Hence there is need to investigate neck muscles fatigue and balance.
Objectives: 1.To assess the dynamic endurance of neck extensors till fatigue sets in.
2. To study the postural control pre and post fatigue in neck extensors.
Methods: 50 healthy students participated in the study. Balance assessment was done on balancemaster with modified clinical test of sensory interaction and balance. Fatigue was induced in neckextensor muscles using pressure biofeedback apparatus in supine position. The posturographic dataof sway velocity was obtained pre and post fatigue & analyzed with paired't' test.
Results: Postural sway velocities in mCTSIB test showed significant difference after inducing fatigue inneck extensors (mean 0.14+0.22, P<0.001)
Conclusion: It is speculated that from the fatigued neck muscles, altered sensory input leading toabnormal central processing may compromise balance, thereby reflecting a notable change in posturalsway.
Keywords: Fatigues, Postural Control, Sway Velocity.
INTRODUCTION
Balance, both literally and figuratively, is one of themost important concepts and functions in life.Historically balance has not been considered a criticalfactor in rehabilitation of orthopedic patients or perhapsthe impact of these deficits on high-level functionaloutcomes had not been sufficiently documented. Yetbalance deficits in orthopedic patients exist are oftenpersistent, impede the return of normal function andincrease the risk of re-injury.1
The crucial role of the sensory systems and the brainin producing skilled, co-ordinated movement isrecognized by orthopedic physical therapist asevidenced by closed chain testing and training.1, 2
Neuromuscular re-education is necessary forefficient co-ordinated movement, which in turn isnecessary for skilled function on the job or on the playingfield.1,2,3
Balance a highly integrative process involvingmultiple afferent pathways, depends on somatosensory,
visual and vestibular inputs for the reception of intrinsic(body) and extrinsic (environment) information.
The brain for the integration of this information andthe formation of a motor plan and musculoskeletalsystem for the production of adequate movements toexecute the plan. Problems in any of these areas canlead to the imbalance. The known presence ofproprioceptive deficits and musculoskeletalimpairments in orthopedic patients should arouse thesuspicion that balance problem may exist in thesepatients and research confirms these suspicions.1,2,3,4
Poor postural performance is observed in patientssuffering from neck pain and following whiplash injuryin which there is hyperextension injury and too muchrotation at the cervical spine.Especially those who havehad injuries or disruption of joint surface in theperipheral joints or spine such as whiplash injuries tothe neck. The small intrinsic, deep dorsal andsuboccipital cervical muscles show a high density ofmuscle spindles that are likely to provide a maincontribution to neck proprioception.
44. RESHMA--234-237.pmd 2/7/2013, 8:08 PM234

Indian Journal of Physiotherapy & Occupational Therapy. January-March 2013, Vol. 7, No. 1 235
If fatigued muscles are unable to transmitsomatosensory information to the CNS, then uprightpostural control may be compromised. Therefore thereis need to use a specific testing method to determine thecorrelation between the neck extensors fatigue andbalance1, 5
In the erect standing posture, the body undergoes aconstant swaying motion called ‘postural sway’ or‘sway envelope’. Physiological postural sway is definedas the continuous corrective movements around thecenter of gravity of a body designed to maintain posturalcontrol in the upright position while stand still.6, 7
Shumway- cook and Horak in 1986 suggested amethod for clinically assessing the influence of sensoryinteraction on postural stability in the standingposition. The purpose of the test is to identifyabnormalities in the three sensory system contributingto postural control- somatosensory, visual andvestibular.
In mCTSIB (Modified Clinical Test of SensoryInteraction of Balance) the level of challenge is increasedby altering the support surface from the firm levelforceplate to a complaint foam pad.
Mean COG sway velocity assessed under fourconditions: - In all conditions, low sway scores are goodand high sway scores are worse.8
Eyes open, firm surface.
Eyes closed, firm surface.
Eyes open, foam surface.
Eyes closed, foam surface.
It was hypothesized that the balance would besignificantly changed when the fatigue sets in neckextensors muscles.
AIMS AND OBJECTIVES
AIM
To study the effect of neck extensor muscles fatigueon postural control using balance master.
OBJECTIVES
• To assess the dynamic endurance of neck extensormuscles till fatigue sets in.
• To study the postural control on stable and unstablesurfaces pre and post fatigue in neck extensormuscles.
MATERIAL AND METHODOLOGY
Study Design: -Experimental within subject design.
Selection Criteria -The study was carried out onsubjects selected from physiotherapy department, K.E.MHospital. The study was approved by the ethicalcommittee, Seth G. S. Medical College and K.E.MHospital and subjects gave informed consent to thework.
50 Normal healthy students volunteered for thestudy.
Subjects of either sex within the age group of 20-25years were included.
There were no dropouts during the course of study.
EXCLUSION CRITERIA
Any history of cervical spine trauma.
Neck pain or any type of musculoskeletal treatmenttaken for neck complaints in the past three months.
Any balance disorders.
Visual impairments not corrected by glasses.
H/o ankle sprains / knee ligament injuries.
STUDY MATERIAL
Pressure biofeedback apparatus.
Blood pressure apparatus (sphygmomanometer)and stethoscope.
Balance master and foam
Personal computer. Pentium 3, 128 MB, Neurocomsoftware
STUDY PROCEDURE
Balance Assessment
Balance master was connected to the personalcomputer for obtaining digital recording of posturalsway. The subject was asked to stand still on the forceplate as per the foot placement displayed on thecomputer screen.
The four test conditions of modified CTSIB (m CTSIB)test administered each test for 10 seconds duration.
44. RESHMA--234-237.pmd 2/7/2013, 8:08 PM235

236 Indian Journal of Physiotherapy & Occupational Therapy. January-March 2013, Vol. 7, No. 1
The four test conditions were always administeredin chronological order -
Eyes open, firm surface (FIRM-EO)
Eyes closed, firm surface (FIRM-EC)
Eyes open, foam surface (FOAM-EO)
Eyes closed, foam surface (FOAM –EC)
Posturographic data of sway velocity obtained foreach test.
Procedure for inducing fatigue in neck extensormuscles.
The subject assumed a supine position on the plinthwith head and neck placed in neutral position suchthat tragus of the ear and tip of the shoulder are in thesame horizontal plane. Layers of towels were placedunder the head to achieve the neutral position asneeded. The air bag of the stabilizer was folded intothree and placed behind the neck suboccipitally. Theairbag was inflated to 20 mmHg as baseline.
The subject was asked to perform the static neckextension over the inflated cuff. The maximal neck
extension contraction was noted on biofeedbackapparatus. 60% of maximal voluntary isometriccontraction was calculated and subject was asked torepeat that submaximal contraction as many times aspossible and no. of contractions were counted. Thebiofeedback was held such that the performer andsubject both can see the fluctuations on the pointer.When the subject was unable to exert the pressure atgiven sub maximal pressure values against the cuff heor she was allowed to stop and made to stand.
The blood pressure was measured to rule out theeffect of postural hypotension on balance. Again thesubject was taken on the balance master andposturographic data obtained as earlier. The collectedposturographic data was analyzed statistically withpaired ‘t’ test.
Results and Graphical Representation
Every condition of test and composite of allconditions of the test were analyzed with‘t’ test in whichpre and post posturographic recordings werecompared.
TABLE -1 - Comparison of Postural sway velocities in four test conditions of mCTSIB pre and post neck extensorsfatigue
Sway Velocity Firm Firm Foam Foam Composite(in degrees/sec) EO EC EO EC
PRE Mean 0.23 0.27 0.60 1.50 0.61
POST Mean 0.32 0.34 0.68 1.56 0.73
DIFFERENCE Mean 0.11* 0.07* 0.08* 0.06* 0.12*
P Value P<0.001 P<0.1 P<0.01 P<0.05 P<0.001
*statistically significant
Observation – Postural sway velocities before andafter neck extensors fatigue were compared using thepaired‘t’ test. There was significant difference betweenthe Postural sway velocities demonstrated by subjects.In eyes open on firm surface the difference was highlysignificant (p value <0.001) whereas even though thepostural sway velocities were high in eyes closed onfoam surface the difference was significant. (p value<0.05). The difference between the postural swayvelocities in composite of all test conditions was highlysignificant at p value <0.001.
DISCUSSION
As observed in this study, there was maximumincreased postural sway in Eyes open, firm surface testcondition, in spite of all the three sensory inputs were
available, which can be explained as because of neckmuscles fatigue, the proprioceptors could not providethe accurate somatosensory inputs to the CNS, requiredfor maintaining postural control and hence there wasincrease in postural sway. It can also be said that asthis test was done immediately after the fatigue wasinduced hence the postural sway was maximum in thisparticular test condition as seen in graph 2.
In Eyes closed on firm surface, when the visualinformation was unavailable, the postural sway wasincreased and the difference between pre and post swayvelocity was statistically significant as in this conditionsubjects relied more on somatosensory and vestibularinputs.
In test conditions on foam surface, there wasadditional challenge to musculoskeletal systems
44. RESHMA--234-237.pmd 2/7/2013, 8:08 PM236

Indian Journal of Physiotherapy & Occupational Therapy. January-March 2013, Vol. 7, No. 1 237
because of inaccurate somatosensory information. Asshown in table 3, the postural sway velocity wasincreased definitely and the difference pre and postfatigue was statistically significant.
So it can be inferred that mechanoreceptors ofthe synovial facet joints and surrounding soft tissuesof the cervical spine if affected by a spinal injury suchas whiplash injury or chronic neck pain due to cervicalspondylosis can alter postural control. Stampley et al(2006) in their study, ‘Neck muscles fatigue and posturalcontrol in patients with whiplash injury’ showed thatpatients with whiplash injury show identifiableincrease in neck muscle fatigability and associatedincrease in postural sway after contractions of dorsalneck muscles and physiotherapy treatment reducesthese effects9.
CONCLUSION
The submaximal isometric contraction of the neckextensor muscles for maximal no. of repetitionsproduced changes in displacement of center of gravityand velocity of postural sway in young healthy subjects.Therefore this study accepts the hypothesis that theneck extensor muscles fatigue significantly affects thebalance, which was confirmed by mCTSIB test.Abnormal central processing of sensory input maycompromise balance in the setting of posturalperturbations to a greater degree in patients with neckmuscles weakness as in case of chronic neck patientsand whiplash injuries.
Ultimately, this may help us in developing objectiveevaluation procedure and the priority treatment goalfor subjects suffering from neck complaints, thus takingcare of all aspects of functional rehabilitation of thepatients with neck complaints.
ACKNOWLEDGEMENT
This is to acknowledge the help and supportextended to me by Head of the Physiotherapy
Department, my Guide, the Bio statistician, theDepartmental Staff and to all my subjects. I wish toexpress my heartfelt gratitude to Mr. Vivek Nadkarniand Mrs. Tanuja Nadkarni and whole team ofNeurocom international Ltd. I thank them for providingme balance master equipment and their valuableguidance and technical expertise in analyzing data.Their special interest and assistance has been guidingforce in every step during the preparation of my study.I thank Dr.Yesha Pandya (PT) for technical help.
REFERENCES
1. Kauffman, Nashner Lewis. Balance is criticalparameter in orthopedic rehabilitation.Orthopadic Physical Therapy Clinics of NorthAmerica.New Technologies in Physical Therapy.March 1997;(6-1)
2. Lewis Nashner. The anatomic basis of balance inorthopedics. Orthopedic physical therapy clinicsof North America. March 2002;(11-1)
3. Blackburn TML, Voight , A matter of balance.Rehabilitation Therapies. June 2001.
4. Guyton C, Hall JE. Textbook of medical physiology.Chapter 49, 50, 51, 52, 55, 9th Edition
5. Mark Morningstar. Reflex control of the spine andposture, a review of literature from a chiropracticperspective. Chiropractic Osteopathy journal2005; (13-16).
6. Sharon Thomas. Functional Efficiency of thevestibular system in the performance of standingbalance Sept. 2004.
7. Shumway – Cook, Motor control: Theory ofpractical Application, 2nd edition, 1995.
8. Neurocom Internantional – The clinical test forthe sensory interaction of balance – Descriptionand definations.
9. Stapley D.J. Neck muscle fatigue & postural controlin patients which whiplash injury. ClinicalNeurophysiology March 2006, (117-3): 610-622.
44. RESHMA--234-237.pmd 2/7/2013, 8:08 PM237

238 Indian Journal of Physiotherapy & Occupational Therapy. January-March 2013, Vol. 7, No. 1
Aerobic Capacity in Regular Physical Exercise Group andIndian Classical Dancers: A Comparative Study
Rupali B. Gaikwad1, Vijay Kumar R. waghmare2, D.N. Shenvi3
1Assistant Professor, Dept. of Physiology, Govt. Medical College, Miraj Dist. Sangli, Maharashtra, 2Assistant Professor,Dept. of Anatomy, Govt. Medical College, Miraj Dist. Sangli, Maharashtra, 3Associate professor, Dept. of Physiology,
Seth.G.S.M.C. & K.E.M.H., Parel, Mumbai, Maharashtra
ABSTRACT
Introduction: Dance in its many forms has recently received much attention in medical literature andconsiderable promotion in the lay press. This has been in keeping with current awareness of physicalfitness, which has been the result of increasing evidence linking cardiovascular disease to physicalinactivity, lack of cardiopulmonary fitness and obesity.
One such program is aerobic or cardiovascular training program. Cardiovascular fitness is one of themost important health component required for performing more physical work with many healthbenefits. It is common notion that, only physical exercise provides fitness and is beneficial to health.Attempts have been made in the past to correlate other physical activities like ballet (western dance)with established physical exercise routines in gymnasium.1, 2. Indian classical dance is one of thephysical activities as it is performed regularly.
Material and Methods: The study group consists of 30 female subjects aged 17-30 yrs from each groupwho had received training in their respective physical exercise/ activity for a minimum duration of 6months. Aerobic power was determined by simple exercise step test (Queen's College step test). Gradingof aerobic capacity was done by using indirect estimation of VO2 Max.
Results: Comparison in the given study groups showed that; not only conventional aerobic exercisesbut also any physical activity (Indian classical dance) performed regularly improved cardiovascularendurance of an individual. This improvement in endurance was statistically proved.
Discussion: Comparison in the given study groups showed that; not only conventional aerobic exercisesbut also any physical activity (Indian classical dance) performed regularly improved cardiovascularendurance of an individual. This improvement in endurance was statistically proved.
Conclusion: The mean value of the vo2 max in ml/kg/min was found to be higher in Indian classicaldancers than females engaged in gymnasium.
The number and percentage of females falling into good and average category was more in Indianclassical dancers than females engaged in gymnasium. The percentage of Indian classical dancersfrom Bharatnatyam type falling into good category was more than Indian classical dancers from Kathaktype.
This concludes that the vo2 max in ml/kg/ml and aerobic capacity under grading into "good" and"average" category was more in Indian classical dancers than females engaged in gymnasium.
Keywords: VO2 Max (Aerobic Power), Aerobic Capacity, Indian Classical Dance, Physical Exercise Group.
INTRODUCTION
Less physical activity with relative sedentary lifestyle habits leads to gradual deteriorations of physicalwellbeing or even disability. Sports, exercise or everydaychores will help us to live longer.
Today people are more aware of the fact that physicalexercise will not only decrease the incidence of healthproblems but also lead to an improved quality of lifeand longevity. Subsequently a new fitness trend has
gradually developed over the last two decades whichhas led to a tremendous increase in the number ofindividuals who participates in fitness and wellnessprogrammers.
One such program is aerobic or cardiovasculartraining program. Cardiovascular fitness is one of themost important health component required forperforming more physical work with many healthbenefits. It is common notion that, only physicalexercise provides fitness and is beneficial to health.
45. Rupali --238-242.pmd 2/7/2013, 8:08 PM238

Indian Journal of Physiotherapy & Occupational Therapy. January-March 2013, Vol. 7, No. 1 239
Attempts have been made in the past to correlate otherphysical activities like ballet (western dance) withestablished physical exercise routines in gymnasium.1,
2. Indian classical dance is one of the physical activitiesas it is performed regularly. There are very few studies3, 4, 5,6,7,8 showing that Indian classical dance (Bharat-Natayam, Kathak) can provide health related fitnessand endurance.
MATERIALS AND METHOD
Study was done in 2 groups
First study group (engaged in physical exercise ingymnasium): comprising of 30 female subjects of agegroup 17 to 30 years.
Second study group (Indian classical dancers):comprising of 30 female subjects of age group of 17 to30 years.
Inclusion criteria
1) Subjects ages 17-30 years.
2) Minimum regular six months training (with at leastone session of one & half to two hour’s duration &minimum three days in a week.)
Exclusion criteria
1) Subjects without regular 6 months training.
2) Subjects having any type of cardiopulmonarydiseases like myocardial infraction, unstableangina, aortic stenosis, cardiac arrhythmia, acuteendocarditis, myocarditis and pericarditis. Suchsubjects are excluded by history, general & systemicexamination.
METHODOLOGY
Cardiovascular endurance assessment by Queen’scollege step test:
The equipments used: Stepping bench of height16.25 inches, Metronome set at 88 beats / min or 22steps ups / min for women. Stop watch, Scale formeasuring height, weighing scale.
Prior to testing, required pretest instructionswill be given & test was properly explained &demonstrated to each subject. Calculations were doneto obtain the results.
Observations & results
The Table No. I and the Fig.1 shows the Comparison
of VO2 max/ aerobic power in ml/kg/ min betweenIndian classical dancers & females engaged ingymnasium. The VO2 Max/ aerobic power in ml/kg/min was to be higher in Indian classical dancers thanfemales engaged in gymnasium. The difference wasfound to be highly significant with the ‘p’ value of 0.
The Table No. II show Comparison of actual &predicted VO2 Max/ aerobic power (ml/kg/min) inIndian classical dancers. There was difference in meansof actual VO2 Max & predicted VO2 Max. The differencewas found to be significant with the ‘p’ value of 0.05.
The Table No. III show Comparison of actual &predicted vo2 max / aerobic power VO2 Max (ml/kg/min) in females engaged in gymnasium. There was nodifference in means of actual VO2 Max and predictedVO2 Max. The difference was found to be non-significant with ‘p’ value of 0.05.
The Table No. IV show comparison of aerobiccapacity/fitness in both study groups; Indian classicaldancers and females engaged in gymnasium.
The total number and percentage of females fromboth study groups falling into “average” category wasmore compared to “good” and “fair” category.
The total number and percentage of females fallinginto “good” and “fair” category was more in Indianclassical dancers compared to females engaged ingymnasium.
The total number and percentage of females fallinginto “fair” category was more which was from studygroup of females engaged in gymnasium only.
DISCUSSION
It is common notion that only physical exerciseprovides physical fitness & is beneficial to health. Butit is found that any type of physical activity doneregularly can improve cardiovascular endurance.Indian classical dance is one of the physical activitiesas it is done regularly. The VO2 max in ml/kg/ml andaerobic capacity under grading into “good” and“average” category was more in Indian classicaldancers than females engaged in gymnasium.Following are the reasons.
a) Muscle group involved
The total muscle mass involved in Indian classicaldance was much more and variable, moment tomoment, in the entire duration of the activity in
45. Rupali --238-242.pmd 2/7/2013, 8:08 PM239

240 Indian Journal of Physiotherapy & Occupational Therapy. January-March 2013, Vol. 7, No. 1
comparison to females engaged in gymnasium.Predominantly the lower extremity is involved in theexercises performed by the females engaged ingymnasium. Thus higher the VO2 Max in Indianclassical dancers.
The organism (inclusive heart) could tolerate aprolongation of the exercise period when larger massof skeletal muscle were activated. The subjective feelingof strain was more related to metabolism. Therefore atraining of the oxygen transporting system was moreefficient and psychologically less strenuous, the largerthe muscular mass involved in dynamic activities. 9
b) Duration
Indian classical dancers were practicing for anaverage duration of 45-60min daily. In addition, theywere also learning the skills for 3-4 days in a week.This might be classified as intermittent type of trainingmethod. (Teacher teaches dance step for 5 min thenstudent dances for learning that step for 5 to 10 min.)
Compared to Indian classical dancers, femalesengaged in gymnasium did the exercise for an averageduration of 60 min. (15 to 20 minutes- treadmill, crosscycling, stepper; 30 min – strength and flexibilityexercise.) females did this training for 5-6 days on anaverage in a week.
No threshold duration per workout exists for optimalaerobic improvement. If threshold exists, it probablydepends on the interaction of total work accomplished(duration or training volume), exercise intensity,training frequency and initial fitness level. Generally,the more frequent and longer the endurance trainingprogramme is, the greater will be the fitness benefits10.
c) Effect of Nritta, specific position, Natya, Nritya andmusic in Bharatnatyam.
Bharatnatyam comprises three aspects, Nritta,Nritya and Natya.
Nritta – are rhythmical and repetitive elements, i.e.it is dance proper.
Natya (Abhinaya) – is the dramatic art, and is alanguage of gestures, poses and mime.
Nritya – is a combination of Nritta and Natya.
Nritta in Bharatnatyam type includes complex stepsin different postures with expressions which involveeach and every part of the body of the dancer. In Nrittathe whole body was made the instrument to produce
action. The solar plexus at the naval forms the centrefrom which all movements originate and are controlledby breath. The vibrations generated by Nritta lead tocorrection of energy imbalance in the body by actingupon nervous flexes or chakras a result of biochemicalchanges. Natya, Nritya and music were helpful inreducing the stress and increasing the functions oflimbic system, reticular activating system, probably byreleasing the neurotransmitters. This might help toelevate the mood and to keep the mind calm and alert.
d) Effect of Kathak
In Kathak physical activity is based on bhav (mood),raga (melody) and tala (rhythmic beat) mainly. Kathakdance is an art which has mainly vigor of dynamic footwork and pin point spins the subtle movements of theface and blended with miming of stories of all kinds. InKathak workload was by “bells” around the ankles,leg exercise by tapping of feet in a high speed rhythmcalled “Tatkar”. Kathak dance improves and maintainscardiovascular endurance and respiratory fitness.
Females engaged in gymnasium were performingexercises on treadmill, cross cycling and stepper withstrength and flexibility exercises. Females engaged ingymnasium had speed, inclination variation while theywere performing exercises on treadmill.
e) Training period
Training period varies among dancers & amongfemales engaged in gymnasium.
f) Goal
The goal of most of the Indian classical dancers is toattain expertise in a dance form, some of them wantedto make career in dance and few of them were dancingas a hobby. But the goal of the females engaged ingymnasium was to reduce weight to maintain figure,while some of them wanted to achieve for physicalfitness.
CONCLUSION
.This concludes that the VO2 max in ml/kg/ml andaerobic capacity under grading into “good” and“average” category was more in Indian classicaldancers than females engaged in gymnasium.
Thus physical activity like Indian classical dancedone regularly improved aerobic capacity/cardiovascular endurance in dancers.
45. Rupali --238-242.pmd 2/7/2013, 8:08 PM240
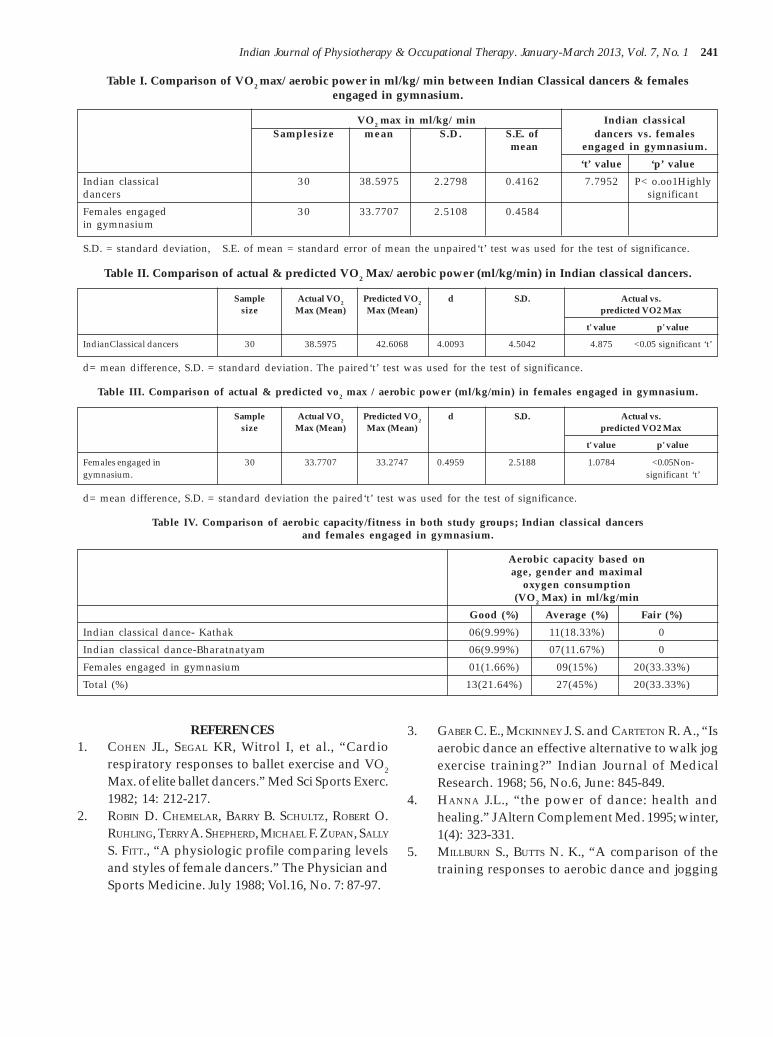
Indian Journal of Physiotherapy & Occupational Therapy. January-March 2013, Vol. 7, No. 1 241
Table I. Comparison of VO2 max/ aerobic power in ml/kg/ min between Indian Classical dancers & femalesengaged in gymnasium.
VO2 max in ml/kg/ min Indian classicalSamplesize mean S.D. S.E. of dancers vs. females
mean engaged in gymnasium.
‘t’ value ‘p’ value
Indian classical 30 38.5975 2.2798 0.4162 7.7952 P< o.oo1Highlydancers significant
Females engaged 30 33.7707 2.5108 0.4584in gymnasium
S.D. = standard deviation, S.E. of mean = standard error of mean the unpaired‘t’ test was used for the test of significance.
Table II. Comparison of actual & predicted VO2 Max/ aerobic power (ml/kg/min) in Indian classical dancers.
Sample Actual VO2 Predicted VO2 d S.D. Actual vs.size Max (Mean) Max (Mean) predicted VO2 Max
t' value p' value
IndianClassical dancers 30 38.5975 42.6068 4.0093 4.5042 4.875 <0.05 significant ‘t’
d= mean difference, S.D. = standard deviation. The paired‘t’ test was used for the test of significance.
Table III. Comparison of actual & predicted vo2 max / aerobic power (ml/kg/min) in females engaged in gymnasium.
Sample Actual VO2 Predicted VO2 d S.D. Actual vs.size Max (Mean) Max (Mean) predicted VO2 Max
t' value p' value
Females engaged in 30 33.7707 33.2747 0.4959 2.5188 1.0784 <0.05Non-gymnasium. significant ‘t’
d= mean difference, S.D. = standard deviation the paired‘t’ test was used for the test of significance.
Table IV. Comparison of aerobic capacity/fitness in both study groups; Indian classical dancersand females engaged in gymnasium.
Aerobic capacity based onage, gender and maximal
oxygen consumption(VO2 Max) in ml/kg/min
Good (%) Average (%) Fair (%)
Indian classical dance- Kathak 06(9.99%) 11(18.33%) 0
Indian classical dance-Bharatnatyam 06(9.99%) 07(11.67%) 0
Females engaged in gymnasium 01(1.66%) 09(15%) 20(33.33%)
Total (%) 13(21.64%) 27(45%) 20(33.33%)
REFERENCES1. COHEN JL, SEGAL KR, Witrol I, et al., “Cardio
respiratory responses to ballet exercise and VO2
Max. of elite ballet dancers.” Med Sci Sports Exerc.1982; 14: 212-217.
2. ROBIN D. CHEMELAR, BARRY B. SCHULTZ, ROBERt O.RUHLING, TERRY A. SHEPHERD, MICHAEL F. ZUPAN, SALLY
S. FITT., “A physiologic profile comparing levelsand styles of female dancers.” The Physician andSports Medicine. July 1988; Vol.16, No. 7: 87-97.
3. GABER C. E., MCKINNEY J. S. and CARTETON R. A., “Isaerobic dance an effective alternative to walk jogexercise training?” Indian Journal of MedicalResearch. 1968; 56, No.6, June: 845-849.
4. HANNA J.L., “the power of dance: health andhealing.” J Altern Complement Med. 1995; winter,1(4): 323-331.
5. MILLBURN S., BUTTS N. K., “A comparison of thetraining responses to aerobic dance and jogging
45. Rupali --238-242.pmd 2/7/2013, 8:08 PM241

242 Indian Journal of Physiotherapy & Occupational Therapy. January-March 2013, Vol. 7, No. 1
in college females,” Med Sci Sports Exerc. 1983;15(6): 510-513.
6. NOVAC L. P., MAGILL L. A. and SCHUTTE J. E.,“Maximal oxygen intake and body compositionof female dancers.” Eur J Appl Physiol OccupPhysiol. 1978; Oct 20, 39(4):277-282.
7. PEPPER M. S., “Dance – a suitable form of exercise?A Physiological appraisal.” S Afr Med J. 1984; Des8, 66(23):883-888.
8. “Changes in selected cardio respiratory responses
to exercise and in body composition, following 12week aerobic dance programme.” Jr Sports Sci;winter, 4(3): 189-199.
9. ASTRAND P.O. and RODAHL K., “Textbook of WorkPhysiology. “1988”; Third edition, (London:MacGraw Hill), pp. 311,356,361.
10. Merle L. Foss.,Steven J Keteyian , Fox’sPhysiological basis for exercise & sports. 1998;Sixth edition, (MacGraw Hill), pp. 301-303.
45. Rupali --238-242.pmd 2/7/2013, 8:08 PM242

Indian Journal of Physiotherapy & Occupational Therapy. January-March 2013, Vol. 7, No. 1 243
Comparative Study to Determine the Hand Grip Strengthin Type-II Diabetes Versus Non-Diabetic Individuals - A
Cross Sectional Study
Jayaraj C. Sindhur1, Parmar Sanjay2
1Associate Professor, Dept. of Medicine, 2Assistant Professor, Dept. of Physiotherapy,S.D.M. College of Medical Sciences & Hospital, Dharwad
ABSTRACT
Abstract: Background and objective: The diabeties is increasing in developing countries, manycomplication have been studied hand getting affected is one of them. As hand is major in humanfunction. So objective of this study was to evaluate the grip strength in diabetic group and comparewith non-diabetic individuals.
Materials & Method: After obtaining ethical clearance, a pilot study was conducted and total 274subjects 137 in each group that is diabetic and non-diabetic were assessed for hand grip strength andcompared with each other. The standard method of assessment by using hand dynamometer and BodyMass Index was assessed by using stadiometer and weaning machine. After obtaining of the dataanalysis was done.
Results: The mean age of diabetic group was 57.63 + 6.76 year, non diabetic mean age was 57.70 + 6.48.The mean Body Mass Index was 22.81 +2.04 kg/m2 and 24.62+3.06 in non-diabetic and diabetic groupwas respectively. The mean grip strength for the diabetic left hand was 13 kgs while non-diabetic it was15kgs while right hand was 14kgs in diabetics and 16kgs was in non-diabetic individuals.
Conclusions: We concluded that there is significant reduction in grip strength in diabetic group. It wasincreased as the duration of diabeties was increased. There fore incorporating grip strength evaluationand treatment at the earlier stages may help in preventing complication, which will also reduce theimpact on functional disability in diabetic population.
Keywords: Diabetes Mellitus, Grip Strength, Hand Dynamometer
INTRODUCTION
As per word health organization (WHO), diabetesmellitus is a heterogeneous metabolic disordercharacterized by common feature of chronichyperglycemia with disturbance of carbohydrate, fatand protein metabolism is a leading cause of morbidityand mortality1.
India leads the world with largest number of diabeticsubjects earning dubious distinction of being termedthe “diabetic capital of world” according to diabetesatlas 2006 published by the international diabetesfederation, number of people with diabetes in Indiacurrently around 40.9 million is expected to rise to 69.9million by 2025 unless urgent preventive steps aretaken.2
Diabetes causes various system dysfunction andwhich leads to disabling function which includemusculoskeletal disorder although other complicationof diabetes are better recognized as cause of themorbidity and mortality. The musculoskeletalsyndromes associated it with it may be verydebilitating.3
The prevalence of connective tissue disorder in thesepatient has increased in the recent years affectingsignificantly their quality of life. Approximately 82.6%of individual with diabetes have been found to exhibitmusculoskeletal abnormalities, mainly of thedegenerative, non-inflammatory type musculoskeletaldisorder are the common finding among patient withtype –II diabetes. It causes connective tissue in manyways which leads to different alteration in periarticularand skelectur system.4
46. Sanjay parmar--243-246.pmd 2/7/2013, 8:08 PM243

244 Indian Journal of Physiotherapy & Occupational Therapy. January-March 2013, Vol. 7, No. 1
The hand of human is remarkable instrument,capable of performing countless actions owing to itsfunction as prehension and precision. The functionalview point of the hand is the effectar organ of theupperlimb which supports it mechanically and allowsit adopt the optimal position for any given action.However hand is not only motor organ but also a verysensitive and accurate sensory receptor, which feedsback information essential for its own performance.5
Grip strength is one of the many components to beconsidered in the examination of the hand function.The grip strength measurement can provide objectivethe quantifiable information regarding hand function.6
Less importance has been given to hand in diabetesmellitus, though hand function is crucial forproductivity and quality of life.7
OBJECTIVE OF STUDY
To study the hand grip strength in type –II diabetesmellitus as compare to non-diabetes age matchedindividuals.
HYPOTHESIS
Null Hypothesis: There will not be difference inHand grip strength in non-diabetic to diabeticindividuals.
Alternative Hypothesis: There will be difference inHand grip strength in non-diabetic to diabeticindividuals
MATERIAL AND METHODOLOGY
Department of medicine S.D.M. College MedicalScience & Hospital Dharwad.
MATERIAL
1. Data collection sheet including conset form
2. Hand dynamometer (IMI-1417)
3. Straight backed chair without armrest
4. Sphygmomanomenter (Diamond)
5. Steltho Scope (Littman)
6. Weighing machine (Koups)
7. Stadiomeler
8. Goniometer (IMR: 1432)
Inclusion Criteria
Subjects of either gender of any age with type-IIdiabetics as diagnosed according to American DiabeticAssociation Criteria.8
Exclusion Criteria
1. Any musculoskeletal, Neurological, Disorder/Injury
2. Subjects unwilling and not comfortable duringprocedure or before.
Sampling: Convenient Sampling as all included.Earlier as diabetic group which were diagnosed. Thesample derived from pilot study which came upto 274individuals divided as 137 diabetic individuals andthan age matched and gender, BMI matched individualswere taken for the study.
PROCEDURE
The study was approved by the SDM College ofMedical Science & Hospital Ethical committee. Subjectswith diabetics mellitus were screened by doing routineblood test and previous record which followed to thePrincipal Investigator. Grip strength was collectedusing Hand Dynamometer9,10. Inter- rater and intra –rater reliability were assessed by a pilot study and ‘r’values were found to be 0.95 and 0.94 respectively.
Before testing vitals were noted and the procedurewas explained and demonstrated in local language.The position prescribed by the American Society ofHand Therapist was used. The dynamometer readingtaken was mean was three trials for each hand. Thedynamometer was reset to zero prior to each readingand was read to be nearest increment of the 2 scaledivision. 60 second rest was given between each trial.Each contraction was held for 3 seconds. 11
RESULTS
Table I . Distribution of Study Subject according tostudy groups and gender
Groups Male % Female % Total
Diabetic 64 46.72 73 53.28 137
Non-Diabetic 64 46.72 73 53.28 137
Total 128 46.35 146 53.65 274
Table 2. Mean and standard Deviation or studysamples according to groups
Groups Mean age (Years) Standard Deviation
Diabetic 57.63 6.76
Non-Diabetic 57.70 6.48
Total 57.66 6.61
46. Sanjay parmar--243-246.pmd 2/7/2013, 8:08 PM244

Indian Journal of Physiotherapy & Occupational Therapy. January-March 2013, Vol. 7, No. 1 245
Table 3.Comparison of diabetic andnon-diabetic groups with respect to grip
strength (Kg) by unpaired‘t’ test.
Variables Groups Mean SD ‘t’ value P-value
Grip strength Diabetic 12.820 3.93 -5.034 0.000kgs in left hand Non diabetic 15.006 3.21
Grip strength Diabetic 13.868 4.06 -4.71 0.000in Kgs on right Non diabetic 15.960 3.22hand
Significant at 5% level of significance (P<0.05)
DISCUSSION
Hand is an important target for diabeticmusculoskeletal complication. Much less attention hasbeen given to the hand. Hand function is crucical forproductivity and quality of life.12,13 The mean BMI was25.18 kg/m2 in diabetic and 25.69 kg/m2 in non diabeticthus no significant difference was found. As BMI (BodyMass Index) said to influence grip strength. That isindividual with higher BMI has higher grip strength.
The Systolic Blood Pressure (SBP) & Diastolic BloodPressure (DBP) was changed significantly this was truefor both group. The recommended 3 second duration ofhold and repetition of three times was used in study soas to register maximum reading. However isometricmuscle contraction can cause in blood pressure andheart rate which was monitered by physician. The bloodpressure values came to normal in 3 minutes.11
Hand grip values were significantly lower indiabetic group compared with control non diabeticgroup. This finding is in accordance with studies byCetinus et al and Sayer et al, in there study evaluatedmuscle strength and physical function in 1391 diabeticsubjects it was found that mean grip strength in diabeticwas 41.8 kgs while as in normal non- diabetic it was44.7 kgs. (P=0.002).14
Also reduction in grip strength is associated withpower glycemic control with increased systemicinflammatory cytokines such as Tumor Necrosis Factorá (TNF-á) and interleukin-6(IL-6) have detrimentaleffects on muscle function. Distal symmetricalneuropathy which may present sebclinically is alsoresponsible for distal muscle weakness and thereforeattributes to low grip strength15.
LIMITATIONS
Work profile /level of physical activity were nottaken into considerations
FUTURE SCOPE
To study correlation between – duration of diabeticand grip strength as a longitudinal study
CONCLUSION
The objective of this study was to determine gripstrength between – diabetic and non- diabeticpopulation. Thus we conclude that be grip strength getsreduction and early medical and physical therapyintervention may show better out come in hand function
REFERENCES
1. Mohan H. Textbook of pathology 5th ed New Delh:Jaypee Brothers Medical publisher 2005. P 842-48
2. Mohan V. Sandeep S.; Epidemiology of Type -2Diabetes: Indian scenario Indian J. Med Res (serialonline) 2007 March (cited 2008 Oct. 23); 25:217-230
3. Joslin E. Joslin’s diabetes mellitus 14th ed Boston:Lippincott Williams and Wilkins: 2004,P. 1061-1121.
4. Browne D, Mc care F. Musculoskeletal disease indiabetes 18 (2); 62-64; 2009
5. Magee D. Orthopedic physical Assessment 4th
edition penny sylovania Elsevier science; 2002, p355-418
6. Kuzala EA, Vargo MC. The Relationship betweenelbow position and grip strength. Am J occup Ther1992; 46 (6): 509-512
7. Cosanova JE, Young MS, Hand function in patientwith diabetic mellitus, southern medical journal(serial online) 1991 September (citied 2008September 10); 84 (9): 1111-1113
8. Stewart P. Diagnosis and classification of Diabetesmellitus. Diabetes care (serial online) 2008 Jan(cited 2008 Sept. 4); 31 suppl 1:55-60
9. McAradle WD, frank IK, victor L. Exercisephysiology Energy, Nutrition and Humanperformance 6th ed Baltimore: Lippincott Williamsand Wilkins: 2007 P 774-775.
10. Brown SC, Millor WC, JC ME: ExercisePhysiology: Basis of Human Movement in healthdisease 6th ed London Lippincott Williams andWilkins; 2007 P 529-530
11. Innes E. Hand grip strength testing: A review ofthe literature. Australian occupational therapyJournal (serial online) 1999 (cited 2008 August2011); 46 ; 120-140
46. Sanjay parmar--243-246.pmd 2/7/2013, 8:08 PM245

246 Indian Journal of Physiotherapy & Occupational Therapy. January-March 2013, Vol. 7, No. 1
12. Casanopva JS, Young MJ. Hand function in patientwith diabetes mellitus. Southern medial Journal(serial online) 1991 Sept. 2008; 84 (9) ; 1111-1113
13. Savas, Hakanc, et al: The effects of the diabetiesrelated soft tissue hand legion and the reducedhand strength on function disability of hand intype 2 diabetic patient. Diabetic Research andclinical practice 2007; 77: 77-83
14. Sayers, Dennison E- Type 2 diabetes, muscle
strength and impaired physical function. Diabetescare (serial online) 2005 (cited 2008 August 2011);28 (10): 2541-2.
15. Goodpaster BH, Decreased muscle strength andquality in older adults with type 2 diabetes: TheHealth ageing and body composition studydiabetes (serial online) 2006 Jun (cited 2008October 2008); 55:1813-1818
46. Sanjay parmar--243-246.pmd 2/7/2013, 8:08 PM246

Indian Journal of Physiotherapy & Occupational Therapy. January-March 2013, Vol. 7, No. 1 247
Study of Correlation between Hypermobility and BodyMass Index in Children aged 6-12 Years
Parmar Sanjay1, Praveen. S. Bagalkoti2, Rajlaxmi Kubasadgoudar2
1Assistant Professor, Department of Physiotherapy, 2Associate Professor, Department of Pediatrics,SDM College of Medical Sciences And Hospital, Dharwad, 2Consultant Pediatric Physiotherapist,
Regional Neuroscience Centre, Hubli, Karnataka
ABSTRACT
Objectives: Joint hypermobility indicates an increase in the range of joint movement among normalindividuals. Joint hypermobility commonly occurs in school age children (8-39%). Weight gain mayprecipitate the onset of symptoms of hypermobility syndrome. This study was done to assess thecorrelation between hypermobility and body mass index in children aged 6-12 years.
Design: Cross sectional study
Methods: Beighton score was used to evaluate 420 healthy children. One point was scored for eachpositive result (maximum: 9). Scores >4 were considered to be generalised hypermobility. Body massindex was calculated using height and weight of the children. Then, the data was evaluated statisticallyusing SPSS 16.0 version statistical software and results were obtained.
Results: The result showed that 57.14% of hypermobile children were under weight, 35.93% ofhypermobile children had normal weight, 19.15% of hypermobile children were at risk of beingoverweight where as 16.67% of hypermobile children were overweight. A negative correlation (-0.0008)between hyper mobility and BMI was found.
Conclusion: Hypermobility was more prevalent (57.14%) among under weight children aged 6-12years.
Keywords: Hypermobility, Beighton Score, 6-12 Years Aged Children, Body Mass Index
INTRODUCTION
Generalised joint hypermobility indicates anincreased range of motion in general compared withthe mean range of motion. Generalised jointhypermobility is claimed to be present in 5–15% ofgeneral population.1 There is clear evidence that factorssuch as gender, age group, ethnic group, certain physicalactivities and their intensity, and the presence of certainpathological conditions, may be associated with jointmobility.2 Greater range of motion is inherently presentin children than adults.3
The most widely used scale for hypermobility is theBeighton hypermobility score. It can be conductedeasily and requires less time. A study done by van derGiessen LJ showed that Beighton score is valid inhealthy children aged between 4 to 12 years.4 It is apractical and reliable method for defininghypermobility in children.
Ancedontal evidence suggests that sudden andsubstantial weight gain may precipitate the onset ofsymptoms, notably arthralgia, in previouslyasyptomatic hypermobile individuals. Despite the factthat no study has yet demonstrated an improvement insymptoms following weight loss, it would seemadvisable to recommend such a measure to obese adultsor children with the symptoms.5
There is no study done on correlation betweenhypermobility and body mass index in children aged6-12 years. There is need for identifying body mass indexin hypermobile children who are at risk of developingmusculoskeletal complications. Education andtherapeutic interventions can be targeted to this specificgroup of children before they become symptomatic andprevent further sequelae.
In this study we assessed the correlation betweenhypermobility and body mass index in children aged6–12 years.
47. Sanjay parmar--247-249.pmd 2/7/2013, 8:08 PM247

248 Indian Journal of Physiotherapy & Occupational Therapy. January-March 2013, Vol. 7, No. 1
METHOD
Before commencement of the study, an ethicalclearance from Shri Dharmastala ManjunatheshwaraInstitutional Ethical Committee, Dharwad was taken.Children from various schools of Dharwad wereincluded in the study. Prior to the commencement ofthe study, a written consent letter was obtained from allparents.
SUBJECTS
420 children aged 6–12 years were included, ofwhich there were 252 boys and 168 girls. At first, all thechildren were screened by a paediatrician and childrenwith skeletal problems such as fracture, neuromusculardisorder like cerebral palsy, rheumatic disorders,metabolic dysfunctions or disorders such ashomocystinuria, developmental delay and geneticdisorders such as downs syndrome were excluded.
PROCEDURE
Joint hypermobility was measured in five body areas
using Beighton score. One point was scored for eachpositive result (for each side), and scores of 4 or morepoints were considered to be generalised hypermobility.The children were categorized according to the scoring.
Along with scoring the hypermobility, even heightand weight of the children were taken. Body mass index(kg/mt2) was calculated using these height and weightmeasurements. According to CDC growth charts, thechildren were categorized as underweight, normalweight, at risk of being overweight and overweightgroups.
Statistical Analysis
SPSS 16.0 version statistical software was used forstatistical analysis. The investigator used Chi squaretest to evaluate the descriptive statistics that isdistribution of study subjects by BMI and generalisedhypermobility. Then, the Correlation between hypermobility scores (i.e. only scores are greater than or equalto 4) with BMI scores was found out using KarlPearson’s correlation method.
RESULTS
Table1. Distribution of study subjects by BMI and hyper mobility.
BMI Normal mobility % Hyper mobility % Total %
Underweight 9 42.86 12 57.14 21 5.00
Normal weight 214 64.07 120 35.93 334 79.52
At risk of being overweight 38 80.85 9 19.15 47 11.19
Overweight 15 83.33 3 16.67 18 4.29
Total 276 65.71 144 34.29 420 100.00
Chi-square=12.5291 df=3 p=0.0057, S
Table1 shows the distribution of study subjects withrespect to BMI and hyper mobility. This table showsthat 57.14% of hypermobile children were under weight,35.93% of hypermobile children had normal weight,
19.15% of hypermobile children were at risk of beingoverweight where as 16.67% of hypermobile childrenwere overweight.
Table 2. Correlation between hyper mobility scores with BMI scores by Karl Pearson’s correlation method
Correlation between Hypermobility scores (i.e. only scores are
greater than or equal to 4) with
Correlation coefficient t-value p-value
BMI scores -0.0008 -0.0099 0.9921
Table 2 shows correlation between hyper mobilityscores (i.e. only scores are greater than or equal to 4)
with BMI scores. There was negative correlationcoefficient of -0.0008 between hypermobility and BMI.
47. Sanjay parmar--247-249.pmd 2/7/2013, 8:08 PM248

Indian Journal of Physiotherapy & Occupational Therapy. January-March 2013, Vol. 7, No. 1 249
DISCUSSION
The purpose of this study was to assess thecorrelation between hypermobility and body mass indexin children aged 6–12 years.
A study was done to know the prevalence of jointhypermobility in children from Mumbai, India and itsassociation with malnutrition. 829 children of the lowerurban socio-economic strata, between 3 and 19 years ofage were evaluated independently by two observers forhypermobility using the Beighton 9-point scoringsystem. Their nutritional status was stratified usingstandard Indian growth charts and hypermobility wasquantified in various nutritional groups.Musculoskeletal symptoms were assessed by aquestionnaire given to parents. They foundhypermobility in 58.7% of population. Near equal sexincidence was noted. A higher incidence of finger signswas noted in comparison to elbow hyperextension,knee hyperextension and hands to floor. 26% of thehypermobile population had musculoskeletalsymptoms as compared with 17.2% of the nonhypermobile population. A positive Beighton score wasfound in children with grade 3 and 4 malnutrition and26.1% of those hypermobile had musculoskeletal tosymptoms in comparison 17.7% of their nonhypermobile counterparts.6
A population-based evaluation of generalized jointlaxity (Hypermobility) in fourteen-year-old childrenfrom the UK was studied. Among the 6,022 childrenevaluated, the prevalence of hypermobility (defined asa Beighton score of >4 [i.e., >4 joints affected]) in girlsand boys age 13.8 years was 27.5% and 10.6%,respectively. 45% of girls and 29% of boys hadhypermobile fingers. There was a suggestion of apositive association between hypermobility in girls andvariables including physical activity, body mass index,and maternal education. Girls who were obese were2.7 times more likely to be hypermobile (adjusted OR2.70 [95% CI 1.24–5.88]) compared to girls who wereunderweight.7
Our study showed that 57.14% of hypermobilechildren were under weight, 35.93% of hypermobilechildren had normal weight, 19.15% of hypermobilechildren were at risk of being overweight where as16.67% of hypermobile children were overweight.
The limitations to our study was that further followup regarding any complication secondary togeneralised hypermobility was not carried out.Moreover, hypermobile children were screenedsubjectively and individual hypermobility were notdocumented (example, elbow hyperextension). Nocorrelation between socioeconomic factor andhypermobility was studied.
Future scope of this study will be long term followup of any secondary problem in hypermobile group ofvarious body mass index.
CONCLUSION
From this study, we can conclude that hypermobilityis more prevalent (57.14%) among under weightchildren aged 6-12 years.
REFERENCES
1. Russek LN. Hypermobility syndrome. Phys Ther1999 Jun;79(6):591-599.
2. Lamari NM, Chueire AG, Cordeiro JA. Analysisof joint mobility patterns among preschoolchildren. Sao Paulo Med J 2005 May 2;123(3):119-123.
3. Juul Kristensen B, Rogind H, Jensen DV, RemvigL. Inter-examiner reproducibility of tests andcriteria for generalized joint hypermobility andbenign joint hypermobility. Rheumatology(Oxford) 2007 Dec;46(12):1835-1841.
4. van der Giessen LJ, Liekens D, Rutgers KJ,Hartman A, Mulder PG, Oranje AP. Validation ofBeighton score and prevalence of connective tissuesigns in 773 Dutch children. J Rheumatol 2001Dec;28(12):2726-2730.
5. Peter Beighton, Rodney Grahame, Howard Bird.Hypermobility of joints. 4th ed. Springer VerlagLondon Limited; 2012. p. 82.
6. Hasija RP, Khubchandani RP, Shenoi S. Jointhypermobility in Indian children. Clin ExpRheumatol 2008 Jan-Feb;26(1):146-150.
7. Clinch J, Deere K, Sayers A, Palmer S, Riddoch C,Tobias JH, Clark EM. Epidemiology of generalisedjoint laxity (hypermobility) in fourteen year oldchildren from the UK. Arthritis Rheum. 2011Sep;63(9):2819-2827.
47. Sanjay parmar--247-249.pmd 2/7/2013, 8:08 PM249

250 Indian Journal of Physiotherapy & Occupational Therapy. January-March 2013, Vol. 7, No. 1
Comparison of Reaction Time in Older Versus Middle-agedType II Diabetic Patients - An observational Study
Shruti Bhat1, Sanjiv Kumar2
1MPT, Dept of Neuro Physiotherapy, 2PhD Principal and Professor, Institute of Physiotherapy,KLE University, Belgaum
ABSTRACT
Introduction: Diabetes mellitus affects the various systems of the body like the somatosensory, auditorysystem and slows psychomotor and cognitive responses all of which together may affect the reactiontime. Reaction time is the time taken by the individual to react or respond to a applied stimuli. Slowingof these reaction times affects the everyday tasks such as balance, increasing probability of a slip or afall.
Objective: The objective of the study was to evaluate and compare the reaction time of the middle agedand old age individuals with type II diabetes mellitus.
Methodology: Thirty individuals having diabetes mellitus of age 40 to 60 were randomly allotted intwo groups. The individuals between 40 to 60 years were allotted to Group A and those between 60 to80 years were allotted to Group B. The reaction time of both the groups were evaluated by using DropRuler Test and compared.
Results: Results showed that the reaction time in Group A was 0.19 seconds (±0.01) and in group B itwas 0.21 seconds (±0.01). The reaction time was more in group B compared to group A but was notstatistically significant. The co-relation co-efficient between age and reaction time of the two groupscombined was r=0.605
Keywords: Diabetes Mellitus, Reaction time, Drop Ruler Test, Middle aged, Old age.
INTRODUCTION
Diabetes mellitus a metabolic disorder of multipleaetiology. It is characterized by chronic hyperglycaemiaassociated with disturbances of carbohydrate, fat andprotein metabolism. This may result due to defect in theproduction of insulin or its action or due to both themechanism.1 India ranks first in the list of top 10countries estimated to have the highest numbers ofpeople with diabetes in 2000 and 2030.2 TheInternational Diabetes Federation (IDF) estimates thetotal number of people in India with diabetes to bearound 50.8 million in 2010, rising to 87.0 million by2030.3 Diabetes mellitus may present with characteristicsymptoms such as thirst, increased frequency ofurination, visual disturbances, and decrease in bodymass. The condition is symptomless in initial stagesbut may give rise to various complications affectingvarious organs of the body like eyes, kidneys, nervesgiving rise to conditions like retinopathy, nephropathy,and neuropathies respectively. Diabetes also affects the
central nervous system and Type 2 diabetes has beenassociated with cognitive impairments4
Reaction time is the time taken by an individual toreact or respond to an applied stimulus. It is the timelapse between the stimuli and response shown by theindividual. Reaction time is considered to be a putativecomponent of higher cognitive functions 5 this reactiontime is found to be increased in individuals with type IIdiabetes6. The reaction time depends on both theperipheral and central components of the nervoussystem. Impaired peripheral sensations and declinedcognitive function, due to affection of central nervoussystem are the important factors for increased reactiontimes in diabetic individuals. One of the largestimplications of increased reaction time is in the area ofslips and falls. Falls are incurred by most of the diabeticpopulation and are a common source of morbidity andmortality. Hence the assessment and improvement ofreaction time constitutes an important part ofmanagement of individuals with type II diabetes.
48. Sanjeev Kumar--250-253.pmd 2/7/2013, 8:08 PM250

Indian Journal of Physiotherapy & Occupational Therapy. January-March 2013, Vol. 7, No. 1 251
Various studies are done to assess the reaction timein diabetic individuals by comparing with the healthyindividuals but no study is done on comparison of thesereaction times between patients with diabetes mellitusof different age group. Hence objective of this study wasto compare the reaction time in middle age and old agetype II diabetic patients.
PARTICIPANTS
30 subjects diagnosed with type II diabetes fromKLE’s Dr. Prabhakar Kore Hospital And MedicalReasearch Centre, Belgaum and Vrudhashram wererecruited in this study and divided in to two groupsaccording to their age. Those between age 40 to 60 wereallotted to group A and those between age 60 to 80 wereallotted to group B. Group A had 15 patients (9 femalesand 6 males with mean age 50.4 yrs +/- 6.16 yrs) andGroup B also had 15 patients (7 females and 8 maleswith mean age 70.2 +/- 4.73 yrs).
PROCEDURE
The participants were explained about the test to beperformed and written consent was obtained from eachparticipant. After obtaining the consent the patient wasallotted to one of the groups according to his/her age.The reaction time in all subjects was tested using theDrop Ruler Test.7 A 30cm wooden ruler was used toperform the test. The subject was made to sit on a chairor stool with elbow supported on a table with wristoutside the table. The forearm was placed in midproneposition. The ruler was then placed between the thumband the index finger such that the finger and thumb areclose but not touching the ruler. The 0cm mark on theruler coincided with the borders of the fingers. The rulerwas then dropped between two fingers without priorintimation and the subjects were asked to grasp it attheir earliest. The distance at which the ruler wasgrasped was noted down and reaction time wascalculated. The standard equation for freely fallingbodies is Sf=1/2at2+vot+So.8 Where Sf is the averagedistance that the ruler fell, a is the acceleration of gravity(980 cm/sec2),t is the time that it takes the ruler to fall(the reaction time), vo is the initial velocity (zero) and
So is the initial distance (zero). Substituting in zero forvo and So simplifies the equation as Sf=1/2at2. Solvingthis equation for t yields dt=√(2Sf/a)
As the intra subject variability is high in this method10 trials were conducted for each subject and the meanreaction time was taken for statistical analysis.
Statistical analysis
Mean baseline demographic values were calculatedfor the continuous variables and analysis was done tofind the co-relation between age and the reaction time.The data was analysed in SPSS 16 using independentt-test to estimate the difference between groups in eachoutcome. The significance level was set at p<0.05.
RESULT
The data were collected from group A and group Bwhich was analysed and assessed for the significance.(Table-1) The gender distributions among the groupswere as follows; in group A there were 6 males and 9females with mean age 50.4 (+/-6.16) years and in groupB 8 males and 7 females with mean age 70.2 years (+/-4.73) were included. The mean height of group A was1.65 meter (+/-0.14) and group B the mean height was1.61 meters (+/-0.13). Hence there were no significantdifference between the groups and within the group asfar as height was concerned. The weight of participantsof group A was 65.21kg (+/- 4.17) whereas in group B itwas 65 kg (+/- 11.02). Within the group there weremoderate difference whereas inter group comparisondoes not show any significant difference hence it maybe concluded that the group was homogenous. BMI wasassessed and for group A mean BMI were 23.62 (+/-2.38) thus signifies that there were hardly anyoverweight individuals included in group A. In groupB mean BMI was 25.03(+/- 1.98) suggestive of presenceof overweight individuals in this group. The reactiontime was calculated in group A and found that meanreaction time was 0.19 seconds (+/- 0.01) and in groupB 0.21 seconds (+/- 0.01). The reaction time of groupsmight be related to the BMI of the groups. The co-relationco-efficient between age and reaction time of the twogroups combined is r=0.605
Table 1. Demographic details and outcome result
Gender Age Height(m) Weight(kg) BMI Reaction time(s)
A 6 males9 females 50.4±6.16 1.65±0.14 65.21±4.17 23.62± 2.38 0.19± 0.01
B 8 males7 females 70.2±4.73 1.61±0.13 65±11.02 25.03± 1.98 0.21± 0.01
T - - 0.970 0.058 1.574 2.872
DF - - 28 28 28 28
P<0.05 - - 0.340 0.955 0.127 0.008
48. Sanjeev Kumar--250-253.pmd 2/7/2013, 8:08 PM251

252 Indian Journal of Physiotherapy & Occupational Therapy. January-March 2013, Vol. 7, No. 1
DISCUSSION
A reaction time measurement includes the latencyin the sensory neural code traversing peripheral andcentral pathways; perceptive, cognitive and volitionalprocessing; a motor signal again traversing both centraland peripheral neuronal structures; and finally, thelatency in end effector (e.g., muscle) activation5. Manystudies have been done to evaluate the reaction timesin healthy individuals. A study on human reactiontimes found that in almost every age group, males havefaster reaction times than females and also that whilemen were faster than women at aiming at a target, thewomen were more accurate.9 Here in the present studythe difference of reaction times in females and maleswith diabetes was not calculated. A longitudinal studywas done on 1,265 community-dwelling volunteers(833 males and 432 females) who ranged in age from 17to 96 and cross-sectional analyses revealed slowing ofsimple reaction (SRT) and relatively greater slowing ofdisjunctive reaction time (DRT) across decades for bothmales and females. Repeated testing withinparticipants over eight years showed consistentslowing and increased variability with age 10. In ourstudy similar results were shown with group B havingmore reaction time compared to group A. Holmes et al.reported significant slowing of visual reaction timeduring a hospital clamp study at a blood glucose levelof 16.7 mmol/l but were unable to replicate thissubsequently using an auditory reaction-time task.11 Thepresent study showed that hyperglycaemia isassociated with increase in reaction time in diabeticindividuals. There is increasing evidence thathypoglycaemic episodes are also critical factor in type2 diabetes and older subjects aged more than 65 years,who represent the majority of type 2 diabetic patients,appear at a particularly high risk of experiencing severehypoglycaemia. Hypoglycaemia unawareness in thepresence of pronounced hypoglycaemia, inducedreaction time prolongation in older type 2 diabeticpatients 12. Earlier study on diabetic individualsconcluded that middle-aged individuals with type 2diabetes showed a greater decline in cognitive functionthan middle-aged individuals without diabetes3.Another study on the effect of metabolic syndrome oncognitive function showed that subjects with metabolicsyndrome showed poorer cognitive performance thansubjects without metabolic syndrome, especially thosewith high levels of inflammation and hyperglycaemiawas the main contributor of the association of metabolic
syndrome with cognition13. Study done on 20individuals with type 2 diabetes with mean age 61.5years concluded that during acute hyperglycaemia,cognitive function was impaired and mood state alsodeteriorated.14 These evidences show that the delay inthe reaction time may be the consequence ofsomatosensory affection, cognitive decline andhypoglycaemic unawareness.
In the present study there is increase in the reactiontime in the second group but is not statisticallysignificant. This increase may be due to age factor orepisodes of severe hyperglycaemia. Another reason maybe the increased BMI in the second group i.e group B.study on middle aged individuals concluded thatincreased BMI was associated with poor cognitivefunctions15. Comparison of type 2 diabetic subjects withnormal individuals concluded that patients with longstanding diabetes showed improved cognitive capacitywith restoration of glycaemic control16. Hence it can besaid that the decline in cognitive function in diabetesmellitus is rapid in the first few years after diagnosisand with progression of the condition the process ofthis decline is slowed down. This might be a reasonwhy there was no significant difference in the reactiontimes between the middle aged and old aged diabeticindividuals. The reaction time in Group B did not showstatistical increase because the increased reaction timein them may be attributed to the old age more thanpresence of the condition.
The further scope of this study is to evaluate largepopulation of diabetic individuals and to take intoaccount the duration of the condition which was notconsidered in the present study.
CONCLUSION
Our present study concludes that the slowing ofreaction time in individuals with type II diabetes is morepronounced in the early stages of the condition anddoes not significantly worsen with the progression ofthe disease.
REFERENCES
1. Definition, Diagnosis and Classification ofDiabetes Mellitus and its Complications, Reportof a WHO Consultation. World HealthOrganization Department of NoncommunicableDisease Surveillance Geneva 1999.
48. Sanjeev Kumar--250-253.pmd 2/7/2013, 8:08 PM252

Indian Journal of Physiotherapy & Occupational Therapy. January-March 2013, Vol. 7, No. 1 253
2. A Ramachandran, AK Das, SR Joshi, CS Yajnik, SShah, KM Prasanna Kumar. Current Status ofDiabetes in India and Need for Novel TherapeuticAgents. Supplement To JAPI. 2010 June; 58: 7-9.
3. Astrid C.J. Nooyens, Caroline A. Baan, AnnemiekeM.W. Spijkerman, W.M. Monique Verschuren.Type 2 Diabetes and Cognitive Decline in Middle-Aged Men and Women. Diabetes Care 2010,33(9):1964–1969.
4. Christopher M. Ryan and Michelle O. Geckle.Circumscribed Cognitive Dysfunction in Middle-Aged Adults With Type 2 Diabetes. Diabetes Care2000, October, 23(10):1486–1493.
5. Ian J. Deary and Geoff Der. Reaction Time, Age,and Cognitive Ability: Longitudinal Findings fromAge 16 to 63 Years in Representative PopulationSamples. Aging, Neuropsychology andCognition,2005, 12:187–215.
6. Samantha J Richerson, Charles J Robinson andJudy Shum. A comparative study of reaction timesbetween type II diabetics and non-diabetics.
7. Ziaee Vahid, Kordi Ramin, Halabchi Farzin,Ghebleh Zadeh Mohammad and KestidarMohammad. Can We Promote Physical FitnessAmong Medical Students By Education Program?J.Med.Sci, (4):300-306.
8. Reaction Time. Roy Coleman, Morgan Park HighSchool Retired.
9. Tapani N. Liukkonen. Human Reaction Times asa Response to Delays in Control Systems. KajaaniUnit of Department of Information ProcessingScience, University of Oulu.
10. James L. Fozard, Max Vercruyssen, Sara L.Reynolds, P. A. Hancock and Reginald E. Quilter.
Age Differences and Changes in Reaction Time:The Baltimore Longitudinal Study of Aging. TheGerontological Society of America, 1994.
11. Daniel J. Cox, Boris P. Kovatchev, Linda A. Gonder-Frederick, Kent H. Summers, Anthony Mccall,Kevin J. Grimm,William L. Clarke. RelationshipsBetween Hyperglycemia and CognitivePerformance Among Adults With Type 1 and Type2 Diabetes. Diabetes Care 2005, january 28(1):71–77.
12. Jan P. Bremer, Kamila Jauch-Chara, ManfredHallschmid, Sebastian Schmid, Bernd Schultes.Hypoglycemia Unawareness in Older ComparedWith Middle-Aged Patients With Type 2 Diabetes.Diabetes Care 2009, 32(8):1513–1517.
13. Miranda G. Dik, Cees Jonker, Hannie C. Comijs,Dorly J.H. Deeg, Astrid Kok, Kristine Yaffe, BrendaW. Penninx. Contribution of Metabolic SyndromeComponents to Cognition in Older Individuals.Diabetes Care 2007 October, 30:2655–2660.
14. Andrew J. Sommerfield, Ian J. Deary, Brian M. Frier.Acute Hyperglycemia Alters Mood State andImpairs Cognitive Performance in People WithType 2 Diabetes. Diabetes Care 2004, 27:2335–2340.
15. M. Cournot, J. C. Marquié, D. Ansiau, C. Martinaud,H. Fonds, J. Ferrières, J. B. Ruidavets. Relationbetween body mass index and cognitive functionin healthy middle-aged men and women.
16. W. Hewera, M. Mussella, F. Ristb, B. Kulzerc andK. Bergis. Short-Term Effects of Improved GlycemicControl on Cognitive Function in Patients withType 2 Diabetes. Gerontology 2003;49:86–92.
48. Sanjeev Kumar--250-253.pmd 2/7/2013, 8:08 PM253

254 Indian Journal of Physiotherapy & Occupational Therapy. January-March 2013, Vol. 7, No. 1
Effect of Rehearsal Digit-Span Working MemoryIntervention on Sensory Processing Disorder in children
with Autism: A Pilot Study
Smily Jesu Priya V1, Jayachandran V1, Noratiqah S2, Vikram M3, Mohamad Ghazali M1, Ganapathy Sankar U4
1Lecture, Department of Occupational Therapy, 2Student, Department of Occupational Therapy, 3Lecturer, Department ofPhysiotherapy, Universiti Teknologi MARA (UiTM), Malaysia, 4Associate professor, SRM University, Kattankulathur
ABSTRACT
This pilot study investigated the effect of rehearsal digit span WM training on Sensory processingdisorder (SPD). Twenty children's with autism (6-9 years) were participated. The experimental groupreceived combination modalities of rehearsal digit span WM training to SPD, while the control groupdid not receive. The duration of training was one hour, twice per day for ten sessions. The findingindicate that rehearsal digit Span WM intervention has significant changes in the auditory filteringand no changes in tactile sensitivity, movement sensitivity, low energy, visual/auditory sensitivitytaste/smell sensitivity, seeks sensation and total score, since training was not conducted with controls.The study discusses consideration for future WM intervention on SPD for children with ASD.
Keywords: Autism; Working Memory; Digit Span; Sensory Processing Disorder
INTRODUCTION
Sensory processing disorder (SPD) is quite commonamong children with autism; literature reports a rangeof occurrence from 42% to 80% 1. Children with evidenceof sensory processing dysfunction, such as those withautism, often have difficulty regulating their responseto sensation and specific stimuli and may use self-stimulation to compensate for their limited sensoryinput or to avoid overstimulation2. These atypicalsensory reactions suggest poor sensory integration inthe central nervous system and could explainimpairments in attention and arousal1.
One area of executive function (EF) is which isfrequently discussed in autism is working memory(WM). Among the many potential areas of deficit inautism is related with executive function3. The clinicalpresentation of sensory processing disorder in autismhas been linked to deficits in executive functioning5.Executive function is an umbrella term for a set ofsubfunctions that are integrated throughout corticaland subcortical areas of the brain and used to carry outhigher order cognitive tasks. Overall the evidence ismixed about the relationship between sensoryprocessing disorder and executive deficits in autism,and it is unlikely that executive dysfunction is theprimary explanatory model of these behaviors4. Still itis important to examine if executive function (working
memory) intervention also could account for theimprovement of sensory issues in autism. This willallow researchers to determine whether workingmemory intervention will solve the sensory processingdisorder in children with ASD.
Despite the documented deficits in working memory(WM) in autism, relatively little research has beenpublished on procedures for remediating these deficits.A small number of studies have evaluated approachesto improving working memory, often focusing onchildren with attention deficit hyperactive disorder(ADHD), fetal alcohol spectrum disorder (FASD) orDown syndrome. The rehearsal training programeffectively improved the mnemonic performance of achild with down syndrome7. This finding was laterreplicated with typically developing peers. For example,authors found that WM span scores increased as aresult of using a rehearsal strategy and positivereinforcement improves the WM in autism8.
Sensory symptoms in autism also are impacted bycognitive maturation, at least in preschool-agedchildren. Researchers have found that lower mentalages are predictive of aberrant sensory features in youngchildren with autism or other developmentaldisabilities9. Based on the previous studies there was arelationship between executive functions and sensoryprocessing disorder in individuals with ASD, virtually
49. smily jesipriya-254-258.pmd 2/7/2013, 8:08 PM254

Indian Journal of Physiotherapy & Occupational Therapy. January-March 2013, Vol. 7, No. 1 255
no research has been published in cognitiveintervention to sensory issue problems. Therefore, thepurpose of this was to examine the rehearsal digit spanworking memory intervention on sensory processingdisorder in children with ASD.
METHOD
Research design
We used a pretest–posttest, control group design.This study was approved by the ethics committee asrequired (Institutional Review Board), and all parentsprovided consent for their children’s participation.
Participants and setting
Participants in the study were a convenience sampleof children diagnosed with autism (n=20) on the basisof the Diagnostic and Statistical Manual of MentalDisorders criteria10. All participants were between ages6 and 9 (mean [M] age = 7.4) (See Table 1). Allparticipants with autism were selected from theOccupational Therapy Department and they wereassigned to an experimental (n=10) and control (n=10)group.
Inclusion criteria for this study included: Nonverbalintelligence scores within the average range on theWechsler Intelligence Test11, language scores below theaverage range on the Clinical Evaluation of LanguageFundamentals-Fourth Edition (CELF-4)12, and noknown auditory, neurological, or physiological basisfor their difficulties. Exclusionary criterion included:A significant history of hearing problems or speech/language difficulties, a diagnosis of dyspraxia, a corelanguage standard score outside the range of 85 to 115on the CELF-412, and for all participants, an inability to
recognize the numbers 1 to 9 in English.
Table 1. Distribution of Demographic Characteristics
Variables Respondents
Group Experimental 10
Control 10
Gender Male 13
Female 7
Diagnosis Autism 20
Age (year) MeanSD 7.401.155
Range 6 – 9
INSTRUMENTATION
Short Sensory Profile (SSP): This study used the SSPto assessed SPD (according to parent observation). TheSSP, which is based on the Sensory Profile13,14, is a 38-item caregiver questionnaire that was specificallydesigned to be used as a research instrument andscreening tool to identify children with SPD (age 3 -10).The 7 sections of the SSP found in a normative sampleare Tactile Sensitivity, Taste/Smell Sensitivity,Movement Sensitivity, Under-responsive/SeeksSensation, Auditory Filtering, Low Energy/Weak, andVisual/Auditory Sensitivity.
TASK DESIGN
The four digit recall tasks were designed using thedifferent combinations of visual and auditorymodalities for both the input presentation and thechild’s response (output), as described in Table 2. Allfour tasks used digit sequences, which ranged from twoto seven digits. In order to minimize the use of achunking strategy, sequences did not include repeatedor consecutive numbers. The four task types were usedfor both the DF and DB recall conditions. The digit recalltasks are available on the journal’s website at (http://www.informaworld.com/ijslp).
Table 2. Outline of task designs used for digits forwards (DF) and backwards (DB) conditions
Task Input Visual Support Output Visual Support Abbreviation Description
1 Auditory - Verbal - Aud/Verb Participant listens to a digit sequence saysthe numbers aloud. No visual informationis available.
2 Auditory - Verbal and motor + Aud/Verb-Mot Participant listens to a digit sequence andsays the numbers aloud while pointing tothem on a full digit grid.
3 Auditory and visual + Verbal - Aud-Vis/Verb Participant listens to a digit sequence whilewatching it on the screen and says thenumbers aloud.
4 Auditory and visual + Verbal and motor + Aud-Vis/ Verb-Mot Participant listens to a digit sequence whilewatching it on the screen and says thenumbers aloud while pointing to them on
a full digit grid.
49. smily jesipriya-254-258.pmd 2/7/2013, 8:08 PM255

256 Indian Journal of Physiotherapy & Occupational Therapy. January-March 2013, Vol. 7, No. 1
PROCEDURE
Control group was not received training andexperimental group received rehearsal training of fourdigit recall tasks using different combinations ofauditory and visual input and output for a DF and DBrecall. The duration of intervention was one hour, twiceper day and total ten sessions.
Prior to each task, the participants were given ashort explanation outlining what they were required todo and some reminders. The tasks that used visualinput or required gestural output included a 3-secondpresentation of the full digit grid before the task began,to familiarize the participants with the designatedlocations of the numbers. Each task began with fourtraining items (two trials at a length of two digits andtwo trials at a length of three digits). This allowed theparticipants to become familiar with the demands ofthe task and receive feedback if they were a difficulty.The test sequences began at a length of two digits andprogressed to a length of seven digits, with two trials ateach length. The participant was required to score atleast one of the two trials correct at each digit length toprogress to a longer sequence. This design was adaptedfrom Pickering.15. For each digit sequence, the testercontrolled when it was presented and said ‘‘go’’ afterits completion. The participants then gave a responseand the tester recorded this online. A 3-secondanimation reward was then revealed on the screen.
The tasks for both the DF and DB conditions werepresented in the following order: Task 1 (Aud/Verb), 2(Aud/Verb-Mot), 4 (Aud-Vis/Verb-Mot), 3 (Aud- Vis/Verb). Tasks with auditory only input were presentedfirst, followed by those with mixed modality input. TheDF and DB tasks were completed in separate sessions,with the DF tasks first and the DB tasks in the lastsession. Before starting the DF condition, each childwas shown a full digit grid and asked to name thenumbers. The tester pointed to each number in a randomorder to ensure automatic speech patterns were notused. If the child unable to recognize and name one ormore of the numbers, they were excluded from furthertesting. Production of a correct sequence was given ascore of 1, and a sequence where any number wasincorrect was scored 0. If there was a discrepancybetween the number the child pointed to and thenumber said aloud (regardless of whether one of thesewas correct), a score of zero was given for that sequence.
RESULT
Table 3 shows the pre- and post-test score for allparticipants for the SSP. The Wilcoxon Signed Rank testwas to determine whether any differences in pre andpost test for experimental and control group on SSP inchildren with ASD. The result showed that there wasno significant changes were found in both experimentaland control group (P > 0.05).
Table 3. Pre and post test scores for all participants on the SSP for both groups
Group Variable Pre test Post test Z-statistic P-valueMedian (IQR) Median (IQR)
Experimental Tactile sensitivity 27.50 (9.00) 30.50 (4.00) -1.604 0.109
Taste/smell sensitivity 15.00 (3.00) 15.50 (5.00) -1.342 0.180
Movement sensitivity 12.00 (2.00) 13.00 (4.00) -1.414 0.157
Seeks sensation 24.50 (7.00) 28.50 (7.00) -1.826 0.068
Auditory filtering 18.50 (5.00) 24.00 (4.00) -1.826 0.068
Low energy 28.50 (3.00) 28.50 (2.00) -1.00 0.317
Visual/auditory sensitivity 20.50 (8.00) 22.50 (4.00) -1.604 0.109
Total 149.00 (17.00) 162.00 (15.00) -1.826 0.068
Control Tactile sensitivity 24.50 (14.00) 30.00 (11.00) -1.342 0.180
Taste/smell sensitivity 16.00 (9.00) 14.50 (9.00) -0.184 0.854
Movement sensitivity 11.00 (2.00) 11.50 (5.00) -0.816 0.414
Seeks sensation 27.00 (14.00) 29.00 (12.00) -0.552 0.581
Auditory filtering 21.50 (9.00) 17.00 (5.00) -1.105 0.269
Low energy 25.00 (5.00) 25.50 (7.00) -0.447 -0.447
Visual/auditory sensitivity 17.00 (2.00) 17.00 (9.00) -0.365 0.715
Total 143.00 (34.00) 146 .00 (35.00) -1.826 0.068
49. smily jesipriya-254-258.pmd 2/7/2013, 8:08 PM256

Indian Journal of Physiotherapy & Occupational Therapy. January-March 2013, Vol. 7, No. 1 257
Table 4 present Mann Whitney test was used toanalysis post test between experimental group andcontrol group in children with ASD. The experimentalgroup displayed significant changes in auditoryfiltering than the control group, as measured by a SSP(P < 0.05, Z = 0.041), indicating that rehearsal digit span
working memory interventions were having impact onASD. No significant changes were found between thetwo groups on tactile sensitivity, taste/smell sensitivity,movement sensitivity, seeks sensation, low energy,visual/auditory sensitivity and total (p > 0.05).
Table 4. Comparison between experimental and control group on SSP
Variables Experimental Control Z-statistic P-value(n=10)Median (IQR) (n=10)Median (IQR)
Tactile sensitivity 30.50 (4.00) 30.00 (11.00) 0.00 1.00
Taste/smell sensitivity 15.50 (5) 14.50 (9.00) -0.577 0.564
Movement sensitivity 13.00 (4.00) 11.50 (5.00) -1.169 0.243
Seeks sensation 28.50 (7.00) 29.00 (12.00) 0.00 1.00
Auditory filtering 24.00 (4.00) 17.00 (5.00) -2.045 0.041
Low energy 28.50 (2.00) 25.50 (7.00) -0.899 0.369
Visual/auditory sensitivity 22.50 (4.00) 17.00 (9.00) -1.162 0.245
Total 162.00 (15.00) 146.00 (35.00) -1.732 0.083
DISCUSSION
Results identified significant post-interventionchanges in auditory filtering (see Table 4) between thegroups, as determined by SPP scores in the area ofsensory processing. The findings of this study showthat auditory short-term memory performance can beimproved in children with ASD through rehearsalstrategies. Previous study suggested that since short-term memory skills are strongly related to languageacquisition, it is very important to improve these skillsin children with ASD17. The rehearsal working memoryintervention improved auditory filtering inexperimental group. In this study, an experimentalgroup applied rehearsal training on working memorywith animation reward in children with autism. Areward is one type of positive reinforcement. Positivereinforcement provided motivation to the respondentto perform the digit span tasks. Researcher suggestedthat basic intervention (positive reinforcement) may besuccessful in improving working memory in childrenwith autism8.
No significant changes in the experimental andcontrol groups were found in the scores on the SSP orfrom pretest to posttest. Many reasons could exist forthe non significant results, ranging from a lack ofrehearsal working memory and sensory memorytraining. With regard to the effectiveness of intervention,it may not fully reflect common clinical sensoryprocessing disorder because recommendations forrehearsal into other working memory span were notprovided. A previous study supported digit forwardtask involving central executive of Baddeley model of
working memory16 and increase cognitive demand ofdigit backward recall. The study stated that rehearsaltraining improves working memory capacity18. Childrenwho not receive some specific training they do not showany significant changes in their performance. Inaddition, the sensitivity of the measurement tools mayhave influenced their ability to detect the changes.
LIMITATIONS
To fully interpret and apply the results of this study,several limitations should be considered. As withpretest–posttest control group designs, a small samplewas used; we had only twenty participants.Conclusions from the study should be interpreted andapplied in the context of the small number ofparticipating individuals. To increase external validityand generalizability of results, future researchersshould include a larger sample size. Second, this studyinvolved digit span task only as intervention andduration of treatment was short. Working memoryinvolved many tasks such as listening recall, countingrecall, word list matching, word list recall, Non-wordlist recall and others. Future researches to need to beexamined all the combined tasks of activities to WMskills on sensory processing disorder. Third, this studywas not used sensitive of outcome measures for sensoryprocessing disorder in ASD.
CONCLUSION
This study provides preliminary support for usingrehearsal digit span working memory intervention inchildren with ASD, although further research is
49. smily jesipriya-254-258.pmd 2/7/2013, 8:08 PM257

258 Indian Journal of Physiotherapy & Occupational Therapy. January-March 2013, Vol. 7, No. 1
necessary. Results identified significant progresstowards auditory filtering after rehearsal digit spanworking memory interventions, although no significantchanges were found on the other components. Resultssuggest implementing intervention, that are generalizedto home and community setting, using interventionsthat allow for individualized improvement in furtherstudies, and completing future studies with a largesample. Moreover, WM is an essential skill for everydaylife, and is an important link to skills, such as wordlearning and mathematics.
ACKNOWLEDGMENT
The authors would like to thank all parents or caretaker for their co-operation with data collection.
Declaration of Conflicting Interests
The author(s) declared no potential conflicts ofinterest with respect to the research, authorship, and/or publication of this article.
REFERENCES
1. Baranek GT: Efficacy of sensory and motorinterventions for children with autism. Journal ofAutism and Developmental Disorders 2002; 32,397–422.
2. Roberts JE, King-Thomas L, Boccia ML: Behavioralindexes of the efficacy of sensory integrationtherapy. American Journal of Occupational Therapy2007; 61, 555–562.
3. Hughes,C: Executive dysfunctions in autism: Itsnature and implications for the everyday problemsexperienced by individuals with autism. In: J.Burack and T. Charman, Editors, The developmentof autism: Perspectives from theory and research2001; (pp. 255–275). New York: Erlbaum.
4. O’Hearn K, Asato M, Ordaz S, Luna B:Neurodevelopment and executive function inautism. Development and Psychopathology 2008,20, 1103–1132.
5. Lopez BR, Lincoln AJ, Ozonoff S, Lai Z: Examiningthe relationship between executive functions andrestricted, repetitive symptoms of autistic disorder.Journal of Autism and Developmental Disorders2005; 35(4), 445–460.
6. Tamm L, Hughes C, Ames L, Pickering J, SilverCH, Stavinoha P., et al: Attention training forschool-aged children with ADHD: Results of anopen trial. Journal of Attention Disorders 2010;14, 86–94.
7. Farb J, Throne J: Improving the generalizedmnemonic performance of a Down syndromechild. Journal of Applied Behavior Analysis 1978;11, 413–419.
8. Baltruschat L, Hasselhorn M, et al: Furtheranalysis of the effects of positive reinforcement onworking memory in children with autism.Research in Autism Spectrum Disorders 2011; 5,855 – 863.
9. Baranek GT et al:Hyperresponsive sensorypatterns in young children with autism,developmental delay, and typical development.American Journal of Mental Retardation 2007; 112,233–245.
10. American Psychiatric Association: Diagnostic andstatistical manual of mental disorders 2000; (4thed., text rev,). Arlington, VA: Author.
11. Wechsler, D: Wechsler Preschool and PrimaryScale of Intelligence-Revised. Cleveland, OH: ThePsychological Corporation 1989.
12. Semel E, Wiig E, Secord W: Clinical Evaluation ofLanguage Fundamentals – fourth edition. SanAntonio, TX: Psychological Corporation, 2006.
13. Dunn, W: The sensory profile: User’s manual. SanAntonio, TX: Psychological Corporation, 1999.
14. McIntosh, DN et al: Development and validationof the short sensory profile. In W. Dunn (Ed.),Sensory profile manual (pp. 59-73). San Antonio,TX: Psychological Corporation, 1999.
15. Pickering S, Gathercole S, Peaker M: Verbal andvisuo-spatial short-term memory in children:Evidence for common and distinct mechanisms.Memory and Cognition 1998; 26, 1117–1130.
16. Gathercol SE, Baddeley AD: Working memory andlanguage. Hove: Erlbaum, 1993.
17. Baddeley, AD: Working memory and language: Anoverview. Journal of Communication Disorders2003; 36, 189–208.
18. Lehmann M, Hasselhorn M: Variable memorystrategy use in children’s adaptive intratasklearning behavior: Developmental changes andworking memory inûuences in free recall. ChildDevelopment 2007; 78, 1068 – 1082.
49. smily jesipriya-254-258.pmd 2/7/2013, 8:08 PM258

Indian Journal of Physiotherapy & Occupational Therapy. January-March 2013, Vol. 7, No. 1 259
Evaluation of Inter-Rater Reliability to Measure Hand andArm Function in Reaching Performance Scale for Stroke
Patients
SureshKumar T.1, Leo Rathinaraj A.S.2, Jeganathan A.3, Vignesh waran Vellaichamy4
1Assistant Professor, Maharashtra Institute of Physiotherapy, Latur, 2Professor, Maharashtra Institute ofPhysiotherapy, Latur, 3Professor, MAEER's Physiotherapy College, Talegaon, Pune, 4Lecturer, Santosh
College of Physiotherapy, Ghaziabad
ABSTRACT
Objective: This study is to assess the inter-rater reliability of Reaching Performance Scale test in handfunction evaluation.
Introduction: Stroke is defined as a rapidly developing clinical sign of focal or global disturbance ofcerebral function lasting for more than 24 hours or leading to death due to no other reason thanvascular origin. As there is high incidence of middle cerebral artery stroke, upper limb is more affectedthan the lower extremity and about 20% of the individual fail to regain any functional use of affectedupper extremity. When a stroke patient attempts to move and encounters all the deficits the naturalreaction is to compensate with available motor strategies. The measurement of the performance of theaffected arm and hand of the patient with hemiplegia is important for determining the goal of interventionas well as outcomes of rehabilitation. So there is a need to have a scale that measures the quality ofmotor performances specific to the task and identify which elements of the task are missing and howthey are compensated. Reaching performance scale is for the identification and quantification ofmovement pattern and their compensation during reach to grasp task in patients with upper extremityinvolvement after a stroke.
Materials & Methodology: 30 Hemiplegic patients between age group of 40-60 years who met theinclusion criteria were selected and explained about the study and procedure, and the consent for thestudy was taken. The Type of study is Inter-rater reliability study (correlation). The Materials used werecard board cone, Table, inch tape and a chair.
Procedure: The patients were examined by two Physiotherapists respectively. The patient was seatedin a chair with backrest but no arm rest. Reaching performance scale evaluated six components. For allpatients both close target [Task I] and Far target [Task II] were assessed and graded. Only reach to graspcomponent of task are taken into account. The inter-rater reliability to measure the hand and armfunction in Reaching Performance scale was statistically analysed by the Mann-Whitney test withP<0.05.
Result & Conclusion: In this study the reliability between the investigators is very highly significantcorrelation of closed target (0.951) and P <0.05, Far target (0.946) and P<0.05. So we can conclude thatinter rater reliability of RPS scale in assessing arm and hand function is high and hence RPS can alsobe used to assess the compensatory strategies in stroke patients for an effective intervention.
Keywords: CVA, Stroke, Arm and hand function, Reaching Performance scale, Inter-rater Reliability,Compensatory strategies.
INTRODUCTION
Stroke is the third leading killer on western countriesafter heart disease and cancer. Among all neurologicaldisease of adult life, the cerebro-vascular disease ranksfirst in frequency and importance.1 Stroke orcerebro-vascular accident CVA is defined as a rapidlydeveloping clinical sign of focal or global disturbanceof cerebral function lasting for more than 24 hours or
leading to death due to no other reason than vascularorigin.2 The term CVA is used interchangeably withstroke of either ischemic or hemorrhagic lesions andaffects approximately 7,00,000 individual a year out ofthem 75% have weakness in the upper extremity.3 Withan estimated number of 5, 00,000 stroke survivors andthe incidence of stroke increases dramatically with age,doubling every decade after 55 years of age. In India,the prevalence range is 20 per 1, 00,000 population and
50. Suresh Kumar--259-263.pmd 2/7/2013, 8:08 PM259

260 Indian Journal of Physiotherapy & Occupational Therapy. January-March 2013, Vol. 7, No. 1
in south India, the incidence of stroke is 56.9 per1, 00,000 population.4
The most common insult to the brain results frommiddle cerebral artery lesion. More than two third arewithin the distribution of middle cerebral artery5. Owingto high incidence of middle cerebral artery strokes,upper limb is more affected than the lower extremity,about 20% of the individual fail to regain any functionaluse of affected upper extremity. Typically distal musclesmore affected than proximal muscles.6 Grip strengthchanges accordingly to the size of object being grasped.In hemiplegics commonly grasp an object and theninitiate the movement from the shoulder which placesthe hand in a non functional position7. Recentmovement analysis studies shows that the patient withhemiparesis due to stroke, use excessive trunk andshoulder girdle displacement, when pointing to targetsor attempting to reach and grasp objects placed withinand beyond the reach of the arm8. Such excessivedisplacement is thought to be compensatory behaviouremerging from the efforts of spared cortical andsubcortical system to compensate for lost control overmotor function such as elbow extension and shoulderelbow inter joint co-ordination.9
Studies of motor recovery following stroke haveshown that improvement in outcome measures such asspeed, precision and variability of arm movement maybe accomplished by compensatory strategies. Forexample in patients with severe hemiparesis,compensatory trunk movements that are used to extendsthe reach of the arm may limit the recovery of shoulderadduction and elbow extension needed forindependent arm movement.10 A compensatory strategyused by stroke patients is the fixation of body segments.This may decrease the number of motor elements (degreeof freedom).11 A negative consequence may be the lackof girdle mobility, which may limit the normalkinematics of upper and lower limb movement.12
The measurement of the performance of the affectedarm and hand of the patient with hemiplegia isimportant for determining the goal of intervention aswell as outcomes of rehabilitation.13 Functional outcomescale access the performance of daily living at theactivity level and quantify whether task is performedwith in the constraint specified by the test, while littleattention is paid how the movement performed.Impairment scales assess the underlying impairmentsuch as decreased range of motion or muscle weaknessor how well the specific movement performs. Thus testevaluate movement or movement pattern having no
functional goal. Impairment scales identify the factorthat may affect the performance of the task.14 So there isa need to have a scale that measures the quality of motorperformances specific to the task and identify whichelements of the task are missing and how they arecompensated.15 Reaching performance scale is for theidentification and quantification of movement patternand their compensation during reach to grasp task inpatients with upper extremity involvement after astroke. These scales particularly focus on the transportphase of reaching, defined as the beginning of themovement until the object is grasped. This scale alsoincludes a measure of compensatory strategies usedfor grasping.
METHODOLOGY
The purpose of the study is to assess the inter-raterreliability of Reaching Performance Scale test in handfunction evaluation. 30 Hemiplegic patients betweenage group of 40-60years who met the inclusion criteriaswere selected by simple random sampling from varioushospitals and rehabilitation centers. They wereexplained about the study and procedure, and theconsent for the study was taken. The Inclusion Criteriainclude patients who Sustained with single Cerebrovascular accident, aged between 40-60 years, withduration of one month to five years, having goodcognitive function, both the right and left sideinvolvement. The Exclusion criterias were Patients whoare not able to follow simple instructions, having anymusculoskeletal condition that prevent test procedure,Non co-operative patients, flaccid stage and Mentalretardation. The Type of study is Interater reliabilitystudy (correlation). The Materials used were card boardcone [7 cms base & 17.5 cms height] , Table [72 cmheight], inch tape and a chair [seat height 42 cms] toevaluate hand and arm function by using ReachingPerformance Scale.
PROCEDURE
As the test procedure is to find the inter-raterreliability, the patients are been examined by twoPhysiotherapists respectively. Prior to performance, thepatient were been instructed briefly how to carry outthe test procedure. The patient was seated in a chairwith backrest but no arm rest. The chair kept facing thetable. The table and chair placed one arm distance ofpatients arm, keeping wrist on the table. Patient seatedwithout leaning on the back support and patient feetflat on the floor. A card board cone kept on the table.Reaching performance scale evaluates six components
50. Suresh Kumar--259-263.pmd 2/7/2013, 8:08 PM260

Indian Journal of Physiotherapy & Occupational Therapy. January-March 2013, Vol. 7, No. 1 261
namely Trunk dissplacement, Movement smoothness,Shoulder movements, Elbow movements, Prehensionand Task accomplishments. This is an ordinal scaleand graded according to the patient performance. Forall patients both close target [Task I – grasping the coneplaced 1 cm far from the front edge of the table] and Fartarget [Task II - grasped the cone placed 30 cm far fromthe front edge of the table] were assessed and graded.Only reach to grasp component of task are taken intoaccount.
As a procedure is a double blind one time study, inorder to prevent scoring error, 3 successive readings isnoted and a separate recording sheet is used for thetwo examiners and examiner’s were unaware of eachother’s results. The inter-rater reliability to measure thehand and arm function in Reaching Performance scalewas statistically analysed by the Mann-Whitney testwith P<0.0
RESULTS
Table 1. Median and Quartile deviation for Closetarget
Close target Median Quartiledeviation
11.5 1.25
Table 2. Median and Quartile deviation for Far target
Far target Median Quartiledeviation
12.0 1.50
Table 3. Correlation between Investigator I andinvestigator II
Close target r-value P-value Result
0.951 0.000 P<0.05[Veryhighly
significant]
Shows the correlation of grasp between the 2investigators. Statistical analysis reveals thatspearman’s rank correlation co-efficient is r = 0.951[Close target] and the level of significance p = 0.000.Since the correlation is between the values -5 and +5and level of significance is < 0.05, the correlationbetween the rater’s is very highly significant.
Table 4. Correlation between Investigator I andinvestigator II
Far target r-value P-value Result
0.946 0.000 P<0.05(Veryhighly
significant)
Shows the correlation of grasp between the 2investigators. Statistical analysis reveals thatspearman’s rank correlation co-efficient is r = 0.946 [Fartarget] and the level of significance p = 0.000. Sincethe correlation is between the values -5 and +5 andlevel of significance is < 0.05, the correlation betweenthe rater’s is very highly significant.
Graph 1:
SCATTER DIAGRAM FOR CLOSED
TARGET
0
5
10
15
20
0 5 10 15 20
INVESTIGATOR A
IN
VE
ST
IG
AT
OR
B
Graph 2:
SCATTER DIAGRAM FOR FAR
TARGET
0
5
10
15
20
0 5 10 15 20
INVESTIGATOR A
IN
VE
ST
IG
AT
O
R B
DISCUSSION
This study was aimed at determining the inter raterreliability of Reaching performance scale test inassessing the arm and hand functions of stroke patients.The data analysis and statistical inference hasreinforced the reliability of Reaching performance scaletest. This study indicates reaching performance scaletest is extremely reliable for each of the subscales aswell as the total score when performed by differentraters. Different users of RPS test achieved consistent
50. Suresh Kumar--259-263.pmd 2/7/2013, 8:08 PM261

262 Indian Journal of Physiotherapy & Occupational Therapy. January-March 2013, Vol. 7, No. 1
result. Recent movement analysis studies have shownthat patient with hemiparesis due to stroke useexcessive trunk and shoulder girdle displacement whenpointing targets or attempting to reach and grasp objectplaced within and beyond the reach of the arm. Suchexcessive displacement is thought to be compensatorybehaviour emerging from the efforts of spared corticaland subcortical system to compensate for lost controlover motor function such as elbow extension andshoulder-elbow interjoint coordination.
In the flaccid extremity as a result of CVA there isinsufficient muscle tone to hold the glenohumeral jointin proper alignment due to the force of gravity andweight of the arm. The scapula placed in a downwardlyrotated and abducted position (Ryerson and Levitt1997). In the extremity with the spasticity unbalancedmuscle activation can contribute to downwarddepression and retraction of scapula (O‘ Sullivan 2001).Difficulty with Reach, and grasp occurs often in thepatient with CVA. The factors that may cause changesin upper extremity function are unbalanced musclepull, paralysis, decrease in sensation, secondary jointchanges, pain and odema. These factors restrict thereach and grasp due to increase tone of muscle, thepattern that develops include internal rotation andelevation of shoulder, elbow flexion, fore arm supinationor pronation, wrist and finger flexion. If this position offingers and wrist flexion continues for longer periods,flexor tendons shorten. This cause increased difficultyin active or passive opening of the hand.16
To mask the impairment the patient alwayscompensate with the other movement to accomplishthe task. For example a patient with severe hemiparesis,compensatory trunk movements are used to extend thereach of the arm. This may limit the recovery of shoulderadduction and elbow extension needed forindependent arm movement. Compensatory strategiesin reaching activities of stroke patients are adaptiveone. It invariably lead to other problems by causingaltered movement or joint glides. Hence it is importantfor then to be evaluated and corrected. This scaleparticularly focuses on transport phase of reaching i.e.the beginning of movement until the object is grasped.This scale also includes measure of compensatorystrategies used for grasping.
Reaching performance scale test is constructed forassessing upper limb functional recovery. Performanceevaluated for close and far targets. A wide rangevarying from acute stroke to chronic strokes wereincluded in this study. The duration of the samples
included ranged from a minimum of 1 month to 5 yearsof post stroke. Mindy F Levin concluded that the inter-rater reliability of reaching performance scale inassessing arm and hand function was significantlyhigh.17
In this study the reliability between the investigatorsis very highly significant correlation of closed target(0.951) and P <0.05, Far target (0.946) and P<0.05. Sowe can conclude that inter rater reliability of RPS scalein assessing arm and hand function is high and henceRPS can also be used to assess the compensatorystrategies in stroke patients for an effective intervention.
CONCLUSION
This study led to the inference that the Reachingperformance scale test used in assessment of handfunction in stroke patient has got very high significantinter-rater reliability. The current study being anevaluative study, have assessed the functional recoveryof affected upper limb, and the inter-rater reliability, sothat it can be used for clinical and research purpose.The inter-rater reliability is found to be high, the clinicalimplication of this study is that this scale can be usedeither when two therapists treat the same patient orwhen the clinical data is shared and they will be able tointerpret each other score without assessing the patientagain. Though the inter-rater reliability of Reachingperformance scale test was already proved but it wasless compared with that of intra rater reliability andfurther studies was recommended.
To conclude, the inter-rater reliability of Reachingperformance scale test was analyzed and found that itis highly reliable, with high level correlation andsignificance in measuring hand function of strokepatients.
ACKNOWLEDGEMENTS
The authors are thankful to, Prof Dr.Koti ReddyM.P.T, Principal, Maharashtra Institute ofPhysiotherapy for kindly providing laboratory facilitiesto carry out this work. A special thanks to my seniorDr.Lenin, for being source of inspiration.
Conflict of Interest
There is no conflict of interest between the authors
SOURCE OF FUNDING
Nil
50. Suresh Kumar--259-263.pmd 2/7/2013, 8:08 PM262

Indian Journal of Physiotherapy & Occupational Therapy. January-March 2013, Vol. 7, No. 1 263
ETHICAL CLEARANCE
This research study is given clearance under Ethicalcommittee headed by Prof Dr.Koti Reddy, Principal,Maharashtra Institute of Physiotherapy, Latur.
REFERENCES
1. Berg K O, Maki B E, Williams J, Holliday P, Wood-Dauphiner S L. Clinical and laboratory measureof postural balance in an elderly population J PhyMed Rehab. 1992 Nov, 73(11):1073-80.
2. Berg K, Wood- Dauphiner S L, Williams J. Thebalance scale: Reliability assessment with elderlyresidents in patients with stroke. J Phy Med Rehab.27:27-36.1995
3. Lawrence ES, Coshall C, Dundas R. et al, Estimateof the prevalence of acute stroke impairments anddisability in a multiethnic population. Stroke.2001; 32: 1279-1284.
4. Bergk o Makib e ,Williams j , Holliday PJ wood-Dauphnier s l, clinical and laboratory measure ofpostural balance in elderly population j phy medrehab 1992 nov ,73 11. 1073-80.
5. Catherene M, Dean M, Robeta B Sheaperd ,Taskrelated training improve performance of seatedreaching task after stroke 1997 ,28 ,722-728.
6. Susan O Sullivan, Thomas PJ, Schimitz Physicalreahybilitation assessment and treatment IV ediChapter17;532-para3.
7. Horak HB: The effect of movement velocity, massdisplaced, and mass certainty on associatedpostural adjustment made by normal andhemiplegic individuals, J Neurol Neurosurgpsychiatry 47:1020,1984.
8. Michaelsen SM, Luta A, Roby-Brami A, Levin MF.Effect of trunk restraint on the recovery of reaching
movements in hemiparetic patients. Stroke.2002;32:1875–1883.
9. Horak FB. Assumptions underlying motor controlfor neurologic rehabilitation. In Contemporarymanagement of Motor control ProblemsProceedings of the II step conference. Alexandria,Va: Foundation for Physical Therapy;1991 :11–27.
10. Cirstea CM, Ptito A, Forget R, Levin MF. Arm motorimprovement in stroke patients may depend ontype of training.Soc Neurosci Abtstir.2000; 26:162
11. Brunnström S. Motor testing procedures inhemiplegia: based on sequential recovery stages.Phys Ther.1966; 46:357–375.
12. Levin MF. Interjoint coordination during pointingmovements is disrupted in spastic hemiparesis.Brain.1996; 119:281–294.
13. Fisher B. Effect of trunk control and alignment onlimb function, J head trauma Rehabilitation2:72,1987.
14. Mindy F Levin, Johanne Desrosiers, DanielleBeauchemin, Nathalie Bergeron and AnnieRochette. Development & Validation of a scale forrating moto Compensation used for reading inpatients with Hemiparesis: The ReachingPerformance scale. Physio therp Vol 84, Number1, Jan 2004.
15. Roby-Brami A, Fuchs S, Mokhtari M, Bussel B.Reaching and grasping strategiein hemipareticpatients.Motor Control.1997; 1:72–91 .
16. Dolores B Bertoti. Functional Neuro rehabilitationthrough the life span. 316-3rd para.
17. Mindy F Levin. Development and validation of ascale for rating motor compensations used forreaching in patients with hemiparesis.ReachingPerformance scale. Phys Ther 2004;84;8-22.
50. Suresh Kumar--259-263.pmd 2/7/2013, 8:08 PM263

264 Indian Journal of Physiotherapy & Occupational Therapy. January-March 2013, Vol. 7, No. 1
Effect of Incentive Spirometry on Cardiac AutonomicFunctions in Normal Healthy Subjects
Trupti Ajudia1, Pravin Aaron2, Subin Solomen3
1Lecturer, 2Professor, 3Assistant Professor, Padmashree Institute of Physiotherapy, Bangalore
ABSTRACT
Objective: Objective of the study was to examine the effects of Incentive Spirometry on cardiac autonomicfunctions in normal healthy subjects in 18-25 years age group.
Material & Method: 30 subjects (n=15 in Study group and n=15 in Control group) were included inthis study. The duration of study was 3 months. Primary outcome measures included cardiac autonomicfunction tests. Outcome measures were recorded before and 3 months after the study.
Result: 3 months practice of Incentive Spirometry resulted in statistically significant change (p < 0.05)in following parameters - Basal heart rate, Immediate maximum heart rate, Steady state heart rate,Steady State heart rate (time in seconds) during heart rate response to Standing test; Minimum heartrate and Deep Breathing Difference (DBD) during heart rate response to Deep Breathing test.
Conclusion: 3 months practice of Incentive Spirometry changes autonomic function response.
Keywords: Breathing Exercise, Pranayama, Incentive Spirometer, Autonomic Functions.
Corresponding author:Trupti AjudiaLecturer, Padmashree Institute Of Physiotherapy,#23 Gurukrupa Layout, 80 Feet Ring Road,Nagarbhavi, Bangalore - 560072, IndiaPh(cell): +91-9989824237E-mail: [email protected]
INTRODUCTION
Breathing exercise is defined as the therapeuticintervention by which there is purposeful alteration ofa given breathing pattern.1 Breathing exercises arefundamental interventions for prevention andcomprehensive management of acute or chronicobstructive pulmonary disorders, for patients who haveundergone thoracic and abdominal surgicalprocedures, for patients with central nervous systemdeficit, for psychological conditions or for patients whoare bedridden for extended period of time.2,3 It is knownthat the regular practice of breathing exercise(Pranayama) increases parasympathetic tone, decreasessympathetic activity, improves cardiovascular andrespiratory functions, decreases the effect of stress onthe body and improves physical and mental health.4
Pranayama has been researched mostly for its beneficialapplication in treatment of cardiovascular diseases,
pulmonary disease, autonomic nervous systemimbalances and psychological or stress relateddisorders.5-7 Different forms of pranayama activatedifferent branches of the autonomic nervous system.5
Incentive Spirometry (IS), also referred as sustainedmaximal inspiration (SMI), is designed to mimic naturalsighing or yawning by encouraging the patient to takelong, slow, deep breaths by using a device that providespatients with visual or other positive feedback whenthey inhale at a predetermined flow-rate or volume andsustain the inflation for a minimum of 3 seconds.8,9
Studies have suggested that Incentive Spirometer iseffective mean as prophylaxis and as part of intensivepost-operative physiotherapy program followingcardio-thoracic and abdominal surgeries,10-13 forpulmonary hygiene with sickle cell disease and neuro-muscular diseases, as well as a rehabilitation tool withCOPD.14-16 Some of the proposed benefits of IncentiveSpirometer are - subjects can assume responsibility fortheir own treatment without any harmful side effects,thus reducing the amount of direct patient contact timewith therapist,10 provision of prolonged phase ofeffective inspiration, more controlled flow and greaterenthusiasm to practice, suitable to children and thosewith learning difficulties because it can be learnt bydemonstration.17
51. Trupti Ajudia--264-269.pmd 2/7/2013, 8:08 PM264
Indian Journal of Physiotherapy & Occupational Therapy. January-March 2013, Vol. 7, No. 1 265
STATEMENT OF PURPOSE
Studies have proven that practice of pranayamictype of breathing exercises can produce significanteffects on autonomic functions. Since, which is a SMI,is also one type of slow breathing exercises, similarresults in terms of changes in autonomic response canbe expected with use of IS-training. Therefore, thereexists the need of the study to find out the effect of IS oncardiac autonomic functions. Therefore, this study wasdesigned to assess the effect of IS on cardiac autonomicfunctions in normal healthy subjects in the age groupof 18-25 years.
SUBJECTS AND METHOD
The study was conducted at Padmashree Instituteof Physiotherapy, Bangalore on 30 male and femaleundergraduate physiotherapy student volunteers. Theinclusion criteria were: subject should be in the agegroup of 18-25 years, should be non-smoker and freefrom major health problems. Subjects who wereunwilling or unable to complete the study or had cardio-respiratory problems or were practicing any form ofregular breathing exercises were not included. Prior toparticipation, a written-informed consent was takenfrom all subjects and subjects were informed about studyprotocol. Ethical clearance for the study was obtainedfrom the Institutional Ethical Committee, PadmashreeInstitute of Physiotherapy, Bangalore as per the ethicalguidelines for Biomedical Research on Human subjects,2001 ICMR, New Delhi.
PROCEDURE
The subjects were instructed not to practice any otherphysical exercise or yogic technique other than theprescribed one. Subjects were randomly assigned toStudy group (n=15) and Control group (n=15).Autonomic function tests were performed before and 3months after the study period for both groups.
Study group: Study group subjects were giventraining to learn and perform IS. The subjects wereinstructed to perform Incentive Spirometry (MediciserTM
Respiratory Exerciser) for 10 repetitions every wakinghour for 3 months.17
The IS exercise was performed as below
- The subject was asked to sit relaxed on a chair.
- Incentive Spirometer was held with one hand; otherhand supporting the tube with mouth-piece whichwas inserted inside mouth.
- The subject was asked to inhale inside the mouth-piece till he/she can raise two balls in the Incentive
Spirometer (Third ball as a control) and sustain itfor 3 seconds.
- Same procedure was repeated for 10 times persession.
Control group: Control group subjects were notallowed to perform IS.
The autonomic function test recordings wereperformed in the afternoon (between 2 and 5 pm) at thePadmashree Diagnostic Centre, Bangalore. The subjectswere instructed not to take tea, coffee or any drinks 1hour before and any food 2 hours before the recordingsin order to exclude the effects of food and water intakeon the recordings. Before performing the test, subjectswere given enough rest of 15-20 minutes. Altogether, 30subjects completed the study and there was no dropout.
The following cardiac autonomic function tests wereperformed following the procedures described byBanister and Mathias.4,18
• Heart-rate response to Standing
The subjects were allowed to lie down for 5 min insupine position and ECG leads (GE Medical systemMAC1200 ST) were connected. The basal heart rate wasnoted from the heart-rate counter in the polygraph. Thesubject was then asked to stand up immediately andchanges in the heart-rate (HR) were recorded from thepolygraph. The manoeuver was repeated 3 times at aninterval of 5 min between each and the mean of threewas taken for recording.
• Heart-rate response to Deep Breathing
This was done with subjects in sitting posture withECG leads attached to polygraph. The subject wasasked to take a deep breath (deep inhalation followedby deep exhalation) and HR changes during theserespiratory phases were recorded from the polygraph.This procedure was repeated for 3 times at 5 min intervaland best of three was taken for calculation.
STATISTICAL ANALYSIS
Statistical analysis was performed using SPSSsoftware (version 17). Alpha value was set at 0.05.Descriptive statistics was used to find out mean andstandard deviation (SD) for demographic and outcomevariables. Chi-square test was used to test for genderdifference among both groups. Paired t-test was usedto measure the outcome variables before and aftertraining within Study and Control group. Unpaired t-test was used to test the age, height and weightdifferences among both groups and also to measureoutcome variables between Study and Control group.
51. Trupti Ajudia--264-269.pmd 2/7/2013, 8:08 PM265
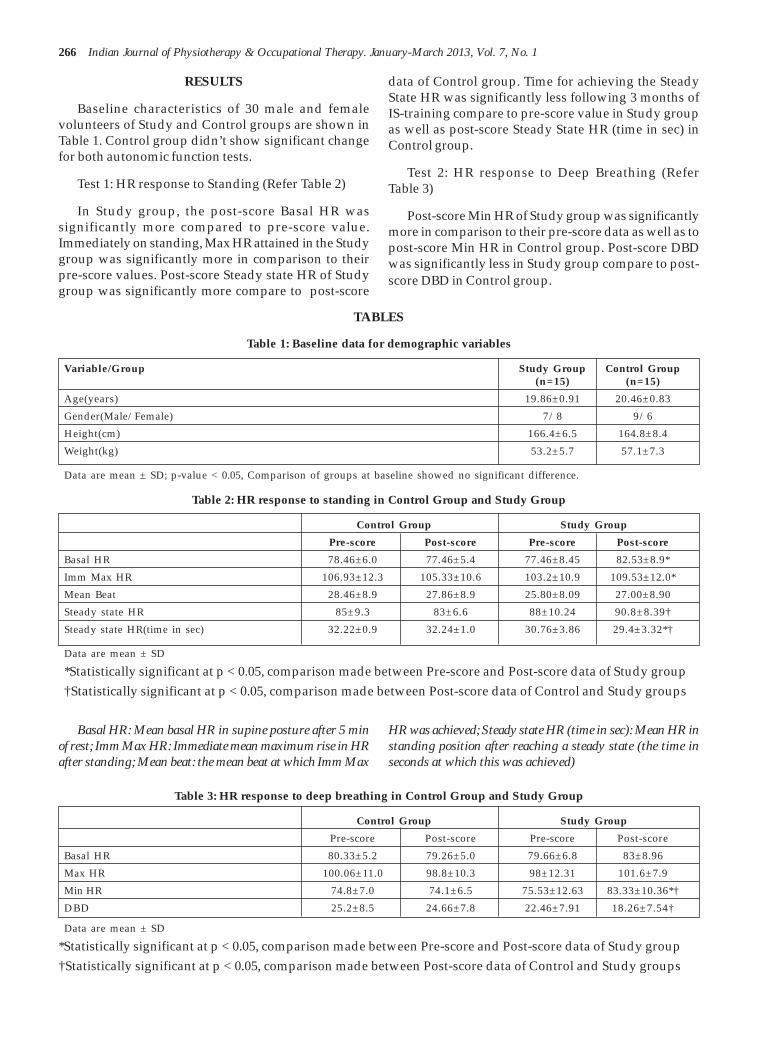
266 Indian Journal of Physiotherapy & Occupational Therapy. January-March 2013, Vol. 7, No. 1
RESULTS
Baseline characteristics of 30 male and femalevolunteers of Study and Control groups are shown inTable 1. Control group didn’t show significant changefor both autonomic function tests.
Test 1: HR response to Standing (Refer Table 2)
In Study group, the post-score Basal HR wassignificantly more compared to pre-score value.Immediately on standing, Max HR attained in the Studygroup was significantly more in comparison to theirpre-score values. Post-score Steady state HR of Studygroup was significantly more compare to post-score
data of Control group. Time for achieving the SteadyState HR was significantly less following 3 months ofIS-training compare to pre-score value in Study groupas well as post-score Steady State HR (time in sec) inControl group.
Test 2: HR response to Deep Breathing (ReferTable 3)
Post-score Min HR of Study group was significantlymore in comparison to their pre-score data as well as topost-score Min HR in Control group. Post-score DBDwas significantly less in Study group compare to post-score DBD in Control group.
TABLES
Table 1: Baseline data for demographic variables
Variable/Group Study Group Control Group(n=15) (n=15)
Age(years) 19.86±0.91 20.46±0.83
Gender(Male/Female) 7/8 9/6
Height(cm) 166.4±6.5 164.8±8.4
Weight(kg) 53.2±5.7 57.1±7.3
Data are mean ± SD; p-value < 0.05, Comparison of groups at baseline showed no significant difference.
Table 2: HR response to standing in Control Group and Study Group
Control Group Study Group
Pre-score Post-score Pre-score Post-score
Basal HR 78.46±6.0 77.46±5.4 77.46±8.45 82.53±8.9*
Imm Max HR 106.93±12.3 105.33±10.6 103.2±10.9 109.53±12.0*
Mean Beat 28.46±8.9 27.86±8.9 25.80±8.09 27.00±8.90
Steady state HR 85±9.3 83±6.6 88±10.24 90.8±8.39†
Steady state HR(time in sec) 32.22±0.9 32.24±1.0 30.76±3.86 29.4±3.32*†
Data are mean ± SD
*Statistically significant at p < 0.05, comparison made between Pre-score and Post-score data of Study group†Statistically significant at p < 0.05, comparison made between Post-score data of Control and Study groups
Basal HR: Mean basal HR in supine posture after 5 minof rest; Imm Max HR: Immediate mean maximum rise in HRafter standing; Mean beat: the mean beat at which Imm Max
HR was achieved; Steady state HR (time in sec): Mean HR instanding position after reaching a steady state (the time inseconds at which this was achieved)
Table 3: HR response to deep breathing in Control Group and Study Group
Control Group Study Group
Pre-score Post-score Pre-score Post-score
Basal HR 80.33±5.2 79.26±5.0 79.66±6.8 83±8.96
Max HR 100.06±11.0 98.8±10.3 98±12.31 101.6±7.9
Min HR 74.8±7.0 74.1±6.5 75.53±12.63 83.33±10.36*†
DBD 25.2±8.5 24.66±7.8 22.46±7.91 18.26±7.54†
Data are mean ± SD
*Statistically significant at p < 0.05, comparison made between Pre-score and Post-score data of Study group†Statistically significant at p < 0.05, comparison made between Post-score data of Control and Study groups
51. Trupti Ajudia--264-269.pmd 2/7/2013, 8:08 PM266

Indian Journal of Physiotherapy & Occupational Therapy. January-March 2013, Vol. 7, No. 1 267
Basal HR: Mean HR in sitting posture after 5 min of rest;Max HR: Mean maximum HR recorded during deepinspiration; Min HR: Mean minimum HR recorded duringdeep expiration; DBD: Difference in HR between themaximum during inspiration and the minimum during theexpiration
DISCUSSION
The baseline data of the demographic and outcomevariables did not show any statistically significantdifference between the subjects in the Study and Controlgroups.
Test 1: HR response to Standing
In normal resting subject, Basal HR is the functionof parasympathetic system.4 In this study, significantincrease in post-score Basal HR in Study groupindicates that the practice of IS may be improvingsympathetic activity.
On immediate standing, HR increases andcontinues to rise for next several seconds.19,20 Followingthis, HR falls to minimum and then rises again tostabilize at Steady State HR.4 HR response to Standingassesses the integrity of parasympathetic cardiovagalfunction.19 In this study, post-score Imm Max HR wassignificantly more in Study group. However, it may beargued that the maximum increase in HR was more inStudy group because their post-score Basal HRfollowing 3 months of IS-training was more.
Following standing from supine position,subsequent HR changes are baroreceptor mediatedwhich enhance sympathetic tone.19 Therefore,significant increase in Steady State HR in Study groupindicates that there may be improvement in sympatheticactivity.
In this study, the stabilization of heart rate followingthe standing occurred in less time compare to its pre-study counterpart which indicates that there may beimprovement in parasympathetic activity. Study doneby G. K. Pal (2004) showed that Steady state HR (Timein sec) was reduced by more than 100 seconds toconsider it as increased parasympathetic activity.4
However, in this study, reduction in Steady State HR(Time in sec) within Study group and in between Studyand Control groups were 1.36 sec and 2.84 secrespectively, which were negligible changes. Therefore,30:15 ratio could be considered as more appropriatemeasure of parasympathetic function.21
Test 2: HR-response to Deep Breathing
Following HR-response to Deep Breathing, post-score Min HR was significantly more in Study groupcompare to post-score Min HR in control group. Thevariation of HR with respiration is known as SinusArrhythmia, which is generated by autonomic reflexes.Inspiration increases HR and expiration deceases HRi.e. during inspiration, vagal activity decreases andsympathetic activity increases. Opposite mechanismoccurs during expiration.4,19 Thus, increase in Min HRduring expiration in present study indicates that theremay be predominance of sympathetic activity.
Significant decrease in DBD following 3 months ofIS-training in Study group indicates that there may beincrease in sympathetic activity.
Previous studies have suggested that well-performed slow, yogic breathing decreases sympatheticactivity.4,21-24 However, in this study, most of thevariables of cardiac autonomic function tests wereindicating marked increase in sympathetic reactivity.Possible reasons for obtaining this result may be asfollowing:
In this study, IS, which is considered as slow andsustained maximal inspiration, is performed for 10repetitions per session without focusing on expiration.Previous study has shown that stimulation of carotidchemo- or baroreceptors can evoke reflex bradycardia,but such reflex effects are wholly or partly blockedduring inspiratory phase of breathing by central neuralinspiratory mechanisms and by the central actions ofsensory nerves from the lungs.25
Additionally, hyperventilation resulting from slowand sustained maximal inspiration through IncentiveSpirometer without focusing on expiration phase couldbe one of the possible mechanisms for gettingsympathetic predominance response becausehyperventilation is a powerful physiological stimulusand induces tremendous sympathetic stimulation.26
Moreover, in this study, IS was performed via mouth.Some studies have suggested that because breathingmechanism (nerve innervation) is situated in the noseand not in the mouth; nose breathing becomes thefunction of parasympathetic nervous system.27 Studiesdone by Dr Douillard mentions that on a physiologicallevel, nose breathing enhances deep breathing whichcontracts diaphragm and makes us breathe moreefficiently by pulling more air into lower lobes of lungs.Chest breathing through mouth fill the middle and
51. Trupti Ajudia--264-269.pmd 2/7/2013, 8:08 PM267

268 Indian Journal of Physiotherapy & Occupational Therapy. January-March 2013, Vol. 7, No. 1
upper lobes but tends not to engage lower lobes, whichhost many of parasympathetic nerve receptors.28
Limitations of the study were – small sample size,data collection from one place which may limit thegeneralizability of the findings, not performing IS-training under closed supervision of the therapist andautonomic function tests recording in afternoon timewhich may have influence on autonomic function.
Future recommendations are - conducting the studywith larger sample size with inclusion of subjects fromvarious sources under closed-supervised IS-training.There is further research scope to investigate effect ofIS-training on pulmonary autonomic functions.
Conclusion - Most of the variables of cardiacautonomic function tests were showing markedimprovement in sympathetic activity and so 3 monthspractice of IS is showing considerable increase insympathetic activity.
Acknowledgement/Source of support/Conflicts ofInterest: Nil
REFERENCES
1. Claudia R. Breathing exercises: In Cynthia CoffinZadai. Pulmonary Management in PhysicalTherapy. 1st ed. NY (USA):Churchill LivingstoneInc.,1992:135.
2. Carolyn Kisner, Lynn Allen Colby. Therapeuticexercise - foundations and techniques. 4th ed. NewDelhi:Jaypee Brothers Medical Publishers (P)Ltd.,2002:749.
3. Donna L. Frownfelter. Chest Physical Therapyand Pulmonary Rehabilitation - AnInterdisciplinary Approach. 2nd ed. St.Louis(USA):Mosby Year Book MedicalPublisher,1987:233.
4. GK Pal, S. Velkumary, Madanmohan. Effect of shortterm practice of breathing exercises on autonomicfunctions in normal human volunteers. IndianJournal of Medical Research 2004 August:115-21.
5. Ravider J, John WE, Vernon A., Vandna J.Physiology of long pranayamic breathing: Neuralreapiratory elements may provide a mechanismthat explains how slow deep breathing shifts theautonomic nervous system. Med Hypotheses2006;67(3):566-71.
6. Carlos H, Renato A, Denise G, Maria J.Spontaneous respiratory modulation improvescardiovascular control in essential hypertension.Arq. Bras. Cardiol 2007 June;88(6):576-83.
7. Brown RP, Gerbarg PL. Sudarshan Kriya yogicbreathing in the treatment of stress, anxiety, anddepression: part I - neurophysiologic model. JAltern Complement Med. 2005 Feb;11(1):189-201.
8. AARC Clinical Practice Guideline: IncentiveSpirometry. Respir Care 1991;36:1402-05.
9. Robert L, James K, Craig L, David C. Egan’sFundamentals of Respiratory Care. 8th ed. MosbyInc;June 2003:866.
10. Tom J, Catherine M, S Deborach, Christina B,Birgitta I, Catherine T. The effect of IncentiveSpirometry on post-operative pulmonarycomplications - A systematic review. CHEST 2001Sep;120(3):971-78.
11. Patricia C. The relationship between dyspnea andblood pressure in Chronic Obstructive PulmonaryDisease. J Cardiovasc Nurs. 2007 Sep/Oct;22(5):351-58.
12. Hall JC, Tarala R, Harris J, Tapper J, ChristiansenK. Incentive Spirometry Versus routine chestphysiotherapy for prevention of pulmonarycomplications after abdominal surgery. Lancet1991 April 20;337(8747):953-56.
13. Westwood K., Griffin M, Roberts K, Williams M,Yoong K, Digger T. Incentive spirometry decreasesrespiratory complications following majorabdominal surgery. Surgeon 2007 Dec;5(6):339-42.
14. Ong GL. Incentive Spirometry for children withsickle cell disease. Nurs Times. 18 October2005;101(42):55-57.
15. Basoglu O.K., Atasever A., Bacakoglu F. Theefficacy of Incentive Spirometry in patients withCOPD. Respirology 2005;10:349-53.
16. Pruitt B, Jacobs M. Clearing away pulmonarysecretions. Nursing 2005;35:37-41.
17. Alexandra Hough. Physiotherapy in RespiratoryCare - An evidence-based approach to respiratoryand cardiac management. 3rd ed. Cheltenham(UK):Nelson Thorness Ltd.,2001:153,156.
18. Bannister R, Mathias CJ. Investigations ofautonomic disorders. Autonomic failure – A textbook of clinical disorders of the autonomicnervous system. 3rd ed. San Francisco:OxfordUniversity Press,1992:225-90.
19. UK Misra, J Kalita. Clinical Neurophysiology –Nerve Conduction, Electromyography and EvokedPotentials. ELSEVIER:101.
20. GK Pal & Pravati Pal. Textbook of PracticalPhysiology. 2nd ed. Chennai(India):OrientLongman Private Limited,2005:301.
21. Pramanik T, sharma HO, Mishra S, Prajapati R,Singh S. Immediate effect of slow pace bhastrika
51. Trupti Ajudia--264-269.pmd 2/7/2013, 8:08 PM268

Indian Journal of Physiotherapy & Occupational Therapy. January-March 2013, Vol. 7, No. 1 269
pranayama on blood pressure and heart rate. JAltern Complement Med. 2009 Mar;15(3):293-5.
22. Bernardi L, Gabutti A, Porta C, Spicuzza L. Slowbreathing reduces chemoreflex response tohypoxia and hypercapnia, and increasesbaroreflex sensitivity. J Hypertens. 2001Dec;19(12):2221-9.
23. R Bhargava, MG Gogate, JF Mascarenhas.Autonomic responses to breath holding and itsvariations following pranayama. Indian journalof physiology and pharmacology 1988;32(4):257-64.
24. Shirley Telles, T Desiraju. Oxygen consumptionduring pranayamic type of very slow-ratebreathing. Indian J Med Res. 1991 Oct;94:357-63.
25. SC Gandevia, DI McCloskey, Erica K. Reflexbradycardia occurring in response to Diving,
Nasopharyngeal stimulation and Occularpressure, & its modification by Respiration andSwallowing. J. Physiol. 1978;276:383-94.
26. Dr KK Deepak. The role of autonomic nervoussystem in rapid breathing practices. Departmentof Physiology, All India Institute of MedicalSciences, New Delhi(India): p.42-45. (Available at:http://aolresearch.org/pdf/other/Deepak.pdf)
27. Nose Breathing Research & Benefits – NBMhomepage. Available at http://www.nosebreathe.com/benefits.html. (Accessibleon date: 10/01/2011)
28. Susan Moran. Going the Distance - Yogicbreathings can make any kind of workout easierand enjoyable. Yoga Journal (Health) 2007February:39-41.
51. Trupti Ajudia--264-269.pmd 2/7/2013, 8:08 PM269

270 Indian Journal of Physiotherapy & Occupational Therapy. January-March 2013, Vol. 7, No. 1
Concurrent Validity of Clinical Chronic ObstructivePulmonary Disease (COPD) Questionnaire (CCQ) in South
Indian Population
C.M. Herbert1, V.K. Nambiar2, M. Rao3, S. Ravindra4
1Clanical Physiotherapist, Dubai Medical Centre, 2Associate Professor, Dept. of Physiotherapy, 3Professor & Head, Dept.of Chest Medicine, 4Professor & Head, Dept. of Physiotherapy, .M.S.Ramaiah Medical College & Teaching Hospital,
Bangalore
ABSTRACT
Background: Chronic Obstructive Pulmonary Disease (COPD) is a progressive disease associatedwith a high level of disability, the treatment of which is aimed at reducing symptoms, increasingfunction and improving the quality of life of the patient with lot of emphasis been given to thedevelopment of a Health Related Quality Of Life (HRQOL) questionnaire. St. George's RespiratoryQuestionnaire (SGRQ) is a self administered validated questionnaire used in COPD. The ClinicalCOPD Questionnaire (CCQ) was developed as a simple tool to help clinicians identify the clinicalstatus of airways in individuals with COPD. Hence there is a need to validate the CCQ to identify thehealth status of those with COPD in Indian population.
Aims: To measure and compare the scores and time taken with SGRQ and CCQ respectively in COPDsubjects.
Methodology: A convenience sample of 35 COPD subjects, were asked to answer the SGRQ and CCQ.
Results: Pearson correlation and Student's t-test were used for statistical analysis and it was foundthat the three individual components of CCQ correlated with those of the SGRQ (r =0.909, p<0.001).
Conclusion: CCQ can be considered at par with SGRQ to assess the HRQOL in individuals with COPDin South Indian population.
Keywords: St. George's Respiratory Questionnaire, Clinical COPD Questionnaire, Chronic ObstructivePulmonary Disease.
Corresponding author:V.K. NambiarAssociate Professor,Dept. of Physiotherapy,M.S. Ramaiah Medical Teaching Hospital,MSR Nagar,MSRIT Post,Bangalore - 560 054E-mail ID: [email protected]
INTRODUCTION
Chronic Obstructive Pulmonary Disease (COPD) isthe major cause of morbidity and mortality throughoutthe world. It is currently the 4th major cause of death inthe world. The death rate from the disease has increasedin the recent decades in apparent association withincrease in cigarette smoking and air pollution.1
Globally, by 2020, COPD is expected to rise to the 3rd
position as a cause of death and at 5th position as thecause of loss of Disability Adjusted Life Years (DALYs)
according to the baseline projections made in the GlobalBurden of Disease Study (GBDS).2
In India, about 5% males and 2.7% females above 30years of age have been estimated to be suffering fromCOPD. There is a significant burden of COPD as adisease in the Indian community with overallprevalence of 6.85% in South India; with the prevalenceof males being 7.4% and females being 4.64%.3
It is known that in addition to the primary organdysfunction, impaired skeletal muscle performance isa strong predictor of low exercise capacity in subjectswith severe COPD.4 Progressive decrease in functionalactivity and exercise performance in subjects with severeCOPD is found.5 The perception of the dyspnoeaworsens with the sudden onset of high intensityconstant work rate exercise. Further such dyspnoea isfound to affect the activities of daily living (ADL).6
According to GOLD (Global Obstructive Lung Diseases)guidelines, the goals of clinical control in patients withCOPD include Health Related Quality of Life (improved
52. veena kiran--270-273.pmd 2/7/2013, 8:08 PM270

Indian Journal of Physiotherapy & Occupational Therapy. January-March 2013, Vol. 7, No. 1 271
exercise and emotional function) and clinical goals(prevention of disease progression and minimizationof symptoms).7 In recent years, a great deal of attentionhas been paid to developing and validating “quality oflife” questionnaires for individuals with COPD, in orderto identify and treat the functional as well as theemotional problems that are most important to thosesuffering from the disease.7Health Related Quality OfLife (HRQOL) has been defined as the “functional effectof an illness and its consequent therapy, upon a patient,as perceived by the patient”. HRQOL questionnairesallow the clinicians to measure directly the impact ofthe disease on an individual’s Activities of Daily Life.8
St George Respiratory Questionnaire (SGRQ) is asupervised, self administered, reproducible, valid andresponsive instrument chosen as the gold standard toassess the HRQOL in Indian individuals with COPD.Clinical COPD Questionnaire (CCQ) is a selfadministered questionnaire specially developed as asimple tool to help clinicians identify the clinical statusof airways in the individuals with COPD. Since theCCQ, which is a shorter and easier questionnaire, hasnot been validated for the Indian environment, the aimof the present study is to validate the CCQ and establishits effectiveness in comparison to the SGRQ, in SouthIndian population
MATERIALS AND METHOD
An ethical clearance was issued from the institutionprior to the study. A convenience sampling was done. Itwas a cross sectional study with 35 subjects inclusiveof both males and females between 35 and 60 years ofage, diagnosed with COPD(all stages according toGOLD standard) and having good Englishcomprehension. Subjects with any neurological ororthopedic dysfunction, recent surgeries and othercardiopulmonary dysfunction were excluded from thestudy. The source of data collection was from M. S.Ramaiah Teaching Hospitals. On the day of the firstsession, the subject was handed out the SGRQ and askedto fill it up in the presence of the examiner. After twodays, subjects were given the CCQ and asked to do thesame. The scores of the individual components as wellas the overall total were separately calculated for eachof the questionnaires. Time taken by each patient foreach of the questionnaires was also recorded using astop watch.
STATISTICS
Data was analyzed by using SPSS 15.0, Stata 8.0,MedCalc 9.0.1 and Systat 11.0. Microsoft word and Excelwere used to generate tables, graphs, etc. StatisticalMethod: Descriptive statistical analysis has been carriedout in the present study. Results on continuousmeasurements are presented on Mean ± SD (Min-Max)and results on categorical measurements are presented
in Number (%).Significance is assessed at 5 % level ofsignificance. Statistical Tests: Pearson correlation wasperformed to assess the correlation between thecomponent scores and the total scores of CCQ andSGRQ. Student’s t-test has been used to find thesignificance of the correlation between the componentscores and the total scores of CCQ and SGRQ.
RESULTS
Out of the 35 subjects, there were 29 males and 6females. The scores of SGRQ – Symptoms componentwas a mean of 55.59 ± 24.93; Activity component was66.32 ± 15.94; Impact component was 49.93 ± 18.39and total scores were a mean of 53.69 ± 16.29(Table 1).The scores of CCQ – Symptoms domain was a mean of3.11 ± 1.40; Functional state domain was 3.75 ± 1.08;Mental state domain was 2.91 ± 1.18 and total scoreswere a mean of 3.32 ± 0.99 (Table 2). The symptomcomponent of CCQ had a good correlation with thesymptom component of SGRQ (r=0.955, p<0.001); thefunctional state component of CCQ correlated well withactivity component of SGRQ (r=0.821, p<0.001); themental state component of CCQ correlated well withthe impact component of SGRQ (r=0.886, p<0.001). Theoverall total score of 50 questions of SGRQ and the 10questions of CCQ showed a very high correlation(r=0.909, p<0.001) (Table 3) and (Figure 3) .It takes acomparatively less duration of time to complete the CCQas compared to SGRQ ( Table 4).
Table 1. Descriptive statistics of St. George respiratoryQuestionnaire (SGRQ).
SGRQ Min-Max Mean ± SD
*SG-Symptoms 6.25-93.75 55.59±24.93
SG-Activity 25.88-88.88 66.32±15.94
SG-Impact 9.09-78.78 49.93±18.39
SG-Total 11.68-79.50 53.69±16.29
The table shows the mean scoring of eachcomponent of SGRQ i.e. symptoms, activity and impact;and the mean of the total scoring of SGRQ. *SG-represents SGRQ.
Table 2: Descriptive statistics of Clinical COPDquestionnaire (CCQ).
CCQ Min-Max Mean ± SD
*C-Symptoms 0.50-12.00 3.11±1.40
C-Functional 1.25-5.75 3.75±1.08
C-Mental 0.50-8.00 2.91±1.18
C-Total 0.80-5.40 3.32±0.99
The table shows the mean scoring of each componentof CCQ i.e. symptoms, functional state and mentalstate; and the mean of the total scoring of CCQ. *C-represents CCQ
52. veena kiran--270-273.pmd 2/7/2013, 8:08 PM271

272 Indian Journal of Physiotherapy & Occupational Therapy. January-March 2013, Vol. 7, No. 1
Table 3: Pearson Correlation of CCQ with SGRQ
Pearson correlation r value P value
SG-Symptoms vs C-Symptoms 0.955 <0.001**
SG-Activity vs C-Functional 0.821 <0.001**
SG-Impact vs C-Mental 0.886 <0.001**
SG-Total vs C-total 0.909 <0.001**
Each of the components and the total of CCQ aresignificantly correlated with those of SGRQ .CCQ canpredict the SG by 82.8% accuracy.
Figure 3 : Correlation scatter plot between the totalscoring of SGRQ and total scoring of CCQ;
and the 10 questions of CCQ showed a very highcorrelation (r=0.909, p<0.001) (table 3 and figure 3).Theindividual components of CCQ significantly correlatedwith each of the components of SGRQ (table 3). Thusthe CCQ can be considered at par with the SGRQ. Anyincrease in any of the components or the total of SGRQwould mean an increase in the correspondingcomponent or total of CCQ. Both questionnaires havethree components each. SGRQ, which has a total of 50questions, is divided into symptoms component (8questions), activity component (9 questions) and impactcomponent (33 questions). It includes all possiblequestions that are asked in order to assess the overallstatus of the patient and the impact COPD has onpeople suffering from the disease. On the other handCCQ has a total of 10 questions and is divided intothree similar components – symptoms (4 questions),functional state (4 questions) and mental state (2questions). CCQ has been developed by selection ofpotential questions that assess the quality of life ofpeople suffering from COPD by experts in the field.Hence the 10 questions of CCQ include the importantand relevant questions to be answered in order to assessthe HRQOL in individuals suffering from COPD.8 Fromthe present study, CCQ has shown a very highcorrelation with SGRQ. Hence it is apparent that CCQcan be used to assess the HRQOL in Indians who haveCOPD. Since this study has been done on a populationof South Indians, it can be concluded that CCQ has aconcurrent validity in South Indian population whencompared to SGRQ. The CCQ takes a appreciablyshorter duration of time to administer as there are only10 questions to be answered as compared to the 50questions of SGRQ. Thus CCQ has the added advantageof being easier and quicker to administer, thus can beused as a quick tool to assess the HRQOL of SouthIndians who have COPD.
FUTURE STUDIES
Validation of the CCQ could be done for a greaterpopulation covering larger geographical area in India.
CONCLUSION
There was a strong correlation between the StGeorge Respiratory Questionnaire (SGRQ) and theClinical COPD Questionnaire (CCQ); hence CCQ canbe considered at par with the SGRQ in South Indianpopulation. The CCQ is easy to score and allows datato be quickly collected. It is thus suitable for use ineveryday practice for clinical trials or quality of caremonitoring, of individuals with COPD, in South India.
SGRQ -
total
CCQ - total
The total score of SGRQ (Y-axis) is showing a highcorrelation with the total score of CCQ (X-axis).
Table 4: Time taken to administer the SGRQ and CCQ
Questionnaire Min-Max Mean ± SD(minutes) (minutes)
SGRQ 11.05-16.25 13.50±0.96
CCQ 2.00-4.40 2.99±0.71
It takes a comparatively less duration of time tocomplete the CCQ.
DISCUSSION
The (CCQ) has been deemed as a valid and reliabletool to measure the Health Related Quality Of Life(HRQOL) in individuals with COPD and has beenconsidered to be at par with the (SGRQ) in Netherlands,Italy and Sweden.7,8,9 The validation of a questionnaireis linked to the place and population where it isadministered. SGRQ has been validated in the Indianpopulation, but the CCQ has not been validated. SGRQhas been chosen as the gold standard as it is wellvalidated, frequently used in COPD trials, it is availablein Hindi and it was used in the original validation ofCCQ.10 The overall total score of 50 questions of SGRQ
52. veena kiran--270-273.pmd 2/7/2013, 8:08 PM272

Indian Journal of Physiotherapy & Occupational Therapy. January-March 2013, Vol. 7, No. 1 273
ACKNOWLEDGEMENT
The authors wish to thank Dr. S. Kumar, Presidentof Medical Education at M.S. Ramaiah Medical College,Dr. Eva Wikstrom Jonsson, author, KarolinskaUniversity Hospital Solna, Stockholm, Sweden andreferring Doctors and Physiotherapists, who providedthe subjects for the study.
REFERENCES
1. G. Viegi, F. Pistelli et al. “Definition, epidemiologyand natural history of COPD.” Eur Respir J; 2007;30: 993–1013.
2. Jindal, Surinder K et al. “Emergence of chronicobstructive pulmonary disease as an epidemic inIndia.” Indian Journal of Medical Research; Dec2006.
3. K.J.R. Murthy, J.G. Sastry et al. “Economic burdenof chronic obstructive pulmonary disease.”NCMH Background Papers Burden of Disease inIndia, 2005.
4. Harry R Gosker et al. “Skeletal muscle dysfunctionin chronic obstructive pulmonary disease andheart failure: underlying mechanisms and therapyperspectives.” American Journal of ClinicalNutrition; 2000; 71(5); 1033-1047.
5. Francois Maltais et al. “Oxidative enzymeactivities of the vastus lateralis muscle and thefunctional status in patients with COPD.” Thorax;2000; 55; 848 – 853.
6. Luis Puente – Maestu et al. “Dyspnea, VentilatoryPattern, and Changes in the DynamicHyperinflation Related to the Intensity of ConstantWork Rate Exercise in COPD.” CHEST; 2005; 128;651 – 656.
7. Salvatore Damato, Chiara Bonatti et al. “Validationof the Clinical COPD questionnaire in Italianlanguage.” Health and Quality of Life Outcomes,2005; 3:9.
8. Thys van der Molen et al. “Development, validityand responsiveness of the Clinical COPDQuestionnaire.” Health and Quality of LifeOutcomes, 2003; 1:13.
9. Bjorn Stallberg et al. “Validation of clinical COPDquestionnaire (CCQ) in primary care.” Health andQuality of Life Outcomes, 2009; 7:26.
10. Ashutosh N. et al. “Validation of Hindi Translationof St. George’s Respiratory Questionnaire in IndianPatients with Chronic Obstructive PulmonaryDisease.” Indian J Chest Dis Allied Sci; 2007; 49:87-92.
52. veena kiran--270-273.pmd 2/7/2013, 8:08 PM273

274 Indian Journal of Physiotherapy & Occupational Therapy. January-March 2013, Vol. 7, No. 1
To Study the effect of Mental Practice on one Leg StandingBalance in Elderly Population
Vidya V Acharya1, Saraswati Iyer2
1M.P.Th., 2Professor, Seth G.S.Medical College & K.E.M. Hospital, Parel, Mumbai
ABSTRACT
Purpose of study is: to compare "effect of only physical practice" with " effect of physical practice andmental practice" in subjects, for activity of one leg standing.
Materials used: table, chair, cassette and record player, stop-watch, newspaper.
Methodology: 80 independently ambulatory subjects (age group 50-70yrs) were randomly selectedand divided into 2 intervention groups of 40 each. Task was to stand on the preferred leg with arms byside and one legged balance time was measured. Two sessions (1st & 2nd) of the task, of 5 days each,were given to subjects at a periodic gap of 30 days. Baseline and final measurements of one leggedbalanced time were compared after a three days practice intervention period.
Group I (n=40, 20 male s and 20 females) performed only physical practice in both sessions (1st & 2nd)and Group II, (n=40, 20 males and 20 females) performed only physical practice in 1st session and in2nd session performed physical practice interspersed with mental practice. Mental Practice involveduse of idealized visual and kinesthetic mental images provided to subjects through recorded tape.
Results: Percentage improvement in balance time in both sessions was compared and statistical analysiswas done by paired 't' test and 'z' test. All groups showed improvement, but Group II showed the mostimprovement in 2nd session, of 33.01% in males and 31% in female's resp. ('p' < 0.001). Comparison ofpercent improvement between Group I and II, showed an increment of 10% in balance time of group IIin its 2nd session('p' < 0.001,HS).Thus showing that balance time increased significantly with physicalpractice interspersed with mental practice.
Conclusion: Our study concludes that Mental Practice along with Physical Practice may hence be animportant therapeutic tool to encourage rapid acquisition of a motor skill.
Keywords: Mental Practice, Physical Practice, One Leg standing Balance
INTRODUCTION
Major concern of physical therapist is movement –its acquisition, quality and retention. Primary aim ofphysical therapist is to maximize patient’s movementpotential. So focus is on physical techniques, forteaching new motor skills to patients.1 However it isnot always possible to carry out task under guidance oftherapist.
Hence Mental practice, which is cognitive rehearsalof a physical skill in absence of any gross muscularmovement, can be an utilized as a clinical tool inassisting patients, to rapidly learn a motor task. 1
A major concern of physical therapists with allpatients, but especially with elderly, is balance. Theincreased postural sway seen with age is correlated
with loss of balance and increased incidence of falls inelderly2.Therefore, balance is selected as physical taskto test the effect of mental practice on.
MATERIAL AND METHOD
Materials
Table, chair, cassette and record player, stop-watch,newspaper.
ii. Method
a. Inclusion Criteria
Age group: 50 to 70 years.
All subjects are independently ambulatory withoutassistive device.
53. Vidya Acharya--274-279.pmd 2/7/2013, 8:08 PM274

Indian Journal of Physiotherapy & Occupational Therapy. January-March 2013, Vol. 7, No. 1 275
b. Exclusion Criteria
Subjects with orthopaedic, neurological,uncontrolled diabetes, uncontrolled blood pressureproblem, significant hearing and vision loss andpsychological problems were excluded.
c. Selection of Subjects
Group Subjects Sex Number Age Mean Age(yrs) (yrs)
I PP and ONLY PP FM 2020 50-70 59.22
II PP and PP + MP 2020 2020 50-70 59.12
PP=PHYSICAL PRACTICE
MP=MENTAL PRACTICE
d. Study Procedure
A short verbal health care history was taken.
SESSION I
Each subject from group I and group II stood onpreferred leg and lifted other foot. Arms were held byside and time was measured using a stopwatch untillifted foot contacted ground.
An average of three readings of measured time wastaken to have a baseline value on day 1. Group I & IIsubjects carried out physical practice of activity for nextthree days. Final value of balance time was taken froman average of three readings on day 5. On day 2,3,4:reading task was given, which distracted attention fromoriginal activity. So on day 2,3,4 group I & II subjectstook:
PHYSICAL Reading PHYSICAL Reading PHYSICALPRACTICE Session PRACTICE Session PRACTICE
SESSION II
After a month Group I subjects took only physicalpractice same as they took in previous month.
Group II took physical practice and mental practiceof the activity.
Baseline and final measurements of balance time ofboth groups were taken again on day 1 and day 5respectively.
Group II subjects listened to recorded speechthrough record player. Speech consisted of detailsregarding balance activity & relaxation. The capabilityof subjects to concentrate and perceive recorded speechwas measured on Likert’s scale.
Likert’s Scale
1. did not understand
2. understood little
3. understood satisfactorily
4. understood properly
5. understood properly and completely.
Group II subject’s Likert’s scale response was 4,5after tape session.
So on day 2, 3, 4 group II subjects took
PHYSICAL Tape PHYSICAL Tape PHYSICALPRACTICE Session PRACTICE Session PRACTICE
FINDINGS
Results And Observations
Percent improvement in balance time in bothsessions was compared and statistical analysis wasdone by paired‘t’ test and ‘z’ test.
Group I (Males)
Day 1 Day 5 % improvement t- value p- value
P. P1st 54 ± 36.57 62.15 ± 37.13 17.45 ± 10.37 7.52 < 0.001session
P. P 2nd 55.95 ± 36.78 67.60 ± 38.56 21.88 ± 10.97 8.89 < 0.001session
During 1st session,% improvement in response forbalance time is 17.45.This increase is statistically highlysignificant at p<0.001,which indicates response on day5 is likely to be much more as compared to day 1 due tophysical practice.
During 2nd session,% improvement in response forbalance time is 21.88.This increase is statistically highlysignificant at p<0.001,which indicates response on day5 is likely to be much more as compared to day 1 due tophysical practice.
Group I (Females)
Day 1 Day 5 % improvement t- value p- value
P. P1st 59.85 ± 44.70 70.65 ± 46.54 19.25 ± 10.62 7.52 < 0.001session
P. P 2nd 62.30 ± 45.96 78.20 ± 49.48 23.99 ± 12.30 8.89 < 0.001session
During 1st session,% improvement in response forbalance time is 19.25%.This increase is statisticallyhighly significant at p<0.001,which indicates responseon day 5 is likely to be much more as compared to theday 1 due to physical practice.
During 2nd session,% improvement in response forthe balance time is 23.99%.This increase is statisticallyhighly significant at p<0.001,which indicates responseon day 5 is likely to be much more as compared to day1 due to physical practice.
53. Vidya Acharya--274-279.pmd 2/7/2013, 8:08 PM275

276 Indian Journal of Physiotherapy & Occupational Therapy. January-March 2013, Vol. 7, No. 1
Group II (Males)
Day 1 Day 5 % improvement t- value p- value
P. P1st 50.30 ± 29.30 61.65 ± 34.97 19.48 ± 9.98 8.27 < 0.001session
P. P + 52.75±29.89 77.20 ± 40.57 33.01 ± 11.86 12.44 < 0.001M.P2nd
session
During 1st session,% improvement in response forbalance time is 19.48%.This increase is statisticallyhighly significant at p<0.001,which indicates responseon day 5 is likely to be much more as compared to day1 due to physical practice.
During the 2nd session,% improvement in responsefor balance time is 33.01%.This increase is statisticallyhighly significant at p<0.001,which indicates responseon day 5 is likely to be much more as compared to day1 due to physical practice and mental practice.
Group II (Females)
Day 1 Day 5 % improvement t- value p- value
P. P1st 52.60 ± 39.51 61.85 ± 41.38 19.00 ± 10.001 8.48 < 0.001session
P. P + 55.60 ± 38.46 77.30 ± 42.73 31.79 ± 12.86 11.04 < 0.001M. P2nd
session
During 1st session,% improvement in response forbalance time is 19%.This increase is statistically highlysignificant at p<0.001,which indicates response on day5 is likely to be much more as compared to the day 1due to physical practice.
During 2nd session,% improvement in response forbalance time is 31.79%.This increase is statisticallyhighly significant at p<0.001,which indicates responseon day 5 is likely to be much more as compared to theday 1 due to physical practice and the mental practice.
Comparison of Average % Improvement Between 1st and 2nd Session in Males and Females.
Subjects % % % Difference t- value p- valueImprovement I Improvement II improvement
Group I Males PP 17.45 21.88 4.33 8.18 P < 0.001
FemalesPP 19.25 23.99 4.74 6.74 P < 0.001
Group II MalesMP + PP 19.48 33.01 13.53 11.67 P < 0.001
FemalesMP + PP 19.00 31.79 12.79 11.91 P < 0.001
From above table maximum improvement is seen with Group II carrying out physical practice and mental practicein second session.
Comparison of Overall Average % Improvement Between Group I and Group II in the 1st and 2nd Session.
Group-I Group-II z- value p- value(M+F) (M+F)
% Improvement1st Session 18.35 + 10.49P.P 19.24 + 9.999P.P 0.3 NS
% Improvement2nd Session 22.93 + 11.69P.P 32.4 + 12.37P.P 3.53 P < 0.001(HS)
From above table we can infer that
Comparison between Group I and II is statisticallynot significant in first session, which indicates thatoverall improvement between both groups is the same.Difference between them is 0.89%, which is not up tothe level of significance.
Irrespective of sex of the subjects, physical practiceis not enough to increase response in 2nd session forsubjects in group I.But with supplement of mentalpractice response in 2nd session for subjects in group IIincreased by 10%.This increase is statistically highlysignificant p<0.001, which indicates that physicalpractice and mental practice is likely to yield much more
response in 2nd session as compared to only physicalpractice.
Mental Practice interspersed with Physical practicesignificantly improved balance time in the study.
The difference between comparative groups showedhighly significant results:
• Within groups
All groups showed improvement, but the Group IIshowed the most improvement in
2nd session of 33.01% in males and 31% in femalesrespectively.
53. Vidya Acharya--274-279.pmd 2/7/2013, 8:08 PM276

Indian Journal of Physiotherapy & Occupational Therapy. January-March 2013, Vol. 7, No. 1 277
• Between both groups
The comparison of percent improvement in Group Iand II, showed an increment of 10% in balance time ofgroup II in its 2nd session. Thus showing that thebalance time increased with physical practice andmental practice of the activity.
Following could be the reasons for significantincrease in balance time for Group II subjects.
Strengthening of Engram Formation
The plausibility that improvement in performanceis a direct function of mental practice is related to engramformation. Program of engram formation3 includes i)Perception ii) Precision iii) Perceptual practice.
PERCEPTION
While carrying out, the act of standing on one leg,perception of sensory inputs are mainly from:proprioception, vision and auditory stimulus from tapesession, which provides information aboutperformance to cerebellum and automatic monitoringcentre.
Mental imaging during tape session and physicalpractice facilitate process of engram formation, thusenhancing motor learning. This is evident fromresponse of Group II in 2nd session. For Group 1 subjects,it can be inferred that, engram process is notstrengthened as those subjects carried out an activity,not related to one leg standing, during reading session.
Imaging studies by Shadmer and Holcomb haveshown cerebellum to be active during consolidation ofa learned internal model of a task4. It acts as adaptivefeed forward control system, which programs voluntarymovement skills, based on memory of previous sensoryinputs and motor outputs.
PRECISION
Precision of one leg activity is enhanced by mentalpractice, which entails picturing of standing on oneleg, while imagining kinesthetic feel of act and trying tobalance on one leg and at the same time correctingimagined mistakes. This occurs in addition to actualphysical performance of activity.
Perceptual practice
Results into excitation of desired neuronal linkagesand inhibition of those motor neurons, which should
not be performing in pattern of the one leg standingactivity. This helps into minimizing leg muscle work &facilitating muscle work with appropriate force anddirection5, thus developing a more efficient balance &co-ordination.
So Mental Practice substitutes Physical Practice inprocess of engram formation. This image would thencreate a perception of motor act, that would activate“automatic monitoring center” and facilitateconsolidation of engram formation.
With engram development, volitional excitation4
takes place, which is strengthened during PhysicalPractice of the activity and this adds for improvementin performance in Group II.
Effect of Auditory Stimulus
• Mental Practice given in form of auditory cue helpedin facilitation of mental picture, by guiding activityof balancing on one leg.
• Use of background music induces relaxationresponse.
• Commands used during tape session affect toneregulation, attention, arousal. This in turn enhancesperformance by increasing focus to be achieved4.
EFFECT OF PRACTICE
During Physical Practice
Subjects carry out Procedural learning6 i.e. repeatedexposure of activity-hence strategies applicable tochanging stimulus configuration, within task must beacquired through practice.
Procedural Learning is supported by circuitsinvolving Prefronto-caudate-striosmal topographicprojections6 . Saint and Taylor propose that straitum’srole involved with mobilizing new procedures to selectamong known procedures by acting as proceduralmemory buffer7 .
i. During Mental Practice
Subjects carry out Perceptual learning & Declarativelearning. Declarative learning results in ability tostore and consciously recall tape session duringactual practice session.
Temporal-cortico-caudate projections are involved(neo striatum)6.
53. Vidya Acharya--274-279.pmd 2/7/2013, 8:08 PM277

278 Indian Journal of Physiotherapy & Occupational Therapy. January-March 2013, Vol. 7, No. 1
iii. Acquisition of procedural knowledge throughrepeated practice may eventually result intodevelopment of declarative knowledge of task.
iv. Conversely development of declarative knowledgeof task may hasten acquisition of proceduralknowledge8.
v. With repetitive information through mental andphysical input, Group II showed significantimprovement in average balance time during secondsession.
This improvement in the task can be supported bythe research:
Neuro-imaging Studies
• In mental simulation of motor act, cerebral bloodflow studies suggest that prefrontal cortex,supplementary motor area, basal ganglia,cerebellum, structures required for performance ofactual movement, are active5.
• PET studies have shown changes in local cerebralblood flow associated with state of informationprocessing i.e. activation when hearing words.(Stephan H Koslow, George V. Coelho)9
Effect on Memory Function
• Hippocampus10 provides drive that causestranslation of short term memory to long term i.e. ittransmits signals which seems to make mindrehearse over & over new information.
• Consolidation of long term memory of verbal typetakes place within hippocampi.
Effect of Motivation
• Motivation hypothesis postulates that MentalPractice increases the subject’s motivation toimprove1.
• Following structures are involved in motivation:prefrontal cortex, limbic structures, hypothalamus,thalamus, brainstem, motor cortex (structures arealso active during mental practice)11.
Effect of Neurotransmitter Activity
• Noradrenergic, dopamine, serotonin systemsinfluence operations of neural systems for decisionmaking12.
• These systems have cognitive appraisals oftenwithout conscious awareness.
CONCLUSION
• In elderly population, Mental Practice coupled withPhysical Practice has shown to improve one legbalance time more significantly than PhysicalPractice alone.
• This improvement in balance, which is fundamentalcomponent of human movement, suggests thatMental Practice has promising usefulness in healthcare.
• Because efficacy of mental practice increases withincreasing task familiarity, it could be usefulmodality for rehabilitation.
• Therapeutic exercise could be supplemented withmental imaging during rest period.
• Patients confined to bed can use visualizationtechniques to prepare for future retraining in gaitand activities of daily living.
• It could easily be incorporated into patient’s homeprogram.
• Mental rehearsal encourages patients to assumeresponsibility for their recovery.
• Thus, Mental Practice may be an importanttherapeutic tool to encourage rapid acquisition of amotor skill.
ACKNOWLEDGEMENT
My heartfelt thanks to the Dean of Institute, Head ofPhysical Therapy Department, Bio-statistician, all mysubjects, departmental staff and colleagues.
Conflict of Interest - Nil.
REFERENCES
1. Claudia, L.Fansler, Cathy L. Poff, Katherine FShepard: Effects of mental practice on balance inelderly women. Physical Therapy, September1985, Vol.65, No.9.
2. Antonio Nardone, Rosella Siliotto: Influence ofaging on keg muscle reflex response to stanceperturbation. Arch Phys Med Rehabilitation,February 1995, Vol 76.
3. Frederic J Kottke, Daniel Halpern: The training ofco-ordination.Arch phys Med Rehabil, December1978, Vol.59.
53. Vidya Acharya--274-279.pmd 2/7/2013, 8:08 PM278

Indian Journal of Physiotherapy & Occupational Therapy. January-March 2013, Vol. 7, No. 1 279
4. Darcy A Umphred: Interventions for NeurologicalDisability, Neurological Rehabilitation 4 th Ed.
5. Janet Carr, Roberta Shepherd: Training motorcontrol, increasing strength and fitness andpromoting skill acquisition, NeurologicalRehabilitation. Optimising Motor Performance.
6. J.A.Saint–Cyr, Ann.E.Taylor, A.E.Lang: ProceduralLearning and Neo-straital Dysfunctions in man,Brain 1988, 111,941-959.
7. P.Soliveri, R.G.Brown, M.Jahanshahi: Learningmanual pursuit tracking skills in patients withParkinsons’s Disease. Brain 1997, 120, 1325-1337.
8. Pascual Leone, J Grafman, K.Clark,M.Stewart:Procedural learning in Parkinson’sDisease and Cerebellar Degeneration.Annals ofNeurology,July-Dec 1993,Vol.34,1-6.
9. Stephan H.Koslow, George V.Coelho: FunctionalMapping of the Human Brain.Decade of the Brain.
10. Guyton and Hall: Behavioral and MotivationalMechanisms of the Brain. Textbook of Medicalphysiology.9th Ed.
11. Paul D Cheney: Role of cerebral cortex in voluntarymovements.A Review. Physical Therapy, May1985, Vol65, No5.
12. R E O’Caroll, B P Papps: Decision making inHumans: The Effects of manipulating the centralnoradrenergic systems.J Neurology NeurosurgeryPsychiatry 2003:74:376-378.
53. Vidya Acharya--274-279.pmd 2/7/2013, 8:08 PM279

280 Indian Journal of Physiotherapy & Occupational Therapy. January-March 2013, Vol. 7, No. 1
Effect of Midprone Decubitus on Pulmonary FunctionTest Values in Young Adults with Undesirable Body Mass
Indices (BMI)
Junaid Ahmed Fazili1, Ajith S2, A.M.Mirajkar3, Mohamed Faisal C K4, Ivor Peter D'Sa5
1Physical Therapist, Dept. of Physiotherapy, 2Asst. Professor, Dept. of Physiotherapy, 3Professor and HOD, Dept. ofPhysiology, 4Professor and HOD, Dept. of Physiotherapy, 5Professor Dept of Medicine, NITTE University, Mangalore
ABSTRACT
Background and purpose: Body positioning is prescribed by Physical Therapists to directly enhanceoxygen transport and oxygenation, to minimize the risk of aspiration, and to drain pulmonary secretionin most of the intensive care units. The aim of this study is to assess pulmonary function in sitting, rightmid-prone, left mid prone position in healthy young adult subjects and to compare the effect of BodyMass Index (BMI) on pulmonary function in sitting, right and left mid prone position.
Materials and Methods: We recruited 60 healthy male volunteers by using convenience sampling withthe mean age 20.5 ranges from 18-30 years. The subjects were divided into two groups based on theirBMI (Group A BMI 18.5-24.9kg/m2and Group B BMI>25kg/m2 ). The spirometric test was done tomeasure Forced Vital Capacity (FVC), Forced expiratory volume in 1 second (FEV1), Slow Vital Capacity(SVC), Maximum Voluntary Ventilation (MVV) in sitting, right side lying and left side lying position,the values of three different positions were compared with in the groups and between the groups.
Results: FVC and FEV1 values show significant changes in three different positions in normal andobese subjects. The MVV of normal and obese groups in sitting, right side lying and left side lying wassignificantly varied. There was no significant difference in other values.
Conclusion: With right side and left side lying position the FVC and FEV1 values decreased significantlyin compare to the sitting position, and there is no difference in lung volumes between normal and obeseexcept MVV. MVV is significantly reduced in right and left side lying position. Upright sitting positionwill increase the lung volumes and capacities compared to the other positions.
Keywords: Midprone Decubitus, Pulmonary Function Test, Body Mass Indices (BMI).
INTRODUCTION
Body Mass Index (BMI) is a widely accepted andused index to measure obesity in both adults as well asin adolescents. Obesity can cause various deleteriouseffects to respiratory function, such as alterations inrespiratory mechanics, decrease in respiratory musclestrength and endurance, decrease in pulmonary gasexchange, lower control of breathing, and limitationsin pulmonary function tests and exercise capacity. Thesechanges in lung function are caused by extra adiposetissue in the chest wall and abdominal cavity,compressing the thoracic cage, diaphragm, and lungs15.Many studies have stated that there is a directrelationship between lung function and body mass
index .Weight and body mass index as measures ofoverall abdominal adiposity are used as predictors ofpulmonary function in many epidemiological studies.These measures are widely accepted as determinantsof pulmonary function in many epidemiologicalstudies6, 7. Abdominal adiposity may restrict the descentof diaphragm and limit lung expansion compared tooverall adiposity, which may compress the overall chestwall.2Several previous studies have stated that increasein body weight decrease lung volume, but many studieshave been small; they included subjects with coexistingmorbidities8-10.
Therefore, it is important to understand therelationship between body mass index (BMI) and lung
54. ajith sonam-280-284.pmd 2/7/2013, 8:08 PM280

Indian Journal of Physiotherapy & Occupational Therapy. January-March 2013, Vol. 7, No. 1 281
function to properly interpret Pulmonary Function Tests(PFTs).
Different side lying body positioning is prescribedby Physical Therapists to directly enhance oxygentransport and oxygenation, to minimize the risk ofaspiration, and to drain pulmonary secretion in mostof the intensive care units.11Compared with the uprightposition, recumbent positions have well documenteddeleterious effects on lung volume of the dependentairways, reduced flow rates ,and reduced arterialsaturation .These effects are accentuated with age,smoking history, obesity, breathing at low lungvolumes, sedation and direct effects of anaesthesia12.
Although side lying (mid prone) positions arecommonly used clinically, the differential effects of rightand left side mid prone position on lung functioncompared with a reference position such as uprightsitting have not been studied in detail. There have beena few reports of improved arterial oxygenation in leftversus right side-lying in patients with unilateral lungdisease and bilateral lung disease and in patientsfollowing coronary artery bypass surgery.13
In recumbent positions gas exchange is improvedwith the healthy lung down in patients with unilaterallung disease and in right side lying in patients withbilateral lung disease. In patients with unilateral lungdisease, the role of the inferior lung as gas exchangerand diffusion capacity is enhanced because of thecephalad displacement of the hemi diaphragm placingit in greater mechanical advantage.14The Effect of midprone position on pulmonary function test amongyoung adults of altered BMI has not been studied withthe importance it deserves. This study aims tounderstand the relationship between the side-lyingposition and BMI on lung function.
METHOD
Subjects
This study was approved by the Central EthicalCommittee of Nitte University; 60 healthy malevolunteers were selected by using conveniencesampling. We included healthy male volunteers of agerange 18-30 years, and excluded the subjects with ahistory of cardio respiratory disease, BMI< 18.5, yogaand exercise practitioners, subjects with history of
smoking, subjects taking medication, which has effecton respiratory system.
STUDY PROTOCOL
The study was conducted at the Nitte Institute ofPhysiotherapy; the subjects were briefed about theprotocol and the informed consent was obtained fromthem prior to the commencement of study. A detailedhistory regarding their habits, physical activity andhistory suggestive of any cardio respiratory or anysystemic illness was elicited. The percentage of bodyfat was calculated by Quetelet’s Index15
BMI=weight (kg)/height2 (m2))
Body fat composition was measured was measuredby the skin fold thickness method in the followingmanner, the skin fold thickness was measured at fourdifferent sites on the dominant side of the body by usingskin fold callipers. Extremity skin folds were measuredat the triceps, biceps, trunk, supra-iliac and sub scapularareas16, 17. The skin fold was picked up between thethumb and forefinger and the readings were taken 5seconds after the calliper was applied. Three consecutivereadings were taken and recorded at each site. Theaverage of three readings at each site was calculatedand sum of these values was entered into the table givenby Durnin and Womersley18.to find out the body fatpercentage. Body fat percentage and BMI of the subjectswere compared to add weight age to the classification;high body fat percentage was seen to be associated withhigh BMI. The subjects were divided into 2 groups basedon the BMI
Group I 30 subjects with BMI 18.5-24.9kg/m2
Group II 30 subjects with BMI>25kg/m2
The lung function parameters which were assessedby computerized spirometers were Forced VitalCapacity (FVC), Forced expiratory volume in 1second(FEV1), Slow Vital Capacity (SVC), and MaximumVoluntary Ventilation (MVV)
The sessions were conducted in ventilated room;the instrument used to measure respiratory parametersis SPIROMETER HELIOS 401.
Session I - Sitting position (recordings taken after15 minutes in sitting)
54. ajith sonam-280-284.pmd 2/7/2013, 8:08 PM281

282 Indian Journal of Physiotherapy & Occupational Therapy. January-March 2013, Vol. 7, No. 1
Session II- Right mid prone position (recordingstaken after 15 minutes in side lying to the right).
Session III - Left mid prone Position (recordingstaken after 15 minutes in side lying to the left).
A gap of 15 minutes was maintained in between thesessions to avoid bronchospasm or exhaustion, thesessions lasted for an hour and the study was dividedinto three sessions based upon the position
For recording FVC and Fev1, the subject wasinstructed to keep the disposable mouth piece attachedto the transducer halfway in the mouth above the tongue,the nose clip was applied and the subject was asked tolook away from the monitor, after that he was asked totake a deep inspiration and then blow hard in thetransducer up to 6secoonds followed by a deepinspiration19
For recording SVC the subjects with his nose clipwas asked to breathe normally, after a minimum of 3quiet breaths he was asked to take a deep inspirationfollowed by expiration and then breathe normally andto record MVV, the subject was instructed to breathe inand out rapidly through the transducer for at least 15seconds.
For each manoeuvre the subject performed thrice andthe best of the 3 readings were selected. In each sessionthe rest period was 15 minutes to accommodate theeffects of position change on the pulmonary circulation,notably the pulmonary capillaries, which is timedependent.
RESULTS
64subjects were selected for the study; the datacollection of four subjects could not be completed.Statistical analysis was performed with SPSS softwarepackage. The mean age of the subjects who participatedin the study was 20.5; range (18-30) .T-test comparedthe various positions in the two groups. Annova wasused to compare the variables within the groups.
FVC and FEV1 values showed significant changesin all three positions in normal and obese subjects (Table1 & 2), (figure 1). But when we compared the values inbetween normal and obese groups in sitting positionthere was significant difference in MVV and nosignificant difference in other values (Table 3, figure 2).
In right side lying positionFev1/fvc and MVV showssignificant difference (Table 4&figure3) In left side lyingposition the MVV values of obese group is at a lowerlevel when compared to the normal group and thisdifference is very highly significant.( Table 5 &figure 4).
Table 1. (Normal subjects)
Normal Sitting Rt Left P-value
Sidelying Sidelying
FVC 3.95 ± 0.65 3.583±.61 3.484±.83 .p<.05(s)
FEV1 3.32±.55 3.0 ± .55 2.9173±.77 p<.05(s)
FEV1/FVC 83.33±9.7 84.130±8.7 82.58±10.7 .829
SVC 3.807±.66 3.756±.68 15.920±68.39 .393
MVV 119.67±27.240 116.07±33.909 119.43±23.471 .861
Table 2. (obese subjects)
Normal Sitting Rt Left P-value
Sidelying Sidelying
FVC 3.95 ± 0.65 3.583±.61 3.484±.83 p<.05(s)
FEV1 3.32±.55 3.0 ± .55 2.9173±.77 p<.05(s)
FEV1/FVC 83.33±9.7 84.130±8.7 82.58±10.7 .829
SVC 3.807±.66 3.756±.68 15.920±68.39 .393
MVV 119.67±27.240 116.07±33.909 119.43±23.471 .861
Fig. 1. Error bar graph with mean & SD in threepositions
Table 3. Comparison of Pft Variable with Obese andNormal In Sitting
Group-1 Group-2 p-value
(N=30) (N=30)
Sitting
Fvc 3.9503±.648 4.0227±.547 p>0.05(ns)
Fev1 3.321±.55 3.32±.50 p>0.05(ns)
Fev1/fvc 83.318±9.79 82.23±6.26 p>0.05(ns)
Svc 3.905±.65 3.759±.71 p>0.05(ns)
Mvv 119.67±27.24 104.70±22.78 p<.05(s)
54. ajith sonam-280-284.pmd 2/7/2013, 8:08 PM282

Indian Journal of Physiotherapy & Occupational Therapy. January-March 2013, Vol. 7, No. 1 283
Fig. 2
Table 4. Comparison Of Pft Variables With Obese AndNormal In Right Sidelying
Group-1 Group-2 p-value
(N=30) (N=30)
Right sidelying
Fvc 3.5827±.61 3.6600±.66 p>0.05(ns)
Fev1 3.0400±.55 2.9227±.58 p>0.05(ns)
Fev1/fvc 84.123±8.7145 79.788±7.8893 p<.05(s)
Svc 3.7563±.68422 3.8123±.72779 p>0.05(ns)
Fig. 2
DISCUSSION
Body position exerts a strong effect on pulmonaryposition, but its effect on the side lying position withundesirable Body Mass Indices (BMI) is still to beunderstood. This study investigated the inter-relationships of PFT values in side lying positionsbetween two different BMI groups. Studies previouslydone on this subject have shown marked improvementin patients who lay with the diseased or operated lunguppermost compared with the dependent position andmany studies have concluded that obesity has a directeffect on pulmonary function. Fiona Manning et al
(1999)19 concluded that FVC and FEV1 were decreasedequally in left and right side lying positions in olderindividuals without cardiopulmonary disorders.
Therefore the present study aims to assess the PFTvalues in sitting and side lying positions in younghealthy population of different BMIs. We studied 60healthy young adults in two different groups with threedifferent positions. Our study findings confirm that FVCand FEV1 value was decreased in right side lying andleft side lying when compared to the sitting position.The results of our study conform to the result of theprevious study done by Fiona Manning et al19 andBehrakis et al 20. The decrease in FVC in recumbencymay reflect both increased thoracic blood volume dueto the increased venous return and cephaladdisplacement of the diaphragm caused by abdominalencroachment. Other factors which may have causedthis decrease include increased airway resistance anddecreased lung compliance secondary to anatomicaldifference between the left and right lungs and shiftingof mediastinal structures. When the value betweennormal and obese subjects was compared, there issignificant reduction in MVV in obese population. MVVis a measurement of respiratory muscle endurance, isreduced by 20% in healthy obese individuals and by45% in obese individuals with obesity hypoventilationsyndrome (OHS) 21. This may result from diaphragmdysfunction due to increased abdominal and visceraladipose tissue deposition. While other studiesconducted by earlier authors have shown reduction inthe lung volumes especially FRC and ERV, manyresearches proved that obesity (BMI>30) has a directrestrictive effect on pulmonary function. Wafaa R. Al-Bader et al22 proved that BMI>30 is associated with arestrictive effect on pulmonary ventilation. We selectedsubjects with BMI> 25, and the number of subjects withBMI>30 was very much limited; this may be the reasonthe other values are not significant in both the groups.
The major limitations of our study is we recruitednormal subjects and we could have increased thenumber of subjects that would have given morestatistical weightage, if we selected a diseasedpopulation that would have given more clinical validityof our study. The other components of pulmonaryfunction tests could also have been done to furthervalidate the study.
The clinical importance of our study is that sinceoptimal lung function is seen in upright position, it canbe beneficial if ventilator dependent patients are nursedin the upright position as opposed to the traditionally
54. ajith sonam-280-284.pmd 2/7/2013, 8:08 PM283

284 Indian Journal of Physiotherapy & Occupational Therapy. January-March 2013, Vol. 7, No. 1
used supine position, the need of early mobilizationafter the major surgical procedure is also considered.Since Obesity will increase the demand for ventilation,elevated work of breathing, respiratory muscleinefficiency and diminished respiratory compliance,the result of our study will benefit the patients ofcardiopulmonary disorders with high BMI. Thephysical therapist should know the physiologicaleffects of positioning while administering chest physicaltherapy.
CONCLUSION
Authors concluded that with right side and left sidelying position the FVC and FEV1 values decreasedsignificantly in compare to the sitting position, andthere is no difference in lung volumes between normaland obese except MVV. MVV is significantly reduced inright and left side lying position, authors alsoconcluded that upright sitting position will increasethe lung volumes capacities.
ACKNOWLEDGEMENT
Authors would like to thank the Nitte University,Dep. of Physiology K S Hegde Medical Academy andDep. of Physiotherapy for their complete support to fulfilthis study.
Conflict of Interest
Authors agree that there was no source of conflict ofinterest
REFERENCES
1. Faintuch J, Souza SAF, Valexi AC, Sant´ana AF,Gama-Rodrigues JJ. Pulmonary function andaerobic capacity in asymptomatic bariatriccandidates with very severe morbid obesity. RevHosp Clin Fac Med S Paulo. 2004; 59:181-86.
2. Koenig, SM. Pulmonary Complications of obesity.Am J Med Sci. 2001; 321:249-79.
3. Ladosky W, Botelho MAM, Albuquerque JP. Chestmechanics in morbidly obese non-hypo ventilatedpatients. Respir Med. 2001; 95:281-6.
4. Lotti P, Gigliotti F, Tesi F, Stendardi L, Grazzini M,Duranti R et al. Respiratory muscles and dyspneain obese nonsmoking subjects. Lung. 2005;183:311-23.
5. Rasslan Z., Junior RS, Stirbulov R, Fabbri RMA,Lima CAC. Evaluation of Pulmonary Function inClass I and II Obesity. J Bras Pneumol. 2004; 30:508-14.
6. Heather M Ochs-Brydon Pulmonary Function and
Abdominal Adiposity in the General Population.Chest 2006; 129; 853-862.
7. Biring MS, LewisMI, LiuJT, etal.Pulmonaryphysiologic changes of morbid obesity. Am J MedSci 1999; 318:293-297?
8. PelosiP, Croci M RavagnamI,et al. The effects ofbody mass on Lung volumes, respiratorymechanics and gas exchange during generalanaesthesia.AnesthAnalg 1998; 87:654-660.
9. WatsonRA, PrideNB.Postural changes in lungvolumes and respiratory resistance in subjectswith obesity ApplyPhysiol2005; 98:512–517.
10. SahebjamiH,GartsidePS.Pulmonary Function inobese subjects with a normal FEV1/FVCChest1996; 110:1425–1429
11. Sahebjami.H.Dysnea in obese healthy men Chest1998; 114:1373-1377.
12. RayCS, SueDY, Bray G et al Effects of obesity onrespiratory function. Am Rev RespiirDis1983;128:50 -506
13. CollinsLC, HobertyPD, WalkerJF, etal.The effect ofbody fat distribution on pulmonary function tests.Chests 1995; 107:1298-1302.
14. Dean E. Effect of body position on pulmonaryfunction. Phyther 1985; 65:613-618.
15. Ross J, Dean E Body positioning .in Zadai C,ed,Clinic in Physical Therapy;1992:79-98.
16. Dean E. Invited commentary on “Are incentivespirometry, intermittent positive pressurebreathing, and deep breathing exercises effectivein the prevention of postoperative pulmonarycomplications after upper abdominal surgery? Asystematic overview and meta-analysis” PhysTher.1994; 74:10-15.
17. GarrowJS, WebsterJ. Quetelet’s index as measureof fatness. Int J Obese 1985; 9(2):147-153.
18. DurninJV,WomersleyJ.Body fat assessed from thebody density and its estimation from skin foldthickness on measurements on 481 men andwomen aged 16 to 72 years.Br J Nutr 1974;32:77-97
19. Fiona Manning, Elizabeth Dean, Jocelyn Ross, RajaT Abbound. Effects of side lying on lung functionin older individuals. Physical therapy, 1999; 79(5): 456-466.
20. Behrakis PK, Baydur A, Jaeger MJ, Milic-Emili J.Lung mechanics in sitting and horizontal bodypositions. Chest. 1983; 83:643– 646.
21. Wafaa R. Al-Bader, J. Ramadan, A Nasr-Eldin , M.Barac-Nieto. Pulmonary Ventilatory Functionsand Obesity in Kuwait. Med Princ Pract 2008;17:20–26.
22. K Parameswaran, DC Todd, M Soth. Alteredrespiratory physiology in obesity. Can Respir J2006; 13(4):203-210.
54. ajith sonam-280-284.pmd 2/7/2013, 8:08 PM284

Indian Journal of Physiotherapy & Occupational Therapy. January-March 2013, Vol. 7, No. 1 285
Comparison of Quality of Life in off-pump Versuson-pump Coronary Artery bypass Graft (CABG) Patients
before and after Phase II Cardiac Rehabilitation
Nikhil Vishwanath1, Ajith S2, Ivor Peter D'Sa3, M.Gopalakrishnan4, Mohamed Faisal C K5
1Physical therapist, Dep. of Physiotherapy, 2Asst. Professor, Dep. of Physiotherapy, 3Professor, Dep. of Medicine, 4HOD,Dep. of Cardio Thoracic Surgery, 5Professor and HOD, Dep. Of Physiotherapy, NITTE University, Mangalore
ABSTRACT
Background and purpose: Coronary artery Bypass Graft (CABG) is the commonly performedrevascularization procedure after a major vessel block. Many studies have indicated that there is areduction in Quality of Life after CABG. The aim of our study was to compare the Quality of Life (QOL)in off pump and on pump CABG patients before and after phaseII Cardiac rehabilitation and to find outthe effectiveness of cardiac rehabilitation to improve the QOL.
Materials and Methods: The QOL of 50 patients consisting of two groups were studied on two differentoccasions before phase II cardiac rehabilitation and after Phase II cardiac rehabilitation respectively byusing SF-36v2 questionnaire.
Results: 50 patients with the mean age 47.9 years, (range 40-58) completed the study. Following thecardiac rehabilitation there was a marked improvement in the QOL of both the groups, and the physicaland mental components scores in the SF-36v2 questionnaire were increased. The difference betweenthe scores of off pump and on pump CABG was significant before phase II cardiac rehabilitation. AfterphaseII cardiac rehabilitation, there were no significant changes between the scores except for those ofgeneral health (p=.005), emotional role functioning (p<.001) and mental component score (p=.01)
Conclusion: The QOL was seen to increase significantly after 3 months of structured cardiacrehabilitation program(comprising of Phase I and Phase II cardiac rehabilitation) in both on pump andoff pump CABG patients .There were significant changes in the all the 8 domains in the SF-36v2questionnaire in both groups before and after Phase II cardiac rehabilitation, but there was no significantdifference in QOL between on pump and off pump CABG subjects after Phase II cardiac rehabilitationprogram.
Keywords: Quality of Life (QOL), off Pump CABG (OPCAB), on Pump CABG, Phase II Cardiac Rehabilitation.
INTRODUCTION
Coronary artery bypass grafting (CABG) is the majorcoronary artery revascularization procedure after anymajor vessel block. It is one of the landmarkoperations in the history of cardiac surgery that savedthe lives of millions of people afflicted with coronaryartery disease.1, 2 Coronary Artery Bypass Graft is acommonly performed surgery worldwide. In Indiaaround 500,000 CABGs are performed annually. CABGis the most accepted coronary revascularizationprocedure performed after a major vessel block3-5.
There are 2 different methods of doing CABG: thetraditional way, which is called the on-pump CABG,and the newer way, which is called the off-pump CABG(OPCAB). The pulmonary function after CABG isseverely reduced; the reasons for the restrictive
impairment and atelectasis are multiple and include,besides the effects of anesthesia, intra-operative eventssuch as internal mammary artery harvesting, changescaused by mechanical alteration of the thoracic cavity,immobilization and pain6. Roentgenologial signs ofatelectasis are common and various studies havedocumented reduced lung volumes and oxygenationin the post-operative period7. Many studies show thatthe pulmonary complications are more in patients withon pump coronary artery bypass graft8
The World Health Organization (WHO) classifiesCardiac Rehabilitation as ‘The sum of activities requiredto influence favorably the underlying cause of thedisease, as well as to ensure the patient the best possiblephysical, mental and social conditions, so that theymay, by their own efforts, preserve or resume when lost,
55. ajith sonam-285--292.pmd 2/7/2013, 8:08 PM285
286 Indian Journal of Physiotherapy & Occupational Therapy. January-March 2013, Vol. 7, No. 1
as normal a place as possible in the life of thecommunity9, 10
Cardiac rehabilitation is divided into four phases,progressing from the acute hospital admission stage tolong-term maintenance of lifestyle changes. Accordingto American College of Sports Medicine (ACSM) 11, therehabilitation phase can be divided into
• Phase I – in-patient period, duration 5- 7 days.
• Phase II – early post-discharge, duration up to 3months.
• Phase III – supervised out-patient programincluding structured exercise.
• Phase IV – long-term maintenance of exercise andother lifestyle changes.
Even reports on health economic aspects show thatcardiac rehabilitation is a justifiable use of the health-related budget. However, access to cardiac rehabilitationis often limited12, 13, 14
Cardiac rehabilitation ensures improvement inquality of life and makes it easier for patients to work,participate in social activities and exercise.
Quality Metric’s SF-36V2 Health Survey asks 36
questions to measure functional health and well-beingfrom the patient’s point of view. It’s called a generichealth survey because it can be used across age (18 andolder), disease, and treatment groups, as opposed to adisease-specific health surveys which focus on aparticular condition or disease. The survey ismeaningful to patients, clinicians, researchers, andadministrators across the health care spectrum, andhas various applications15.
METHOD
Subjects
This study was approved by the Central EthicalCommittee of Nitte University. The patients posted forCoronary Artery Bypass Graft (CABG) were randomlyselected from the cardiothoracic unit of K S HegdeMedical College with the permission of thecardiothoracic surgeon. We included subjects withisolated CABG, aged between 40-65 years and withEjection fraction > 35% and we excluded the subjectswith other than isolated CABG ,Age > 65 years,Myocardial infarction after CABG, Ejection fraction<35% , Renal failure and high risk subjects .
STUDY PROTOCOL
All the patients underwent pre-operative chestphysiotherapy to clear secretions and to improve thelung function. After surgery, the patients were dividedin to two groups based on the type of surgery.
Group 1 – On pump CABG patients (n= 25).
Group 2 – Off pump CABG patients (n= 25).
No mortality was recorded in both the groups afterextubation and all patients underwent phase I cardiacrehabilitation. The phase I cardiac rehabilitationincluded the physiotherapy techniques like incentivespirometry, coughing, huffing, chest manipulation,segmental expansion, thoracic mobilization andambulation. Post operatively the exercises were startedapproximately 1 hr after extubation, and the patientswere encouraged to perform all the exercises twice dailyfor the first 7 postoperative days.
After the phase I program the SF36-v2 questionnairewas administered. It consists of 36 short questionsmirroring health and Quality of Life (QOL) in eightdifferent aspects: bodily pain (BP, 2 items); mental health(MH, 5); vitality (VT, 4); social functioning (SF, 2); generalhealth (GH, 5); physical functioning (PF, 10); and rolefunctioning, both emotional (RE, 3) and physical (RP,4). Role functioning reflects the impact of emotional andphysical disability on work and regular activity. Allthe patients were explained about the questionnaireand asked to fill according to the questions.
Phase II cardiac rehabilitation was a home-basedindividualized tailored program of aerobic exercises;preferably brisk walking17, 18. The exercises were taughtto the patient in the department under physiotherapistsupervision, and then the program protocol was givento the patient to be done at home for 3months. Patientswere also trained in palpating the pulse and calculatingthe heart rate, and to rate the Rating of PerceivedExertion (RPE) of 11 to 14.The exercise programconsisted of warm up which included breathingexercise, stretching exercise and gentle active exerciseto upper limb, lower limb and trunk muscles for aperiod of 10 minutes, followed by graded aerobictraining and cool down. Aerobic training was briskwalking for 3-5 times a week with intensity of 40-70%of Heart Rate Reserve (HRR) achieved in exercise testby using Karvonen formula, and RPE of 11-14 forduration of 20 to 40 minutes (ACSM guidelines 2005)19.Patients were contacted by phone every two weeks toensure their interest in the program and to monitor the
55. ajith sonam-285--292.pmd 2/7/2013, 8:08 PM286

Indian Journal of Physiotherapy & Occupational Therapy. January-March 2013, Vol. 7, No. 1 287
progress. The exercise log was reviewed every 15 days.Subjects were also advised to contact thephysiotherapist if any advice or help was needed. Weprovided a detailed booklet in the patients’ mothertongue
which contained dos and don’ts after cardiacsurgery and termination criteria while doing exercise.The progression of the exercise intensity was done everytwo weeks .As the RPE falls with improving fitness theintensity of exercise was increased by 5 to 10 percent ofthe maximum heart rate, and the RPE was maintained11 to 14 throughout the 3 months duration. Subjectsstarted to do the exercise for 15 to 20 minutes and by theend of 3rd month they gradually progressed to 30 to 40minutes20.
After the end of the phase II cardiac rehabilitationSF36V2 questionnaire was again administered to the
patients and asked to fill accordingly. Later thequestionnaire scores were compared with the pre-phaseII cardiac rehabilitation scores and scores werecompared between on pump and off pump CABG.
RESULT
58 subjects were selected for the study out of whichthe questionnaire was not completed for eight subjects.Statistical analysis was performed with SPSS softwarepackage. The mean age of the subjects who participatedin the study was 47.9 years, range (40-58). 33 malesand 17 females completed the study. In comparison withthe pre and post values from the SF36 v2 administeredto the patients of both the group of on-pump and offpump. There was significant difference when the scoresof the questionnaire were compared after one week ofsurgery (before phase II) of both the groups. (Table- 1)
Table 1. Before phase II cardiac rehabilitation
GROUP N Mean Std. Deviation T
PF Group I 25 30.2360 2.70086 2.25000
GroupII 25 33.7080 4.20150 p=0.005 hs
RP Group I 25 31.1360 3.81744 2.83400
GroupII 25 33.7680 3.50721 p=0.04sig
BP Group I 25 49.5280 5.68718 4.92600
GroupII 25 54.9640 2.16578 P<.001 vhs
GH Group I 25 51.8080 2.75550 2.53600
GroupII 25 54.8160 4.25182 p=0.005 hs
VT Group I 25 59.7200 5.09220 2.44700
GroupII 25 62.8640 2.70545 p=0.01 hs
SF Group I 25 46.7960 6.65014 2.48400
GroupII 25 49.2120 3.41219 p=0.005 hs
RE Group I 25 40.0960 3.10145 2.20700
GroupII 25 43.6120 3.34692 p=0.04sig
MH Group I 25 59.3120 5.15871 2.55900
GroupII 25 63.9320 2.65601 p=0.01 hs
PCS Group I 25 50.1800 3.49327 2.84700
GroupII 25 53.6880 2.76059 p=0.04 sig
MCS Group I 25 49.2160 4.95468 2.35700
GroupII 25 53.0880 3.24807 p=0.005 hs
PCS - physical component summary score, PCS = PF+RP+BP+GH
MCS – mental component summary score, MCS = VT+SF+RE+MH
There were no significant changes in the score afterPhase 2 cardiac rehabilitation in both the groups. Therewere changes in the PF (physical functioning) GH
(general health) RE (emotional role functioning) MCS(mental component summary score). (Table-2).
55. ajith sonam-285--292.pmd 2/7/2013, 8:08 PM287

288 Indian Journal of Physiotherapy & Occupational Therapy. January-March 2013, Vol. 7, No. 1
Table 2. After Phase II Cardiac Rehabilitation
GROUP N Mean Std. Deviation T
PF Group I 25 40.8720 3.96227 2.10900
GroupII 25 41.9720 3.01407 p=0.307 ns
RP Group I 25 32.8120 5.25808 .45700
GroupII 25 35.2120 6.31667 P=.654 ns
BP Group I 25 54.9400 5.55788 .56600
GroupII 25 55.7080 3.89657 p=0.574 ns
GH Group I 25 61.5120 2.17855 2.93000
GroupII 25 64.5280 4.66329 P=0.005 hs
VT Group I 25 62.5880 5.26223 .10700
GroupII 25 63.4520 5.61503 P=0.916ns
SF Group I 25 51.8160 3.48589 .45700
GroupII 25 52.2600 3.38674 p=0.656 ns
RE Group I 25 49.0360 5.43207 4.92600
GroupII 25 54.9640 2.58697 p<.001 vhs
MH Group I 25 62.1400 3.30568 1.35300
GroupII 25 63.1680 1.87143 p=0.182 ns
PCS Group I 25 52.2720 3.63198 .58400
GroupII 25 53.5440 5.07092 P=0.562 ns
MCS Group I 25 59.7160 5.04824 2.67900
GroupII 25 62.7120 2.40387 P=.01 hs
Paired sample test was done to compare pre andpost values of both the groups, and there weresignificant difference between pre phase II and post
phase II of cardiac rehabilitation scores between onpump and off pump cardiac surgery.(Table-3 and 4)
Table 3. Paired Samples Test, Group-1
GROUP Paired Differences
Mean Std. Deviation
Group I PF- PRE PF-POST -9.6360 10.08319 -4.778 <.001 vhs
RP-PRE RP-POST -.6760 16.14273 -.209 .836
BP-PRE BP-POST -9.4120 11.40677 -4.126 <.001 vhs
GH-PRE GH-POST -3.7040 6.47447 -2.860 0.009 hs
VT-PRE VT-POST -9.8680 12.44946 -3.963 <.001 vhs
SF-PRE SF-POST -5.0200 9.54799 -2.629 0.015 sig
RE-PRE RE-POST -16.9400 15.05631 -5.626 <.001 vhs
MH-PREMH-POST -9.8280 10.38775 -4.731 <.001 vhs
PCS-PRE PCS-POST -3.0920 8.27682 -1.868 .074
MCS-PRE MCS-POST 12.5000 12.61266 -4.955 <.001 vhs
55. ajith sonam-285--292.pmd 2/7/2013, 8:08 PM288

Indian Journal of Physiotherapy & Occupational Therapy. January-March 2013, Vol. 7, No. 1 289
Table 4. Paired Samples Test, Group II
GROUP Paired Differences
Mean Std. Deviation
GroupII PF-PRE PF-POST -12.2640 7.03526 -8.716 <.001 vhs
RP-PRE RP-POST -3.4440 19.16059 -.899 .378
BP-PRE BP-POST -12.7440 10.20139 -6.246 <.001 vhs
GH-PRE GH-POST -7.7120 8.90048 -4.332 <.001 vhs
VT-PRE VT-POST -13.5880 9.04366 -7.512 <.001 vhs
SF-PRE SF-POST -10.0480 14.03852 -3.579 0.002 hs
RE-PRE RE-POST -18.3520 13.76787 -6.665 <.001 vhs
MH-PREMH-POST -15.2360 11.24333 -6.776 <.001 vhs
PCS-PRE PCS-POST -5.8560 8.24768 -3.550 0.002 hs
MCS-PRE MCS-POST -16.6240 12.54184 -6.627 <.001 vhs
DISCUSSION
Overall QOL after surgical myocardialrevascularization was fairly well preserved in bothgroups and comparable with that of a standardpopulation in most aspects. General and mental health,vitality, physical and social functioning, and bodilypain were not negatively affected by surgery irrespectiveof the procedure chosen. The quality of life before thephase II cardiac rehabilitation in off pump and on pumppatients was significantly changed; the QOL rating wasmore in off pump patients than on pump group. Thismay be due to CABG performed with cardiopulmonarybypass (CPB), also known as on- pump CABG, whichhas been associated with significant pulmonarycomplication and functional changes. Many of theseabnormalities are thought to be caused by CPB. Durationof hospital stay and extubation period was lesser inoff-pump group compared with on-pump group. Theincidence of atelectasis and pleural effusion andventilator support was significantly higher in on pumpgroup. Four of the on pump patients were re- intubatedduring the phase I cardiac rehabilitation period. Manystudies suggest that quality of life is better in OPCABpatients in the initial 2 weeks after surgery; our studyrevealed that quality of life can improve in both types ofsurgery after structured cardiac rehabilitation.
One limitation of the study may be the sample size,since the less number will not give more statisticalweightage. The phase II cardiac rehabilitation programwas an individually tailored exercise program, inwhich the exercise frequency, intensity and mode wereprescribed and the patient was encouraged to performthe exercise at home. The disadvantage of this type ofexercise program is that it is non- monitored and thuscompliance with the program cannot be ensured.
CONCLUSION
The authors concluded that 3 months of structuredcardiac rehabilitation programs significantly improvedQOL in on pump and off pump CABG patients; therewere significant changes in the all the 8 domains in theSF36 questionnaire before and after Phase II cardiacrehabilitation. But there were no significant differencein QOL between on pump and off pump CABG subjectsafter a cardiac rehabilitation program.
Conflict of Interest -nil
REFERENCES
1. Kolesov VI. Mammary artery-coronary arteryanastomosis as a method of treatment of anginapectoris. J Thorac Cardiovascular Surg. 1967; 54:535–544.
2. Favaloro RG. Saphenous vein autograftreplacement of severe segmental coronary arteryocclusion: operative technique. Ann ThoracSurg. 1968; 5: 334–339.
3. H S Rissam, S Kishore, N Trehan Coronary ArteryDisease in young Indians- The missing link. JIndian Academy of clinical Medicine. 2001July-september; 2(3).
4. Thomas A .Schwann.Effects of body size onoperative, intermediate, and long-term outcomesafter coronary artery bypass operation.AnnThoracic Surg. 2001; 71:521-530.
5. Reeves BC,Ascione R, Chamberlain MH,AngeliniGD. Effect of body mass index on early outcomesin patients undergoing coronary artery bypasssurgery. J Am Coll Cardiol. 2003; 42:668-676.
6. D Johnson. Postoperative physical therapy aftercoronary artery bypasses surgery. Am. J. Respir.Crit. Care Med. Sep 1995; 152(3):953-958.
7. Elisabeth Westerdahl. Chest physiotherapy after
55. ajith sonam-285--292.pmd 2/7/2013, 8:08 PM289

290 Indian Journal of Physiotherapy & Occupational Therapy. January-March 2013, Vol. 7, No. 1
CABG surgery- A comparison of three differentdeep breathing techniques. Rehab Med. 2001;33:79-84.
8. Ignacio J. Ferreira-Gonza´lez, Aida Ribera,Purificacio´n Cascant and Gaieta´ Permanyer-Miralda1. The ARCA study group EpidemiologyUnit, Department of Cardiology, Vall d’HebronHospital, Paseo Vall d’Hebron. European HeartJournal. 2006; 27: 2473–2480.
9. Bo Hedback, Joep Perk, Mikael H¨ornblad and UlfOhlsson. Cardiac rehabilitation after coronaryartery bypass surgery:10-year results on mortality,morbidity and readmissions tohospital. Journalof Cardiovascular Risk. 2001; 8:153–158.
10. Yaacov Drory MD. Cardiac Rehabilitation afterCoronary Artery Bypass GraftSurgery: UrgentlyNeeded. IMAJ. 2001; 3:427-429.
11. Eagle KA, Guyton RA, Davidoff R, Ewy GA,Fonger, J, Gardner TJ, Gott JP, Herrmann HC,Marlow RA, Nugent WC, O’Connor GT, OrszulakTA, Rieselbach RE, Winters WL, Yusuf S. ACC/AHA guidelines for coronary artery bypass graftsurgery: a report of the American College ofCardiology/American Heart Association TaskForce on Practice Guidelines Committee.
12. Oldridge N, Furling W, Feeny D. Economicevaluation of cardiac rehabilitation soon afteracute myocardial infarction. Am J Cardiol.1993;72:154–161.
13. Levin LA, Perk J, Hedb B. Cardiac rehabilitation –a cost analysis. J Intern Med. 1991; 230:427–434.
14. Ades PA, Pashkow F, Nestor JR. Cost-effectivenessof cardiac rehabilitation after myocardialinfarction. J Cardiopulm Rehabil. 1997; 17:222–231.
15. Dempster M, Donnelly M. Measuring health-related quality of life among people withischaemic heart disease. Heart. 2000; 83:641–644.
16. John E. Ware, Jr., PhD, founder/CEO of QualityMetric Health Outcomes Solutions, releases theUser’s Manual for the SF 36v2 Health Survey –Second Edition. Lincoln RI – September 2007.
17. Morag K. Thow Dip PE, BSc, PhD, MCSP .ExerciseLeadership in Cardiac Rehabilitation Anevidence-based approach. Glasgow CaledonianUniversity Glasgow, UK.page1 and page 9.
18. Machionni N, Fattirolli F, Fumagalli S. Improvedexercise tolerance and quality of life with cardiacrehabilitation of older patients after myocardialinfarction: results of a randomized controlled trail.Circulation.2003; 107: 2201-2206.
19. American College of Sports Medicine (ACSM) -Guidelines for exercise testing and prescription.7th Ed. Philadelphia: Lippincott, Williams andWilkines.2006.
20. Mohammad H Haddadzadeh, Arun G Maiya, BjanShad, Fardin Mirbolouk, R Padmakumar,Vasudeva Guddattu .Effect ofcardiac rehabilitationon myocardial contractility in coronary arterydisease patients: A trail from Iran.ijcrr.2011september;03(09):149-158.
55. ajith sonam-285--292.pmd 2/7/2013, 8:08 PM290

Indian Journal of Physiotherapy & Occupational Therapy. January-March 2013, Vol. 7, No. 1 291
55. ajith sonam-285--292.pmd 2/7/2013, 8:08 PM291
4 Floor, Statesman House Building, Barakhamba Road,Connaught Place, New Delhi-110 001
91-9971888542, Fax No: +91 11 3044 6500
th
Mobile:
55. ajith sonam-285--292.pmd 2/7/2013, 8:08 PM292

Devtech Publishers & Printers Pvt. Ltd., Faridabad
Sub Editor
Kavita Behal SharmaMPT (Ortho)
4 Floor, Statesman House Building, Barakhamba Road,Connaught Place, New Delhi-110 001
th
4 Floor, Statesman House Building, Barakhamba Road,Connaught Place, New Delhi-110 001
th

Volume 7 Number 1 January-March 2013
Published, Printed and Owned : Dr. R.K. SharmaDesigned and Printed : Devtech Publishers & Printers Pvt. Ltd., FaridabadPublished at :
Editor : Dr. R.K. Sharma, Mobile:
4 Floor, Statesman House Building,Barakhamba Road,Connaught Place,New Delhi-110 001
th
91-9971888542, Fax No: +91 11 3044 6500