documenting the effectiveness of cosorption of airborne
TRANSCRIPT


Documenting the Effectiveness of Cosorption of Airborne Contaminants by a Field-Installed Active Desiccant System
Final Report: Phase 2D
J. Fischer SEMCO, Inc.
C. Bayer and R. Hendry
Georgia Tech Research Institute
J. Sand Oak Ridge National Laboratory
November 2002
Prepared by SEMCO, Inc., and Georgia Tech Research Institute
for OAK RIDGE NATIONAL LABORATORY
P.O. Box 2008 Oak Ridge, Tennessee 37831-6285
managed by UT-Battelle, LLC
for the U.S. DEPARTMENT OF ENERGY under contract DE-AC05-00OR22725


iii
CONTENTS LIST OF FIGURES.................................................................................................................................. v LIST OF TABLES ................................................................................................................................... vii 1. INTRODUCTION: BENEFITS OFFERED BY CONTAMINANT COSORPTION....................... 1 2. BACKGROUND: PREVIOUS RESEARCH COMPLETED BY GTRI.......................................... 3 2.1 GTRI Baker Laboratory Building Installation ........................................................................ 4 2.2 Berry College East Mary Dormitory Installation .................................................................... 5 3. RESULTS: GTRI BAKER LABORATORY BUILDING SITE ...................................................... 7 3.1 Installation Description and Challenge Procedure .................................................................. 7 3.2 Initial Ambient Results............................................................................................................ 7 3.3 Elevated Contaminant Concentration Challenge Results........................................................ 9 3.3.1 Removal Efficiency at Low Regeneration Temperatures ........................................... 10 3.3.2 Removal Efficiency at Moderate Regeneration Temperatures ................................... 11 3.3.3 Removal Efficiency at High Regeneration Temperatures........................................... 11 4. LONG-TERM CONTAMINANT REMOVAL TESTING: BERRY COLLEGE DORMITORY................................................................................................................ 13 4.1 Installation Description and Challenge Procedure .................................................................. 13 4.2 Long-Term Contaminant Removal Efficiency at the Berry Dormitory .................................. 13 5. CONCLUSIONS ............................................................................................................................... 17 5.1 Impact of Ambient Humidity Content on Removal Efficiency............................................... 17 5.2 Impact of Regeneration Temperature on Removal Efficiency................................................ 17 5.3 Recommendations for Further Research ................................................................................. 18 6. REFERENCES .................................................................................................................................. 19 APPENDIX A: ANALYTICAL METHODS AND SAMPLING PROCEDURES ................................ 21 A.1 Analytical Methodology.......................................................................................................... 21 A.2 Quality Assurance/Quality Control ......................................................................................... 23 A.3 Raw and Reduced Cosorption Data......................................................................................... 24 A.4 Long-Term Cosorption Data: SEMOC Hybrid System at East Mary Dormitory ................... 30


v
LIST OF FIGURES
Page 1 SEMCO active desiccant system being installed on the Baker Building rooftop ....................... 5 2 The active desiccant wheel installed as part of the hybrid system at Berry College .............................................................................................................................. 6 3 Flow schematic of active desiccant system installed at the Baker Research Building at Georgia Tech ............................................................................................................ 8 4 Flow schematic of active desiccant system installed at the Berry College dormitory site.......... 14 5 Relative impact of regeneration temperature and ambient moisture on the contaminant removal percentage................................................................................................. 18 A1 Relative challenge results from the GTRI Baker Building showing impact of regeneration temperature ........................................................................................................ 36


vii
LIST OF TABLES
Page 1 Results of testing the SEMCO 1M dehumidification wheel ....................................................... 3 2 Aldehyde and ketone removal by SEMCO unit (month one) ..................................................... 9 3 Aldehyde removal by SEMCO unit (month three) ..................................................................... 9 4 Percentage removal of total volatile organic compounds, ambient challenge ............................ 9 5 Overall percentage of contaminants removed for contaminant challenge .................................. 10 6 Percentage of contaminants removed for the six contaminants with the highest concentration in the outdoor air .................................................................................................. 15 A1 VOC analysis conditions............................................................................................................. 22 A2 Aldehyde and ketone analysis conditions ................................................................................... 23 A3 Aldehyde and ketone removal by SEMCO unit (month one) ..................................................... 24 A4 Aldehyde and ketone removal by SEMCO unit (month three) ................................................... 24 A5 VOCs in upstream air to SEMCO unit #1................................................................................... 25 A6 VOCs in upstream air to SEMCO unit #2................................................................................... 25 A7 VOCs in downstream air to SEMCO unit #1 .............................................................................. 26 A8 VOCs in downstream air to SEMCO unit #2 .............................................................................. 26 A9 Percentage removal of TVOC ambient challenge....................................................................... 26 A10 Hexane removal with 140° maximum regeneration temperature applied to wheel .................... 26 A11 Hexane removal with 175° maximum regeneration temperature applied to wheel .................... 26 A12 Toluene removal with 140° maximum regeneration temperature applied to wheel.................... 27 A13 Toluene removal with 175° maximum regeneration temperature applied to wheel.................... 27 A14 SO2 removal with 140° maximum regeneration temperature applied to wheel .......................... 27 A15 SO2 removal with 175° maximum regeneration temperature applied to wheel .......................... 27 A16 NO2 removal with 140° maximum regeneration temperature applied to wheel.......................... 27 A17 NO2 removal with 175° maximum regeneration temperature applied to wheel.......................... 28 A18 Ozone removal with 140° maximum regeneration temperature applied to wheel, sample #1 .................................................................................................................................... 28 A19 Ozone removal with 140° maximum regeneration temperature applied to wheel, sample #2 .................................................................................................................................... 28 A20 Ozone removal with 175° maximum regeneration temperature applied to wheel, sample #1 .................................................................................................................................... 28 A21 Ozone removal with 175° maximum regeneration temperature applied to wheel, sample #2 .................................................................................................................................... 28 A22 Ozone removal with no regeneration applied to wheel, sample #1............................................. 29 A23 Ozone removal with no regeneration applied to wheel, sample #2............................................. 29 A24 Overall percentage removal for contaminant challenge.............................................................. 29 A25 Berry College long-term results entering active desiccant wheel ............................................... 30 A26 Berry College long-term results leaving active desiccant wheel................................................. 33


1
1. INTRODUCTION: BENEFITS OFFERED BY CONTAMINANT COSORPTION
The final report for Phase 1 of this research effort (ORNL/SUB/94-SV004/1) concluded that a significant market opportunity would exist for active desiccant systems if it could be demonstrated that they can remove a significant proportion of common airborne contaminants while simultaneously performing the primary function of dehumidifying a stream of outdoor air or recirculated building air. If the engineering community begins to follow the intent of ASHRAE Standard 62, now part of all major building codes, the outdoor air in many major cities may need to be pre-cleaned before it is introduced into occupied spaces.
Common air contaminant cosorption capability would provide a solution to three important aspects of the ASHRAE 62-89 standard that have yet to be effectively addressed by heating, ventilation, and air-conditioning (HVAC) equipment manufacturers:
1. The ASHRAE standard defines acceptable outdoor air quality. If the outdoor air contains
unacceptable levels of certain common outdoor air contaminants (e.g., sulfur dioxide, ozone), then the standard requires that these contaminants be removed from the outdoor air stream to reach compliance with the acceptable outdoor air quality guidelines.
2. Some engineers prefer to apply a filtration or prescriptive approach rather than a ventilation approach to solving indoor air quality problems. The ASHRAE standard recognizes this approach provided that the filtration technology exists to remove the gaseous contaminants encountered. The performance of current gaseous filtration technologies is not well documented, and they can be costly to maintain because the life of the filter is limited and the cost is high. Moreover, it is not easy to determine when the filters need changing. In such applications, an additional advantage provided by the active desiccant system would be that the same piece of equipment could control space humidity and provide filtration, even during unoccupied periods, if the active desiccant system were operated in a recirculation mode.
3. Almost all major medical, university, and research facilities face the dilemma that the air exhausted from a building exits near the intake of another building. As a result, contaminants exhausted outdoors are pulled back into the same or an adjacent building. The removal of contaminants from outdoor air that an active desiccant system offers would be attractive to applications in such cases.
The primary objective of this research project was to quantify the ability of the SEMCO composite
desiccant dehumidification wheel to purify outdoor and recirculated air streams by removing gaseous contaminants commonly encountered in actual applications. This contaminant removal is provided simultaneously with dehumidification (removing the latent load) of these air streams at conditions encountered in HVAC applications. This research builds upon initial seed work completed by the Georgia Tech Research Institute (GTRI) during 1993 (Bayer and Downing 1993).


3
2. BACKGROUND: PREVIOUS RESEARCH COMPLETED BY GTRI
In 1993, a small research investigation was completed by GTRI, with limited seed funding, to document the ability of the SEMCO composite wheel to remove airborne contaminants. This testing was conducted in the SEMCO test laboratory, with all instrumentation and evaluation provided by GTRI. This research was supported by the Gas Research Institute (Bayer and Downing 1993).
The small (approximately 20-in.-diameter) wheel tested as part of this program was designed to contain a percentage of hydrophobic molecular sieve as part of the composite desiccant coating applied to a thin aluminum substrate. The hydrophobic molecular sieve was included specifically to enhance the ability of the active wheel to remove airborne gaseous contaminants.
As part of this testing, six contaminants commonly encountered in indoor and/or outdoor environments were investigated. These materials were selected by GTRI, as well as the challenge concentration to represent conditions likely to exist in an actual application. The contaminants selected are presented in Table 1.
Table 1. Results of testing the SEMCO 1M dehumidification wheel Pollutant concentration
Pollutant Wheel inlet Wheel outlet Ambient
Removal %
Sulfur dioxide 53 ppb 4 ppb 2.1 ppb 92 Ozone 60 ppm 12 ppm 3.0 ppm 80 Formaldehyde 1.2 ppm 0.3 ppm 0.75 ppm 75 Hexane (low)a (high)a
1.72 ppm 1.72 ppm
0.18 ppm 1.1 ppm
0.0 ppm 0.0 ppm
90 36
Toluene (high)a
5.75 ppm
2.4 ppm
0.0 ppm
61
Carbon dioxide 1325 ppm 425 ppm 350 ppm 68 aHigh humidity condition entering wheel; ambient refers to laboratory background pollutant concentration. Source: Bayer, Charlene and Christopher Downing 1993. Cosorption of Airborne Pollutants by the SEMCO 1M Dehumidification Wheel: Phase 1 Test Results, Georgia Tech Research Institute, Atlanta, April.
One primary objective of this 1993 testing was to determine whether an active desiccant wheel could
effectively remove airborne gaseous contaminants from an airstream. Another equally important objective was to determine if effective removal could occur while the desiccant wheel was processing the very high moisture load (high humidity) that exists during typical cooling season conditions.
To answer these questions, the small active desiccant wheel was placed in a test loop that had the capability to create the outdoor air humidity conditions typically encountered during the cooling season. Testing was conducted with an entering outdoor temperature of 96°F and at two incoming humidity levels. Outdoor design humidity levels of 112 grains of moisture (high) and a more moderate 80-grain ambient moisture level were used to challenge the wheel, along with the injected contaminant. Data were collected for all contaminants at the high humidity level and for one representative contaminant (hexane) at the lower humidity level. The purpose of this testing was to determine if, as anticipated, the removal efficiency would increase as the level of moisture in the outdoor air decreased. Increased effectiveness was anticipated because the number of adsorption sites available to the contaminant increases as the moisture level in the airstream decreases.
Because of the limited funding available, data were collected only at the maximum regeneration air temperature condition of 275°F. This temperature was reached and maintained by heating the regeneration airstream with an electric resistance heater.

4
The contaminant concentrations were measured in the ambient (laboratory) air, the challenge air in, the challenge air out, and the regeneration air in (ambient) and out. GTRI selected instrumentation to provide accurate results for the individual contaminants chosen. The challenge contaminants were carefully metered and delivered to the test loop at very low concentrations as required to emulate common indoor and outdoor air environments. This controlled delivery was accomplished by introducing contaminants in the form of compressed bottled gases. The analytical methodology and procedures used to maintain and measure the contaminant levels investigated are discussed in Appendix A.
Table 1 provides a summary of the results collected as part of the 1993 research investigation. As shown, the level of removal measured for all of the challenge contaminants was quite high. As expected, the amount of removal dropped as the absolute humidity level of the challenge airstream increased, based on the hexane data.
These results answered the questions raised by the objectives set for this initial research: High percentages of common gaseous contaminants could be removed, even at high ambient humidity levels.
Answering these initial questions raised new, secondary questions. For example, how would the removal efficiencies be impacted by the lower regeneration temperatures that would be common in typical applications? Will the removal efficiency degrade over time? How will the performance at an actual installation site compare with the data collected in the laboratory? The Composition of the Active Desiccant Wheels Investigated
It is important to mention that these initial findings, as well as those presented later in this report, are limited to the particular active desiccant wheel matrix investigated. The SEMCO wheel was specifically developed to provide targeted cosorption of common indoor and outdoor contaminants, specifically volatile organic compounds (VOCs), along with moisture adsorption. The SEMCO wheels tested as part of the 1993 laboratory investigation, as well as the two wheels tested as part of this investigation (one at the GTRI Baker Building and the other at Berry College), all utilized a composite (mixture) desiccant/adsorbent coating designed for the purpose of effective cosorption. Details of the SEMCO active desiccant wheel composite coating can be found in U.S. Patent 5,300,138 (Fisher and Thomas 1993)
2.1 GTRI Baker Laboratory Building Installation
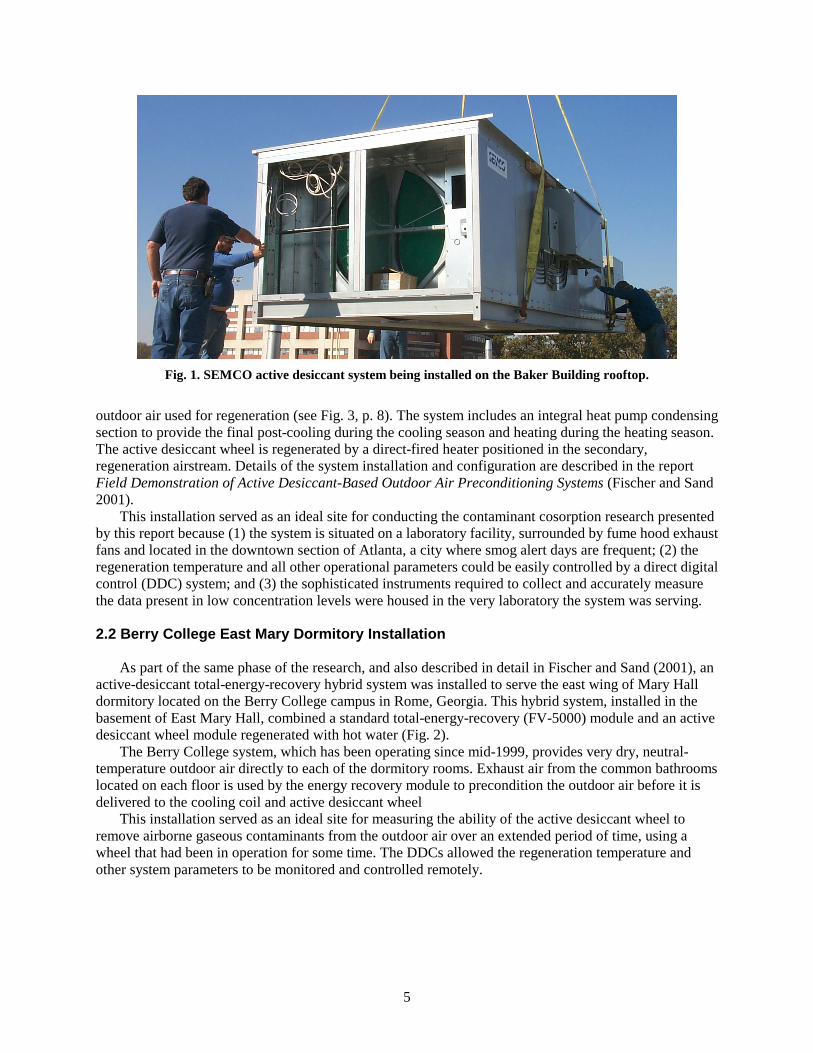
As part of a separate phase of this research program sponsored by the U.S. Department of Energy, a 3,000-cfm active desiccant system was installed on the Baker Research Building located on the Georgia Tech campus (Fig. 1). The Baker Research Building houses the Georgia Tech Environmental Monitoring Branch, one of the most respected indoor air quality research groups in the country. Because of the sophisticated instrumentation (sensitive mass spectrometers) used for indoor air quality research, a clean environment free from external contaminants, with effective temperature and humidity control, was desired for the laboratories served by the pilot/prototype system.
To segregate the indoor air quality laboratory from the rest of the building contaminants, it must be served by its own outdoor air system and the laboratory pressurized relative to the rest of the building. Because the outdoor air preconditioning system must be located on the roof of the building, another problem arose: Approximately 30 fume hood exhaust fans are also located on the roof. This problem, which is common for chemical research facilities, would add to the concentration of contaminants re-entrained into the incoming ventilation air feeding the laboratory. Therefore, this application required a system that could provide 100% outdoor air to the laboratory while controlling temperature and humidity and effectively filtering particulates and removing airborne gaseous contaminants from the outdoor air.
A system was designed for the Baker building to meet these needs. It uses a desiccant-based cooling configuration (DBC), combining an active desiccant wheel to dehumidify the outdoor air (Fig. 2) with an epoxy-coated sensible-only energy wheel to both cool the air leaving the desiccant wheel and preheat the
5
Fig. 1. SEMCO active desiccant system being installed on the Baker Building rooftop.
outdoor air used for regeneration (see Fig. 3, p. 8). The system includes an integral heat pump condensing section to provide the final post-cooling during the cooling season and heating during the heating season. The active desiccant wheel is regenerated by a direct-fired heater positioned in the secondary, regeneration airstream. Details of the system installation and configuration are described in the report Field Demonstration of Active Desiccant-Based Outdoor Air Preconditioning Systems (Fischer and Sand 2001).
This installation served as an ideal site for conducting the contaminant cosorption research presented by this report because (1) the system is situated on a laboratory facility, surrounded by fume hood exhaust fans and located in the downtown section of Atlanta, a city where smog alert days are frequent; (2) the regeneration temperature and all other operational parameters could be easily controlled by a direct digital control (DDC) system; and (3) the sophisticated instruments required to collect and accurately measure the data present in low concentration levels were housed in the very laboratory the system was serving.
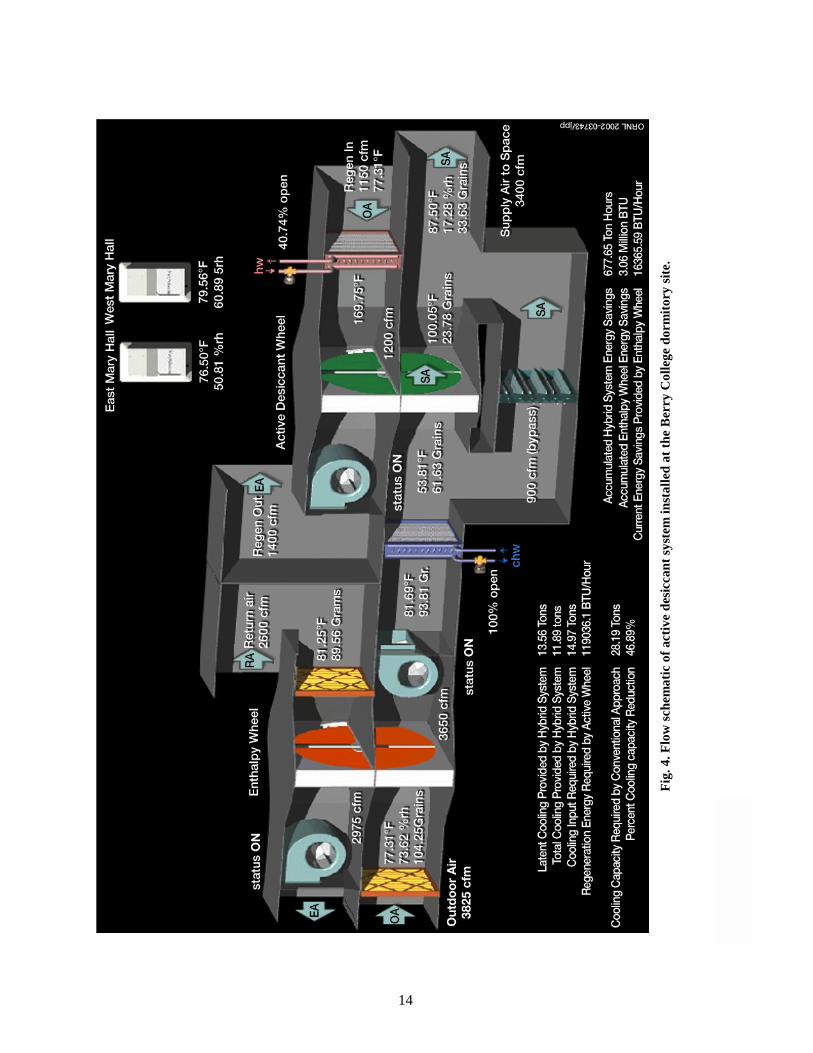
2.2 Berry College East Mary Dormitory Installation As part of the same phase of the research, and also described in detail in Fischer and Sand (2001), an
active-desiccant total-energy-recovery hybrid system was installed to serve the east wing of Mary Hall dormitory located on the Berry College campus in Rome, Georgia. This hybrid system, installed in the basement of East Mary Hall, combined a standard total-energy-recovery (FV-5000) module and an active desiccant wheel module regenerated with hot water (Fig. 2).
The Berry College system, which has been operating since mid-1999, provides very dry, neutral-temperature outdoor air directly to each of the dormitory rooms. Exhaust air from the common bathrooms located on each floor is used by the energy recovery module to precondition the outdoor air before it is delivered to the cooling coil and active desiccant wheel
This installation served as an ideal site for measuring the ability of the active desiccant wheel to remove airborne gaseous contaminants from the outdoor air over an extended period of time, using a wheel that had been in operation for some time. The DDCs allowed the regeneration temperature and other system parameters to be monitored and controlled remotely.

6
Fig. 2. The active desiccant wheel installed as part of the hybrid system at Berry College.

7
3. RESULTS: GTRI BAKER LABORATORY BUILDING SITE The primary objective of the testing at the Baker Building site was to quantify the ability of the active
desiccant wheel to remove both ambient outdoor air contaminants and selected challenge contaminants. The primary focus was to determine its contaminant removal effectiveness at moderate regeneration temperatures and at the high outdoor humidity levels that exist in the Atlanta area. The original research proposal would also have included data at high regeneration temperatures and data collected at low ambient humidity levels. However, funding constraints necessitated a decision to focus on the worst-case conditions, low regeneration temperatures and high ambient humidity, to provide conservative data.
Furthermore, the early seed research provides valuable data at high-regeneration-temperature, low-ambient-humidity conditions to fill gaps in the database. In addition, the long-term field investigation completed at the Berry College site provides data at higher regeneration temperatures and low ambient humidity levels.
3.1 Installation Description and Challenge Procedure
A simplified schematic of the system installed at the Baker Building laboratory site is provided as Fig. 3. To challenge the system with ambient contaminants, sample tubes were simply placed in the appropriate compartments of the system for the duration of the tests. The contaminants were introduced either directly as gases or as nebulized liquids. When the wheel was being challenged with injected contaminants, the supply air stream was vented to the roof (rather than delivered to the space) after being sampled within the system, to ensure that the high challenge levels of contaminants were not inadvertently delivered to the building. The venting was easily accomplished by attaching a steel plate over the supply ductwork serving the laboratory and then opening the access door downstream of the cooling coil.
The access door opening was partially blocked in order to maintain the same airflow quantity (3,000 cfm) and static pressure (1.8 in. of H2O) as during normal operation. The pressure was measured by a TSI Accu-calc® instrument. All testing was completed with the medium-efficiency pleated prefilter media removed and with the SEMCO system operated in a “locked on” regeneration mode. The regeneration temperature was chosen in advance and was maintained at the predetermined value throughout the testing period by the DDC system provided with the test system. The condensing section was locked off during all testing to avoid the possibility that the wetted evaporator cooling coil surface might enhance contaminant removal efficiency. Samples upstream and downstream of the active desiccant wheel were collected through an eight-port sampling manifold to mitigate any concentration gradients or stratification. The SEMCO system had the active wheel speed set at 3 Hz, or approximately 1/3 of a rotation per minute. The wheel was regenerated at two different (moderate) temperatures for each contaminant, 140 and 175°F.
3.2 Initial Ambient Results
The initial contaminant removal results measured the ability of the active desiccant system to remove ambient levels of outdoor contaminants. For this preliminary testing, the active desiccant system was operated in its normal operating mode, with the regeneration temperature locked to its minimum 140°F setting, to provide the most conservative data for cosorption contaminant removal. More important, the system was allowed to cycle, providing only the regeneration energy necessary to meet the desired operating condition. This cosorption testing was intended to reflect the minimum contaminant removal anticipated, in contrast to the data collected in the 1993 seed research in which the regeneration temperature was controlled and operated continually at a maximum level to provide the maximum removal efficiency.

F
ig. 3
. Flo
w s
chem
atic
of
acti
ve d
esic
cant
sys
tem
inst
alle
d at
the
Bak
er R
esea
rch
Bui
ldin
g at
Geo
rgia
Tec
h.
8

9
As shown in Fig. 1, the active desiccant system was located on the roof of the Baker Building adjacent to numerous small fume hood exhaust fans. Depending upon the prevailing wind direction, effluent from these exhaust fans and the fume hoods they serve add to the ambient contaminant level challenging the system.
Tables 2 and 3 summarize the percentages of contaminant removal observed for several aldehydes and ketones measured in the ambient air entering the active desiccant system. The two sets of data provided by these tables were collected 2 months apart and after the system had been operating for approximately 6 months. Under these conditions, the proportion of aldehyde removed ranged between 3% and 27%.
Table 2. Aldehyde and ketone removal by SEMCO unit (month one)
Aldehyde and ketone
Upstream #1 (ppb)
Upstream #2 (ppb)
Downstream #1 (ppb)
Downstream #2 (ppb)
Removal (Avg. of #1 and #2)
(%) Acetaldehyde 7.07 6.65 5.15 4.82 27 Acetone 13.56 13.37 11.92 12.34 10 Propionaldehyde 7.68 7.4 7.29 7.32 3
Table 3. Aldehyde removal by SEMCO unit (month three)
Aldehyde and ketone
Upstream #1 (ppb)
Upstream #2 (ppb)
Downstream #1 (ppb)
Downstream #2 (ppb)
Removal (%)
Formaldehyde 6.99 7.47 6.69 5.27 17 Acetaldehyde 4.38 5.47 4.11 3.61 22 Benzaldehyde 23.74 20.48 21.07 19.45 8
Table 4 summarizes data for removal of the total
volatile organic compounds (TVOCs) tabulated in Appendix Tables A5, A6, A7, and A8, which summarized these data collected at the same time as the aldehyde/ketone removal data in Tables 2 and 3. Under these conditions, the averaged TVOC removal percentage was about 53% (an average incoming TVOC concentration of ≈21 µg/m3 vs an average downstream concentration of ≈9.9 µg/m3).
The raw data used to prepare Tables 2 through 4 are included in Appendix A as Tables A1 through A7. These tables show that other aldehydes were identified in the ambient air but that the levels were near the detection level of the instrumentation, making it impossible to accurately quantify the degree of contaminant removal.
The data presented in Table 4 show that a significant proportion of the TVOC contaminants present in the ambient air was removed despite the moderate temperatures used to regenerate the desiccant wheel. The fact that the regeneration temperature was allowed to modulate provides the most likely explanation for the wide variation between samples 1 and 2 listed in Table 4. The fact that the system was capable of removing an average of 53% of the TVOCs at this condition was encouraging, suggesting that even higher removal percentages would be expected at increased regeneration temperatures.
To improve the accuracy of the data collected, the challenge concentrations of the airborne contaminants introduced to the desiccant wheel were increased to minimize any error in sample analyses.
3.3 Elevated Contaminant Concentration Challenge Results
To spike the incoming airstream with contaminant concentrations higher than ambient levels, select liquid and gaseous compounds were introduced directly to the system intake louver as part of the testing. Liquid chemicals, hexane and toluene, were nebulized with compressed zero-grade air and injected into
Table 4. Percentage removal of total volatile organic compounds, ambient challenge
Sample run Removal (%) No. 1 25 No. 2 67 Average removal percentage 53

10
the fresh air intake by a Perkin-Elmer series 2 liquid chromatography pump unit at a rate of approximately 3 mL per minute.
The gaseous chemicals sulfur dioxide and nitrogen dioxide were released from a cylinder of compressed gas and controlled to an injection rate of approximately 20 mL per minute by a rotometer.
The ozone challenge was accomplished using the naturally occurring ambient concentrations that are typical of Atlanta during the summer. Samples were collected in the afternoon to maximize the ozone challenge concentration. Typical ozone concentrations observed at the time of sampling were in the 50 to 60 parts per billion range.
Table 5 summarizes the results of testing conducted for the contaminants at extreme ambient humidity conditions. The outdoor humidity level during testing is important because the 1993 research concluded that an increase in humidity level decreases the efficiency of the contaminant cosorption. Data for this series of tests are shown in Table 5 for two different, moderate regeneration temperatures (140 and 175EF).
Table 5. Overall percentage of contaminants removed for contaminant challenge
Hexane #1 (%)
Hexane #2 (%)
Toluene (%)
SO2
(%) NO2
(%) Ozone #1
(%) Ozone #2
(%) Regeneration temperature
Percentage of contaminants removed by active desiccant wheel 140° 18 29 60 0 25 15 13 175° 55 56 71 0 33 26 23
No regeneration heat 13 23 Data are also presented for ozone removal with the desiccant wheel regeneration heat turned off. This
condition was investigated because ozone has been shown to break down catalytically to simple oxygen as a result of surface interaction when it passes through certain molecular sieves similar to those used in the active desiccant wheel (Hovrath 1985).
3.3.1 Removal Efficiency at Low Regeneration Temperatures
Contaminant cosorption data were collected at the low-temperature, 140°F, regeneration condition
and at high ambient humidity conditions to represent the worst-case scenario for contaminant adsorption. Under normal operation, the active desiccant system will typically require regeneration temperatures well in excess of 140°F. Nevertheless, the data presented in Table 5 confirm a removal rate for the contaminants investigated ranging from a low of 13% to a high of 60% (with the exception of SO2, which will be discussed later).
The test data presented in Table 5 were obtained at extremely high ambient moisture conditions, (135 grains), far greater than the humidity level used during the 1993 investigation (112 grains of moisture). The 1993 research confirmed that increased moisture loading in the outdoor air results in a reduction in the amount of contaminant removal. For example, research conducted in 1993 reported that hexane removal decreased from 90% to 36% when the moisture content of the airstream was increased by 40%, from 80 to 112 grains of moisture per pound of dry air. It can therefore be said that the extreme humidity conditions used for this phase of testing represent the worst case scenario, and that at more moderate ambient humidity conditions, the percentage of contaminants removed would likely be greater than the levels shown in Table 5. This is highlighted by the long-term data reported later in section 4.2 as part of the Berry College investigation.
Table 5 is a summary of Tables A5 through A8 in Appendix A. These tables include the actual data, including concentrations of contaminants measured, for each data set. They also include details of temperature and humidity of the various airstreams for each sample collected.

11
3.3.2 Removal Efficiency at Moderate Regeneration Temperatures The anticipated trend of increased removal efficiency with increased regeneration temperature is
evident in almost all cases presented by Table 5. The average removal effectiveness for the TVOCs (hexane and toluene) increased from 36 to 61%, a 70% increase. When the regeneration temperature was increased from 140 to 175°F, removal of NO2 and ozone increased by 32% and 75%, respectively.
These data are consistent with the findings reported in the 1993 investigation. Given that the 140°F and 175°F regeneration temperatures used to produce the data presented in Table 5 were much lower than that used in the 1993 investigation (275°F), lower removal percentages were expected. A lower removal rate is especially likely given the elevated ambient humidity levels during testing and sample collection in this investigation (see Appendix A, Tables A10 through A23).
The actual test data collected for the various contaminants at the 175°F regeneration temperature are provided in Tables A11, A13, A15, A17, A20, and A21 in Appendix A.
3.3.3 Removal Efficiency at High Regeneration Temperatures
Because of budgeting and scheduling changes, data could not be collected at a high regeneration
temperature at the Baker Building site. An additional data set at the 200 to 225°F level had been planned, which would have provided valuable information to fill the current gap in the data set between the 140°F, 175°F, and 275°F regeneration data now available. To help compensate for these missing data, the long-term sampling conducted at the Berry site (discussed later) was completed at a 200°F regeneration temperature.
As mentioned earlier, based on the 1993 test data and the data presented in Table 5, higher contaminant removal percentages than those shown at the 175°F regeneration temperature would be expected for cosorption sampling completed at a 200°F regeneration temperature.
The data obtained for SO2 were surprising because it was the only contaminant not cosorbed. During the 1993 laboratory investigation, 92% removal was observed for SO2 (see Table 1) at the elevated regeneration temperature. Given that SO2 is polar, removal was expected even at moderate regeneration temperatures. Additional testing will be required to resolve this apparent inconsistency. It may be possible that the adsorption of SO2 is strongly dependent upon the elevated (275oF) regeneration temperature used in the 1993 investigation.


13
4. LONG-TERM CONTAMINANT REMOVAL TESTING: BERRY COLLEGE DORMITORY
The testing completed on the Berry College dormitory desiccant system installation provided
information regarding three important performance criteria. It involved long-term sampling of contaminants in an actual application. It provided data at a fixed regeneration temperature higher than that used at the Baker Building site (200°F vs 140°F/175°F). Just as important, it provided data at lower ambient humidity levels because the data were collected during the fall.
4.1 Installation Description and Challenge Procedure
A simplified schematic of the active desiccant hybrid preconditioning system installed at the Berry College Dormitory site is provided as Fig. 4. The low contaminant levels that existed normally in the outdoor air at ground level provided the challenge to this system. The outdoor air delivered to this unit is pulled into a duct connected to an intake louver located near the parking lot, which is located at the back of the building.
One set of passive diffusion VOC sampling tubes was installed in the compartment after the cooling coil but before the active desiccant wheel. A second set of sampling tubes was inserted downstream of the desiccant wheel and isolated from the wheel bypass airstream so that the bypass air did not impact the final results. Two tubes were installed in each location to enhance the accuracy of the sample analysis.
The system was operated normally, with the exception of the desiccant system regeneration operation, and samples were collected for approximately one month. To obtain data at a 200°F operating condition, the regeneration temperature was locked on and controlled to approximately 200°F over the testing period. The fact that the samples were collected during the month of November ensured that the ambient humidity level was low. The diffusion tubes were removed after approximately one month of operation, sealed, and then analyzed in the GTRI laboratory using the procedures outlined in Appendix A.
4.2 Long-Term Contaminant Removal Efficiency at the Berry Dormitory
A summary of the data collected at Berry College is given in Table 6, which lists the six contaminants that were found to have the highest concentration in the outdoor airstream. The total listing of the more than 130 individual chemical contaminants identified at Berry are included in Appendix A as Tables A25 and A26.
As shown by Table 6, the active desiccant wheel at the Berry College site provided a very high contaminant removal rate. The average removal rate for all contaminants was determined to be 80%. The average removal rate was 88% for the six contaminants listed in Table 6 that showed the greatest ambient concentration. These removal rates were the averages over the one-month sampling period. The wheel installed at Berry had already operated for approximately 2 years prior to the cosorption testing and sample collection. These data clearly suggest that the cosorption effectiveness remains effective over an extended product life.
Although the Berry College cosorption data suggest unexpectedly high removal rates, the findings may be justifiable. For example, the average VOC removal rate measured during cosorption tests at the Baker Building with a 175°F regeneration temperature was 61%. This is a 70% increase over the 36% removal rate measured at the regeneration temperature of 140°F. Using this relationship as a basis, the 80% removal effectiveness associated with the increase in regeneration temperature from 175°F to 200°F may be reasonable.
Equally important, the data presented in Table 5 for the Baker Building site were collected at extremely high ambient humidity conditions (135 grains of moisture average), while the data for Berry were collected at a much lower average outdoor air humidity (in the range of 60 grains). This is certainly
F
ig. 4
. Flo
w s
chem
atic
of
acti
ve d
esic
cant
sys
tem
inst
alle
d at
the
Ber
ry C
olle
ge d
orm
itor
y si
te.
14

15
Table 6. Percentage of contaminants removed for the six contaminants with the highest concentration in the outdoor air
Contaminant Outdoor air concentration
(µg/m3) Supply air concentration
(µg/m3) Removal efficiency
(%) 2-(2-butoxyethoxy)ethanol 66.9 9.9 85 2-butoxyethanol 34.3 8.2 76 Ethosuximide 47.6 0.8 98 Hexadecane 26.6 5.7 79 Isopropylalcohol 29.8 0.8 97 Limonene 53.8 3.0 94
Total VOC concentration (considering all contaminants)
899 179 80
true when the cooling coil at the Berry College installation is energized, as was the case at Berry most of the time during this sample collection period.
As a result, the increased rate of contaminant removal recorded at the Berry site likely results from a combination of a higher desiccant wheel regeneration temperature and a much lower moisture level in the incoming air.
These data also agree well with the initial data obtained from the 1993 seed research, in which approximately 90% contaminant removal was reported for hexane at the very high regeneration temperature (275EF) and moderate humidity level.
Based upon these data, it becomes clear that the hybrid system applied at Berry College has an added advantage over the system installed at the Baker Building with regard to contaminant cosorption. By design, the Berry College system ensures that a moderate ambient humidity level is always introduced to the active wheel, since the air first passes through a cooling coil. The disadvantage (with respect to cosorption) of the Berry hybrid system design is that not all of the air passes through the desiccant wheel.
The converse is true for the system design applied to the Baker Building in that high ambient humidity levels frequently are delivered to the active desiccant wheel; however, all of the outdoor air passes through the desiccant wheel. As a result, the net contaminant removal of the GTRI system operating at a 60% removal efficiency is on par with a Berry-style, hybrid active desiccant system that bypasses 20% of the outdoor airflow and removes 80% of the contaminants from the remaining airflow that passes through the active desiccant wheel.


17
5. CONCLUSIONS The research summarized by this report demonstrates that an excellent opportunity exists for active
desiccant systems that are designed with the capability to remove high percentages of airborne gaseous contaminants. As has been shown, the active desiccant wheel investigated can remove between approximately 15 and 95% of many airborne, gaseous contaminants while simultaneously performing the primary function of the product, dehumidification.
The degree of contaminant removal will vary depending upon the properties of the individual contaminant, the formulation of the desiccant material, the amount of ambient humidity in the air entering the active desiccant wheel, and the desiccant regeneration temperature. Systems using active desiccant technology can be designed to process all outdoor air so that it can be cleaned, as necessary, to conform to the requirements of Section 6.1.1, “Ventilation Rate Procedure,” of ASHRAE Standard 62-1999 (ASHRAE 1999). This capability would be beneficial to applications such as airports, buildings located in major cities or near highways, and other places where the quality of the outdoor air may be poor.
Active desiccant technology can be used to design systems that meet the intent of Appendix E of ASHRAE Standard 62-1999, “Procedure for Use of Cleaned Recirculated Air” (an informative-only section). An active desiccant system designed to process recirculated air could significantly reduce the amount of outdoor air required for ventilation in Table 2, “dilution ventilation approach” of Appendix E, ASHRAE Standard 62-1999, if these guidelines are followed. Given that the recirculated air would contain a low humidity level by design, even moderate regeneration temperatures would result in high contaminant removal efficiencies.
The contaminant removal rates documented by this investigation present clear, significant opportunities for a commercialized active desiccant product capable of cosorbing contaminants from outdoor and/or recirculated airstreams. The specific removal rates reported are based upon the active desiccant wheel technology developed by SEMCO.
5.1 Impact of Ambient Humidity Content on Removal Efficiency
The data collected as part of this research confirmed the initial findings from the 1993 investigation with regard to the impact of ambient humidity on contaminant cosorption efficiency. Higher ambient humidity conditions tend to reduce the contaminant removal percentages, and lower ambient humidity levels tend to increase them (Fig. 5). The reason probably is that as less moisture resides on the adsorbent surface, more sites become available within the active desiccant wheel matrix for contaminant cosorption.
5.2 Impact of Regeneration Temperature on Removal Efficiency
The data collected as part of this research also confirmed the logical expectation (based upon theory, manufacturer literature, and moisture behavior) that the higher the regeneration temperature, the higher the percentage of contaminants removed. However, the research confirmed that at even moderate desiccant regeneration temperatures (say 175EF), contaminant removal levels could still be high. Most important, at the more typical 200°F regeneration temperature, very high removal percentages were observed (i.e., 80% for TVOCs measured at the Berry Site).
Figure 5 is an image of the relative impact of the desiccant regeneration temperature and ambient humidity level on the capability of the active desiccant wheel to remove VOCs, based upon the findings of this study. The highest removal efficiency will likely occur when the regeneration temperature remains relatively high and the ambient humidity remains relatively low (e.g., the Berry College case). The contaminant removal efficiency will likely be lowest when the regeneration temperature is relatively low and the ambient humidity level is high (e.g., the Georgia Tech Baker Building case).
Control options that go beyond the scope of this report are available to allow for optimizing contaminant removal efficacy as the ambient humidity conditions change over time.

18
Fig. 5. Relative impact of regeneration temperature and ambient moisture on the contaminant removal percentage.
5.3 Recommendations for Further Research
Future research should focus on the missing portion of the database. These data would include challenge testing at the Baker Building site with a 200°F regeneration temperature, retesting all regeneration temperatures at moderate ambient humidity levels, and retesting with sulfur dioxide as a contaminant at a high-regeneration-temperature operating condition.
Low Regeneration Temperature High
Ambient Humidity(grains)
Low
High
40
20
60
0
80
ContaminantRemoval
(%)
19
6. REFERENCES Bayer, Charlene and Christopher Downing 1993. Cosorption of Airborne Pollutants by the SEMCO 1M
Dehumidification Wheel: Phase 1 Test Results, Georgia Tech Research Institute, Atlanta, April. Fischer, John C., and Tudor L. Thomas 1993. “Langmuir Moderate Type 1 Desiccant Mixture for Air
Treatment,” U.S. Patent 5,300,138, January 21. Fisher, J. and J. Sand 2001. Field Demonstration of Active Desiccant-Based Outdoor Air Preconditioning
Systems, ORNL/SUB/94-SV044/3, Oak Ridge National Laboratory, July. Horvath, M., et al. 1985. Ozone, Elsevier Science Publishing, New York. ASHRAE 1999. Ventilation for Acceptable Indoor Air Quality, Standard 62-1999, American Society of
Heating, Refrigeration, and Air-Conditioning Engineers, Atlanta.

21
APPENDIX A ANALYTICAL METHODS AND SAMPLING PROCEDURES
A.1 Analytical Methodology VOC Analysis
The volatile organic compound (VOC) sampler consisted of a stainless steel tube (3.5 × 0.25 in. o.d.).
The tube was packed from inlet to exit with 160 mg of 60/80 mesh Tenax TA and 160 mg of 60/80 mesh Carbotrap (Supelco Inc., Bellefonte, PA). Stainless steel wire mesh screens were inserted at the front and back of each individual adsorbent bed. In addition, glass wool was placed on the inlet side of the last screen. Prior to use, the tubes were conditioned in a tube oven at 300°C with a nominal nitrogen flow of 50 mL/minute for at least 14 hours. After conditioning, the tubes were capped with Swagelok caps with Teflon ferrules.
Samples were collected for approximately 1 hour using personal air sampling pumps calibrated to approximately 0.200 L/minute. Actual sampling times and calibrated airflows were recorded for every sample. Accompanying each sample set were field blank tubes returned for analysis with the sample set. The samples were stored at –2EC in a laboratory freezer until analysis. The tubes were spiked with an internal standard (ISTD) of toluene-d8, resulting in a final concentration of 188.6 ng per tube. The ISTD was prepared in methanol. The ISTD methanol solution was injected onto each sample tube. The tubes were flushed with a nitrogen stream of 150 mL/minute to remove the methanol and push the toluene-d8 onto the adsorbent.
Thermal desorption was accomplished with a Perkin-Elmer model ATD-400 automatic thermal desorption unit. Separation and detection were achieved by coupling the ATD-400 to a Hewlett-Packard model 5890A gas chromatograph (GC)/VG model Trio 1 mass spectrometer. Analysis conditions are shown in Table A23.
Quantitation was based on either the mass spectrometric response or the toluene-d8. The quantitation based on toluene-d8 produces semi-quantitative results because not all compounds give an identical mass spectral response as does the toluene-d8. Mass spectral interpretation was based on the best match in conjunction with manual interpretation according to the NIST and WILEY mass spectral libraries, match to an authentic standard, or manual interpretation.
Diffusion VOC Analysis The diffusion VOC sampler consisted of a stainless steel tube (3.5 × 0.25 in. o.d.). The tube was
packed from inlet to exit with 100 mg of 60/80 mesh Tenax TA (SKC, Inc., Eighty Four, PA). Stainless steel wire mesh screens were inserted at the front and back of each individual adsorbent bed. Prior to use, the tubes were conditioned in a tube oven at 300°C with a nominal nitrogen flow of 50 mL/minute for at least 14 hours. After conditioning, the tubes were capped with Swagelok caps with Teflon ferrules.
The collection period for the time-integrated VOC samples was approximately 30 days. Samples were collected by removing one of the Swagelok® caps and securing the tube in the airstream. At the end of the sampling period, the Swagelok® cap was reinstalled on the sampling tube to seal the sample. Sample volume was calculated from the passive uptake rate of 0.33 mL/minute using the equation
C = Ws /(Um × ts)
where
C = concentration in mg/m3 Ws = weight of the compound detected on the tube

22
Um = uptake rate in ml/min Ts = sampling time in min
The uptake rate (Um) is defined as
Um = (60 × D1A)/Z
where Um = uptake rate in ml/min D1 = diffusion coefficient through air of the vapor in cm2/sec A = cross-sectional area of the sampling tube in cm2 Z = path length of the air gap in cm. The samples were stored at –2°C in a laboratory freezer until analysis. The tubes were spiked with an
ISTD of toluene-d8, resulting in a final concentration of 188.6 ng per tube. The ISTD was prepared in methanol. The ISTD methanol solution was injected onto each sample tube. The tubes were flushed with a nitrogen stream of 150 mL/minute to remove the methanol and push the toluene-d8 onto the adsorbent. Analysis conditions are shown in Table A1.
Table A1. VOC analysis conditions Parameter TD/GC/MS settings
Desorption temperature, °C 300 Desorption time, mins 10 Desorption flow, mL/min 50 Valve temperature, °C 225 Cold trap temperature (low), °C –30 Cold trap temperature (high), °C 300 Cold trap hold time, min 4 Inlet split No Outlet split Yes Outlet split % (% on column) 10 Transfer line temperature, °C 250 Carrier gas Helium System pressure, psi 28 Analytical GC column Stabilwax, 60 m × 0.25 mm
1.0 µm film thickness Average linear velocity, cm/sec 32 Initial oven temperature, °C 32 Initial oven time, min 32 First oven rate, °C/min 2.5 First oven temperature 65 Second oven rate °C/min 5 Final oven temperature, °C 225 Final oven time, min 10 Scan range, m/z 40–450 Scan time, sec 0.6

23
Aldehyde and Ketone Samples Aldehydes and ketones were collected on dinitrophenylhydrazine-coated silica gel-filled Sep-Paks
(Waters Corp.) according to Environmental Protection Agency method IP-6A. Samples were collected for approximately 1 hour using personal air sampling pumps calibrated to approximately 0.500 L/minute. Actual sampling times and calibrated airflows were recorded for every sample. Accompanying each sample set were field blank tubes returned for analysis with the sample set. The samples were stored at –2°C in a laboratory freezer until analysis.
Desorption was with 2.5 mL of acetonitrile. Analysis was by high-pressure/liquid chromatography (HPLC) using two serially connected C18 columns. Analysis conditions are shown in Table A2.
Identification was based on retention time match with authentic standards (Supelco, Inc.). Quantitation was achieved through regression analysis of the instrumental response of the samples compared with the instrumental response of several different concentrations of the authentic standards.
Table A2. Aldehyde and ketone analysis conditions Parameter HPLC settings
Analytical LC column Two (2) Waters Nova-pak C18, 3.9 mm × 150 mm
Initial solvent mix Acetonitrile/water/tetrahydrofuran Initial solvent % 25/65/10 Initial time, min 2 Gradient time, min 25 Final solvent mix Acetonitrile/water Final solvent % 75/25 Final time, min 8 Solvent flow rate, mL/min 1.25 UV wave length, nm 360
Bruel & Kjaer Photoacoustic Multi-Gas Monitor Real-time hexane and toluene measurements were made using a Bruel & Kjaer (B&K) photoacoustic
multi-gas monitor. The B&K measurements were corrected for water content interference based on dew point.
Ozone Monitor Real-time ozone measurements were made using a Thermo Environmental Instruments model 49C
ozone analyzer. The analyzer was factory calibrated and provided direct readings in parts per billion level.
Sulfur Dioxide and Nitrogen Dioxide Monitor The Enmet Omni-4000 portable gas detector was used to measure sulfur dioxide and nitrogen dioxide
levels. The monitor was factory calibrated and provided direct readings in the parts per million level.
A.2 Quality Assurance/Quality Control Good laboratory practices were followed to ensure good quality assurance and quality control. All
sampling equipment was pre- and post-calibrated to yield average sampling volumes. All analytical instruments were calibrated at least once daily during operation or according to manufacturers’ instructions.

24
A.3 Raw and Reduced Cosorption Data Field blanks, laboratory blanks, and replicate samples were analyzed for quality control purposes. A
field blank accompanied each type of sampling media to the field during each phase. At least one replicate sample was collected for each type of sampling medium.
Chain-of-custody procedures were followed for all samples. Samples were labeled and sealed immediately after completion of sampling at each sampling site. All data were recorded in bound laboratory notebooks. The samples were logged upon receipt at the laboratory by the laboratory sample custodian. Samples were analyzed according to sample log number and initial reports prepared by sample log number. The identities of the samples were associated only with the log numbers during the preparation of the final report.
Table A3. Aldehyde and ketone removal by SEMCO unit (month one)
Aldehyde and ketone Upstream #1
(ppb) Upstream #2
(ppb) Downstream #1
(ppb) Downstream #1
(ppb) Removal
(%) Formaldehyde <6.54 <6.54 <6.54 <6.54 0 Acetaldehyde 7.07 6.65 5.15 4.82 27 Acetone 13.56 13.37 11.92 12.34 10 Acrolein <3.27 <3.27 <3.27 <3.27 0 Propionaldehyde 7.68 7.40 7.29 7.32 3 Crotonaldehyde <3.27 <3.27 <3.27 <3.27 0 Methacrolein <3.27 <3.27 <3.27 <3.27 0 Methyl ethyl ketone <3.27 <3.27 <3.27 <3.27 0 Butraldehyde <3.27 <3.27 <3.27 <3.27 0 Benzaldehyde 18.00 12.21 14.95 13.44 6 Valeraldehyde <3.27 <3.27 <3.27 <3.27 0 p-Tolualdehyde <3.27 <3.27 <3.27 <3.27 0 Hexaldehyde <3.27 <3.27 <3.27 <3.27 0
Table A4. Aldehyde and ketone removal by SEMCO unit (month three)
Aldehyde and ketone Upstream #1
(ppb) Upstream #2
(ppb) Downstream #1
(ppb) Downstream #1
(ppb) Removal
(%) Formaldehyde 6.99 7.47 6.69 5.27 17 Acetaldehyde 4.38 5.47 4.11 3.61 22 Acetone <3.27 <3.27 <3.27 <3.27 0 Acrolein <3.27 <3.27 <3.27 <3.27 0 Propionaldehyde <3.27 <3.27 <3.27 <3.27 0 Crotonaldehyde <3.27 <3.27 <3.27 <3.27 0 Methacrolein <3.27 <3.27 <3.27 <3.27 0 Methyl ethyl ketone <3.27 <3.27 <3.27 <3.27 0 Butraldehyde <3.27 <3.27 <3.27 <3.27 0 Benzaldehyde 23.74 20.48 21.07 19.45 8 Valeraldehyde <3.27 <3.27 <3.27 <3.27 0 p-Tolualdehyde <3.27 <3.27 <3.27 <3.27 0 Hexaldehyde <3.27 <3.27 <3.27 <3.27 0

25
Table A5. VOCs in upstream air to SEMCO unit #1
Table A6. VOCs in upstream air to
SEMCO unit #2 Chemical µg/m3 Chemical µg/m3
1,3,5-trimethylbenzene 0.13 1,1,2-trichloro-1,2,2-trifluoroethane 0.70 1-hexene 0.40 1,3,5-trimethylbenzene 0.10
2,2-dimethylbutane 1.58 1-butanol 1.08 2-methyl-1-butene 0.27 1-propanol 5.17
3-methylhexane 1.49 2,2-dimethylhexane 0.14 3-pentene 0.43 2,3,4-trimethylpentane 0.24 Acetone 0.08 2,3-dimethylhexane 0.23
Benzaldehyde 0.86 3-methylhexane 0.99 Benzene 0.22 3-methylpentane 0.54
Decane 1.92 3-methylpentene 0.16 Ethanol 0.46 Acetone 5.78 Ethylbenzene 1.09 Benzaldehyde 0.23
Heptane 0.26 Benzene 0.62 Hexane 0.28 Butanal (butyraldehyde) 0.17
Isopentane 0.12 Chloroform 0.11 M&P-xylene 1.90 Decane 0.33
Methylcyclohexane 0.14 Ethanol 0.08 Methylcyclopentane (MCP) 0.40 Ethyl acetate 0.30 Nonane 0.74 Ethylbenzene 0.38
O-xylene 0.25 Heptane 0.25 Perchloroethylene (PERC) 0.20 Hexane 1.01
Substituted C6 hydrocarbon 0.77 Isopentane 2.59 Toluene 0.18 Isoprene 0.25 Trichloroethylene 0.38 M&P-xylene 0.83
Undecane 0.15 Methyl chloroform 0.08
TVOC 14.71 Methyl isobutyl ketone (MIBK) 0.13
Methylcyclopentane (MCP) 0.45
Nonane 0.21
Octane 0.33
O-xylene 0.32
Perchloroethylene (PERC) 0.16
Propylbenzene 0.08
Substituted C6 hydrocarbon 0.85
Toluene 2.19
Trichloroethylene 0.27
TVOC 27.35

26
Table A10. Hexane removal with 140° maximum regeneration temperature applied to wheel
Inlet temperature (°F) = 87 Exit temperature (°F) = 90 Inlet % relative humidity = 68% Exit % relative humidity = 37% Inlet grains/lb = 135 Exit grains/lb = 81 Inlet dewpoint (°F) = 75 Exit dewpoint (°F) = 60
Upstream Downstream Removal (%) 37.91 30.97 18.3 43.54 28.9
Table A11. Hexane removal with 175° maximum regeneration temperature applied to wheel
Inlet temperature (°F) = 92 Exit temperature (°F) = 97 Inlet % relative humidity = 63% Exit % relative humidity = 35% Inlet grains/lb = 143 Exit grains/lb = 53 Inlet dewpoint (°F) = 77 Exit dewpoint (°F) = 49
Average concentration ppm Upstream Downstream Removal (%)
46.45 21.03 55 47.86 56
Table A7. VOCs in downstream air to SEMCO unit #1
Chemical µg/m3 1,3,5-trimethylbenzene 0.10 2-methyl-1-butene 0.30 3-methylhexane .84 Acetone 0.56 Benzaldehyde 0.22 Benzene 0.11 Decane 1.28 Ethanol 0.26 Ethylbenzene 1.24 Heptane 0.09 Hexane 0.17 Isopentane 0.12 M&P-xylene 3.45 Methylcyclopentane (MCP) 0.33 Nonane 0.52 O-xylene 0.44 Toluene 0.61 Trichloroethylene 0.13 Undecane 0.21 TVOC 10.98
Table A8. VOCs in downstream air to SEMCO unit #2
Chemical µg/m3 1,3,5-trimethylbenzene 0.25 Acetone 0.74 Benzaldehyde 0.39 Benzene 0.20 Decane 1.45 Ethanol 0.31 Ethylbenzene 1.02 Heptane 0.11 Hexane 0.29 Isopentane 0.14 M&P-xylene 2.64 Methylcyclopentane (MCP) 0.19 Nonane 0.49 O-xylene 0.37 Toluene 0.24 Trichloroethylene 0.16 TVOC 8.99
Table A9. Percentage removal of TVOC ambient challenge
Sample #1 25% Sample #2 67% Averaged samples 53%

27
Table A12. Toluene removal with 140° maximum regeneration temperature applied to wheel
Inlet temperature (°F) = 94 Exit temperature (°F) = 97 Inlet % relative humidity = 60% Exit % relative humidity = 37% Inlet grains/lb = 152 Exit grains/lb = 60 Inlet dewpoint (°F) = 78 Exit dewpoint (°F) = 52
Average concentration ppm Upstream Downstream Removal (%)
39.21 15.67 60
Table A13. Toluene removal with 175° maximum regeneration temperature applied to wheel
Inlet temperature (°F) = 92 Exit temperature (°F) = 97 Inlet % relative humidity = 63% Exit % relative humidity = 35% Inlet grains/lb = 143 Exit grains/lb = 53 Inlet dewpoint (°F) = 77 Exit dewpoint (°F) = 49
Average concentration ppm Upstream Downstream Removal (%)
39.21 11.38 71
Table A14. SO2 removal with 140° maximum regeneration
temperature applied to wheel Inlet temperature (°F) = 90 Exit temperature (°F) = 96 Inlet % relative humidity = 66% Exit % relative humidity = 24% Inlet grains/lb = 147 Exit grains/lb = 63 Inlet dewpoint (°F) = 77 Exit dewpoint (°F) = 53
Average concentration ppm Upstream Downstream Removal (%)
1.4 1.4 0
Table A15. SO2 removal with 175° maximum regeneration temperature applied to wheel
Inlet temperature (°F) = 94 Exit temperature (°F) = 119 Inlet % relative humidity = 59% Exit % relative humidity = 8% Inlet grains/lb = 147 Exit grains/lb = 43 Inlet dewpoint (°F) = 77 Exit dewpoint (°F) = 43
Average concentration ppm Upstream Downstream Removal (%)
1.4 1.4 0
Table A16. NO2 removal with 140° maximum regeneration temperature applied to wheel
Inlet temperature (°F) = 93 Exit temperature (°F) = 107 Inlet % relative humidity = 61% Exit % relative humidity = 16% Inlet grains/lb = 142 Exit grains/lb = 60 Inlet dewpoint (°F) = 77 Exit dewpoint (°F) = 52
Average concentration ppm Upstream Downstream Removal (%)
0.4 0.3 25

28
Table A17. NO2 removal with 175° maximum regeneration temperature applied to wheel
Inlet temperature (°F) = 90 Exit temperature (°F) = 117 Inlet % relative humidity = 61% Exit % relative humidity = 11% Inlet grains/lb = 135 Exit grains/lb = 56 Inlet dewpoint (°F) = 75 Exit dewpoint (°F) = 50
Average concentration ppm Upstream Downstream Removal (%)
0.53 0.36 32
Table A18. Ozone removal with 140° maximum regeneration temperature applied to wheel, sample #1
Inlet temperature (°F) = 94 Exit temperature (°F) = 107 Inlet % relative humidity = 55% Exit % relative humidity = 12% Inlet grains/lb = 132 Exit grains/lb = 45 Inlet dewpoint (°F) = 75 Exit dewpoint (°F) = 45
Average concentration ppb Upstream Downstream Removal (%)
55 47 15
Table A19. Ozone removal with 140° maximum regeneration temperature applied to wheel, sample #2
Inlet temperature (°F) = 90 Exit temperature (°F) = 96 Inlet % relative humidity = 59% Exit % relative humidity = 22% Inlet grains/lb = 128 Exit grains/lb = 59 Inlet dewpoint (°F) = 74 Exit dewpoint (°F) = 52
Average concentration ppb Upstream Downstream Removal (%)
60 52 13
Table A20. Ozone removal with 175° maximum regeneration temperature applied to wheel, sample #1
Inlet temperature (°F) = 93 Exit temperature (°F) = 118 Inlet % relative humidity = 56% Exit % relative humidity = 8% Inlet grains/lb = 132 Exit grains/lb = 39 Inlet dewpoint (°F) = 75 Exit dewpoint (°F) = 41
Average concentration ppb Upstream Downstream Removal (%)
53 40 25
Table A21. Ozone removal with 175° maximum regeneration temperature applied to wheel, sample #2
Inlet temperature (°F) = 91 Exit temperature (°F) = 115 Inlet % relative humidity = 60% Exit % relative humidity = 11% Inlet grains/lb = 138 Exit grains/lb = 50 Inlet dewpoint (°F) = 75 Exit dewpoint (°F) = 47
Average concentration ppb Upstream Downstream Removal (%)
59 46 22

29
Table A22. Ozone removal with no regeneration applied to wheel, sample #1
Inlet temperature (°F) = 94 Exit temperature (°F) = 93 Inlet % relative humidity = 54% Exit % relative humidity = 53% Inlet grains/lb = 130 Exit grains/lb = 130 Inlet dewpoint (°F) = 75 Exit dewpoint (°F) = 73
Average concentration ppb Upstream Downstream Removal (%)
55 48 13
Table A23. Ozone removal with no regeneration applied to wheel, sample #2
Inlet temperature (°F) = 89 Exit temperature (°F) = 88 Inlet % relative humidity = 62% Exit % relative humidity = 37% Inlet grains/lb = 129 Exit grains/lb = 76 Inlet dewpoint (°F) = 74 Exit dewpoint (°F) = 58
Average concentration ppb Upstream Downstream Removal (%)
59 46 22
Table A24. Overall percentage removal for contaminant challenge Regeneration temperature
Hexane #1 Hexane #2 Toluene SO2 NO2 Ozone #1 Ozone #2 Overall average for
all contaminants 140° 18% 29% 60% 0% 25% 15% 13% 23% 175° 55% 56% 71% 0% 33% 26% 23% 38%
No heat 13% 23%

30
A.4 Long-Term Cosorption Data: SEMCO Hybrid System at East Mary Dormitory
Table A25. Berry College long-term results entering active desiccant wheel
Outdoor Air Contaminant Concentration: (Before SEMCO Active Wheel) Compound Outdoor Air VOC 1 Outdoor Air VOC 2 Sample Average
1-(1,1-dimethyl)-2-methylpropanoate (2) 13.36 14.34 13.85 1-(2-methoxypropoxy)-2-propanol (2) 12.41 12.23 12.32 1,2,3-trimethylbenzene (1) 4.66 4.63 4.645 1,2,4-trimethylbenzene (1) 3.79 3.67 3.73 1,2-dimethylbenzene (1) 4.65 4.25 4.45 1,3,5-trimethylbenzene (1) 11.88 10.38 11.13 1,3-pentadiene (2) 0.29 0.23 0.26 1,4-dichlorobenzene (2) 6.6 6.72 6.66 1-butoxy-2-propanol (2) 19.47 18.3 18.885 1-chloro-2-methylbenzene (2) 5.02 4.49 4.755 1-ethyl-2-methylbenzene (1) 0.01 3.81 1.91 1-ethyl-3-methylbenzene (2) 11.7 11.61 11.655 1-ethyl-3-methylcyclohexane (2) 0.78 0.79 0.785 1-ethynylcyclohexanol (2) 2.02 1.79 1.905 1-methyl-3-(1-methylethyl) benzene (2) 7.85 7.39 7.62 1-methyl-3-propylbenzene (2) 2.13 2.44 2.285 1-methyl-4-(1-methylethenyl)benzene (2) 8.25 6.84 7.545 2-(1,1-dimethylethyl)cyclohexanol (2) 4.57 5.03 4.8 2-(1-methylethyl)phenol (2) 1.19 2.39 1.79 2-(2-butoxyethoxy)ethanol (2) 62.36 71.39 66.875 2-(2-ethoxyethoxy)ethanol (2) 2.46 2.84 2.65 2,2,3,3-tetramethylhexane (2) 1.75 1.58 1.665 2,3,8-trimethyldecane (2) 0.72 0.78 0.75 2,4,6-trimethyloctane (2) 2.75 2.6 2.675 2,5-dimethylheptane (2) 4.38 4.26 4.32 2,6-dimethyl-7-octen-2-ol (2) 4.42 4.45 4.435 2,6-dimethyltoctane (2) 0.67 0.69 0.68 2,6-dimethylundecane (2) 1.63 1.63 1.63 2,7-dimethylnaphthalene (2) 2.28 2.99 2.635 2,9-dimethylundecane (2) 3.75 3.75 3.75 2-butoxyethanol (2) 35.31 33.37 34.34 2-ethyl-1,4-dimethylbenzene (2) 5.52 5.37 5.445 2-ethyl-1-hexanol (1) 7.09 6.82 6.955 2-ethylhexanoic acid (2) 3.36 4.04 3.7 2-hexanone (1) 5.89 5.96 5.925 2-methyl-5-(1-methylethenyl)cyclohexanone (2) 6.84 6.9 6.87 2-methyl-5-(1-methylethyl)-2-cyclohexen-1-one (2) 6.4 6.85 6.625 2-methylbutylacetate (3) 1.58 1.62 1.6 2-methylhexanal (3) 1.16 1.31 1.235 2-methylhexane (2) 1.22 1.22 1.22 2-methylnaphthalene (2) 2.88 3.66 3.27 2-methylpentane (3) 0.64 0.55 0.595 2-phenoxyethanol (2) 6.3 7.31 6.805 3,4-dimethyl-2-hexanone (2) 6.31 5.92 6.115 3,4-dimethylheptane (2) 2.06 2.07 2.065 3,5,5-trimethyl-2-cyclohexen-1-one (2) 0.91 2.51 1.71 3,7-dimethyl-1,6-octadien-3-ol (2) 3.23 3.23 3.23 3,7-dimethyl-3-octanol (2) 1.82 1.66 1.74 3,9-dimethylundecane (2) 2.82 2.8 2.81 3-hydroxy-2,4-dimethylpropanoate (2) 4.01 14.71 9.36
µg/m3

31
Table A25 (continued)
Compound Outdoor Air VOC 1 Outdoor Air VOC 2 Sample Average
3-methylhexane (2) 2.18 2.21 2.195 3-nonyne (3) 7.02 3.8 5.41 3-phenyl-2-propenal (3) 2.65 5.56 4.105 4-(1-hydroxyethyl)benzaldehyde (2) 3.56 2.48 3.02 4,6-diemthyldodecane (2) 6.25 5.95 6.1 4-methylphenol (2) 1.38 2.54 1.96 5-methyl-2-(1-methylethyl)cyclohexanol (2) 10.7 10.63 10.665 5-methyl-2-(1-methylethyl)cyclohexanone (2) 2.49 2.5 2.495 5-methyl-5-propylnonane (3) 4.32 5.49 4.905 6-methyldodecane (2) 3.04 3.08 3.06 acetic acid (1) 9.23 5.96 7.595 acetone (1) 1.93 2.45 2.19 acetophenone (1) 4.37 4.11 4.24 allylheptanoate (2) 2.3 2.23 2.265 alpha-pinene (1) 6.28 6.69 6.485 alpha-terpineol (1) 4.24 4.88 4.56 amyl cinnamaldehyde (2) 1.73 0.01 0.87 amyl salicylate (2) 1.6 2.6 2.1 amylacetate (2) 1.3 3.08 2.19 benzaldehyde (1) 11.75 9.68 10.715 benzene (1) 1 1 1 benzyl acetate (2) 15.09 16.42 15.755 beta-myrcene (1) 4.74 4.21 4.475 beta-pinene (1) 3.32 3.55 3.435 biphenyl (2) 4.56 5.65 5.105 bromocyloheptane (2) 3.57 3.16 3.365 butyl acetate (3) 7.38 6.91 7.145 butylbutyrate (2) 3.07 9.18 6.125 caprolactam (2) 2.87 3.67 3.27 cycloheptane (2) 4.09 4.34 4.215 cyclohexane (2) 0.78 0.79 0.785 cyclohexanone (2) 4.24 4.15 4.195 cyclohexyl acetate (2) 1.28 4.4 2.84 cyclooctene (3) 2.26 2.94 2.6 decane (1) 4.97 4.74 4.855 decanoic acid (2) 8.27 9.54 8.905 diethyltoluamide (2) 7 0.11 3.555 diisopropyladipate (2) 2.08 5.21 3.645 dimethyltoluamide (2) 0.01 9.49 4.75 dioxlane (2) 3.28 3.36 3.32 diphenylether (2) 3.84 5.15 4.495 ethanol (1) 1.58 1.24 1.41 ethosuximide (2) 46.97 48.13 47.55 ethyl acetate (3) 3.03 2.78 2.905 ethylthiocyanate (3) 1.24 1.25 1.245 eucalyptol (2) 5.91 5.32 5.615 heptane (1) 2.2 2.16 2.18 heptanoic acid (2) 5.76 6.82 6.29 heptanol (1) 2.37 2.72 2.545 hexadecane (1) 25.32 27.92 26.62 hexanal (1) 1.16 1.11 1.135 hexane (1) 0.44 0.39 0.415 hexanoic acid (2) 17.95 21.79 19.87 isopropylalcohol (2) 4.56 54.96 29.76 isopropylmyristate (2) 2.68 3.65 3.165 isothicyantoethane (3) 3.32 3.48 3.4 limonene (1) 54.88 52.73 53.805 methyl dihydrojasmonate (3) 1.49 1.53 1.51 methyl ethyl ketone (1) 0.58 0.61 0.595 methyl salicylate (1) 14.65 17.81 16.23
µg/m3

32
Table A25 (continued)
Compound Outdoor Air VOC 1 Outdoor Air VOC 2 Sample Average
methylbenzoate (2) 0.01 7.22 3.615 methylcyclohexane (1) 1.7 1.78 1.74 naphthalene (1) 7.83 8.94 8.385 n-butylsalicylate (2) 1.58 2.49 2.035 nonadecane (1) 6.72 7.63 7.175 nonanoic acid (2) 17.48 20.33 18.905 octadecane (1) 11.69 13.17 12.43 octadecanol (1) 3.21 4.07 3.64 octane (1) 1.05 1.15 1.1 octanoic acid (2) 6.79 7.77 7.28 octyl thioglycolate (2) 6.73 8.7 7.715 pentadecane (1) 2.87 2.53 2.7 pentadecene (2) 0.89 1.49 1.19 pentanoic acid (2) 2.02 2.24 2.13 phenol (1) 7.92 10.66 9.29 phenyl isopropanol (2) 2.26 2.83 2.545 phenylethylalcohol (2) 5.3 6.05 5.675 propylbenzene (1) 3.56 3.19 3.375 propylcyclohexane (2) 0.71 0.72 0.715 p-xylene (1) 9.3 8.46 8.88 styrallyl acetate (2) 4.69 5.18 4.935 styrene (1) 2.35 2.18 2.265 tetradecane (1) 6.56 6.67 6.615 toluene (1) 7.5 7.39 7.445 tridecane (1) 4.62 5.12 4.87 undecanol (2) 6.94 12.28 9.61
Total VOC Level (µg/m3) 882
µg/m3

33
Table A26. Berry College long-term results leaving active desiccant wheel
Supply Air Contaminant Concentration to Space: (After SEMCO Active Wheel)
Compound Supply Air VOC 1 Supply Air VOC 2 Sample Average
1-(1,1-dimethyl)-2-methylpropanoate (2) 2.55 2.81 2.68 1-(2-methoxypropoxy)-2-propanol (2) 2.41 1.95 2.18 1,2,3-trimethylbenzene (1) 2.38 2 2.19 1,2,4-trimethylbenzene (1) 1.48 0.84 1.16 1,2-dimethylbenzene (1) 1.75 1.82 1.785 1,3,5-trimethylbenzene (1) 3.15 4.04 3.595 1,3-pentadiene (2) 0.25 0.39 0.32 1,4-dichlorobenzene (2) 2.08 1.72 1.9 1-butoxy-2-propanol (2) 0.37 0.01 0.19 1-chloro-2-methylbenzene (2) 1.04 0.93 0.985 1-ethyl-2-methylbenzene (1) 0.57 0.55 0.56 1-ethyl-3-methylbenzene (2) 2.59 2.19 2.39 1-ethyl-3-methylcyclohexane (2) 0.11 0.16 0.135 1-ethynylcyclohexanol (2) 0.7 0.35 0.525 1-methyl-2-(1-methylethyl)benzene (2) 0.77 0.69 0.73 1-methyl-3-propylbenzene (2) 0.67 0.55 0.61 1-methyl-4-(1-methylethyl)benzene (2) 0.39 0.14 0.265 2-(1,1-dimethylethyl)cyclohexanol (2) 0.96 0.77 0.865 2-(1-methylethyl)phenol (2) 2.03 2.35 2.19 2-(2-butoxyethoxy)ethanol (2) 9.18 10.58 9.88 2-(2-ethoxyethoxy)ethanol (2) 0.2 0.63 0.415 2,3-dihydro-4-methyl-1H-indene (2) 0.36 0.23 0.295 2,4,6-trimethyloctane (2) 0.52 0.57 0.545 2,5,9-trimethyldecane (2) 1.76 1.56 1.66 2,5-dimethylheptane (2) 0.84 1.05 0.945 2,6-dimethyl-7-octen-2-ol (2) 0.38 0.01 0.195 2,6-dimethyltoctane (2) 0.16 0.27 0.215 2,9-dimethylundecane (2) 0.7 0.2 0.45 2-butoxyethanol (2) 8.33 8 8.165 2-ethyl-1,4-dimethylbenzene (2) 0.55 0.41 0.48 2-ethyl-1-hexanol (1) 1.73 1.44 1.585 2-ethylhexanoic acid (2) 1.05 0.92 0.985 2-hexanone (1) 0.49 0.5 0.495 2-methyl-5-(1-methylethenyl)cyclohexanone (2) 0.79 0.29 0.54 2-methyl-5-(1-methylethyl)-2-cyclohexen-1-one (2) 0.99 1.01 1 2-methylhexanal (3) 0.78 0.95 0.865 2-methylhexane (2) 0.48 0.54 0.51 2-methylnaphthalene (2) 1.16 1.46 1.31 2-methylpentane (3) 0.66 0.76 0.71 2-pentanone (2) 0.01 0.21 0.11 2-phenoxyethanol (2) 1.9 1.17 1.535 3,4-dimethyl-2-hexanone (2) 0.57 0.51 0.54 3,4-dimethylheptane (2) 0.83 0.89 0.86 3,5,5-trimethyl-2-cyclohexen-1-one (2) 0.46 0.11 0.285 3,9-dimethylundecane (2) 1.09 0.69 0.89 3-hydroxy-2,4-dimethylpropanoate (2) 3.5 3.59 3.545 3-methylhexane (2) 1.43 1.53 1.48 3-nonyne (3) 0.44 0.79 0.615 4-(1-hydroxyethyl)benzaldehyde (2) 0.5 0.28 0.39 4,6-diemthyldodecane (2) 1.11 0.81 0.96
µg/m3

34
Table A26 (continued)
Compound Outdoor Air VOC 1 Outdoor Air VOC 2 Sample Average
4-hydroxybenzaldehyde (2) 0.95 0.69 0.82 5-methyl-2-(1-methylethyl)cyclohexanol (2) 1.87 0.57 1.22 5-methyl-5-propylnonane (3) 0.59 0.35 0.47 6,6-dimethylbicyclo[3.3.1]heptan-2-one (2) 0.86 0.12 0.49 6,6-dimethylbicyclo[3.3.1]heptan-3-one (2) 0.9 0.9 0.9 6-methyldodecane (2) 3.81 3.26 3.535 acetaldehyde (3) 0.01 1.9 0.955 acetic acid (1) 1.53 1.29 1.41 acetone (1) 0.78 0.93 0.855 acetophenone (1) 2.9 2.53 2.715 allylheptanoate (2) 0.89 0.8 0.845 alpha-pinene (1) 3.4 3.59 3.495 alpha-terpineol (1) 0.34 0.33 0.335 amylacetate (2) 0.56 0.55 0.555 benzaldehyde (1) 4.48 4.13 4.305 benzene (1) 0.8 0.95 0.875 benzyl acetate (2) 3.52 2.55 3.035 benzylbenozate (2) 0.44 0.01 0.225 beta-pinene (1) 1.47 1.58 1.525 biphenyl (2) 1.18 0.93 1.055 butyl acetate (3) 1.09 1.09 1.09 butylbutyrate (2) 2.43 2.25 2.34 caprolactam (2) 0.78 0.73 0.755 cycloheptane (2) 1.43 1.03 1.23 cyclohexane (2) 0.45 0.01 0.23 cyclohexanone (2) 1.01 0.91 0.96 cyclohexyl acetate (2) 0.99 0.77 0.88 decane (1) 1.14 1.13 1.135 decanoic acid (2) 0.46 0.06 0.26 diethyltoluamide (2) 0.92 0.82 0.87 diphenylether (2) 2.01 1.37 1.69 ethanol (1) 0.21 0.35 0.28 ethosuximide (2) 0.86 0.73 0.795 ethyl acetate (3) 0.3 0.43 0.365 ethylbenzene (1) 1.15 1.19 1.17 ethylthiocyanate (3) 0.14 0.19 0.165 eucalyptol (2) 1.03 1.03 1.03 heptadecane (1) 1.26 0.86 1.06 heptane (1) 0.53 0.56 0.545 heptanoic acid (2) 2.26 1.71 1.985 hexadecane (1) 6.55 4.84 5.695 hexane (1) 0.38 0.48 0.43 hexanoic acid (2) 5.57 6.23 5.9 isopropylalcohol (2) 0.93 0.59 0.76 isothicyantoethane (3) 0.18 0.24 0.21 limonene (1) 2.53 3.45 2.99 methyl ethyl ketone (1) 0.31 0.38 0.345 methyl salicylate (1) 4.59 5.77 5.18 methylbenzoate (2) 1.07 1.68 1.375 methylcyclohexane (1) 0.77 0.86 0.815 naphthalene (1) 1.55 6.29 3.92 nonadecane (1) 0.75 0.5 0.625 nonanoic acid (2) 1.87 1.67 1.77 octadecane (1) 1.74 1.37 1.555 octadecanol (1) 1.29 0.88 1.085 octane (1) 0.45 0.22 0.335 octanoic acid (2) 1.42 1.02 1.22 pentadecane (1) 1.56 1.49 1.525 pentanoic acid (2) 0.54 0.32 0.43 phenol (1) 5.02 5.18 5.1
µg/m3

35
Table A26 (continued)
Compound Outdoor Air VOC 1 Outdoor Air VOC 2 Sample Average
phenyl isopropanol (2) 0.77 0.68 0.725 phenylethylalcohol (2) 1.31 1.35 1.33 propylbenzene (1) 0.77 0.71 0.74 propylcyclohexane (2) 0.05 0.11 0.08 p-xylene (1) 7.3 7.81 7.555 sabinene (1) 0.01 0.19 0.1 styrallyl acetate (2) 0.46 0.32 0.39 tetradecane (1) 1.19 0.92 1.055 toluene (1) 5.45 5.78 5.615 tridecane (1) 0.86 0.01 0.435 undecanol (2) 1.8 1.48 1.64
Total VOC Level (µg/m3) 177
Percent Removal (%) 79.9%
µg/m3

SE
MC
O u
nit
ch
emic
al c
on
tam
inan
t ch
alle
ng
e p
erce
nt
rem
ova
l at
vari
ou
s te
mp
erat
ure
s
0%10%
20%
30%
40%
50%
60%
70%
80%
hexa
ne #
1he
xane
#2
tolu
ene
SO
2N
O2
ozon
e #1
ozon
e #2
Ch
alle
ng
e ch
emic
al
Percent removal
140°
175°
no
hea
t
F
ig. A
1. R
elat
ive
chal
leng
e re
sult
s fr
om t
he G
TR
I B
aker
Bui
ldin
g sh
owin
g im
pact
of
rege
nera
tion
tem
pera
ture
.
36