documentation on cadisplay compatibility analysis display ... · documentation on cadisplay...
TRANSCRIPT

Radiocommunication Bureau (BR)
Documentation on CADisplay
Compatibility Analysis Display
for Central America and Caribbean Region
User Manual
Terrestrial Services Department
Broadcasting Division
Edition: June, 2018

-2-
Contents 1. General Introduction ....................................................................................................................... 3
2. Description of the process .............................................................................................................. 3
3. Description of the CADisplay functionalities ............................................................................. 4
3.1. Main Menu .............................................................................................................................. 4
3.2. Viewing Compatibility Analysis Results ............................................................................... 4
3.3. How to use the Coverage Analysis screen .......................................................................... 6
3.4. How to use the Service/Coverage Areas screen ................................................................. 7
3.5. How to use the channel distribution statistics screen ....................................................... 8
4. General analysis results (GAR) ....................................................................................................... 9
4.1. How to get to the “General analysis results” (GAR) ........................................................... 9
4.2. Interpretation of the compatibility analysis results displayed in the “General analysis
results” (GAR) .................................................................................................................................... 10
4.3. Analysis of the results .......................................................................................................... 12
5. Detailed analysis results (DAR) ................................................................................................... 15
6. Consideration of coordination information in the requirements ....................................... 16
7. Some definitions: ............................................................................................................................ 19

-3-
1. General Introduction
CADisplay is an application designed to assist the administrations in analyzing the
calculations related to the compatibility analysis for Television (DTT stations recorded in
the Master International Frequencies Registry (MIFR) as well as new DTT requirements
and analog stations recorded in the MIFR) for the administrations involved in the
multilateral frequency coordination process in the VHF/UHF bands in Central America
and the Caribbean.
CADisplay is one of the tools used in the compatibility analysis process. It is intended
to be used to display the compatibility analysis result files stemming from the
compatibility analysis calculations carried out under eTools, and provides useful features
to facilitate the analysis of those results.
For more information on the methodology to seek new channels, please see document
INFO-2 and the relevant presentation.
Please note that you will be automatically prompted to download any available updates.
2. Description of the process
The application reads the compatibility analysis database file obtained from the
CA_compat 1 job available under eTools (eBCD web application). The compatibility
analysis can involve notices (additions, modifications and suppressions) from one or
several administrations, which are then “applied” to a snapshot of the current status of
the MIFR. (A compatibility analysis is performed on a subset of frequency ranges, either
VHF or UHF frequency bands, depending on the input data provided by the
administrations).
The results of a compatibility analysis are stored in an MS Access database file (MDB
format) together with the input data for the calculation, including all the relevant MIFR
1 CA_compat does not use the Digital Terrain Model. The calculations are taking into account propagation
conditions along the entire path between the transmitter and the receiver (land, sea, mixed) in accordance
with the IDWM as well as the effective antenna height, which represents the height of the transmitting
antenna above terrain height averaged between distances of 3 to 15 km, in the direction of the receiving
antenna (SRTM: http://www.itu.int/SRTM3/index.html ).
-4-
entries and MIFR modifications in process (within a 1000km boundary) in the relevant
frequency bands.
3. Description of the CADisplay functionalities
3.1. Main Menu
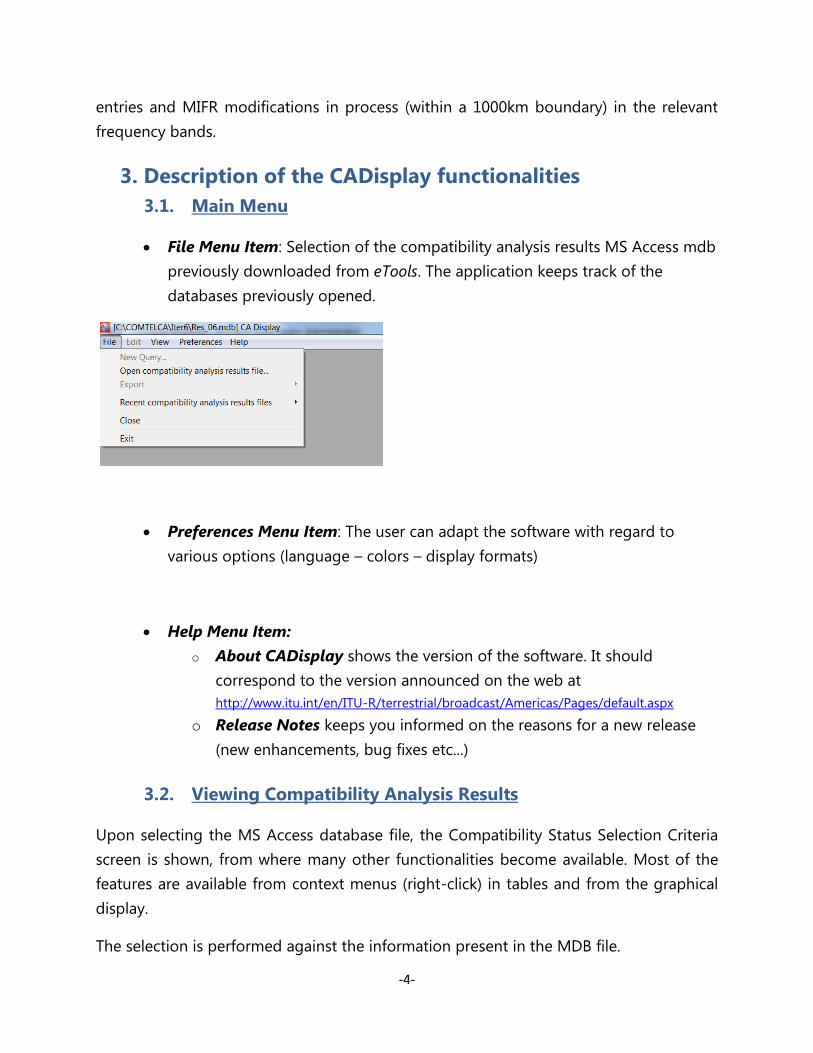
File Menu Item: Selection of the compatibility analysis results MS Access mdb
previously downloaded from eTools. The application keeps track of the
databases previously opened.
Preferences Menu Item: The user can adapt the software with regard to
various options (language – colors – display formats)
Help Menu Item:
o About CADisplay shows the version of the software. It should
correspond to the version announced on the web at
http://www.itu.int/en/ITU-R/terrestrial/broadcast/Americas/Pages/default.aspx
o Release Notes keeps you informed on the reasons for a new release
(new enhancements, bug fixes etc...)
3.2. Viewing Compatibility Analysis Results
Upon selecting the MS Access database file, the Compatibility Status Selection Criteria
screen is shown, from where many other functionalities become available. Most of the
features are available from context menus (right-click) in tables and from the graphical
display.
The selection is performed against the information present in the MDB file.
-5-
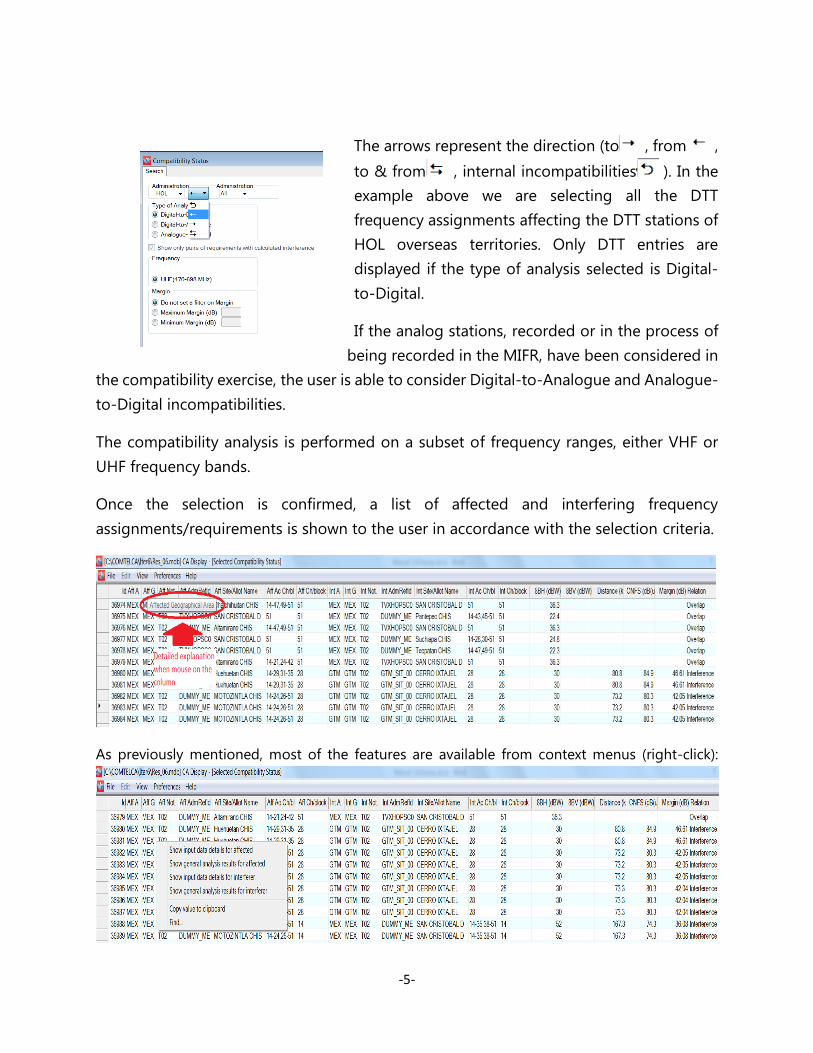
The arrows represent the direction (to , from ,
to & from , internal incompatibilities ). In the
example above we are selecting all the DTT
frequency assignments affecting the DTT stations of
HOL overseas territories. Only DTT entries are
displayed if the type of analysis selected is Digital-
to-Digital.
If the analog stations, recorded or in the process of
being recorded in the MIFR, have been considered in
the compatibility exercise, the user is able to consider Digital-to-Analogue and Analogue-
to-Digital incompatibilities.
The compatibility analysis is performed on a subset of frequency ranges, either VHF or
UHF frequency bands.
Once the selection is confirmed, a list of affected and interfering frequency
assignments/requirements is shown to the user in accordance with the selection criteria.
As previously mentioned, most of the features are available from context menus (right-click):

-6-
Additional features: a left-mouse click on the
columns opens a dialog for the user to select the
column preferences (sort order and displayed
columns). If the user wants the application to
“remember” those changes, he/she should click on
the button “set as default”.
3.3. How to use the Coverage Analysis screen
The Coverage Analysis screen shows the number of coverages in any given point of a
geographic area, i.e. the sets of requirements whose service area covers the point.
The intensity of the color in a given point corresponds to the number of coverages, i.e. a
darker color means more coverages. Please note that the legend may not reflect the actual
coloring in the case the actual maximum number of coverages is higher than the
maximum specified value for the legend. In order for the legend to be correct, the selected
maximum for the legend must be equal to or higher than the actual maximum number of
coverages, which requires some experimenting on the part of the user.
It is possible to easily compare acceptable channels from input data and
available/assigned channels from the analysis results by clicking on the corresponding
radio button. More details on the actual coverages may be obtained by right-clicking on
a given point. A pop-up list appears, showing the number of coverages at the point, as
well as the following information for each coverage:
Adm Administration identifier.

-7-
Adm Ref Id unique identifier from the input data.
Acceptable or Available Channels or Assigned Channel: The acceptable
channels from input data or the available channel or assigned channel from the
analysis/synthesis results (see definition further down).
3.4. How to use the Service/Coverage Areas screen
The Service/Coverage area screen shows the noise limited (for digital) or interference
limited (for analogue) service areas for individual assignments/requirements, present in
the database and showing incompatibilities with the notices submitted to the
compatibility analysis, with filtering by channel and optional adjacent channel. Details of
the requirement or compatibility analysis details can be invoked from the context menu
either from the table or from right-clicking in the map.
Filtering by channel: Please note that when 6 and 8 MHz channel rasters are involved and
a specific channel is selected, the service areas of the assignments having overlapping
channels are shown to provide to the user with a full list of requirements and assignments
having an overlapping frequency due to different channel rasters which are affected
(example: if channel 15-6MHz is selected, the frequency assignments/requirements at 21-
8MHz, 22-8Mhz and 15-6MHz are displayed on the map.
Considering adjacent channels: In the example below (15-6MHz channel selected),
considering adjacent channels has a different meaning. The channels considered are 14-
6MHz, 15-6MHz, 16-6MHz together with the 8 MHz channels overlapping those 3
channels (21-8MHz, 22-8Mhz, 23-8MHz), in the areas where 6 and 8 MHz channels are
used.
-8-
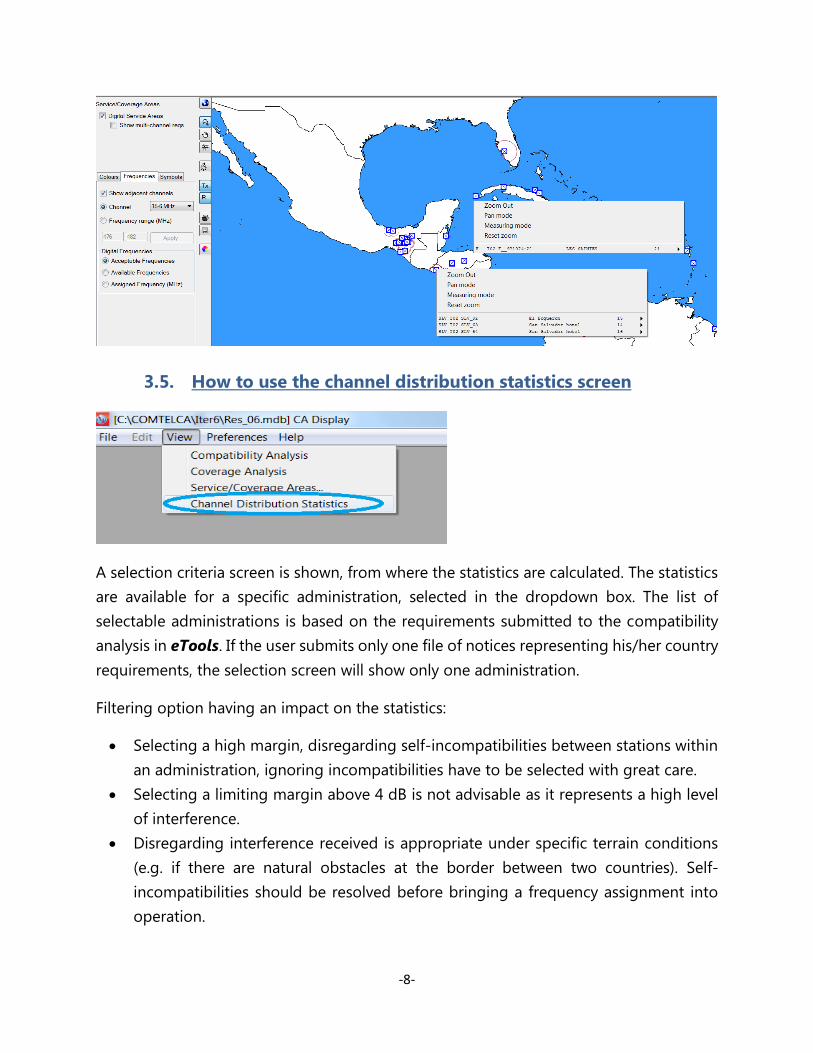
3.5. How to use the channel distribution statistics screen
A selection criteria screen is shown, from where the statistics are calculated. The statistics
are available for a specific administration, selected in the dropdown box. The list of
selectable administrations is based on the requirements submitted to the compatibility
analysis in eTools. If the user submits only one file of notices representing his/her country
requirements, the selection screen will show only one administration.
Filtering option having an impact on the statistics:
Selecting a high margin, disregarding self-incompatibilities between stations within
an administration, ignoring incompatibilities have to be selected with great care.
Selecting a limiting margin above 4 dB is not advisable as it represents a high level
of interference.
Disregarding interference received is appropriate under specific terrain conditions
(e.g. if there are natural obstacles at the border between two countries). Self-
incompatibilities should be resolved before bringing a frequency assignment into
operation.
-9-
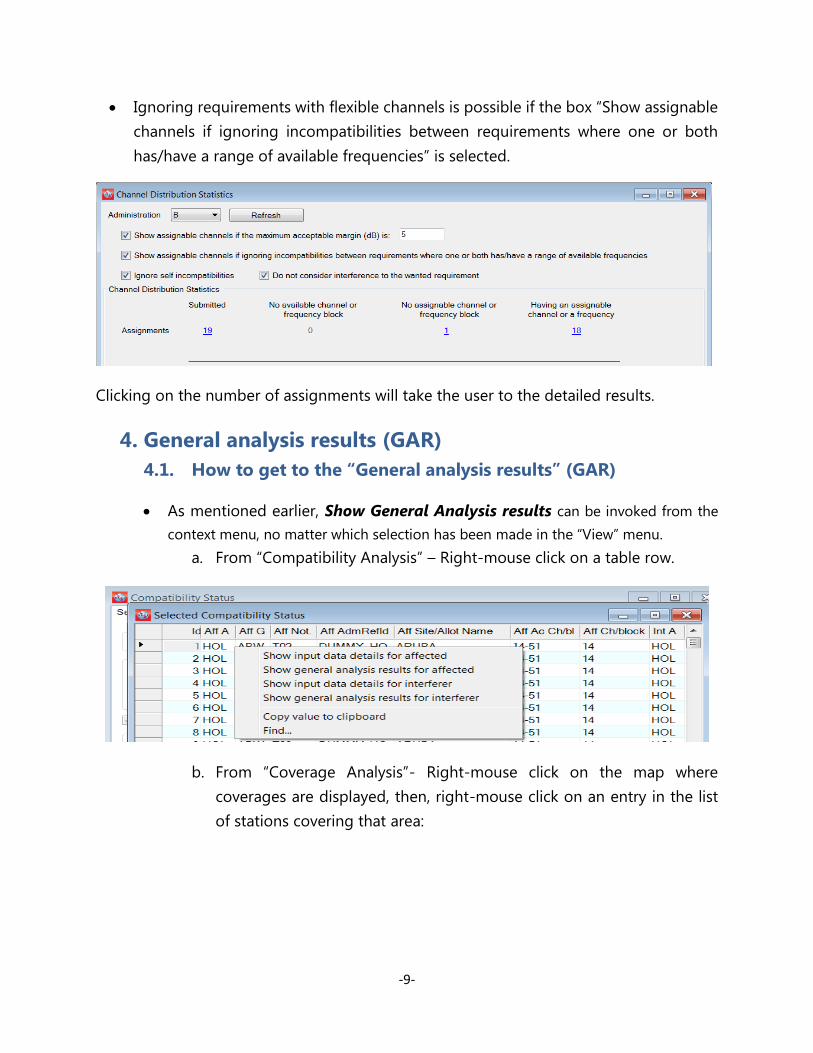
Ignoring requirements with flexible channels is possible if the box “Show assignable
channels if ignoring incompatibilities between requirements where one or both
has/have a range of available frequencies” is selected.
Clicking on the number of assignments will take the user to the detailed results.
4. General analysis results (GAR)
4.1. How to get to the “General analysis results” (GAR)
As mentioned earlier, Show General Analysis results can be invoked from the
context menu, no matter which selection has been made in the “View” menu.
a. From “Compatibility Analysis” – Right-mouse click on a table row.
b. From “Coverage Analysis”- Right-mouse click on the map where
coverages are displayed, then, right-mouse click on an entry in the list
of stations covering that area:
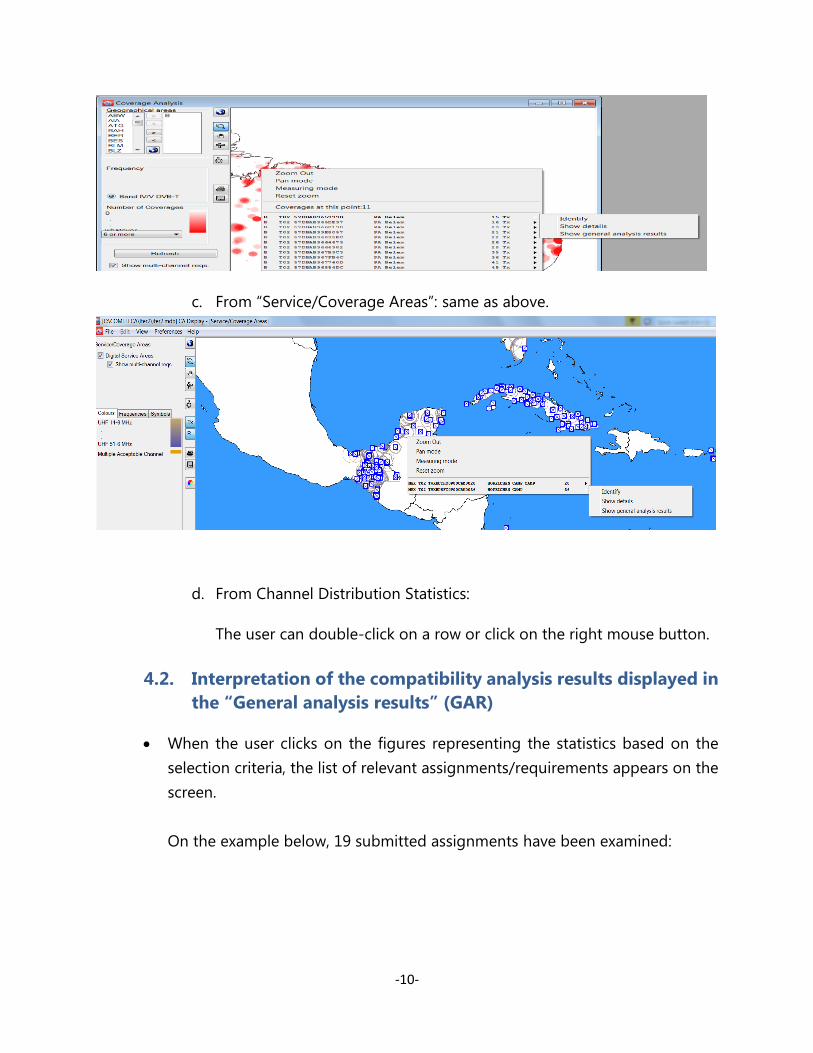
-10-
c. From “Service/Coverage Areas”: same as above.
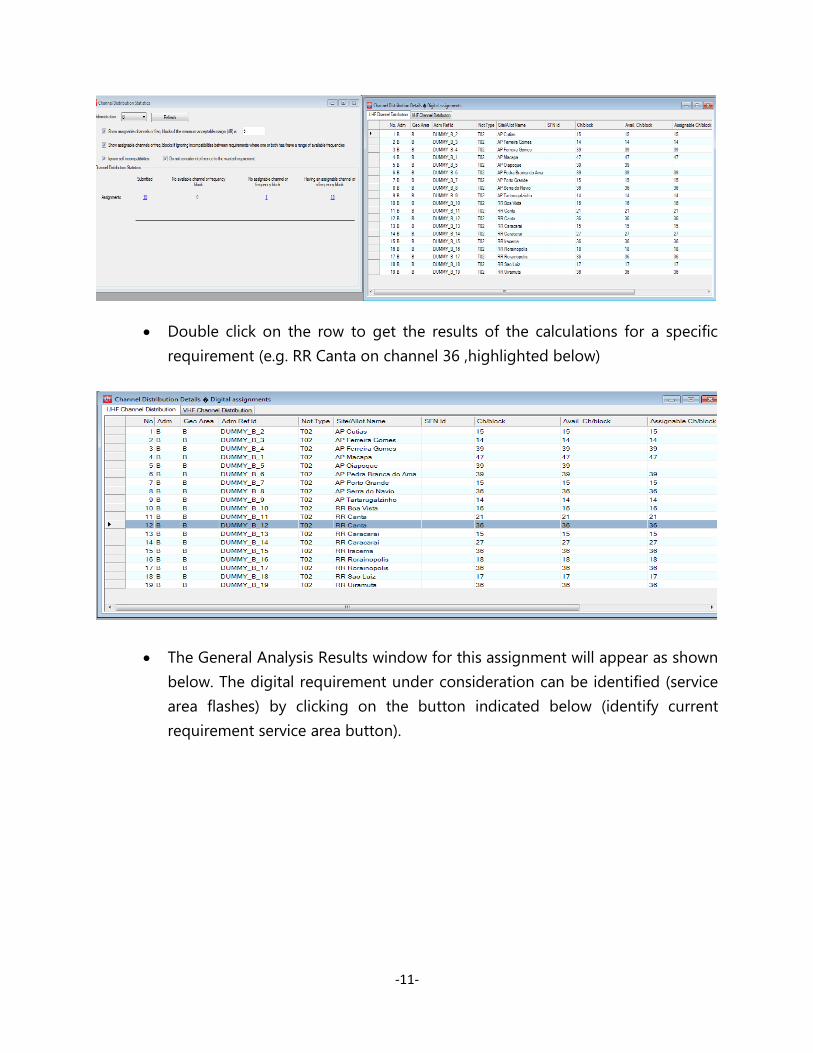
d. From Channel Distribution Statistics:
The user can double-click on a row or click on the right mouse button.
4.2. Interpretation of the compatibility analysis results displayed in
the “General analysis results” (GAR)
When the user clicks on the figures representing the statistics based on the
selection criteria, the list of relevant assignments/requirements appears on the
screen.
On the example below, 19 submitted assignments have been examined:
-11-
Double click on the row to get the results of the calculations for a specific
requirement (e.g. RR Canta on channel 36 ,highlighted below)
The General Analysis Results window for this assignment will appear as shown
below. The digital requirement under consideration can be identified (service
area flashes) by clicking on the button indicated below (identify current
requirement service area button).

-12-
4.3. Analysis of the results
In most cases, the General Analysis Results contain “Digital Interferers” and “Digital
Affected” tabulations, where:
- “Digital Interferers” contains the list of digital assignments, in process or recorded
in the MIFR, and the digital requirements which are affecting the digital
requirement under consideration (incoming interference margin > 1.25 dB);
- “Digital Affected” contains the list of digital assignments, in process or recorded in
the MIFR, and the digital requirements which are affected by the digital
requirement under consideration (outgoing interference margin > 1.25 dB).
One or both tabs can be missing if the digital requirement under consideration does not
suffer or/and cause any interference from/to digital assignments/requirements
(calculated margins below 1.25 dB) on that specific channel.
The meaning of margins as well as the concept of combined value of nuisance field
strength and combined location correction (CNFS) are described in document INFO-4
(http://www.itu.int/en/ITU-R/terrestrial/broadcast/Americas/Documents/Info/INFO-4-
E_margins.pdf).
In the case where digital interferers and/or digital affected are present, the analysis starts
with the column “Relation”. Three relation types are possible, namely:
- “Overlap” – means that the service/coverage areas of two transmitters are
overlapping. The selected channels therefore are not suitable for the digital
-13-
requirement under consideration. However, in some cases, due to terrain shielding,
this can be possible after more detailed calculations involving terrain profiles.
- “Tx inside” – this case is worse than “Overlap”. The transmitter site is located inside
the service/coverage area of the interfering/affected assignment/requirement.
- “Interference” - in this case only, the margin is calculated and reflected in the
column “Margin”.
There may be 2 cases:
Case 1: Calculated margins in both directions (incoming and outgoing interference) do
not exceed the maximum acceptable margin selected by the user in the “Channel
Distribution Statistics”.
The channel is compatible and it can be assigned to the digital requirement under
consideration.
Case 2: the calculated margin in one or both directions exceeds the maximum acceptable
margin. Several situations are possible:
a) Self-Interference: The interference involves the digital requirement under consideration
and digital assignment/requirement of the same administration. It is the responsibility of
the administration to decide on this situation.
b) The digital requirement under consideration is affecting assignment/requirement from
a neighboring administration. In that case, a modification to the technical characteristics
may help (reduction of maximum ERP, revision of the transmitting antenna pattern etc.)
to reduce the interference in the direction of the affected assignment/requirement of
another administration. Please note that such a modification cannot be made directly in
CADisplay; the notice containing the revised notice should first be submitted to eTools
for a new compatibility analysis. If the results are satisfactory, the notice should be
retained in the file to be submitted to the BR for the next iteration. If not, the parameters
can be reviewed and the calculations should re-run until the results are satisfactory.
c) The digital requirement under consideration is interfered with by recorded
assignment(s) or requirement(s) of another administration. The administration seeking for
this specific channel can accept this higher level of incoming interference if the terrain
profile between both sites is preventing interference.

-14-
More detailed calculations, using external software packages taking into account digital
terrain profiles, may be performed. Furthermore, in all the above situations, except a),
bilateral/multilateral coordination may be needed to obtain the best possible results.
In some cases, the General Analysis Results may also contain “Analogue TV Interferers”
and “Analogue TV Affected” tabulations, as shown on the example below, where:
- “Analogue TV Interferers” contains the list of analogue TV assignments, in process or
recorded in the MIFR which are affecting the digital requirement under consideration
(incoming interference margin > 1.25 dB);
- “Analogue TV Affected” contains the list of analogue TV assignments, in process or
recorded in the MIFR which are affected by the digital requirement under consideration
(outgoing interference margin > 0.5 dB).
One or both tabs will not appear if the digital requirement under consideration does not
suffer or/and cause any interference from/to analogue TV assignments (calculated
margins below 1.25 dB/0.5 dB) on that specific channel.
In the case where analogue TV interferers and/or analogue TV Affected are present, the
same analysis as described above for the digital interferers/affected has to be performed,
taking into account different value of maximum acceptable margin for affected analogue
TV assignments.
When considering the analogue service, the goal is to protect the analog stations in
operation. Consequently, when the proposed requirement produces, on an analog station
of a neighboring country, an interference margin greater than 0.5 dB on a specific channel,
the channel is identified as “unavailable” to the digital requirement. In other words, the
channel cannot be assigned when it is interfering with the analog frequency assignments
of the neighboring administrations.
On the other hand, interference received from analog (analog interferer) as well as internal
incompatibilities (analog to digital and digital to analog) are not setting the analog
channel as unavailable to the digital requirement.
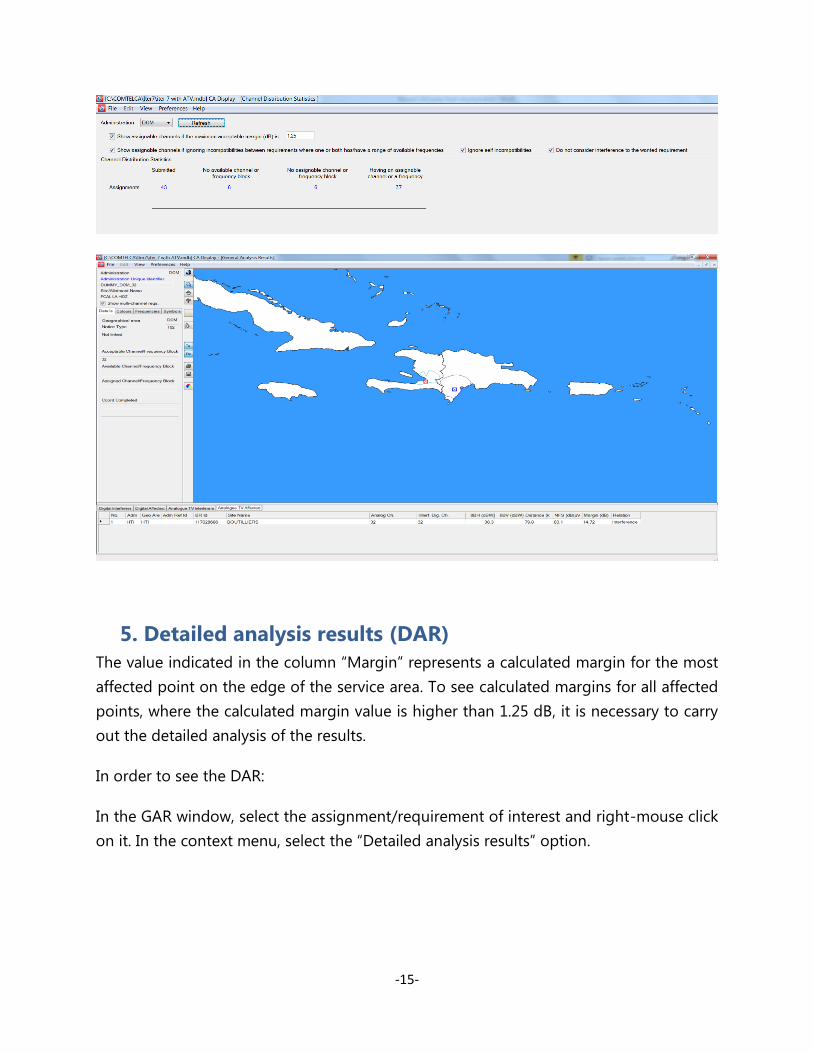
In the example below, the fixed channel 32 is not available for the requirement from DOM
(see No available channel) because it is interfering with an analog assignment of HTI (see
analog TV affected).
-15-
5. Detailed analysis results (DAR)
The value indicated in the column “Margin” represents a calculated margin for the most
affected point on the edge of the service area. To see calculated margins for all affected
points, where the calculated margin value is higher than 1.25 dB, it is necessary to carry
out the detailed analysis of the results.
In order to see the DAR:
In the GAR window, select the assignment/requirement of interest and right-mouse click
on it. In the context menu, select the “Detailed analysis results” option.

-16-
The following window will appear, where the details are indicated. The worst case point
of the service/coverage area of the affected digital requirement under consideration is
surrounded in blue.
The same approach is being used when the digital requirement under consideration
affects another digital assignment/requirement.
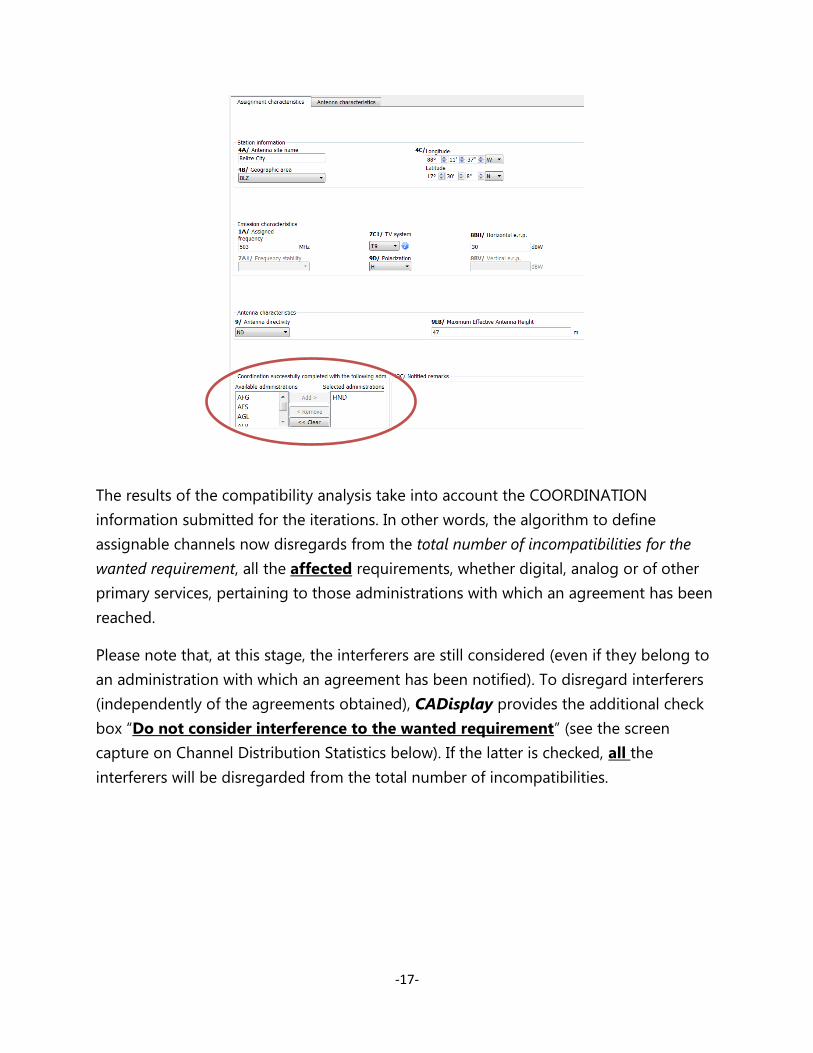
6. Consideration of coordination information in the
requirements
Administrations participating in the ITU Regional Frequency Coordination for Central
America and Caribbean are encouraged to submit, for the ITERATIONS, the relevant
electronic notices containing the agreements obtained from affected administrations
within the respective <COORD> sections. This information is to be entered using
TerRaNotices:
-17-
The results of the compatibility analysis take into account the COORDINATION
information submitted for the iterations. In other words, the algorithm to define
assignable channels now disregards from the total number of incompatibilities for the
wanted requirement, all the affected requirements, whether digital, analog or of other
primary services, pertaining to those administrations with which an agreement has been
reached.
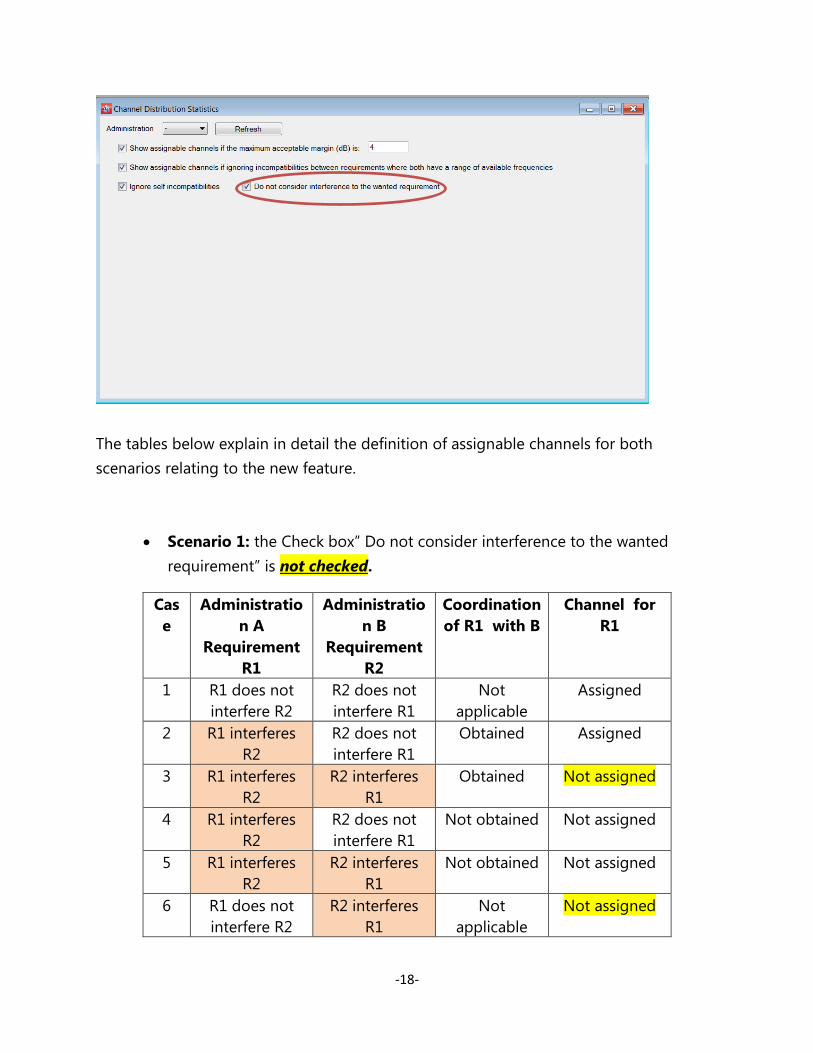
Please note that, at this stage, the interferers are still considered (even if they belong to
an administration with which an agreement has been notified). To disregard interferers
(independently of the agreements obtained), CADisplay provides the additional check
box “Do not consider interference to the wanted requirement” (see the screen
capture on Channel Distribution Statistics below). If the latter is checked, all the
interferers will be disregarded from the total number of incompatibilities.
-18-
The tables below explain in detail the definition of assignable channels for both
scenarios relating to the new feature.
Scenario 1: the Check box” Do not consider interference to the wanted
requirement” is not checked.
Cas
e
Administratio
n A
Requirement
R1
Administratio
n B
Requirement
R2
Coordination
of R1 with B
Channel for
R1
1 R1 does not
interfere R2
R2 does not
interfere R1
Not
applicable
Assigned
2 R1 interferes
R2
R2 does not
interfere R1
Obtained Assigned
3 R1 interferes
R2
R2 interferes
R1
Obtained Not assigned
4 R1 interferes
R2
R2 does not
interfere R1
Not obtained Not assigned
5 R1 interferes
R2
R2 interferes
R1
Not obtained Not assigned
6 R1 does not
interfere R2
R2 interferes
R1
Not
applicable
Not assigned

-19-
Scenario 2: the Check box” Do not consider interference to the wanted
requirement” is checked.
Cas
e
Administratio
n A
Requirement
R1
Administratio
n B
Requirement
R2
Coordination
of R1 with B
Channel for
R1
1 R1 does not
interfere R2
R2 does not
interfere R1
Not
applicable
Assigned
2 R1 interferes
R2
R2 does not
interfere R1
Obtained Assigned
3 R1 interferes
R2
R2 interferes
R1
Obtained Assigned
4 R1 interferes
R2
R2 does not
interfere R1
Not obtained Not assigned
5 R1 interferes
R2
R2 interferes
R1
Not obtained Not assigned
6 R1 does not
interfere R2
R2 interferes
R1
Not
applicable
Assigned
7. Some definitions:
Acceptable Channel
Refers to the channel/s which is/are notified by the Administration for a digital
requirement.
The digital frequency channels already in the MIFR for that transmitter site are discarded
from the list of acceptable channels.
Flexible Channel
In the case where the user wants to analyze the situation of a digital requirement under
consideration on all the acceptable frequency channels in VHF or UHF frequency band,
the requirement should contain the following information:
- For UHF: channel 83, frequency 887 MHz, for 6MHz channel raster and channel 69
frequency 858 MHz, for 8MHz channel raster
-20-
- For VHF: channel 82, frequency 881 MHz for 6MHz channel raster and channel 68
frequency 850 MHz, for 8MHz channel raster.
The compatibility analysis software will scan the band on channel-by-channel basis to
assess incompatibilities. In this case, the software is calculating the service area of the
digital requirement, taking into account the lowest acceptable frequency (i.e. the worst
case scenario).
Available (Av) Channel
Refers to the channel(s) among the list of Acceptable channels, which are determined by
the planning software to be compatible with assignments to analogue broadcasting (in
that case, only the level of outgoing interference to the analogue station is considered)
and other primary services in the Reference situation, hence available for assigning to a
digital requirement.
Assignable Channel
Refers to the channel(s) among the list of Available channels, which are determined by
the planning software to be compatible with assignments and requirements to digital and
analogue broadcasting services.
Assigned (As) Channel
Refers to the frequency channel, among the list of Available Channels, which is already
assigned to a digital assignment recorded in the Master Register.
Affected (Aff) channel
Refers to the channel of the digital or analogue assignments or requirements of the
affected administration, which is identified by the compatibility analysis.
Interfering (Int) Channel
Refers to the channel of the interfering digital or analogue assignments or requirements
of another administration (the same administration if self-incompatibility is considered),
which is identified by the compatibility analysis.
_____________