documentation for the nces common core of data, … · documentation for the nces common core of...
TRANSCRIPT
U.S. Department of Education Institute of Education Sciences NCES 2005–355
Documentation for the NCES Common Core of Data, School District Finance Survey (F-33), School Year 1996–1997, Fiscal Year (FY) 1997 Final File


U.S. Department of Education Institute of Education Sciences NCES 2005–355
Documentation for the NCES Common Core of Data, School District Finance Survey (F-33), School Year 1996–1997, Fiscal Year (FY) 1997
Final File February 2005 Chip Berry U.S. Census Bureau Crecilla Cohen Education Statistics Services Institute Frank Johnson Project Officer National Center for Education Statistics

U.S. Department of Education Margaret Spellings Secretary Institute of Education Sciences Grover J. Whitehurst Director National Center for Education Statistics Jeffery Owings Associate Commissioner The National Center for Education Statistics (NCES) is the primary federal entity for collecting, analyzing, and reporting data related to education in the United States and other nations. It fulfills a congressional mandate to collect, collate, analyze, and report full and complete statistics on the condition of education in the United States; conduct and publish reports and specialized analyses of the meaning and significance of such statistics; assist state and local education agencies in improving their statistical systems; and review and report on education activities in foreign countries. NCES activities are designed to address high priority education data needs; provide consistent, reliable, complete, and accurate indicators of education status and trends; and report timely, useful, and high quality data to the U.S. Department of Education, the Congress, the states, other education policymakers, practitioners, data users, and the general public. We strive to make our products available in a variety of formats and in language that is appropriate to a variety of audiences. You, as our customer, are the best judge of our success in communicating information effectively. If you have any comments or suggestions about this or any other NCES product or report, we would like to hear from you. Please direct your comments to: National Center for Education Statistics Institute of Education Sciences U.S. Department of Education 1990 K Street NW Washington, DC 20006–5651 February 2005 The NCES World Wide Web Home Page address is http://nces.ed.gov The NCES World Wide Web Electronic Catalog address is http://nces.ed.gov/pubsearch Suggested Citation: Berry, Chip and Cohen, Crecilla. U.S. Department of Education, National Center for Education Statistics. Documentation for the NCES Common Core of Data, School District Finance Survey (F-33), School Year 1996–97, Fiscal Year (FY) 1997, NCES 2005–355. Washington DC: 2004. For ordering information on this report, write: U.S. Department of Education ED Pubs PO Box 1398 Jessup, MD 20794–1398 Call toll free 1–877–4ED–Pub or order online at www.edpubs.org Content Contact: Frank Johnson 202–502–7362 [email protected]
iii
Contents I. Introduction to the NCES Common Core of Data, School District Finance Survey (F-33),
School Year 1996–97, Fiscal Year (FY) 1997.......................................................................... 1 II. User’s Guide.............................................................................................................................. 3
A. Methodology ....................................................................................................................... 3 B. Accounting Methods ........................................................................................................... 3 C. Unit Identifiers .................................................................................................................... 5 D. Common Core of Data (CCD) .......................................................................................... 10 E. Changes to the Survey 1990 to Present ............................................................................. 11
Sample Use ....................................................................................................................... 11 Survey Changes ................................................................................................................ 11
F. File Formats and File Names............................................................................................ 13
G. Appendices D and E.......................................................................................................... 14
Appendices Appendix A— Record Layout and Descriptions of Data Elements………………………….A-1 Appendix B— Glossary………………………………………………………………………B-1 Appendix C— State Notes……………………………………………………………………C-1 Appendix D— Value Distribution and Field Frequencies …………………………………...D-1 Appendix E— Survey Form…………………………………..………………………………E-1

iv
List of Tables C-1. California School Districts Combined Financial Data for the F-33 Survey: 1996–97……C-1 D-1. Frequencies of categorical variables, school district finance survey: 1996–97………....D-1 D-2. Count of districts with zero and non-zero values for revenues, by type of revenue and state: 1996–97……………………………………………………………….……....D-3 D-3. Count of districts with zero and non-zero values for current expenditures, by type of
expenditures and state: 1996–97…………………………………………….…….…….D-4 D-4. Count of districts with zero and non-zero values for expenditures or membership, by type of expenditures and state: 1996–97 ...……………………………………….….D-5 D-5. Minimum, maximum and mean of districts' local revenues, by state: 1996–97..…….....D-6 D-6. Minimum, maximum and mean of districts' state revenues, by state: 1996–97…..….…D-7 D-7. Minimum, maximum and mean of districts' federal revenues, by state: 1996–97……...D-8 D-8. Minimum, maximum and mean of districts' total revenues, by state: 1996–97………...D-9 D-9. Minimum, maximum and mean of districts' current expenditures for instruction, by state: 1996–97…………………………………………….…………..…………….D-10 D-10. Minimum, maximum and mean of districts' current expenditures for support services,
by state: 1996–97……………………………………………………………………….D-11 D-11. Minimum, maximum and mean of districts' other current expenditures, by state: 1996–97……………………………………...……………………………….D-12 D-12. Minimum, maximum and mean of districts' total current expenditures, by state: 1996–97……………………………………………………………….……...D-13 D-13. Minimum, maximum and mean of districts' capital outlays, by state: 1996–97…….…D-14 D-14. Minimum, maximum and mean of districts' non-elementary-secondary expenditures, by state: 1996–97……………………...…………………………………………….…D-15 D-15. Minimum, maximum and mean of districts' total expenditures, by state: 1996–97…...D-16 D-16. Minimum, maximum and mean of continuous variables: 1996–97.…………………...D-17

v
List of Figures
Figure 1. CENSUSID Position Description…………………………………………………6 Figure 2. CENSUSID State Codes………………………………..…………………………7 Figure 3. CENSUSID Type of School Government…………………………………….…..7 Figure 4. FIPS Code Description …………………………………...………………………8 Figure 5. Federal Information Processing Standards State Codes (FIPST), by State Name
and State Abbreviation, 2 Digit State Codes………………………………..…….8 Figure 6. SCHLEV Code Description…………………………………………………..….10 Figure 7. F-33 Survey Sample Data, by Year and State ………………………….…….…11 Figure 8. Changes in the F-33 Survey, Fiscal Years 1990–1996…………………………..12 Figure 9. Changes in the F-33 Survey, Fiscal Years 1992–1997…………………………..12 Figure 10. Third Position of CENSUSID, Changes in Agency Type Code Over Years……13

vi
1
U.S. Department of Education INSTITUTE OF EDUCATION SCIENCES
NATIONAL CENTER FOR EDUCATION STATISTICS 1990 K Street, NW, Washington, DC 20006
I. Introduction to the NCES Common Core of Data, School District Finance Survey (F-
33), School Year 1996–97, Fiscal Year (FY) 1997 The Common Core of Data (CCD) School District Finance Survey (F-33) consists of data submitted annually to NCES by state education agencies (SEAs, or state departments of education) in the 50 states and the District of Columbia. The purpose of the survey is to provide finance data for all local education agencies (LEAs or school districts) that provide free public elementary and secondary education in the United States. National and state totals are not included1. Both NCES and the Governments Division of the U.S. Census Bureau collect public school system finance data and they collaborate in their efforts to gather these data. The Census Bureau is required to collect government finance data under Title 13 U.S.C. Section 182. NCES is authorized to collect these data by Congress through the National Education Statistics Act of 1995, section 404(a), (20 U.S.C. 9003(a)). The Census Bureau acts as the primary collection agent and produces two data files: one for distribution and reporting by the Census Bureau and the other for distribution and reporting by NCES. The two data files differ in the inclusion in the NCES file of state government expenditures for and on behalf of school districts in certain variables, and in the classification of certain revenues as being from local or state sources. This (NCES) file also includes many charter school districts that are not included on the Census Bureau file. In addition, the data files differ in name. The Census Bureau refers to its data file as the Annual Survey of Local Government Finances: School Systems and NCES refers to its as the Common Core of Data, School District Finance Survey. This is the documentation of the CCD School District Finance Survey for FY 1997. The CCD survey is part of a system of surveys developed and designed to be inclusive rather than exclusive. Accordingly, CCD files contain a substantial number of records representing administrative and operating units that are unlike typical public schools and school districts. Definitions and categories used in the CCD are deliberately generic so that they may accommodate the many and varied organizational structures used in the provision of public elementary and secondary education across the nation. The CCD system provides features that enable the SEA and data users to identify and select records according to the categories of interest to them. The principal users of CCD Fiscal data are the Federal Government, the education research community, state and local government officials (including school boards and LEA administrators), and the general public. Data items are defined and referenced through the NCES accounting handbook, Financial Accounting for Local and State School Systems (http://nces.ed.gov/pubsearch/pubsinfo.asp?pubid=97096R). The accounting handbook provides common definitions for detail account codes, which are aggregated to form the data items collected on this survey. This helps to ensure comparable data across states and school districts.
1 Refer to the National Public Education Financial Survey (NPEFS) for national and state level figures.

2
Changes in the universe population do occur, and are often the result of new district incorporations, boundary changes, or breakups of districts. More detailed information on these changes can be found in the nonfiscal CCD Local Education Agency Universe files and documentation. The 1996–97 CCD School District Finance Survey contains 15,679 records representing the public elementary and secondary education agencies in the 50 states and the District of Columbia. Variables include revenues by source, expenditures by function, indebtedness, assets, student membership counts, and identification variables. For a complete list of variables please refer to Appendix A. The finance data are presented in whole dollar amounts. The remainder of this documentation includes a User’s Guide and five appendices. The User’s Guide contains information on methodology reflecting certain conditions that are unique to the data file covering the 1996–97 survey cycle. Information from other survey cycles that may be important to the user planning longitudinal analyses is included in part E of the User’s Guide. File versions. NCES releases a Preliminary file when we believe the data are ready to be released to the public. NCES standards require that a NCES publication using the data be released before the data are considered final. After a publication using the data has been released, NCES will release a Final file. In most cases, the Final data will be the same as Preliminary data. Changes in the Final file from the Preliminary file will be noted in the Final file documentation. If NCES receives revised data from states or discovers errors in the Final release data file, we will release a Revised file. The Revised file will indicate, in the documentation, which states sent revised data. The Revised file is usually released one year after the Final file. Appendix A—Record Layout and Descriptions of Data Elements gives the variable names and labels of the data elements discussed throughout the documentation, as well as their location on the data file for the 1996–1997 survey cycle. Appendix B—Glossary defines all of the F–33 data items. Appendix C—State Notes provides comments related to unique state financial practices for FY 1997 and how those practices relate to this data release. Appendix D—Value Distribution and Field Frequencies provides information about the frequency and distribution of data elements across local education agencies. Appendix E—Survey Form includes a facsimile of the data collection instrument.

3
II. User’s Guide A. Methodology The F-33 is a universe survey, meaning that all LEAs were surveyed from each of the 50 states and the District of Columbia. Between October 1 and December 31 of each year, the Census Bureau distributes the F-33 survey instrument to all SEAs. Representatives from each SEA collect and edit data from their LEAs, and submit data to the Census Bureau between March 15 and September 30 of the following year. Data are reported to the Census Bureau in either the F-33 format or in the individual state agency’s format. The latter process requires that the Census Bureau staff manually evaluate the SEA’s chart of accounts and create a “crosswalk” that combines or allocates state data to the F-33 format. In the 1996–97 collection, the following states sent in data in their own unique formats: Alabama, Alaska, Arizona, Arkansas, California, Colorado, Georgia, Indiana, Kentucky, Louisiana, Maine, Massachusetts, Mississippi, Montana, Nebraska, New Hampshire, New Jersey, New Mexico, North Dakota, Rhode Island, South Carolina, Tennessee, and Utah. All other states reported data in the F-33 format. Oklahoma sent revenue data in the F-33 format and expenditure data in the state’s own format. The District of Columbia and Hawaii submitted supplemental data, and additional data were taken from the National Public Education Financial Survey (NPEFS) survey. All data are monitored by survey analysts and computer edits are used to check for internal and longitudinal consistency. The F-33 is designed to provide finance data for each school district, and should not be used to create SEA totals. It is suggested that the data user look to other sources such as NPEFS (http://www.nces.ed.gov/ccd/stfis.asp) for state aggregate data. B. Accounting Methods Information collected by this survey is intended to provide a complete picture of financial activity associated with public elementary and secondary school systems. All financial transactions associated with assets, expenditures by object and function, indebtedness, and all revenue by source are considered in these data. The finance data are presented in whole dollar amounts. The Census Bureau collects and edits the data, and works with state data coordinators to resolve any inconsistent or unusual data. Some LEA data may not strictly adhere to the NCES finance manual or an LEA may be missing data for certain items. In these cases, supplemental information may be used by the Census Bureau to impute or estimate the necessary figures. A general record of data anomalies associated with state reporting and F-33 adaptation can be found in Appendix C—State Notes. There are some instances in which the Census Bureau and NCES differ in their classification of tax items. If the Census Bureau classifies a tax item as state and NCES classifies it as local, the amount is recorded in category C24 on the data file.
4
Fiscal Years. The fiscal year begins on July 1 and ends on June 30 for most states. The fiscal year for Alabama runs from October 1 through September 30, and the fiscal years for Nebraska and Texas run from September 1 through August 31. The City of Chicago School District, in Illinois, also runs from September 1 through August 31. These data are not adjusted to conform to a uniform fiscal year. Transfer Items. The F-33 file contains several transfer items involving the transfer of funds among school districts. Local Intergovernmental Revenue from Other School Districts (D11) is payments received from other school districts for providing services. In computing local revenue and total revenue totals by state or the nation, D11 should be subtracted from the revenue totals because these revenues are double counted, once by the sending the district and once by the receiving district. Payments to Other School Systems (Q11) are expenditures made to other school districts for providing services. In computing total expenditures by state or for the nation, Q11 should be subtracted from total expenditures (TOTALEXP) because these expenditures are double counted, once by the sending district and once by the receiving district. Other transfer items such as Local Intergovernmental Revenue from Cities and Towns (D23), and expenditure items Payments to State Governments (L12), and Payments to Local Governments (M12) are not double counted on the F-33, and are reported in full on the data file. D23 is included in TLOCREV and TOTALREV. L12 and M12 are included in TOTALEXP. Special Items. Payments to Private Schools (V91) and Payments to Public Charter Schools (V92) do not represent the total charter school and private school expenditures by districts. These are special items used to identify charter school and private school expenditures that are included in the reported amount for instruction (E13 and TCURINST) when those students are not included in the student count (V33). When reporting per pupil expenditures, data users should subtract items V91 and V92 from E13, TCURINST, TCURELSC, and TOTALEXP so that these expenditures are for the students included in the V33 student count. If a school district has charter schools and V92 is 0, then the student count V33 includes the count of charter school students. State Revenue on Behalf of School Districts – Employee Benefits (C38) and State Revenue on Behalf of School Districts – Other than Employee Benefits (C39) are included in the state revenue subtotal TSTREV and total revenue TOTALREV. State direct support expenditures for and on behalf of school districts are included in the detailed current expenditure items. The direct support data items on the survey form [State Payment on Behalf of the LEA: Instruction (J13), Pupil Support Services (J17), Instructional Staff Support (J07), General Administration (J08), School Administration (J09), Operation and Maintenance of Plant (J40), Student Transportation (J45), Business/Central/Other (J90), and Other (J10)] are not reported separately on the file, but have been included in the detail data items. A list of all of the data items is provided in the record layout in Appendix A. A glossary is provided in this documentation in Appendix B.
5
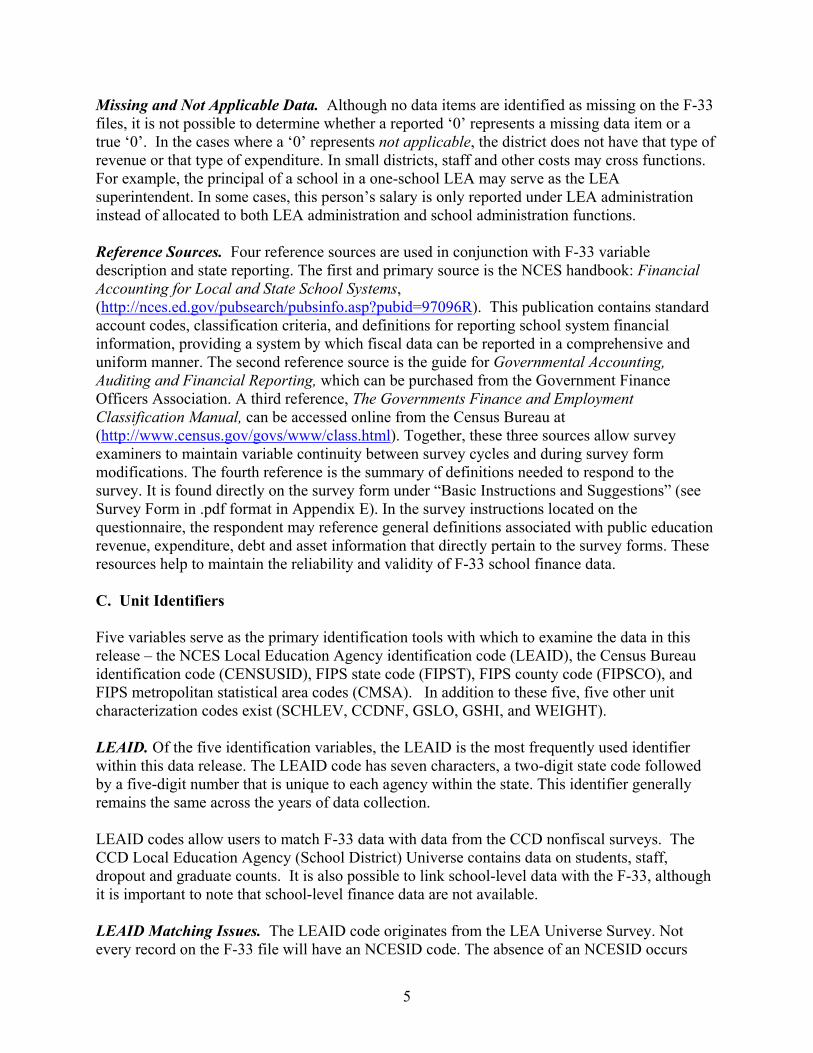
Missing and Not Applicable Data. Although no data items are identified as missing on the F-33 files, it is not possible to determine whether a reported ‘0’ represents a missing data item or a true ‘0’. In the cases where a ‘0’ represents not applicable, the district does not have that type of revenue or that type of expenditure. In small districts, staff and other costs may cross functions. For example, the principal of a school in a one-school LEA may serve as the LEA superintendent. In some cases, this person’s salary is only reported under LEA administration instead of allocated to both LEA administration and school administration functions. Reference Sources. Four reference sources are used in conjunction with F-33 variable description and state reporting. The first and primary source is the NCES handbook: Financial Accounting for Local and State School Systems, (http://nces.ed.gov/pubsearch/pubsinfo.asp?pubid=97096R). This publication contains standard account codes, classification criteria, and definitions for reporting school system financial information, providing a system by which fiscal data can be reported in a comprehensive and uniform manner. The second reference source is the guide for Governmental Accounting, Auditing and Financial Reporting, which can be purchased from the Government Finance Officers Association. A third reference, The Governments Finance and Employment Classification Manual, can be accessed online from the Census Bureau at (http://www.census.gov/govs/www/class.html). Together, these three sources allow survey examiners to maintain variable continuity between survey cycles and during survey form modifications. The fourth reference is the summary of definitions needed to respond to the survey. It is found directly on the survey form under “Basic Instructions and Suggestions” (see Survey Form in .pdf format in Appendix E). In the survey instructions located on the questionnaire, the respondent may reference general definitions associated with public education revenue, expenditure, debt and asset information that directly pertain to the survey forms. These resources help to maintain the reliability and validity of F-33 school finance data. C. Unit Identifiers Five variables serve as the primary identification tools with which to examine the data in this release – the NCES Local Education Agency identification code (LEAID), the Census Bureau identification code (CENSUSID), FIPS state code (FIPST), FIPS county code (FIPSCO), and FIPS metropolitan statistical area codes (CMSA). In addition to these five, five other unit characterization codes exist (SCHLEV, CCDNF, GSLO, GSHI, and WEIGHT). LEAID. Of the five identification variables, the LEAID is the most frequently used identifier within this data release. The LEAID code has seven characters, a two-digit state code followed by a five-digit number that is unique to each agency within the state. This identifier generally remains the same across the years of data collection. LEAID codes allow users to match F-33 data with data from the CCD nonfiscal surveys. The CCD Local Education Agency (School District) Universe contains data on students, staff, dropout and graduate counts. It is also possible to link school-level data with the F-33, although it is important to note that school-level finance data are not available. LEAID Matching Issues. The LEAID code originates from the LEA Universe Survey. Not every record on the F-33 file will have an NCESID code. The absence of an NCESID occurs

6
when agencies are not included on, or could not be matched to, the nonfiscal LEA Universe file. Education service agencies (ESAs) may also lack an NCESID. These agencies provide education-related services and will typically show administrative data but no enrollment. The existence of an LEAID code does not guarantee that a match can be made with the LEA Universe file. In some cases the nonfiscal record may be dropped (by the state coordinator) from the LEA Universe file, but continued on the fiscal file because there is still some financial activity associated with that agency. Additionally, it is possible for a district to receive start-up money in advance of having students and staff, resulting in its being reported on the fiscal F-33 survey, but not on the nonfiscal LEA Universe survey. The student membership count (V33) is derived from the LEA Universe Survey, although in some cases it has been edited. This item is adjusted when the student count on the LEA Universe Survey does not reflect the students educated in the district. In some cases the student count on the LEA Universe Survey reflects the students that the district is responsible for and not the students that are actually educated in the district. Agencies on the LEA Universe Survey that cannot be matched to the F-33 survey usually do not have student counts. A CCDNF flag has been added to the F-33 file to indicate whether a record matches a record on the LEA Universe file. In most NCES research and publications, only those F-33 records matching the LEA universe and with student counts greater than zero are used in the analysis. For more information on the NCES identification code, please see the file documentation for the School Universe and LEA Universe surveys, available on the web at http://nces.ed.gov/ccd/ccddata.asp. Data from the most recent NCES file can be accessed on the web at the US Department of Education/NCES web site at http://nces.ed.gov/ccd. CENSUSID. The CENSUSID consists of the following items by their position in the CENSUSID field:
Figure 1. CENSUSID Position Description
Position Description 1–2 Census Bureau state code 3 Agency type code (indicating ability to raise local taxes) 4–6 County area code 7–9 Parent school district government 10–14 Sub-unit of parent school district government
SOURCE: Data reported by states to the U.S. Department of Education, National Center for Education Statistics, Common Core of Data (CCD), School District Finance Survey (Form F-33) FY 1997, (sdf97d1a).
The first two positions of CENSUSID (for all cycles) represent Census Bureau / Governments Division state codes. The following table includes a complete listing of those codes.
7
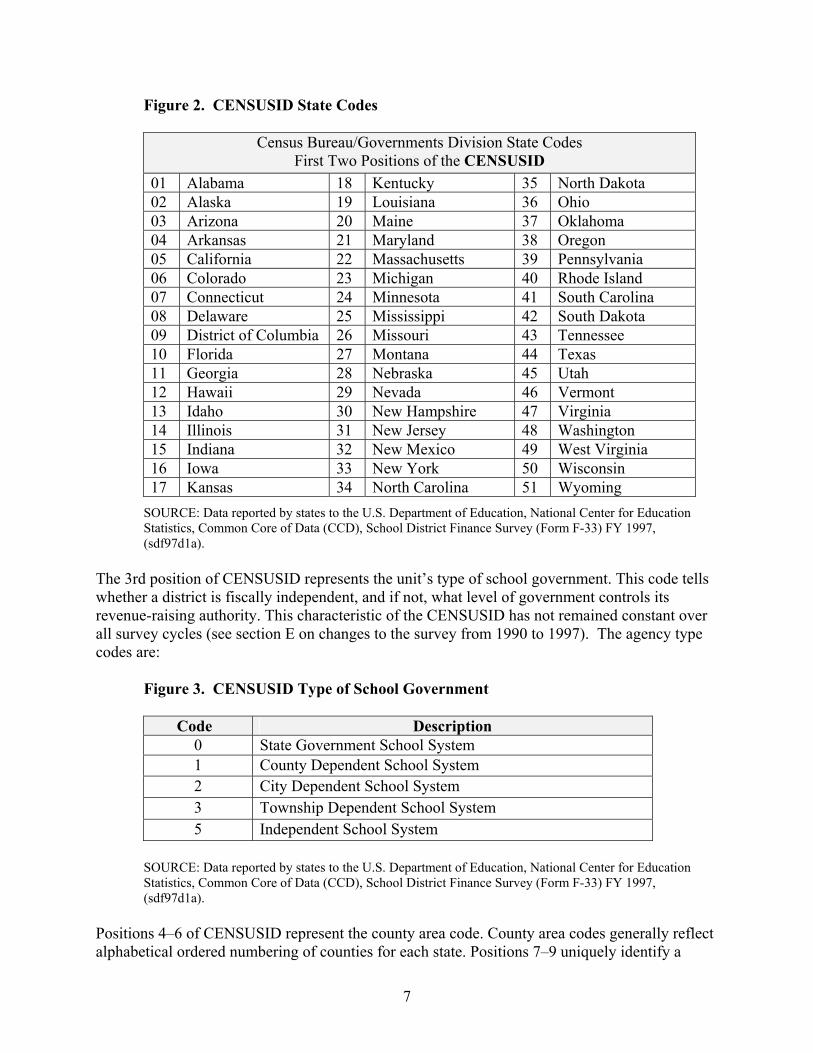
Figure 2. CENSUSID State Codes
Census Bureau/Governments Division State Codes First Two Positions of the CENSUSID
01 Alabama 18 Kentucky 35 North Dakota 02 Alaska 19 Louisiana 36 Ohio 03 Arizona 20 Maine 37 Oklahoma 04 Arkansas 21 Maryland 38 Oregon 05 California 22 Massachusetts 39 Pennsylvania 06 Colorado 23 Michigan 40 Rhode Island 07 Connecticut 24 Minnesota 41 South Carolina 08 Delaware 25 Mississippi 42 South Dakota 09 District of Columbia 26 Missouri 43 Tennessee 10 Florida 27 Montana 44 Texas 11 Georgia 28 Nebraska 45 Utah 12 Hawaii 29 Nevada 46 Vermont 13 Idaho 30 New Hampshire 47 Virginia 14 Illinois 31 New Jersey 48 Washington 15 Indiana 32 New Mexico 49 West Virginia 16 Iowa 33 New York 50 Wisconsin 17 Kansas 34 North Carolina 51 Wyoming
SOURCE: Data reported by states to the U.S. Department of Education, National Center for Education Statistics, Common Core of Data (CCD), School District Finance Survey (Form F-33) FY 1997, (sdf97d1a).
The 3rd position of CENSUSID represents the unit’s type of school government. This code tells whether a district is fiscally independent, and if not, what level of government controls its revenue-raising authority. This characteristic of the CENSUSID has not remained constant over all survey cycles (see section E on changes to the survey from 1990 to 1997). The agency type codes are:
Figure 3. CENSUSID Type of School Government
Code Description 0 State Government School System 1 County Dependent School System 2 City Dependent School System 3 Township Dependent School System 5 Independent School System
SOURCE: Data reported by states to the U.S. Department of Education, National Center for Education Statistics, Common Core of Data (CCD), School District Finance Survey (Form F-33) FY 1997, (sdf97d1a).
Positions 4–6 of CENSUSID represent the county area code. County area codes generally reflect alphabetical ordered numbering of counties for each state. Positions 7–9 uniquely identify a

8
parent school district government, regardless of type. After the 1993 cycle, unique identifiers (digits 10 through 14) were added by the Census Bureau to further specify sub-units of parent school district governments. CENSUSID for some districts may change across survey cycles due to boundary changes or changes in governmental control. FIPS Codes. Federal Information Processing Standards (FIPS) codes allow the records to be identified with specific geographic areas. The FIPS codes included are:
Figure 4. FIPS Code Description
Code Description FIPST FIPS State Code FIPSCO FIPS County Code CMSA FIPS Metropolitan Statistical Area Code
SOURCE: Data reported by states to the U.S. Department of Education, National Center for Education Statistics, Common Core of Data (CCD), School District Finance Survey (Form F-33) FY 1997, (sdf97d1a).
In the CMSA field, the first 2 digits are the alternate CMSA FIPS codes. These digits are blank if the district is not located in a CMSA. The remaining 4 digits are the MSA/CMSA FIPS code. The following table outlines FIPS state codes by state name and state abbreviation. For a list of FIPS county and metro codes refer to the following websites: http://www.itl.nist.gov/fipspubs/co-codes/states.htm(county), http://www.census.gov/population/estimates/metro-city/99mfips.txt (metro).
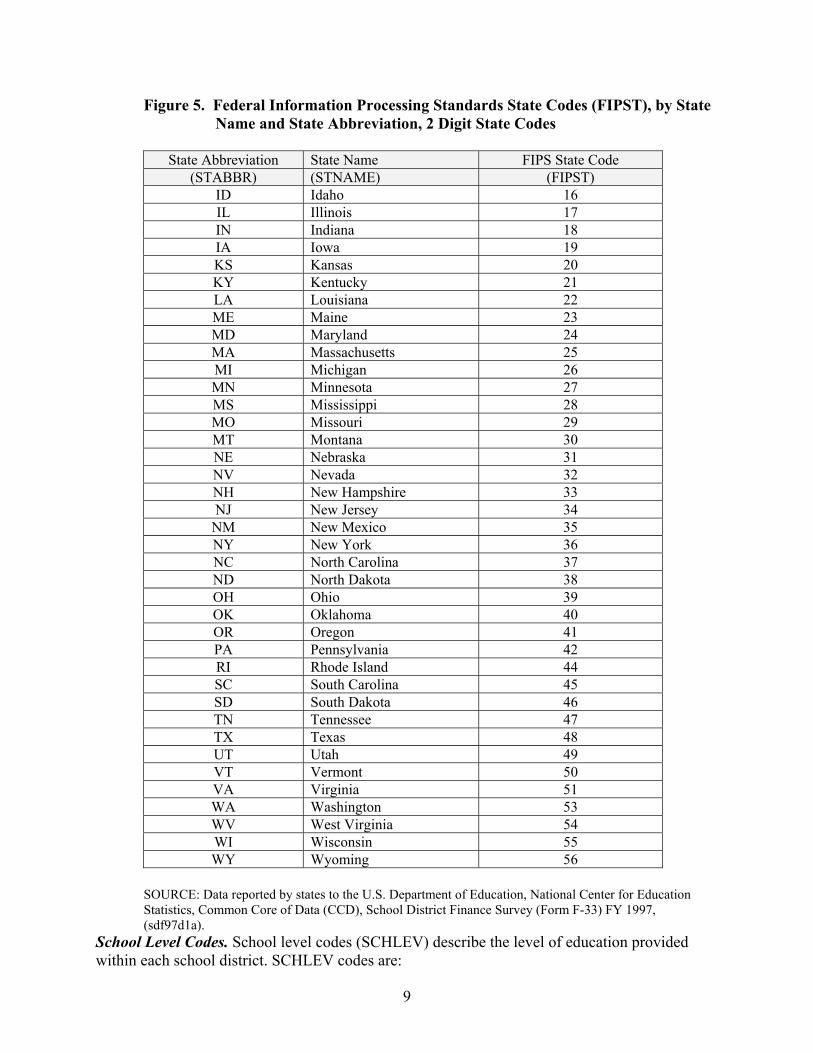
Figure 5. Federal Information Processing Standards State Codes (FIPST), by State Name and State Abbreviation, 2 Digit State Codes
State Abbreviation State Name FIPS State Code
(STABBR) (STNAME) (FIPST) AL Alabama 01 AK Alaska 02 AZ Arizona 04 AR Arkansas 05 CA California 06 CO Colorado 08 CT Connecticut 09 DE Delaware 10 DC District of Columbia 11 FL Florida 12 GA Georgia 13 HI Hawaii 15
9
Figure 5. Federal Information Processing Standards State Codes (FIPST), by State Name and State Abbreviation, 2 Digit State Codes
State Abbreviation State Name FIPS State Code
(STABBR) (STNAME) (FIPST) ID Idaho 16 IL Illinois 17 IN Indiana 18 IA Iowa 19 KS Kansas 20 KY Kentucky 21 LA Louisiana 22 ME Maine 23 MD Maryland 24 MA Massachusetts 25 MI Michigan 26 MN Minnesota 27 MS Mississippi 28 MO Missouri 29 MT Montana 30 NE Nebraska 31 NV Nevada 32 NH New Hampshire 33 NJ New Jersey 34
NM New Mexico 35 NY New York 36 NC North Carolina 37 ND North Dakota 38 OH Ohio 39 OK Oklahoma 40 OR Oregon 41 PA Pennsylvania 42 RI Rhode Island 44 SC South Carolina 45 SD South Dakota 46 TN Tennessee 47 TX Texas 48 UT Utah 49 VT Vermont 50 VA Virginia 51 WA Washington 53 WV West Virginia 54 WI Wisconsin 55 WY Wyoming 56
SOURCE: Data reported by states to the U.S. Department of Education, National Center for Education Statistics, Common Core of Data (CCD), School District Finance Survey (Form F-33) FY 1997, (sdf97d1a).
School Level Codes. School level codes (SCHLEV) describe the level of education provided within each school district. SCHLEV codes are:
10
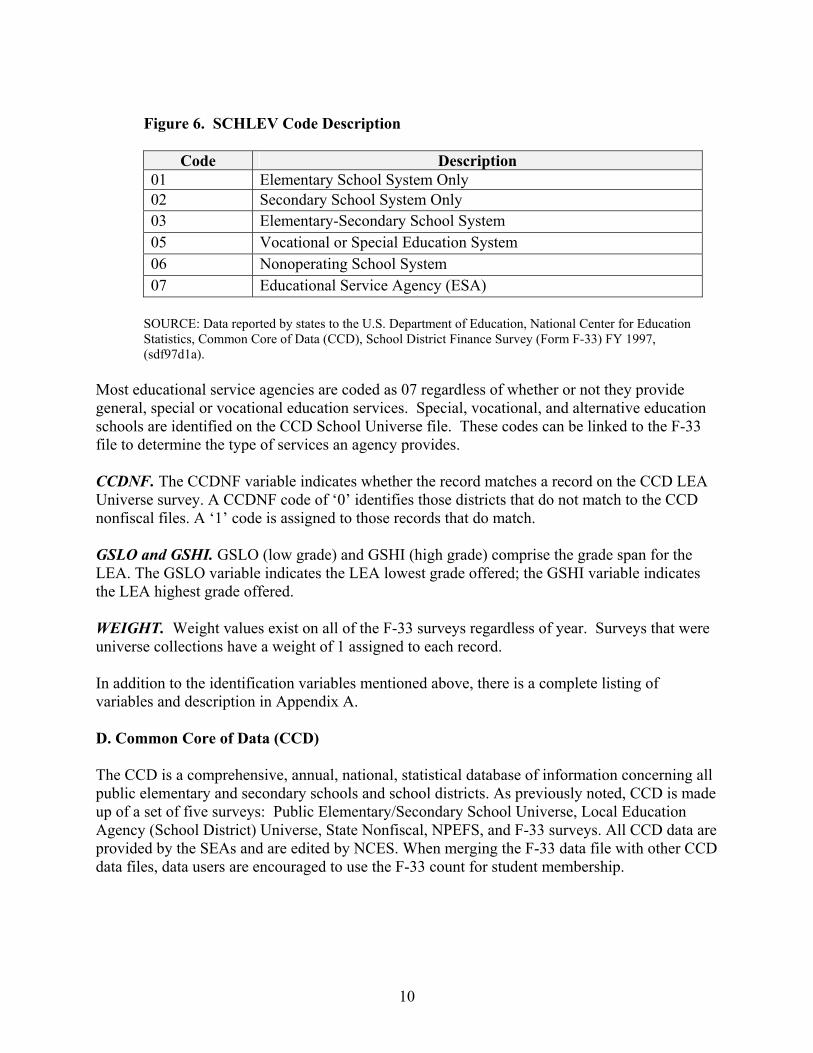
Figure 6. SCHLEV Code Description
Code Description
01 Elementary School System Only 02 Secondary School System Only 03 Elementary-Secondary School System 05 Vocational or Special Education System 06 Nonoperating School System 07 Educational Service Agency (ESA)
SOURCE: Data reported by states to the U.S. Department of Education, National Center for Education Statistics, Common Core of Data (CCD), School District Finance Survey (Form F-33) FY 1997, (sdf97d1a).
Most educational service agencies are coded as 07 regardless of whether or not they provide general, special or vocational education services. Special, vocational, and alternative education schools are identified on the CCD School Universe file. These codes can be linked to the F-33 file to determine the type of services an agency provides. CCDNF. The CCDNF variable indicates whether the record matches a record on the CCD LEA Universe survey. A CCDNF code of ‘0’ identifies those districts that do not match to the CCD nonfiscal files. A ‘1’ code is assigned to those records that do match. GSLO and GSHI. GSLO (low grade) and GSHI (high grade) comprise the grade span for the LEA. The GSLO variable indicates the LEA lowest grade offered; the GSHI variable indicates the LEA highest grade offered. WEIGHT. Weight values exist on all of the F-33 surveys regardless of year. Surveys that were universe collections have a weight of 1 assigned to each record. In addition to the identification variables mentioned above, there is a complete listing of variables and description in Appendix A. D. Common Core of Data (CCD) The CCD is a comprehensive, annual, national, statistical database of information concerning all public elementary and secondary schools and school districts. As previously noted, CCD is made up of a set of five surveys: Public Elementary/Secondary School Universe, Local Education Agency (School District) Universe, State Nonfiscal, NPEFS, and F-33 surveys. All CCD data are provided by the SEAs and are edited by NCES. When merging the F-33 data file with other CCD data files, data users are encouraged to use the F-33 count for student membership.
11
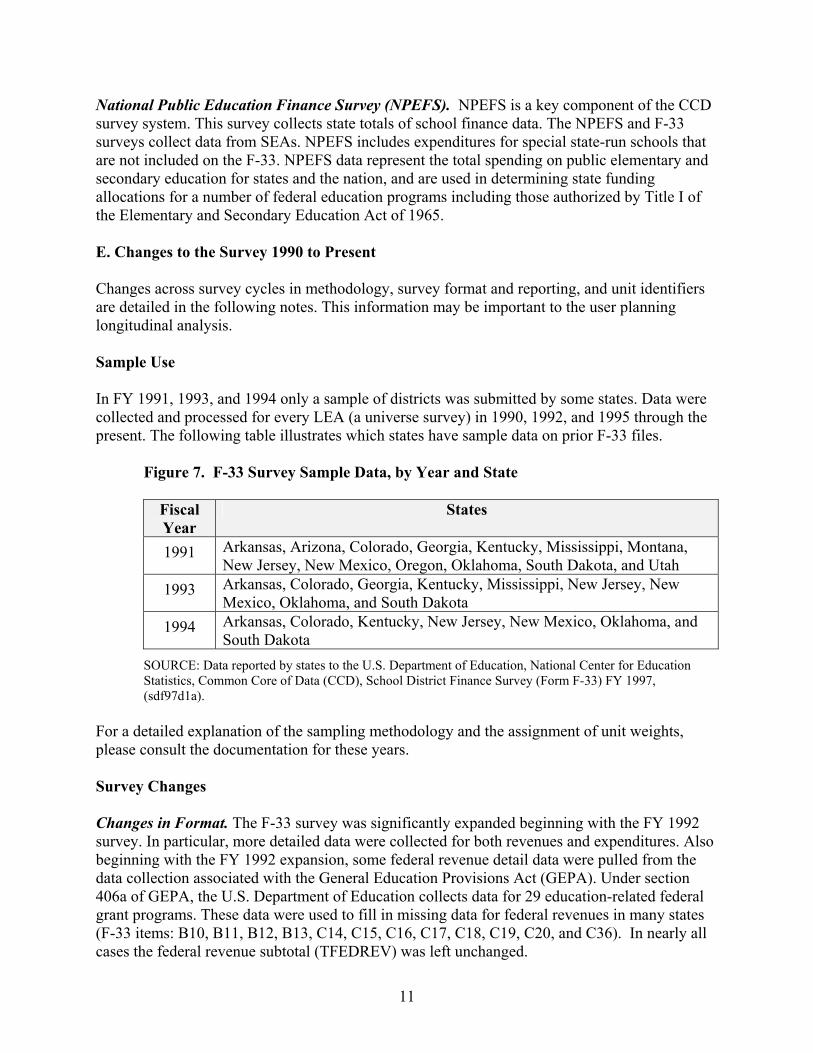
National Public Education Finance Survey (NPEFS). NPEFS is a key component of the CCD survey system. This survey collects state totals of school finance data. The NPEFS and F-33 surveys collect data from SEAs. NPEFS includes expenditures for special state-run schools that are not included on the F-33. NPEFS data represent the total spending on public elementary and secondary education for states and the nation, and are used in determining state funding allocations for a number of federal education programs including those authorized by Title I of the Elementary and Secondary Education Act of 1965. E. Changes to the Survey 1990 to Present Changes across survey cycles in methodology, survey format and reporting, and unit identifiers are detailed in the following notes. This information may be important to the user planning longitudinal analysis. Sample Use In FY 1991, 1993, and 1994 only a sample of districts was submitted by some states. Data were collected and processed for every LEA (a universe survey) in 1990, 1992, and 1995 through the present. The following table illustrates which states have sample data on prior F-33 files.
Figure 7. F-33 Survey Sample Data, by Year and State
Fiscal Year
States
1991 Arkansas, Arizona, Colorado, Georgia, Kentucky, Mississippi, Montana, New Jersey, New Mexico, Oregon, Oklahoma, South Dakota, and Utah
1993 Arkansas, Colorado, Georgia, Kentucky, Mississippi, New Jersey, New Mexico, Oklahoma, and South Dakota
1994 Arkansas, Colorado, Kentucky, New Jersey, New Mexico, Oklahoma, and South Dakota
SOURCE: Data reported by states to the U.S. Department of Education, National Center for Education Statistics, Common Core of Data (CCD), School District Finance Survey (Form F-33) FY 1997, (sdf97d1a).
For a detailed explanation of the sampling methodology and the assignment of unit weights, please consult the documentation for these years. Survey Changes Changes in Format. The F-33 survey was significantly expanded beginning with the FY 1992 survey. In particular, more detailed data were collected for both revenues and expenditures. Also beginning with the FY 1992 expansion, some federal revenue detail data were pulled from the data collection associated with the General Education Provisions Act (GEPA). Under section 406a of GEPA, the U.S. Department of Education collects data for 29 education-related federal grant programs. These data were used to fill in missing data for federal revenues in many states (F-33 items: B10, B11, B12, B13, C14, C15, C16, C17, C18, C19, C20, and C36). In nearly all cases the federal revenue subtotal (TFEDREV) was left unchanged.

12
Figure 8. Changes in the F-33 Survey, Fiscal Years 1990–1996
1990 to 1991 1992 to 1996
A10 A07+A08+A15 A12 A11+A13+A20 B26 B10+B11+B12+B13 C23 C01+C04+C05+C06+C07+C08+C09+C10+C11+C12+
C13+C35 C26 C14+C15+C16+C17+C18+C19+C20+C36 C27 C38+C39 E27 V35+V40+V45+V50+V55 E15 V85 K12 K09+K10+K11
SOURCE: Data reported by states to the U.S. Department of Education, National Center for Education Statistics, Common Core of Data (CCD), School District Finance Survey (Form F-33) FY 1997, (sdf97d1a).
Beginning with the FY 1997 survey, some administrative expenditure items were collapsed. These changes are summarized in the tables below.
Figure 9. Changes in the F-33 Survey, Fiscal Years 1992–1997
1992 to 1996 1997 V19+V25+V27 V37 V20+V26+V28 V38 V35+V50+V55 V90
Additional Variables. Beginning in FY 1997, two variables, Payments to Private Schools (V91) and Payments to Charter Schools (V92), were added. Combined Financial Data. For six districts in California, the state reports a single unified district on the F-33, but separate elementary and secondary districts on the CCD LEA Universe. California treats the two Elementary and High School districts as one district in its financial accounting, but as separate districts in managing student and staff data. An NCESID code is assigned to the combined district so that it may be matched with related items on the CCD file. Refer to the table in Appendix C under California for a list of the combined data by district, NCESID, enrollment and year. Changes in Unit Identifiers. Prior to 1994, CENSUSID consisted of a 9-digit field where positions 1–2 represented the Census Bureau state code; position 3, the agency type code; positions 4–6, the country area code; and positions 7–9, the parent school district government. In the 1994–1997 cycles, positions 10–14 were added to further specify units of parent school district governments. Consequently, the CENSUSID was changed from a 9-digit field to a 14-digit field. Following the 1993 survey cycle, the type codes, position 3 of the CENSUSID, were changed and are detailed in the following table.

13
Figure 10. Third Position of CENSUSID, Changes in Agency Type Code Over Years
(Type / Description) Prior to FY 1994 FY 1994 – Present
0 / State Dependent School Systems 0 / State Dependent School Systems 5 / Independent School Systems 5 / Independent School District 7 / County Dependent School Systems 1 / County Dependent School System 8 / City Dependent School System 2 / City Dependent School System 9 / Township Dependent School system 3 / Township Dependent School System
SOURCE: Data reported by states to the U.S. Department of Education, National Center for Education Statistics, Common Core of Data (CCD), School District Finance Survey (Form F-33) FY 1997, (sdf97d1a).
Longitudinal Consistency. Although longitudinal consistency is a key principle of CCD, it is impossible for NCES to guarantee, particularly when utilizing early data cycles. As previously discussed, in 1991, 1993, and 1994 the F-33 survey utilized sample data. As a result, it is not possible to conduct a longitudinal study for every LEA across every survey cycle. Data files prior to FY 1994 contain a YRDATA variable. The variable was used to identify records that utilized data from a previous year. Prior to FY 1994, when entire records were missing, records from a previous year were copied into the current year file and inflated using the Municipal Cost Index2. YRDATA indicated which year the data were drawn for each record. Beginning with FY 1994 this method was no longer utilized. Files covering fiscal years 1994 through 1997 are missing a small amount of detail data within support services for a limited number of districts in California. The subtotals TCURSSVC, TCURELSC and TOTALEXP include these expenditures, but a detailed breakout within support services was not reported. F. File Formats and File Names Data File Formats. Data presented in this release are available in two formats — SAS data sets (.sas7bdat), and tab-delimited text files (.txt). The names of those data sets are:
sdf97d1a.sas7bdat (SAS — F-33 data for School Year 1996–1997, FY 1997) sdf97d1a.txt (TEXT — F-33 data for School Year 1996–1997, FY 1997) Complete information on layout (variable name, data type – alpha or numeric, and variable description) can be found in Appendix A. Finance data included in these files are presented in whole dollar amounts. The School District Finance Survey (F-33) data file for FY 1997 is titled sdf97d1a.sas7bdat. The first 5 characters indicate the file contents and year, and the last 3 characters indicate the file version. “sdf” stands for school district finance, “97” stands for FY 1997, “d” indicates this is
2 Refer to the “American City County” magazine for the Municipal Cost Index (http://americancityandcounty.com/). Data were inflated using the index to one decimal place.
14
the 4th version of this file produced by the Census Bureau, “1” indicates that the file is ready for release by NCES, and “a” indicates this is the first release of this file by NCES. G. Appendices D and E Zero / Non-zero Frequencies of Cumulative Variables. The frequency of non-zero and zero data for cumulative variables (totals and subtotals) is provided in Appendix D of this release. Survey Forms / Questionnaires. The F-33 survey form is provided in Appendix E in a portable document format (pdf), which can be viewed and printed using an Acrobat Reader. There are items on the survey form that do not appear on the data file. They are referred to as Special Processing Items and are used in processing the F-33 data. These items are listed in Part IX of the survey form and include: A15, T07, C24, C35, C36, J13, J17, J07 and J08. The survey form may be accessed in the following file folder: F-33_97q (TIF — F-33 Survey for 1997).

Appendix A—Record Layout and Data Elements Description Common Core of Data, School District Financial Survey, SY 1996–97, FY 1997
A-
1
File name=sdf97d1a.txt Number of Variables =127 Number of Observations = 15,679 Release: 1a, February 2005 This is a tab-delimited file. All finance data are in whole dollars. Position Variable Name Type Variable Description
1 LEAID Char NCES 7 DIGIT LOCAL EDUCATION AGENCY ID 2 CENSUSID Char CENSUS 14 DIGIT GOVT ID 3 FIPST Char FIPS STATE NUMBER 4 FIPSCO Char FIPS COUNTY NUMBER 5 CMSA Char CMSA/PMSA/MSA CODE – digits 1 and 2 are ‘00’ or the code for the
Consolidated Metropolitan Statistical Area; digits 3-6 are either the PMSA or MSA code as appropriate.
6 NAME Char NAME OF LOCAL EDUCATION AGENCY 7 STNAME Char STATE NAME 8 STABBR Char STATE ABBREVIATION 9 SCHLEV Char SCHOOL LEVEL CODE
01 Elementary School System only 02 Secondary School System only 03 Elementary-Secondary School System 05 Vocational or Special Education School System 06 Non-Operating School System 07 Education Service Agency
10 YEAR Char YEAR OF DATA
11 CCDNF Char CCD AGENCY NONFISCAL FILE MATCH 0 Does not match CCD Local Education Agency Universe file 1 Matches CCD Local Education Agency Universe file
12 GSLO Char AGENCY LOW GRADE OFFERED 13 GSHI Char AGENCY HIGH GRADE OFFERED 14 V33 Num FALL MEMBERSHIP 15 TOTALREV Num TOTAL REVENUE
(equals TFEDREV + TSTREV + TLOCREV) 16 TFEDREV Num TOTAL FEDERAL REVENUE
(equals C14 + C15 + C16 + C17 + C18 + C19 + C20 + C25 + C36 + B10 + B11 + B12 + B13)
17 C14 Num FED REV - THRU STATE - TITLE I 18 C15 Num FED REV - THRU STATE - CHILDREN WITH DISABILITIES - IDEA 19 C16 Num FED REV - THRU STATE - EISENHOWER MATH AND SCIENCE 20 C17 Num FED REV - THRU STATE - DRUG FREE SCHOOLS 21 C18 Num FED REV - THRU STATE - TITLE VI 22 C19 Num FED REV - THRU STATE - VOCATIONAL EDUCATION 23 C20 Num FED REV - THRU STATE - OTHER 24 C25 Num FED REV - THRU STATE - CHILD NUTRITION ACT 25 C36 Num FED REV - NONSPECIFIED 26 B10 Num FED REV - DIRECT - IMPACT AID 27 B11 Num FED REV - DIRECT - BILINGUAL EDUCATION 28 B12 Num FED REV - DIRECT - INDIAN EDUCATION 29 B13 Num FED REV - DIRECT - OTHER
Appendix A—Record Layout and Data Elements Description Common Core of Data, School District Financial Survey, SY 1996–97, FY 1997
A-
2
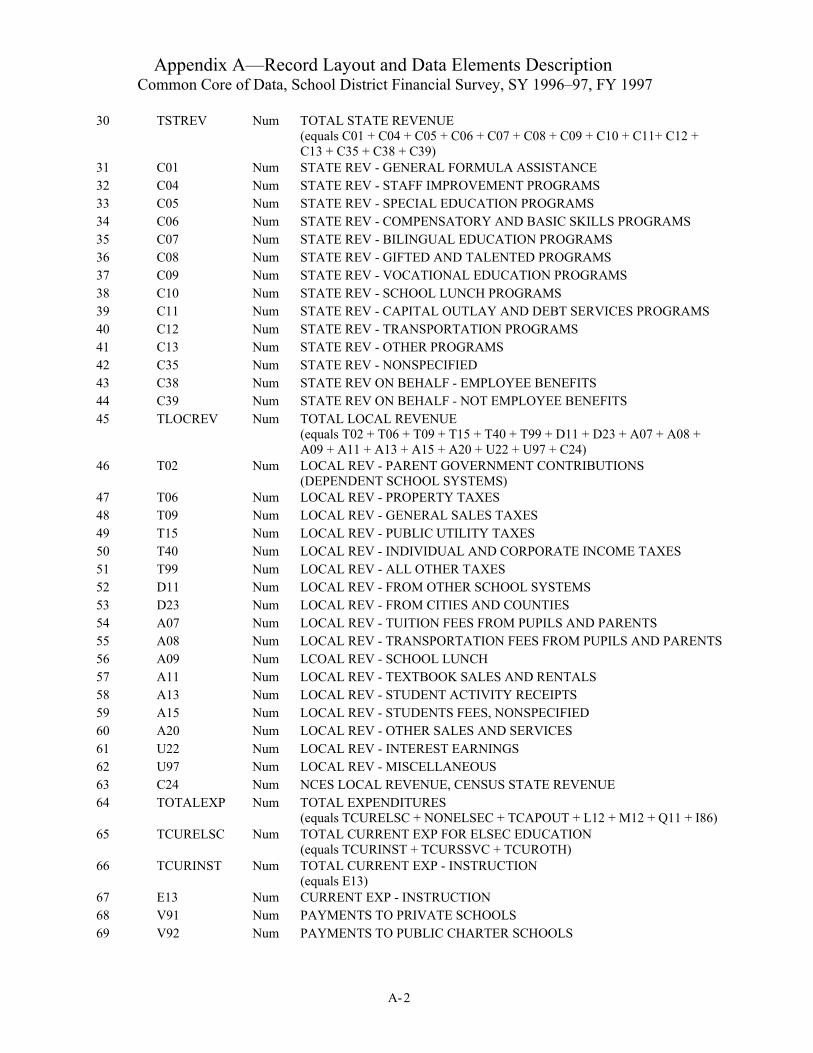
30 TSTREV Num TOTAL STATE REVENUE (equals C01 + C04 + C05 + C06 + C07 + C08 + C09 + C10 + C11+ C12 + C13 + C35 + C38 + C39)
31 C01 Num STATE REV - GENERAL FORMULA ASSISTANCE 32 C04 Num STATE REV - STAFF IMPROVEMENT PROGRAMS 33 C05 Num STATE REV - SPECIAL EDUCATION PROGRAMS 34 C06 Num STATE REV - COMPENSATORY AND BASIC SKILLS PROGRAMS 35 C07 Num STATE REV - BILINGUAL EDUCATION PROGRAMS 36 C08 Num STATE REV - GIFTED AND TALENTED PROGRAMS 37 C09 Num STATE REV - VOCATIONAL EDUCATION PROGRAMS 38 C10 Num STATE REV - SCHOOL LUNCH PROGRAMS 39 C11 Num STATE REV - CAPITAL OUTLAY AND DEBT SERVICES PROGRAMS 40 C12 Num STATE REV - TRANSPORTATION PROGRAMS 41 C13 Num STATE REV - OTHER PROGRAMS 42 C35 Num STATE REV - NONSPECIFIED 43 C38 Num STATE REV ON BEHALF - EMPLOYEE BENEFITS 44 C39 Num STATE REV ON BEHALF - NOT EMPLOYEE BENEFITS 45 TLOCREV Num TOTAL LOCAL REVENUE
(equals T02 + T06 + T09 + T15 + T40 + T99 + D11 + D23 + A07 + A08 + A09 + A11 + A13 + A15 + A20 + U22 + U97 + C24)
46 T02 Num LOCAL REV - PARENT GOVERNMENT CONTRIBUTIONS (DEPENDENT SCHOOL SYSTEMS)
47 T06 Num LOCAL REV - PROPERTY TAXES 48 T09 Num LOCAL REV - GENERAL SALES TAXES 49 T15 Num LOCAL REV - PUBLIC UTILITY TAXES 50 T40 Num LOCAL REV - INDIVIDUAL AND CORPORATE INCOME TAXES 51 T99 Num LOCAL REV - ALL OTHER TAXES 52 D11 Num LOCAL REV - FROM OTHER SCHOOL SYSTEMS 53 D23 Num LOCAL REV - FROM CITIES AND COUNTIES 54 A07 Num LOCAL REV - TUITION FEES FROM PUPILS AND PARENTS 55 A08 Num LOCAL REV - TRANSPORTATION FEES FROM PUPILS AND PARENTS56 A09 Num LCOAL REV - SCHOOL LUNCH 57 A11 Num LOCAL REV - TEXTBOOK SALES AND RENTALS 58 A13 Num LOCAL REV - STUDENT ACTIVITY RECEIPTS 59 A15 Num LOCAL REV - STUDENTS FEES, NONSPECIFIED 60 A20 Num LOCAL REV - OTHER SALES AND SERVICES 61 U22 Num LOCAL REV - INTEREST EARNINGS 62 U97 Num LOCAL REV - MISCELLANEOUS 63 C24 Num NCES LOCAL REVENUE, CENSUS STATE REVENUE 64 TOTALEXP Num TOTAL EXPENDITURES
(equals TCURELSC + NONELSEC + TCAPOUT + L12 + M12 + Q11 + I86)65 TCURELSC Num TOTAL CURRENT EXP FOR ELSEC EDUCATION
(equals TCURINST + TCURSSVC + TCUROTH) 66 TCURINST Num TOTAL CURRENT EXP - INSTRUCTION
(equals E13) 67 E13 Num CURRENT EXP - INSTRUCTION 68 V91 Num PAYMENTS TO PRIVATE SCHOOLS 69 V92 Num PAYMENTS TO PUBLIC CHARTER SCHOOLS
Appendix A—Record Layout and Data Elements Description Common Core of Data, School District Financial Survey, SY 1996–97, FY 1997
A-
3
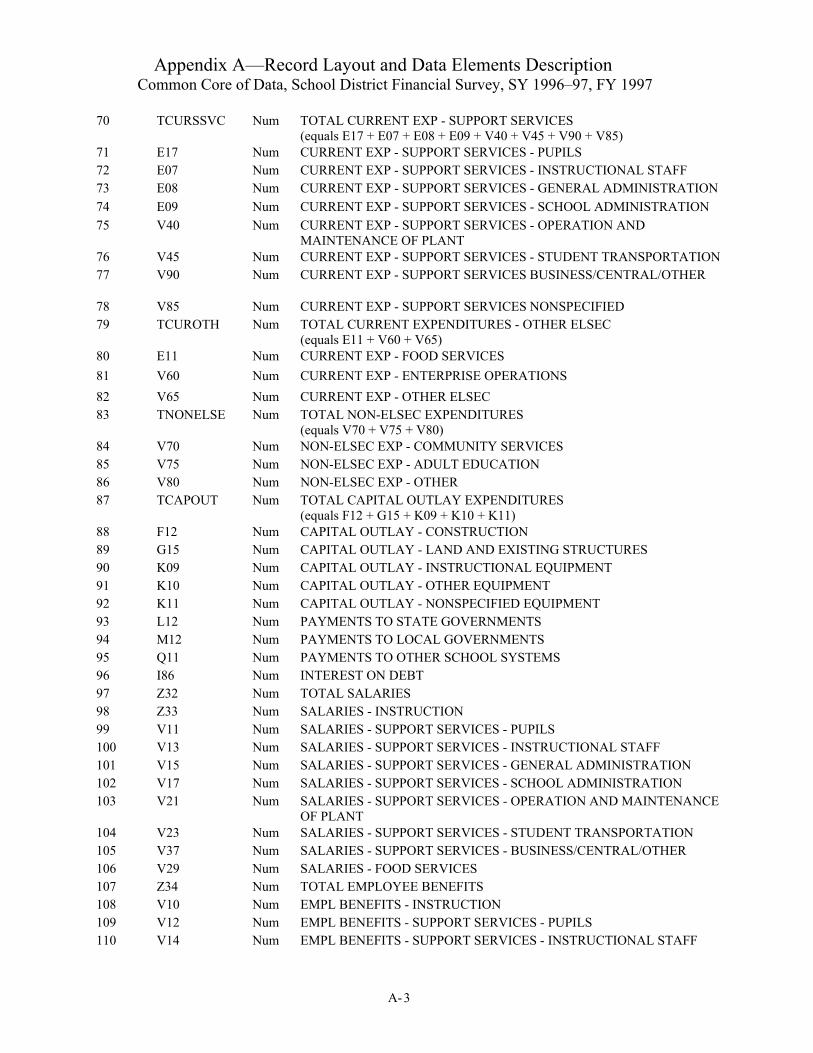
70 TCURSSVC Num TOTAL CURRENT EXP - SUPPORT SERVICES (equals E17 + E07 + E08 + E09 + V40 + V45 + V90 + V85)
71 E17 Num CURRENT EXP - SUPPORT SERVICES - PUPILS 72 E07 Num CURRENT EXP - SUPPORT SERVICES - INSTRUCTIONAL STAFF 73 E08 Num CURRENT EXP - SUPPORT SERVICES - GENERAL ADMINISTRATION74 E09 Num CURRENT EXP - SUPPORT SERVICES - SCHOOL ADMINISTRATION 75 V40 Num CURRENT EXP - SUPPORT SERVICES - OPERATION AND
MAINTENANCE OF PLANT 76 V45 Num CURRENT EXP - SUPPORT SERVICES - STUDENT TRANSPORTATION77 V90 Num CURRENT EXP - SUPPORT SERVICES BUSINESS/CENTRAL/OTHER
78 V85 Num CURRENT EXP - SUPPORT SERVICES NONSPECIFIED 79 TCUROTH Num TOTAL CURRENT EXPENDITURES - OTHER ELSEC
(equals E11 + V60 + V65) 80 E11 Num CURRENT EXP - FOOD SERVICES 81 V60 Num CURRENT EXP - ENTERPRISE OPERATIONS 82 V65 Num CURRENT EXP - OTHER ELSEC 83 TNONELSE Num TOTAL NON-ELSEC EXPENDITURES
(equals V70 + V75 + V80) 84 V70 Num NON-ELSEC EXP - COMMUNITY SERVICES 85 V75 Num NON-ELSEC EXP - ADULT EDUCATION 86 V80 Num NON-ELSEC EXP - OTHER 87 TCAPOUT Num TOTAL CAPITAL OUTLAY EXPENDITURES
(equals F12 + G15 + K09 + K10 + K11) 88 F12 Num CAPITAL OUTLAY - CONSTRUCTION 89 G15 Num CAPITAL OUTLAY - LAND AND EXISTING STRUCTURES 90 K09 Num CAPITAL OUTLAY - INSTRUCTIONAL EQUIPMENT 91 K10 Num CAPITAL OUTLAY - OTHER EQUIPMENT 92 K11 Num CAPITAL OUTLAY - NONSPECIFIED EQUIPMENT 93 L12 Num PAYMENTS TO STATE GOVERNMENTS 94 M12 Num PAYMENTS TO LOCAL GOVERNMENTS 95 Q11 Num PAYMENTS TO OTHER SCHOOL SYSTEMS 96 I86 Num INTEREST ON DEBT 97 Z32 Num TOTAL SALARIES 98 Z33 Num SALARIES - INSTRUCTION 99 V11 Num SALARIES - SUPPORT SERVICES - PUPILS 100 V13 Num SALARIES - SUPPORT SERVICES - INSTRUCTIONAL STAFF 101 V15 Num SALARIES - SUPPORT SERVICES - GENERAL ADMINISTRATION 102 V17 Num SALARIES - SUPPORT SERVICES - SCHOOL ADMINISTRATION 103 V21 Num SALARIES - SUPPORT SERVICES - OPERATION AND MAINTENANCE
OF PLANT 104 V23 Num SALARIES - SUPPORT SERVICES - STUDENT TRANSPORTATION 105 V37 Num SALARIES - SUPPORT SERVICES - BUSINESS/CENTRAL/OTHER 106 V29 Num SALARIES - FOOD SERVICES 107 Z34 Num TOTAL EMPLOYEE BENEFITS 108 V10 Num EMPL BENEFITS - INSTRUCTION 109 V12 Num EMPL BENEFITS - SUPPORT SERVICES - PUPILS 110 V14 Num EMPL BENEFITS - SUPPORT SERVICES - INSTRUCTIONAL STAFF
Appendix A—Record Layout and Data Elements Description Common Core of Data, School District Financial Survey, SY 1996–97, FY 1997
A-
4
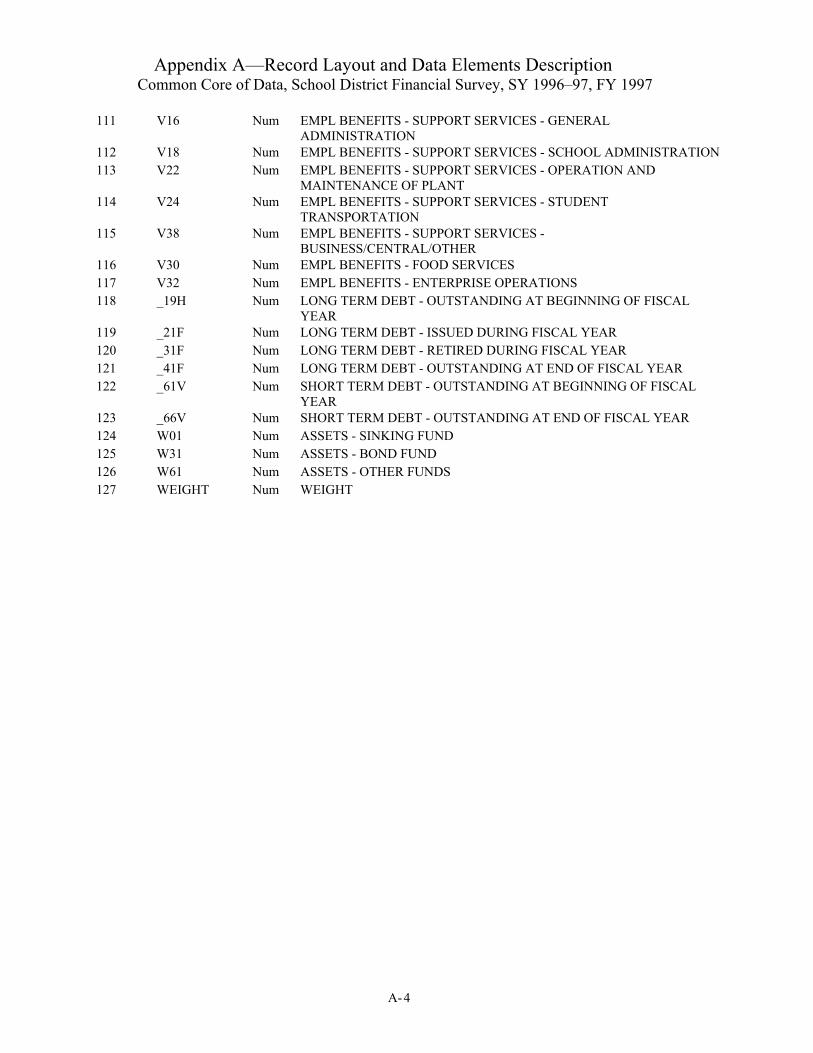
111 V16 Num EMPL BENEFITS - SUPPORT SERVICES - GENERAL ADMINISTRATION
112 V18 Num EMPL BENEFITS - SUPPORT SERVICES - SCHOOL ADMINISTRATION113 V22 Num EMPL BENEFITS - SUPPORT SERVICES - OPERATION AND
MAINTENANCE OF PLANT 114 V24 Num EMPL BENEFITS - SUPPORT SERVICES - STUDENT
TRANSPORTATION 115 V38 Num EMPL BENEFITS - SUPPORT SERVICES -
BUSINESS/CENTRAL/OTHER 116 V30 Num EMPL BENEFITS - FOOD SERVICES 117 V32 Num EMPL BENEFITS - ENTERPRISE OPERATIONS 118 _19H Num LONG TERM DEBT - OUTSTANDING AT BEGINNING OF FISCAL
YEAR 119 _21F Num LONG TERM DEBT - ISSUED DURING FISCAL YEAR 120 _31F Num LONG TERM DEBT - RETIRED DURING FISCAL YEAR 121 _41F Num LONG TERM DEBT - OUTSTANDING AT END OF FISCAL YEAR 122 _61V Num SHORT TERM DEBT - OUTSTANDING AT BEGINNING OF FISCAL
YEAR 123 _66V Num SHORT TERM DEBT - OUTSTANDING AT END OF FISCAL YEAR 124 W01 Num ASSETS - SINKING FUND 125 W31 Num ASSETS - BOND FUND 126 W61 Num ASSETS - OTHER FUNDS 127 WEIGHT Num WEIGHT

Appendix B—Glossary Common Core of Data, School District Finance Survey, SY 1996–97, FY 1997
B-1
This glossary applies to the school district financial survey. When applicable, corresponding F-33 variables are listed in brackets. For additional detail, it is suggested that the data user consult the NCES Handbook: Financial Accounting for Local and State School Systems. BOND FUNDS. Funds established to account for the proceeds of bond issues pending their disbursement. [W31] CAPITAL OUTLAY. Direct expenditure for construction of buildings, roads, and other improvements, and for purchases of equipment, land, and existing structures. Includes amounts for additions, replacements, and major alterations to fixed works and structures. However, expenditure for repairs to such works and structures is classified as current expenditure. [TCAPOUT is the sum of: F12, G15, K09, K10, and K11] CASH and INVESTMENTS. Cash, deposits, and government and private securities (bonds, notes, stocks, mortgages, etc.) except holdings of agency and private trust funds. Does not include interfund loans, receivables, and the value of real property and other fixed assets. [W01, W31, W61] CCD. Common Core of Data. A group of public elementary-secondary education surveys of NCES. CCD data are collected from each state’s department of education, from their administrative records data systems. The CCD variable on the F-33 data file indicates whether the record matches a record on the CCD (nonfiscal) Local Education Agency Universe file. CENSUS STATE REVENUE. The C24 category is reserved for any tax item classified as state by the U.S. Census Bureau and as local by the NCES. [C24] CHARTER SCHOOLS. Charter schools are public schools that are exempted from significant state or local rules that normally govern the operation and management of public schools. A charter school is created by a developer as a public school, or is adapted by a developer from an existing public school. It operates in pursuit of a specific set of education objectives determined by the school’s developer and agreed to by the public chartering agency and provides a program of elementary or secondary education, or both. It meets all applicable federal, state, and local health and safety requirements; complies with federal civil rights laws and operates in accordance with state law. Charter schools may be affiliated with a regular school district, or they may be self-governing entities. CONSTRUCTION. Production of fixed works and structures and additions, replacements, and major alterations thereto, including planning and design of specific projects, site improvements and provision of equipment and facilities that are integral parts of a structure. Includes both construction undertaken either on a contractual basis by private contractors or through a government’s own staff (i.e. force account). [F12] CURRENT EXPENDITURE. Expenditure for Instruction (TCURINST), Support Services (TCURSSVC), and Other Elementary-Secondary Programs (TCUROTH.) Includes salaries, employee benefits, purchased services, and supplies, as well as payments made by states on behalf of school districts. Also includes transfers made by school districts into their own retirement system. Excludes expenditure for Non Elementary-Secondary Programs (TNONELSE), debt service, capital outlay, and transfers to other governments or school districts. This item is formally called "current expenditures for public elementary - secondary education." [TCURELSC is the sum of: TCURINST, TCURSSVC, and TCUROTH] CURRENT OPERATION EXPENDITURE. A Census Bureau summary category similar to Current Spending, but that excludes payments made by states on behalf of school districts and transfers by some school districts into their own retirement system. CURRENT SPENDING. A Census Bureau summary category comprised of expenditure for instruction, support services, other elementary-secondary programs, and non elementary-secondary programs. DEBT. Long-term credit obligations of the school system or its parent government and all interest-bearing short-term (repayable within 1 year) credit obligations. Excludes noninterest-bearing short-term obligations, interfund obligations, amounts owed in a trust agency capacity, advances and contingent loans from other governments, and
Appendix B—Glossary Common Core of Data, School District Finance Survey, SY 1996–97, FY 1997
B-2
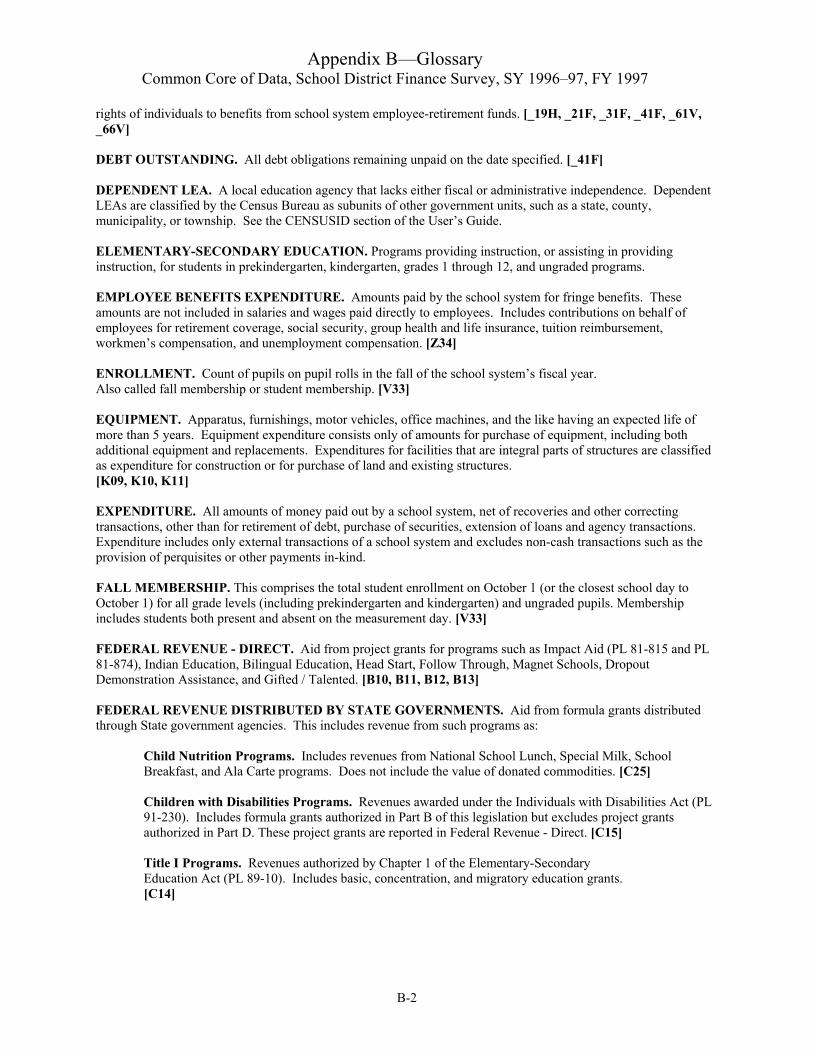
rights of individuals to benefits from school system employee-retirement funds. [_19H, _21F, _31F, _41F, _61V, _66V] DEBT OUTSTANDING. All debt obligations remaining unpaid on the date specified. [_41F] DEPENDENT LEA. A local education agency that lacks either fiscal or administrative independence. Dependent LEAs are classified by the Census Bureau as subunits of other government units, such as a state, county, municipality, or township. See the CENSUSID section of the User’s Guide. ELEMENTARY-SECONDARY EDUCATION. Programs providing instruction, or assisting in providing instruction, for students in prekindergarten, kindergarten, grades 1 through 12, and ungraded programs. EMPLOYEE BENEFITS EXPENDITURE. Amounts paid by the school system for fringe benefits. These amounts are not included in salaries and wages paid directly to employees. Includes contributions on behalf of employees for retirement coverage, social security, group health and life insurance, tuition reimbursement, workmen’s compensation, and unemployment compensation. [Z34] ENROLLMENT. Count of pupils on pupil rolls in the fall of the school system’s fiscal year. Also called fall membership or student membership. [V33] EQUIPMENT. Apparatus, furnishings, motor vehicles, office machines, and the like having an expected life of more than 5 years. Equipment expenditure consists only of amounts for purchase of equipment, including both additional equipment and replacements. Expenditures for facilities that are integral parts of structures are classified as expenditure for construction or for purchase of land and existing structures. [K09, K10, K11] EXPENDITURE. All amounts of money paid out by a school system, net of recoveries and other correcting transactions, other than for retirement of debt, purchase of securities, extension of loans and agency transactions. Expenditure includes only external transactions of a school system and excludes non-cash transactions such as the provision of perquisites or other payments in-kind. FALL MEMBERSHIP. This comprises the total student enrollment on October 1 (or the closest school day to October 1) for all grade levels (including prekindergarten and kindergarten) and ungraded pupils. Membership includes students both present and absent on the measurement day. [V33] FEDERAL REVENUE - DIRECT. Aid from project grants for programs such as Impact Aid (PL 81-815 and PL 81-874), Indian Education, Bilingual Education, Head Start, Follow Through, Magnet Schools, Dropout Demonstration Assistance, and Gifted / Talented. [B10, B11, B12, B13] FEDERAL REVENUE DISTRIBUTED BY STATE GOVERNMENTS. Aid from formula grants distributed through State government agencies. This includes revenue from such programs as:
Child Nutrition Programs. Includes revenues from National School Lunch, Special Milk, School Breakfast, and Ala Carte programs. Does not include the value of donated commodities. [C25]
Children with Disabilities Programs. Revenues awarded under the Individuals with Disabilities Act (PL 91-230). Includes formula grants authorized in Part B of this legislation but excludes project grants authorized in Part D. These project grants are reported in Federal Revenue - Direct. [C15]
Title I Programs. Revenues authorized by Chapter 1 of the Elementary-Secondary
Education Act (PL 89-10). Includes basic, concentration, and migratory education grants. [C14]

Appendix B—Glossary Common Core of Data, School District Finance Survey, SY 1996–97, FY 1997
B-3
Vocational Programs. Revenues from the Carl D. Perkins Vocational Education Act (PL 101-392). Includes revenues from Title II (Basic Grants), Title III (Community Based Organizations), Title III-B (Consumer and Homemaking Education), and Title III-E (Tech-Prep Education). [C19] Other Federal Aid Distributed by the State. Includes revenues from other formula grant programs distributed through state governments, such as the Adult Education Act (Part B), Chapter 2 Block Grants sanctioned by the Education Consolidation Improvement Act (PL 100-297), Drug Free Schools (1986 Elementary-Secondary Education Act), and Eisenhower Math and Science (PL 89-10, Title II-A). [C16, C17, C18, C20] Nonspecified Federal Aid Distributed by the State. Federal revenue amounts which pertain to more than one of the above categories but which reporting units could not break out into these categories. These revenues are included in “Nonspecified” instead of “Other.” [C36]
FISCAL YEAR. The 12-month period to which the annual operating budget applies. At the end of the fiscal year, the agency determines its financial condition and the results of its operations. GENERAL EXPENDITURE. All school system expenditure except employee retirement or other insurance trust expenditure. GENERAL REVENUE. All school system revenue except employee retirement or other insurance trust revenue. INDEPENDENT LEA. A local education agency that has both fiscal and administrative independence. See the CENSUSID section of the User’s Guide. INSTRUCTION EXPENDITURE. Includes payments from all funds for salaries, employee benefits, supplies, materials, and contractual services for elementary-secondary instruction. It excludes capital outlay, debt service, and interfund transfers for elementary-secondary instruction. Instruction covers regular, special, and vocational programs offered in both the regular school year and summer school. It excludes instructional support activities as well as adult education and community services. Instruction salaries (Z33) includes salaries for teachers and teacher aides and assistants. [TCURINST, E13] INSTRUCTIONAL EQUIPMENT (Only). Includes expenditure for all equipment recorded by school systems in general or operating funds under the “instruction” function. [K09] INTEREST EARNINGS. Interest earned on deposits and securities including amounts for accrued interest on investment securities sold. Receipts for accrued interest on bonds issued are classified as offsets to interest expenditure. Interest earnings shown under general revenue do not include earnings on assets of employee retirement systems. [U22] INTEREST EXPENDITURE. Amounts paid for use of borrowed money. [I86] LAND and EXISTING STRUCTURES. Expenditures for the purchase of land, improvements to land, and existing buildings including purchase of rights-of-way, payments on capital leases, title search, and similar activity associated with real property purchase transactions. [G15] LEA. Local Education Agency, often called school districts, an education agency at the local level whose primary responsibility is to operate public schools or to contract for public school services. LOCAL REVENUE. Revenue raised within the boundaries of the LEA. These revenues are primarily raised through property taxes, but also come from other types of taxes and fees. [TLOCREV is the sum of: A07, A08, A09, A11, A13, A15, A20, C24, D11, D23, T02, T06, T09, T15, T40, T99, U22, and U97].

Appendix B—Glossary Common Core of Data, School District Finance Survey, SY 1996–97, FY 1997
B-4
Fees. Fees and payments for services provided to students, including: School Lunch [A09], Student Activities [A13], Textbook Sales and Rentals [A11], Transportation Fees [A08], Tuition Fees [A07], Nonspecifed Fees [A15], and Other Sales and Service Revenue [A20]. Cities and Counties. Revenues from separate county and city governments and transferred to the LEA. Assessments received by regional LEAs from independent school districts are included here. [D23] Interest Earnings. Interest earnings from all funds held by the LEA. [U22] Other School Systems. Payments received from other school systems, both within and outside the state, for tuition, transportation and other services. This item should be excluded from state and national totals. [D11] NCES Local, Census State Revenue. Revenues that are classified by NCES as local revenues, and by the Census Bureau as state revenues. This category includes specific property tax revenue in Arkansas, Illinois, Missouri, and Wisconsin; and revenue from a local school support tax and motor vehicle privilege tax in Nevada. [C24] Parent Government Contributions. Tax receipts and any other amounts appropriated for the LEA by the parent government from within the boundary of the LEA. This includes local property taxes collected by the state government from within the LEA's boundary. These are revenues to dependent LEAs. [T02] Property Taxes. Taxes conditioned on ownership of property and measured by its value. This includes general property taxes relating to property as a whole, real and personal, tangible and intangible, whether taxed at a single rate or at classified rates. Property Taxes reported here are from independent agencies. [T06] Property taxes collected by a parent government from dependent LEAs are reported as Parent Government Contributions.
Taxes (Other than Property Taxes). Revenues raised by school districts that set their own tax rates (Independent LEAs). These include: General Sales Taxes [T09], Individual and Corporate Taxes [T40], Other Taxes [T99], Property Taxes [T06], and Public Utility Taxes [T15].
LONG-TERM DEBT. Debt payable more than 1 year after the date of issue. LONG-TERM DEBT ISSUED. The par value of long-term debt obligations incurred during the fiscal period concerned, including funding and refunding obligations. Debt obligations authorized but not actually incurred during the fiscal period are not included. [_21F] LONG-TERM DEBT RETIRED. The par value of long-term debt obligations liquidated by repayment or exchange, including debt retired by refunding operations. [_31F] NCES. National Center for Education Statistics, an organization within the U.S. Department of Education. NCES is the primary federal entity for collecting, analyzing and reporting data related to education. NON ELEMENTARY-SECONDARY EXPENDITURE. Expenditure for non elementary–secondary education programs. Included in this category are community services, adult education, and other non elementary-secondary programs. [TNONELSE is the sum of: V70, V75, and V80] OTHER ELEMENTARY-SECONDARY CURRENT EXPENDITURE. Current expenditure for other than instruction and support service activities. Included in this category are food services, enterprise operations, and other elementary-secondary current expenditures. [TCUROTH is the sum of: E11, V60, and V65] PAYMENTS TO OTHER GOVERNMENTS. Payments to state and local governments (except LEAs), including debt service payments to agencies that incur debt instead of the LEA. [L12, M12]

Appendix B—Glossary Common Core of Data, School District Finance Survey, SY 1996–97, FY 1997
B-5
PAYMENTS TO OTHER SCHOOL SYSTEMS. Payments made to other school systems within the state and outside of the state, for tuition, transportation and other services. This item should be excluded from state and national totals. [Q11] PAYMENTS TO PRIVATE SCHOOLS. Expenditures to private schools (for tuition and other purposes) that are also included in instruction expenditures (TCURINST) and related totals TCURELSC and TOTALEXP. See 'Special Items' in the User's Guide. [V91] PAYMENTS TO PUBLIC CHARTER SCHOOLS. This item includes charter school expenditures that are included in the reported amount for instruction when the charter school students are not included in the student count. [V92] PROPERTY TAXES. See ‘Local Revenues- Property Taxes.’ PUBLIC SCHOOL SYSTEMS. Includes independent school district governments and dependent school systems. Independent school district governments are organized local entities providing public elementary, secondary, special, and vocational/technical education. Dependent school systems are classified by the Census Bureau as sub-units of some other governmental unit such as a county, municipality, township, or the state. REVENUE. All amounts of money received by a school system from external sources, or net of refunds and other correcting transactions other than from issuance of debt, liquidation of investments, or as agency and private trust transactions. Revenue on the F-33 excludes non-cash transactions such as receipt of services, commodities, or other “receipts in-kind.” SEA. State Education Agency, the agency of the state charged with primary responsibility for coordinating and supervising public instruction. SALARIES and WAGES. Amounts paid for compensation of school system officers and employees. Consists of gross compensation before deductions from withheld taxes, retirement contributions, or other purposes. [Z32] SCHOOL LUNCH CHARGES. Gross collections from cafeteria sales to children and adults. [A09] SHORT-TERM DEBT. Interest–bearing debt payable within 1 year from the date of issue, such as bond anticipation notes, bank loans, and tax anticipation notes and warrants. Includes obligations having no fixed maturity date if payable from a tax levied for collection in the year of their issuance. [_61V, _66V] STATE REVENUE. State revenue paid to the school system for any purpose, restricted or unrestricted, including the following: [TSTREV is the sum of: C01, C04, C05, C06, C07, C08, C09, C10, C11 C12, C13, C35, C38, and C39]
Capital Outlay/Debt Service. Revenue paid for school construction and building aid including amounts to help the school systems pay for servicing debt. [C11] Compensatory Programs. Revenues for “at risk” or other economically disadvantaged students including migratory children. Also includes monies from state programs directed toward the attainment of basic skills and categorical education excellence and quality education programs which provide more than staff enhancements, such as materials, resource centers, and equipment. [C06] Special Education Programs. Revenues for the education of physically and mentally disabled students. [C05] Payments on Behalf of LEA. State payments that benefit school systems but are not paid directly to school systems. Includes amounts transferred into state teacher or public employee retirement funds as well as into funds for other kinds of employee benefits, such as group health, life, and unemployment
Appendix B—Glossary Common Core of Data, School District Finance Survey, SY 1996–97, FY 1997
B-6
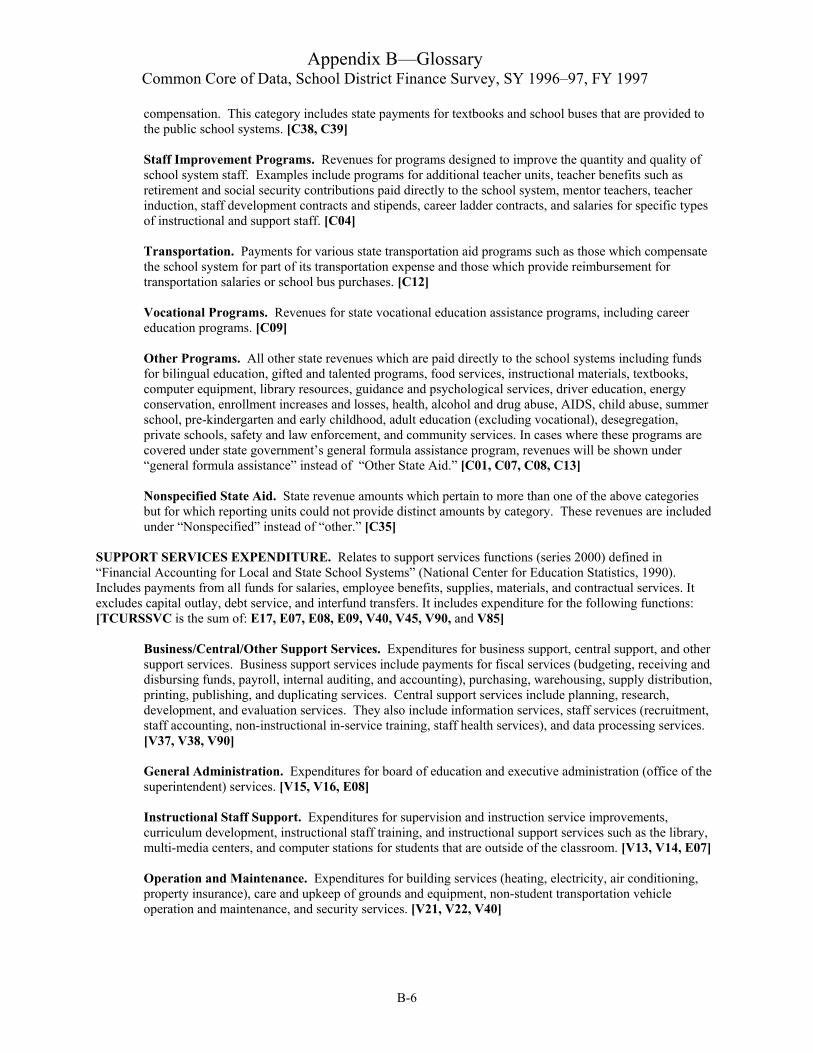
compensation. This category includes state payments for textbooks and school buses that are provided to the public school systems. [C38, C39]
Staff Improvement Programs. Revenues for programs designed to improve the quantity and quality of school system staff. Examples include programs for additional teacher units, teacher benefits such as retirement and social security contributions paid directly to the school system, mentor teachers, teacher induction, staff development contracts and stipends, career ladder contracts, and salaries for specific types of instructional and support staff. [C04] Transportation. Payments for various state transportation aid programs such as those which compensate the school system for part of its transportation expense and those which provide reimbursement for transportation salaries or school bus purchases. [C12] Vocational Programs. Revenues for state vocational education assistance programs, including career education programs. [C09] Other Programs. All other state revenues which are paid directly to the school systems including funds for bilingual education, gifted and talented programs, food services, instructional materials, textbooks, computer equipment, library resources, guidance and psychological services, driver education, energy conservation, enrollment increases and losses, health, alcohol and drug abuse, AIDS, child abuse, summer school, pre-kindergarten and early childhood, adult education (excluding vocational), desegregation, private schools, safety and law enforcement, and community services. In cases where these programs are covered under state government’s general formula assistance program, revenues will be shown under “general formula assistance” instead of “Other State Aid.” [C01, C07, C08, C13] Nonspecified State Aid. State revenue amounts which pertain to more than one of the above categories but for which reporting units could not provide distinct amounts by category. These revenues are included under “Nonspecified” instead of “other.” [C35]
SUPPORT SERVICES EXPENDITURE. Relates to support services functions (series 2000) defined in “Financial Accounting for Local and State School Systems” (National Center for Education Statistics, 1990). Includes payments from all funds for salaries, employee benefits, supplies, materials, and contractual services. It excludes capital outlay, debt service, and interfund transfers. It includes expenditure for the following functions: [TCURSSVC is the sum of: E17, E07, E08, E09, V40, V45, V90, and V85]
Business/Central/Other Support Services. Expenditures for business support, central support, and other support services. Business support services include payments for fiscal services (budgeting, receiving and disbursing funds, payroll, internal auditing, and accounting), purchasing, warehousing, supply distribution, printing, publishing, and duplicating services. Central support services include planning, research, development, and evaluation services. They also include information services, staff services (recruitment, staff accounting, non-instructional in-service training, staff health services), and data processing services. [V37, V38, V90]
General Administration. Expenditures for board of education and executive administration (office of the superintendent) services. [V15, V16, E08]
Instructional Staff Support. Expenditures for supervision and instruction service improvements, curriculum development, instructional staff training, and instructional support services such as the library, multi-media centers, and computer stations for students that are outside of the classroom. [V13, V14, E07]
Operation and Maintenance. Expenditures for building services (heating, electricity, air conditioning, property insurance), care and upkeep of grounds and equipment, non-student transportation vehicle operation and maintenance, and security services. [V21, V22, V40]
Appendix B—Glossary Common Core of Data, School District Finance Survey, SY 1996–97, FY 1997
B-7
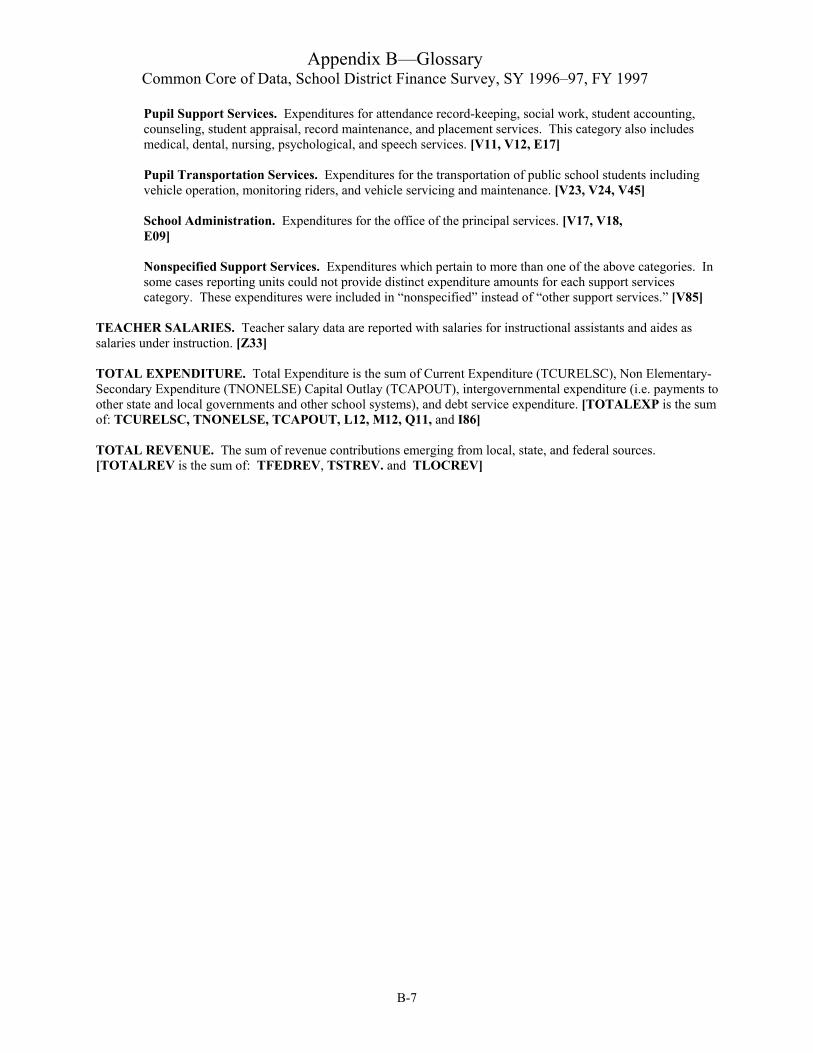
Pupil Support Services. Expenditures for attendance record-keeping, social work, student accounting, counseling, student appraisal, record maintenance, and placement services. This category also includes medical, dental, nursing, psychological, and speech services. [V11, V12, E17]
Pupil Transportation Services. Expenditures for the transportation of public school students including vehicle operation, monitoring riders, and vehicle servicing and maintenance. [V23, V24, V45]
School Administration. Expenditures for the office of the principal services. [V17, V18,
E09] Nonspecified Support Services. Expenditures which pertain to more than one of the above categories. In some cases reporting units could not provide distinct expenditure amounts for each support services category. These expenditures were included in “nonspecified” instead of “other support services.” [V85]
TEACHER SALARIES. Teacher salary data are reported with salaries for instructional assistants and aides as salaries under instruction. [Z33] TOTAL EXPENDITURE. Total Expenditure is the sum of Current Expenditure (TCURELSC), Non Elementary-Secondary Expenditure (TNONELSE) Capital Outlay (TCAPOUT), intergovernmental expenditure (i.e. payments to other state and local governments and other school systems), and debt service expenditure. [TOTALEXP is the sum of: TCURELSC, TNONELSE, TCAPOUT, L12, M12, Q11, and I86]
TOTAL REVENUE. The sum of revenue contributions emerging from local, state, and federal sources. [TOTALREV is the sum of: TFEDREV, TSTREV. and TLOCREV]

Appendix B—Glossary Common Core of Data, School District Finance Survey, SY 1996–97, FY 1997
B-8

Appendix C—State Notes Common Core of Data, School District Finance Survey, SY 1996–97, FY 1997
C-1
The following notes can be used to track anomalies in state data reported to the collection agent. Each anomaly recorded here applies to the current fiscal year. The absence of "Notes" for a state indicates that the state’s data did not contain any anomalies. Alabama
State Abbreviation: AL
Alaska State Abbreviation: AK Notes: -Payments to other school systems are not separately identified in expenditure data. These data may slightly inflate current expenditure amounts for individual school districts.
Arizona
State Abbreviation: AZ Notes: -Instructional equipment is combined with all equipment outlays. -State expenditure made on behalf of the public school systems is reported in the data.
Arkansas
State Abbreviation: AR Notes: -State expenditure made on behalf of the public school systems is reported in the data.
California
State Abbreviation: CA Notes: -State expenditure made on behalf of the public school systems is reported in the data. -Expenditures for support services are not broken out. -For six districts in CA, the state reports a single unified district on the F-33, but separate elementary and secondary districts on the CCD Agency Universe. California treats the two Elementary and High School districts as one district in its financial accounting, but as separate districts in managing its student and staff data. An NCESID code is assigned to the combined district so that it may be matched with related items on the CCD file. The table below lists the combined data by district, NCESID and enrollment.
C-1. California School Districts Combined Financial Data for the F-33 Survey: 1996–97
School District NCESID Enrollment Year
Alhambra (combined district) 0601910 19,918 1997 Alhambra City Elementary 0601910 11,592 1997 Alhambra City High 0601930 8,326 1997
Eureka (combined district) 0613060 6,173 1997 Eureka City Elementary 0613040 2,937 1997 Eureka City High 0613060 3,236 1997
Modesto (combined district) 0625130 31,005 1997 Modesto City Elementary 0625130 18,157 1997 Modesto City High 0625150 12,848 1997
Petaluma (combined district) 0630230 7,381 1997 Petaluma City Elementary 0630230 2,549 1997 Petaluma City High 0630250 4,832 1997

Appendix C—State Notes Common Core of Data, School District Finance Survey, SY 1996–97, FY 1997
C-2
C-1. California School Districts Combined Financial Data for the F-33 Survey: 1996–97—Continued
School District NCESID Enrollment Year
Santa Cruz (combined district) 0635590 9,017 1997 Santa Cruz City Elementary 0635590 3,335 1997 Santa Cruz City High 0635600 5,682 1997
Santa Rosa (combined district) 0635810 16,751 1997 Santa Rosa Elementary 0635810 5,157 1997 Santa Rosa High 0635830 11,594 1997
SOURCE: Data reported by states to the U.S. Department of Education, National Center for Education Statistics, Common Core of Data (CCD), School District Finance Survey (Form F-33) FY 1997, (sdf97d1a).
- Student membership for Alhambra, Eureka and Modesto were edited to agree with data from the CCD Agency Nonfiscal file.
Colorado
State Abbreviation: CO Connecticut
State Abbreviation: CT Notes: -State expenditure made on behalf of the public school systems is reported in the data.
Delaware
State Abbreviation: DE Notes: -State expenditure made on behalf of the public school systems is reported in the data. -Capital outlay payments for land and existing structures are reported under construction.
District of Columbia
State Abbreviation: DC Notes:
-Instructional Equipment is combined with all equipment outlays. Florida
State Abbreviation: FL Notes: -Payments to other school systems are not separately identified in expenditure data. These data may slightly inflate current expenditure amounts for individual school districts.
Georgia
State Abbreviation: GA Notes: -State expenditure made on behalf of the public school systems is reported in the data.
Hawaii
State Abbreviation: HI Idaho
State Abbreviation: ID Notes: -Capital outlay payments for land and existing structures are reported under construction. -Payments to other school systems are not separately identified in expenditure data. These data may slightly inflate current expenditure amounts for individual school districts.

Appendix C—State Notes Common Core of Data, School District Finance Survey, SY 1996–97, FY 1997
C-3
Illinois
State Abbreviation: IL Notes: -Capital outlay payments for land and existing structures are reported under construction. -State expenditure made on behalf of the public school systems is reported in the data. -Corporate personal property replacement tax revenues are included in local revenue.
Indiana
State Abbreviation: IN Notes: -State expenditure made on behalf of the public school systems is reported in the data.
Iowa
State Abbreviation: IA Kansas
State Abbreviation: KS Notes: -State expenditure made on behalf of the public school systems is reported in the data.
Kentucky
State Abbreviation: KY Notes: -Fixed charges are estimated based on salaries and wages. -State expenditure made on behalf of the public school systems is reported in the data.
Louisiana
State Abbreviation: LA Maine
State Abbreviation: ME Notes: -State expenditure made on behalf of the public school systems is reported in the data.
Maryland State Abbreviation: MD Notes: -State expenditure made on behalf of the public school systems is reported in the data.
Massachusetts
State Abbreviation: MA Notes: -Fixed charges are estimated based on salaries and wages.
-State expenditure made on behalf of the public school systems is reported in the data. -Capital outlay payments for land and existing structures are reported under construction.
Michigan
State Abbreviation: MI Minnesota
State Abbreviation: MN

Appendix C—State Notes Common Core of Data, School District Finance Survey, SY 1996–97, FY 1997
C-4
Mississippi State Abbreviation: MS Notes: -Capital outlay payments for land and existing structures are reported under construction -Payments to other school systems are not separately identified in expenditure data. These data may slightly inflate current expenditure amounts for individual school districts.
Missouri
State Abbreviation: MO Montana
State Abbreviation: MT Nebraska
State Abbreviation: NE Nevada
State Abbreviation: NV Notes: -Local school support and sales tax levied by the state are included in the total local revenue data (from sales, motor vehicle, and utility franchise tax).
New Hampshire
State Abbreviation: NH New Jersey
State Abbreviation: NJ Notes: -State expenditure made on behalf of the public school systems is reported in the data.
New Mexico
State Abbreviation: NM Notes: -Fixed charges are estimated based on salaries and wages. -State expenditure made on behalf of the public school systems is reported in the data. -Payments to other school systems are not separately identified in expenditure data. These data may slightly inflate current expenditure amounts for individual school districts.
New York
State Abbreviation: NY Notes:
-Fixed charges are estimated based on salaries and wages. -The state of NY created 16 ‘special act’ school districts to serve institutionalized children from other districts or public agencies. They have no tax base and are run by private organizations. Prior to FY 1998, the Census Bureau classified these districts as public entities. Beginning with FY 1998, they were reclassified as private institutions and therefore do not appear on any data file release by the Census Bureau after 1997.
-Seven school districts in NY had C36 adjusted from negative values to ‘0.’ North Carolina
State Abbreviation: NC Notes: -State expenditure made on behalf of the public school systems is reported in the data. -Payments to other school systems are not separately identified in expenditure data. These data may slightly inflate current expenditure amounts for individual school districts.
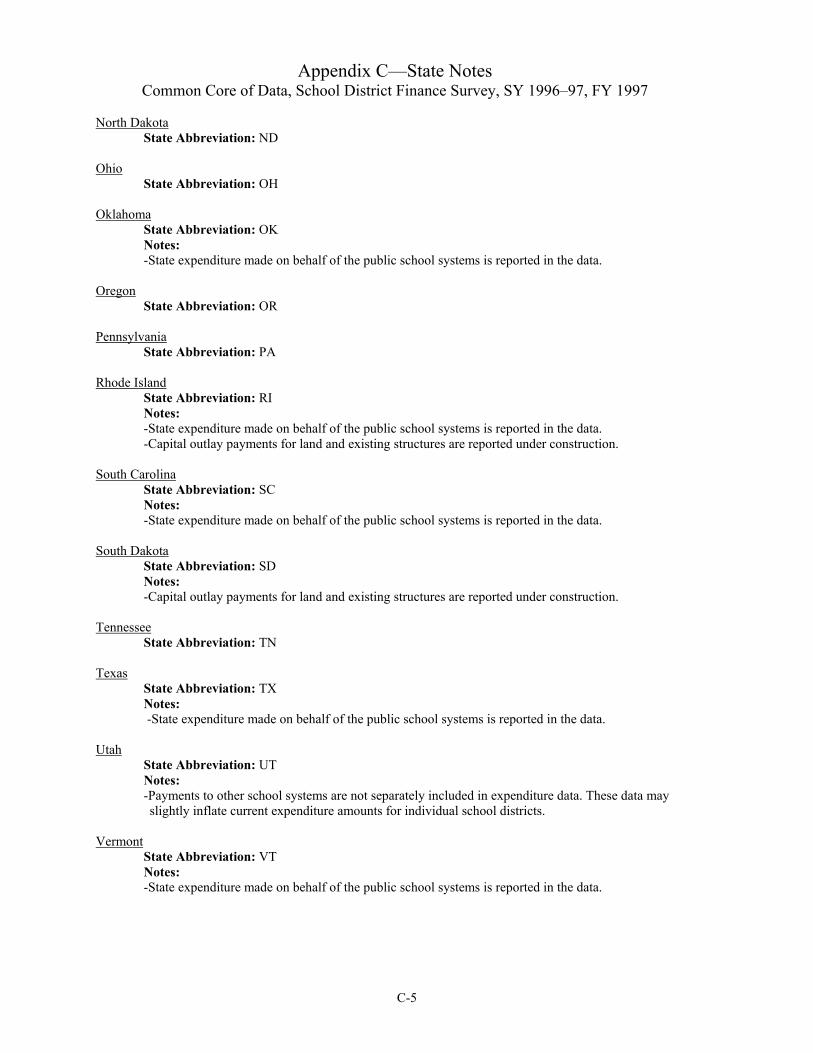
Appendix C—State Notes Common Core of Data, School District Finance Survey, SY 1996–97, FY 1997
C-5
North Dakota State Abbreviation: ND
Ohio
State Abbreviation: OH Oklahoma
State Abbreviation: OK Notes: -State expenditure made on behalf of the public school systems is reported in the data.
Oregon
State Abbreviation: OR Pennsylvania
State Abbreviation: PA Rhode Island
State Abbreviation: RI Notes: -State expenditure made on behalf of the public school systems is reported in the data.
-Capital outlay payments for land and existing structures are reported under construction. South Carolina
State Abbreviation: SC Notes: -State expenditure made on behalf of the public school systems is reported in the data.
South Dakota
State Abbreviation: SD Notes: -Capital outlay payments for land and existing structures are reported under construction. Tennessee
State Abbreviation: TN Texas
State Abbreviation: TX Notes: -State expenditure made on behalf of the public school systems is reported in the data.
Utah
State Abbreviation: UT Notes: -Payments to other school systems are not separately included in expenditure data. These data may slightly inflate current expenditure amounts for individual school districts.
Vermont
State Abbreviation: VT Notes: -State expenditure made on behalf of the public school systems is reported in the data.
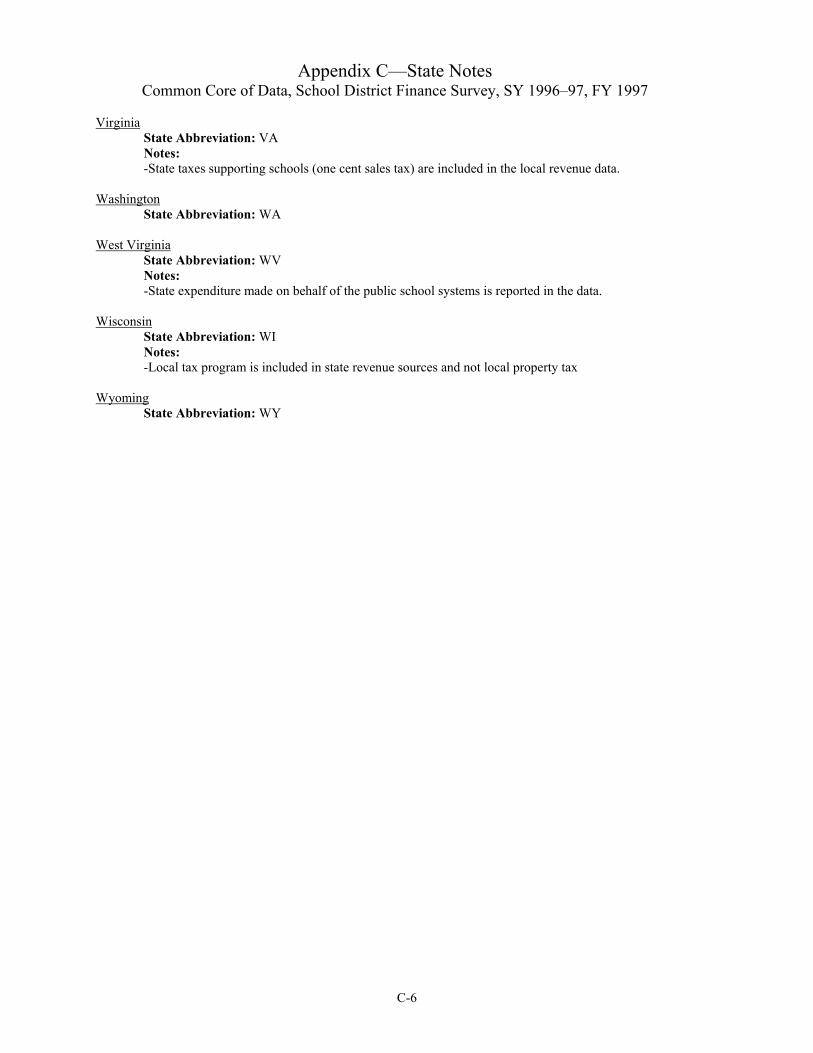
Appendix C—State Notes Common Core of Data, School District Finance Survey, SY 1996–97, FY 1997
C-6
Virginia State Abbreviation: VA
Notes: -State taxes supporting schools (one cent sales tax) are included in the local revenue data.
Washington
State Abbreviation: WA West Virginia
State Abbreviation: WV Notes: -State expenditure made on behalf of the public school systems is reported in the data.
Wisconsin
State Abbreviation: WI Notes: -Local tax program is included in state revenue sources and not local property tax Wyoming
State Abbreviation: WY

Table D-1. Frequencies of categorical variables: 1996–97
SCHLEV Frequency PercentCumulative Frequency
Cumulative Percent
01 Elementary School System Only 3,223 20.6 3,223 20.602 Secondary School system Only 538 3.4 3,761 24.003 Elementary-Secondary School System 10,588 67.5 14,349 91.505 Vocational or Special Education School System 259 1.7 14,608 93.206 Nonoperating School System 285 1.8 14,893 95.007 Educational Service Agency 786 5.0 15,679 100.0
YEAR Frequency PercentCumulative Frequency
Cumulative Percent
1997 15,679 100.0 15,679 100.0
CCDNF Frequency PercentCumulative Frequency
Cumulative Percent
0 Record does not match CCD LEA Universe Survey 270 1.7 270 1.71 Record matches CCD LEA Universe Survey 15,409 98.3 15,679 100.0
See notes at end of table.
CCD Agency Nonfiscal File Match
Common Core of Data, School District Finance Survey, SY 1996–97, FY 1997 Appendix D—Value Distribution and Field Frequencies
School Level Code
Survey Year
D-1
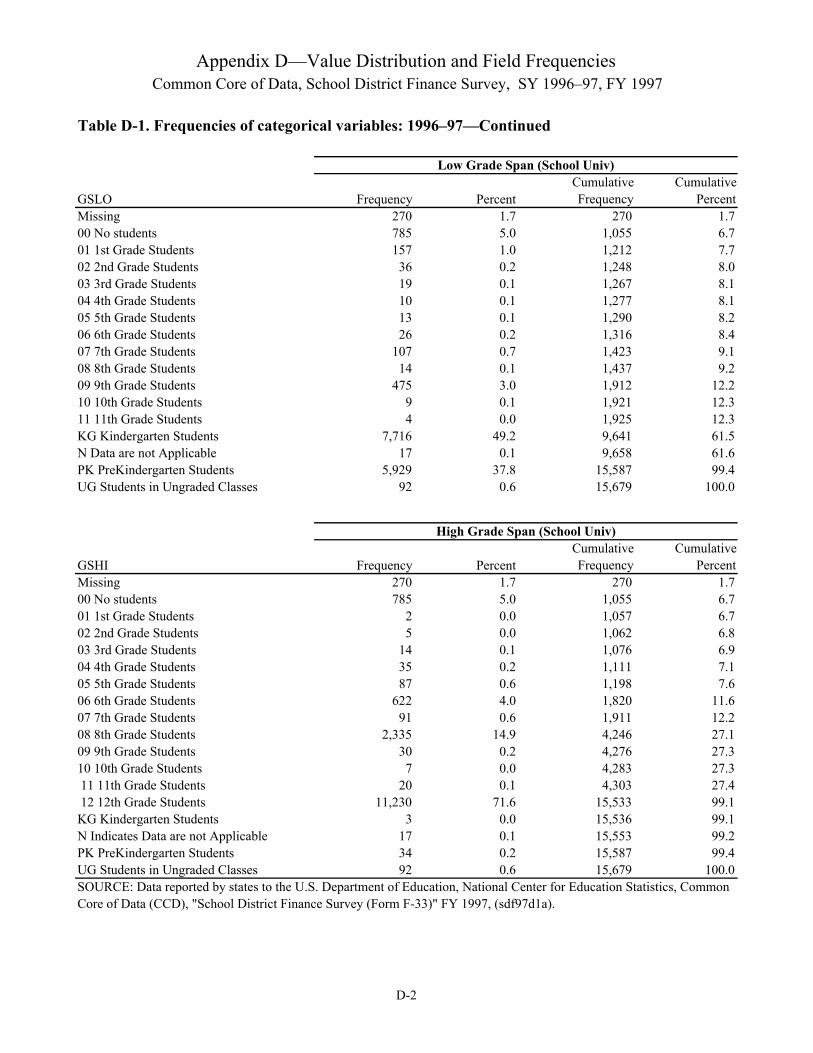
Table D-1. Frequencies of categorical variables: 1996–97—Continued
GSLO Frequency PercentCumulative Frequency
Cumulative Percent
Missing 270 1.7 270 1.700 No students 785 5.0 1,055 6.701 1st Grade Students 157 1.0 1,212 7.702 2nd Grade Students 36 0.2 1,248 8.003 3rd Grade Students 19 0.1 1,267 8.104 4th Grade Students 10 0.1 1,277 8.105 5th Grade Students 13 0.1 1,290 8.206 6th Grade Students 26 0.2 1,316 8.407 7th Grade Students 107 0.7 1,423 9.108 8th Grade Students 14 0.1 1,437 9.209 9th Grade Students 475 3.0 1,912 12.210 10th Grade Students 9 0.1 1,921 12.311 11th Grade Students 4 0.0 1,925 12.3KG Kindergarten Students 7,716 49.2 9,641 61.5N Data are not Applicable 17 0.1 9,658 61.6PK PreKindergarten Students 5,929 37.8 15,587 99.4UG Students in Ungraded Classes 92 0.6 15,679 100.0
GSHI Frequency PercentCumulative Frequency
Cumulative Percent
Missing 270 1.7 270 1.700 No students 785 5.0 1,055 6.701 1st Grade Students 2 0.0 1,057 6.702 2nd Grade Students 5 0.0 1,062 6.803 3rd Grade Students 14 0.1 1,076 6.904 4th Grade Students 35 0.2 1,111 7.105 5th Grade Students 87 0.6 1,198 7.606 6th Grade Students 622 4.0 1,820 11.607 7th Grade Students 91 0.6 1,911 12.208 8th Grade Students 2,335 14.9 4,246 27.109 9th Grade Students 30 0.2 4,276 27.310 10th Grade Students 7 0.0 4,283 27.3 11 11th Grade Students 20 0.1 4,303 27.4 12 12th Grade Students 11,230 71.6 15,533 99.1KG Kindergarten Students 3 0.0 15,536 99.1N Indicates Data are not Applicable 17 0.1 15,553 99.2PK PreKindergarten Students 34 0.2 15,587 99.4UG Students in Ungraded Classes 92 0.6 15,679 100.0SOURCE: Data reported by states to the U.S. Department of Education, National Center for Education Statistics, CommonCore of Data (CCD), "School District Finance Survey (Form F-33)" FY 1997, (sdf97d1a).
Low Grade Span (School Univ)
High Grade Span (School Univ)
Appendix D—Value Distribution and Field FrequenciesCommon Core of Data, School District Finance Survey, SY 1996–97, FY 1997
D-2

Table D-2. Count of districts with zero and non-zero values for revenues, by type of revenue and state: 1996–97
State Non-zero Zero Non-zero Zero Non-Zero Zero Non-Zero Zero
Total 15,608 71 14,770 909 15,447 232 15,580 99
Alabama 127 0 127 0 127 0 127 0Alaska 53 0 53 0 53 0 53 0Arizona 228 0 218 10 226 2 228 0Arkansas 325 1 325 1 325 1 325 1California 1,084 0 1,071 13 1,077 7 1,084 0Colorado 194 1 192 3 194 1 194 1Connecticut 174 0 173 1 173 1 172 2Delaware 19 0 19 0 19 0 19 0District of Columbia 1 0 1 0 0 1 1 0Florida 67 0 67 0 67 0 67 0Georgia 196 0 196 0 196 0 196 0Hawaii 1 0 1 0 1 0 1 0Idaho 112 0 109 3 112 0 111 1Illinois 1,096 0 1,004 92 1,058 38 1,089 7Indiana 315 0 312 3 315 0 315 0Iowa 394 0 394 0 394 0 394 0Kansas 304 0 304 0 304 0 304 0Kentucky 176 0 176 0 176 0 176 0Louisiana 66 0 66 0 66 0 66 0Maine 291 1 234 58 290 2 291 1Maryland 24 0 24 0 24 0 24 0Massachusetts 374 62 325 111 335 101 374 62Michigan 691 0 634 57 689 2 684 7Minnesota 425 0 403 22 395 30 425 0Mississippi 153 0 153 0 153 0 153 0Missouri 525 0 525 0 525 0 525 0Montana 489 1 384 106 489 1 489 1Nebraska 674 0 451 223 671 3 673 1Nevada 17 0 17 0 17 0 17 0New Hampshire 177 0 159 18 173 4 177 0New Jersey 615 0 596 19 614 1 615 0New Mexico 89 0 89 0 89 0 89 0New York 707 0 697 10 706 1 707 0North Carolina 117 0 117 0 117 0 117 0North Dakota 263 0 253 10 260 3 263 0Ohio 736 0 725 11 736 0 736 0Oklahoma 586 0 584 2 582 4 586 0Oregon 243 0 214 29 242 1 243 0Pennsylvania 604 0 594 10 600 4 604 0Rhode Island 36 0 36 0 36 0 36 0South Carolina 106 0 104 2 106 0 106 0South Dakota 177 0 173 4 177 0 177 0Tennessee 139 0 139 0 139 0 139 0Texas 1,058 4 1,047 15 1,050 12 1,048 14Utah 40 0 40 0 40 0 40 0Vermont 328 0 275 53 326 2 328 0Virginia 153 1 136 18 144 10 153 1Washington 305 0 301 4 305 0 305 0West Virginia 55 0 55 0 55 0 55 0Wisconsin 430 0 429 1 430 0 430 0Wyoming 49 0 49 0 49 0 49 0SOURCE: Data reported by states to the U.S. Department of Education, National Center for Education Statistics, Common Core of Data (CCD),"School District Finance Survey (Form F-33)" FY 1997, (sdf97d1a).
Appendix D—Frequencies of Categorical Variables and Ranges of Selected Data ItemsCommon Core of Data, School District Finance Survey, SY 1996–97, FY 1997
Total Local RevenueTotal Revenue Total Federal Revenue Total State Revenue
D-3

Table D-3. Count of districts with zero and non-zero values for current expenditures, by type of expenditures and state: 1996–97
State Non-zero Zero Non-zero Zero Non-zero Zero Non-zero Zero
Total 15,401 278 15,576 103 13,962 1,717 15,597 82
Alabama 127 0 127 0 127 0 127 0Alaska 53 0 53 0 47 6 53 0Arizona 220 8 228 0 219 9 228 0Arkansas 325 1 325 1 315 11 325 1California 1,083 1 1,083 1 975 109 1,084 0Colorado 192 3 194 1 178 17 194 1Connecticut 166 8 166 8 144 30 166 8Delaware 19 0 19 0 19 0 19 0District of Columbia 1 0 1 0 1 0 1 0Florida 67 0 67 0 67 0 67 0Georgia 193 3 196 0 185 11 196 0Hawaii 1 0 1 0 1 0 1 0Idaho 112 0 112 0 107 5 112 0Illinois 1,054 42 1,086 10 923 173 1,094 2Indiana 312 3 315 0 295 20 315 0Iowa 394 0 394 0 380 14 394 0Kansas 304 0 304 0 304 0 304 0Kentucky 176 0 176 0 176 0 176 0Louisiana 66 0 66 0 66 0 66 0Maine 261 31 291 1 217 75 291 1Maryland 24 0 24 0 24 0 24 0Massachusetts 331 105 369 67 317 119 369 67Michigan 691 0 689 2 560 131 691 0Minnesota 415 10 424 1 355 70 425 0Mississippi 153 0 153 0 153 0 153 0Missouri 525 0 525 0 524 1 525 0Montana 484 6 490 0 335 155 490 0Nebraska 666 8 673 1 408 266 674 0Nevada 17 0 17 0 17 0 17 0New Hampshire 170 7 176 1 149 28 176 1New Jersey 611 4 615 0 578 37 615 0New Mexico 89 0 89 0 89 0 89 0New York 706 1 707 0 675 32 707 0North Carolina 117 0 117 0 117 0 117 0North Dakota 260 3 263 0 227 36 263 0Ohio 733 3 736 0 665 71 736 0Oklahoma 585 1 586 0 573 13 586 0Oregon 238 5 242 1 200 43 243 0Pennsylvania 602 2 604 0 548 56 604 0Rhode Island 36 0 36 0 36 0 36 0South Carolina 106 0 106 0 98 8 106 0South Dakota 176 1 177 0 169 8 177 0Tennessee 139 0 139 0 139 0 139 0Texas 1,054 8 1,061 1 1,036 26 1,062 0Utah 40 0 40 0 40 0 40 0Vermont 317 11 322 6 231 97 328 0Virginia 152 2 153 1 134 20 153 1Washington 305 0 305 0 289 16 305 0West Virginia 55 0 55 0 55 0 55 0Wisconsin 429 1 430 0 426 4 430 0Wyoming 49 0 49 0 49 0 49 0SOURCE: Data reported by states to the U.S. Department of Education, National Center for Education Statistics, Common Core of Data (CCD), "School District Finance Survey (Form F-33)" FY 1997, (sdf97d1a).
Appendix D—Frequencies of Categorical Variables and Ranges of Selected Data ItemsCommon Core of Data, School District Finance Survey, SY 1996–97, FY 1997
Total Current Instruction Expenditures
Total Support Services Expenditures
Total Current Other Expenditures
Total Current Elementary/Secondary
Expenditures
D-4

Table D-4. Count of districts with zero and non-zero values for expenditures or membership, by type of expenditures and state: 1996–97
State Non-zero Zero Non-zero Zero Non-zero Zero Non-zero Zero
Total 15,618 61 8,885 6,794 15,161 518 14,481 1,198
Alabama 127 0 126 1 127 0 127 0Alaska 53 0 52 1 53 0 53 0Arizona 228 0 119 109 221 7 215 13Arkansas 325 1 85 241 325 1 311 15California 1,084 0 405 679 1,081 3 1,048 36Colorado 194 1 87 108 194 1 176 19Connecticut 172 2 151 23 171 3 166 8Delaware 19 0 18 1 19 0 19 0District of Columbia 1 0 0 1 1 0 1 0Florida 67 0 67 0 67 0 67 0Georgia 196 0 90 106 196 0 180 16Hawaii 1 0 1 0 1 0 1 0Idaho 112 0 37 75 111 1 112 0Illinois 1,094 2 497 599 1,059 37 905 191Indiana 315 0 297 18 314 1 292 23Iowa 394 0 187 207 394 0 378 16Kansas 304 0 166 138 304 0 304 0Kentucky 176 0 160 16 176 0 176 0Louisiana 66 0 66 0 66 0 66 0Maine 291 1 149 143 231 61 227 65Maryland 24 0 24 0 24 0 24 0Massachusetts 383 53 154 282 328 108 330 106Michigan 691 0 456 235 671 20 629 62Minnesota 425 0 373 52 408 17 355 70Mississippi 153 0 101 52 153 0 153 0Missouri 525 0 506 19 524 1 523 2Montana 490 0 195 295 480 10 463 27Nebraska 674 0 57 617 559 115 643 31Nevada 17 0 16 1 17 0 17 0New Hampshire 177 0 42 135 165 12 162 15New Jersey 615 0 405 210 596 19 584 31New Mexico 89 0 72 17 89 0 89 0New York 707 0 659 48 705 2 706 1North Carolina 117 0 110 7 117 0 117 0North Dakota 263 0 47 216 248 15 234 29Ohio 736 0 533 203 733 3 611 125Oklahoma 586 0 187 399 577 9 572 14Oregon 243 0 104 139 239 4 219 24Pennsylvania 604 0 539 65 601 3 500 104Rhode Island 36 0 33 3 36 0 36 0South Carolina 106 0 98 8 106 0 91 15South Dakota 177 0 46 131 174 3 173 4Tennessee 139 0 123 16 139 0 138 1Texas 1,062 0 447 615 1,047 15 1,043 19Utah 40 0 12 28 40 0 40 0Vermont 328 0 44 284 287 41 247 81Virginia 153 1 132 22 151 3 132 22Washington 305 0 156 149 303 2 296 9West Virginia 55 0 55 0 55 0 55 0Wisconsin 430 0 369 61 429 1 426 4Wyoming 49 0 30 19 49 0 49 0SOURCE: Data reported by states to the U.S. Department of Education, National Center for Education Statistics, Common Core of Data (CCD), "School District Finance Survey (Form F-33)" FY 1997, (sdf97d1a).
Common Core of Data, School District Finance Survey, SY 1996–97, FY 1997 Appendix D—Frequencies of Categorical Variables and Ranges of Selected Data Items
MembershipTotal Expenditures
Total Non-Elementary/ Secondary
ExpendituresTotal Capital Outlay
Expenditures
D-5

Table D-5. Minimum, maximum and mean of districts' local revenues, by state: 1996–97
State Number of districts Minimum Maximum Mean
Total 15,679 $0 $4,151,985,000 $9,214,115
Alabama 127 932,000 69,397,000 8,714,496Alaska 53 43,000 97,953,000 5,547,604Arizona 228 3,000 159,829,000 8,905,504Arkansas 326 0 85,818,000 2,302,500California 1,084 29,000 1,014,907,000 11,257,784Colorado 195 0 264,251,000 10,994,528Connecticut 174 0 122,649,000 16,726,052Delaware 19 1,221,000 59,333,000 14,018,368District of Columbia 1 638,448,000 638,448,000 638,448,000Florida 67 1,199,000 944,637,000 94,760,030Georgia 196 201,000 297,065,000 16,538,036Hawaii 1 29,587,000 29,587,000 29,587,000Idaho 112 0 77,497,000 3,323,054Illinois 1,096 0 1,486,556,000 8,217,708Indiana 315 79,000 147,092,000 12,052,787Iowa 394 343,000 92,562,000 4,078,487Kansas 304 244,000 126,203,000 3,930,197Kentucky 176 220,000 266,303,000 6,359,773Louisiana 66 819,000 160,474,000 23,336,121Maine 292 0 43,371,000 2,716,079Maryland 24 8,057,000 856,137,000 141,862,292Massachusetts 436 0 397,866,000 8,960,321Michigan 691 0 187,184,000 6,113,831Minnesota 425 1,000 210,473,000 6,428,019Mississippi 153 236,000 78,183,000 4,679,608Missouri 525 146,000 168,129,000 5,781,400Montana 490 0 24,279,000 885,884Nebraska 674 0 169,484,000 1,850,850Nevada 17 716,000 716,243,000 64,204,941New Hampshire 177 16,000 75,835,000 6,781,339New Jersey 615 10,000 103,530,000 12,494,193New Mexico 89 47,000 77,705,000 2,805,775New York 707 143,000 4,151,985,000 21,004,942North Carolina 117 1,157,000 221,738,000 17,937,410North Dakota 263 3,000 43,234,000 1,283,856Ohio 736 1,000 266,750,000 9,208,749Oklahoma 586 16,000 90,790,000 1,981,247Oregon 243 14,000 198,845,000 6,005,889Pennsylvania 604 77,000 649,732,000 14,415,699Rhode Island 36 308,000 70,576,000 18,095,667South Carolina 106 562,000 133,568,000 14,561,066South Dakota 177 48,000 76,259,000 2,325,085Tennessee 139 359,000 280,760,000 13,790,568Texas 1,062 0 684,202,000 10,850,982Utah 40 395,000 94,513,000 16,985,725Vermont 328 24,000 25,347,000 2,293,774Virginia 154 0 1,008,889,000 30,216,792Washington 305 6,000 151,391,000 6,019,895West Virginia 55 1,149,000 81,125,000 10,863,891Wisconsin 430 212,000 218,848,000 6,729,679Wyoming 49 168,000 47,360,000 6,047,796SOURCE: Data reported by states to the U.S. Department of Education, National Center for Education Statistics, Common Core of Data (CCD), "School District Finance Survey (Form F-33)" FY 1997, (sdf97d1a).
Common Core of Data, School District Finance Survey, SY 1996–97, FY 1997Appendix D—Frequencies of Categorical Variables and Ranges of Selected Data Items
D-6

Appendix D—Frequencies of Categorical Variables and Ranges of Selected Data Items
Table D-6. Minimum, maximum and mean of districts' state revenues, by state: 1996–97
State Number of districts Minimum Maximum Mean
Total 15,679 $0 $3,693,134,000 $9,419,007
Alabama 127 2,913,000 210,705,000 19,675,961Alaska 53 610,000 199,314,000 13,063,472Arizona 228 0 187,524,000 8,366,298Arkansas 326 0 67,189,000 4,254,929California 1,084 0 2,946,433,000 18,967,463Colorado 195 0 230,027,000 9,150,277Connecticut 174 0 177,753,000 9,883,351Delaware 19 3,939,000 110,968,000 30,308,158District of Columbia 1 0 0 0Florida 67 3,365,000 1,225,161,000 104,814,343Georgia 196 599,000 297,323,000 22,815,209Hawaii 1 1,088,410,000 1,088,410,000 1,088,410,000Idaho 112 33,000 66,801,000 6,671,875Illinois 1,096 0 934,816,000 3,717,773Indiana 315 17,000 218,417,000 12,010,756Iowa 394 257,000 113,874,000 4,178,929Kansas 304 147,000 152,596,000 5,533,888Kentucky 176 717,000 279,922,000 13,532,182Louisiana 66 4,617,000 207,847,000 31,634,894Maine 292 0 20,618,000 2,292,764Maryland 24 7,875,000 441,143,000 97,663,667Massachusetts 436 0 216,646,000 7,662,945Michigan 691 0 1,059,768,000 12,631,462Minnesota 425 0 217,729,000 7,816,139Mississippi 153 738,000 72,447,000 8,190,876Missouri 525 68,000 183,390,000 4,149,423Montana 490 0 25,051,000 949,680Nebraska 674 0 97,141,000 935,853Nevada 17 68,000 300,300,000 31,863,235New Hampshire 177 0 4,284,000 534,181New Jersey 615 0 441,547,000 7,804,392New Mexico 89 765,000 371,000,000 14,462,506New York 707 0 3,693,134,000 14,820,211North Carolina 117 4,571,000 305,119,000 36,393,308North Dakota 263 0 22,568,000 1,027,989Ohio 736 5,000 283,530,000 6,962,094Oklahoma 586 0 117,857,000 3,369,491Oregon 243 0 178,273,000 7,515,757Pennsylvania 604 0 775,718,000 9,430,225Rhode Island 36 165,000 107,988,000 13,079,889South Carolina 106 26,000 169,211,000 19,125,774South Dakota 177 9,000 27,196,000 1,499,175Tennessee 139 807,000 247,624,000 15,214,381Texas 1,062 0 375,808,000 9,302,118Utah 40 1,424,000 202,631,000 34,195,150Vermont 328 0 6,722,000 709,015Virginia 154 0 175,621,000 15,161,929Washington 305 96,000 208,109,000 14,568,639West Virginia 55 4,925,000 109,304,000 23,386,309Wisconsin 430 16,000 519,549,000 8,238,149Wyoming 49 163,000 51,750,000 6,542,163SOURCE: Data reported by states to the U.S. Department of Education, National Center for Education Statistics, Common Core of Data (CCD), "School District Finance Survey (Form F-33)" FY 1997, (sdf97d1a).
Common Core of Data, School District Finance Survey, SY 1996–97, FY 1997
D-7
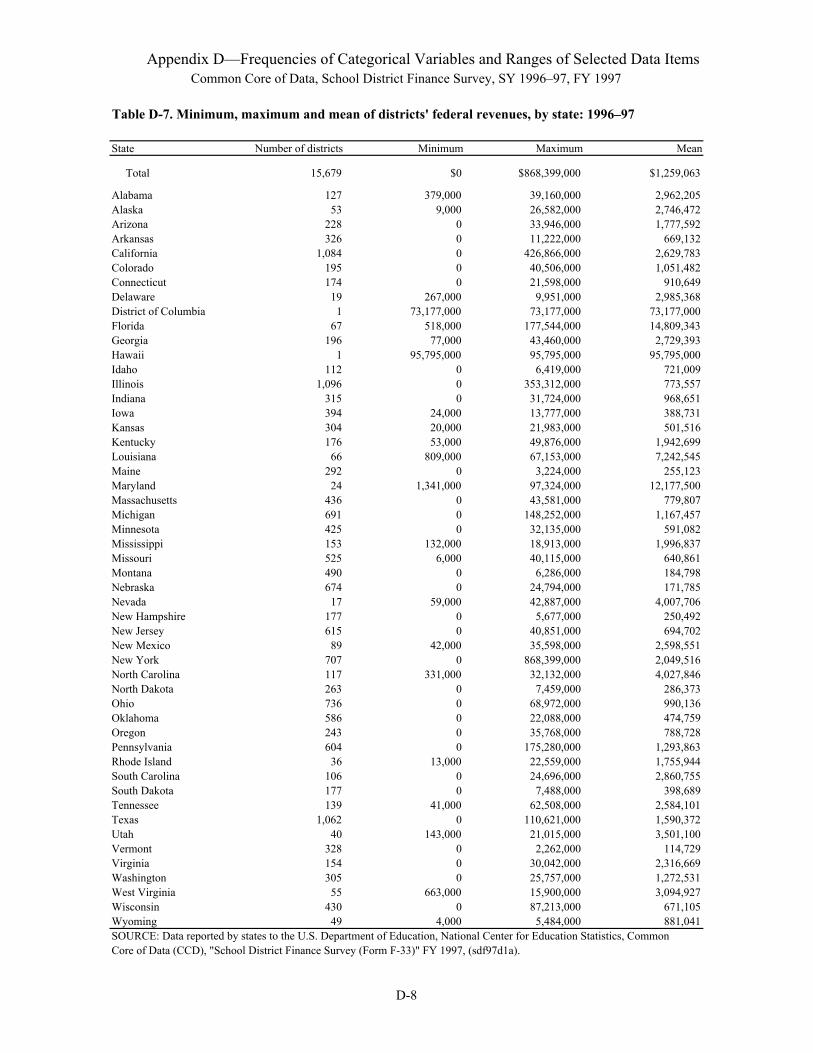
Appendix D—Frequencies of Categorical Variables and Ranges of Selected Data Items
Table D-7. Minimum, maximum and mean of districts' federal revenues, by state: 1996–97
State Number of districts Minimum Maximum Mean
Total 15,679 $0 $868,399,000 $1,259,063
Alabama 127 379,000 39,160,000 2,962,205Alaska 53 9,000 26,582,000 2,746,472Arizona 228 0 33,946,000 1,777,592Arkansas 326 0 11,222,000 669,132California 1,084 0 426,866,000 2,629,783Colorado 195 0 40,506,000 1,051,482Connecticut 174 0 21,598,000 910,649Delaware 19 267,000 9,951,000 2,985,368District of Columbia 1 73,177,000 73,177,000 73,177,000Florida 67 518,000 177,544,000 14,809,343Georgia 196 77,000 43,460,000 2,729,393Hawaii 1 95,795,000 95,795,000 95,795,000Idaho 112 0 6,419,000 721,009Illinois 1,096 0 353,312,000 773,557Indiana 315 0 31,724,000 968,651Iowa 394 24,000 13,777,000 388,731Kansas 304 20,000 21,983,000 501,516Kentucky 176 53,000 49,876,000 1,942,699Louisiana 66 809,000 67,153,000 7,242,545Maine 292 0 3,224,000 255,123Maryland 24 1,341,000 97,324,000 12,177,500Massachusetts 436 0 43,581,000 779,807Michigan 691 0 148,252,000 1,167,457Minnesota 425 0 32,135,000 591,082Mississippi 153 132,000 18,913,000 1,996,837Missouri 525 6,000 40,115,000 640,861Montana 490 0 6,286,000 184,798Nebraska 674 0 24,794,000 171,785Nevada 17 59,000 42,887,000 4,007,706New Hampshire 177 0 5,677,000 250,492New Jersey 615 0 40,851,000 694,702New Mexico 89 42,000 35,598,000 2,598,551New York 707 0 868,399,000 2,049,516North Carolina 117 331,000 32,132,000 4,027,846North Dakota 263 0 7,459,000 286,373Ohio 736 0 68,972,000 990,136Oklahoma 586 0 22,088,000 474,759Oregon 243 0 35,768,000 788,728Pennsylvania 604 0 175,280,000 1,293,863Rhode Island 36 13,000 22,559,000 1,755,944South Carolina 106 0 24,696,000 2,860,755South Dakota 177 0 7,488,000 398,689Tennessee 139 41,000 62,508,000 2,584,101Texas 1,062 0 110,621,000 1,590,372Utah 40 143,000 21,015,000 3,501,100Vermont 328 0 2,262,000 114,729Virginia 154 0 30,042,000 2,316,669Washington 305 0 25,757,000 1,272,531West Virginia 55 663,000 15,900,000 3,094,927Wisconsin 430 0 87,213,000 671,105Wyoming 49 4,000 5,484,000 881,041SOURCE: Data reported by states to the U.S. Department of Education, National Center for Education Statistics, Common Core of Data (CCD), "School District Finance Survey (Form F-33)" FY 1997, (sdf97d1a).
Common Core of Data, School District Finance Survey, SY 1996–97, FY 1997
D-8

Table D-8. Minimum, maximum and mean of districts' total revenues, by state: 1996–97
State Number of districts Minimum Maximum Mean
Total 15,679 $0 $8,713,518,000 $19,892,185
Alabama 127 4,702,000 312,137,000 31,352,661Alaska 53 747,000 323,849,000 21,357,547Arizona 228 8,000 366,752,000 19,049,395Arkansas 326 0 164,229,000 7,226,561California 1,084 61,000 4,388,206,000 32,855,030Colorado 195 0 502,134,000 21,196,287Connecticut 174 115,000 260,048,000 27,520,052Delaware 19 5,427,000 178,533,000 47,311,895District of Columbia 1 711,625,000 711,625,000 711,625,000Florida 67 6,831,000 2,347,342,000 214,383,716Georgia 196 1,244,000 574,769,000 42,082,638Hawaii 1 1,213,792,000 1,213,792,000 1,213,792,000Idaho 112 41,000 150,717,000 10,715,938Illinois 1,096 2,000 2,774,684,000 12,709,037Indiana 315 364,000 397,233,000 25,032,194Iowa 394 848,000 220,213,000 8,646,147Kansas 304 923,000 278,408,000 9,965,602Kentucky 176 1,249,000 596,101,000 21,834,653Louisiana 66 7,835,000 425,703,000 62,213,561Maine 292 0 67,213,000 5,263,966Maryland 24 20,656,000 1,127,857,000 251,703,458Massachusetts 436 0 658,093,000 17,403,073Michigan 691 34,000 1,395,204,000 19,912,750Minnesota 425 4,000 460,337,000 14,835,240Mississippi 153 1,724,000 169,543,000 14,867,320Missouri 525 366,000 385,870,000 10,571,684Montana 490 0 53,211,000 2,020,361Nebraska 674 1,000 291,419,000 2,958,488Nevada 17 1,531,000 1,059,430,000 100,075,882New Hampshire 177 28,000 85,355,000 7,566,011New Jersey 615 10,000 585,928,000 20,993,288New Mexico 89 987,000 480,593,000 19,866,831New York 707 144,000 8,713,518,000 37,874,669North Carolina 117 6,343,000 557,046,000 58,358,564North Dakota 263 38,000 69,044,000 2,598,217Ohio 736 58,000 555,828,000 17,160,978Oklahoma 586 167,000 223,767,000 5,825,498Oregon 243 105,000 412,886,000 14,310,374Pennsylvania 604 77,000 1,600,730,000 25,139,786Rhode Island 36 1,909,000 199,431,000 32,931,500South Carolina 106 588,000 320,367,000 36,547,594South Dakota 177 137,000 104,693,000 4,222,949Tennessee 139 1,306,000 590,892,000 31,589,050Texas 1,062 0 1,170,631,000 21,743,472Utah 40 2,439,000 318,159,000 54,681,975Vermont 328 24,000 30,287,000 3,117,518Virginia 154 0 1,181,732,000 47,695,390Washington 305 125,000 385,257,000 21,861,066West Virginia 55 7,781,000 206,329,000 37,345,127Wisconsin 430 619,000 825,610,000 15,638,933Wyoming 49 632,000 76,960,000 13,471,000SOURCE: Data reported by states to the U.S. Department of Education, National Center for Education Statistics, Common Core of Data (CCD), "School District Finance Survey (Form F-33)" FY 1997, (sdf97d1a).
Appendix D—Frequencies of Categorical Variables and Ranges of Selected Data ItemsCommon Core of Data, School District Finance Survey, SY 1996–97, FY 1997
D-9

Table D-9. Minimum, maximum and mean of districts' current expenditures for instruction, by state: 1996–97
State Number of districts Minimum Maximum Mean
Total 15,679 $0 $5,603,761,000 $10,557,045
Alabama 127 2,192,000 167,173,000 16,503,181Alaska 53 359,000 195,500,000 12,300,660Arizona 228 0 201,125,000 8,673,465Arkansas 326 0 89,635,000 3,962,353California 1,084 0 2,317,762,000 16,753,169Colorado 195 0 279,472,000 11,224,262Connecticut 174 0 170,397,000 15,569,575Delaware 19 2,886,000 93,321,000 25,607,895District of Columbia 1 337,401,000 337,401,000 337,401,000Florida 67 2,915,000 1,167,934,000 100,385,567Georgia 196 0 353,182,000 22,980,434Hawaii 1 685,225,000 685,225,000 685,225,000Idaho 112 36,000 88,078,000 6,071,991Illinois 1,096 0 1,561,831,000 6,278,559Indiana 315 0 192,194,000 11,525,686Iowa 394 66,000 130,893,000 4,448,520Kansas 304 432,000 151,194,000 4,857,447Kentucky 176 672,000 360,769,000 12,048,767Louisiana 66 3,750,000 243,061,000 33,409,818Maine 292 0 38,465,000 3,105,127Maryland 24 12,161,000 654,306,000 139,999,333Massachusetts 436 0 392,020,000 10,251,993Michigan 691 29,000 785,636,000 9,808,347Minnesota 425 0 262,087,000 8,144,487Mississippi 153 890,000 86,554,000 8,122,229Missouri 525 109,000 173,491,000 5,536,950Montana 490 0 32,537,000 1,138,449Nebraska 674 0 141,611,000 1,605,332Nevada 17 776,000 524,258,000 50,477,059New Hampshire 177 0 51,799,000 4,284,650New Jersey 615 0 316,944,000 11,555,176New Mexico 89 365,000 249,424,000 9,943,382New York 707 0 5,603,761,000 22,997,849North Carolina 117 3,290,000 292,583,000 31,666,111North Dakota 263 0 37,841,000 1,336,662Ohio 736 0 353,202,000 8,762,690Oklahoma 586 0 111,680,000 2,969,186Oregon 243 0 238,847,000 8,198,955Pennsylvania 604 0 742,685,000 13,602,871Rhode Island 36 1,209,000 116,443,000 20,579,944South Carolina 106 322,000 159,296,000 18,479,396South Dakota 177 0 54,119,000 2,208,774Tennessee 139 713,000 353,157,000 19,112,597Texas 1,062 0 623,143,000 11,335,649Utah 40 991,000 183,040,000 29,423,875Vermont 328 0 16,781,000 1,406,826Virginia 154 0 610,065,000 25,018,273Washington 305 72,000 175,377,000 11,004,259West Virginia 55 4,320,000 115,775,000 20,579,800Wisconsin 430 0 472,063,000 8,716,170Wyoming 49 317,000 45,260,000 7,402,143SOURCE: Data reported by states to the U.S. Department of Education, National Center for Education Statistics, Common Core of Data (CCD), "School District Finance Survey (Form F-33)" FY 1997, (sdf97d1a).
Common Core of Data, School District Finance Survey, SY 1996–97, FY 1997Appendix D—Frequencies of Categorical Variables and Ranges of Selected Data Items
D-10

Appendix D—Frequencies of Categorical Variables and Ranges of Selected Data Items
Table D-10. Minimum, maximum and mean of districts' current expenditures for support services, by state: 1996–97
State Number of districts Minimum Maximum Mean
Total 15,679 $0 $1,989,716,000 $5,731,879
Alabama 127 1,316,000 86,517,000 8,467,339Alaska 53 317,000 103,349,000 7,033,736Arizona 228 2,000 105,279,000 5,492,443Arkansas 326 0 52,679,000 2,047,359California 1,084 0 1,193,924,000 9,262,362Colorado 195 0 149,621,000 6,181,067Connecticut 174 0 70,717,000 7,863,575Delaware 19 1,543,000 51,199,000 13,982,842District of Columbia 1 272,058,000 272,058,000 272,058,000Florida 67 2,302,000 722,391,000 65,226,597Georgia 196 464,000 158,868,000 11,604,791Hawaii 1 326,596,000 326,596,000 326,596,000Idaho 112 16,000 42,015,000 3,152,179Illinois 1,096 0 765,000,000 3,868,967Indiana 315 31,000 127,441,000 6,442,898Iowa 394 83,000 61,873,000 2,495,746Kansas 304 266,000 94,578,000 3,155,664Kentucky 176 346,000 191,645,000 6,439,869Louisiana 66 2,522,000 117,821,000 17,832,606Maine 292 0 20,968,000 1,388,610Maryland 24 6,749,000 307,532,000 78,899,292Massachusetts 436 0 187,714,000 4,643,351Michigan 691 0 445,115,000 6,369,805Minnesota 425 0 125,741,000 3,862,515Mississippi 153 460,000 48,597,000 4,114,948Missouri 525 80,000 138,080,000 3,027,505Montana 490 3,000 17,260,000 619,433Nebraska 674 0 85,937,000 764,315Nevada 17 593,000 324,675,000 30,946,471New Hampshire 177 0 23,335,000 2,051,718New Jersey 615 3,000 181,454,000 6,783,353New Mexico 89 393,000 138,326,000 6,461,573New York 707 48,000 1,989,716,000 10,093,423North Carolina 117 2,024,000 162,795,000 15,978,855North Dakota 263 7,000 17,148,000 674,989Ohio 736 36,000 166,192,000 5,449,887Oklahoma 586 37,000 80,594,000 1,728,826Oregon 243 0 160,957,000 4,759,346Pennsylvania 604 35,000 424,497,000 7,002,454Rhode Island 36 441,000 57,962,000 9,337,417South Carolina 106 219,000 90,748,000 10,473,925South Dakota 177 2,000 29,671,000 1,166,209Tennessee 139 223,000 182,446,000 8,793,273Texas 1,062 0 386,099,000 5,968,585Utah 40 845,000 78,280,000 12,616,000Vermont 328 0 9,380,000 698,841Virginia 154 0 370,572,000 13,987,442Washington 305 34,000 130,259,000 6,514,292West Virginia 55 2,279,000 57,551,000 10,657,945Wisconsin 430 203,000 268,928,000 4,623,537Wyoming 49 356,000 24,799,000 4,219,163SOURCE: Data reported by states to the U.S. Department of Education, National Center for Education Statistics, Common Core of Data (CCD), "School District Finance Survey (Form F-33)" FY 1997, (sdf97d1a).
Common Core of Data, School District Finance Survey, SY 1996–97, FY 1997
D-11

Table D-11. Minimum, maximum and mean of districts' other current expenditures, by state: 1996–97State Number of districts Minimum Maximum Mean
Total 15,679 $0 $291,902,000 $751,392
Alabama 127 305,000 20,119,000 1,982,843Alaska 53 0 8,580,000 675,151Arizona 228 0 19,433,000 1,026,053Arkansas 326 0 7,968,000 443,313California 1,084 0 197,229,000 1,137,233Colorado 195 0 22,552,000 731,882Connecticut 174 0 9,584,000 797,305Delaware 19 297,000 4,423,000 1,586,579District of Columbia 1 23,494,000 23,494,000 23,494,000Florida 67 313,000 103,427,000 9,007,955Georgia 196 0 30,948,000 2,183,949Hawaii 1 71,653,000 71,653,000 71,653,000Idaho 112 0 5,356,000 444,446Illinois 1,096 0 110,112,000 390,042Indiana 315 0 11,629,000 812,092Iowa 394 0 11,371,000 339,183Kansas 304 32,000 9,930,000 509,612Kentucky 176 51,000 29,213,000 1,177,920Louisiana 66 684,000 26,775,000 4,222,485Maine 292 0 1,573,000 153,938Maryland 24 1,010,000 47,020,000 11,211,208Massachusetts 436 0 23,365,000 506,271Michigan 691 0 33,348,000 498,711Minnesota 425 0 14,779,000 494,894Mississippi 153 125,000 11,864,000 1,055,314Missouri 525 0 14,398,000 405,524Montana 490 0 2,666,000 73,545Nebraska 674 0 11,439,000 110,503Nevada 17 58,000 29,281,000 2,811,059New Hampshire 177 0 2,873,000 226,525New Jersey 615 0 22,374,000 549,878New Mexico 89 32,000 18,892,000 927,730New York 707 0 291,902,000 957,624North Carolina 117 352,000 30,256,000 3,337,692North Dakota 263 0 2,747,000 181,046Ohio 736 0 20,760,000 566,996Oklahoma 586 0 13,565,000 327,503Oregon 243 0 12,449,000 461,465Pennsylvania 604 0 49,725,000 759,455Rhode Island 36 22,000 8,249,000 1,107,833South Carolina 106 0 15,805,000 1,973,000South Dakota 177 0 4,736,000 181,548Tennessee 139 8,000 31,791,000 1,522,417Texas 1,062 0 61,578,000 981,438Utah 40 119,000 22,020,000 3,848,475Vermont 328 0 1,028,000 66,482Virginia 154 0 33,141,000 1,668,649Washington 305 0 12,428,000 872,918West Virginia 55 351,000 12,160,000 2,037,473Wisconsin 430 0 25,213,000 442,574Wyoming 49 36,000 2,570,000 438,245SOURCE: Data reported by states to the U.S. Department of Education, National Center for Education Statistics, Common Core of Data (CCD), "School District Finance Survey (Form F-33)" FY 1997, (sdf97d1a).
Appendix D—Frequencies of Categorical Variables and Ranges of Selected Data ItemsCommon Core of Data, School District Finance Survey, SY 1996–97, FY 1997
D-12
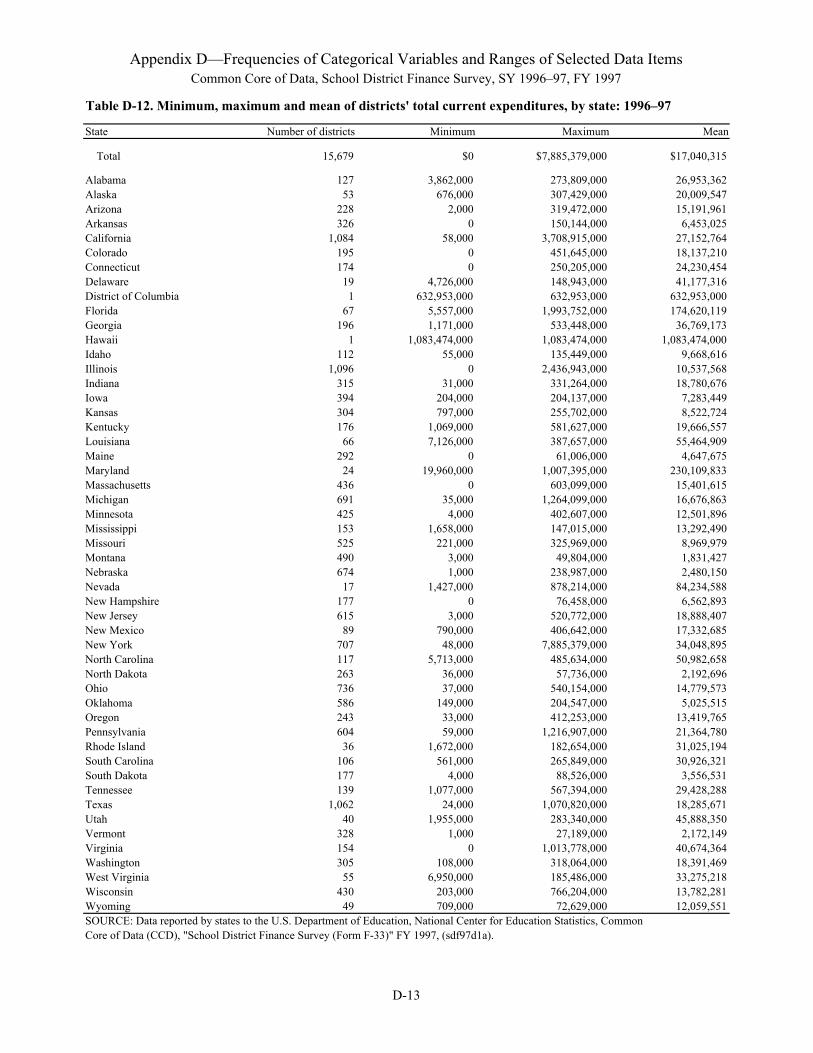
Table D-12. Minimum, maximum and mean of districts' total current expenditures, by state: 1996–97
State Number of districts Minimum Maximum Mean
Total 15,679 $0 $7,885,379,000 $17,040,315
Alabama 127 3,862,000 273,809,000 26,953,362Alaska 53 676,000 307,429,000 20,009,547Arizona 228 2,000 319,472,000 15,191,961Arkansas 326 0 150,144,000 6,453,025California 1,084 58,000 3,708,915,000 27,152,764Colorado 195 0 451,645,000 18,137,210Connecticut 174 0 250,205,000 24,230,454Delaware 19 4,726,000 148,943,000 41,177,316District of Columbia 1 632,953,000 632,953,000 632,953,000Florida 67 5,557,000 1,993,752,000 174,620,119Georgia 196 1,171,000 533,448,000 36,769,173Hawaii 1 1,083,474,000 1,083,474,000 1,083,474,000Idaho 112 55,000 135,449,000 9,668,616Illinois 1,096 0 2,436,943,000 10,537,568Indiana 315 31,000 331,264,000 18,780,676Iowa 394 204,000 204,137,000 7,283,449Kansas 304 797,000 255,702,000 8,522,724Kentucky 176 1,069,000 581,627,000 19,666,557Louisiana 66 7,126,000 387,657,000 55,464,909Maine 292 0 61,006,000 4,647,675Maryland 24 19,960,000 1,007,395,000 230,109,833Massachusetts 436 0 603,099,000 15,401,615Michigan 691 35,000 1,264,099,000 16,676,863Minnesota 425 4,000 402,607,000 12,501,896Mississippi 153 1,658,000 147,015,000 13,292,490Missouri 525 221,000 325,969,000 8,969,979Montana 490 3,000 49,804,000 1,831,427Nebraska 674 1,000 238,987,000 2,480,150Nevada 17 1,427,000 878,214,000 84,234,588New Hampshire 177 0 76,458,000 6,562,893New Jersey 615 3,000 520,772,000 18,888,407New Mexico 89 790,000 406,642,000 17,332,685New York 707 48,000 7,885,379,000 34,048,895North Carolina 117 5,713,000 485,634,000 50,982,658North Dakota 263 36,000 57,736,000 2,192,696Ohio 736 37,000 540,154,000 14,779,573Oklahoma 586 149,000 204,547,000 5,025,515Oregon 243 33,000 412,253,000 13,419,765Pennsylvania 604 59,000 1,216,907,000 21,364,780Rhode Island 36 1,672,000 182,654,000 31,025,194South Carolina 106 561,000 265,849,000 30,926,321South Dakota 177 4,000 88,526,000 3,556,531Tennessee 139 1,077,000 567,394,000 29,428,288Texas 1,062 24,000 1,070,820,000 18,285,671Utah 40 1,955,000 283,340,000 45,888,350Vermont 328 1,000 27,189,000 2,172,149Virginia 154 0 1,013,778,000 40,674,364Washington 305 108,000 318,064,000 18,391,469West Virginia 55 6,950,000 185,486,000 33,275,218Wisconsin 430 203,000 766,204,000 13,782,281Wyoming 49 709,000 72,629,000 12,059,551SOURCE: Data reported by states to the U.S. Department of Education, National Center for Education Statistics, Common Core of Data (CCD), "School District Finance Survey (Form F-33)" FY 1997, (sdf97d1a).
Common Core of Data, School District Finance Survey, SY 1996–97, FY 1997Appendix D—Frequencies of Categorical Variables and Ranges of Selected Data Items
D-13

Appendix D—Frequencies of Categorical Variables and Ranges of Selected Data Items
Table D-13. Minimum, maximum and mean of districts' capital outlays, by state: 1996–97
State Number of districts Minimum Maximum Mean
Total 15,679 $0 $1,303,105,000 $2,068,636
Alabama 127 154,000 42,248,000 3,307,638Alaska 53 21,000 72,867,000 2,874,151Arizona 228 0 59,599,000 2,977,162Arkansas 326 0 10,910,000 589,583California 1,084 0 172,499,000 2,849,330Colorado 195 0 59,982,000 3,480,159Connecticut 174 0 24,431,000 1,116,207Delaware 19 95,000 20,297,000 3,891,895District of Columbia 1 53,106,000 53,106,000 53,106,000Florida 67 389,000 370,103,000 31,514,164Georgia 196 7,000 139,182,000 5,390,388Hawaii 1 123,704,000 123,704,000 123,704,000Idaho 112 0 25,302,000 1,595,563Illinois 1,096 0 367,188,000 1,458,097Indiana 315 0 27,560,000 2,117,549Iowa 394 6,000 13,497,000 750,147Kansas 304 14,000 13,108,000 618,934Kentucky 176 15,000 26,191,000 1,842,994Louisiana 66 192,000 20,659,000 3,786,288Maine 292 0 10,858,000 245,291Maryland 24 813,000 161,154,000 24,696,875Massachusetts 436 0 42,579,000 1,007,507Michigan 691 0 37,013,000 2,140,304Minnesota 425 0 92,603,000 1,880,362Mississippi 153 27,000 26,776,000 1,595,431Missouri 525 0 69,293,000 1,052,010Montana 490 0 2,951,000 121,869Nebraska 674 0 25,215,000 317,021Nevada 17 125,000 298,646,000 21,737,000New Hampshire 177 0 50,053,000 957,497New Jersey 615 0 37,603,000 1,526,070New Mexico 89 12,000 72,309,000 2,805,281New York 707 0 1,303,105,000 3,622,532North Carolina 117 212,000 153,495,000 7,249,812North Dakota 263 0 6,064,000 182,479Ohio 736 0 33,655,000 1,461,285Oklahoma 586 0 21,465,000 482,290Oregon 243 0 25,994,000 1,627,329Pennsylvania 604 0 33,840,000 2,318,167Rhode Island 36 13,000 8,990,000 607,028South Carolina 106 3,000 63,048,000 4,807,858South Dakota 177 0 6,331,000 357,017Tennessee 139 34,000 65,027,000 3,449,525Texas 1,062 0 137,644,000 2,963,357Utah 40 231,000 37,398,000 7,070,675Vermont 328 0 9,538,000 293,186Virginia 154 0 123,014,000 5,401,935Washington 305 0 46,085,000 2,941,433West Virginia 55 211,000 11,331,000 2,621,982Wisconsin 430 0 36,382,000 1,770,209Wyoming 49 46,000 16,039,000 1,718,980SOURCE: Data reported by states to the U.S. Department of Education, National Center for Education Statistics, Common Core of Data (CCD), "School District Finance Survey (Form F-33)" FY 1997, (sdf97d1a).
Common Core of Data, School District Finance Survey, SY 1996–97, FY 1997
D-14

Table D-14. Minimum, maximum and mean of districts' non-elementary-secondary expenditures, by state:1996–97State Number of districts Minimum Maximum Mean
Total 15,679 $0 $120,684,000 $241,593
Alabama 127 0 6,552,000 567,984Alaska 53 0 1,647,000 97,925Arizona 228 0 2,894,000 137,031Arkansas 326 0 2,714,000 42,383California 1,084 0 120,684,000 516,806Colorado 195 0 2,689,000 58,759Connecticut 174 0 2,854,000 150,149Delaware 19 0 2,305,000 467,158District of Columbia 1 0 0 0Florida 67 15,000 100,388,000 6,517,269Georgia 196 0 14,862,000 293,781Hawaii 1 34,197,000 34,197,000 34,197,000Idaho 112 0 1,539,000 19,830Illinois 1,096 0 45,686,000 91,590Indiana 315 0 5,660,000 253,651Iowa 394 0 1,875,000 21,226Kansas 304 0 4,637,000 84,447Kentucky 176 0 1,650,000 197,858Louisiana 66 10,000 8,375,000 368,788Maine 292 0 1,546,000 48,599Maryland 24 15,000 5,096,000 862,167Massachusetts 436 0 3,062,000 43,573Michigan 691 0 22,208,000 440,599Minnesota 425 0 18,169,000 883,433Mississippi 153 0 833,000 39,281Missouri 525 0 10,341,000 185,870Montana 490 0 563,000 7,445Nebraska 674 0 937,000 4,234Nevada 17 0 4,241,000 563,765New Hampshire 177 0 453,000 17,181New Jersey 615 0 8,692,000 257,330New Mexico 89 0 2,368,000 86,124New York 707 0 74,582,000 362,713North Carolina 117 0 8,829,000 390,812North Dakota 263 0 1,392,000 18,053Ohio 736 0 13,486,000 298,060Oklahoma 586 0 19,507,000 213,768Oregon 243 0 5,306,000 64,391Pennsylvania 604 0 41,225,000 230,980Rhode Island 36 0 1,726,000 204,028South Carolina 106 0 2,751,000 355,849South Dakota 177 0 229,000 5,175Tennessee 139 0 2,726,000 268,813Texas 1,062 0 12,368,000 104,808Utah 40 0 2,640,000 170,600Vermont 328 0 1,388,000 12,058Virginia 154 0 23,815,000 823,474Washington 305 0 3,592,000 88,797West Virginia 55 1,000 8,329,000 516,982Wisconsin 430 0 5,492,000 84,181Wyoming 49 0 649,000 33,265SOURCE: Data reported by states to the U.S. Department of Education, National Center for Education Statistics, Common Core of Data (CCD), "School District Finance Survey (Form F-33)" FY 1997, (sdf97d1a).
Common Core of Data, School District Finance Survey, SY 1996–97, FY 1997Appendix D—Frequencies of Categorical Variables and Ranges of Selected Data Items
D-15

Table D-15. Minimum, maximum and mean of districts' total expenditures, by state: 1996–97
State Number of districts Minimum Maximum Mean
Total 15,679 $0 $10,041,575,000 $20,145,495
Alabama 127 4,152,000 322,818,000 31,209,638Alaska 53 721,000 390,032,000 23,341,566Arizona 228 5,000 393,120,000 19,440,175Arkansas 326 0 166,040,000 7,299,067California 1,084 60,000 4,019,716,000 31,238,267Colorado 195 0 535,233,000 22,554,851Connecticut 174 0 261,641,000 26,682,960Delaware 19 5,227,000 174,067,000 46,822,684District of Columbia 1 686,059,000 686,059,000 686,059,000Florida 67 6,883,000 2,533,475,000 217,384,328Georgia 196 1,259,000 638,073,000 43,283,046Hawaii 1 1,241,375,000 1,241,375,000 1,241,375,000Idaho 112 55,000 166,283,000 11,550,938Illinois 1,096 0 2,887,795,000 12,701,271Indiana 315 198,000 400,860,000 23,254,241Iowa 394 826,000 225,455,000 8,846,038Kansas 304 858,000 269,485,000 9,702,658Kentucky 176 1,194,000 614,645,000 22,176,926Louisiana 66 7,622,000 417,561,000 61,018,606Maine 292 0 63,029,000 5,231,723Maryland 24 20,921,000 1,200,830,000 259,046,667Massachusetts 436 0 650,749,000 17,154,603Michigan 691 47,000 1,328,308,000 20,601,884Minnesota 425 4,000 532,269,000 16,213,584Mississippi 153 1,685,000 173,261,000 15,158,980Missouri 525 307,000 377,393,000 10,528,962Montana 490 4,000 52,317,000 1,983,794Nebraska 674 3,000 268,982,000 2,888,316Nevada 17 1,581,000 1,249,628,000 112,114,118New Hampshire 177 36,000 87,413,000 8,087,412New Jersey 615 8,000 552,921,000 21,531,743New Mexico 89 1,000,000 483,989,000 20,522,742New York 707 162,000 10,041,575,000 39,925,829North Carolina 117 6,077,000 676,890,000 59,894,786North Dakota 263 45,000 67,104,000 2,584,380Ohio 736 56,000 579,150,000 16,877,667Oklahoma 586 149,000 225,473,000 5,786,509Oregon 243 34,000 437,178,000 15,607,292Pennsylvania 604 85,000 1,521,278,000 26,121,318Rhode Island 36 1,914,000 197,310,000 32,656,611South Carolina 106 571,000 310,146,000 36,994,953South Dakota 177 107,000 98,157,000 4,017,243Tennessee 139 1,112,000 598,452,000 33,779,921Texas 1,062 24,000 1,173,751,000 22,289,087Utah 40 2,361,000 314,758,000 54,469,450Vermont 328 37,000 30,035,000 3,260,052Virginia 154 0 1,189,644,000 48,287,922Washington 305 109,000 338,787,000 22,269,708West Virginia 55 7,460,000 201,594,000 36,694,273Wisconsin 430 599,000 815,836,000 16,256,951Wyoming 49 755,000 77,984,000 14,186,265SOURCE: Data reported by states to the U.S. Department of Education, National Center for Education Statistics, Common Core of Data (CCD), "School District Finance Survey (Form F-33)" FY 1997, (sdf97d1a).
Common Core of Data, School District Finance Survey, SY 1996–97, FY 1997Appendix D—Frequencies of Categorical Variables and Ranges of Selected Data Items
D-16

Table D-16. Minimum, maximum and mean of continuous variables: 1996–97
Variable Label N Minimum Maximum MeanV33 FALL MEMBERSHIP 15,656 $0 $1,063,561 $2,894 TOTALREV TOTAL REVENUE 15,679 0 8,713,518,000 19,892,185 TFEDREV TOTAL FEDERAL REVENUE 15,679 0 868,399,000 1,259,063 C14 FED REV - THRU STATE - TITLE I 15,679 0 402,189,000 415,813 C15 FED REV - THRU STATE - CHILDREN WITH DISABILITIES - IDEA 15,679 0 50,165,000 149,073 C16 FED REV - THRU STATE - EISENHOWER MATH AND SCIENCE 15,679 0 8,220,000 11,781 C17 FED REV - THRU STATE - DRUG FREE SCHOOLS 15,679 0 11,954,000 18,810 C18 FED REV - THRU STATE - TITLE VI 15,679 0 13,127,000 15,545 C19 FED REV - THRU STATE - VOCATIONAL EDUCATION 15,679 0 14,605,000 35,502 C20 FED REV - THRU STATE - OTHER 15,679 0 80,749,000 122,517 C25 FED REV - THRU STATE - CHILD NUTRITION ACT 15,679 0 220,559,000 360,283 C36 FED REV - NONSPECIFIED 15,679 0 29,970,000 20,969 B10 FED REV - DIRECT - IMPACT AID 15,679 0 30,944,000 44,674 B11 FED REV - DIRECT - BILINGUAL EDUCATION 15,679 0 19,741,000 3,241 B12 FED REV - DIRECT - INDIAN EDUCATION 15,679 0 2,015,000 2,928 B13 FED REV - DIRECT - OTHER 15,679 0 110,010,000 57,928 TSTREV TOTAL STATE REVENUE 15,679 0 3,693,134,000 9,419,007 C01 STATE REV - GENERAL FORMULA ASSISTANCE 15,679 0 2,697,384,000 6,796,185 C04 STATE REV - STAFF IMPROVEMENT PROGRAMS 15,679 0 73,452,000 137,806 C05 STATE REV - SPECIAL EDUCATION PROGRAMS 15,679 0 284,351,000 512,639 C06 STATE REV - COMPENSATORY AND BASIC SKILLS PROGRAMS 15,679 0 73,229,000 117,483 C07 STATE REV - BILINGUAL EDUCATION PROGRAMS 15,679 0 89,033,000 26,105 C08 STATE REV - GIFTED AND TALENTED PROGRAMS 15,679 0 24,992,000 16,624 C09 STATE REV - VOCATIONAL EDUCATION PROGRAMS 15,679 0 21,334,000 72,205 C10 STATE REV - SCHOOL LUNCH PROGRAMS 15,679 0 19,231,000 21,698 C11 PROGRAMS 15,679 0 209,190,000 195,036 C12 STATE REV - TRANSPORTATION PROGRAMS 15,679 0 55,141,000 202,149 C13 STATE REV - OTHER PROGRAMS 15,679 0 984,827,000 873,089 C35 STATE REV - NONSPECIFIED 15,679 0 46,932,000 92,572 C38 STATE REV ON BEHALF - EMPLOYEE BENEFITS 15,679 0 123,291,000 330,760 C39 STATE REV ON BEHALF - NOT EMPLOYEE BENEFITS 15,679 0 10,740,000 24,656 TLOCREV TOTAL LOCAL REVENUE 15,679 0 4,151,985,000 9,214,115 T02 (DEPENDENT SCHOOL SYSTEMS) 15,679 0 3,806,790,000 1,463,881 T06 LOCAL REV - PROPERTY TAXES 15,679 0 1,278,734,000 5,764,114 T09 LOCAL REV - GENERAL SALES TAXES 15,679 0 121,990,000 53,742 T15 LOCAL REV - PUBLIC UTILITY TAXES 15,679 0 10,716,000 15,320 T40 LOCAL REV - INDIVIDUAL AND CORPORATE INCOME TAXES 15,679 0 76,122,000 54,831 T99 LOCAL REV - ALL OTHER TAXES 15,679 0 74,638,000 68,636 D11 LOCAL REV - FROM OTHER SCHOOL SYSTEMS 15,679 0 132,126,000 281,522 D23 LOCAL REV - FROM CITIES AND COUNTIES 15,679 0 292,455,000 205,397 A07 LOCAL REV - TUITION FEES FROM PUPILS AND PARENTS 15,679 0 28,722,000 47,658 A08 PARENTS 15,679 0 937,000 2,681 A09 LCOAL REV - SCHOOL LUNCH 15,679 0 25,227,000 286,652 A11 LOCAL REV - TEXTBOOK SALES AND RENTALS 15,679 0 1,815,000 9,028 A13 LOCAL REV - STUDENT ACTIVITY RECEIPTS 15,679 0 53,795,000 132,404 A15 LOCAL REV - STUDENTS FEES, NONSPECIFIED 15,679 0 3,391,000 3,800 A20 LOCAL REV - OTHER SALES AND SERVICES 15,679 0 13,938,000 38,469 U22 LOCAL REV - INTEREST EARNINGS 15,679 0 57,179,000 278,062 U97 LOCAL REV - MISCELLANEOUS 15,679 0 128,365,000 363,407 C24 NCES LOCAL REVENUE, CENSUS STATE REVENUE 15,679 0 365,414,000 144,511 TOTALEXP TOTAL EXPENDITURES 15,679 0 10,041,575,000 20,145,495 TCURELSC TOTAL CURRENT EXP FOR ELSEC EDUCATION 15,679 0 7,885,379,000 17,040,315 TCURINST TOTAL CURRENT EXP - INSTRUCTION 15,679 0 5,603,761,000 10,557,045
See notes at end of table.
Appendix D—Value Distribution and Field Frequencies Common Core of Data, School District Finance Survey, SY 1996–97, FY 1997
D-17

Appendix D—Value Distribution and Field Frequencies Common Core of Data, School District Finance Survey, SY 1996–97, FY 1997
Table D-16. Minimum, maximum and mean of continuous variables: 1996–97—Continued
Variable Label N Minimum Maximum MeanE13 CURRENT EXP - INSTRUCTION 15,679 0 5,603,761,000 10,557,045 V91 PAYMENTS TO PRIVATE SCHOOLS 15,679 0 74,232,000 68,629 V92 PAYMENTS TO PUBLIC CHARTER SCHOOLS 15,679 0 0 0 TCURSSVC TOTAL CURRENT EXP - SUPPORT SERVICES 15,679 0 1,989,716,000 5,731,879 E17 CURRENT EXP - SUPPORT SERVICES - PUPILS 15,679 0 246,420,000 807,864 E07 CURRENT EXP - SUPPORT SERVICES - INSTRUCTIONAL STAFF 15,679 0 148,513,000 675,638 E08 ADMINISTRATION 15,679 0 71,883,000 346,979 E09 ADMINISTRATION 15,679 0 232,796,000 949,320 V40 MAINTENANCE OF PLANT 15,679 0 778,713,000 1,645,090 V45 TRANSPORTATION 15,679 0 469,043,000 707,634 V90 BUSINESS/CENTRAL/OTHER 15,679 0 153,860,000 467,348 V85 CURRENT EXP - SUPPORT SERVICES NONSPECIFIED 15,679 0 17,129,000 132,006 TCUROTH TOTAL CURRENT EXPENDITURES - OTHER ELSEC 15,679 0 291,902,000 751,392 E11 CURRENT EXP - FOOD SERVICES 15,679 0 291,902,000 707,973 V60 CURRENT EXP - ENTERPRISE OPERATIONS 15,679 0 20,725,000 32,606 V65 CURRENT EXP - OTHER ELSEC 15,679 0 21,551,000 10,813 TNONELSE TOTAL NON-ELSEC EXPENDITURES 15,679 0 120,684,000 241,593 V70 NON-ELSEC EXP - COMMUNITY SERVICES 15,679 0 45,432,000 94,197 V75 NON-ELSEC EXP - ADULT EDUCATION 15,679 0 109,455,000 101,141 V80 NON-ELSEC EXP - OTHER 15,679 0 70,279,000 46,255 TCAPOUT TOTAL CAPITAL OUTLAY EXPENDITURES 15,679 0 1,303,105,000 2,068,636 F12 CAPITAL OUTLAY - CONSTRUCTION 15,679 0 1,239,072,000 1,432,813 G15 CAPITAL OUTLAY - LAND AND EXISTING STRUCTURES 15,679 0 23,520,000 99,003 K09 CAPITAL OUTLAY - INSTRUCTIONAL EQUIPMENT 15,679 0 45,733,000 190,622 K10 CAPITAL OUTLAY - OTHER EQUIPMENT 15,679 0 75,858,000 312,332 K11 CAPITAL OUTLAY - NONSPECIFIED EQUIPMENT 15,679 0 27,478,000 33,867 L12 PAYMENTS TO STATE GOVERNMENTS 15,679 0 49,153,000 27,831 M12 PAYMENTS TO LOCAL GOVERNMENTS 15,679 0 53,565,000 39,139 Q11 PAYMENTS TO OTHER SCHOOL SYSTEMS 15,679 0 435,517,000 308,788 I86 INTEREST ON DEBT 15,679 0 342,992,000 419,192 Z32 TOTAL SALARIES 15,679 0 5,029,442,000 11,204,357 Z33 SALARIES - INSTRUCTION 15,679 0 3,987,810,000 7,672,695 V11 SALARIES - SUPPORT SERVICES - PUPILS 15,679 0 162,297,000 583,357 V13 SALARIES - SUPPORT SERVICES - INSTRUCTIONAL STAFF 15,679 0 102,783,000 426,624 V15 SALARIES - SUPPORT SERVICES - GENERAL ADMINISTRATION 15,679 0 49,075,000 171,987 V17 SALARIES - SUPPORT SERVICES - SCHOOL ADMINISTRATION 15,679 0 178,424,000 713,027 V21 MAINTENANCE OF PLANT 15,679 0 417,879,000 668,390 V23 SALARIES - SUPPORT SERVICES - STUDENT TRANSPORTATION 15,679 0 63,852,000 268,229 V37 SALARIES - SUPPORT SERVICES - BUSINESS/CENTRAL/OTHER 15,679 0 62,046,000 225,574 V29 SALARIES - FOOD SERVICES 15,679 0 129,867,000 252,713 Z34 TOTAL EMPLOYEE BENEFITS 15,679 0 1,493,071,000 3,008,683 V10 EMPL BENEFITS - INSTRUCTION 15,679 0 1,215,224,000 2,021,540 V12 EMPL BENEFITS - SUPPORT SERVICES - PUPILS 15,679 0 42,723,000 152,017
V14 EMPL BENEFITS - SUPPORT SERVICES - INSTRUCTIONAL STAFF15,679 0 27,352,000 111,983
V16 ADMINISTRATION 15,679 0 14,955,000 52,318 V18 ADMINISTRATION 15,679 0 54,372,000 190,364 V22 MAINTENANCE OF PLANT 15,679 0 127,342,000 200,233 V24 TRANSPORTATION 15,679 0 20,044,000 80,244 V38 BUSINESS/CENTRAL/OTHER 15,679 0 18,908,000 72,227 V30 EMPL BENEFITS - FOOD SERVICES 15,679 0 20,477,000 72,354 V32 EMPL BENEFITS - ENTERPRISE OPERATIONS 15,679 0 1,058,000 1,160 _19H YEAR 15,679 0 6,053,879,000 7,067,990
See notes at end of table.
D-18

Appendix D—Value Distribution and Field Frequencies Common Core of Data, School District Finance Survey, SY 1996–97, FY 1997
Table D-16. Minimum, maximum and mean of continuous variables: 1996–97—Continued
Variable Label N Minimum Maximum Mean
_21F LONG TERM DEBT - ISSUED DURING FISCAL YEAR 15,679 0 1,478,629,000 1,439,933 _31F LONG TERM DEBT - RETIRED DURING FISCAL YEAR 15,679 0 922,471,000 655,019 _41F LONG TERM DEBT - OUTSTANDING AT END OF FISCAL YEAR 15,679 0 6,610,037,000 7,854,121
_61VSHORT TERM DEBT - OUTSTANDING AT BEGINNING OF FISCAL YEAR 15,679 0 38,630,000 207,560
_66V SHORT TERM DEBT - OUTSTANDING AT END OF FISCAL YEAR 15,679 0 61,012,000 160,894
W01 ASSETS - SINKING FUND 15,679 0 154,341,000 283,187 W31 ASSETS - BOND FUND 15,679 0 676,831,000 1,472,148 W61 ASSETS - OTHER FUNDS 15,679 0 1,129,715,000 3,062,033 SOURCE: Data reported by states to the U.S. Department of Education, National Center for Education Statistics, Common Core of Data (CCD), "School District Finance Survey (Form F-33)" FY 1997, (sdf97d1a).
D-19
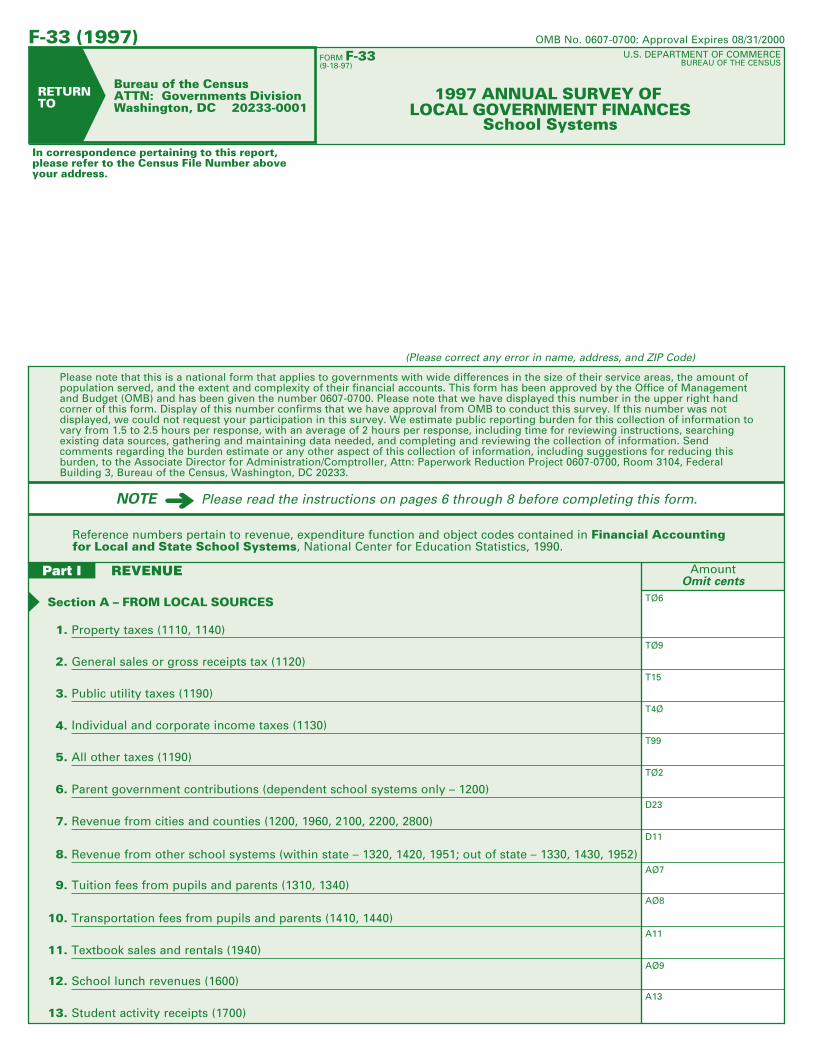
Please note that this is a national form that applies to governments with wide differences in the size of their service areas, the amount ofpopulation served, and the extent and complexity of their financial accounts. This form has been approved by the Office of Managementand Budget (OMB) and has been given the number 0607-0700. Please note that we have displayed this number in the upper right handcorner of this form. Display of this number confirms that we have approval from OMB to conduct this survey. If this number was notdisplayed, we could not request your participation in this survey. We estimate public reporting burden for this collection of information tovary from 1.5 to 2.5 hours per response, with an average of 2 hours per response, including time for reviewing instructions, searchingexisting data sources, gathering and maintaining data needed, and completing and reviewing the collection of information. Sendcomments regarding the burden estimate or any other aspect of this collection of information, including suggestions for reducing thisburden, to the Associate Director for Administration/Comptroller, Attn: Paperwork Reduction Project 0607-0700, Room 3104, FederalBuilding 3, Bureau of the Census, Washington, DC 20233.
RETURNTO
Bureau of the CensusATTN: Governments DivisionWashington, DC 20233-0001
FORM F-33(9-18-97)
U.S. DEPARTMENT OF COMMERCEBUREAU OF THE CENSUS
1997 ANNUAL SURVEY OF LOCAL GOVERNMENT FINANCES
School Systems
In correspondence pertaining to this report,please refer to the Census File Number aboveyour address.
(Please correct any error in name, address, and ZIP Code)
Please read the instructions on pages 6 through 8 before completing this form.NOTE ➜
Reference numbers pertain to revenue, expenditure function and object codes contained in Financial Accountingfor Local and State School Systems, National Center for Education Statistics, 1990.
AmountOmit cents
Part I REVENUE
Section A – FROM LOCAL SOURCES
4.
1. Property taxes (1110, 1140)
2. General sales or gross receipts tax (1120)
3. Public utility taxes (1190)
Individual and corporate income taxes (1130)
5. All other taxes (1190)
6. Parent government contributions (dependent school systems only – 1200)
7. Revenue from cities and counties (1200, 1960, 2100, 2200, 2800)
8. Revenue from other school systems (within state – 1320, 1420, 1951; out of state – 1330, 1430, 1952)
9. Tuition fees from pupils and parents (1310, 1340)
10. Transportation fees from pupils and parents (1410, 1440)
11. Textbook sales and rentals (1940)
12. School lunch revenues (1600)
13. Student activity receipts (1700)
OMB No. 0607-0700: Approval Expires 08/31/2000
TØ6
TØ9
T15
T4Ø
T99
TØ2
D23
D11
AØ7
AØ8
A11
AØ9
A13
F-33 (1997)
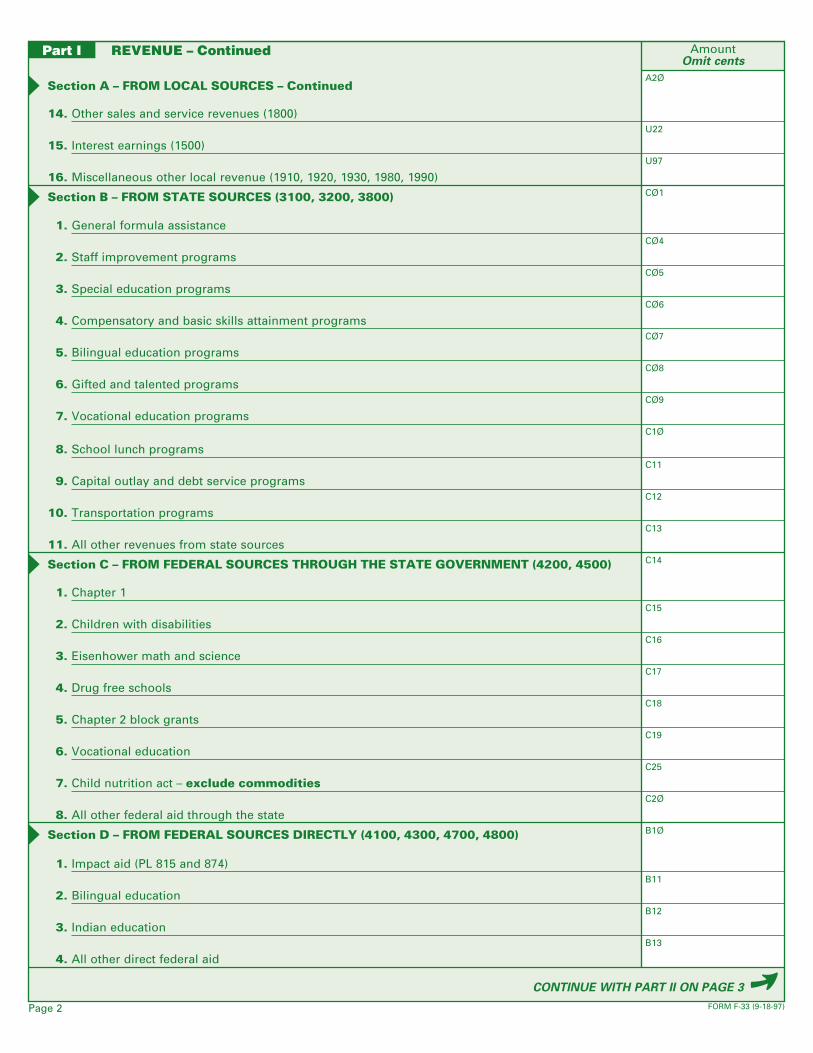
AmountOmit cents
Part I REVENUE – Continued
Section A – FROM LOCAL SOURCES – Continued
14. Other sales and service revenues (1800)
15. Interest earnings (1500)
16. Miscellaneous other local revenue (1910, 1920, 1930, 1980, 1990)
Section B – FROM STATE SOURCES (3100, 3200, 3800)
1. General formula assistance
2. Staff improvement programs
3. Special education programs
4. Compensatory and basic skills attainment programs
5. Bilingual education programs
6. Gifted and talented programs
7. Vocational education programs
8. School lunch programs
9. Capital outlay and debt service programs
10. Transportation programs
11. All other revenues from state sources
Section C – FROM FEDERAL SOURCES THROUGH THE STATE GOVERNMENT (4200, 4500)
1. Chapter 1
2. Children with disabilities
3. Eisenhower math and science
4. Drug free schools
5. Chapter 2 block grants
6. Vocational education
7. Child nutrition act – exclude commodities
8. All other federal aid through the state
Section D – FROM FEDERAL SOURCES DIRECTLY (4100, 4300, 4700, 4800)
1. Impact aid (PL 815 and 874)
2. Bilingual education
3. Indian education
4. All other direct federal aid
CONTINUE WITH PART II ON PAGE 3
FORM F-33 (9-18-97)Page 2
A2Ø
U22
U97
CØ1
CØ4
CØ5
CØ6
CØ7
CØ8
CØ9
C1Ø
C11
C12
C13
C14
C15
C16
C17
C18
C19
C25
C2Ø
B1Ø
B11
B12
B13

TOTAL (ALL currentoperation objects)
Part II CURRENT OPERATION – All amounts paid excluding internal transfers andamounts reported in parts III, IV3–6, VIA3, and IX6–14.
1. Instruction (1000)
2. Support services, pupils (2100)
3. Support services, instructional staff (2200)
CONTINUE WITH PART IV ON PAGE 4
FORM F-33 (9-18-97) Page 3
Employee benefits only(Object 200)
Salaries only(Object 100)
4. Support services, general administration (2300)
5. Support services, school administration (2400)
6. Support services, operation and maintenance of plant (2600)
7. Support services, student transportation(2700)
8. Business/central/other support services (2500, 2800, and 2900)
Section B – ELEMENTARY-SECONDARY NON-INSTRUCTIONAL PROGRAMS
9. Food services (3100)
10. Enterprise operations (3200)
11. Other
Section C – NON-ELEMENTARY-SECONDARY PROGRAMS
Section A – ELEMENTARY-SECONDARY EDUCATION INSTRUCTIONAL PROGRAMS – PREKINDERGARTEN THROUGH GRADE 12
12. Community services (3300)
13. Adult education
14. Other
Part III CAPITAL OUTLAY EXPENDITURES AmountOmit cents
1. Construction (object code 450)
2. Land and existing structures (object codes 710, 720)
3. Instructional equipment (object code 730, function 1000)
4. All other equipment (object code 730, functions 2000, 3000, 4000)
OTHER EXPENDITURES BY LOCAL EDUCATION AGENCY
1. Total salaries and wages (object 100 – ALL functions)
Total employee benefit payments (object 200 – ALL functions)
Z33 V1Ø E13
V11 V12 E17
V13 V14 EØ7
V15 V16 EØ8
V17 V18 EØ9
V21 V22 V4Ø
V23 V24 V45
V37 V38 V9Ø
V29 V3Ø E11
V32 V6Ø
V65
V7Ø
V75
V8Ø
F12
G15
KØ9
K1Ø
Z32
Z34
Part IV
(1) (2) (3)
Section D – EXHIBITS OF SELECTED ITEMS REPORTED ABOVE IN II-A AND II-B
15. Payments to private schools (object 563)
16. Payments to public charter schools
2.
V91
V92
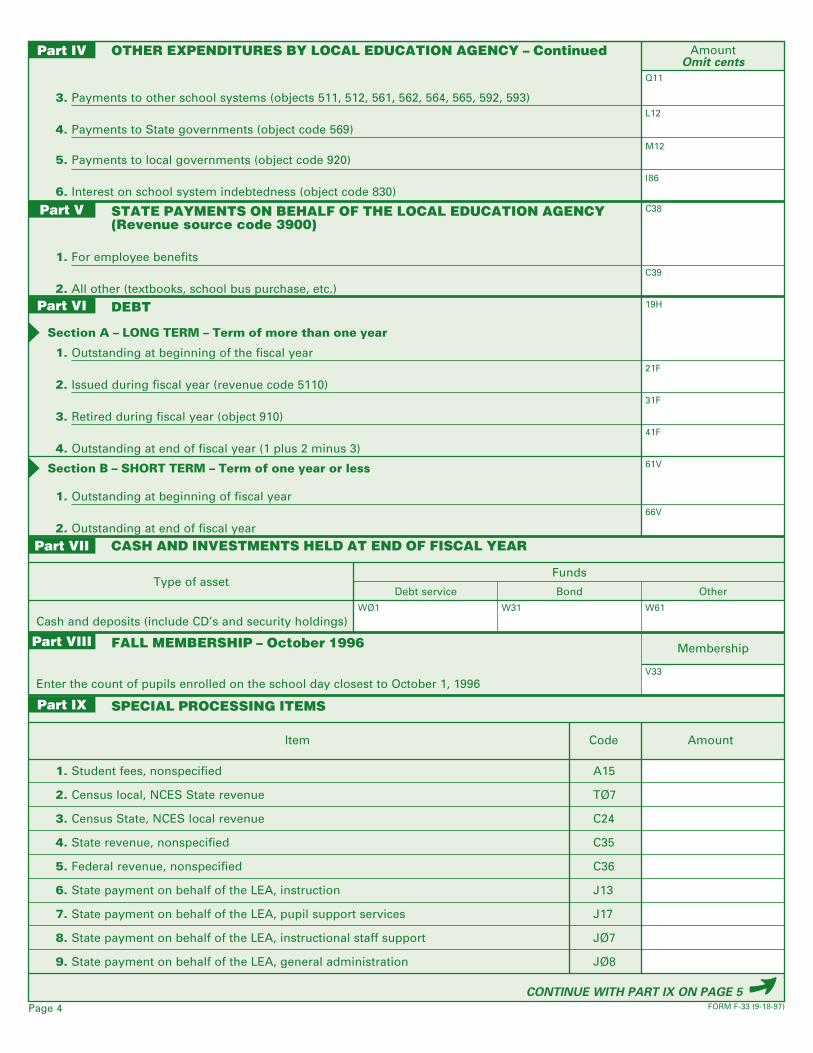
AmountOmit cents
Part IV OTHER EXPENDITURES BY LOCAL EDUCATION AGENCY – Continued
3. Payments to other school systems (objects 511, 512, 561, 562, 564, 565, 592, 593)
4. Payments to State governments (object code 569)
FORM F-33 (9-18-97)Page 4
Part V STATE PAYMENTS ON BEHALF OF THE LOCAL EDUCATION AGENCY (Revenue source code 3900)
1. For employee benefits
2. All other (textbooks, school bus purchase, etc.)Part VI DEBT
Section A – LONG TERM – Term of more than one year
1. Outstanding at beginning of the fiscal year
2. Issued during fiscal year (revenue code 5110)
3. Retired during fiscal year (object 910)
4. Outstanding at end of fiscal year (1 plus 2 minus 3)
Section B – SHORT TERM – Term of one year or less
1. Outstanding at beginning of fiscal year
2. Outstanding at end of fiscal year
Part VII CASH AND INVESTMENTS HELD AT END OF FISCAL YEAR
Type of assetFunds
Debt service Bond Other
Cash and deposits (include CD’s and security holdings)
Part VIII FALL MEMBERSHIP – October 1996
Enter the count of pupils enrolled on the school day closest to October 1, 1996
Membership
Q11
L12
C38
C39
19H
21F
31F
41F
61V
66V
WØ1 W31 W61
V33
Payments to local governments (object code 920)5.
6. Interest on school system indebtedness (object code 830)
Part IX
Student fees, nonspecified
Census local, NCES State revenue
Census State, NCES local revenue
State revenue, nonspecified
Federal revenue, nonspecified
State payment on behalf of the LEA, instruction
State payment on behalf of the LEA, pupil support services
State payment on behalf of the LEA, instructional staff support
State payment on behalf of the LEA, general administration
SPECIAL PROCESSING ITEMS
A15
TØ7
C24
C35
C36
J13
J17
JØ7
JØ8
Item Code Amount
CONTINUE WITH PART IX ON PAGE 5
1.
2.
3.
4.
5.
6.
7.
8.
9.
M12
Ι86

FORM F-33 (9-18-97) Page 5
Part IX
10. State payment of behalf of the LEA, school administration
11. State payment on behalf of the LEA, operation and maintenance of plant
12. State payment on behalf of the LEA, student transportation
13. State payment on behalf of the LEA, business/central/other
14. State payment on behalf of the LEA, other
15. Support services expenditures, nonspecified
16. Equipment expenditure, nonspecified
17. Own retirement system transfer, instruction
18. Federal revenue on behalf of school system
SPECIAL PROCESSING ITEMS – Continued
JØ9
J4Ø
J45
J9Ø
J1Ø
V85
K11
J12
B23
Item Code Amount
Remarks – Please use this space for any explanation that may be essential in understanding your reported data. Ifadditional space is required, please attach a separate sheet.
Part X DATA SUPPLIED BYName Telephone
Area code Number ExtensionTitle
FOR CENSUSUSE ONLY

BASIC INSTRUCTIONS AND SUGGESTIONS
FORM F-33 (9-18-97)Page 6
FINALLY AUDITED FIGURES ARE UNNECESSARY. If substantiallyaccurate figures can be supplied on a preliminary basis, please do notdelay submitting this report.
1. INCLUDE the unduplicated revenues and expenditures from all funds.
a. General fund b. Special revenue fundsc. Federal projects funds d. Debt service fund
2. EXCLUDE transfers of monies between funds, agency transactions,transactions of private trust funds, purchase of commodities, andpurchase of securities for investment purposes.
3. Please describe in the "Remarks" section the basis of any estimates orprorations used to report amounts requested on this form.
Part I – REVENUESection A – FROM LOCAL SOURCESLines 1–5. Independent school districts (those with "5" in the thirdcharacter of their ID) should report their tax receipts here. Line 1(property taxes) will be applicable to most independent school districts.Lines 2 through 5 will be applicable to only a relatively small number ofdistricts. Taxes reported here should be those which the district has thepower to levy. State taxes and state property tax relief payments shouldbe excluded here and reported instead in section B. Include current anddelinquent tax revenues and penalties.
Line 6. Dependent school systems (those with "0," "1," "2," or "3" in thethird character of their ID) should report their tax receipts and any otheramounts appropriated by their parent government on line 6 (Censuscode T02).
Line 7. Report taxes for education levied by separate county and citygovernments and transferred to the school system. Include debt issuedin the name of a local (non- school system) government and transferredto the school system. Regional school systems should reportassessments received from cities and towns here. Assessments receivedfrom independent school districts should be reported on line 8.
Line 8. Report payments received from other school systems, bothwithin and outside the state, for tuition, transportation, and otherservices (such as purchasing and data processing). Regional schoolsystems should report assessments received from independent schooldistricts here. Assessments received from cities and towns should bereported on line 7.
Lines 9–14. Report all student fees on these lines. Gross receipts fromsale of school breakfasts, lunches, and milk (from students, teachers,adults, but not from state or federal funds) should be entered in item 12.Gross student activity receipts for those funds under control of thecustodian of school funds should be included on line 13. Revenues fromother sales and services, including community services activities shouldbe entered on line 14. Report in Part IX the amount of any student feethat cannot be reported because the fee covers more than one of theitems on lines 9 through 14, such as lump sum fees for both tuition andtransportation.
Line 15. Include interest earnings from all funds held by the schoolsystem.
Line 16. Report receipts from rentals, property sales, privatecontributions, and refunds from prior year expenditures.
Section B – FROM STATE SOURCESInclude all state payments made directly to the local educationagency. Exclude state payments made on behalf of the localeducation agency and report instead in Part V.Line 1. Include revenue from general non-categorical state assistanceprograms such as foundation, minimum or basic formula support,principal apportionment, equalization, flat or block grants, and statepublic school fund distributions. Also include state revenue dedicatedfrom major state taxes, such as income and sales taxes. Revenues fromminor state taxes should be included on line 11.
Line 2. Report revenues from programs designed to improve the qualityand quantity of local education agency staff. Examples includeadditional teacher units, teacher benefits, retirement and social securitypaid directly to local education agencies, mentor teachers, teacherinduction, staff development contracts and stipends, career laddercontracts, in-service training, health insurance, principal leadership,teacher quality contracts, and salaries for specific types of instructionaland support staff (other than for staff directly associated with theprograms described on lines 3 through 10).
Line 3. Enter revenues for the education of physically and mentallyhandicapped students.
Line 4. Include revenues from state compensatory education for "atrisk" or other economically disadvantaged students, including migratorychildren (unless bilingual – see line 5) and orphans. Also includeamounts from state programs directed toward the attainment of basicskills. Include categorical education excellence and quality educationprograms which provide more than staff enhancements – such asmaterials, resource centers, and equipment. Programs which focus onstaff should be reported on line 2.
Lines 5–10. Enter state revenues for the type of program indicated. Includecareer education programs on line 7; school lunch matching payments on line8; school construction, building aid, and interest and principal payments online 9; and bus driver salaries and bus replacements on line 10.
Line 11. Report amounts for specific programs not described above onlines 1 through 10 including instructional materials, textbooks, computerequipment, library resources, guidance and psychological services,driver education, energy conservation, enrollment increases and losses,health, alcohol and drug abuse, AIDS, child abuse, summer school,prekindergarten and early childhood, adult education (excludingvocational), desegregation, private schools, safety and law enforcement,and community services.
Also include on line 11 those items financed by relatively minor statetaxes, licenses, fees, and funds such as severance and license taxes,timber and motor vehicle excise taxes, payments in lieu of taxes,refunds, land reimbursement, and forest funds.
Report in Part IX the amount of any state revenue item that cannot bereported because the item covers more than one of the items on lines 1through 11, such as "total state revenues" not broken down by program.
Section C – FROM FEDERAL SOURCES THROUGH THE STATEGOVERNMENT
Line 1. Include federal revenues distributed through Chapter 1 of theElementary-Secondary Education Act (P.L. 89-10). Report basic,concentration, and migratory education grants.
Line 2. Report federal revenues awarded under the Children withDisabilities Act (P.L. 91-230). Include formula grants authorized in Part Bof this legislation. Exclude project grants authorized in Part C (EarlyEducation and Severely Disabled Programs), Part E (Innovation andDevelopment), and Part G (Technical Development). Report these projectgrants instead in Part I-D4.
Line 3. Report math and science formula grants authorized by Title II-Aof the Elementary-Secondary Education Act (P.L. 89-10).
Line 4. Include formula and project grants for drug free schoolsauthorized by the Elementary-Secondary Education Act of 1986.
Line 5. Enter Chapter 2 block grants sanctioned by the EducationConsolidation Improvement Act (P.L. 100-297).
Line 6. Report formula grants authorized by the Carl D. PerkinsVocational Education Act (P.L. 101-392). Include revenues from Title II(Basic Grants), Title III-A (Community Based Organizations), Title III-B(Consumer and Homemaking Education), and Title III-E (Tech-PrepEducation).
CONTINUE ON PAGE 7
Line 7. Include revenues from Child Nutrition Act programs (nationalschool lunch, special milk, school breakfast and ala carte) sanctioned byP.L. 79-396 and P.L. 89-642. Report cash payments only -- Excludethe value of donated commodities.
Line 8. Enter the total of all other federal funds disbursed through thestate to the local education agency. Include formula grants authorized bythe Adult Education Act (Part B).
Section D – FROM FEDERAL SOURCES DIRECTLY
Line 1. Include federal payments for construction (P.L. 81-815) and formaintenance and operation (P.L. 81-874).
Line 2. Include project grants for bilingual education authorized by TitleVII of the Elementary-Secondary Education Act and Title IV-E of the CarlD. Perkins Act.
Line 3. Include both project and formula grants for Indian educationauthorized by the Education Consolidation and Improvement Act (P.L.100-297, Title V-C) and the Johnson - O’Malley Act.
Line 4. Report the total of all other federal grants awarded directly tothe local education agency. Include project grants for HandicappedEducation (see instructions for Part I-C2), Head Start, Follow Through,Magnet Schools, Dropout Demonstration Assistance, and Gifted andTalented.
Report in Part IX the amount of any federal revenue item that cannot bereported because the item covers more than one of the items in PartIC1-8 and ID1-4, such as "total federal revenues" not broken down byprogram.
4. Please report "0" in cases of revenues not received, no expendituresmade, or no debt or assets. Report "M" if there are values for theseitems but they cannot be determined because they are missing fromyour records.
e. Capital projects funds f. Food service fund g. Student activity funds
5. Contact the Elementary-Secondary Education Statistics Branch,Bureau of the Census at 1–800–622–6193 for help with questions.

FORM F-33 (9-18-97)
Part II – CURRENT OPERATION EXPENDITUREInclude for the functions shown on lines 1 though 16 expenditures forsalaries and wages only (column (1)), employee benefits only (column(2)), and all current operation expenditure (column (3)). Column (3)totals should include amounts entered in columns (1) and (2).Additionally, column (3) totals should include such objects as contracts,rent, insurance, utilities, maintenance services, printing, tuition paid toprivate schools, purchase of food, supplies, and materials.
Exclude from section A Include instead in:
Handbook references pertain to function codes contained inFinancial Accounting for Local and State School Systems,National Center for Education Statistics, 1990.
Section A – Elementary-secondary Education InstructionalPrograms – Prekindergarten through Grade 12
Line 1. Instruction (1000). Total current operation expenditure foractivities dealing with the interaction of teachers and students in theclassroom, home, or hospital as well as co-curricular activities. Reportamounts for activities of teachers and instructional aides or assistantsengaged in regular instruction, special education, and vocational ed-ucation programs. Exclude adult education programs (report on line 15).
Line 2. Pupil support (2100). Report expenditures for administrative,guidance, health, and logistical support that enhance instruction. Includeattendance, social work, student accounting, counseling, studentappraisal, information, record maintenance, and placement services.Also include medical, dental, nursing, psychological, and speechservices.
Line 3. Instructional staff support (2200). Include expenditures forsupervision of instruction service improvements, curriculumdevelopment, instructional staff training, and media, library, audiovisual,television, and computer-assisted instruction services.
Line 4. General administration (2300). Expenditure for board ofeducation and executive administration (office of the superintendent)services.
Line 5. School administration (2400). Report expenditure for theoffice of the principal services.
Line 6. Operation and Maintenance of Plant (2600). Expenditure forbuildings services (heating, electricity, air conditioning, propertyinsurance), care and upkeep of grounds and equipment, non-studenttransportation vehicle operation and maintenance, and security services.
Line 7. Student Transportation (2700). Report expenditure forvehicle operation, monitoring riders, and vehicle servicing andmaintenance.
Line 8. Business/central/other support services (2500, 2800, and2900). Include business support expenditures for fiscal services(budgeting, receiving and disbursing funds, payroll, internal auditing,and accounting), purchasing, warehousing, supply distribution, printing,publishing, and duplicating services. Also include central supportexpenditures for planning, research and development, evaluation,information, management services, and expenditures for other supportservices not included on lines 2 through 7. Report in part IX, line 15(support service expenditures, nonspecified) any item that cannot bereported because it covers more than one of the items in lines 2 through 8, such as "total support services" not broken down by function.
Section B – Elementary-secondary Non-instructional Programs
Line 11. Food services (3100). Gross expenditure for cafeteriaoperations to include the purchase of food but excluding the value ofdonated commodities and purchase of food service equipment (reportequipment in Part III-4).
Line 12. Enterprise operations (3200). Include expenditure forbusiness-like activities (such as a bookstore) where the costs arerecouped largely with user charges.
Line 13. Other. Report the expenditure for other elementary-secondary NON-instructional activities not related to food services orenterprise operations. Non-enterprise student activities should beincluded with "instruction" on line 1.
Section C – Non-elementary-secondary ProgramsLine 14. Community services (3300). Include any local educationagency expenditure for providing non-education services such asoperation of a swimming pool, public library, programs for the elderly,or child care centers.
Line 15. Adult education. Expenditure for provision of GED or otherclasses offered by the local education agency outside theelementary-secondary curriculum.
Line 16. Other. All other non-elementary secondary programs such asany community college programs.
Part III – CAPITAL OUTLAY EXPENDITURESInclude expenditures for construction of fixed assets (line 1); purchasingfixed assets including land and existing buildings and grounds (line 2);and equipment (lines 3 and 4). Instructional equipment (line 3) consistsof all equipment (or capital outlay) recorded in general and operatingfunds under "instruction" – function code 1000.
Report in Part IX the amount of any equipment expenditure that cannotbe broken down into the categories of "instructional" and "otherequipment."
Part IV – OTHER EXPENDITURES BY LOCAL EDUCATIONAGENCYLine 1. Total salaries and wages. Enter the total expenditure for allsalaries and wages paid by the local education agency during the fiscalyear. Include both here and in Part II-A, column 1, gross salaries withoutdeduction of withholdings for income tax, employee contributions toSocial Security and retirement coverage, etc. Do not include employerpaid employee benefits in these figures. The total entered for salariesand wages should at least be equal to the sum of the entries made inPart II-A, column 1, and be larger if the local education agency paidsalaries for enterprise operations and for non-elementary-secondaryprogram activities.
Line 3. Payments to other school systems. Report payments toin-state and out-of-state public school systems for tuition, transportation,computer and purchasing services, etc. Payments made to dependentschool systems or to parent governments of dependent school systemsshould be included here.
Lines 4 and 5. Report payments to state and local governments,including repayments of loans. Also include debt service payments tostate and local governments and school building authorities which incurdebt instead of the school system.
Line 6. Interest on school system debt. Expenditure for interestincurred on both long-term and short-term indebtedness of the schoolsystem. Exclude principal payments which should be reported in Part VI.
Capital outlay expenditures Part III
Payments to other school systems Part IV, item 3Payments to the State, cities,counties, or special districts Part IV, items 4 and 5
Debt service payments Part IV, item 6 and Part VIA3State payments on behalf ofschool systems Part IX, items 6–14
Also exclude inter-fund transfers and the purchase of stocks, bonds,securities, and other investment assets.
Page 7
Line 2. Total employee benefit payments. Enter the totalexpenditure for all employee benefits paid by the local education agencyduring the fiscal year. Include both here and in Part II-A, column 2, theemployer share of state or local employee retirement contributions,social security contributions, group life and health insurance,unemployment and workmen’s compensation, and any tuitionreimbursements. Exclude (and report in Part V) state payments made onbehalf of the local education agency. The total entered for employeebenefits should at least be equal to the sum of the entries made in PartII-A, column 2, and be larger if the local education agency paidemployee benefits for non-elementary-secondary program activities.
CONTINUE ON PAGE 8
Section D – EXHIBITS OF SELECTED ITEMS REPORTED ABOVE INII-A AND II-BLine 1. Payments to private schools (object 563). Report allexpenditures to private schools for tuition and for any othe purpose.These payments will be deducted from the amounts reported in partsII-A and II-B when calculating per pupil expenditures for the schoolsystem. The fall membership count of students supported by publicschool money but attending private schools should be excluded fromthe fall membership reported in Part VIII. Identify in the remarks sectionthe expenditure functions for which the private school payment wasmade, if possible. If no information is provided, this amount will bededucted from instruction expenditure reported in part II-A1 whencalculating per pupil expenditures.
Line 2. Payments to public charter schools. Indicate in the remarkssection whether fall membership counts of students attending charterschools are included in the school system’s membership reported in theCommon Core of Data Nonfiscal Survey or in part VIII of this form. Alsoidentify in the remarks section the expenditure functions for which thecharter school payment was made, if possible. This information will beused in determining per pupil expenditure amounts for the schoolsystem.
FORM F-33 (9-18-97)
Part VII – CASH AND INVESTMENTS HELD AT END OF FISCALYEAR
Report the total amount of cash on hand and on deposit andinvestments in Federal Government, Federal agency, state and localgovernment and nongovernment securities. Report all investments atpar value. Exclude accounts receivable, value of real property, and allnon-security assets.
Part VIII – FALL MEMBERSHIP – OCTOBER, 1996
Include an unduplicated head count of pupils enrolled in the schoolsystem on the closest date to October 1, 1996 as possible. Include pupilstransferred into the school system and exclude pupils transferred out.Also exclude pupils attending private schools. You do not have to reportany information in this part if you report the same information in theCommon Core of Data Nonfiscal Survey.
Page 8
Part IX – SPECIAL PROCESSING ITEMS
These are special use items. Amounts should only be reported in thispart if all pertinent financial data cannot be reported in Parts I throughVIII. Before entering data in this part please contact theElementary-Secondary Education Statistics Branch, U.S. Bureau of theCensus at 1–800–622–6193.
Line 1. Student fees, nonspecified. Report here any item in yourchart of accounts which cannot be crosswalked into the itemsidentified in Part I, Line 9 (tuition), 10 (transportation), 11 (textbooksales), 12 (school food service sales), or 13 (student activities). Anexample would be total student fees not broken down into theseseparate categories.
Line 2. Census local, NCES state revenue. This category is reservedfor any tax item classified as local by the Bureau of the Census and asstate by the National Center for Education Statistics.
Line 3. Census state, NCES local revenue. This category is reservedfor any tax item classified as state by the Bureau of the Census and aslocal by the National Center for Education Statistics.
Line 4. State revenue, nonspecified. Report here any item in yourchart of accounts which cannot be crosswalked into the items identifiedin Part I-B, lines 1 through 11. An example would be total state revenuenot broken down into separate state aid programs.
Line 5. Federal revenue, nonspecified. Report here any item in yourchart of accounts which cannot be crosswalked into the items identifiedin Part I-C, lines 1 through 8, and Part I-D, lines 1 through 4. An examplewould be total federal aid not broken down into separate federal grantprograms.
Line 6. State payment on behalf of the LEA, instruction. Reportexpenditures of the revenues reported in Part V, lines 1 and 2, that weremade for instruction. See definition for Part II-A, line 1.
Line 7. State payment on behalf of the LEA, pupil supportservices. This item consists of the actual or estimated expenditurefrom the revenues reported in Part V, lines 1 and 2, for pupil supportservices. It also may include any employer contributions to theschool system’s own retirement system. See definitions for Part II-A,line 2.
Line 8. State payment on behalf of the LEA, instructional staffservices. This item consists of the actual or estimated expenditurefrom the revenue reported in Part V, lines 1 and 2, for instructionalstaff services. It also may include any employer contributions to theschool system’s own retirement system. See definitions for Part II-A,line 3.
Line 9. State payment on behalf of the LEA, generaladministration. This item consists of the actual or estimatedexpenditure from the revenues reported in Part V, lines 1 and 2, forgeneral administration. It also may include any employercontributions to the school system’s own retirement system. Seedefinitions for Part II-A, line 4.
Line 10. State payment on behalf of the LEA, schooladministration. This item consists of the actual or estimatedexpenditure from the revenues reported in Part V, lines 1 and 2, forschool administration. It also may include any employercontributions to the school system’s own retirement system. Seedefinitions for Part II-A, line 5.
Line 11. State payment on behalf of the LEA, operation andmaintenance of plant. This item consists of the actual orestimated expenditure from the revenues reported in Part V, lines 1and 2, for operation and maintenance of plant. It also may includeany employer contributions to the school system’s own retirementsystem. See definitions for Part II-A, line 6.
Line 12. State payment on behalf of the LEA, studenttransportation. This item consists of the actual or estimatedexpenditure from the revenues reported in Part V, lines 1 and 2, forstudent transportation. It also may include any employer contributionsto the school system’s own retirement system. See definitions for PartII-A, line7.
Line 13. State payment on behalf of the LEA,business/central/other. This item consists of the actual or estimatedexpenditure from the revenues reported in Part V, lines 1 and 2, forbusiness, central and other support services. It also may include anyemployer contributions to the school system’s own retirement system.See definitions for Part II-A, line 8.
Part V – STATE PAYMENTS ON BEHALF OF THE SCHOOLSYSTEM
Include state payments that benefit the local education agency butwhich are not paid directly. Report on line 1 amounts transferred by thestate into state teacher or public employee retirement funds. Alsoinclude other employee benefit transfers, such as health, life, orunemployment compensation insurance payments. Include in line 2 anyother payments on behalf of the school system, such as for the purchaseof textbooks or school buses purchased by the state and given to thelocal education agency.
Part VI – DEBT
Include in section A bonded indebtedness and any other school districtinterest-bearing debt with a term of more than one year. Report insection B interest-bearing tax anticipation and bond anticipation notebalances and other short-term debt with a term of one year or less.Exclude accounts payable and other non- interest-bearing obligations.
Line 14. State payment on behalf of the LEA, other. Reportexpenditures of the revenues reported in Part V, lines 1 and 2, thatwere made for other than instruction or support services. Seedefinitions for Part II-B and Part II-C.
Line 16. Equipment expenditure, nonspecified. Report here anyitem in your chart of accounts which cannot be crosswalked into theitems identified in Part III, line 3 (instructional equipment) or line 4(other equipment). An example would be total equipment not brokendown by function.
Line 17. Own retirement system transfer, instruction. If theschool system administers its own employee retirement fund (ratherthan participating in a state government retirement system), pleasereport the employer contribution for instructional employees.
Line 18. Federal revenue on behalf of school system. Report anyitem in your chart of accounts identified as received through federalpayments made on behalf of the school system.
Line 15. Support services, nonspecified. Report here any item inyour chart of accounts which cannot be crosswalked into the itemsidentified in Part II-A, lines 2 through 8.