document resume tm 025 726 author zhang .... administering, scoring, and interpreting assessment...
TRANSCRIPT

DOCUMENT RESUME
ED 400 322 TM 025 726
AUTHOR Zhang, ZhichengTITLE Teacher Assessment Competency: A Rasch Model
Analysis.PUB DATE 10 Apr 96NOTE 31p.; Paper presented at the Annual Meeting of the
American Educational Research Association (New York,NY, April 8-12, 1996).
PUB TYPE Reports Research/Technical (143)Speeches /Conference Papers (150)
EDRS PRICE MF01/PCO2 Plus Postage.DESCRIPTORS Decision Making; Difficulty Level; *Educational
Assessment; Educational Practices; Factor Analysis;Factor Structure; *Grading; *Item Response Theory;Rating Scales; Standardized Tests; *TeacherCompetencies; Teacher Education; Test Construction;*Test Interpretation; Test Results
IDENTIFIERS *Alternative Assessment; Rasch Model
ABSTRACTA 67-item Assessment Practices Inventory (API) was
administered to 311 inservice teachers. The application of principalcomponents analysis to the data yielded a 6-factor solution thatexplained 64% of the variance. The Rasch rating scale model wasapplied to the API to estimate item calibrations. The factor analyzedassessment categories were then ranked in order by difficulty basedon mean logits. The distribution of mean logits ranged from -.35 to0.78. Communicating assessment results was the easiest assessmentcategory. Interpreting standardized test results, conductingclassroom statistics, and using assessment results in decision makingconstituted the most difficult assessment categories.Nonachievement-based grading was more difficult than recommendedgrading practices, and performance assessment was more difficult thanpaper-pencil tests. The identification of the hierarchy of classroomassessment categories provided useful information for measurementtraining and teacher education in assessment. The findings justifiedongoing research on grading practices, and supported the call in theassessment community for a shift of instructional emphasis fromtraditional objective tests to alternative assessments. (Contains 2figures, 7 tables, and 53 references.) (Author/SLD)
**.A**AAAA*************************************************************** Reproductions supplied by EDRS are the best that can be made *
* from the original document. *
***********************************************************************

U.S. DEPARTMENT OF EDUCATIONOff ic f Educational Research and Improvement
ED ATIONAL RESOURCES INFORMATIONCENTER (ERIC)
This document has been reproduced asreceived from the person or organizationoriginating it.
CI Minor changes have been made toimprove reproduction quality.
Points of view or opinions stated in thisdocument do not necessarily representofficial OERI position or policy.
PERMISSION TO REPRODUCE ANDDISSEMINATE THIS MATERIAL
HAS BEEN GRANTED BY
Zfl, e Ne-706 Ziym,var
TO THE EDUCATIONAL RESOURCESINFORMATION CENTER (ERIC)
Teacher Assessment Competency: A Rasch Model Analysis
Zhicheng Zhang
Virginia Military Institute
Paper Presented at the Annual Meeting of American Educational Research Association
New York, April 10, 1996
2
BEST COPY AVAIlLABLE

Abstract
A 67-item Assessment Practices Inventory (API) was administered to 311 inserviceteachers. The application of a principal component analysis to the data yielded a six-factorsolution that explained 64% of the variance. The Rasch rating scale model was applied to theAPI to estimate item calibrations. The factor analyzed assessment categories were then rankedin order by difficulty based on mean logits. The distribution of mean logits ranged from -.35to .78. Communicating assessment results was the easiest assessment category. Interpretingstandardized test results, conducting classroom statistics, and using assessment results in decisionmaking constituted the most difficult assessment category. Nonachievement-based grading wasmore difficult than recommended grading practices. Performance assessment was more difficultthan paper-pencil tests.
The identification of the hierarchy of classroom assessment categories provided usefulinformation for measurement training. Teachers should receive more training and exercise inthe technical aspect of assessment such as interpreting standardized test results, evaluatingteacher-made tests, and developing performance assessment instruments. The findings justifiedthe ongoing research on grading practices. It also supported the call in the assessmentcommunity for a shift of instructional emphasis from traditional objective tests to alternativeassessments.

Teacher Assessment Competency: A Rasch Model Analysis
Introduction
The 1990s has witnessed marked changes in educational assessment. As part of the
educational reform movement cognitive psychologists and educators began to emphasize the
importance of higher order thinking skills which are not measured by simple recall items in
paper-pencil tests. The need to measure students' ability to apply knowledge in real life
situations, to cooperate with others, and to do hands-on activities gave rise to a new
emphasis on alternative assessment methods. In addition, the fact that 99% of the assessment
activities in the classroom are conducted by teachers called a shift of attention from large
scale standardized testing to classroom assessments (Stiggins, 1991b). With these changes
came the time for teachers to move into the center stage of classroom assessment (Stiggins,
1992a).
Research indicates that teachers spend up to 50% of their classroom time in
assessment related activities (Stiggins, 1991a). This underscores the need for a high level
assessment competency among classroom teachers. A few large-scale studies have been
conducted in recent years to investigate teacher competence of educational assessment.
These studies have invariably come to the conclusion that teachers' preparation for testing
and measurement is inadequate (Jett & Schafer, 1992; Newman & Stallings, 1982; Marso &
Pigge, 1989; Plake, 1993; Plake, Impara, & Fager, 1993; Wise, Lukin, & Roos, 1991).
Among the solutions proposed in these studies were strengthening measurement training for
preservice and inservice teachers and requiring an assessment component in teacher
certification.
What constitutes classroom assessments? Is there a hierarchy of difficulty to
classroom assessment techniques? What implications does it have on measurement training?
The present study attempts to address these questions.
Related Literature
Classroom Assessment Skills
What assessment skills should be included in a testing and measurement course to
ensure that preservice and inservice teachers are adequately trained? The answer to this
1

question will delineate the content domain of classroom assessment skills. Drawn from
measurement textbooks and published literature, Schafer (1991) specified eight content areas
in which teachers need to develop assessment skills:
1. Basic concepts and terminology of assessment. Teachers should understand
assessment concepts and correctly use terms such as objective tests, alternative assessments,
formative versus summative assessment, criterion-referenced versus norm-referenced testing
and grading, validity, and reliability (Airasian, 1994; Carey, 1994; Schafer, 1991).
2. Uses of assessment. Assessment can be used for planning and evaluating
instruction, diagnosing problem areas, monitoring progress, grouping students, assigning
grades, developing curriculum, and evaluating school improvement (Burry-Stock, 1995;
Stiggins, 1987).
3. Assessment planning and development. To plan assessment, the teacher needs to
consider students' ability level, specify assessment targets, and choose appropriate assessment
methods (Airasian, 1994; Carey, 1994; Stiggins, 1992b). Writing objectives and designing
test specifications are two important devices at assessment planning stage to ensure validity
and reliability of assessment (Burry-Stock, 1995; Zhang & Iran-Nejad, 1993). Three major
assessment methods are paper-pencil tests, performance measures, and informal assessment
(Stiggins, 1992b). The first two methods are considered formal and the last one informal
(Airasian, 1994).
4. Interpretation of assessments. To properly interpret standardized test results,
teachers need to have a good understanding of the meaning and limitations of standard scores
such as percentile rank, grade equivalent score, normal curve equivalent, and stanine. They
should understand the concept of standard error of measurement and be able to use this
concept in explaining a percentile band-of-error. In addition, teachers should know how to
judge the adequacy of test norms and use norms to evaluate an individual's performance
(Airasian, 1994; Carey, 1994; Schafer, 1991).
5. Description of assessment results. This content area involves the application of
basic statistical analysis to classroom assessment data.
6. Evaluation and improvement of assessments. The teacher should be able to use
2

assessment data to analyze the quality of a test (validity and reliability) and test items (item
analysis) (Carey, 1994; Gregory, 1996).
7. Feedback and grading. When assigning grades, teachers need to make three
decisions: the grading model to be used (criterion-referenced versus norm-referenced),
performance components to be included in grades (achievement-related versus
nonachievement-related), and the weight each component should receive (Airasian, 1994).
Criterion-referenced grades indicate mastery level of teaching objectives whereas norm-
referenced grades suggest an individual's relative standing in a class. To produce valid
grades, teachers should only include achievement-related components in the calculation of
final grades. Assessment components that reflect effort, ability, attitude, and motivation
should not be included in subject matter grades because they are hard to define and measure
(Stiggins, Frisbie, & Griswold, 1989). Assessment components that provide more
information about students' academic achievement and learning (e.g., final exam) should
receive more weights (Airasian, 1994; Carey, 1994). The methods that can be used to
integrate different assessment components to determine the final grades include percentage
method, weighted method, and maximum point method (Carey, 1994). When called upon,
teachers should explain to students, parents, and other educational personnel the meaning,
implication, and limitation of the grading system they use to determine grades.
8. Ethics of assessment. Teachers should guard against overuse and misuse of
assessment results. Students' right to fair testing and confidentiality should be protected
(Plake, 1993).
These assessment skills summarized the expectations of the assessment community for
classroom teachers. In 1990, the American Federation of Teachers (AFT), the National
Council on Measurement in Education (NCME), and the National Education Association
(NEA) issued the seven Standards for Teacher Competence in Educational Assessment of
Students. The seven Standards incorporated various assessment skills addressed in
measurement textbooks and assessment literature. According to the seven Standards,
teachers should be skilled in
1. choosing assessment methods,
2. developing assessment methods,

3. administering, scoring, and interpreting assessment results,
4. using assessment results in decision making,
5. grading,
6. communicating assessment results, and
7. ethics in assessment.
The seven Standards were intended to guide teacher evaluation and measurement training.
Research revealed that teachers are not well prepared to meet classroom assessment
demands as specified in the seven Standards (Stiggins, 1991a) due to inadequate measurement
training (Goslin, 1967; Hills, 1991; Jett & Schafer, 1992; O'Sullivan & Chalnick, 1991;
Roeder, 1972; Wolmut, 1988). Problems can be found in different aspects of classroom
assessment.
Stiggins (1992a) conducted qualitative research with a group of teachers teaching
math, science, speaking, and writing in second, fifth, eighth, and eleventh grades. Seventy-
eight percent of the teachers reported using performance assessment in their classroom.
However, one third of these teachers did not define levels of performance or plan scoring
procedures in advance, nor did they inform students of performance evaluation criteria.
About 50% of the teachers did not record their scoring during assessment. These practices
were not in line with recommended performance assessment methods.
Teachers were not well trained to use standardized tests in their classrooms (Marso
and Pigge, 1988). Many teachers did not know that standardized tests and teacher-made tests
should differ in terms of test administration (Vanleirsburg and Johns, 1991). Fifty-five
percent of the teachers in Hall and Kleine's (1992) study reported engaging in inappropriate
practices of teaching test items, increasing time limits, giving hints, and changing students'
answers. The pressure for teachers to raise standardized test scores through means other
than instructional improvement was also widely reported by the teachers in another study by
Nolen, Haladyna and Haas (1992). In addition, most teachers had trouble understanding and
interpreting standard scores such as percentile rank and grade equivalent score (Hills, 1991).
Impara, Divine, Bruce, Liverman, and Gay (1991) reported, based on their experimental
study, that most teachers were weak in interpreting a percentile band profile even with the
help of interpretive information.
4

1,
Grading criteria used by teachers were often arbitrary and mysteries (Wiggins, 1988).
Stiggins, Frisbie, and Griswold (1989) discovered that 80% of teachers in 15 high schools in
their study felt that effort, attitude, and motivation should be considered in grading; 50% of
them indeed incorporated ability into grades. Fifty percent of the teachers studied did not
distinguish between formative and summative data and thus did not use weights to reflect the
relative importance of assessment components. All teachers used subjective nonachievement
factors to make decisions about borderline cases. Griswold suggested that teachers
incorporated social-cognitive learning and attribution theories into their grading belief system
and practice when they graded on nonachievement factors of efforts and attitude. It was not
clear, however, how teachers operationally define and assess these intrinsic dispositions.
Rasch Rating Scale Model
Rasch model is a family of item response theory (IRT) models that assume,that item
difficulty is the only item characteristic affecting an individual's performance on a test item
(Rasch, 1960). Like all IRT models, Rasch model has the advantage of offering a sample-
free item parameter estimate, a test-free ability parameter estimate, and a standard error of
measurement for each individual item (Hambleton, Swaminathan, & Roger, 1991). Rasch
rating scale model is appropriate for measurement instruments with fixed response format
(Wright & Masters, 1982). When fixed response format is used, the relative difficulties of
the response categories should be invariant. Thus, the formula for the Rasch rating scale
model according to Wright and Masters is
k
Eexp EI 13 - (Si + t1)]k=0 j=0
where
0= 0 so that exp 11311 (5, =
j=0
5

4 i
13, = ability estimate for examinee it
5; = scale value estimate for item I.
Ti= threshold estimate for category j, this is done for m + 1 categories
exp = raising the irrational number e to the natural log (1982, p. 49).
When a rating scale is analyzed using this model, it is possible to obtain an ability estimate for
each examinee, a difficulty estimate for each item, and estimates of response "thresholds" T/ T1, -,for m+1 categories (Wright & Masters, 1982).
Rasch model has been used in quite a few validation studies. In Harvey-Beavis' study
(1994), a Spelling Developmental Continuum was designed according to the published
judgementS of experts. The instrument consisted of phases called indicators describing
behaviors associated with literacy acquisition for children. To establish the extent of
accuracy of the Spelling Continuum, teachers were asked to provide empirical evidence by
recording whether their students exhibited the spelling behaviors specified in the instrument.
The data were analyzed under the Rasch model. The greater the number of students
displaying a behavior described by an indicator, the easier that indicator was estimated to be.
Ideally, the early phase of spelling development should have indicators with low scale values
(easy tasks) and the last phase should have indicators with high scale values (difficulty tasks).
Kenyon (1995) used a two-facet Rasch rating scale model to validate a self-assessment
instrument of foreign language speaking ability. The instrument was designed in accordance
with the Speaking Proficiency Guidelines of the American Council on Teaching of Foreign
Languages (ACTFL). Rasch model was used to first determine difficulty parameter for each
speaking task (item) and then compare the scaling of speaking tasks presented by the self-
assessment with their a priori hierarchy ordering specified by the guidelines of the ACTFL.
The study attempted to determine whether foreign language students perceived the difficulty
of performing speaking tasks in a manner consistent with their hierarchy ordering as
specified in the guidelines.
In Zhu and Kurz's (1995) study, Rasch Partial Credit modeling was used to confirm
the theory of developmental sequence in motor development. Rasch Partial Credit model
was applied to the calibration of a motor development instrument. Zhu and Kurz concluded
6

that the features of the theory of developmental sequence such as hierarchical change,
hierarchical integration, and intransitive were well demonstrated through the Rasch modeling.
Even though the three studies differed in content area, they all used the scaling of the
items on an instrument as an empirical evidence to validate the developmental sequence
suggested by the instrument.
The present study was based on the theoretical framework of classroom assessment in
the literature and the seven Standards. Different from most other research endeavors in
classroom assessment, the study attempted to determine the hierarchy of teacher assessment
competency with Rasch model. The results of the study would provide valuable information
for measurement training.
Methodology
Instrumentation
The instrument used in the study was the Assessment Practices Inventory (API)
designed by Zhang and Burry-Stock (1994). After three pilot studies and numerous
revisions, the current version of the API had 67 items each of which described a classroom
assessment practice. A 5-point scale ranging from "NOT AT ALL SKILLED" to "HIGHLY
SKILLED" was used for the subjects to self-report their perceived skill level in carrying out
classroom assessment activities as specified by the 67 items. The statistical analysis of the
data from 311 inservice teachers yielded a Cronbach alpha coefficient of .97, indicating the
instrument had a high measure of reliability. All item-to-total correlations were above .37
with the highest one being .69. The standard error of measurement was 7.7.
The content validity of the API was built into the construction process by developing
the items according to the seven Standards for Teacher Competence in Educational
Assessment of Students and assessment literature. The construct validity of the API was
supported by strong item-to-total correlations (81% of the items were above .50) (Gregory,
1996) and a moderate distribution of item calibrations along a continuum of -.89 to 1.31
(Wright & Stone, 1979).
Sample
The sample was made up of 311 inservice teachers who came mainly from two local
school districts in Alabama. The numbers of elementary, middle school/junior high, and high
7

-1 r
schools participating in the study were 6, 4, and 6, respectively. A vocational school was
also included in the data collection. This was done to ensure a balanced representation of
teachers from different grade levels. The subjects were primarily white (89%) and female
(77.4%). The percentages of elementary, junior high/middle school, and high school
teachers were 34, 23, and 30, respectively. The remaining 13% were for comprehensive and
other types of schools. Forty percent of these teachers obtained a bachelor's degree, another
56% had a Master's degree. About 28% of the inservice teachers had had one measurement
course, 45% of them had taken 2-3 measurement courses. The average number of years of
teaching was 10.9.
Data Collection
Data were collected in March, 1995. The instrument, together with a cover letter and
computer scanable answer sheet, was distributed to the teachers by their school principal at a
faculty meeting. Since directions were clearly provided in written form, participants
responded to the instrument on their own. Those who voluntarily responded to the
instrument returned the completed answer sheets to the school secretary. The return rate was
approximately 30%.
Data Analysis
Principal component analysis was used to check IRT assumptions of unidimensionality
and local independence. The Rasch rating scale model computer program BIGSTEPS
(Linacre & Wright, 1994) was used to estimate item calibrations for the 67 items of the API.
Based on principal component analysis, the 67 items were grouped into assessment categories
each of which was represented by a factor. The difficulty of each assessment category was
then determined by calculating the mean calibration of the items belonging to that category.
The analysis would reveal how inservice teachers perceived the relative difficulty of
assessment categories.
Results
IRT Assumption Check
A principal component analysis of the data indicated that the first principal component
accounted for 31.83% of the variance. This number met Recase's (1979) criterion that 20
percent of the variance should be explained by the first principal component. Thus, it was
8

r
concluded that unidimensionality assumption was satisfied. Since the instrument was
unidimensional, it followed that the assumption of local independence would hold (Lord &
Novick, 1968).
Principal Component Analysis
The application of principal component analysis to the data with principal axis method
of extraction and a varimax orthogonal rotation yielded a six-factor solution. The six-factor
solution best represented the initial classification of assessment categories while meeting the
criterion of eigenvalues greater than one (Kaiser, 1960). The six factors accounted for
53.14% of the variance. The six factors were:
1. Develop and adthinister paper-pencil tests, choose tests for classroom use,
2. Interpret standardized test results/conduct classroom statistics, use assessment
results in decision making,
3. Communicate test results, ethics in assessment,
4. Develop and use performance assessment, informal assessment,
5. grading, and
6. Nonachievement based grading.
Insert Table 1 Here
Table 1 shows rank ordered factor loadings of individual items for the six factor
solution. For each factor, only high loadings (greater than .33) selected by the computer
program are presented. The final communality estimates for each item, the sum of squared
factor loadings for each factor, and the percent of variance explained by each factor are also
presented.
Rasch Rating Scale Model Analysis
Data-to-Model Fit. Data-to-model fit was not as satisfactory as expected. The
analysis of 311 persons indicated that about 10% of the persons had infit and outfit mean-.
square values greater than 1.6. This occurred when some high-ability persons unexpectedly
failed some of the easier items or some low-ability persons passed some of the harder items
(Wright & Stone, 1979). About 8% of the items had infit and outfit mean-square values
9

greater than 1.4. A "misfit" item often indicates that the item is poorly defined. Since the
study was mainly interested in obtaining sample-free item calibration, it was decided to
remove misfiting persons in order to improve the precision of item estimates. After 41% of
the persons and 13% of items were removed, all the items except five (31, 32, 34, 35, and
49) had infit and outfit mean-square values equal to or less than 1.27 and 1.28, respectively.
The five items whose infit mean-square values fell within the range of 1 to 1.53 and whose
outfit mean-square values fell within the range of 1 to 1.68 were of some concern to the
researcher. However, since the five items were important to research questions, they were
kept for data analysis.
The deletion of misfiting persons and items was an interactive process. What was
noticed in this process was that misfiting was a relative phenomenon. This was particularly
true for person analysis. After the top 10% of the misfiting persons were delected and the
analysis was reconducted on the reduced sample, some other persons were found to have
increased infit and outfit statistics, almost as high as those of the items that had been deleted.
This explained why some persons still had high infit and outfit mean-square values after
numerous deletions. Nevertheless, the fit statistic analysis and subsequent person and item
deletion resulted in improved person mean infit and outfit statistics (infit ZSTD was reduced
from 3.0 to 1.9, outfit ZSTD was reduced from 2.8 to 1.8) and item mean infit and outfit
statistics (infit ZSTD was reduced from 2.7 to 1.9, outfit ZSTD was reduced from 2.9 to
1.9). The information about person mean statistics, corrected person reliability measure,
item mean statistics, and corrected item reliability measure are presented in Tables 2 and 3,
respectively. The fit statistics for average step measures also dropped from the original
range of 1.40 to .93 to the current range of 1.24 to .95, indicating the improvement in
measurement precision. This information is presented in Table 4.
Insert Tables 2, 3, and 4 Here
Estimates of Item Difficulty and Person ability. After misfiting persons and items
were removed, item calibrations ranged from -1.23 to 1.23. The most difficult item was
"calculating test statistics" and the easiest item was "administering standardized tests".
10

Person Ability estimates ranged from -2.56 to 6.88. The distributions of persons and items
are presented in Figure 1. The average step measures for steps 1 through 5 ranged from
-.89 to 2.64 (Table 4). The category (steps) probability curves are presented in Figure 2.
Insert Figures 1 and 2 Here
Item calibrations, item infit and outfit mean-square values, and item labels are presented in
Table 5. The number at the beginning of each item label indicates the factor on which the
item is heavily loaded. Person measures are presented in Table 6.
Insert Tables 5 and 6 Here
Ranking Assessment Categories by Rasch Model Analysis
Based on the principal component analysis, the 67 items of the API were classified
into six assessment categories each of which was represented by a factor. Based on the
Rasch model analysis, the item calibrations of the 58 items (nine items were deleted due to
misfit) were estimated. To get a better idea of the difficulty of each assessment category, the
mean logit of the items belonging to a category was calculated. The six categories were then
ranked in order by their mean logit values. The factor analyzed assessment categories and
their mean logits are presented in Table 7.
Insert Table 7 Here
Of the six assessment categories, interpreting standardized test results/conducting
classroom statistics and using assessment results in decision making were perceived to be the
hardest category by inservice teachers and communicating assessment results was considered
to be the easiest. The result confirmed previous research findings that teachers were weak in
interpreting test results even with the help of interpretative information (Hills, 1991; Impara,
Divine, Bruce, Liverman, & Gay, 1991). Notice the category at the top of the hierarchy of
difficulty also involved technical issues such as conducting item analysis and calculating
11
14

central tendency and variability. The current finding in a way provided an explanation for
Marso and Pigge's (1989) report that 44% of the teachers in their study never or rarely
conducted item analysis and 60% of them never or rarely estimated test reliability for
teacher-made tests.
Nonachievement based grading practices had the second highest mean logit, higher
than regular grading category. This finding was not surprising to the assessment community.
Grading practice has long been the focus of classroom assessment research. Much research
has been generated to address the difference between the recommended practice of grading
on achievement-related factors and the classroom reality of incorporating nonachievement-
related factors in grading. The current finding justified the ongoing research endeavor to
reduce the difference. Teachers found it hard to grade on nonachievement factors of effort,
ability, and behavior even though they incorporated these factors in grading (Stiggins,
Frisbie, & Griswold, 1989; Zhang, 1995). A possible reason for this was that teachers
realized that nonachievement factors were hard to define thus their judgement may be
subjective (Griswold, 1993).
Another interesting but not surprising finding was that performance assessment was
perceived to be harder than paper-pencil tests. The finding challenged the traditional
measurement training program in which paper-pencil tests played a dominant role. If
teachers considered performance assessment to be more difficult than objective tests, they
should receive more training in alternative assessment methods. The current finding lent
support to Stiggins' (1991b) comment that the new educational assessment era in the 1990s
called for a shift of instructional emphasis in measurement training from traditional objective
tests to alternative assessments.
Discussion and Conclusion
The present study was built on the theoretical framework of classroom assessment
literature. Rasch rating scale modeling and principal component analytic technique were
used to first obtain sample-free item calibrations and then determine the hierarchy of
classroom assessment categories. The ranking of assessment categories provided us an
opportunity to reexamine the design of measurement training program and pointed out
directions for improvement.
12
15

Assessment practices requiring technical training and expertise remained to be the most
difficult category. Interpreting standardized test results, determining the validity of
standardized tests for classroom use, conducting item analysis and test evaluation for teacher-
made tests constituted this category. Obviously teachers need a lot more training and
exercise than what is normally provided in interpreting test results, evaluating tests, and
using assessment results in decision making. Efforts have been made recently to address this
problem. Based on the results from a national survey of teacher assessment competency
(Plake, 1993), the NCME (1994) has embarked on producing and testing measurement
training materials Communicating and Interpreting Assessment Results. Hopefully, the
release of the final product will provide adequate resource materials in this category for
measurement training.
Teachers reported using performance assessment in their classroom (Stiggins, 1992b);
yet the present study indicated that they considered themselves less skilled in using
performance assessment than using paper-pencil tests. The finding lent support to the call
for a shift of instructional emphasis from traditional objective tests to alternative assessments
(Stiggins, 1991b). Recent measurement textbooks have incorporated alternative assessment
methods with examples (e.g., Airasian, 1994; Carey, 1994). More exploration into the area
is needed both theoretically and technically. Recently published research on the development
of performance assessment (e.g., Baron, 1991; Brandt, 1992; Dunbar, Koretz, & Hoover,
1991; Meyer, 1992; Quellmalz, 1991; Shavelson, Baxter, & Pine, 1991; Stiggins, 1987) has
made a significant contribution to the assessment literature. Measurement training programs
should utilize these resources to strengthen the alternative assessment component in teacher
assessment education.
The study was one of the few research endeavors that sought to investigate and facilitate
the implementation of the seven Standards issued by the AFT, NCME, and NEA (1990).
One inference that could be made based on the present study was that the seven Standards
did not carry equal weights. The seven. Standards suggested a sequence in application from
choosing assessment methods (Standard 1) or developing assessment methods (Standard 2) to
administering and scoring tests, interpreting test results (Standard 3), using assessment results
in decision making (Standard 4), grading (Standard 5), communicating test results (Standard
13

6), and meeting ethical standards (Standard 7). However, no assumption should be made
that the seven Standards are of equal importance . Since performance assessment and paper-
pencil tests, both related to Standard 2, emerged as two separate assessment categories in the
present study, it was concluded that Standard 2 carried more weight than other standards.
Standards 1 and 7, on the other hand, did not emerge as separate categories. Instead, they
were incorporated into other assessment categories. The message here seemed to suggest
that, while using the seven Standards as the general guidelines, measurement training
programs should adjust the instructional emphasis on the seven Standards and thus
accommodate the real needs of classroom teachers.
Since the self-report inventory was used only with 311 inservice teachers mainly from
two school districts, the present research findings should be interpreted with caution. A
larger and more representative sample is desired to replicate the study. The design of the
study can also be improved by' using objective evaluation methods (e.g., evaluating teachers'
assessment behaviors and products) instead of self-report technique.
14
References
American Federation of Teachers, National Council on Measurement in Education, &
National Education Association. (1990). Standards for teacher competence in educational
assessment of students. Washington, DC: National Council on Measurement in
Education.
Airasian, P. W. (1994). Classroom assessment. McGraw-Hill, Inc.
Baron, J. B. (1991). Strategies for the development of effective performance exercises.
Applied Measurement in Education, 4(4), 305-318.
Brandt, R. (1992). On performance assessment: A conversation with Grant Wiggins.
Educational Leadership, 49(8), 35-37.
Burry-Stock, J. A. (Ed.). (1995). BER 450 Handbook. Tuscaloosa, AL: The University of
Alabama.
Carey, L. M. (1994). Measuring and evaluating school learning. Allyn and Bacon.
Dunbar, S. B., Koretz, D. M., & Hoover, H. D. (1991). Quality control in the
development and use of performance assessments. Applied Measurement in Education,
4(4), 289-303.
Gregory, R. J. (1996). Psychological Testing History. Principles, and Applications. MA:
Allyn Bacon.
Goslin, D. A. (1967). Teachers and testing. New York: Russell Sage Foundation.
Griswold, P. A. (1993). Beliefs and inferences about grading elicited from students
performance sketches. Educational Assessment, 1(4), 311-328.
Haladyna, T. M., Haas, N. S., & Nolen, S. B. (1989). Test score pollution. Technical
Report 89-1. Phoenix: Arizona State University West.
Hall, J. L. & Kleine, P. F. (1992). Educators' perceptions of NRT misuse. Educational
Measurement: Issues and Practice, 11(2), 18-22.
Hambleton, R. K., Swaminathan, H., & Rogers, H. J. (1991). Fundamentals of item
response theory. Newbury Park, CA: Sage Publications.
Harvey-Beavis, A. (1994, April). Analyzing teacher judgments with the Rasch model:
Their contribution to the construction of Continua to assess literacy developments in
the early years of school. Paper presented at the annual meeting of the American
15
18
Educational Research Association, New Orleans, LA.
Hills, J. R. (1991). Apathy concerning grading and testing. Phi Delta Kappa. 72(7),
540-545.
Impara, J. C., Divine, K. P., Bruce, F. A., Liverman, M. R., & Gay, A. (1991). Does
interpretive test score information help teachers? Educational Measurement Issues
and Practice, n(4), 16-18.
Jdtt, D. L. & Schafer, W. D. (1992). Classroom teacher move to center stage in the
assessment area--ready or not. Paper Presented at American Educational Research
Association. ED 346144.
Kaiser, H. F. (1960). The application of electronic computers to factor analysis.
Educational and Psychological Measurement, 20(1), 141-151.
Kenyon, D. M. (1995, April). Using Rasch analysis to examine a student self-assessment of
foreign language speaking proficiency. Paper presented at the annual meeting of the
American Educational Research Association. San Francisco, CA.
Linacre, J. M. & Wright, B. D. (1994). A user's guide to BIGSTEPS. MESA Press:
Chicago.
Lord, F. M. & Novick, M. R. (1968). Statistical theories of mental test scores. Reading,
MA: Addison-Wesley.
Marso, R. N. & Pigge, F. L. (1988). Standardized and competency testing programs:
Classroom teachers' needs and proficiencies as viewed by principals and supervisors.
Paper presented at Mid-West Educational Research Association. ED 304473.
Marso, R. N. & Pigge, F. L. (1989). Staff development Implications from a state-wide
assessment of classroom teachers' testing skills and practices. Paper presented at
Mid-Western Educational Research Association. ED 312309.
Meyer, C. A. (1992). What's the difference between authentic and performance assessment?
Educational Leadership. 42(8), 39-40.
National Council on Measurement in Education. (1994). Communicating and interpreting
assessment results.
Newman, D. C. & Stallings, W. M. (1982). Teacher competency in classroom testing,
measurement preparation. and classroom testing practices. Paper presented at NCME.
16
19

ED 220491.
Nolen, S. B., Haladyna, T. M., & Haas, N. S. (1992). Uses and abuses of achievement
test scores. Educational Measurement: Issues and Practice.11(2), 9-15.
O'Sullivan, R. G. & Chalnick, M. K. (1991). Measurement related coursework
requirements for teacher certification and recertification. Educational Measurement:
Issues and Practice, 1Q(1), 17-19, 23.
Plake, B. S. (1993). Teacher assessment literacy: Teachers' competencies in the educational
assessment of students. Mid-Western Educational Researcher. k(1), 21-27.
Plake, B. S., Impara, J. C. & Fager, J. J. (1993). Assessment competencies of teachers: A
national survey. Educational Measurement: Issues and Practice. Winter, 10-12.
Quellmalz, E. S. (1991). Developing criteria for performance assessments: The missing
link. Applied Measurement in Education, 4(4), 319-331.
Rasch, G. (1960). Probabilistic models for some intelligence and attainment tests.
Copenhagen: Danish Institute for Educational Research.
Reckase, M. (1979). Unifactor latent trait models applied to multi-factor tests: Results and
implication. Journal of Educational Statistics, 4, 207-230.
Reeder, H. H. (1972). Are today's teachers prepared to use tests? Peabody Journal of
Education. 52, 239-240.
Schafer, W. D. (1991). Essential assessment skills in professional education of teachers.
Educational Measurement: Issues and Practice, 10(1), 3-6.
Shavelson, R. J., Baxter, G. P., & Pine, J. (1991). Performance assessment in science.
Applied Measurement in Education, 4(4), 347-362.
Stiggins, R. J. (1987). Design and development of performance assessments. Educational
Measurement: Issues and Practice, 6(3), 33-42.
Stiggins, R. J., Frisbie, D. A., & Griswold, P. A. (1989). Inside high school grading
practices: Building a research agenda. Educational Measurement: Issues and Practice,
8(2), 5-14.
Stiggins, R. J. (1991a). Relevant classroom assessment training for teachers. Educational
Measurement: Issues and Practice, n(1), 7-12.
Stiggins, R. J. (1991b). Facing the challenges of a new era of educational assessment.
17

Applied Measurement in Education, 4(4), 263-272.
Stiggins, R. J. (1992a). In teachers' hands: Investigating the practices of classroom
assessment. Albany: State University of New York Press.
Stiggins, R. J. (1992b). High quality classroom assessment: What does it really mean?
Educational Measurement: Issues and Practice, 11(2), 35-39.
Vanleirsburg, R. & Jones, J. L. (1991, December). Assessment literacy: Perceptions of
preservice and inservice teachers regarding ethical considerations of standardized
testing procedures. Literacy Research Report No. 12. ED 341666.
Wiggins, G.(1988). Rational numbers: Toward grading and scoring that help rather than
harm learning. American Educator, 12, 20-25, 45-48.
Wise, S. L., Lukin, L. E., & Roos, L. L. (1991). Teacher beliefs about training in testing
and measurement. Journal of Teacher Education, 42(1), 37-42.
Wolmut, P. (1988). On the matter of testing misinformation. Paper presented at the SRA,
Inc, Invitational conference, Phoenix, Az.
Wright, B. D. & Stone, M. H. (1979). Best test design. MESA Press: Chicago.
Wright, B. D. & Masters, G. (1982). Rating scale analysis Rasch measurement. MESA
Press: Chicago.
Zhang, Z. & Iran-Nejad, A. (1993, November). A thematic approach to teaching tests and
measurement. Paper presented at the annul meeting of Mid-South Educational Research.
New Orleans, LA.
Zhang, Z. & Burry-Stock, J. A. (1994). Assessment practices inventory. Tuscaloosa, AL:
The University of Alabama.
Zhang, Z. (1995). Investigating teachers' perceived assessment practices and assessment
competencies on the assessment practices inventory (API). Unpublished doctoral
dissertation. AL: The University of Alabama.
Zhu, W. & Kurz, K. A. (1995, April). Rasch partial credit modeling for theory of
development sequence. Paper presented at the annual meeting of the American
Educational Research Association. CA: San Francisco.
18
21

Table 1
A Principal Component Analysis of the API: A Six-Factor Solution With aVarimax Rotation
FACTOR1
N=311
FACTOR2 FACTOR3 FACTOR4 FACTORS FACTOR6 COMMUNALITY
ESTIMATE
ITEM15 .74 .63
ITEM14 .74 .64
ITEM12 .72 .67
ITEM13 .71 .57
ITEM16 .69 .64
ITEM4 .65 .59
ITEM17 .63 .58
ITEM5 .55 .41
ITEM2 .55 .44
ITEM32 .53 .53
ITEM18 .50 .59
ITEM49 .50 .57
ITEMS .49 .37
ITEM19 .47 .52
ITEM52 .43 .45
ITEM64 .37 .35
ITEM35 .73 .57
ITEM36 .71 .60
ITEM34 .70 .56
ITEM33. .68 .63
ITEM37 .67 .56
ITEM38 .65 .61
ITEM46 .61 .54
ITEM43 .54 .49
ITEM40 .51 .57
ITEM39 .50 .61
ITEM47 .49 .52
ITEM25 .49 .39
ITEM9 .48 .38
ITEM8 .47 .35
ITEM67 .64 .50
ITEM66 .61 .46
ITEM65 .55 .48
ITEM41 .54 .54
ITEM62 .54 .50
ITEM61 .50 .46
ITEM63 .50 .46
ITEM60 .47 .50
ITEM42 .46 .52
ITEM11 .40 .46
ITEM1 .40 .41
ITEM59 .38 .42

Table 1 Continued
A Principal Component Analysis of the API: A Six-Factor Solution With aVarimax Rotation
FACTOR1
N=311
FACTOR2 FACTOR3 FACTOR4 FACTOR5 FACTOR6 COMMUNALITY
ESTIMATE
ITEM28 .74 .70
ITEM29 .74 .68
ITEM27 .67 .62
ITEM30 .64 .61
ITEM24 .61 .49
ITEM26 .59 .62
ITEM31 .58 .48
ITEM? .56 .49
ITEM6 .50 .45
ITEM21 .49 .61
ITEM22 .46 .51
ITEM10 .44 .56
ITEM45 .59 .57
ITEM44 .56 .57
ITEM48 .49 .57
ITEM58 .45 .37
ITEM51 .44 .54
ITEM23 .44 .49
ITEM20 .40 .48
ITEM54 .77 .67
ITEM56 .77 .70
ITEM55 .74 .65
ITEM57 .69 .55
ITEM53 .65 .61
ITEM50 .33 .35
SUM OF SQUARED 8.09 6.76 6.26 6.10 4.24 4.16 35.61
FACTOR LOADINGS
% OF VARIANCE 12.07 10.09 9.34 9.10 6.33 6.21 53.15
EXPLAINED
20

Table 2
SUMMARY OF 182 MEASURED (NOW-EXTREME) PERSONS
RAWSCORE COUNT
MODELMEASURE ERROR
INFIT OUTFITNNW ZSTD HMSO ZSTD
MEAN 144.8 57.4 .74 .19 1.03 .1 1.01 .1
S.D. 35.5 3.6 1.27 .08 .36 1.9 .36 1.8
MODEL RMSE .20 ADJ.SD 1.25 SEPARATION 6.18 PERSON RELIABILITY .97
REAL RMSE .22 ADJ.SD 1.25 SEPARATION 5.77 PERSON RELIABILITY .97
S.E. OF PERSON MEAN .09WITH 1 EXTREME PERSONS = 183 PERSONS
MODEL RMSE .24 ADJ.SD 1.25 SEPARATION 5.14 PERSON RELIABILITY .96
REAL RMSE .25 ADJ.SD 1.24 SEPARATION 4.90 PERSON RELIABILITY .96
Table 3
SUMMARY OF 58 MEASURED (NON-EXTREME) ITEMS
RAWSCORE COUNT
MODELMEASURE ERROR
INFIT OUTFITMNSQ ZSTD HMSO ZSTD
MEAN 634.4 180.1
S.D. 64.8 1.6.00 .10.59 .01
1.01 .1 1.01 .1
.20 1.9 .21 1.9
MODEL RMSE .10 ADJ.SD .58 SEPARATION 5.90 ITEM RELIABILITY .97
REAL RMSE .10 ADJ.SD .58 SEPARATION 5.63 ITEM RELIABILITY .97
S.E. OF ITEM MEAN .08
Table 4
SUMMARY OF MEASURED STEPS
CATEGORY STEP OBSERVEDLABEL VALUE COUNT
AVGE OUTFIT O8 /EXMEASURE MNSQ FIT
STEPMEASURE
STEPERROR
EXPECTED SCORE MEASURESSTEP-.5 AT STEP STEP+.5
THURSTONETHRESHOLD
CATEGRESIDUL
1 1 415 -.89 3.88 1.24 NONE ( -3.22) -2.41 -1.1
2 2 1461 -.37 1.72 1.04 -1.95 .06 -2.41 -1.48 -.84 -2.16 -1.1
3 3 2406 .15 .72 1.00 -.60 .03 -.84 -.25 .42 -.76 .9
4 4 4592 .90 .51 .92 -.11 .02 .42 1.40 2.82 .21 2.5
5 5 1574 2.64 1.47 .95 2.66 .03 2.82 ( 3.81) 2.72 -1.2awls I mann math nr
OB/EX FIT IS "OBSERVED MNSG / EXPECTED NNW"
BEST COPY AVAILABLE
21

Table 5
ITEMS STATISTICS: MEASURE ORDER
ENTRYNUM
RAWSCORE COUNT MEASURE ERROR
INFITMNS0 ZSTD
OUTFITMNS0 ZSTD PTBIS ITEMS
35 486 178 1.23 .09 1.51 5.3 1.68 6.7 .42 2test statistics36 516 180 1.03 .09 1.25 2.6 1.23 2.3 .58 2item analysis46 510 178 1.03 .09 .85 -1.6 .86 -1.4 .67 2NR grading31 521 180 .98 .09 1.40 4.2 1.47 4.6 .53 4portfolios8 531 182 .95 .09 1.20 2.1 1.27 2.6 .49 2validity of SAT9 531 182 .95 .09 1.09 .9 1.11 1.1 .58 2UTS planning37 531 180 .91 .09 1.08 .8 1.08 .8 .60 2item revision34 539 179 .82 .09 1.38 3.9 1.46 4.5 .52 2pband interpret47 545 178 .75 .09 1.04 .5 1.06 .6 .61 2CR grading38 555 180 .72 .09 1.00 .0 1.06 .6 .61 2SAT diagnose19 564 182 .69 .09 1.18 1.9 1.21 2.1 .63 lessay scoring24 568 181 .64 .09 .97 -.3 1.04 .4 .59 4PA scoring22 579 181 .54 .09 .90 -1.1 .91 -.9 .61 4PA criteria define43 569 178 .54 .09 .78 -2.3 .75 -2.4 .69 2decision school33 584 180 .48 .09 1.27 2.7 1.28 2.6 .57 2SAT interpret18 591 182 .47 .09 .84 -1.6 .82 -1.7 .63 lcognitive levels40 604 180 .32 .09 .77 -2.3 .75 -2.3 .69 2decision curriculum17 612 182 .30 .09 .94 -.5 1.04 .4 .64 lessay items55 601 178 .29 .09 1.24 2.3 1.26 2.3 .53 6grading on improvement23 627 180 .11 .10 .90 -.9 .90 -.9 .61 5PA criteria communicate48 627 178 .05 .10 .95 -.5 .93 -.6 .69 5borderline grading53 628 178 .04 .10 .98 -.2 .96 -.4 .56 6grading on ability63 630 178 .02 .10 .95 -.4 .94 -.5 .61 3communicate to educators20 640 181. .02 .10 .95 -.5 .99 -.1 .64 5test sampling64 627 177 .02 .10 .95 -.5 1.06 .5 .57 lethics in test preparation5 645 181 -.04 .10 1.17 1.6 1.23 1.9 .55 lunannounce quizz
39 644 180 -.04 .10 .91 -.8 .92 -.7 .62 2decision teaching42 642 179 -.07 .10 .73 -2.5 .70 -2.4 .70 3decision classroom56 642 178 -.09 .10 1.12 1.1 1.11 .9 .51 6grading on efforts62 643 178 -.10 .10 .93 -.6 .95 -.4 .66 3communicate to parents2 663 182 -.16 .10 1.15 1.3 1.17 1.3 .53 1select test items
41 653 179 -.17 .10 .84 -1.5 .83 -1.4 .62 3decision Ind.1 665 182 -.18 .10 .91 -.8 .94 -.5 .53 3choose assessments29 662 181 -.19 .10 .84 -1.5 .84 -1.3 .64 4group hands-on45 658 179 -.22 .10 1.02 .2 .97 -.2 .61 5grading philosophy27 667 181 -.24 .10 .84 -1.5 .83 -1.4 .65 4group participation30 664 180 -.25 .10 .75 -2.2 .73 -2.1 .69 4ind. presentation21 670 181 -.26 .10 .63 -3.4 .63 -2.9 .72 4PA validity15 674 182 -.27 .10 .96 -.3 .98 -.1 .58 1T/F items44 665 179 -.29 .10 1.06 .5 .99 .0 .63 5systematic grading6 681 182 -.34 .10 1.23 2.0 1.23 1.8 .49 4questioning
13 685 182 -.39 .10 1.09 .8 1.08 .6 .59 1MC items51 674 179 -.39 .10 .98 -.2 .94 -.4 .66 5weighted grading
3 686 182 -.40 .10 1.25 2.2 1.24 1.9 .49 1revise tests60 673 178 -.41 .10 .88 -1.1 .84 -1.2 .67 3written feedback10 688 182 -.42 .10 .82 -1.6 .81 -1.5 .62 4objective planning14 690 182 -.44 .10 .95 -.4 .90 -.7 .63 imatching items16 692 182 -.46 .10 .77 -2.0 .72 -2.1 .66 ishort answer items28 689 181 -.47 .10 .90 -.9 .86 -1.1 .64 4ind. hands-on61 686 178 -.55 .11 .81 -1.6 .73 -2.0 .67 3communicate to students26 700 181 -.59 .11 .76 -2.0 .74 -1.9 .66 4ind. participation7 704 182 -.59 .11 .98 -.2 1.02 .2 .48 4observation
11 706 182 -.62 .11 1.01 .1 1.01 .0 .57 3match instruction49 705 177 -.84 .11 1.40 3.3 1.25 1.7 .59 lgrading criteria communicate12 733 182 -.94 .11 .78 -1.8 .75 -1.7 .61 1PP tests
59 725 178 -1.05 .12 1.05 .4 .96 -.3 .54 3oral feedback4 753 182 -1.22 .12 1.12 1.0 1.07 .4 .55 lannounce quizz
32 750 181 -1.23 .12 1.53 4.2 1.41 2.6 .52 1SAT administer
MEAN 634. 180. .00 .10 1.01 .1 1.01 .1
S.D. 65. 2. .59 .01 .20 1.9 .21 1.9
22

Table 6
PERSON STATISTICS: NEASURE ORDER
ENTRYNUM
RAWSCORE COUNT MEASURE ERROR
INFITMHO ZSTD
OUTFITMNSO ZSTD PTBIS PER
55 231 58 6.88 1.01 .94 -.1 .35 -.6 .29 55
167 229 58 5.74 .59 .98 .0 .70 -.5 .21 16752 221 58 4.26 .34 1.24 1.0 .91 -.3 .46 52
69 219 58 4.05 .32 .91 -.4 .70 -1.2 .60 6950 218 58 3.95 .31 .92 -.4 .75 -1.0 .56 509 214 58 3.61 .28 .81 -1.0 .81 -.9 .42 9
305 214 58 3.61 .28 .97 -.2 .91 -.5 .41 30596 213 58 3.53 .28 1.48 2.6 1.22 1.1 .59 9698 213 58 3.53 .28 1.31 1.7 1.24 1.2 .27 98
211 213 58 3.53 .28 1.24 1.3 1.16 .8 .38 211
21 211 58 3.38 .27 1.35 2.0 1.33 1.8 .35 21
263 210 58 3.31 .26 1.04 .2 .99 .0 .40 263
300 206 57 3.29 .26 1.08 .4 1.09 .5 -.06 300129 208 58 3.18 .26 1.05 .3 .95 -.3 .64 129
213 205 58 2.99 .25 1.16 .9 1.08 .5 .56 213
210 201 58 2.75 .24 1.47 2.6 1.36 2.1 .42 210
258 133 39 2.61 .29 .95 -.2 .92 -.4 .14 25890 4 1 2.47 1.82 MAXIMUM ESTIMATED MEASURE 90
285 193 58 2.32 .23 .72 -1.5 .73 -1.4 .52 285
48 186 58 1.98 .22 1.60 2.9 1.42 2.2 .61 4880 186 58 1.98 .22 1.55 2.7 1.49 2.5 .24 80
175 186 58 1.98 .22 1.17 .8 1.20 1.0 .38 175
148 184 58 1.88 .21 1.14 .7 1.15 .7 .22 148
200 184 58 1.88 .21 1.55 2.6 1.47 2.3 .40 20033 183 58 1.84 .21 1.00 .0 1.01 .1 .63 33
298 183 58 1.84 .21 .82 -.8 .82 -.9 .58 298119 180 58 1.71 .21 2.01 4.7 1.92 4.5 .43 119
216 179 58 1.66 .21 1.66 3.1 1.75 3.6 .43 216227 179 58 1.66 .21 1.71 3.3 1.64 3.1 .37 22727 178 58 1.62 .21 .86 -.7 .83 -.8 .27 2794 178 58 1.62 .21 1.32 1.5 1.17 .8 .62 94
293 178 58 1.62 .21 1.24 1.1 1.24 1.1 .50 293
34 175 58 1.50 .20 1.33 1.5 1.32 1.5 -.01 34
53 174 58 1.46 .20 .15 -3.9 .14 -4.0 .00 53
92 174 58 1.46 .20 .15 -3.9 .14 -4.0 .00 92128 174 58 1.46 .20 .15 -3.9 .14 -4.0 .00 128
303 174 58 1.46 .20 1.74 3.4 1.73 3.5 .54 303262 163 54 1.43 .21 1.46 2.0 1.47 2.1 .21 262
114 172 58 1.38 .20 2.31 6.1 2.03 4.8 .56 114
204 172 58 1.38 .20 1.17 .8 1.12 .5 .67 20435 171 58 1.34 .20 .51 -2.3 .50 -2.3 -.01 35
59 171 58 1.34 .20 .83 -.8 .81 -.9 .26 59
163 171 58 1.34 .20 .51 -2.3 .55 -2.1 .44 163
153 170 58 1.30 .19 1.28 1.3 1.32 1.5 .51 153
235 170 58 1.30 .19 .41 -2.7 .40 -2.8 .09 235
304 170 58 1.30 .19 1.20 .9 1.11 .5 .53 304165 168 58 1.23 .19 .53 -2.2 .56 -2.0 .21 165
77 166 58 1.16 .19 .73 -1.3 .78 -1.0 .34 77
173 166 58 1.16 .19 .52 -2.2 .51 -2.3 .27 173
244 166 58 1.16 .19 1.35 1.7 1.29 1.4 .46 244
306 166 58 1.16 .19 .75 -1.2 .69 -1.5 .59 306176 165 58 1.12 .19 .85 -.7 .82 -.8 .34 176
299 165 58 1.12 .19 1.75 3.5 1.55 2.6 .66 29958 164 58 1.09 .19 .84 -.8 .93 -.3 .37 58122 164 58 1.09 .19 .62 -1.8 .61 -1.8 .20 122
264 161 57 1.09 .19 1.37 1.8 1.39 1.8 .45 264
158 161 58 .98 .18 1.25 1.2 1.27 1.3 .39 158
191 160 58 .95 .18 .49 -2.5 .51 -2.3 .52 191
66 159 58 .92 .18 1.23 1.1 1.19 .9 .66 6688 159 58 .92 .18 .79 -1.0 .78 -1.0 .57 88
BEST COPY AVAILABLE
23

Table 6 Continued
PERSON STATISTICS: MEASURE ORDER
ENTRYNUM
RAWSCORE COUNT MEASURE ERROR
INFITMNSQ ZSTD
OUTFITMNSQ ZSTD PTBIS PER
233 159 58 .92 .18 .91 -.4 .88 -.6 .27 233
100 158 58 .89 .18 1.02 .1 1.15 .7 -.02 100
107 158 58 .89 .18 .86 -.7 .89 -.5 .55 107
146 158 58 .89 .18 1.41 2.0 1.36 1.7 .63 146
212 158 58 .89 .18 .99 -.1 .98 -.1 .32 212
242 158 58 .89 .18 1.04 .2 1.04 .2 .05 24267 157 58 .85 .18 1.15 .7 1.26 1.2 .47 67294 157 58 .85 .18 1.23 1.2 1.14 .7 .19 294
78 156 58 .82 .18 1.89 4.4 1.70 3.4 .49 78
162 153 57 .80 .18 .62 -1.9 .52 -2.3 .59 162
16 155 58 .79 .18 1.22 1.1 1.18 .9 .34 16
132 155 58 .79 .18 .74 -1.3 .78 -1.0 .21 132
209 153 58 .73 .17 .63 -1.8 .61 -1.9 .56 209
144 152 58 .70 .17 .69 -1.6 .69 -1.5 .41 144
99 151 58 .67 .17 .78 -1.1 .67 -1.6 .50 99
184 151 58 .67 .17 1.12 .6 1.11 .5 .52 184
199 151 58 .67 .17 .79 -1.1 .73 -1.3 .44 199
292 151 58 .67 .17 .77 -1.2 .88 -.6 .25 292
267 140 54 .64 .18 .89 -.5 .84 -.7 .60 267130 150 58 .64 .17 1.20 1.0 1.11 .6 .29 130
288 150 58 .64 .17 1.23 1.2 1.24 1.2 .10 288238 149 58 .61 .17 1.00 .0 .88 -.6 .42 238311 149 58 .61 .17 1.70 3.6 1.71 3.5 .40 311
194 148 58 .58 .17 1.03 .2 .95 -.3 .34 194
203 148 58 .58 .17 1.16 .9 1.16 .8 .39 203
268 148 58 .58 .17 1.54 2.8 1.74 3.7 .00 268
51 146 58 .53 .17 1.24 1.3 1.29 1.5 .54 51
149 146 58 .53 .17 1.11 .6 1.12 .6 .74 149
168 146 58 .53 .17 1.12 .6 1.30 1.5 -.18 168
218 146 58 .53 .17 .79 -1.1 .72 -1.4 .59 218
219 146 58 .53 .17 1.23 1.2 1.33 1.7 .51 219
237 146 58 .53 .17 1.29 1.6 1.40 2.0 .39 237157 145 58 .50 .17 .39 -3.2 .37 -3.2 .60 157
208 144 58 .47 .17 1.43 2.3 1.41 2.1 .66 208
103 143 58 .44 .17 1.01 .0 1.03 .2 .35 103
249 143 58 .44 .17 .43 -3.0 .43 -2.9 .54 249287 143 58 .44 .17 1.07 .4 1.03 .2 .39 287295 143 58 .44 .17 .70 -1.6 .74 -1.4 .62 295
74 142 58 .42 .16 1.83 4.5 1.75 3.9 .62 74
301 142 58 .42 .16 .95 -.3 .86 -.7 .49 301
309 142 58 .42 .16 .96 -.2 .87 -.7 .48 309
40 141 58 .39 .16 1.20 1.1 1.09 .5 .45 40
126 141 58 .39 .16 .71 -1.6 .78 -1.2 .43 126
137 141 58 .39 .16 1.02 .1 1.01 .0 .44 137
140 141 58 .39 .16 .72 -1.5 .77 -1.2 .08 140
229 140 58 .36 .16 1.21 1.1 1.19 1.0 .14 229159 138 58 .31 .16 1.70 3.8 1.73 3.9 .42 159
281 138 58 .31 .16 1.26 1.4 1.15 .8 .52 281
289 138 58 .31 .16 .93 -.4 .92 -.4 .50 289
260 54 22 .29 .27 1.03 .1 .94 -.2 .51 260
117 137 58 .28 .16 .92 -.5 .84 -.9 .59 117
188 137 58 .28 .16 .75 -1.4 .78 -1.2 .51 188
234 137 58 .28 .16 1.68 3.8 1.75 4.0 .23 234
255 137 58 .28 .16 1.27 1.5 1.21 1.1 .38 255
214 136 58 .26 .16 1.04 .2 1.02 .1 .44 214
226 136 58 .26 .16 .92 -.4 .87 -.7 .51 226
280 136 58 .26 .16 1.03 .2 1.01 .1 .45 280
64 133 57 .25 .16 1.12 .7 1.10 .5 .70 64
177 135 58 .23 .16 .60 -2.2 .64 -1.9 .52 177
24
27

Table 6 Continued
PERSON STATISTICS: MEASURE ORDER
ENTRYNUM
RAWSCORE COUNT MEASURE ERROR
INFITNNW ZSTD
OUTFITMNS12 ZSTD PTBIS PER
257 135 58 .23 .16 .62 -2.1 .64 -1.9 .61 25757 133 58 .18 .16 .36 -3.6 .37 -3.4 .55 5785 133 58 .18 .16 .89 -.6 .84 -.8 .19 85
195 133 58 .18 .16 1.02 .1 1.00 .0 .38 195
250 132 58 .16 .16 1.03 .2 .99 .0 .43 250
245 131 58 .13 .16 1.08 .5 1.08 .5 .47 24563 130 58 .11 .16 1.07 .4 1.05 .3 .44 6395 129 58 .08 .16 1.66 3.8 1.66 3.7 .66 95196 129 58 .08 .16 .82 -1.0 .84 -.9 .47 196
147 128 58 .06 .16 1.12 .7 1.18 1.0 .40 14746 126 58 .01 .15 1.26 1.5 1.26 1.5 .02 46
151 126 58 .01 .15 .93 -.4 .88 -.7 .70 151
134 125 58 -.01 .15 1.29 1.7 1.28 1.6 .31 134
302 125 58 -.01 .15 1.19 1.1 1.15 .9 .39 302236 124 58 -.04 .15 .84 -.9 .84 -.9 .34 236
6 123 58 -.06 .15 .42 -3.4 .41 -3.4 .66 6274 123 58 -.06 .15 1.15 .9 1.11 .6 .29 274
108 122 58 -.08 .15 1.01 .1 .98 -.1 .49 108
154 122 58 -.08 .15 1.29 1.7 1.31 1.8 .35 154
164 122 58 -.08 .15 1.04 .3 1.03 .2 .33 164150 121 58 -.11 .15 .68 -1.9 .69 -1.8 .21 150
116 118 58 -.18 .15 .48 -3.1 .50 -2.9 .48 11670 117 58 -.20 .15 .27 -4.4 .30 -4.2 .20 70
121 117 58 -.20 .15 .93 -.4 .92 -.5 .56 121
276 117 58 -.20 .15 .95 -.3 1.01 .1 .21 2761 116 58 -.22 .15 1.14 .9 1.23 1.4 .37 1
26 116 58 -.22 .15 .73 -1.6 .74 -1.5 .41 26
82 116 58 -.22 .15 .28 -4.3 .31 -4.1 .00 82101 116 58 -.22 .15 1.30 1.8 1.32 1.9 .23 101
166 116 58 -.22 .15 .45 -3.3 .48 -3.1 -.07 166
278 116 58 -.22 .15 .51 -3.0 .53 -2.8 .08 278297 115 58 -.24 .15 1.12 .7 1.10 .6 .35 297
2 114 58 -.27 .15 .61 -2.4 .60 -2.4 .39 2
202 113 58 -.29 .15 .67 -2.0 .69 -1.9 .69 202246 113 58 -.29 .15 1.04 .3 1.06 .4 .61 24630 112 58 -.31 .15 .47 -3.3 .47 -3.2 .61 3084 112 58 -.31 .15 .71 -1.8 .73 -1.6 .64 84
170 111 58 -.33 .15 .60 -2.5 .60 -2.4 .66 170
279 111 58 -.33 .15 1.57 3.5 1.57 3.5 .46 279
215 110 58 -.36 .15 1.39 2.4 1.46 2.8 .09 215
221 110 58 -.36 .15 .73 -1.7 .70 -1.8 .60 221
222 110 58 -.36 .15 1.04 .3 1.08 .5 .51 222275 102 54 -.39 .15 1.20 1.2 1.23 1.4 .15 275
65 108 58 -.40 .15 1.04 .3 1.08 .5 .72 65
93 108 58 -.40 .15 .94 -.4 .95 -.3 .64 93
284 104 56 -.42 .15 1.04 .2 1.03 .2 .47 284
259 61 32 -.46 .20 .87 -.6 .90 -.4 -.02 25939 104 58 -.49 .15 .64 -2.2 .63 -2.3 .48 39155 104 58 -.49 .15 1.17 1.1 1.20 1.2 .28 155
17 103 58 -.51 .15 .93 -.4 .92 -.5 .42 17156 100 58 -.58 .15 1.54 3.4 1.56 3.4 .43 156
13 99 58 -.60 .15 1.18 1.2 1.19 1.2 .45 13
43 94 58 -.71 .15 1.14 .9 1.18 1.1 .24 431
261 94 58 -.71 .15 .96 -.3 .93 -.4 .35 261
282 73 49 -.84 .16 1.31 1.8 1.30 1.7 .59 282
109 87 58 -.87 .15 .98 -.1 1.08 .5 -.51 109
135 87 58 -.87 .15 1.05 .3 1.13 .8 .08 135
239 86 58 -.89 .15 1.29 1.8 1.28 1.7 .42 239
BEST COPY AVAILABLE25
28

Table 6 Continued
PERSON STATISTICS: MEASURE ORDER
ENTRYNUM
RAWSCORE COUNT MEASURE ERROR
INFITMNSQ ZSTD
OUTFITHMSO ZSTD PTBIS PER
181 84 58 -.93 .15 1.43 2.7 1.45 2.8 .66 181
277 84 58 -.93 .15 .89 -.7 .89 -.7 .22 277189 83 58 -.96 .15 1.25 1.6 1.23 1.4 .63 189
231 81 58 -1.00 .15 .69 -1.9 .67 -2.0 .57 231
37 64 58 -1.40 .16 .87 -.7 .87 -.7 .24 37138 28 58 -2.56 .21 1.06 .3 1.06 .3 .27 138
MEAN 145. 57. .74 .19 1.03 .1 1.01 .1
S.D. 36. 4. 1.27 .08 .36 1.9 .36 1.8
Table 7
Rank Order Factor Analyzed Assessment Categories by Difficulty Based on Rasch Model AnalysisN=311
Rank Assessment Categories Mean Logit
1 Interpret standardized test results/conductclassroom statistics, use assessment results indecision making
.75
2 Nonachievement based grading .08
3 Develop and use performance assessment,informal observation
-.10
4 Grading -.12
5 Develop and use paper-pencil tests,choose assessment methods
-.33
6 Communicate assessment results -.35

Figure 1
DISTRIBUTIONS OF PERSON AND ITEM MEASURES BY RASCH ANALYSIS311 PERSONS 67 ITEMS ANALYZED: 182 PERSONS 58 ITEMS 5 CATEGORIES
MEASURE
7.0
6.0
MAP OF PERSONS
- LOW ITEMS
AND ITEMS
- MEAN ---ITEMS - HIGHMEASURE
7.0
6.0
------PERSONS---ITEMS.
5.0 5.0
4.0 . - - - 4.0.# ###.# IOC
3.0 - - - ##. 3.0###############
2.0 .#g - - ## 2.0## #.
##### #1.0 ####### - - ### 1.0
######## ###..########## ##.
.0 .##### - - ###### .0
.######### #########.# ##
-1.0 .## #. -1.0
. ###
-2.0 - ##. - -2.0WOW#########
-3.0 - ## -3.0
#.
-4.0 -4.0
ITEMS LOW ---ITEMS - MEAN ---ITEMS - HIGH------PERSONS -
EACH ' #' IN THE PERSON COLUMN IS 3 PERSONS; EACH 1.1 IS 1 TO 2 PERSONS
EACH ' #' IN THE ITEM COLUMN IS 2 ITEMS ; EACH 1., IS 1 ITEM
BEST COPY AVAILABLE
27
9
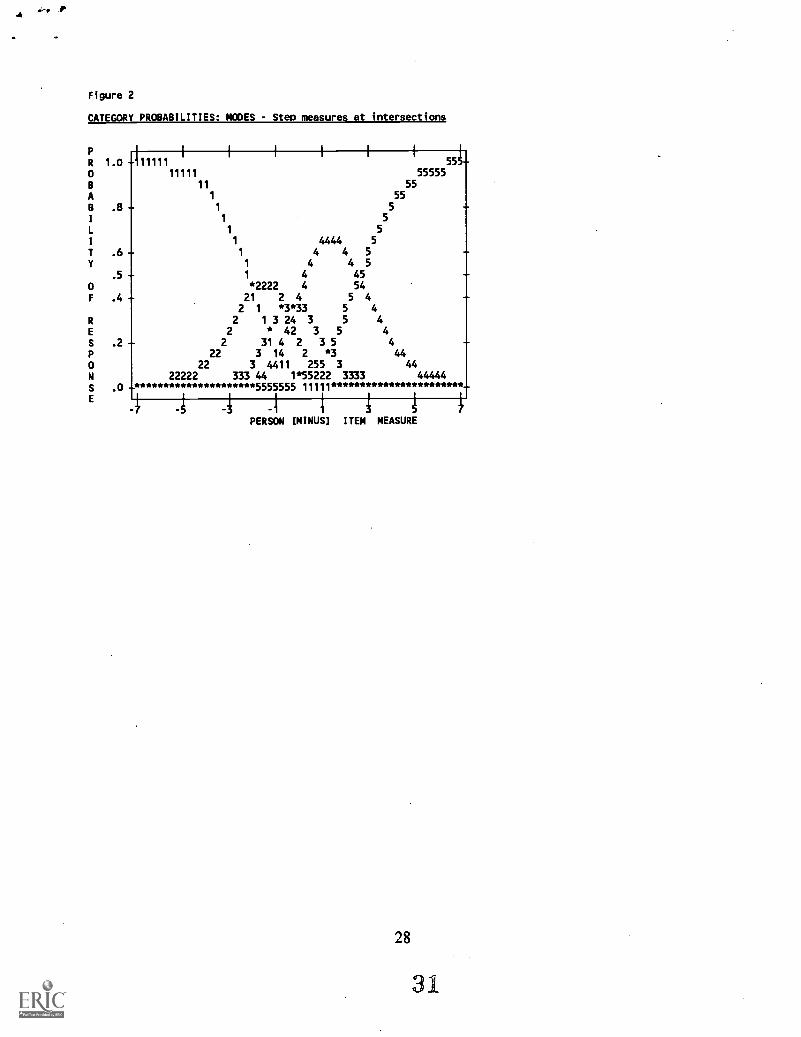
Figure 2
CATEGORY PROBABILITIES: MODES - Step measures at intersections
R 1.0 111111 54.-P
I I I I I
o 11111 55555
B 11 55
A 1 55
B .8 1 5
I 1 5
L 1 5
I 1 4444 5
T .6 1 4 4 5
Y 1 4 4 5
.5 1 4 45O *2222 4 54
F .4 21 2 4 5 42 1 *3*33 5 4
R 2 1 3 24 3 5 4E 2 * 42 3 5 4
S .2 2 31 4 2 3 5 4
P 22 3 14 2 *3 44
O 22 3 4411 255 3 44N 22222 333 44 1*55222 3333 44444S .0 5555555 11111E
PERSON [MINUS] ITEM MEASURE
28
31
a7,_c 6AERA April 8-12, 1996
U.S. DEPARTMENT OF EDUCATIONOffice of Educational Research and Improvement (OERI)
Educational Resources Information Center (ERIC)
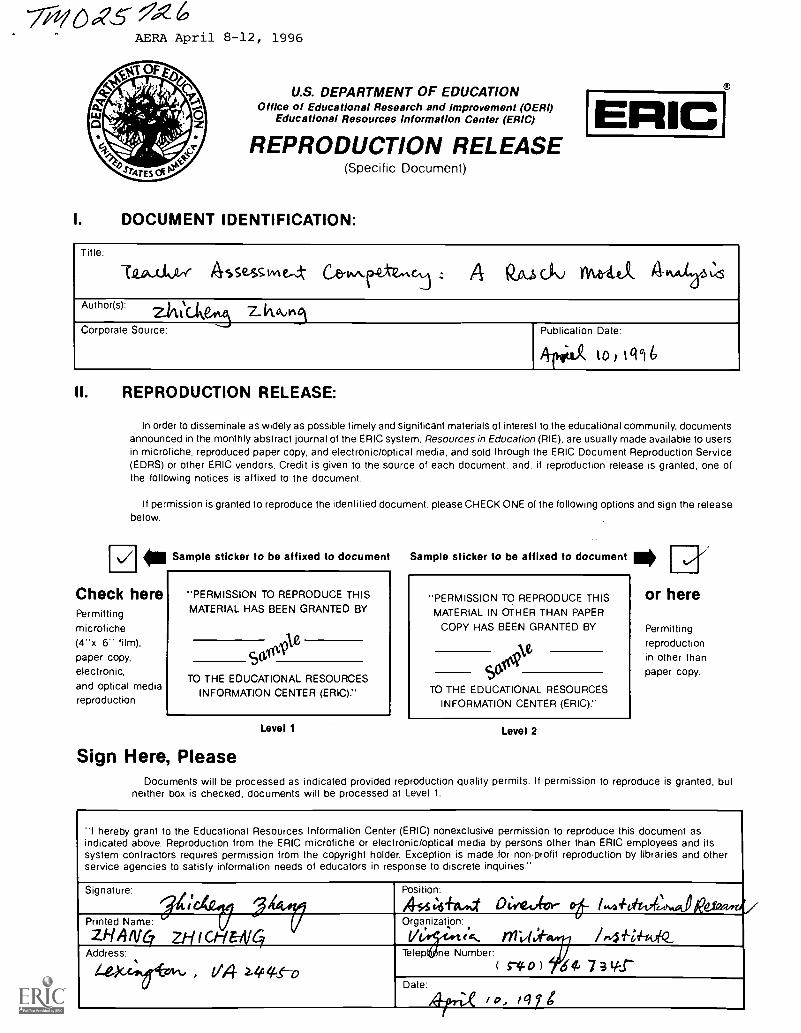
REPRODUCTION RELEASE(Specific Document)
I. DOCUMENT IDENTIFICATION:
ERIC
Title:
7.12.49Wozw A s se-ss e,t z A kflu ct.) nudalAuthor(s):
1
%, 1Z-V1,LA 7-101.005
Corporate Source: Publication Date:
to 016
II. REPRODUCTION RELEASE:
In order to disseminate as widely as possible timely and significant materials of interest to the educational community, documentsannounced in the monthly abstract journal of the ERIC system, Resources in Education (RIE), are usually made available to usersin microfiche, reproduced paper copy, and electronic/optical media, and sold through the ERIC Document Reproduction Service(EDRS) or other ERIC vendors. Credit is given to the source of each document, and, if reproduction release is granted, one ofthe following notices is affixed to the document.
If permission is granted to reproduce the identified document, please CHECK ONE of the following options and sign the releasebelow.
Check herePermittingmicrofiche(4"x 6" film),paper copy,electronic,and optical mediareproduction
Sample sticker to be affixed to document
"PERMISSION TO REPRODUCE THISMATERIAL HAS BEEN GRANTED BY
TO THE EDUCATIONAL RESOURCESINFORMATION CENTER (ERIC)."
Level 1
Sign Here, Please
1----Sample sticker to be affixed to document 0or here"PERMISSION TO REPRODUCE THIS
MATERIAL IN OTHER THAN PAPERCOPY HAS BEEN GRANTED BY
TO THE EDUCATIONAL RESOURCESINFORMATION CENTER (ERIC)."
Level 2
Permittingreproductionin other thanpaper copy.
Documents will be processed as indicated provided reproduction quality permits. If permission to reproduce is granted, butneither box is checked, documents will be processed at Level 1.
"I hereby grant to the Educational Resources Information Center (ERIC) nonexclusive permission to reproduce this document asindicated above. Reproduction from the ERIC microfiche or electronic/optical media by persons other than ERIC employees and itssystem contractors requires permission from the copyright holder. Exception is made for non-profit reproduction by libraries and otherservice agencies to satisfy information needs of educators in response to discrete inquiries."
Signature:r
341C412.#
Position:
Ali eithilwa DINg(110-- 0-1-. 14-ve4131/4Vert\toroeRefrel/rd.':34/7Printed Name:
ZH/4 fV4 ZH I CHENqOrganization:
V e te Ma vi-I AT / 141-141ViZ.Address:
i-a-4,140'%- , 1M- 2itheAf--0
Telep ne Number:(14164. 7 s y:1"-
Date:
4#71.-C / 0, re) 7 t
C UA
THE CATHOLIC UNIVERSITY OF AMERICADepartment of Education, O'Boyle Hall
Washington, DC 20064202 319-5120
February 27, 1996
Dear AERA Presenter,
Congratulations on being a presenter at AERA'. The ERIC Clearinghouse on Assessment andEvaluation invites you to contribute to the ERIC database by providing us with a written copy ofyour presentation.
Abstracts of papers accepted by ERIC appear in Resources in Education (RIE) and are announcedto over 5,000 organizations. The inclusion of your work makes it readily available to otherresearchers, provides a permanent archive, and enhances the quality of RIE. Abstracts of yourcontribution will be accessible through the printed and electronic versions of ME. The paper willbe available through the microfiche collections that are housed at libraries around the world andthrough the ERIC Document Reproduction Service.
We are gathering all the papers from the AERA Conference. We will route your paper to theappropriate clearinghouse. You will be notified if your paper meets ERIC's criteria for inclusionin ME: contribution to education, timeliness, relevance, methodology, effectiveness ofpresentation, and reproduction quality.
Please sign the Reproduction Release Form on the back of this letter and include it with two copiesof your paper. The Release Form gives ERIC permission to make and distribute copies of yourpaper. It does not preclude you from publishing your work. You can drop off the copies of yourpaper and Reproduction Release Form at the ERIC booth (23) or mail to our attention at theaddress below. Please feel free to copy the form for future or additional submissions.
Mail to: AERA 1996/ERIC AcquisitionsThe Catholic University of AmericaO'Boyle Hall, Room 210Washington, DC 20064
This year ERIC/AE is making a Searchable Conference Program available on the AERA webpage (http://tikkun.ed.asu.edu/aera/). Check it out!
Sincerely,
awreYice M. Rudner, Ph.D.Director, ERIC/AE
'If you are an AERA chair or discussant, please save this form for future use.
ERIC Clearinghouse on Assessment and Evaluation