document resume sp 006 625 grover, burton l.; and … · author grover, burton l.; and others title...
TRANSCRIPT

DOCUMENT RESUME
ED 077 920 SP 006 625
AUTHOR Grover, Burton L.; And OthersTITLE A Comparative Multivariate Analysis of
Competency-Based Teacher Education Programs. FinalReport.
INSTITUTION Western Washington State Coll., Bellingham.SPONS AGENCY Office of Education (CHEW), Washington, D.C. Bureau
of Research.BUREAU NO BR-2-J-004PUB DATE Mar 73CONTRACT OEC-X-72-0009(057)GRANT OEG -0 -70 -1930 (715)NOTE 130p.
EDRS PRICE MF-$0.65 HC-$6.58DESCRIPTORS Evaluation Methods; Individual Characteristics;
Instructional Program Divisions; PerformanceContracts; *Performance Criteria; *PerformanceFactors; *Performance Specifications; *ProgramEvaluation; Research Criteria; *Teacher Education
IDENTIFIERS Department of Health Education and Welfare
ABSTRACTThis research project represents an attempt to
capitalize on the study opportunity provided by the simultaneousoperation of seven teacher training programs by one institution andto cope with problems which normally have plagued teacher trainingprogram evaluation efforts: lack of validation of performancecriteria, nonequivalence of trainees in different programs, varyingobjectives, and insufficient data. In trying to discern relationshipsamong selected variables, one major purpose was to identify teachingperformances that potentially are more sensitive to training efforts.A series of factor analyses of selected subsets of variables did notreveal any factor which accounted for more than 10 percent of thevariance. Teaching characteristics tended not to appear in factorscontaining entry program variables, although grade level taught didhave a relationship with teaching variables such as indirect verbalinfluence. (Suggestions for subsequent multivariate approaches to thestudy of teacher education are provided; they include recommendationsto reduce the range of grade levels included in any one study.)(Author/JA)
FILMED FROM BEST AVAILABLE COPY
r
C:FINAL REPORT
C.7.3
14.1 Project No. 571930 Project No. 2-J-004
Grant No. OEG-0-70-1930 (715) Contract No. OEC-X-72-0009 (057)
A COUPARATIVE MULTIVARIATE ANALYSIS OF COMPETENCY-BASEDTEACHER EDUCATION PROGRAMS
Burton L. Grover, Jerald King, and Robert M. Thorndike
with the assistance of Mrs. Barbara RupersRobert Bennett
Western Washington State CollegeBellingham, Washington 98225
March 1973
U S DEPARTMENT OF HLALTH.EDUCATION 8 WELFARENATIONAL INSTITUTE OF
EDUCATIONTHIS DOCUMENT HAS BEEN REPRODOLED EXACTLY AS RECEIVED FROMTHE PERSON OR ORGANIZATiOA ORIGINATING IT POINTS OF VIEW OR )PINIONSSTATED DO NOT NECESSARILY REPRESENT OFFICIAL NATIONAL INSTITUTE OF
EDUCATION POSITION OR POLICY
The research reported herein was performed pursuant to aGrant (No. OEG-0-70-1930 (715)) and Contract (No. OEC-X-72-0009 (057)) with the Office of Education, U.S. Depart-ment of Health, Education, and Welfare. Contractors un-
dertaking such projects under Government sponsorship areencouraged to express freely their professional judgment
in the conduct of the project. Points of view or opinions
stated do not, therefore, necessarily represent officialOffice of Education position or policy.
U.S. DEPARTMEiTT OFHEALTH, EDUCATION AND WELFARE
Office of EducationBureau of Research

TABLE OF CONTENTS
SUMMARY
Page
iii
SECTION I: INTRODUCTION 1
SECTION II: PROCEDURES 5
SECTION III: LIMITATIONS AND PROBLEMS OF THE STUDY . . 20
SECTION IV: RESULTS 26
SECTION V: CONCLUSIONS 54
APPENDIX A INDEX OF VARIABLES WITH INDICATION OFMEASUREMENT AND DATA PROCESSING PROCEDURES . 57
APPENDIX A PERSONALITY-ATTITUDE SCALES GENERATED FROM2
MEASURES USED IN THE MATE STUDY 69
APPENDIX B1
DESCRIPTIVE STATISTICS 75
APPENDIX B2
INTERCORRELATIONS OF 62 VARIABLES 95
APPENDIX C FORMS AND INSTRUMENTS USED IN THE STUDY . . 103
TABLE OF TABLES AND FIGURES
TABLE I: DISTRIBUTION OF SUBJECTS EY TRAINING PROGRAMAND LOCATION OF FIELD EXPERIENCE 10
TABLE II: DISTRIBUTION OF SUBJECTS BY TRAINING PROGRAMAND TIME OF INCLUSION IN STUDY 11
TABLE III: VARIABLE LOADINGS AND VARIANCE ACCOJNTED FORBY FIRST TEN FACTORS FROM FACTOR ANALYSIS OF28 VARIABLES AND 114 SUBJECTS 37
TABLE IV:
TABLE V:
RANK OF PROGRAMS ON SIX VARIABLES HAVINGHIGH LOADINGS ON THE FIRST DISCRIMINANT
FUNCTION OF THE DISCRIMINANT ANALYSIS OFTEACHING VARIABLES 40
RANK OF TRAINING PROGRAMS ON SEVEN TEACHINGVARIABLES HAVING MAJOR LOADINGS ON THESECOND DISCRIMINANT FUNCTION OF THE DISCRIM-INANT ANALYSIS OF TEACHING VARIABLES . . 41

TABLE OF CONTENTS (Cont-nued)
TABLE VI:
TABLE VII:
DISCRIMINANT XIALYSIS OF TEACHING VARIABLES:VARIABLE LOADINGS, PROGRAM LOADINGS, ANDOTHER STATISTICS
VARIABLE LOADINGS AND PROGRAM SCORES ONTHREE SIGNIFICANT FUNCTIONS OF DISCRIMINANTANALYSIS OF 18 ENTRY CHARACTERISTICVARIABLES
Page
44
47
TABLE VIII: VALUES AND VARIABLES OF FOUR CANONICALCORRELATIONS 52
TABLE IX:
FIGURE I:
CORRELATIONS AND CANONICAL WEIGHTS OF FIRSTCANONICAL VARIATE FROM CANONICAL ANALYSIS OFSELECTED PROGRAM AND TEACHING VARIABLES . . . 53
LOCATION OF SIGNIFICANT VARIABLES ANDPROGRAMS IN DISCRIMINANT SPACE OF TWOFUNCTIONS FROM DISCRIMINANT ANALYSIS OF22 TEACHING VARIABLES 43

PREFACE
Although it is unusual to do so, we would like to clarify the
relative contributions of the listed authors to this report. It is
customary for authors to be listed alphabetically when contributions
are coequal. In this case, the relative contributions of the authors
happen to correspond to the alphabetical order of their names, and
since the contributions were very equal, it was felt that this comment
was necessary.
The vast majority of the work (and pain and suffering) of this
project was borne by Burton Grover. He was responsible for the basic
idea, obtaining funding, day-to-day management of data collection, and
writing of the final report. Jerald King was involved in data collec-
tion and preparation and performed the statistical analyses. My func-
tion was mainly that of statistical consultant and editor.
--Robert M. Thorndike
SPECIAL NOTE
Non-local support for this project came from two sources within
the U.S. Office of Education--Teacher Corps and Regional Research. As
a consequence, the project has two project numbers end two umtract or
grant numbers which conceivably could cause some problem in referencing.
All numbers are listed on the cover and title pages. The numbers on the
left (Project No. 571930) were assigned by Teacher Corps and those
the right (Project No. 2-5-004) were assigned by Region X, Regional
Research.

ACKNOWLEDGMENTS
The project described in this report could not have been accomplishedwithout the work and cooperation of several people. Mrs. Barbara Rupersdeserves special mention for her knowledgeable and diligent efforts re-lating to almost all aspects of the project. Her work was essential notonly to data collection but also to their processing, retrieval, and cer-tain thankless, grubby tasks of preliminary analysis.
Robert Bennett, Vancouver, B. C., was instrumental in data collectionand establishing procedural arrangements with schools for data collection.Mr. Bennett shared the accomplishment of this formidable task with Mrs.Rupers and Jerald King.
Project completion depended upon the interested cooperation of sev-eral persons associated with the Teacher Education programs includingRobert Pinney, Bearnice Skeen, Roberta Bouverat, Tom Savage, RichardCovington, and George Lamb. Vernon 0. Tyler not only cooperated in thestudy of his training program but also worked on design and instrumenta-tion mcters concerned with the project. Mrs. Margaret Keagle was es-
pecially helpful in working out arrangements with the local districts.
Richard Parker rnd John Schaller provided needed assistance duringthe later stakes of data analysis.
The project would not have been undertaken has there not been a setof seven training programs to study, programs which in large part werefield-centered and were seriously grappling with the issues of competency-based training. A necessary--and maybe even sufficient -- condition for
their existence was F. Herbert Fite.
Although not customary to acknowledge government personnel in afinal report, it is difficult to conclude this section without expressingappreciation for the supportive nature of contacts from two U. S. Officeof Education officials, Ursula Wagener and John Bean.
ii
- Burton L. Grover

SUMMARY
The research project entitled, "A Comparative Multivariate Analysisof Competency Based Teacher Education Programs," represented an attemptto capitalize on the study opportunity provided by the siaultaneousoperation of seven teacher training programs by one institution and tocope with problems which normally have plagued teacher training programevaluation efforts: lack of validation of performance criteria, non-equivalence of trainees in different programs, varying objectives, andinsufficient data. In trying to discern relationships among selectedvariables, one major purpose was to identify teaching performances thatpotentially are more sensitive to training efforts.
Data were gathered on a large number of variables (exact numberdepends upon how breakdowns of general variables are counted) on 114subjects it seven training programs. Variables were of three generalkinds: entry characteristics, program and setting characteristics, andteaching and exit characteristics. Data-collection included an averageof three observations of subject in the classroom according to aneclectic, systematic procedure.
A series of factor analyses of selected subsets of variables didnot reveal any factor which accounted for more than 10 percent of thevariance. Teaching characteristics tended not to appear in factors con-taining entry or program variables, although grade level taught didhave a relationship with teaching variables such as indirect verbalinfluence.
A multiple discriminant analysis of teaching variables among pro-grams revealed two significant discriminant functions. The disc-iminantanalysis of entry characteristics revealed three significant functions.The canonical correlation between entry and teaching characteristicswas not significant; however, the correlation of program and settingvariables with teaching variables was significant. The strongest singlecontributor to this latter analysis was grade level among the programand setting variables.
Suggestions for subsequent multivariate approaches to the study ofteacher education are provided and include the recommendation to reducethe range of grade levels included in any one study.
iii

SECTION I
INTRODUCTION
A number of elements comprise the background for this research
project.
First of all, there was the recent emphasis on "competency-based"
teacher education programs. The emphasis was exemplified by the USOE
sponsorship of the elementary teacher education modelsl and preferred
criteria for federal funding of teacher training programs. With the
discussion of competency-based programs came the obvious question of
which competencies. The verbal emphasis on performance criteria in
general did not reveal a common agreement or understanding of thosespecific competencies that deserved greatest emphasis and could serve
as goals for program planning.
Second, the lack of agreement or clarity on performance criteriawas not surprising ia light of what is not known about the impact of
teaching variables. Research in teacher effectiveness has yet to
yield a body of knowledge from which mutually acceptable performancecriteria can be derived, that is, criteria which are reasonably stable,related to pupil learning, and subject to change as a result of train-
ing.2
Thirdly, Western Washington State College had initiated a varietyof teacher education programs immediately prior to this research study.The programs were begun within the general context of the competency-based emphasis and one model, in particular, "Cornfield." Each
training program appeared to have unique features which gave rise toboth questions and opportunities for comparative study.
A fourth element was the frustration associated wi'.:11 plans to
evaluate the new programs. Develupment and initial management of the
programs left little time for internal systematic program evaluation,
either for formative or summative purposes; and the additional resourcesthat could be committed to evaluation, whether from federal, state orlocal sources, were severely limited. A national plan for evaluation of
one program had, in fact, been stopped because of funding shifts at the
federal level before the training program was halfway completed.
Even if adequate resources for evaluation had been available,
1Allen, D. V., and J. M. Cooper, 1968. Model Elementary Teacher
Education Program. Washington, D.C.: USOE Bureau of Research, U.S.
Government Printing Office, FS 5.258:58022.
2Rosenshine, Barak and Norma Furst. "Research on Teacher Perform-
ance Criteria," Research in Teacher Education, B. O. Smith, Editor.
Englewood Cliffs, New Jersey, Prentice-Hall, 1971.

there remained not only the uncertainty about valid performance criteriabut also the uncertainty about an appropriate evaluation-research para-
digm. The rarity of comparative evaluations of teacher educationprograms can be ascribed to several difficulties involved in s,..:ch field
research. Controlled manipulation of training variables has been almostimpossible because of the size of the training efforts and the need fornegotiating and adapting arrangements to varying publ.- school situa-
tions. Moreover, the types of students going into various programshave likely been quite different (because of different institutions, dif-ferent locations, and the differences in advertised features of the pro-grams) and not subject to controlled random assignment, with the resultthat student differences and training variable effects are difficult if
1; t impossible to separate. The field situations of the program alsohave provided variations in classroom settings and field supervisors,which may have had as much or more of an effect on what is learned about
teaching than effects of training variables.
Still other factors which have complicated current research plan-ning in teacher education are recent developments in classroom organiza-
tion and instruction. These have included attempts at "open" classroomarrangements, individualized programs, and adaptation of British Infant
school instructional patterns. With these changes have come changes inteachers' roles and possibly a reduction in the appropriateness ofmeasurement procedures based on older roles.
The aforementioned elements, coupled with a desire to utilize thenatural laboratory provided by seven different training programs, led to
a research plan based on certain operating assumptions:
1. Controlled manipulation of trai...ing variables and controlled
assignment of students to programs for research purposes were not feas-
ible. As a result, any study would have to be essentially descriptiveand not experimental, and no causal conclusions could be drawn.
2. A comparative study of different training programs was potenti-.
ally m)re rewarding than a progress-toward-objectives or management-typeanalysis of a single program, particularly because trainee and settingfactors of a program could be unique and also because program directorswere already attempting progress-toward-objectives management as part of
their regular responsibilities.
3. Because of the lack of established criteria for screening oridentifying variables en the basis of relevance to teaching effective-ness, and because of the newer elements of the trainee programs, asmany variables should be studied as possible.
4. In order for a comparative study of the different training pro-
grams to have any chance of yielding useful results, differences in
------..........]
characteristics of trainees prior to their entry into the programs must
somehow be taken into account.
2

5. In order for a comparative study of the different training pro-grams to have any chance of yielding useful results, differences in thecharacteristics of the field Letting and cooperating school personnelmust somehow be taken into account.
6. For any variable to be included in the study, its measurementmust yield data (a) from all seven training programs and (b) in a scal-able form suitable for multivariate analysis. (The presence or absenceof a certain characteristic in a program would be suitable data; however,the measured variations of a feature present in some programs but absentin others would be difficult or impossible to handle meaningfully.)Data on a variable from one program but not from another, however valuable,could not be included.
7. In order to have any potential relevance to teaching effective-ness and as valid guidelines for teacher education programs, at leastpart of the data must be gathered from classroom observation.
8. Multivariate data analyses have potential for revealing pat-terns and interrelationships which have implications for teacher training.In order that any meaning can be derived from a large number of studiedvariables, multivariate analyses are in fact a necessity.
9. A sequence of different multivariate analytical procedures canbe legitimately applied to the data with subsequent analyses determinedin part by findings from the initial analyses.
cciuSatAlthough no legitimate inferences about easel relationships could
be drawn from the series of analyses, any patterns and relationshipsdiscovered have potential as leads and hypotheses, both for furtherresearch and, in lieu of other established findings, as suggested guidesfor program development.
From these operating assumptions the major thrust of the study wasto compile and analyze a data matrix organized along two major dimensions,trainees and variables. The trainee dimension was divided into sevengroups according to the training program from which the trainees wereselected. The variable dimension :vas roughly divided into three categories,one for characteristics of trainees prior to entry to the program, one forcharacteristics and setting of the training program in which they were en-rolled, and one for teaching characteristics of trainees as they partici-pated in or completed the program. The object was to have a datum on eachvariable for each trainee, including data on his training program.
The major purpose of the study, that which guided the selectionof variables and the organization and analysis of data, was to identifythose teaching characteristics which were associated with (and therebypossibly sensitive to) training variables. In addition, differences andsimilarities of trainees in the various programs were to be described.Another underlying implicit and important purpose was to develop andadapt measurement and data processing procedures such that multivariate
3

analyses of teacher education could continue as long as it held promise;in other words, to find out how teacher education could be subjected tomultivariate analysis.
The purposes of the study can be restated in slightly more precisefashion as the following questions:
1. Which components of the training programs varied betweenprograms and which tended to be more constant across all programs?
2. To what extent do trainees entering the various programs differand on what characteristics do they differ the most?
3. Do the teaching behaviors of trainees in the various programsdiffer and on which behaviors do they differ the most?
4. To what extent are teaching behaviors predictable strictly fromcharacteristics of trainees as they enter tha program?
5. Which teaching behaviors, if any, can be found to be associatedwith and thereby possibly sensitive to training variables, either inde-pendent of or in combination with var:ous entry characteristics?
6. Which training variables are associated with the greatest vari-ation in teaching behaviors? 40
Questions five and six, anticipating a factor analysis of the data,can be stated as which clusters of related variables can be found in whichboth training variables and teaching variables appear. If such clusterpatterns can be found, then interpretations can be made on the basis ofthose specific variables that do appear within the cluster, interpreta-tions which could have implications for design of training programs andtrainee selection for specific programs. Should initial analysis haveprovided encouragement and should the required complex statistical proced-ure have been functioning properly, then the data or a promising subsetof the data could be reanalyzed to discoer the extent to which teachingbehaviors are predictable from trairirg variables with entry character-istics partialled out.

SECTION II
PROCEDURES
Teacher Training Programs Studied:
Seven different teacher training programs operating out of Western
Washington State College were included in the study. The programs and
students in the programs were studied only during the student teaching
or practicum phases; the study did not collect any data on program phasespreliminary to actual work in public school classrooms.
A brief mention of the publicized features and characteristics of
the seven programs is presented here. This information is from publi-
cized descriptions provided prior to this particular study. Program
data collected by this particular study are reported in later sections
of this report.
Auburn: The teacher training program in Auburn was a year-long
program designed to prepare baccalaureate holders from fields
other than education for teaching careers. No degrees were of-
fered. The program was for a limited number of students and was
financed partly by USOE (EPDA B-2) funds. Trainees were in twoelementary school buildings in the Auburn school district and
worked mostly in teams using open concept classrooms. A resident
college faculty member managed most of the teacher trainingthrough seminars and instructional modules in addition to the
classroom teaching experience. Interns were located full-ti7Le
in the school district for the complete school year following a
quarter's residence on the college campus taking education
courses. The program was in its second year of operation and had
begun largely through the initiative of the local teacher's associ-
ation.
Southeast Center, Seattle: The Southeast Center program (SEEC)
was one of the college's clinical programs. Students spent two
college quarters with the program in Seattle, with the firstquarter called a "laboratory" phase and the second quarter a
"practicum." Trainees were undergraduate seniors. The program
was operated by resident college faculty. Trainees worked in
various Seattle elementary and secondary schools within their
Southeast district, scree If which were in low-income areas. The
laboratory phase of training involved use of instructional modules
(more or less self-contained training packages). This was the
second year that the program had the two-quarter clinical feature.
Project Turnabout: Project Turnabout, located in one elementary
school in the Everett (Washington) School District, was in its
first year of operation. The total operation of the elementary
school was a cooperaAve effort between the college and the
school district. Five clinical professors, including one in
special education, worked %'ith teams of laboratory and practicum
-5-

phase undergraduate students. All professional educationalcourse equivalents were taught on site. No intern went into
the practicum phase until the last quarter of the school yea'.The general training sequence from a laboratory to a practicumphase was similar to the Southeast Center. Teacher training
placed considerable emphasis on individual consultatica. Some
instructional modules were used.
Teacher Corps: Western Washington State Col_ Cycle
teacher corps program was a two-year graduate pLogram leading
to the M.Ed. During the year of this study it was located in
four smaller, somewhat rural school districts. Trainees were in
their second year. Some had dropped out of the M.Ed. sequence
and were working toward certification only. During their first
year, interns had worked on a variety of grade levels. The pro-
gram's original intent was to work in the middle school level;however, this year they were working primarily on the elemen-
tary level. Another original purpose was to focus on the teach-
ing of rural disadvantaged and Indian children. The program was
also attempting to make two other features operational: communityinvolvement in the teacher training program and a means by whichtrainees could participate in determining their training programon the basis of self-analysis of competency needs. Some Teacher
Corps teams had helped ,3et up and maintain classroom team teach-
ing situations. Because of certain controversies during thefirst year, two teams had shifted to new districts (and teamleaders) for the second year. Teacher Corps, Washington, D.C.,
provided support for this research study.
Project 1070: "Project 1070" was an USOE-funded program designed
to train and retrain teachers for early childhood education. The
program operated in six school districts. The first year of
operation concentrated on training fellows to be teacher trainers
for early childhood education. During the year of this study,
the second year of the project's operation, other teachers wereto be assisted by the fellows and by college faculty to become
trained in special features of early childhood education. At the
same time these experienced teachers were working with the
fellows, undergraduate student teachers, specializing in earlychildhood, were also assigned to many of the experienced teachers'
classrooms. With hesitation, the decision was made to select ex-perienced teachers rather than fellows or student teachers for
subjects of the study.
Teacher Researcher Program: The Teacher Researcher Program,initiated and managed primarily by Dr. Vernon Tyler, located inthe Whatcom Middle School of Bellingham, Washington, was a pro-
gram for college juniors. Participation in this program could
reduce by half the requirement for student teaching in theirsenior year as well as meet several requirements for education
course credits. Full participation by interns meant location in
the school building on a half-day basis throughout the year plus

classe, and seminars on teaching on campus in the afternoon.Some students participated for only one or two quarters rather
''-tali three. (Unfortunately, this developvent was not antici-ated soon enough in the research study and resulted in areduction and possible distortion of data collected.) The at-
tempted emphesis in the program was on tutoring, behavioralmotification, learning diagnosis, and working in teams as
helpers to teachers. This program had no outside support
monies.
Conventional: The conventional or brand X teacher trainingprogram of the college was for seniors and usually involvedonafull-day assignment for one quarter in the public schools.Students in the program typically completed most professionaleducation courses on campus prior to student teaching. The
student teaching experience was likely to have considerablevariation depending on the individual supervisors and class-room setting to which students were assigned. Despite theexistence of several training programs at the college duringthe year of the research study, a large majority of the educa-tion students at Western Washington State College were to be
trained by the conventional program.
It was believed that these programs, with their variations
in student composition, setting, and training emphases, could provide anatural laboratory for the study of teacher education, particularly at-tempts at competency-based teacher education.
Selection of Subjects:
Original plans for random selection of 15 subjects from each of theprograms were abandoned for reasons (a) that the time lag occasioned by
the need to develop measuring techniques decreased the actual time avail-
able for collection of data; (b) the random selection of subjects wouldhave required more travel, more buildings to visit, fewer subjects to be
seen during any one day, and consequently less information on fewer
students; (c) that even with random sampling, the population to which
generalizations could be inferred statistically would be limited to seventeacher training programs of one institution during one year; (d) thatfor a descriptive-analytic study involving the examination cf the inter-relationships of several measures, a compelling need for random sampling
was not apparent. The difficulty in gathering information on certainindividuals for various reasons throughout the year also influenced theselection, substitution, and dropping of some subjects. The means by
which subjects were selected and the numbers finally included from each
program are indicated below:
(1) Auburn: The number of trainees in the Auburn Program numbered
only twelve and all were included.
(2) Southeast Center, Seattle: Students were selected from theSoutheast Center program who had their practicums either during
7

winter or spring quarter. In each quarter, secondary andelementary students were selected on the basis of appropriatefield (fields such as physical education, art, and music werenot included), and locations in various buildings after discus-
sion with the Director. Five elementary, three middle school,and two high school trainees were selected for winter quarter;four elementary and four high school trainees were selectedfor spring quarter.
(3) Everett: The Everett students were included in the study onlyduring spring quarters because that was the first quarter inwhich any student entered the practicum phase. Apart from
those in special education training, 15 students were eligible
for study and all were included.
(4) Teacher Corps: A decision was made to select Teacher Corps
subjects on the basis of site. By selecting three sites out
of the possible four, there were potentially 16 subjects. The
site not selected involved four interns located in two buildings
several miles apart. "Entry measures" were taken on thesestudents during their second year in the program, and one of the
post measures was an instrument that had taken three times the
previous year. Interns were studied during winter and springquarters in two of these school districts. Negotiations with
the third school district, involving five interns, were soprolonged that they were not included until spring quarter.One student in this district refused to participate leaving atotal of 15 subjects.
(5) Project 1070: Eighteen subjects were selected from Project
1070. These subjects were experienced teachers who were workingboth with Fellows and with student teachers. There was diffi-
culty in deciding who were the appropriate subjects for studyin this program, the Fellows, experienced teachers being re-trained for early childhood, or student teachers. The rather
arbitrary decision to include the experienced teachers addeda new element to the whole study, one which permitted certain
comparisons of teaching behavior between trainees and experi-enced teachers, but it also created problems in collectingsome data and interpreting some variables. Project 1070
operated in six different school districts. To ease transpor-
tation and time limitations, subjects were selected from only
three of these districts: Bellingham, Burlington-Edison, and
Sedro Woolley.
(6) Teacher Researcher Program: Twenty subjects, or almost all of
those in the program, were included from the Whatcom Middle
School Teacher-Researcher Program. However, for reasons of
inability to sign up for sufficient credit hours, twelve stu-dents dropped out of the program before spring quarter andbefore it was realized that there was an immediate need to
complete information-gathering on these particular trainees.
8

Tr
These twelve trainees had one classroom observation and hadfilled out entry information, and this information was retainedfor ana3ysis, despite possible bias stemming from a preponder-ance of first-and-only observational data on the majority of
subjects who were to drop out (most would be expected to continueeducation training during their senior year.) The decision to
retain subjects such as these was influenced by the limitationsimposed on multivariate analysis by a low number of subjects to
number of variables ratio.
(7) Conventional: Students in the Conventional student teaching pro-gram were selected both winter and spring quarters partly for
reasons of location (clustering in a single building or school
district preferred) and variation in grade levels taught and
communities. On the secondary level, students in fields such asphysical education, art, music, and technology were excluded.School districts included one suburban (Edmonds), one middle-sized (Bellingham), and two partly rural school districts (Mount
Baker and Burlington-Edison). Seven elementary and five second-
ary trainees were selected winter quarter, and three elementary
and two secondary were selected and studied during the spring
quarter.
All told, there were 114 subjects from the seven training programson whom sufficient information was gathered for the overall analysis.1
The distribution of subjects by program, school district and
school building is presented in Table I. Table II presents dis ribution
of subjects by program and time of inclusion in study.
Instrumentation:
Development and selection of the measurement instruments for a pro-ject of this scope was a large task, particularly since there was littletheoretical focus for the selection of instruments (no doubt there weretheoretical assumptions implicitly involved in instrumentation, but theywere sufficiently eclectic and lacking in a unified rationale to provide
a functional screen for possible instruments).
Selection of variables was based on a conceptual framework which
had three broad categories: entry characteristics, program characteris-
tics, and teaching-eNit characteristics. Within each category several
possible variables were then named. During late summer and fall, 1971,
-Additional data relative to variables of precision teaching, con-tingency management, and/or behavioral modification were gathered onsome subjects in the Teacher-Researcher and Everett Turnabout programs.At the time of this report the data have not been prepared for analysisbut the potential of studying the relationships with variables in this
study remains.
9

TABLE I
DISTRIBUTION OF SUBJECTS BY TRAINING PROGRAM AND LOCATIONOF FIELD EXPERIENCE
School DistrictSchool Building Auburn SEEC
Training Program Turn-Cony. about1070 T-Res T.Co ds
AnacortesFidaigo Elem. 7
AuburnSouth Auburn Elem. 9
Evergreen Elem. 3
BellinghamBirchwood Elem. 2
Columbia Elem. 2
C. Cozier Elem. 1
Marietta Elem. 1
Lowe...1 73 em. 3
Roeder Elem. 2
Roosevelt Elem. 1
Sunnyland Elem. 1
Bellingham H.S. 2
Whatcom Middle S. 20
Burlington-EdisonAllen Elem. 2
Roosevelt Elem. 1 1
Umbarger Elem. 1
Westview Elem. 1 1
High School 1
EdmondsOak Heights Elem. 3
College P1. MiddleSchool 2
LverettGarfield Elem. 15
LaConnerLaConner Elem. 4
Mt. BakerH.S. (Grade 7-12) 4 2
SeattleDunlop Elem. 6
Emerson Elem. 3
Rainier Beach H.S. 6
South Shore M.S. 3
Sedro WoolleyBig Lake Elem. 1
Clear Lake Elem. 2
Mary Purcell Elem. 2
10

TABLE II
DISTRIBUTION OF SUBJECTS BY TRAINING PROGRAM AND TIME OFINCLUSION IN STUDY
Time Training Program Turn-
Auburn SEEC 1070 T.Res. T. Corp. Cory. about
Winter Quarter(Jan-Mar.1972) 10 12 12
Spring Quarter(Mar-May 1972) 8 4 5 15
Both Quarters(Jan-May 1972) 12 17 8 11
estimates were made of which variables could be measured, given time andresource limits, so as to provide data from each program suitable formultivariate analysis. This time was also spent on selectimg items, con-structing paper and pencil instruments, and practicing and eclectic obser-vational procedure. Frequently, a decision was made on a variable or theinstrument for its measurement. on the basis estimated feasibility ofcollecting data on all subjects. Estimates of feasibility were .used on
staff time, resource limits, and tolerance of subjects. Decisions on
this basis were felt necessary despite the belief that the relationshipbetween ease of gathering information and importance of the informationis strong, linear, and negative. Also, there was the limitation that avariable important to one program could not be included unless the vari-able could be measured in all programs (for example, ratings of thequality of baseline data collected could be important to a training pro-gram stressing precision teaching, but this rating of quality could notbe meaningfully applied where baseline data were not kept). Despite de-
sires to continue refining instruments, most modifications had to becomplete by the end of fall quarter, 1971, in order that data collectioncould begin. Little modification of the instruments occurred after thattime save for occasional que!,tions on how to resolve matters coming fromclassroom observation and development of an interview schedule.
Questions of logistic limits forced exclusion of most pupil learningand attitudinal variables. This was believed quite unfortunate, but itsimply did not seem possible to gather data on these variables save forwhat could be inferred from certain verbal interactions with the traineesand estimates of attention to task behavior. The consoling thought was
that it was unlikely that the trainees would by themselves, consideringtheir contact time with pupils and the competing influence of otherfactors, have sufficient impart on the students to create a learning dif-ference discernable by paper and pencil or interview instruments.
11

Information was gathered by six procedures: (1) a paper and pencil
instrument, usually filled out by the subject when he started the program,which included items of personal background information and various atti-tude or opinion scales; (2) a paper and pencil opinion instrument filledout by the student toward his completion of the program; (3) classroomobservation by project staff members; (4) ratings by building principalsof individual interns; (5) interviews with interns and cooperating teach-ers asking for certain information about the classroom setting and itspupil composition; and (6) interviews with the training program directorsand certain features of the training program and the personnel involved.
The major variables of the study are listed in this section togetherwith some indication of the measurement procedures and the code used fordata processing. Included are some variables originally proposed for thestudy but later dropped for one reason or another. A more complete list-ing of variables and measurement procedures is given in Appendix A. Code
numbers with a zero after the decimal usually indicate rather generalizedvariables; measurable indicators of general variables, most of which arelisted only in Appendix A, usually are coded with numerals other than zeroafter the decimal. The code system was set up in the hope that it could
be retained and expanded for future studies.
(Entry Characteristics)
E1.0 Scholastic aptitude. This variable was dropped from the studyafter it was found that data from no common measure was avail-able on a large majority of subjects and it was decided thattrying to have all subjects take a common measure was pressingtheir tolerance and our luck a little too much.
E2.0 Sex.
E3.0 Scholastic achievement. Measured by self-reported grade point
averages.
E4.0 Undergraduate vs. graduate status.
E5.0 Previous experience with children, divided into four types:Babysitting (E5.1), church and Sunday school (E5.2), Recreationand camp programs (E5.3), therapeutic and other types of train-ing work with children (E5.4).
E6.0 Social class background. Two indicators used: prestige rating
of Father's occupation (E6.1) and highest level of Mother'sformal education (E6.2).
E7.0 Attitude toward training program. Also listed as a program
variable.
E8.0 Tolerance of Ambiguity. Attitude scale on questionnaire.
E9.0 Activist orientation. Attitude scale on questionnaire.
12

E10.0 Social Responsibility. Attitude scale on questionnaire.
F11.0 Dogmatism. Attitude scale on questionnaire.
E12.0- Clusters of attitude items formed by regrouping items from scales
E15.0 pertaining to E8.0 to E11.0. See Appendix A2
E16.0 Participation in campus activities. Ratings of reported partici-pation in several categories, such as E16.91, student government
activity ratings.
E17.0 Age.
(Program and Setting Characteristics)
P1.0 Age and grade level of children taught by trainee.
P2.0 Minority group and economically disadvantaged children. Portions
of classes taught by trainee composed of children of selectedminority groups, for example Mexican-Americans (P2.13), andeconomically disadvantaged families (P.2.25).
P3.0 Rural vs. urban setting.
P4.0 Instructional modules (training packages), use of for teacher
training.
P5.0 Field-Centeredness. Scored as number of credits earned (P5.1)or quarters spent (P5.2) during off-campus field component of
teacher training.
P6.0 Reported local control of programs by teachers' association(P6.1) or parents' g-ow (P6.2).
P7.0 Teaching responsibility given interns. Data not gathered on
this variable.
P8.0 Microteaching. Number of episodes during training.
P9.0 Philosophy of project staff. Data not gathered on this variable.
P11.0 College supervision scored according to number of observations
and conferences. (No P10.0 variable--mistake in coding).
P12.0 Trainee choice over content and objectives of program, self-perceived.
P13.0 Experience of cooperating teacher.
P14.0 Attitudes of school personnel toward professional education.
P15.0 Individualization of teacher training.
13

P16.0 Intellectual challenge of program, perceived by trainee.
P17.0 Rated effectiveness of cooperating teachers.
P18.0 Conformity of program to ComField model laboratory--practicumsequence. No data collected on this variable.
E19.0 Trainee attitude coward gaining program (P19.17, same as E7.1).
(Teaching and Exit Characteristics)
Most teaching characteristics were bard on averages obtained fromthree classroom observations on a subject.
T1.0 Building principal's rating of trainee.
T2.0 Verbal interaction patterns with classifications of -..erbal inter-2
action based on modification from Flanders' interaction analysis.Included use of "indirect" or "extended indirect" (six secondsor longer) influence (T2.1 and T2.2), "direct" and "extendeddirect" influence (T2.3 and T2.4), occurrence of pupil-initiatedcomments (T2.5 and T2.6), and extended information presentation(T2.7) for varying kinds of classroom organization as identifiedunder T3.0.
T3.0 Use of whole class vs. individual or small group classroom or-ganization.
T4.0 Cognitive level of expected classroom work, classification basedprimarily on general categories from a cognitive taxonomy ofeducational objectives,3 including usage of above knowledge levelof questions (T4.1), above comprehension level questions (T4.2),question usage vs. no questions (T4.3), and substantive questionsvs. procedural matters (T4.4).
T5.0 Pupil attention to task, as rated by observers.
T6.0 Individualization of instruction as rated by observers.
1It was suspected that three observations would not provide very re-
liable scores for a single individual but that it might be sufficientlyreliable for examination of group trends.
2Flanders, Ned A., et al. Teacher Influence, Pupil Attitudes, and
Achievement. USOE Cooperative Research Monograph No. 12, 0E-25040.Washington, D.C.: U. S. Government Printing Office, 1965.
3Bloom, B. S., et al. Taxonomy of Educational Objectives Handbook
I: Cognitive Domain. New York: David McKay Co., Inc., 1956.
14

T7.0 Adjective pair ratings of classroom and teacner trainee by ob-servers, including dull-stimulating (T7.2), disorganized-systematic (T7.3), and harsh-kind (T7.4).
T8.0 Variety of teaching methods. So far unobtained ratings of
observer comments.
T9.0 Variety of materials. So far unobtained ratings of teachingmaterials used.
T10.0 Commitment to teaching. Two-item attitude scale.
T11.0 Proclivity toward child-centered, problem-solving teachingbehavior. Score on Teaching Situation Reaction Test.
Data Processing and Analysis:
Preparation of Data for Analysis: The amount of data collected per
subject was large. Counting variations of general variables, such asindividualization of training as perceived both by project directors andby trainees, the number of variables for which data were processed was
well in excess of 100. Several of the variables offered unique problemsthat had to be solved in turn before data were made amenable to multi-variate analysis.
To be suitable for eaalysis, data on any variable had to be (a)scaled, even if only dichotomously, (b) present on all subjects, and (c)averaged per subject when there were more than one measurement on a sub-
ject. In some cases these steps had to be preceded by somewhat arbitrarydecisions about the number of subvariables or facets of a general variable
to be involved in a set of data.
An example may illustrate the steps a set of data went through prior
to analysis. "Previous experience with children" was originally proposed
as an entry variable. The initial questionnaire was chosen as a means of
. gathering data on this variable. With difficulty in anticipating thenature of what subjects might report, the item devised on the question-naire was somewhat open-ended, asking for type of activity and amount oftime with each and providing examples ("babysitting: 10 hours/week forten years"). Upon examination of the responses to this item, the diversityof reported experiences made it difficult to conceive of "previous experi-ence with children" as a very homogeneous variable. Consequently, the
variable was subdivided into four, according to how the responses seemed
to cluster: baby-sitting, church group and Sunday School, recreationprograms and camp counseling type experience, and other (which included asubstantial proportion in therapeutic training, hospital, and tutoring
type experiences). Then it was decided to measure each on the basis of
reported amount of time. Total number of hours for each type of experi-ence were computed or estimated (depending on how complete the responsewas) for each subject and placed on a scale. Mostly because a large
number of subjects reported no experience in any single category, arather intuitive decision was made to group the total number of hours ac-
cording to a four or five point rating scale. With little certainty
15
but with no better alternative apparent, it was decided to count blanks
as zero values rather than non-:esponses. The ratings were then made
and recorded on the questionnaire form. Then the ratings were transferred
to punchcards along with other data from the questionnaire. A computer
program was written to provide summary descriptive statistics for theseand Ether variables, both overall and for each training program. The
program had to detect missing data for any variable and discriminate miss-ing data from zero values of collected data--and actual zero values tookdifferent forms for different variables (in the case of child experiencevariables, the lowest rating given, for no experience, was a "1" so that azero or blank would indicate no data on that variable for that subject).The experience ratings were punched on new cards by a computer programwhich condensed the number of variables most likely to be analyzed intoa format more suitable for reading by the cardreader. In so doing,
missing data values were given the special identification value of -.01.The summary statistics program was then applied and reapplied to the newcards, with reapplications interspersed with considerable debugging.Cards for individuals for whcm no data were collected on previous experi-ence with children (some subjects did not return an entry questionnaire)were pulled from the stack and new cards punched, this time with groupaverages (obtained from the printout of the summary statistics program)substituted for missing data. This step required identification of eachsubject ID number on the card as belonging to a particular training pro-gram. Then, finally, the data on previous experience was deemed readyfor multivariate analysis--except that with a higher variables-to-subjectratio, a decision had to be made about which of the four ratings to ex-clude from an initial analysis.
The data on the teaching variables went through some of the samesteps, but there were differences. First of all, the data on the observa-tion recording forms had to be compiled on a summary form by the observer
before keypunching. This step involved such things as counting the num-ber of time segments during which a type of verbal statement, such aspraise, occurred while the class was organized according to small groupsand then placing the number in the appropriate blank. After keypunching
the data from each summary sheet, the values had to be averaged foreach subject (usually but not always there were three summary sheets persubject) so that there was a single score on a variable per subject.This required writing a separate computer program that generated a newset of cards containing the average scores. Substituting missing data
usually was not a problem for teaching variables because no subject wasincluded unless he was observed at least once. The exception to this was
for certain ratios of time segments where the denominator was number oftime segments during which the class was organized according to a specificpattern, such as whole group; appropriate summarization of these ratioshad to distinguish, for instance, a 0/15 from a % ratio.
When data were finally prepared for initial multivariate analysis,there were sixteen computer punchcards of data per subject. The cards
which had been assembled by card number for the summary statistics werethen reassembled in order by subject.
The steps taken to prepare data for analysis have been described in
16

some detail here to provide the reader with some idea of the number ofphases where error could have crept in through mistakes in preparation.Checks were made on accuracy of each step taken for certain variables forcertain groups of subjects, but an exhaustive check of all steps on allvariables was not possible.
Data Analysis: The first step in data analysis, taken along withdata preparation, was a compilation of descriptive statistics. The
descriptive statistics included mean, standard deviation, number ofscores, and a twenty-interval frequency distribution for each variable.The descriptive statistics were computr%.1 all 115 subjects as a total
group and separated for each group of su.jacts within a single trainingprogram.1
In addition to the other descriptive statistics, a correlationratio (n2) was computed with a desk calculator for most of the variableswith subjects grouped according to training programs. The correlationratio in this case was a descriptive device indicating how much of thevariation of a score could be associated with the training programs.
The data were then analyzed by means of factor analysis. Factor
analysis was used to detect whatever clusters or patterns of interrela-tionship among all the variables did occur for the purpose of derivingplausible explanatory hypotheses relevant to teacher training and be-
havior. In particular, factors were examined for the co-presence oftraining program and teaching variables in order to find clues aboutwhich behaviors were sensitive to training and which program variablesthey were sensitive to. Such clues, even if highly tentative, couldprobably provide a better basis for program planning than has existed(presumably, a well-planned training program would not intentionallyattempt to influence behavior not subject to influence). For example;
an identified factor might include these variables:
Age level of childrenSex of traineePupil attention during classPrevious experience with childrenRural vs. urban setting
In this factor, it would be noted that no training or other teachingvariable occurred; pupil attention would appear to be a function of entryand classroom setting characteristics only. On the other hand, an identi-
fied factor might be loaded with the vollowing variables:
Individualization of training of traineesDogmatism of traineesIndividualization in classrooms taught by traineeTrainee commitment to teachingNumber of instructional modules completed by trainee.
1One subject on which little information was gathered was later
dropped to make a total of 114 for multivariate analysis.
17

In this case, the factor would imply that, if individualized teach-ing is a goal of a training program, the training program itself hadbetter serve as a model for individualization and that it might do sothrough the use of instructional modules.
Given any cluster of variables, several interpretations might beplausible. An interpretation might have implications for program plan-ning and it might have implication for further analysis or new research.Judging the relative plausibility of rival interpretations would likelybe on the basis of rational judgment extraneous to anything in thisproject--and could possibly be a rather worthless enterprise--but whererival interpretations appear important for one reason or another, somedirection is given about where to apply additional multivariate analysisif such analysis holds promise for arbitrating plausibility.
A principal component factor analysis was applied to the data.Fifty-four variable,: were chosen for the first factor analysis mostlyon the basis of estimated relative importance and partly on apparentsuitability for multivariate analysis according to the summary statistics.Deciding on the maximum number of variables that could be profitably in-cluded in a factor analysis with 114 subjects was of some concern becauseof the fairly high variables to subject ratio. It was determined throughfamiliarity with the variable, guesswork, and trial-and-error through asequence of analyses. Given a practical upper limit of less than, say,sixty, all possible combinations and permutations from the total set ofvariables was a practical impossibility.
Before the factor analyses could be run successfully, considerableadditional debugging had to be done, mostly concerning mechanical prob-lems of card order and card-reading (a 1/64" offset error on punchcardscaused by the keypunch machine created problems and delays, for instance,before it was rectified). Summary statistics provided by the factoranalysis served as a basis for a partial check on accuracy through com-parison with previously -ran summary statistics.
A factor analysis was also performed on twenty-five variables for asubgroup of subjects, those 'A who completr :d and returned the secondquestionnaire. The reduced factor analysis was necessary to utilize whatinformation was included on the second questionnaire after it was deter-mined that estimation of missing data for the remaining 53 subjects wouldbe carrying things a bit too far.
After the factor analyses, discriminant analysis appeared to be thebest alternative and was performed on data on selected variables. The
purpose for the discriminant analysis was somewhat different than thatfor the factor analyses. The discriminant analysis was designed to re-veal the greatest differences among training programs concerning theentry characteristics of the trainees and the teaching characteristicsof the trainees. Should the data on the training variables be the weak-est part of the data, as was suggested, revealed differences in teaching
characteristics could provide a framework for further ex post facto examina-tion of the training programs and associated characteristics not detected bythis study.
18

In addition to factor and discriminant analyses, canonical correla-tions were obtained between sets of teaching variables and sets of entryand of program variables. The main reason for the canonical analysiswas to assess the extent to which selected teaching variables wereassociated with and predictable from entry or program characteristics.
Time and Sequence
The first part of the project, from September through December 19,1971, was devoted to the selection and modification of measures, con-sideration of which variables were to be included, discussion withprogram directors and other personnel, and attempts to identify subjects.By January, 1972, data collection had to begin whether or not the staffwas ready.
During the academic winter quarter, January through mid-March, 1972,entry information was gathered on most subjects, and slightly less thanhalf of the observations were made. Data collection efforts increasedduring the spring quarter of 1972 (producing another limitation, namely,the possible lack of generalizability of observational data to othertimes of the year or to trainees whose field experience occurred earlierin the school year). All subjects in Project Turnabout were observedonly during spring quarter. Subjects in the Auburn program, Project 1070,the Teacher-Researcher program, and two Teacher Corps teams were observedover two quarters, January through May, 1972. Winter quarter and springquarter subjects in the Southeast Center and the conventional programwere different.
With limitations of personnel, data processing could not begin inearnest until the summer of 1972. All activities to collect data, includ-ing tracking down persons who did not return certain forms (only partlysuccessful) took most of the time that otherwise could have been devotedto preparation for data processing.
Data processing proceeded slowly through the summer and :all, 1972,as the obstacles created by the large number of variables, the diversityof data forms, and the perverse intractability of the computer becamemore apparent. Data from observations had to be put on a summary formfor each observation, then keypunched, then averaged across observations(requiring a special computer program) before summary statistics could beobtained. Summary statistics had to be obtained before decisions aboutwhat to include in multivariate analyses. Missing data gaps also had tobe filled in with group averages prior to analysis. Information aboutsuch things as prior campus activities had to be rated on a scale, anda scale for several such variables had to be devised prior to rating.Multivariate analysis began in November, 1972, even before all summarystatistics were obtained and before averages for all missing data weresubstituted (concerning variables not included in initial analysis).By January 1, 1973, project work Pad included 261 machine entries at theWWSC computer center and had used six and one-half hours of IBM 360/40or 7090 computer time.
19

SECTION III
LIMITATIONS AND PROBLEMS OF THE STUDY
With the number of variables studied, the number of people and sitesto work with, the diversity of the field setting, the time constraints,and the newness of its design and the instruments, it was expected thatthere would be numerous obstacles in the study. The obstacles createdlimitations. Several limitations as perceived by the investigators aredescribed in this section. This listing is probably not exhaustive,for an accounting of all the problems encountered would have taken moretime and effort than data collection itself. Those limitations andproblems listed here should nevertheless give the reader some flavor ofwhat was encountered and enable him to better understand the qualifica-tions to be placed on the findings.
Development of Instruments:
The time requirements of the project di,..tated that all instruments
had to be selected or developed between September and December, 1971, con-currently with orientation of program directors and other planning. Withno integrated and restricted theoretical base and with a desire to includeas wide a range of variables as possible, the project utilized a largenumber of measures. Guesses were made about how many forms the typicalsubject would wish to or would agree to complete. Estimates were alsomade about the types of information that could legitimately be scaledfor multivariate analysis. Forms were modified by a trial-and-errorprocedure, but the time for trial and the number of trial subjectsseemed all too limited. Responses to many items could not be cross-checked for reliability. A partial attempt to correct this deficiencywas by having more than one item or measure for a particular variable(such as having both the subject and the college project director reportindependently the number of microteaching episodes).
The classroom observation was also an eclectic procedure thatattempted to gather a maximum of diverse information within a short timeperiod. While some time was devoted to developing consistency and ob-server reliability, the time available for this work was not as much asdeemed desirable.
For some variables there was a lack of any obvious, clear-cut meas-urement criterion. Estimation of social class background of subjects,for instance, required decisions -miong different and imperfect indicators.
1An interesting argument that time spent for developing high inter-
observer reliability can easily be excessive and even misleading has beenpresented by Donald M. Medley and Daniel P. Norton, The Concept of Relia-bility as It applies to Behavior Records, paper presented to the 1971meeting of the American Psychological Association, Washington, D.C.
20

There also seem,:d to be various and somewhat inconsistent criteria used
in different school systems to estimate the number of children from dis-
advantaged families in classrooms (The heterogenity of the concept itself
caused problems; should a child from a rural welfare family and a child
of an unemployed Boeing engineer be classified together?).
The logistic feasibility criterion frequently seemed too oppressive.
Measures of some variables deemed quite important had to be discarded.
These included academic aptitude of interns and pupil goal perception in
the classroom. Also, variables important for some training programs,
such as the management of contingencies or the keeping of baseline in-
formation in programs emphasizing precision teaching, could not beincluded because they could not be meaningfully measured in another pro-
gram, with the result that these variables were not included (the fact
that baseline information was not kept could be "measured," but the degree
or qualit:, of baseline information kept would have been a variable meaning-
ful to only one of the programs).
Certain other items crept in for God knows what reason, and the re-sultant unanalyzeddata can still be found somewhere on punchcards or
forms. (For example, region of birth of subject.)
Subject Selection, Mortality and Cooperation Problems:
Despite the original plans, subjects were by and large not randomly
selected from programs for reasons mentioned previously. Reasons were
logistical problems of visiting geographically-dispersed subjects within
a limited time period, the small number of trainees in some programs, and
the lack of a compelling reason to sample subjects randomly for a descrip-
tive-analytic (as opposed to an experimental or sample survey) study.
Consequently, no inferences can be made to other subjects on a statistical
basis. Any generalization would have to be an intuitive estimate that the
analysis of certain interrelationships found among subjects in some pro-
grams would also likely be present with roughly comparable subjects in
similar programs. The cooperation of subjects was much better than feared,but there nevertheless were instances where some subjects did net wish to
fill out forms or have their classes observed. This involved the loss of
no more than one or two subjects per program, but the loss could not in
any conceivable way be considered random. A more common problem was the
c,:ct that we were not able to collect all information on a subject. A
subject might, for instance, provide information on all measures except
the final questionnaire. A large number of subjects had missing values
for at least some variables. (See Appendix B.) Group averages were sub-
stituted for missing data (there seemed no alternative for multivariateanalysis), based on the dubious assumption that there was no systematicdeviation of missing from collected information within a program. There
was also the possibility that subjects filled out some forms and gave
some answers in some frivolous or distorted way. There was no way that
this was assessed, but the subjective impressions of the investigatorswere that the reactions of most subjects were cooperative and serious.
21

Problems of Reliability, Standardization, and Measurement Conditions:
The reliability of the measurement procedures, including the stabil-ity of observational data, was not empirically assessed. It was not
known how much the random errors of measurement were compensated for byhaving 114 subjects in the study. It was known that the number of sub-jects had to exceed the numbe:- of variables for any multivariate analysisto be performed. It was also known that a desirable subjects to vari-ables ratio and a sufficient number of subjects to insure adequate com-pensation for random error was beyond realization for this study. The
study simply included as many subjects as it could in the hope that realpatterns of relationships could be detected despite whatever unreliabil-ity existed.
For some variables, such as grade level of children taught, measure-ment was straightforward and not plausibly subject to error. For others,errors were more likely. Academic performance was an example. It was
not possible to secure and examine grade records or transcripts for allsubjects in all programs (if all subjects had been undergraduates, suchexamination could have been done); the less satisfactory method of ask-ing subjects to report their undergraduate grade point average was em-ployed, and the accuracy of their self-report was not known. Most sub-jects were observed in the classroom three times, and observational datafor a person were averaged across observations. The judgment that, whilethree observations were not a sufficient number for a decently reliablescore on an individual, they would provide sufficiently reliable data forgroups of trainees was based on little more than intuition.
To the extent that measurement errors were random, the consequencewould have been simply a lessened chance of detecting true relationshipsand calling them statistically significant. However, the likelihood ofnon-systematic errors, confounded with other variables, remained. To
take the example of grade point average again, reported GPAs, even if ac-curately reported, were from different institutions and different majorfields with no guarantee of equivalence among them and no guarantee thatthe differences were unconfounded with other variables (graduate traineeswith GPAs based on undergraduate work at other institutions were concen-trated in two training programs).
Varying classroom organizational patterns presented one of the morepernicious problems. The assumption behind the development of the meas-urement procedure employed was that it could be applied to any classroomobserved. However, the problems imposed by individualized patterns ofinstruction were underestimated. Measuring the cognitive level of ques-tions asked in a whole-group situation was one thing. Measuring the levelof questions to which pupils were responding when working on differentthings in small groups or as individuals was something else. In part,
their difference was monitored by recording the type of classroom arrange-ment, but the resultant data were not easily amenable to analysis; someteachers had only data from individualized setups and some only fromwhole-class arrangements, and these teachers could not be compared oneither one of the conditions. Interpretations of the results need keepthe differing patterns of classroom organization in mind. To some
22

extent at least the correlation produced by the analyses would reveal theproblems of such discrepancies, but potential devious interrelationshipsexceed that which could be detected.
Working definitions of economically disadvantaged children alsotended to vary between schools and persons asked, and it was not possibleto obtain this information from the person in the same position, such asprincipal, in all locations. Furthermore, it was not self-evident thateconomic disadvantage, however defined, entailed the same things in dif-ferent locations; economic disadvantage may have implied one set of thingsfor a Seattle family and another set of things for a rural family nearSedro Woolley, Washington.
Conditions for gathering information were not standard--again bynecessity and not, by choice. In some cases, as for the initial question-naire for subjects in the Everett Project Turnabout, a specific time andlocation was found to complete the questionnaire. In other programs,questionnaires had to be left with the trainees or program directors tobe returned (sometimes) by mail. Even where specific times and locationswere found for a group of subjects, the times and locations were not thesame between groups--Project 1070 subjects completed theirs duringevening meetings for instance. Data from interviews, such as number ofminority group children, had to be asked of different persons--thetrainee in one school, the principal in another, and the cooperatingteacher in a third. And, different project staff members asked thequestions at different locations (No known bias entered into who askedthe questions where, but unknown bias was not protected against by athorough counterbalancing plan because of staff scheduling difficulties).
The factors of non-standard measurement conditions and other sourcesof possible systematic error make interpretations of results more tenta-tive, particularly for between-group comparisons. Different interpreta-tions of the same pattern of relationship are conceivable, and some arebased on considerations of systematic measurement error.
Problems of Scheduling and Communication:
A complete chronicle of the scheduling and communications problemscould make a separate monograph. Beginning January, 1972, the limitedpart-time staff of the project (three half-time assistants collecteddata) had to devote their main energies to collecting information,leaving little time for schedule coordination and adjustment, not tomention orientation sessions in the field. As indicated previously,this study involved not only seven training programs but also 29 schoolbuildings (each of which had a different principal), in ten school dis-tricts spread out over an area 120 miles long. Orientation discussionswith some key persons were separated widely enough in time so that someagreed upon procedures were forgotten, both by the staff and persons inthe schools. Each school system had different procedural arrangementsfor getting into the buildings and making observations and interviews.Teachers' time schedules were subject to change, and if a message abouta change was given to the project office (several people were very goodabout this), it sometimes was impossible to relay the message to the
23
staff member who was to visit. If the message was received by the staffmember it often was too late to arrange a visit elsewhere. In addition,one staff member lived fifty miles away, another had no home phone, andthe project office's telephone could be manned with a receptionist nomore than half the time.
Some examples: In one school district, after classes had been vis-ited somewhat unexpectedly by persons from a completely different pro-ject (and unLlarity about whom to contact was revealed), the Superintend-ent ruled that no outside personnel could come into the school until af-ter a forthcoming levy election. After that it still was not clear withand through whom the clearances had to be obtained. In another program,questionnaires were first of all administered to the wrong group of in-terns, requiring a separate trip months later to readminister the test.In the Teacher-Researcher Whatcom Middle School program, the operatingassumption was that students were enrolled for the full year. It was toolate before it was realized that a number of students were dropping theprogram after two quarters because of the lack of additional credit hoursthat could be earned through the program. (Most of those juniors were toresume education training their next school year). As a result, approxi-mately half of the subjects were observed only once and had no informa-tion gatnered on them by means of the interview. In another school dis-trict which had a Teacher Corps team, negotiations with the administrationabout entering their schools dragged on throughout the full winter quarter,and data collection did not begin until the spring quarter. Certain sub-jects and building principals who were associated with the full year Pro-ject 1070 program forgot about the procedures from one quarter to the nextand going through preliminary channels had to be repeated. Because oflimits imposed by traveling and schooling, the idea of true time samplingof teacher behavior was pretty much discarded. Certain classroom activi-ties such as recess, play periods, test-giving, teaching by special teach-ers, were ruled out for observation, and there was a tendency to takeobservations during the time when the teacher was "doing some teaching,"even if this were not entirely typical of his activities during the schoolday.
Problems with Appropriateness of Observational Procedures:
Certain types of classroom organization (oftentimes initia,.ed by thetraining program itself) caused certain problems in observing; in particu-lar, the organization of classrooms around learning stations or some openconcept idea was a problem. Standard classroom observational techniquesdid not seem easily adaptable to these different patterns of organization.For instance, it was not always easy to identify which students were theresponsibility of the trainee when the trainee was working with the team.This affected such things as pupil attention scan. If, for instance, anintern were working with a sub-group of six students out of a group oftwenty, the other fourteen being involved with independent study or per-haps with another teacher and not in the physical vicinity, how was thepupil attention scan to be administered? Only with the six students orwith others? Additionally, should the classroom organization have beenregarded as small group, independent study, or whole class? The prob-lem of cognitive level of work expected for differing class organization
24

was mentioned previously. The count of cognitive level of questions
was ordinarily based on time segments, but when pupils were working on
different things in different locations there was no guarantee that they
were all supposed to respond at the same cognitive level. It was pro-
posed in this situation to substitute a pupil-ratio for a time ratio,but this was not consistently or adequately carried out nor could thetwo be considered comparable if it had been carried out. Eventually,
estimates were based on time segments for all situations, often based
on what the teacher was saying to an individual or small group, in the
hope that not too much diversity was missed.
Data Processing Problems:
Various places where error could have crept into the data during the
several stages of data processing have been described in the previous
section.
Despite all problems, data collection and analysis were accomplished.
25
SECTION IV
RESULTS
Descriptive Statistics:
Means and standard deviations were computed for each variable for
each group and for all groups combined. These computations were necessar-
ily performed prior to the multivariate analyses in order that missingdata on subjects could be estimated on the basis of group means. In addi-
tion to means and standard deviations, a correlation ratio (n2) was com-
puted for most variables as a device for describing how much of the vari-ation of scores on a variable could be associated with differences amongtraining programs.
The descriptive statistics as well as a 62-variable correlation
matrix are listed in Appendix B. The sheer number of statistics preventsan exhaustive discussion here, and an attempt to do so would fail torecognize a major purpose of multivariate analysis, namely, to makesense of a large body of data on several variables. Notwithstanding,
some mention of individual statistics on some variables can be made here
bc:cause of their interest independent of subsequent analysis.
Entry characteristics: Few statistics on entry variables were ofparticular note in and of themselves, and few differences among programswere found that were not obvious (such as graduate standing). Reported
general grade point averages hovered around the 3.00 level, and pro-gram differences accounted for only 7.5% of the variance. Program differ-
ences accounted for more of the variation in reported grade point aver-ages in special fields, partly because the special field GPA's forTeacher Corps were roughly the same as for the general GPA, whereas thespecial field GPA in the other programs were greater than the general GPA.
With no normative reference point for the entry attitude scales, thereported figures have little meaning apart from between-group comparisons.Program differences accounted for 24.3% of the variance in the intoleranceof ambiguity scale, 17.8% of the dogmatism scale variance, 17.1% of therelated cluster score variance for the first of four item clusters (aslisted briefly in Section II, four item cluster scores were derived froma cluster analysis of the items of all opinion scales, such as dogmatism,
on the entry questionnaire; explanation is in Appendix A2). On the
intolerance of ambig...,ity scale, Teacher Corps scored low (showing hightolerance), while Project Turnabout, Conventional, and Project 1070
groups scored high. Little in the way of association with program differ-ences occurred for the other attitude scales.
Program and Training Variables: For prosram and setting character-
istics there were both obvious and not-so-obviou. .sults. The average
grade level in which the trainees taught was a little over the fourth,with Prolect 1070, obviously, and Project Turnabout (Everett) traineesworking in the lower grades; and those programs which included secondarylevel trainees, Southeast Center and Conventional, having the highest
averages.26

Nine percent of the pupils in classes taught by trainees werereported to be of one of three minority groups--Black, Mexican-American,
and American Indian--with percentages ranging from one at Auburn toeighteen in Southeast Seattle.
The accuracy of the data on those training variables included wassomewhat suspect, possibly reflecting the variations in the way certainquestions were posed to different respondents. The correlation betweenthe number of instructional modules used as reported by the trainees andby the program directors was r = .17, with a big difference occurring inone program. Trainees reported studying an average of 3.6 modules withtwo programs, Auburn and Turnabout, reporting the greatest usage.
The reporting of micro-teaching episodes was complicated by theproblem of trying to define micro-teaching in a clear and acceptable way.With a narrow definition, very few episodes were reported in any program.With a broader definition, recollections of what constituted micro-teaching probably varied. Trainees reported experiencing an average ofthree episodes using the broader definition with the Southeast Centertrainees reporting the most (6.65), another clinical program; Turnabout,second (3.24), and the Conventional program third (3.24). In the conven-tional programs, trainees generally referred to episodes in methodscourses prior to student teaching.
As with micro-teaching, reports of supervisors' observations coupledwith conferences were plagued by varying recollections perhaps partly dueto varying definitions of a supervisory observation. Moreover, the mean-ing of this variable was complicated by the likely tendency in some or allprograms to increase observations for trainees having trouble and also bythe fact that supervisory visits were not a part of the program for theexperienced teacher subjects in Project 1070.
When asked about how much say trainees had over their own program,few sharp differences among programs occurred when separate items of thesix item scale were summed. This was an explicit feature of TeacherCorps but not of other programs. The average response to an item was amoderate-to-high rating of 3.96 out of 5. Moderate program differencesoccurred for separate2items on this scale such as P12.15, influence overtrainee evaluation (n = .136).
Trainees had differing perceptions about how much their own programwas individualized, with Turnabout and Auburn trainees reporting the mostand trainees in the conventional program the least individualization.
Teaching and Exit Characteristics: Trainees were observed as hav-ing their classes organized so that pupils worked in small groups 38% ofthe time and as individuals (this included seatwork) 24% of the time,leaving 38% of the time for whole class arrangements. Program differencesaccounted for no more than 20% of the variance of these variables (T 3.1,T 3.2, T 3.3 and T 3.4). Teacher Corps interns most frequently used smallgroup class organization, with the Teacher-Researchers second. In theTeacher-Researcher program, subjects, who were juniors, were probablyviewed primarily as teacher assistants rather than as student teachers.
27

The recorded use of indirect verbal influence, according to Flanders'categorization (praise, acceptance and use of pupils' ideas and feelings),occurred in 20% of the total number of 30-second time segments observed.Extended verbal indirect influence, that which lasted six or more secondsconsecutively, occurred in only 2% of the observed time segments. Verbaldirect influence, teacher statements that amounted to the giving ofdirections or criticisms, occurred in 36% of the time segments and extendeddirect influence in 8%. Between-program variation accounted for 13% ofthe variance of direct influence and practically none of the extendeddirect influence. Overall, pupils initiated or expressed free comments(a "9" in Flanders' categorization) during 33% of the time segments, andextended pupil comments in 4%. The teachers' verbal provision of informa-tion for six or more consecutive seconds occurred in no more than 13% ofthe recorded time segments.
When reviewing these results, particularly for programs in which agreat deal of mall group organization occurred, it is well to keep inmind that in some classes the observers had difficulty keeping withinearshot of the teacher as he was conferring with individual or smallgroups of students.
According to the recording of cognitive level of questions asked ofpupils--those that the teacher asked orally or (measured quite imperfect-ly) those confronting the pupil through written materials--questionsabove the knowledge level1 were recorded during 22% of the total timesegments, and 52% of those time segments during which any questions wereasked. Questions above the comprehension level were asked 6% of thetime overall and during 13% of the time segments any question was asked.Questions were not always part of a time segment; substantive questionswere recorded only during 37% of the time segments. No questions orprocedural questions were recorded for 62% of the segments. It wasthought, informally, that the individualized and small group setups in-creased the amount of time with procedural questions, but this was not
borne out by any correlation coefficient greater than .32 (for thevariables on organization and question ratios coded T3.4 and T4.43; othervariables involved in this finding were T6.1 and T3.1, correlated indi-vidually with T4.41 and T4.43). Program differences accounted for nomore than 16% of the variance of any of the classroom organization orquestioning variables.
Adjective pair ratings tended to be moderately positive (towardinteresting, systematic, or kind rather Lhan dull, disorganized or harsh)with averages between 4.2 and 4.5 on 1 one-to-seven scale. With one ex-ception the conventional program had the lowest average rating on allthree adjective pairs, but the differences seemed slight. One adjectivepair, that coded T7.1, was almost impossible to interpret because of mis-understanding about its inclusion and its scale.
Concerning ratings of "individualization" (a concept for which
1As classified by the cognitive taxonomy of Bloom et al, op. cit.
28

common agreement on a definition was extremely difficult to find),Teacher Corps had the highest average rating (2.74 on a five-point scale),but four other programs were close with ratings above 2.4.
The completion and return of paper and pencil instruments at theend of training was limited to 61 subjects. Among programs little dif-ference was found on the Teaching Situation Reaction Test (n2 = .106);attitude toward the training program (14 = .099) or for intellectualchallenge (n2 = .138) variables. Somewhat greater, marginally signifi-cant differences were found for commitment to teaching (n 2 = .176) withthe Project 1070 experienced teachers scoring highest and those fewteaching respondents from the Conventional and Teacher Corps programs
c5r scoring comparatively but not extremely lowest. Generally speaking,attitudes toward training programs seemed high (37.5 out of a possible42), but this could have been altered if all trainees had responded.Reported commitment to teaching also was generally high with a 12.85average out of a possible 14. (On the entry questionnaire, completedby 100 subjects, the attitude toward the training program average was28.46--comparison with the other attitude figure hardly plausible be-cause of the confounding of time with different numbers of respondents).
Factor Analysis Results:
First Factor Analysis (54 variables, 104 subjects): Fifty-fourvariables were selected f'r the first factor analysis. The fifty-fourvariables included 16 on entry characteristics; 19 on program and set-ting characteristics; and 19 on teaching and exit characteristics.Selection of the variables was based on subjective judgments of im-portance, relevance and accuracy for all programs; and numbers of sub-jects on whom data had been collected.
The factor analyfis was a principal components procedure followedby a varimax rotation. With the criterion selected for factor retentionfor rotation as an eigenvalue greater than 1.0, eighteen different
2factors emerged which together accounted for 73% of the total variance.The squared multiple correlation for each individual variable (indicat-ing proportion of that variable's variance accounted for by all othervariables) ranged from .398 to .896. Communalities (proportion of avariable's variance accounted for by all the factors) ranged from .559 to.897.
No single factor accounted for much of the variance. In fact, thegreatest amount of variance accounted for by any factor was only 5,8%.
1Procedure as presented in William H. Cooley and Paul R. Lohnes,
Multivariate Data Analysis, New York: John Wiley & Sons, Inc., 1971.
2Criterion specified by Kaiser. Kaiser, H. F. "The Application of
electronic computers to factor analysis." Ed. & Psych. Measurement. 1960,20, 141-151.
29

What was indicated were several small clusters of moderately intercor-related variables with few surprises. The sought-for coincidence ofteaching variables with program and/or entry variables was generally notfound. The correlation matrix generated for the factor analysis did L not(on visual inspection) promise more, for the correlation coefficientsseemed consistently to be quite low (a 62 variable correlation matrixincluding most of the same variables is included in Appendix B).
The variables with moderately high loadings on the first ten factorsare listed below, in some instances with suggested explanations for thefactors. The explanations are of course merely suggestive; other explana-tions, including chance covariation, may be equally valid. Variables withloadings greater than .500 are listed on the left; variables with loadingsbetween .300 and .500 on the right.
First Factor: (5.8% of total variance)
P1.1 grade level (-.611) P8.12 Directors' reported useT2.36 Verbal direct influence (.810) of modules (.409)T2.46 extended direct influence (.698) E2.0 sex (.319)T2.76 information presentation (-.673)
In the lower grades, subject trainees tended to provide more direc-tions (or possibly criticisms) and less information or lecture-type utter-ances. There were slight tendencies for women to more often be teachingin the lower grades, and for the directors (but not the students) ofprograms involving elementary training to use modules, both known daracter-istics of the field programs. An inverse relat'lmhip of indirect verbalinfluence to direct influence or grade level was not found with thisfactor.
Second factor (5.8% of variance)
T7.2 dull to stimulating (-.881) T5.1 pupil attention scoreT7.3 disorganized to systematic (-.850) (-.330)T7.4 harsh to kind rating (-.792) E9.1 social activism (-.301)
The three adjective pair ratings of classrooms were correlated witheach other and with little else, except perhaps slightly influenced bywhat observers recorded as pupil attention. The loading of social activ-ism was quite low on this factor, resulting in little excitement or re-morse for not trying to explain its presence.
Third factor (5.4% of variance)
P5.2 field centeredness (-.738) P3.16 rural (.498)P6.22 parents' influence by E6.2 mothers' education (.342)
director (-.809) E4.1 graduate vs. undergrad.P11.11 supervisory observations (-.653) (.359)
P6.21 Parents' influence(trainee) (-.327)
30

This factor had a rather obvious group of variables. Programs thathad more time in the field provided more supervisory observation and,probably because of explicit purpose of Teacher Corps (located in ruralareas), reported more parental influence.
Fourth Factor (5.2% of variance):
P17.3 ratings of coop teacher (-.808) P7.16 ruralP4.1 grad vs. undergrad (.735) P8.12 microteachingE17.0 age (.601) (Director)
P8.11 microteaching
(.448)
(-.479)
(-.300)
This factor represents Project 1070 as much as anything. No cooper-ating teachers were part of this experienced teacher program, and data onthis variable (P17.3) were not adjusted, so nobody being rated was giventhe extreme low score of zero. Experienced teachers were older on thererage, and they were not undergraduate students. The Project 1070director reported no use of microteaching.
Fifth Factor (4.6% of variance):
T3.1 small group, individualsT3.4 small groupT4.43 transformed variable
about procedures
(.897) T6.1 individualization(.759)
(.693)
Sixth Factor (4.8% of variance)
rating (.328)
T4.12 above knowledge questions (.887) T4.43 transformed variableT4.22 above comprehension ques- on procedures (.433)
tions (.682)
T4.41 emphasis on procedures (-.786)
All variables are rather obviously related. Mien higher level sub-stantive questions were asked, tnere were fewer time segments when eitherno questions or only procedural questions were asked.
Seventh Factor (3.9% of variance)
P12.15 Trainees' rating of choice over trainee evaluation (.777)
P12.16 Trainees' rating of choice over all phases of program (.839)
P15.1 Trainees' rating of individualization of program (.519)
Eighth Factor: (4.1% of variance)
E2.0 sex (.616)E5.3 camp counseling experience (.545)E5.4 other child experiences (.610)
E5.4 total prior experience with children (.884)
Women tended to report more prior experience with children (baby-sitting and Sunday school experience reports were not included in thisfactor analysis).
31

Ninth Factor (3.8% of variance)
T1.1 principals' ratings (-.539)P4.12 modules reported by director
( -. 745)
P15.1 individualized training,
trainees (-.446)P15.2 individualized training
director (-.413)
This factor may reflect the Auburn program. The one principal thereprobably had a response set on the ratings lower than other principals(perhaps taking the statements on the form at face value and now follow-ing a common tendency to inflate ratings). The program was characterizedby substantial use of modules and rather high ratings for individualizedteacher training.
Tenth Factor (3.9% of variance)
T2.56 pupil-initiated comments (.823) P8.11 trainee-reported micro-T2.66 extended pupil-initiated teaching (.381)
comments (.785)
Pupil-initiated talk and expression of pupils' own thoughts were notfound related to anything else save slightly to microteaching. This in-vestigator hesitates to suggest any causal influence.
Variables included in this analysis but which did not have a loadinggreater than .300 on any of the first ten factors (but often had loadingson factors other than the first ten) were the following:
P2.12 Indian Minority E6.1 Father's OccupationP2.14 Total Minority E8.1 Tolerance of AmbiguityP19.17 Attitude Training E10.1 Social ResponsibilityT2.16 Indirect Influence E11.1 DogmatismT2.26 Extended Indirect E16.11 Campus ActivitiesT5.1 Pupil Attention E16.51 Campus ActivitiesE3.1 General GPA E16.91 Campus Activities
The main import of this factor analysis seemed to be not what occur-red together, but what was found not to occur together. Even suchthings as verbal indirect influence were not found inversely related todirect influence nor directly related to the lower-grades (the indirectinfluence variables were found in the 16th factor with few others excepta small loading from the pupil attention score).
Second Factor Analysis (28 variables, 114 subjects): After thefirst factor analysis yielded several small clusters of variables, asecond analysis was performed on a reduced variable set. The majorattempt of the second analysis was to see if factors of heretoforeunrelated variables could be found once some of the obiously relatedvariables within small clusters had been removed. Also, reduction totwenty-eight variables made the variables to subjects ratio somewhatmore tolerable. Variables were dropped from the first set of 54 largelybecause they were members of a pair or small group of variables that
32
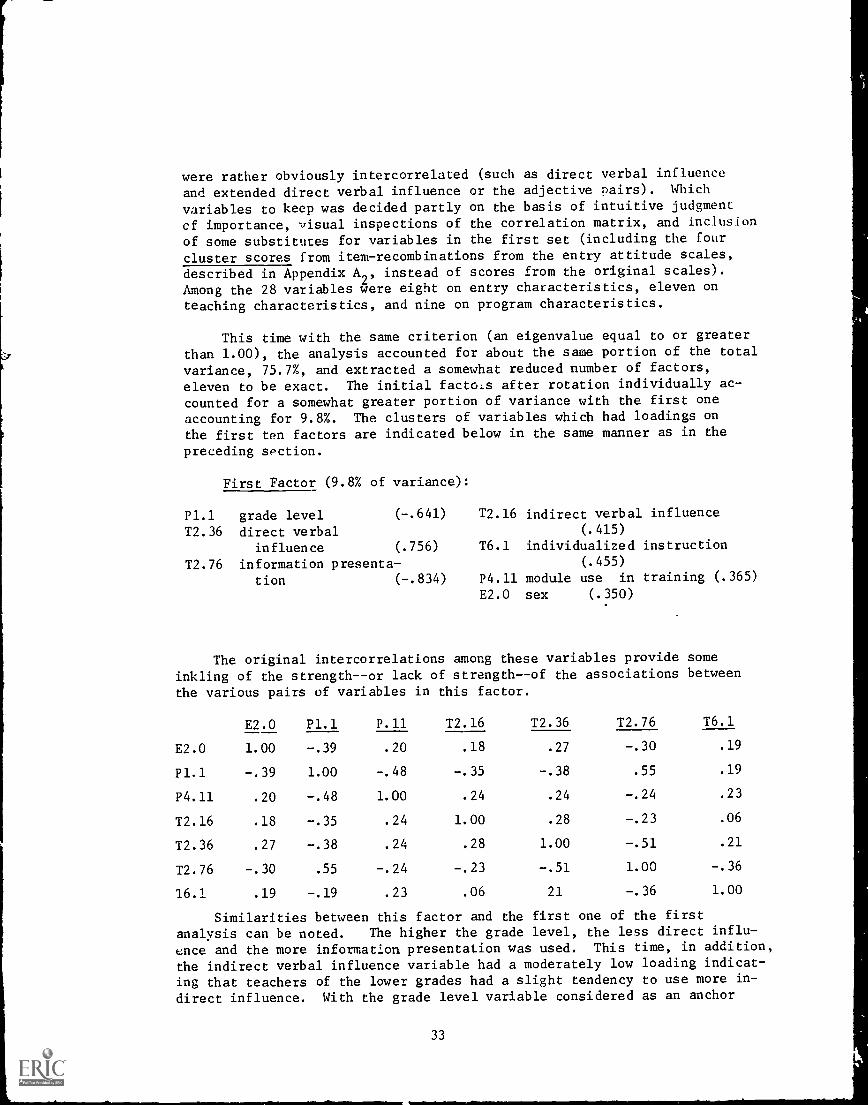
were rather obviously intercorrelated (such as direct verbal influence
and extended direct verbal influence or the adjective pairs). Which
variables to keep was decided partly on the basis of intuitive judgment
of importance, visual inspections of the correlation matrix, and inclusion
of some substitutes for variables in the first set (including the four
cluster scores from item-recombinations from the entry attitude scales,
described in Appendix A2
, instead of scores from the original scales).
Among the 28 variables were eight on entry characteristics, eleven onteaching characteristics, and nine on program characteristics.
This time with the same criterion (an eigenvalue equal to or greaterthan 1.00), the analysis accounted for about the same portion of the totalvariance, 75.7%, and extracted a somewhat reduced number of factors,
eleven to be exact. The initial factors after rotation individually ac-counted for a somewhat greater portion of variance with the first one
accounting for 9.8%. The clusters of variables which had loadings onthe first ten factors are indicated below in the same manner as in the
preceding section.
First Factor (9.8% of variance):
P1.1 grade level (-.641) T2.16 indirect verbal influence
T2.36 direct verbal (.415)
influence (.756) T6.1 individualized instruction
T2.76 information presenta- (.455)
tion (-.834) P4.11 module use in training (.365)
E2.0 sex (.350)
The originalinkling of thethe various pairs
E2.0
intercorrelations among these variables providestrength--or lack of strength--of the associations
of variables in this factor.
P1.1 P.11 T2.16 T2.36 T2.76
some
between
T6.1
E2.0 1.00 -.39 .20 .18 .27 -.30 .19
P1.1 -.39 1.00 -.48 -.35 -.38 .55 .19
P4.11 .20 -.48 1.00 .24 .24 -.24 .23
T2.16 .18 -.35 .24 1.00 .28 -.23 .06
T2.36 .27 -.38 .24 .28 1.00 -.51 .21
T2.76 -.30 .55 -.24 -.23 -.51 1.00 -.36
16.1 .19 -.19 .23 .06 21 -.36 1.00
Similarities between this factor and the first one of the first
analysis can be noted. The higher the grade level, the less direct influ-
ence and the more information presentation was used. This time, in addition,
the indirect verbal influence variable had a moderately low loading indicat-
ing that teachers of the lower grades had a slight tendency to use more in-
direct influence. With the grade level variable considered as an anchor
33

point, the presence of the other variables seemed reasonable. Field pro-
crams which had a greater number of trainees assigned to lower elementary
grades also tended to use modules more and to have more women.
Second Factor (7.4% of variance):
P5.2 field-centeredness (.832) T7.3 disorganized to systematic
P6.22 parental influence, rating (.356)
directors' reports (.865) E12.1 attitude item cluster (.351)
The program which had trainees in the field for the longest period
of time, the Teacher Corps' two-year internship program, also as the
program which attempted to involve parents in decision-making for the
program and, as a result, reported greater parental influence. Little
else appeared to be specifically related to this "Teacher Corps factor"except to a slight degree a "willingness to tackle problems and do agood job," the attitude item cluster, and a rating toward disorganized
rather than systematic teaching.
Third Fac*or (6.7% of variance):
T4.12 above knowledge questions (-.891)
T4.41 procedural or no questions (.874)
The frequency of time segments during which pupils were recorded asresponding to above-knowledge questions was simply related to the fre-quency of time segments during which they were supposed to respond to any
substantive question--and related to nothing else.
Fourth Factor (5.4% of variance):
T3.1 small group, individual organiza- T2.16 indirect influences (-.354)
tion (.623) E15.1 4th item cluster (.375)
E13.1 second item cluster (.661)
The first impression was that teachers used less indirect influ-
ence when they had pupils working in small groups or as individuals, but
the correlation between these variables was only -.06. No other intercor-
relation among the above four variables exceeded .23, and speculationsabout causal or reciprocal relationships among the variables hardly seem
worth the effort. The attitude item clusters were labelled "inequities
and regimentation in society" (E13.1) and "dichotomization of problems"
(E15.1).
Fifth Factor (5.5% of variance)
E12.1 1st item cluster (.618)
E14.1 3rd item cluster (.767)
E15.1 4th item cluster (.534)
Three of the - item clusters, loaded with items from the dogmat-
ism, intolerance of ambiguity, and social responsibility scales werefound to load on a factor that was related to little else.
34

Sixth Factor (5.8% of variance)
P3.31 urban-rural (-.637)
P4.11 modules, by trainee (.520)
P17.3 ratings of coop. teachers (.794)
A probably misleading cluster, harmlessly unrelated to other vari-
ables. Project 1070 subjects had no cooperating teachers, and scores oncooperating teachers for them were entered into the data matrix as the
extreme low, zero. Project 1070 trainees did not study modules to any
extent, and several were located in rural areas.
Seventh Factor (6.9% of variance):
E2.0 sex (.701)
E3.3 GPA, previous year (.700)E5.5 child experience (.764)
Women who went into these education training programs tended to re-port slightly higher grade point averages, at least in the last year be-
fore the field experience (r = .27), and to have had more previous experi-
ence with children (r = .46).
Eighth Factor (5.1% of variance):
T1.1 principals' ratings (-.616)P12.16 trainee choice over program (-.778)
To a slight degree (r = .23) trainees who believed they had more in-fluence over the nature of their own training were rated higher by princi-
pals. Because principals associated with the different programs were dif-ferent, principals with a higher response set may have more or less acci-dentally been found to be with programs that gave more choice to trainees.
Ninth Factor (5.0% of variance):
12.66 extended pupil initiated talk (.792) T1.1 principals' ratings (.392)
P2.25 disadvantaged (-.313)T2.16 indirect influence (.353)
To a slight degree, where fewer pupils were reported as coming fromdisadvantaged families, indirect influence was used more by teacher,pupils tended to express their own ideas more, and principals gave higher
ratings. Which influenced which, if any causal relationships were there,
is a matter of guesswork.
Tenth Factor (5.9% of variance):
T5.1 pupil attention (.730)
T7.3 systematic rating (.538)
35
P2.25 disadvantaged (.485)T2.16 indirect influence (.356)P1.1 grade level (-.357)
Where pupil attention was rated higher, adjective pair ratings-
of which T7.3 was the only one included in this analysis--were also high-
er. These ratings tended to be higher for teachers in the lower grades
who tended to use more indirect influence statements. The inverse associ-
ation between indirect influence and grade level (r = .35) was noted in
previous factors, particularly the first. Also, teacher trainees work-
ing in the lower grades also happened to be with classes that had a
higher proportion of pupils judged to come from disadvantaged families.
This factor analysis provided roughly comparable results to the first
and added a little to it. The first factor in both included mostly the
same variables and accounted for a larger portion of variance in the
second analysis. The cluster scales, a substitution in this second
analysis, tended not to do anything remarkable when three of the four
clustered only with themselves in the fifth factor. However, a new
factor (the fourth) did emerge which included loadings of two of the
clusters along with loadings from classroom organization and indirect
influence an not from grade level, which elsewhere had been found associ-
ated with organization and indirect influence. The indirect influence
variable showed a little life this time by having some loadings scat-
tered through four of the ten factors, including the first which also had
the grade level, pupil expression, and direct influence variables.
Table III presents loadings of all variables on ten factors in this
factor analysis.
Third Factor Analysis (25 variables, 61 subjects): A third factor
analysis was performed on a reduced number of subjects in order to take
into account the variables measured by the exit Questionnaire. Only 61
subjects returned their questionnaires, and it was felt that data this
incomplete could not reasonably be included in an analysis pertaining to
114 subjects even by substituting group averages for missing scores. The
exit questionnaire provided scores on four variables: T11.1, the Teach-
ing Situation Reaction Test; P16.1, the intellectual challenge rating;
T10.1, commitment to teaching; and P19.27, attitude toward the training
program expressed upon completion of the program. Twenty-one other
variables were selected for this analysis. The 61 subjects could not be
considered a random subset of the original 114.
The analysis accounted for 75.7% of the variance and produced ten
factors with the same eigenvalue = LC. criterion.
The first factor, accounting for 9.7% of the variance, contained
loadings from the identical variables as in the first factor in the
second analysis, which was also similar to the first factor of the first
analysis.
The second factor, accounting for 9.5% of the variance, contained
loadings from three of the exit questionnaire measures--all except com-
mitment to teaching--and a loading from only one other variable, the
probLbly misleading cooperating teacher variable, P17.3. Project 1070
subjects, who had no cooperating teachers and were thereby given the
36

TABLE III
VARIABLE LOADINGS AND VARIANCE ACCOUNTED FORBY FIRST TEN FACTORS FROM FACTOR ANALYSIS
OF 28 VARIABLES AND 114 SUBJECTS
FACTOR
VARIABLE* 1 2 3 4 5 6 7 8 9 10
T1.1 -.145 -.123 .285 -.022 .073 .020 -.051 -.616 .392 .118
P1.1 -.641 -.091 .100 .155 .070 -.008 -.136 .189 .198 -.357
P2.14 .009 .064 .075 .130 -.043 .026 -.003 -.089 -.052 -.005
P3.31 -.226 .241 .072 -.105 .194 -.637 -.054 .090 .153 -.123
P4.11 .365 .211 .051 -.001 -.085 .520 .112 -.297 -.043 .287
P5.2 .011 .832 .063 -.001 -.045 .169 -.002 -.022 -.052 -.054
P6.22 .090 .865 .041 .000 .074 -.262 -.076 -.026 -.023 .084
P12.16 .105 .061 -.122 .085 .070 -.021 .024 -.778 -.207 .027
P17.3 -.175 .047 .014 -.101 .295 .794 .009 .152 .112 -.101
P2.25 .217 .003 -.038 -.215 .087 .022 .025 .042 -.313 .485
P2.16 .415 -.207 -.134 -.354 -.211 .150 -.025 .000 .353 .356
P2.36 .756 -.083 .115 .026 .154 .034 .029 .080 .225 .098
P2.66 -.018 -.044 -.279 .060 .067 -.017 .055 .112 .792 -.106
Pc..76 -.834 -.089 .107 .022 .084 .014 -.065 .034 .198 .055
P3.1 .295 .063 -.124 .623 .071 .075 .024 .075 .073 .034
P4.12 -.011 -.017 -.891 -.003 -.047 .000 -.033 .013 .043 -.028
P4.41 -.063 .087 .874 .040 .036 -.013 .004 .051 -.159 -.012
P5.1 .195 -.092 .079 .195 .005 -.048 .141 -.143 .041 .730
T6.1 .455 .300 -.016 .277 -.011 .064 .083 -.118 .124 -.271
T7.3 -.198, .356 -.032 -.107 -.102 .153 -.131 .089 -.104 .5381:10". 916,'"v
E2.0 .350 -.035 -.014 -.161 .123 -.116 .701 -.052 -.101 .050
E3.3 -.015 .015 .067 .073 -.119 -.090 .700 .008 .271 .149
E5.5 .039 -.085 -.013 -.082 .051 .276 .764 .007 -.104 -.097
E6.1 -.017 -.052 .041 .023 .003 .080 .033 -.028 .047 .032
E12.1 .026 -.351 -.031 -.345 .618 -.069 .119 -.235 -.051 -.007
E13.1 -.274 -.061 .107 .661 -.065 -.069 -.157 -.191 .038 .015
E14.1 .001 .193 .065 .058 .767 .160 .006 -.073 .109 -.099
E15.1 .004 -.172 .116 .375 .534 -.119 -.107 .311 -.121 .236
VARIANCE 9.8% 7.4% 6.7% 5.4% 5.5% 5.8% 6.1% 5.1% 5.0% 5.9%
ACCOUNTEDFOR
*Description of variables by code number is presented in Appendix A.
37

extreme low score on the P17.3 variable, scored "well" on the TSRT (lowscores generally regarded as desirable) and on attitude toward theirteacher training program. They were just average on the intellectualchallenge rating, and the loading of -this variable on the factor was in
the opposite direction. Loadings were -.915 for TSRT, .844 for attitudetoward the program, .443 for intellectual challenge, and -.415 for co-operating teacher rating.
The commitment to teaching variable did not appear until the ninthfactor where it had a loading of .779 along with intellectual challenge(.717) and a rather low one from classroom small group or individualorganization (-.345).
Apart from the new variables, which pretty much stayed together anddid not mix well with the others, the factor pattern was not strikinglydifferent from the previous two analyses for 114 subjects. Loadings onfactors other than those already mentioned are given below without com-ment.
Third Factor (7.8% of variance): Fourth Factor (6.6% of variance):
P2.25 disadvantaged (.626) P17.3 coop teacher rating (-.708)
E8.1 intolerance of ambiguity (.790) T3.1 class organization (-.815)E11.1 dogmatism (.646) E5.5 child experience (-.303)T2.66 pupil expression (-.347)T5.1 pupil attention (.387)
Fifth Factor (7.2% of variance): Sixth Factor (6.7% of variance):
E2.0 sex (.793)E5.5 child experience (.719)T2.66 pupil expression (.300)E3.1 grade point average (.317)E11.1 dogmatism (.350)
Seventh Factor (5.4% ofvariance):
T1.1 principals' rating (.669)E3.1 GPA (.743)E11.1 dogmatism (-.305)
P4.11 modules (.626)P12.16 trainee choice (.764)T2.66 pupil expression (-.605)P1.1 grade level (-.426)
Eighth Factor (5.8% of variance):
E9.1 social activism (-.867)T1.1 principals' ratings (-.379)P12.16 trainee choice (-.422)
Ninth Factor (6.9% of variance): Tenth Factor (6.0% of variance):
P16.1 Intellectual challenge (.717)T10.1 commit. to teaching (.779)T3.1 group, indiv. organization
( -. 345)
T4.12 aboveknowledge questions(-.837)
T7.2 dull to stimulating rating(-.615)
As far as the main purpose of this analysis was concerned, theexist attitude scales were not found to be related in any noticeable
way with other teaching or program variables.
38

Discriminant Analyses:
Despite metaphors about sows' ears and silk purses, data analysis
continued. One of the primary questions of the study concerned in what
respects the seven training programs were different. This question could
be more directly answered by discriminant analysis than factor analysis.Moreover, if the "right" or more significant training variables hadbeen missed by the study, a finding of different teaching behavior amongtrainees of the various programs could lead to a reexamination of the
programs for previously missed training characteristics possibly related
to the teaching behavior differences. If trainees in the programs were
different in respect to entry characteristics, different character of theprograms in respect to training, trainee behavior, or some combinationcould potentially be interpreted in terms of accommodation to the enter-
ing differences of the trainees.
Discriminant Analysis, Teaching Variables: A discriminant analysis
was performed on the data from twenty-two variables on all 114 subjects.
The variables included twenty labelled teaching variables and two whimsic-ally thrown in program variables, attitude toward training programs andperception of choice over program (P19.17 and P12.16)1
With the number of variables exceeding the number of subjects in
any one of the seven programs, the accuracy of this analysis was strained
and an approximation procedure was necessary to compensate for a near
singular matrix. The multiple discriminant analysis procedure used was that
from Cooley and Lohnes.2
This discriminant analysis produced a generalized correlation ratio
of .8658 indicating the proportion of group membership variance accounted
for by all six discriminant functions. The correlation ratio was in-
flated somewhat by the high variables to subjects ratio. The preliminary
analyses performed by the program showed ten variables having significantdifferences between programs at the .05 level of confidence and two at
the .01 level.
The discriminant analysis produced two statistically significantdiscriminant functions, using a chi-square probability of less than .05
as a criterion, with canonical correlations of .66 and .60 respectively.
Examination of each significantprovided a reasonably comprehensiblegrams differed in regard to measuredboth functions together gives a more
discriminant function separatelypicture of how trainees in the pro-teaching behavior. Description ofaccurate picture, but strains
1The first discriminant analysis performed actually was of data from
a mixture of entry and training variables. The results made even less
sense conceptually than the reasoning for running the analysis in the
first place, so the discussion proceeds directly to the next analysis
performed.2Op.Cit.
39
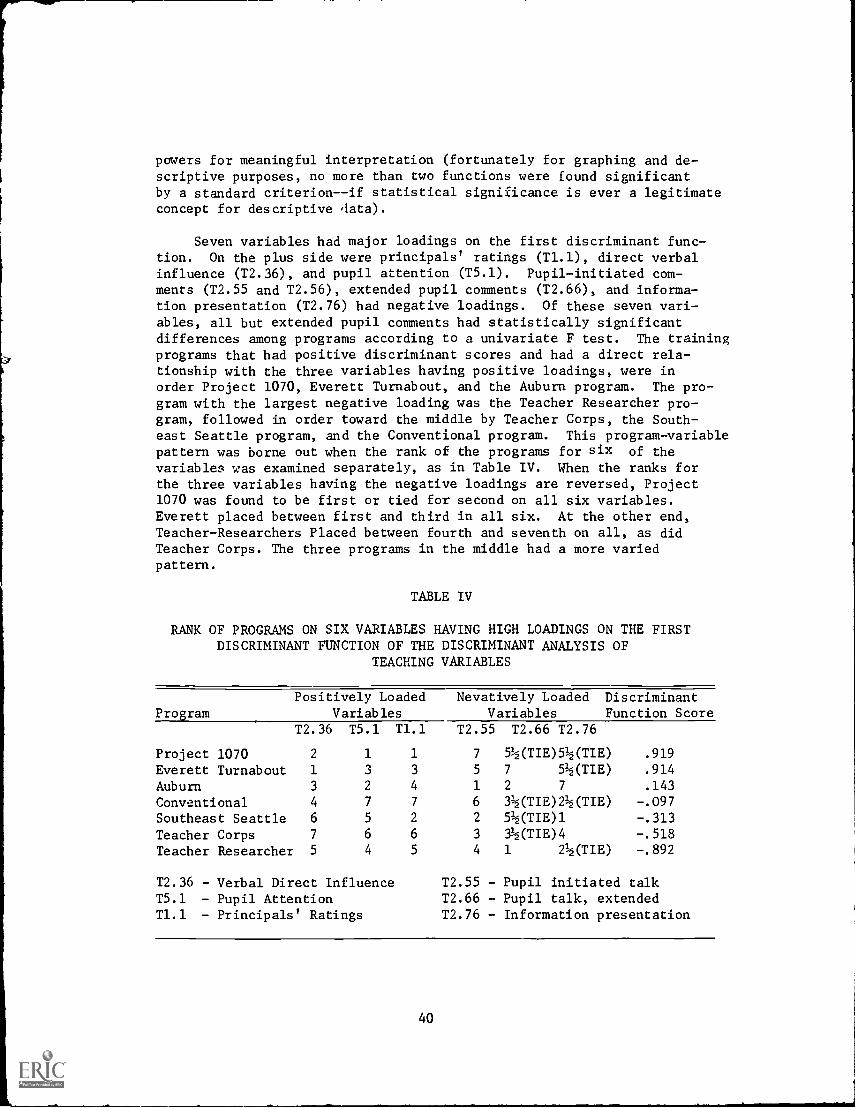
powers for meaningful interpretation (fortunately for graphing and de-scriptive purposes, no more than two functions were found significantby a standard criterion--if statistical significance is ever a legitimateconcept for descriptive data).
Seven variables had major loadings on the first discriminant func-tion. On the plus side were principals' ratings (T1.1), direct verbalinfluence (T2.36), and pupil attention (T5.1). Pupil-initiated com-ments (T2.55 and T2.56), extended pupil comments (T2.66), and informa-tion presentation (T2.76) had negative loadings. Of these seven vari-ables, all but extended pupil comments had statistically significantdifferences among programs according to a univariate F test. The trainingprograms that had positive discriminant scores and had a direct rela-tionship with the three variables having positive loadings, were inorder Project 1070, Everett Turnabout, and the Auburn program. The pro-gram with the largest negative loading was the Teacher Researcher pro-gram, followed in order toward the middle by Teacher Corps, the South-east Seattle program, and the Conventional program. This program-variablepattern was borne out when the rank of the programs for six of thevariables was examined separately, as in Table IV. When the ranks forthe three variables having the negative loadings are reversed, Project1070 was found to be first or tied for second on all six variables.Everett placed between first and third in all six. At the other end,Teacher-Researchers Placed between fourth and seventh on all, as didTeacher Corps. The three programs in the middle had a more variedpattern.
TABLE IV
RANK OF PROGRAMS ON SIX VARIABLES HAVING HIGH LOADINGS ON THE FIRSTDISCRIMINANT FUNCTION OF THE DISCRIMINANT ANALYSIS OF
TEACHING VARIABLES
ProgramPositively Loaded
VariablesNevatively Loaded Discriminant
Variables Function ScoreT2.36 T5.1 T1.1 T2.55 T2.66 T2.76
Project 1070 2 1 1 7 51/2(TIE)51/2(TIE) .919
Everett Turnabout 1 3 3 5 7 51/2(TIE) .914
Auburn 3 2 4 1 2 7 .143
Conventional 4 7 7 6 31/2(TIE)21/2(TIE) -.097Southeast Seattle 6 5 2 2 51/2(TIE)1 -.313
Teacher Corps 7 6 6 3 31/2(TIE)4 -.518
Teacher Researcher 5 4 5 4 1 21/2(TIE) -.892
T2.36 - Verbal Direct Influence T2.55 - Pupil initiated talkT5.1 - Pupil Attention T2.66 - Pupil talk, extendedT1.1 - Principals' Ratings T2.76 - Information presentation
40

The second discriminant function contained loadings from variablesof probably greater interest. All seven of these variables had negativeloadings, and accordingly all training programs which had negativescores ranked higher on these variables than programs with positivescores. With the exception of one variable having to do with emphasison procedural talk during small group or individual class organization(T4.43), all of the variables loading on this function showed statis-tically significant differences among groups according to the univariateF test. Only one of the seven variables, pupil attention (T5.1) also hada consequential loading on the first function; its loading on the secondfunction was larger than on the first.
The variables loading on the second function were attitude towardtraining programs (P19.17), verbal indirect influence (T2.15 and T2.16),extended verbal indirect (T2.26), indiVidual pupil class organization(T3.3), emphasis on procedure (T4.43), and pupil attention (T5.1).Ranged along this function with negative scores, along with all sevenvariables, were four of the programs starring with the Teacher-Researcherprogram and followed in order by Auburn, Everett Turnabout, and Project1070. On the positive side, away from the high scores on the variables,were the conventional programs and, moving closer to the origin, TeacherCorps and SE Seattle. The rank of the programs for each of the sevenvariables is presented in Table V. Here, looking at rank rather thanloading on the function, the most extreme program directly related tothe variables appeared to be Auburn rather than the Teacher-Researcherprogram, whereas at the other end (low scores on the variables) TeacherCorps was at least as extreme on the rankings as the conventional pro-gram.
TABLE V
RANK OF TRAINING PROGRAMS ON SEVEN TEACHING VARIABLES HAVINGMAJOR LOADINGS ON THE SECOND DISCRIMINANT FUNCTION OF THE
DISCRIMINANT ANALYSIS OF TEACHING VARIABLES
Program P19.17 T2.15 T2.16VariableT2.26 T3.3 T.4.43(NS) T5.1
DiscriminantFunction Score
Auburn 21/2 1 11/2 11/2 2 31/2 2 -.414Teacher-R 21/2 3 3 11/2 3 1 4 -.941Everett 1 2 11/2 41/2 1 2 3 -.344Project 1070 4 4 4 3 7 5 1 -.127SE Seattle 6 5 5 41/2 4 71/2 5 .365Conventional 5 6 6 7 5 71/2 7 .827Teacher Corps 7 7 7 6 6 31/2 6 .644
41

It should be noted that variables which had loadings on the samediscriminant function did not necessarily intercorrelate. For instance,
the known correlations of attitude toward training program (P19.17) withthe other variables loading on the second function ranged from .01 to
.20.
Table VI presents more complete information about the two significantdiscriminant functions including loadings of all twenty-two variables
on each. Examination of both functions together makes possible thedescription of the position of both variables and programs in discrimin-ant space. Explaining and interpreting the positioning of programs andvariables considering both functions is hardly simple, but at least itis not as bad as if there had been more than two significant functions.
A display of the discriminant space with the two discriminant func-tions positioned at right angles showing locations of both significantvariable and program statistics is given in Figure 1. The horizontal
axis represents the first function. A cluster of variables is foundprimarily in the lower right quadrant (positive on the first functionand negative on the second), closer to the middle of the first functionthan the second. These are: attitude toward training programs,class organization for individual work, verbal indirect influence, andpupil attention. Although the scale for program placement in the spaceis different than for variables, the placement of the Auburn programwith the cluster shows that this program is in the same direction fromthe origin as are the variables of the cluster. Not far away and in the
same quadrant are the principals' ratings and verbal direct influence
variables. In the same quadrant but holding extreme positions on thefirst function are the Project 1070 and Everett programs. Although the
distance between those two and Auburn is considerable, they may be con-sidered as a group distinguished by higher scores on the aforementionedvariables, a finding supported in part by the patterns of rankings in
Tables IV and V.
In the opposite quadrant are found the conventional program, TeacherCorps, and, considerably closer to the middle, SE Seattle. Teacher
Corps and the conventional program are distinguished by being thefarthest away from the clusters of variables in the lower right quadrant- -and trainees in these programs were in fact observed to use less indirectinfluence, have lower pupil attention, and have pupils work less asindividuals (but more in small groups, a teaching variable not includedin this analysis) than in the other programs.
Another cluster of variables having to do with presentation of in-formation (lecture type statements and expression of pupil ideas) ispositioned along the horizontal axis (first function) on the negativeside along with Teacher Corps, Conventional, and SE Seattle programs.These programs did have the highest ranking for their average scores on
these variables (Table IV).
Far off by itself in the extreme lower left can be found the TeacherResearcher program, the program for juniors who worked mainly as teacherassistants, who were frequently observed only once with a small group,
42

FIGURE 1
Location of significant variables and programs in discriminant space oftwo functions from discriminant analysis of 22 teaching variables*
Variable1-P19.17 attitude toward training program 7-T2.56 pupil initiated comments
2-T1.1 principals' ratings 8-T2.76 information presentation
3-T2.15, T2.16 indirect verbal influence 9-T3.3 individual class organization
4-T2.26 extended indirect influence 10-T4.43 procedural emphasis
T-T2.36 verbal direct influence 11-T5.1 pupil attention
6-T2.55 pupil initiated comments 12-P12.16 perception of choice
Program A - Auburn TC - Teacher Corps
SE - SE Seattle ET - Everett Turnabout
EC Project 1070 Early Childhood C - Conventional
TR'- Teacher Researcher
*The basis for the scale which places programs in discriminant spacc. 's different
from the scale for variables. Programs can be compared with other programs interms of both direction and distance from the origin. Variables also can be com-
pared with each other on both distance and direction. However, programs can be
directly related to variables on direction (angle) from origin only, not dis-
tance. Without scale transformations, programs are generally located further
from the origin.43

TABLE VI
DISCRIMINANT ANALYSIS OF TEACHING VARIABLES: VARIABLE LOADINGS,PROGRAM LOADINGS, AND OTHER STATISTICS
Variables withsignificantunivariate F
Variable LoadingsUnivariateAnova F(6,107df)
First
FunctionSecond
Function
P12.16 .245 -.208 2.65
P19.17 .209 -.413 2.45
T1.1 .308 -.101 2.69
T2.15 .219 -.524 3.17T2.16 .232 -.505 3.01T2.26 -.010 -.551 2.60T2.36 .424 -.175 2.21T2.55 -.354 .036 2.36T2.76 -.391 .171 2.27T3.3 -.026 -.356 2.25T5.1 .331 -.478 3.83
Other Variables
T2.46 .286 -.005 .83
T2.66 -.350 -.185 1.52T3.4 -.211 -.032 2.03T4.12 -.079 -.020 .24
T4.22 -.055 .159 .67
T4.41 .138 .247 1.36T4.43 -.040 -.357 1.28T6.1 .124 .168 .97
T7.2 .229 .022 1.59
T7.4 .170 .059 1-.55
Program Scores
First Function Second FunctionAuburn .143 -.414Everett .914 -.344Southeast Seattle -.313 .365
Teacher-Researcher -.892 -.941Project 1070 .919 -.127Teacher Corps -.518 .644
Conventional -.097 .827
Other Statistics
Canonical R .659 .604
Canonical R2 .434 .365
Chi Square/d. f. 198/132 142/105Lambda .134 .237
Generalized CorrelationRatio (n2) = .866
Wilks Lambda = .134
44

and were in a program stressing behavioral modification. It was, forinstance, a program distinguished by high ratios both for verbal in-formation presentation and indirect influence.
To restate, to the extent that the variables showed more than indi-vidual and random variation, trainees in the Teacher Corps and conven-tional programs were characterized as having lower pupil attention,using less indirect influence and individual work, using more than anaverage amount of time for information presentation, and not enjoyingparticularly high principals' ratings. Auburn, Everett, and Project1070 trainees used more indirect influence, enjoyed higher ratings, andhad higher pupil attention. SE Seattle trainees were fairly close tothe middle. Teacher-researchers were off by themselves, by showingboth high indirect influence and high information presentation and re-latively high pupil expression .of ideas.
Again, one should be reminded that the clustering of variables doesnot imply high intercorrelations between variables. The intercorrela-tion matrix (Appendix B) generally indicates otherwise.
Discriminant Analysis, Entry Variables: A discriminant analysiswas performed on data from eighteen entry characteristic variables.Most of the entry variable data were obtained from self-reports on theentry questionnaire and subject to whatever error was implicit in theself-reports given by persons responding under different conditions,possibly with different attitudes toward the questionnaire, and havingto recall experiences removed in time by varying time periods (such asreporting on baby-sitting experience by persons of different ages).The entry variables also included scores from attitude scales on theentry questionnaire. One variable, attitude toward training programs(P19.17), also was included in this analysis, even though it was in-cluded on the previous one.
This analysis produced a generalized correlation ratio of .904 andthree significant discriminant functions according to .05 chi-squareprobability level criterion. Seven of the eighteen variables showedsignificant (p<.05) differences among training groups according tounivariate analyses of variance. Data on three variables having to dowith age and campus activities were apparently not accurately read intothe computer leaving these variables as showing essentially random andnon-significant variation.
The first function, which had a canonical correlation of R = .755,identified two variables that had both significant differences amonggroups by a univariate test and highest loadings on the first function.These were reported grade point averages in one's special field (prob-ably higher for those having an elementary education major rather thana subject matter major) and attitude toward training program, E3.2 andP19.17 respectively. Other significant variables having loadings onthis function were intolerance of ambiguity (high scores showing intol-erance), Mother's education, and previous baby-sitting experience, E8.1,E6.2, and E5.1, respectively. All loadings were positive.
45

On the first function the Everett program had the highest positivescore, followed in order by Auburn, Conventional, and Teacher-Researcher.
On the negative side (showing low intolerance of ambiguity, low Mother'seducation, lower attitude toward program, etc.) the most extreme wasTeacher Corps, followed by Project 1070 and SE Seattle. A check ofrankings on individual variables showed quite consistent results; TeacherCorps ranked seventh on all five variables while Everett was first onthree, third on one (E5.1) and filth on another (E6.2).
The second significant discriminant function received its highestloadings on two significant variables, intolerance of ambiguity again
(+.474) and prior camp and recreation experience (-.458). Other loadingsslightly more than trivial were a positive one for attitude towardtraining and negative ones for therapeutic and other experience with
children and mother's education.
Two programs had high positive scores on this function, Project 1070
and Everett. On the negative side the most extreme was Auburn followed
in order by SE Seattle, Teacher Corps, Conventional, and Teacher-Researcher. For the first time in either discriminant analysis, Auburn
and Everett parted company.
Two child experience rating variables, baby-sitting (E5.1) and
therapeutic "other" (E5.4), and reported education of mother (E6.2)had th3 highest loadings on the third discriminant function. Baby-sitting had a positive loading and the other two were negative.(Mother's education had a higher loading on another non-significant
function than on this function.) On this function the extreme positive
score was that of the SE Seattle program, followed on the positive side
by Everett and, close to the middle, the Teacher Researcher program.Auburn had the largest negative value with other negative scores for re-maining programs not too large.
Program scores and variable loadings on all three functions are
given in Table VII.
Program Description from Discriminant Analyses:
A recap of the findings from discriminant analyses is presentedhere by describing each program separately in terms of its most salient
differences from the other programs. Desc-'2tions of the programs in-
clude both teaching and entry characteristics but are limited to thosevariables that were "significant" according to univariate F tests.Although variables show differences that are "significant," they never-
theless are often slight.
Auburn (n=12): High in terms of special field GPA (but not other
GPA reports which were not significantly different among groups),Mother's educational level, attitude toward training programs (tied for
second), and other (especially therapeutic training) previous experi-ence with children. Low average (fifth) in intolerance of ambiguity.
46

TABLE VII
VARIABLE LOADINGS AND PROGRAM SCORES ON THREE SIGNIFICANT FUNCliONS
OF DISCRIMINANT ANALYSIS OF 18 ENTRY CHARACTERISTIC VARIABLES
(N = 114)
Loading on
Variable 1st Function
Loading on2nd Function
Loading on3rd Function
Univariate
P19.17 Att toward train .337 .224 -.206 2.45
E2.0 Sex .113 .395 -.027 2.09
E3.1 GPA-General .051 .024 -.109 .37
E3.2 GPA-Specific 785 .023 .141 10.72***
E3.3 GPA-Last Year .003 -.03L -.168 .46
E5.1 Baby-sitting .228 .010 .586 4.31**
E5.2 Church, Sun.Sch. .133 .369 -.076 1.62
E5.3 Camp, Recreation .193 -.458 -.274 3.12**
E5.4 Other Child Exp. .203 -.263 -.387 2.86**
E6.1 Father's occupation .089 .145 .236 1.95
E6.2 Mother's Education .268 -.355 -.345 4.12**
E8.1 Intol of Ambig .360 .474 -.032 4.60**
E9.1 Pol-Soc Activism -.260 -.023 -.009 1.14
E10.1 Social Resp.Scale -.128 -.051 .000 .62
Ell.? Dogmatism .166 .148 .063 .54
E16.51 Activity .157 -.207 -.208 1.41
E16.02 Activity -.139 -.294 -.188 1.42
E17.0 Misread Variable -.038 -.187 -.012 1.29
Chi Square/d.f. 236/108 151/85 93/64
Canonical R .755 .661 .593
Program
Auburn .712 -.846 -1.144
SE Seattle -.335 -.524 .961
Early Childhood (1070) -.721 1.191 -.388
Teacher Researcher .184 -.135 .122
Teacher Corps -1.115 -.428 -.104
Everett Turnabout 1.338 .672 .462
Conventional .214 -.173 .252
*p<.05 **p<.01 ***p<.001
47

Concerning teaching variables, Auburn trainees used indirectverbal influence (from Flanders' interaction analysis as modified fortime segments) more often than in any other program. Rated pupil atten-
tion was second highest as was class organization for pupils workingas individuals (but not small groups, which was a non-significant
variable). Auburn trPthees were third high in use of direct verbal in-fluence (directions aid criticism), received average ratings from theirprincipal, most often had pupil expression and/or initiation of theirown ideas (second highest on extended pupt) expression), and least often
presented information to pupils.
Southeast Seattle (n=18): This clinical program's undergraduatetrainees had slightly lower than average reported special field GPA, lowintolerance of ambiguity scores, comparatively low attitude towardtraining program,1 and low reported Mother's educational level. They
reported considerable prior baby-sitting experience but low "other"
prior child experience.
Seattle trainees were low average in use of both direct and indirectverbal influence and in securing overt pupil attention. They were first
in frequency of presenting information and second in obtaining pupil ex-pression or initiation of ideas (but not extended pupil comments, a
non-significant variable). Principals' ratings were high.
It should be noted that Southeast Seattle was a p-ogram that hadseveral teacher trainees on the secondary level; only one other grouphad trainees in senior high, and elementary-secondary school differencesmay have entered in. It was also the program that was located in themost urban area, and it had the highest proportion of minority pupils.
Early Childhood (Project 1070) (n=18): The experiLaced teachers
in the early childhood program reported low special field GPA, lowlevel of mother's education, and low previous experience with childreneither baby-sitting or other (perhaps they forgot), and had high aver-age intolerance of ambiguity scores. The 1070 teachers were average in
use of indirect verbal influence, second in use of direct influence
(perhaps inherent in teaching lower grades), were highest in having
pupils do work as individuals, had the highest principals' ratings,and secured the highest rated pupil attention.
Teacher-Researcher program (1= 20): The junior students in the T-R
program were different on teaching variables from all other programs in
discriminant space--and they were on the average observed less often.T-R subjects were average in special field GPA, intolerance of ambigu-
ity, and in previous experience with children. They were moderately
high in reported level of mother's education and attitude toward
1The midpoint between positive and negative responses to six items
summA to 24 on this scale; and all programs averaged above the midpoint,that is, gave some degree of positive response. The positive degree
was less for Seattle trainees than for five other programs.
48

teacher training. When teaching, the T-R subjects were slightly higherthan average in indirect influence and average in pupil attention. They
were also average or slightly below average in use of direct influenceand in pupil expression /initiation of ideas, and they had below average
ratings from their principal. They more frequently than average pre-sented information.
Teacher Corps (n= 15): Teacher Corps interns (at least those twelvewho completed the entry questionnaire), were lowest in reported specialfield GPA, intolerance of ambiguity, reported level of mother's education,attitude toward their two-year training program (opinion given after1-1/2 years in program), and reported baby-sitting experience (butabove average in "other" child experience). When teaching, interns werelowest in use of direct influence, average in getting pupil expressionof ideas and presenting information, and last in use of indirect in-fluence. The Teacher Corps interns were next to last in obtaining overtpupil attention and positive principals' ratings.
Everett Turnabout (n= 15): In the first year of their program,Everett trainees reported the highest special field GPA, attitude to-ward teacher training, and average levels of mother's education andprevious child experience. Everett trainees used direct verbal influ-ence more frequently than in any other program and they had averagelevels of expression of ideas, presentation of information,principals' ratings, and pupil attention.
Conventional (n= 17): In a sense, if this group had been largerit could have served as a control group for all the others. Convention-
al trainees were average among trainees of other programs in reportedspecial field GPA, Mother's education, and attitude toward training.hey were second in reported previous experience with ,hildren, bothbaby-sitting and "other." When teaching, Conventional trainees used
an average amount of direct verbal influence and an above averageamount of information presentation (along with only SE Seattle, someconventional trainees were in secondary school situations). The conven-
tional trainees were lowest or next to lowest in indirect verbal influ-ence variables, principals' ratings, pupil attention, and pupil ex-pression or initiation of ideas. To the extent that conventionalvalues can be placed on these variables per se, the clinical programsdii in fact show up better than the subject trainees non-randomlyseiected from the conventional program.
Canonical Correlation:
In order to gain some idea of how much composites of certain sub-sets of variables were predictable from other subsets, some canonicalcorrelations were computed. It was of special interest to know how wella composite of teaching behavior variables was predictable fromentry variables as opposed to program and setting characteristics.The canonical correlations thus obtained were also amenable to compari-
son with canonical correlations with group membership from the
discriminant analyses.
49
Data from 89 variables on the 114 subjects were read into the com-
puter for a series of canonical analyses. The first three canonicalcorrelations involved pretty much the same variables as in the dis-criminant analyses reported in the previous section. The only differ-ence among the three was the placement of the two program variables,attitude toward program (P19.17) and perceived choice over program
(P12.16). The first correlation was between the set of entry vari-ables and the set of teaching variables plus the two program variables.The second correlation was between the same two sets with the program
variables in neither set. The third analysis combined the two programs
variables with the set of entry variables. For these three correlationsthere were twenty-two entry variables, twenty teaching variables, andtwo program variables. The set of two program and twenty teachingvariables was identical to the set for the first discriminant analysispreviously described.
The canonical correlations were not statistically significant for
any of these three cases.1 Values of the three correlations rangedfrom .759 to .770 (squared values ranged from .576 to .593), not large
in view of the high variables to subjects ratio. The probabilitiesthat these correlations were-more than would occur by chance, as deter-mined by a chi-square probability criterion, ranged from no less than
.27 to approximately .30. The data collected on the entry variables did
not predict any observed patterns of teaching behavior.
When program and setting variables were related to the same subsetof teaching variables (P12.6 or P19.17 were not included with the 2teaching variables), a significant canonical correlation of R=.857 (R =
.734) did emerge. The chance chi-square probability was less than
.0005. Something to do with the training programs and the setting inwhich trainees performed had something to do with how trainees
actually performed.
Examination both of the correlations of individual variables withthe first canonical variate and of the canonical weights (Table IX) pro-
vide some indication of which variables were the more important contri-
butors to the equation. The grade level factor had by far the largest
values in the set of program variables. Trainee reports of micro-
teachin- episodes (P8.11) had a very low correlation with the variatebut the second highest canonical weight, indicating the variable'sfunction as a suppressor variable. Perceptions of choice and of indi-
vidualized training and number of disadvantaged children (P12.14,P12.15, P15.1, and P2.25) also appeared to be among the stronger
variables of the set.
1In fact, when multiple regression equations were computed for
individual teaching variables from all of the variables in the other set,only one of the twenty was significant (at the .05 level) in the firstcanonical analysis and only three in the third. Multiple Rs ranged
from .34 to .57 (for variables T6.1, T7.2, and T7.4) in the third of
these analyses.
50

The teaching variables that were more prominent in the canonicalanalysis were direct and indirect verbal influence, presentation ofinformation, and pupil attention (T2.15, T2.16, T2.36, T2.76, and T5.2).Three other teaching variables, emphasis on procedures (P4.43) andtwo adjective pairs (T7.2 and T7.4) had correlations with the secondvariate slightly in excess of .50 (The second canonical variate in thisanalysis could also be called statistically significant with a chi-square chance probability less than .03).
The variables that tended to be more prominent in the factor anddiscriminant analyses also tended to make the more important contribu-
tions to the canonical correlation. In particular the setting variable
of grade level again made a major contribution by being inversely associ-ated with direct and indirect verbal influence and pupil attention anddirectly associated with information presentation.
The canonical correlation of R=.857 ("hr the first "root") wasgreater than the canonical correlation of R=.659 derived from thediscriminant analysis in which the same teaching variables were related
to or "predicted from" group membership. Group membership alone was
not as good a predictor of teaching variables as were measured programand setting variables, but it is quite possible that the difference inthe Rs was due simply to a larger number of program variable predictorsthan group membership predictors. In any event, teaching behavior asobserved and rated was to some extent predictable from either groupmembership or program variables.
Lists of variables included and values of the largest canonicalcorrelations are presented in Table VIII. Table IX contains statistics
for individual variables from the canonical correlation.
51
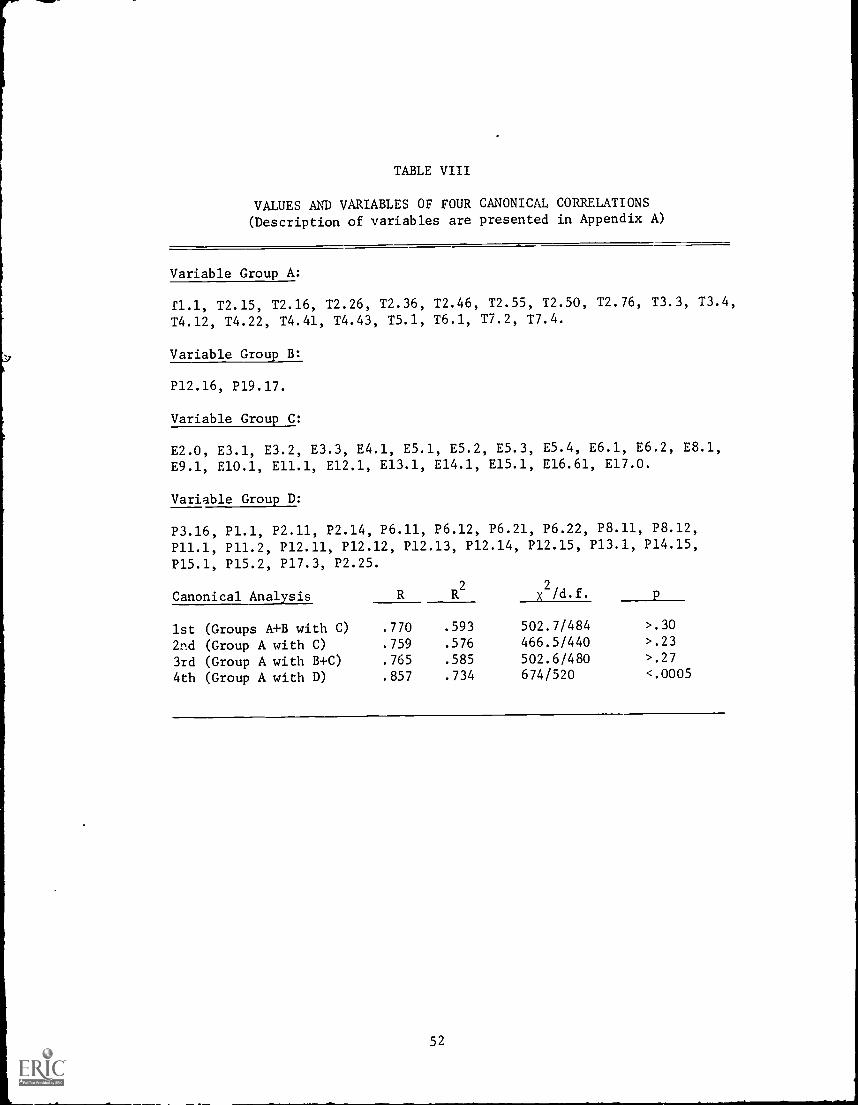
TABLE VIII
VALUES AND VARIABLES OF FOUR CANONICAL CORRELATIONS(Description of variables are presented in Appendix A)
Variable Group A:
£1.1, T2.15, T2.16, T2.26, T2.36, T2.46, T2.55, T2.50, T2.76, T3.3, T3.4,
T4.12, T4.22, T4.41, T4.43, T5.1, T6.1, T7.2, T7.4.
Variable Group B:
P12.16, P19.17.
Variable Group C:
E2.0, E3.1, E3.2, E3.3, E4.1, E5.1, E5.2, E5.3, E5.4, E6.1, E6.2, E8.1,E9.1, E10.1, E11.1, E12.1, E13.1, E14.1, E15.1, E16.61, E17.0.
Variable Group D:
P3.16, P1.1, P2.11, P2.14, P6.11, P6.12, P6.21, P6.22, P8.11, P8.12,P11.1, P11.2, P12.11, P12.12, P12.13, P12.14, P12.15, P13.1, P14.15,
P15.1, P15.2, P17.3, P2.25.
Canonical Analysis R R2
x2/d.f. p
1st (Groups A+B with C) .770 .593 502.7/484 >.30
2nd (Group A with C) .759 .576 466.5/440 >.23
3rd (Group A with B+C) .765 .585 502.6/480 >.27
4th (Group A with D) .857 .734 674/520 <.0005
52

TABLE IX
CORRELATIONS AND CANONICAL WEIGHTS OF FIRST CANONICAL VARIATE FROM CANONICALANALYSIS OF SELECTED PROGRAM AND TEACHING VARIABLES (PLUS MULTIPLE Rs OF
INDIVIDUAL TEACHING VARIABLES PREDICTED BY SET OF PROGRAM VARIABLES)
Program Correlation Canonical Teaching Correlation Canonical Mult R fromVariable w/variate Weight
P3.16 -.09 -.16P1.1 -.75 -1.00P2.11 -.09 .25
P2.14 .00 -.01P4.11 .26 -.23P4.12 .42 .13
.00 -.10P6.11 .06 -.01P5.12 .31 .29
P6.21 .10 .01
P6.22 -.02 .13
P8.11 .13 .12
P8.12 .07 -.67P11.1 -.13 -.11P11.2 .03 .19
P12.11 .19 -.05P12.12 .19 -.07P12.13 .24 .09
P12.14 .18 -.11P12.15 .07 .15
P13.1 .03 .19
P14.15 .06 .18
P15.1 .38 .26
P15.2 .08 -.08P17.3 -.18 .33
P2.25 .31 .34
Variable w/Variate Weight other set
T1.1 .42 .39 .63**T2.15 .45 -.79 .61**T2.16 .46 .83 .60**T2.26 .29 .09 .47
T2.36 .39 .03 .56
T2.46 .10 .04 .51
T2.55 .13 .20 .58*T2.56 .17 .11 .59*T2.66 -.09 -.19 .48
T2.76 -.68 -.65 .71**
T3.3 .05 -.05 .55
T3.4 .02 .00 .53
T4.12 .24 .35 .49
T4.22 -.01 -.12 .33
T4.41 -.34 -.11 .48
T4.43 .15 -.13 .61**
T5.2 .45 .25 .61**
T6.1 .12 -.23 .50
T7.2 .35 .17 .61**
T7.4 .28 .12 .57
*p <.05**p <.01 (or approximately equal)
53

SECTION V
CONCLUSIONS
Certain summarizations of the results can serve as responses to the
questions posed in Section I. The adequacy of the responses varies among
the questions.
1. Which training components of the various training programs variedbetween programs and which tended to be more constant across all
programs?
This question was not answered very well. Because of restrictions
on the type of variables that could be used, because programs naturally
had diffe-_ent settings, and because certain variables were constant oralmost constant within programs, differences among programs tended to
be obvious, spurious, or superficial. Obvious setting differences in-cluded such things as grade level taught by trainee and "ruralness" of
setting. Variables constant within program included such things as aDirector's reponse to a question about parental influence on the program.Programs did vary in terms of use of instructional modules and number ofsupervisory observations. Variables which conceivably could have dugmore deeply into the training style of the programs were missed by the
study. Student assessments of the programs, such as decision-makinginfluence over the program, tended not to reveal any sharp differences,although perceptions of individualization of training did show some
variation with the conventional program scoring markedly lower.
2. To what extent do trainees in the various programs differ and onwhich behaviors do they differ the most?
Different patterns of trainee entry characteristics were found amongprograms, but the differences did not seem to be very exciting, that is,
the variables on which programs differed did not stimulate much specula-tion nor was evidence found that they were related to teaching. Trainees
of the various programs differed in terms of what they reported as gradepoint average in their special field (but not general GPA), previous ex-perience with children, and mother's level of education. They also dif-
fered fairly sharply on the intolerance of ambiguity scale but not on the
other attitude scales.
3. Do teaching behaviors of trainees in the various programs differ andon which behaviors do they differ the most?
Trainees from the various programs significantly differed in twoclusters of variables identified by the discriminant function analysis.One cluster included use of verbal "direct" influence, pupil-initiationor free expression of comments, presentation of ideas, and principals'
ratings. The other cluster included observed pupil attention to task(which overlapped with the first cluster), use of verbal indirect influ-ence, and having pupils work individually (but not in small groups).
54

The two clusters most distinguished the Early Childhood 1070, Auburn,and Everett Turnabout programs from the Conventional and Teacher Corps
programs. The Teacher-Researcher program had an unique position among
the seven programs in relation to these variables.
The teaching differences among programs may have been a function ofgrade level taught (or possibly other setting variables) as much as any-thing, and there was no way in which the grade level variable could bepartialled out, for training variables themselves likely were related tograde level. Nevertheless, at least the possibility remains that train-ing variables independent of grade level--and possibly not captured inthis study--did in fact influence different teaching behavior.
4. To what extent are teaching behaviors predictable from characteris-tics of trainees as they enter the program?
They aren't.
At least no composite pattern derived from those teaching variablesincluded in the study was found to be significantly related to any com-posite of entry characteristics included in the study.
5. Which teaching behaviors, if any, can be found to be associated withand thereby possibly sensitive to training variables, either inde-pendent of or in combination with various entry characteristics?
While a composite of teaching characteristics was found to bemoderately predictable either from a composite of programs and settingcharacteristics or from knowledge of group membership, factor analysisrevealed little clustering of specific teaching variables with specifictraining variables. The setting characteristic of grade level was found
to be related to some teaching variables, and where there was a slighttendency for other program variables to be related, common associationwith grade level is one of the more plausible interpretations. Teaching
variables having to do with verbal interaction, time spent on procedureversus substance, pupil attention, and certain types of class organiza-
tion were associated with at least some program and setting variations.Variables having to do with cognitive level, as imperfectly measured,were not noticeably related to anything in the study.
6. Which training variables were associated with the greatest variation
in teaching behavior?
The variable of grade level taught entered in strongly to the best
equation for predicting a composite of teaching variables. Other vari-
ables which had quite modest associations with the teaching behaviorcomposite included use of training modules, individualization of trainingas perceived by trainees, and reported proportion of disadvantaged child-
ren. Of these only use of modules was a training characteristic asopposed to a setting variable, and the use of modules appeared to have amore or less chance coincidence with those setting variables which more
likely affected performance. Any single training variable that had a
strong impact on teaching behavior was missed by this study.
55

Final Remarks:
This project demonstrated that a multivariate analysis of different
teacher education programs was at least possible. But it was no picnic.
Difficulties abstractly conceived at the outset were more than imaginary.Frequent use of the computer had been expected, for instance, but not
261 machine entries by January 1, 1973. Most major difficulties seemed
to be of three kinds. One was the sheer effort required to cope withthe procedures for collecting a large amount of data from different pro-grams in different schools as much as 120 miles apart. This difficulty
contributed to a low number of subjects to number of variables ratio(causing analytical problems), to possibly increased sources of error(both random and systematic), and to lack of time to devote to other
matters, such as proper development of some measures. Second, there
were difficulties in readying data and programs for multivariate analysis- -
accentuated by the lack of complete information on some subjects and the
requirement for compensation through averaging. Third, important vari-
ables were probably emasculated. The emasculation came from the require-ment that no variable could be program-specific and from the logisticlimitations on data gathering.
Multivariate analysis could very well discern useful patterns andrelationships in teacher education beyond anything found in this study-and this study was undertaken with the idea that successive attemptswould probably be necessary before the investigation began to tune in on
the more significant things. Before this can be done, this project'sexperience would suggest that certain matters be accomplished as neces-
sary or facilitating conditions: First, data gathering should be more
institutionalized and routine. Second, flexible procedures for dataprocessing, storage, and ready retrieval--preferably in an on-linecomputer system--should be worked out in advance. This would include
ready substitution of averages for missing data. Third, either efforts
should be devoted toward finding more penetrating measures--includingmeasures on pupil reaction and growth--that can at the same time be
applied equally well to different programs or the next multivariate ef-forts should be limited to one or a few very similar programs. The
heterogenity of the programs, particularly in regard to variables suchas grade level, appeared to provide a sufficiently diverse mix to
strain comparative study within a single framework, even a complexmultivariate framework, given the measures that were possible. A sub-
sequent study might investigate relationships within a few adjacentgrades rather than over a range of thirteen grade levels. This project
in and of itself failed to suggest that the most important trainingcharacteristics of different programs can be meaningfully compared interms of associations with teaching behavior, and it was unable toattack the matter of pupil learning as a function of teacher training.
The project by no means indicated that multivariate analyses areinvalid for teacher education, but it did suggest that repeated efforts,greater commitmentof resources, and a more limited scope may be neces-
sary conditions for useful results. It could serve as a helpful first
step in a more successful sustained effort.
56

APPENDIX Al
Index of Variables with Indication of
Measurement and Data Processing Procedures
In addition to variables on which data were collected, this indexincludes some variables proposed for the study originally but later
omitted for one reason or another.
Variables are grouped into three series: "E" for entry character-istics, "P" for program and setting characteristics, and "T" for teaching
and exit characteristics. Decimals are used as an aid for indicating
breakdowns of general variables. A zero after a decimal, such as P3.0,indicates a generalized variable; usually there is no direct measure of
such. Measures of one or more facets are usually coded with a numeralother than zero after the decimal, and 'more specific variations ofmeasures by two numerals after the decimal, such as T2.63. With each
code is a description of the measurement, scoring, and transformationprocedure, if any; an indication of the data collection procedure codedwording to the following key; and often another acronym (in parenthesesafter the code number) as a possible aid to the reader when examining thetable of results so that he may not have to refer back and forth quite
so often.
Data collection was by six different procedures, indicated in this
index as follows:
ETQ - Questionnaire and information form completed by trainee(usually) shortly after entrance to the field component
of his training program
INT - Interview of subject trainee, cooperative teacher, and/orbuilding principal
PD - Interview of director of particular training program
and/or college supervisor
OBS - Classroom observation when trainee was teaching
PR - Rating of trainee by building principal
PTQ - Questionnaire completed by trainee around time of com-pletion of his training program
Descriptive summary statistics for the variables in this index are
included in Appendix B. The summary statistics there are given for allsubjects combined from all programs and for subjects within each program.
57

ENTRY CHARACTERISTICS
E1.0 Scholastic Aptitude. No data compiled, despite original intentions,for reasons of lack of commonality or unavailability of data onsubjects plus anticipation of difficulties and time costs of sub-
jects were to be tested during the study.
E2.0 Sex. For data processing and analysis, male subjects were scored
"1" and females "2."
E3.0 Scholastic Achievement.
E3.1 (GPA-G) General. ETQ Self-reported GPA for all college work
as remembered and estimated by subjects.
E3.2 (GPA-Sp) Special Field. ETQ Self-reported GPA as remembered
for subject's major field in college.
E3.3 (GPA-LB) "Late-blooming." ETQ Self-reported GPA as remem-
bered for last year of college prior to entry to
training program.
E4.0 Undergraduate vs. Graduate StatusE4.1 (Grad) Undergraduates scored "1", all post-Baccaleureates
scored a "2."
E4.2 (Grad) Undergraduate "1," post-Baccaleaureate but not Mas-ter's candidates "2," Master's degree candidates "3."
E5.0 Experience working with Children prior to Teacher Training. Es-
timated amount and kind of experience reported on ETQ and subse-quently rated on 4 or 5 point scale. To determine scale for each,
reported hours times weeks times years produced product which was
then placed in frequency distribution. Divisions of distribution
into five then made on basis of eyeball analysis.
E5.1 (BabyS) Babysitting type of experience (2000=5; 1-100=2; 0=1)E5.2 (Church) Church group, Sunday School type of experience (1000=
5; 1-100=2)E5.3 (Rec) Recreation program, camp type of experience (1000=5;
500-1000=4; 1-150=2)E5.4 (Therap) Therapeutic, remedial, and other types of experience
(1-100=2; 1000=5)E5.5 (CompEx) Composite experience rating; summation of 5.1-5.4
E6.0 Social Class BackgroundE6.1 (FOup) Father or legal guardian's occupation during subject's
junior high school age reported on ETQ and subse-quently rated for prestige according to scale fromRobert Hodge et al, "Occupation Prestige in the U.S.1925-63," Class, Status, and Power, R. Bendix (ed.)
E6.2 (ftthEd) Mother's education reported on ETQ, 7-point scaleranging from highest level of less than 8th grade(=1) to graduate degree (=7)
58

E7.0 Attitudes toward Teacher Training.
E7.1 (ATTP) Sum of 7 Likert-type items, an ETQ, items derived by
project staff. Also coded P19.17.
E8.0 Tolerance of AmbiguityE8.1 (TA) Sum of 16 Likert-type items on ETQ entitled opinion
Inventory A, items taken from Robinson and Shaver
(1969).* Low scores indicate high tolerance.
E9.0 Social Activism, Political-Economic AttitudesE9.1 (Pol-Ec) Sum of 14 Likert-type items on ETQ entitled Social
Attitudes A, items devised by project staff and alsotaken from Robinson and Shaver (1969). High scores
indicate high activism.
E10.0 Social Responsibility ScaleE10.1 (SRS) Sum of 8 Likert-type items on ETQ entitled Social
Attitudes B, items taken from Robinson and Shaver
(1969). High scores indicate high responsibility.
E11.0 DogmatismE11.1 (SDogm) Sum of 20 Likert-type items on ETQ taken from Score
on short form of Rokeach's Dogmatism Scale, appear-ing as 20 Likert-type items on ETQ and entitledOpinion Inventory B. High scores indicate high dog-
matism.
E12.0 "Willingness to Tackle Problems and Desire to do a Good Job in
Solving Them"E12.1 (Clusl) First cluster of items appearing from cluster analy-
sis of all items in previous fine scales (E7.1 to
E11.1). Sum of 20 item scores (identification ofitems and description of cluster analysis in Appen-
dix C). High scores indicate high willingness anddesire to do a good job.
E13.0 "Inequities and Regimentation of contemporary society and the de-sire of tide Individual for Self-Expression through varied oppor-
tunities"E13.1 (Clus2) Second appearing cluster of items from five opinion
scales on ETQ. Thirteen items (Appendix C). Highscores indicate belief inequities and regimentation
is high.
E14.0 "Negative Aspects and Feelings about Interaction with other peopleand their ideas"E14.1 (Clus3) Third appearing cluster from opinion items in ETQ
scales. Eight items (Appendix C). High scores
*John P. Robinson and Phillip R. Shaver, Measures of Social Psychological
Attitudes, Ann Arbor: Institute for Social Research, Univ. of Michigan
(1969).
59

indicate negative feelings.
E15.0 "Dichotomization of Situation into Right vs. Wrong and the Desirefor help from Superiors in Resolving these Situations"E15.1 (Clus4) Fourth appearing cluster from opinion items in ETQ
scales. Ten items (Appendix C). High scores indi-cate tendency to dichotomize.
E16.0 Previous participation in Campus Activities. Ratings based Lihours of participation in various activities and on leadershipportions in activities reported on ETQ.E16.11 (AthAc) Reported participation in all athletics (Quarter X
hours) rated from 1 to 4 (0-1=1; 2-10=2; 11-50=3;50=4).
E16.12 "2" if leadership in athletics reported, "1" other-wise.
E16.21 (BTeam) Reported participation in "big-time" team sportsrated 1 to 4.
E16.22 "2" if leadership in team sports reported, "1"otherwise.
E16.31 (LTeam) Reported participation in other team sports rated1 to 4.
E16.32 "2" if leadership in other team sports reported, "1"otherwise.
E16.41 (ISpor) Reported participation in individual sports rated 1to 4.
E16.42 "2" if leadership in individual sports reported, "1"otherwise.
E16.51 (Mus) Reported participation in musical activities (0-1=1;50=5).
E16.52 "2" if leadership in musical activities reported, "1"otherwise.
E16.61 (Spch) Reported participation in speech (drama, forensics)activity, as rated (50=4).
E16.62 "2" if leadership in speech activities reported, "1"otherwise.
E16.71 (Polit) Reported participation in political activities asrated (0=1; 1-10=2; 50=4).
E16.72 "2" if leadership role in politics reported, "1"otherwise.
E16.81 (SocAct) Reported participation in social activities, asrated (25=4).
1_6.82 "2" if leadership role in social activities reported,"1" otherwise.
E16.91 (SGovt) Reported participation in student government, asrated (25-50=4; 50=5).
E16.92 "2" if leadership role in student government reported,"1" otherwise.
E16.01 Reported participation in "other" activities, as rated(25=4)
E16.02 "2" if leadership in "other" activities reported, "1"if not.
E17.0 Age. Year of birth reported on ETQ and subtracted from 1972.
60

PROGRAM AND SETTING CHARACTERISTICS
P1.0 Age and Level of Children
P1.1 (GrLvl) Grade level taught by subject, recorded on INTV, nottransformed (K=0); averaged if necessary for morethan one class taught.
P2.0 Disadvantaged and Minority Children Setting, INTV
P2.1 Minority ChildrenP2.11 (Blac) Reported % of Blacks (including average if any)
P2.12 (AmInd) Reported % of Indians
P2.13 (MexAm) Reported % of Mexican-Americans
P2.14 (Minrty) Total of 2.11, 2.12, and 2.13
P2.15 Classification of person who provided infor-mation for P2.1 (1=Principal, 2=CooperativeTeacher, 3=Trainee, 4=College Supervisor, 5=Other, 6=Multipin Sources)
P2.2 (Disadv) Economically Disadvantaged Children as Reported.Criterion somewhat fuzzy, but free hot lunch eligi-bility used as sug4ested indicator.
P2.21 (Rur1P) percentage in class reported by principal (av-eraged for subject who taught more than oneclass).
P2.22 (Rur1C) percentage in class reported by cooperatingteacher (averaged for classes).
P2.23 (Rur1T) percentage in class reported by trainee (av-eraged for classes).
P2.24 (Rur1M) percentage in class reported from any sourceor averaged for combination of sources.
P2.25 percentage in class reported by any of aboveor averaged of above.
P3.0 Rural vs. Urban Setting
P3.1 Portion of children reported to live in rural areas.P3.11 (RurlE) self-evidentP3.12 (Rur1C) reported by cooperating teacherP3.13 (Rur1P) reported by principalP3.14 (Rur1T) reported by trainee
P3.15 (Rurl) combination of sources
P3.16 figure reported by any one of 3.11 to 3.14 oraverage of any conflicting reports.
P3.2 Determination of type of area where remaining portion ofchildren live.P3.21 Classification of remaining portion as "small
town" (=1), "suburban" (=2) , or "urban" (=3)
P3.3 Generated variables combining information from P3.1 and P3.2
P3.31 (Urban) One minus portion in P3.15 times 2 if smalltown, 4 if suburban, and 5 if urban.
P4.0 Training by Instructional Modules (Learning Packages)
61

P4.1 Number of modules examined (either studied thoroughly or just
moderately examined by trainee).P4.11 (MduiT) Reported by trainee. INTV.
P4.12 (MdulPD) Reported by program director or supervisor. PD.
P4.13 Resolution of 4.11 and 4.12 if different. (Not
yet devised).
P4.2 Number of modules worked through (criterion tests taken or
studied thoroughly).P4.21 (CMd1T) Reported by traineeP4.22 (CMd1PD) Reported by program director
P4.23 Resolution of 4.21 and 4.22 if different (notyet devised).
P5.0 Program Field-CenterednessP5.1 (F1dCr) Number of education courses credits earned off-campus.
P5.11 Reported by traineeP5.12 Reported by program director
P5.2 (F1dQ) Number of quarters spent off-campus, including frac-tional quarter for September pre-fall quarter exper-ience if reported.
P6.0 Local Con,.rol of Program
P6.1 Reported influence by teachers' associations. Six pointscale ranging from l="no influence" to 6c"more influence
than anybody else."P6.11 (LocalT) reported by trainee or cooperating teacher or
principal. INTV.
P6.12 (LocalP) reported by program director or supervisor. PD.
P6.2 Reported influence by parents' group. Same six point scale as
P6.1.P6.21 (ParnD) reported by trainee, cooperating teacher, or
principal. INTV.
P6.22 (ParnT) reported by program director or supervisor. PD.
P7.0 Amount of Teaching Responsibility Given Interns (Data not obtainedin study).
P8.0 Amount of Microteaching.P8.1 Number of episodes reported (broad definition).
P8.11 (McroT) by trainee, INTV.P8.12 (McroD) by project director. PD.
P8.2 Number of episodes reported by project director using strict
uefinition of microteaching. PD.
P9.0 rhilosophy of Project Staff (Not obtained in study)
P10.0 (Omitted.).
P11.0 College Supervision.P11.1 Observations (coupled with post-conference) by college super-
visor.
62

P11.11 (SuprT) as reported by traineeP11.12 (SuprS) as reported by project director or supervisor
P11.13 any resolution of 11.11 or 11.12 (not yetdevised for study).
P11.2 Observations preceded by pre-conference:11.21 reported by trainee
P11.22 reported by project directorP11.3 Any reports of conferences with cooperating teacher
P11.31 reported by trainees
P11.32 reported by project director
P12.0 Trainee Choice over Program Content and Objectives. INTV.
P12.1 (Choice) As perceived by trainee (INTV) using same six point
scale as in P6.0.
P12.11 Over substantive content of courses
P12.12 Over student teaching assignment
P12.13 Over tasks and duties
P12.14 Over content of stIdy of education during studentteaching
P12.15 Over trainee evaluation
P12.16 Average or total
P12.17 Some other composite of P12.11 to P12.15.
P13.0 Experience of Cooperating Teacher with Student TeachersP13.1 (CTExp) Number of student teachers previously supervised by
cooperating teacher as reported (9 maximum). INTV.
P14.0 Attitudes of School Personnel Toward Professional EducatingP14.1 Cooperating teacher attitudes
P14.11 to 14.14 Responses to items 13e and 13d (7-pointscale) on interview. Responses averaged if morethan one respondent.
P14.15 (SchATT)Total of responses 13a to 13d averaged formore than one teacher if necessary.
P14.2 Building principals' attitudesP14.21 to 14.24 Responses by principal to items 13a to
13d on INTV.P14.25 Total of responses to same items.
P14.3 Composite of School Personnel of P14.11-P14.15 and P14.21-P14.25 series if data obtained for both; otherwise just re-peat of values for one or other.
P15.0 Individualization of Teacher Training.P15.1 (IndTT) Response to question 12 on INTV by trainee--trainee
perception.
P15.2 Response to question about importance of feature byProject Director or Supervisor.
63

P17.0 Rated Effectiveness of Cooperating Teachers by Project Director orCollege Supervisor on 5 point scale (1=lowest; 5=highest). PD.
P17.1 (CoopT) Rated specifically for subject traineeP17.2 Rated in general for any traineeP17.3 Total of 17.1 and 17.2
P18.0 Conformite of Program to ComField Lab-Practicum (No data obtained)
P19.0 Attitude Toward Training ProgramP19.1 (AttP) Response on ETQ by trainee.
P19.11 to 19.16 items on ETQP19.17 total of 19.11 to 19.17 (Duplicate of E7.1)
P19.2 Attitude on Exit Questionnaire by trainee.P19.21 to 19.26 same items on PTQ. Items 50, 51, 52, 53(R),
54(R), 55, 56P19.27 total of 19,21 to 19.26
P19.3 Change 19.17 to 19.27
64

TEACHING VARIABLES
(Also termed "Exit" Variables in Some Descriptions of the Study)
Most variables in this group (T2.0 through T9.0) were based on class-room observations of the subjects. The measurement procedure consisted,first of all dividing the first four minutes into 30-second time segments.For each time segment, symbols were entered for (a) instructional grouping(LP = formal presentation such as film, L = whole group discussion or in-formal lecture, S = small group activities, i = pupils working as individ-uals on projects or seatwork), (b) verbal utterances according to modifiedcategories from Flanders' interaction analysis]: indirect influence, ex-tended indirect (six seconds or longer), direct and extended direct (di-rection or criticism), and pupil-initiated or free comments, both shortand extended, and (c) questLons or problems to which pupils were expectedto respond partially according to the cognitive Taxonomy of EducationalObjectives (Bloom et al, D. McKay Co., 1956), namely, K = knowledge ormemory, C = comprehension, A = application or analysis, S = synthesis andE = evaluation. Then, pupils were scanned one by one and rated on overtestimated attention to task on a five point scale (0 = extreme avoidanceor disruptive behavior, 4 = intense, emotionally-tinged attention) withaverage of pupils later computed. These two procedures were then repeatedtwice. Following this, the class was rated on individualization of in-struction and four adjective pairs and additionally certain comments aboutmaterials and methods were sometimes added. Preparation of much of thisdata for analysis frequently involved formation of ratios and then averag-ing across observation for a subject as noted below. Most subjects wereobserved three times with the observations typically divided between twoor three observers. One key problem of observing and obtaining accuratedata was the difficulty in making the cognitive classification procedure(T4.0 variables) applicable and consistent both for whole-class arrange-ments and for individualized learning station arrangements. There islittle confidence that this problem was adequatly solved for this study.
1Description of the systems are in several sources including Ned.
A. Flanders, Analyzing, Teaching Behaviors, Nsw York: Addison-Wesley Co.(1970).
65

T1.0 General Assessment of Trainee's Quality by Building PrincipalsT1.1 (PrinR) Total of 3 items. PR. Three individual items (T1.11,
T1.12, T1.13) responded to by building principal.Each item has five scaled responses and involves aslightly different facet.
T2.0 Variety of Verbal Interaction Patterns using modification of Flan-ders' ca_egories each variable is an average across observationper subject.
T2.1 Use of Indirect influence- Ratios (Indirect plus extendedindirect)T2.11 Indirect time segments over formal presentations
(LP) time segments.T2.12 (VIndL) Indirect time segments over time segments when
class was operating as a whole group (L).Indirect time segments over time segments whenclass was operating as in small groups (S).Indirect time segments over time segments whenpupils were working as individuals (i).Indirect time segments over time segments wheninteraction was an expected part of the class-room activity.
T2.16 (VIndT) Indirect time segments over total time segmentsT2.2 Use of extended indirect influence (spoken for six seconds or
longer).
T2.21 to T2.25 (XInd) Time segments during which extended in-indirect occurred :ger time series of denomina-tors as for T2.1 series.
T2.3 Use of direct influence (direct plus extended direct), namelydirections or criticism.T2.31 to T2.36 (VDir) Time segments during which direct
statements occurred over same series of denom-inators as for T2.1.
T2.4 Use of extended direct influence (six seconds or longer)T2.41 to T2.46 (XDiv) Time segments during which extended di-
rect occurred over same denominators as T2.1T2.5 Occurrences of "Pupil-Initiated" Comments (short plus extended
Category "9" in Flanders' categories.T2.51 to T2.56 (Pup) Time segments during which this occurred
over same denominators as T2.1T2.6 Occurrences of Extended Pupil-Initiated Comments
T2.61 to T2.66 (XPup) over same denominators as T2.1T2.7 Extended Explanation or Information Presentation by Teacher
(six seconds or longer).T2.71 to T2.76 (VInf) time segments over same denominators as
T2.1.
T2.13 (VIndS)
T2.14 (VIndI)
T2.15 (VIndE)
T3.0 Use of Whole Class Group vs. Individual or Small Group Activities.Averaged across Observation per Subject.T3.1 (S+i/T) S + i segments over total time segments recorded.T3.2 (L/T) L segments over total time segments.T3.3 (i/T) i segments over total time segments.T3.4 (S/T) S segments over total time segments.
66
)

T4.0 Cognitive Level of Expected Classroom Work, All Variables areAverages of Observation per Subject.T4.1 Above knowledge question usage. Question defined as any prob-
lem to which pupils were expected to respond.T4.11 (CogQ) Ratio of time segments during which comprehen-
sion, application-analysis, synthesis and/orevaluation level questions were asked to timesegments any question was asked.
T4.12 Same numerator as T4.11 with total time seg-ments observed as denominator.
T4.2 Above comprehension question usageT4.21 (HCogQ) Same ratio as 4.11 except that comprehension
only time segments dropped from numerator.T4.22 Same as T4.21 except total time segments as
denominator.T4.3 Usage of any questions
T4.31 (Ques) Ratio of time segments during which questionsasked to total time segments observed.
T4.4 Emphasis on Procedures.T4.41 (Proc) tine segments procedural questions or no ques-
tions asked over total time segments.T4.42 Variable on cognitive versus procedural seg-
ments lost because of technical difficulties.T4.43 procedural--no question time segments over i +
S time segments plus 1.
T5.0 Pupil Attention, ObservedT5.1 (Atten) Average of pupil attention scan ratios (average for
each observation averaged for all observations)T5.2 (HAtten) Highest pupil attention score for each observation
averaged across observations.
T6.0 Observed Individualization of Instruction by Trainee.T6.1 (IndvI) As rated by observer on 5 point scale averaged across
observations, minimal specification of "Individuali-zation" provided observers.
T7.0 Adjective Pairs: Rating of Classroom Climate and Teacher Behaviorby observer. Averaged across observations for each subject. Sevenpoint scale for each item with high scores reflecting favorableratings.
T7.1 (Mgmt) Class Management rating.T7.2 (Dull) Dull to stimulating.T7.3 (Systm) Disorganized to systematic.T7.4 (Harsh) Harsh to kind.
T8.0 Variety of Methods: Occurrence of Unusual MethodsT8.1 Unobtained rating of observer comments.
T9.0 Variety of Materials.T9.1 Unobtained rating of obserJr comments.
67

T10.0 Commitment to Teaching.
T10.1 (Commt) Sum of 2 7-point Likert items on PTQ (Items 46 and 47,both reverse scored). High scores show high commit-ment.
T11.0 Pupil-Centered Problem Solving Behavior Tendencies by TeacherT11.1 Teaching Situation Reaction Test. Low scores show
high pupil-centered problem-solving tendencies.
68

APPENDIX A2
PERSONAL1TY-ATTITUDE SCALES GENERATED FROMMEASUREy USED IN THE MATE STUDY
The following description of a cluster analysis is an example ofthe type of correlation data being developed and analyzed currently by
the MATE study. These techniques will be used in the same manner in this
proposed study.
Three of the four referenced scales in the overall teacher opine_ -Jn
and attitude survey are standard psychological instruments. These were
the tolerance of ambiguity scale, the political and economic =_ citudes
scale, the social responsibility scale and the Rokeach short form dogmatismscale.
The political and economic scale was supplemented with our own items
to measure current political activism. The fourth scale, opinions aboutteacher training, was developed by Burton Grover for the MATE study.The following then is an example of one type of uage of this data.
A cluster analysis was performed on the 67 items of the attitude
scale. Clusters of items were formed in such a manner that the averagecorrelation among items in a cluster was twice that of the average correla-tion of the items inthe cluster with those not in the cluster.
The first cluster contained 20 items, four from the teacher trainingscale (TT), five from the tolerance of ambiguity scale (TA), six from thepolitical and economic attitudes scale (PE), three from the social responsi-
bility scale (SR) and two from the Rokeach dogmatism (RD) scale.
These items can be grouped under the heading "willingness to tackleproblems and desire to do a good job in solving them." Seven items dealtspecifically with doing the best possible job, six with the possibility ofmore than one aspect to a problem and solution to it and six with the
legitimate manner cf solving problems.
The second cluster of items contained B items, eight from the PEscale and five from the TA scale. All items easily fall under the headingof "inequities and regimentation of contemporary society and the desire ofthe individual for self expression through varied opportunities." Nine
of the items deal specifically with society; its inequities Ind regimenta-tion, the other five with desire for self expression in various ways.
The third cluster comprised eight items, one from the TT scale four
from the SR scale and three _romtthe RD scale. These can all be grouped
under the heading "negative aspects and feelings about interaction with
other people and tneir ideas. Six of the items dealt with interaction
with people alone, three with people and ideas.
The fourth cluster was made up of ten T..,o of these were from
the TA scale and eight from t.-1 RD scale. The general "nor.ding for r.his
69

cluster would be "dic:!lotomization of situations into right vs. wrong and
the desire for help trc-n superiors in resolving these situations." Six
items were specific in reference to dichotomizing and four were specificin the desire for help from superiors.
The remaining 16 items did not readily fall into any cluster or set
of clusters. The. e, therefore, did not correlate any higher among any
subset of themselves "Ian among all themselves.
--Jerry King
70

ORIGINAL SCALE
OTT - Opinions about Teacher Training Program
TA - Tolerance of Ambiguity
P-E - Politicri and Economic Attitudes Scale
SRS - Social :'asponsibility Scale
RD - Rokeach's Dogmatism Scale (Short Form)
Original
Scale
OTT
OTT
OTT
OTT
SRS
SRS
TA
SRS
RD
TA
PE
RD
P-E
P-E
FIRST CLUSTER
Item
I am confident that the training program in which I am enrolled
will be doing a good job in preparing me to teach.
If I had to do it over again, I would enroll in the same
teacher training program.
The instructors and teachers in my teacher education program
have generally been very competent.
So far in my education training, I have learned about things
that are relevant to current problems in American Education.
It is the duty of each person to do his job the very best he
can.
I feel very bad when I have failed to finish a job I promised
I would do.
A good teacher is one who makes you wonder about your way of
looking at things.
Every person should give some of his time for the good of his
town or country.
My blood boils whenever a person stubbornly refuses to admit
he's wrong.
Often the most interesting and stimulating people are those
who don't mind being different and original.
Generally, the government does a good job in protecting our
self-interest.
It is only when a person devotes himself to an ideal or
cause that life becomes meaningful.
Anyone who violates the law for reasons of conscience should
be willing to accept the legal consequences.
There are legitimate channels for reform which must be
exhausted before attempting disruption.
71

P-E
P-E
TA
TA
P-E
P-E
P-E
P-E
P-E
P-E
P-E
P-E
P-E
P-E
TA
TA
TA
TA
Traditions serve a useful social function by providirig stability
and continuity.
In the long run, it is possible to get more done by tackling
small, simple problems rather than large and complicated ones.
People who insist upon a "yes" or "no" answer just don't know
how complicated things really are.
I would like to live in a foreign country for a while.
A problem with most older people is that they have learned toaccept society as it is, not as it should be.
In this complicated world of ours the only way we can know
what's going on is to rely on leaders or experts who can be
trusted.
SECOND CLUSTER
In order to achieve what we need in our society, the system
has to be drastically changed.
Basically, the values of the establishment are hypocritical.
In practice the rich and the pror are not equal before the law.
Society should be quicker to throw out old ideas and traditions
and to adopt new thinking and customs.
The structure of our society is such that self-alienation is
inevitable.
The bureaucracy of American society makes it impossible to
live and work spontaneously.
While man has great potential for good, society brings out
primarily the worst in him.
True democracy is limited in the United States because of the
special privileges enjoyed by business and industry.
Many of our most important decisions are based upon insufficient
information.
People who fit their lives to a schedule probably miss most
of the joy of living.
Teachers or supervisors who hand out vague assign:Tants give a
chance for one to show initiative and originality.
It is more fun to tackle a complicated problem than to solve
a simple one.
72

TA I like parties where I know most of the people more than oneswhere all or most of the people are complete strangers.
SRS
SRS
SRS
RD
SRS
OTT
RD
RD
TA
RD
RD
RD
RD
RD
RD
TA
THIRD CLUSTER
It is no use worrying about current events or public affairs;
I can not do anything about them.
People would be much better off if they could live far awayfrom other people and never have to do anything for them.
Letting your friends down is not so bad because you can't do
good all the time for everybody.
Most of the ideas which get printed nowadays aren't worth thepaper they are printed on.
Our country would be a lot better off if we didn't have so
many elections and people didn't vote so often.
An expert who doesn't come up with a definite answer probably
doesn't know too much.
To compromise with our political opponents is dangerous becauseit usually leads to the betrayal of our own side.
Most people just don't know wha:.'s good for them.
FOURTH CLUSTER
The sooner we all acquire similar values and ideals the better.
Of all the different philosophies which exist in this world:there is probably only one which is correct.
I'd like it if I could find someone who could tell me how to
solve my personal problems.
There are two kinds of people in this world.
Even though freedom of speech for all groups is a worthwhile
goal, it is unfortunately necessary to restrict the freedom
of certain political groups.
Most people just don't give a "damn" for others.
The present is all too often full of unhappiness. It is only
the future that counts.
A good job is one where what is to be done and how it is to be
done are always clear.
73

RD Man on his own is a helpless and miserable creature.
RD The highest form of government is a democracy and the highest
form of democracy is a government run by those who are the
most ir.telligent.
REMAINING ITEMS
So far in my education training, I have learned little of
any practical value for teaching.
I would know much more about teaching methods. than I do now
if I were in a better training program..
It is often desirable to reserve judgment about what's going
on until one has had a chance to hear the opinions of those
one respects.
In a discussion I often find it necessary to repeat myself
several times to make sure I am being understood.
It is better to be a dead hero than to be a live coward.
The main thing in life is for a person to want to do something
important.
The United States and Russia have just about nothing in common.
74

APPENDIX B1
DESCRIPTIVE STATISTICS
Descriptive statistics are presented for several variables in this appen-
dix. Statistics include mean, standard deviation, and number of subjects
for individual programs and for all programs combined. Also given for
some variables is a correlation ratio, eta squared ( ), indicating pro-
portions of total variance associated with differences among training
programs (groups of trainees in different programs) as opposed to variance
associated with differences between individual subjects in their programs.
Appendix A provides some description of the variables and the same codes
and acronyms by which variables are identified here.
75

VARIABLES
Auburn
SEEC
TRAININu PROGRAMS
Project
1070
Teacher
Teacher
Conven-
Researcher
Cops
tional
Turn
About
2.0
(Sex)
7 5
ii 7
18
00
10 10
6 9
Ii 6
i1 4
3.1
x2.90
3.04
2.97
3.0:2.
2.93
3.08
2.95
(;p:-',-,)
c.36
.40
.30
.3A
.46
.28
.47
n11
15
15
18
12
16
12
r.3.2
i3.49
Z.17
3.(,3
3.37
2.04
3.25
3.81
('PA -Sp)
s.45
.39
.29
.40
.49
.25
.26
n10
12
13
14
11
16
12
r;3.3
x3.30
3.12
3.20
3.14
3.13
3.10
3.11
(3g)P-1 ir.z)
s.47
.37
.34
.47
.47
.33
.42
n12
12
12
15
11
16
9
F. 4.2
-i
1.92
2.93
1.18
2.93
1.08
2.94
3.00
(Gra,1)
s.28
.25
.38
.45
.28
.24
0
n12
15
17
19
12
16
14
5.1
X1.67
3.20
1.82
2.16
1.25
2.19
2.71
(Bahy S)
1.18
1.60
1.04
1.39
.60
1.38
1.39
12
15
17
19
12
16
14
5.2
X1.50
1.27
1.38
1.37
1.25
1.31
1.93
('.hurch)
s1.12
.77
1.13
.67
.60
.85
1.22
12
15
17
19
12
16
14
:5.3
x2.58
1.40
1.00
1.63
1.42
1.T3
1.2?
fl,c)
s1.61
.88
0.93
1.11
1.3ti
1.03
12
15
17
.12
16
14
OVERALL
74
41 3.00
.:)75
.38
98 3.29
.371
.47
87 3.15
.090
.42
86 2.34
.872
.85
104 2.12
.337
1.41
104 1.51
.268
.)7
104 1.58
.29
1.16
104

VARIABLES
Auburn
SEEC
TRAINING PROGRAMS
Project
Teacher
Teacher
Conven-
1070
Researcher
Corps
tional
Turn
About
5./'
(Thera- )
X s n
2.73
1.,50
11
1.4°
.8n
14
1.35
.75
16
1.4i
.P.2
18
2.0-)
1.0';
11
'2.13
1.41
13
1."3
1.3=',
13
--
,
).)
(":0'0-x )
X s n
8.50
2.81
12
7.27
2.17
15
6.96
1.83
17
6.61
2.01
19
5.02
1.98
12
7.50
2.74
16
7.86
2.95
14
E )1
(FOcco)
s
L 6.2
(Moth Ed)
)(-
s n
4.91
1,33
11
3.62
1.85
13
3,31
1.25
16
3.94
1,35
lf
2,75
(85
1 2
3.88
1.20
16
3,23
60
1 3
;"8.1
"FA)
x s n
51.67
7.77
12
50.33
8.00
12
56.38
7.91
16
52.22
10.15
18
48.11
9.74
12
57.19
6.94
16
60.57
7.11
14
0.1
('=o1 -Ec
s n
59.25
7.61
1?
60.42
3.43
12
61.00
6.80
16
60.61
3.88
18
60.75
8.52
12
57.81
6.95
16
26.00
4.14
16
56.79
6.48
14
25.21
6.31
14
E 10.1
(ES)
x s
24.58
7.70
12
25.08
3.95
12
25.13
2.60
16
25.33
4.03
18
27.58
4.55
12
11.1
(.."Ionw)
s
59.33
15.'8
12
59.27
8.57
11
60.°4
11.09
16
61.78
q.
(15.
)
18
58.50
15.03
12
39.81
10.54
16
65.21
13.93
14
04N
OVERALL
1*(2
1 i..,2
1.23
104
.183
.2-4
2.50
104
.14?
3.66
99
54.10
.243
9.27
99 59.40
.986
6.50
99
.
25.56
.29)
5.09
99 60.93
.178
12.5'
98

CC
VARIABLES
Auburn
SEEC
TRAINING PROGRAMS
Project
1070
Teacher
Teacher
Conven-
Researcher
Cor s
tional
Turn
Abou
E 12.1
(Clus 1)
X s n
74.00
5.79
12
74.23
5.86
12
75.75
7.66
16
74.17
7.03
r,
68.75
8.15
12
74.06
:5.'13
,0
''
72.°3
3.34
14
I- 13.1
rlus
T(-
s
AS.75
4.9g
12
51.83
3.29
12
50.31
no.or
5.44
3.66
16
13
49.4?
6.24
,,
1
4fl..'18
.6.5;1
113
n5. +3
4.74
14
14.1
X25.50
22.25
25.32
25.28
28.92
27.94
27.21
(r.lus 3)
s4.33
4.30
4.20
3.21
5.38
3.60
5.19
n12
12
16
12
1?
16
14
E 15.1
-34.25
34.42
34.44
r 30.72
34.33
34.9a
37.86
(Clds A)
s6.55
5.°2
6.8°
6.62
9.04
5.57
6.66
12
12
16
18
12
16
14
E 16.11
X4.58
3.73
3.12
3.79
4.50
4.00
6.21
(Athk)
s1.75
.85
.32
1.00
2.06
.94
7.78
12
15
17
19
12
16
14
E 16.21
X1.08
1.00
1.00
1.00
1.08
1.13
1.00
(B1-ear.;)
s.28
00
0.28
.33
012
15
17
19
12
16
14
..
16.31
1.25
1.36
(LT-:a;1)
s.75
.81
n12
i5
17
19
12
16
14
.16./11
;-z
1.19
1.43
.)--mr)
s n
.30
-,1
1
1.05
14
OVERALL
11,2
74.38
7.71
29
.171
49.06
.-)94
5.29
99
26.20
.149
4.62
99
35.32
.250
6.92
99 4.21
.137
3.20
104 1.04
.097
.19
104 1.26
.131
.69
104 1.19
.135
.61
104

VARIABLES
Auburn
SEEC
TRAINING PROGRAMS
Project
Teacher
Teacher
Conven-
1070
Researcher
Cor s
tional
Turn
About
t" 15.51
(MUS)
s
1.75
1.1)
12
1.40
.75
15
1.12
.32
17
1.47
.82
19
1.)7
1.18
12
1.-;.)
.79
,-..
1.93
1.03
14
E 16.51
1.58
2.20
1.12
1.0D
1.37
1.13
1.3o
(SPCA)
S.8.)
.75
.32
.22
1.31
.33
.89
12
15
17
19
12
15
1'+
E 1).52
2.75
2.20
2.05
2.11
2.50
2.25
2.43
S1.23
.75
.24
0.31
.96
.56
.73
12
15
17
19
12
16
14
E 15.71
1.08
1.00
1.00
1.00
1.00
1.00
1.00
(POUT)
S.28
00
00
00
00
00
00
n12
15
17
19
12
16
14
1.58
1.07
1.00
1.11
1.25
1.00
1.00
E 16.81
X1.11
.25
CO
.31
.83
00
00
(Soc Act)
S n12
15
17
19
12
13
14
E 16.91
(S Covt)
X S n
1;5 67
12
E 16.01
(Other)
s n
E 16.12
S n
OVERALL
112
1.56
.92
104
.141
1.33
.337
.85
104 2.30
.155
.75
104 1.01
.133
.1
104 1.13
.180
.53
104

VARIABLES
Auburn
SEEC
TRAINING PROGRAMS
Project
Teacher
Teacher
Conven-
Researcher
Corps
tional
Turn
Abou
E 17,0
(Acle)
-) i'
S n
31.00
9.03
12
22.33
2.J9
15
33.52
7.67
17
23.37
5.95
19
26.15
3.76
13
23.50
6.00
16
28.36
11.25
14
3.63
5.26
2.20
6.75
5.00
9.91
1.53
P 1.1
x1.78
3.-61
1.26
.66
1.5G
2.77
1.48
(GR LVL)
S n12
17
15
815
17
15
X00
.15
00
00
00
.00
.02
P 2.11
s00
.08
.01
00
00
00
.02
(BLAC)
n12
17
15
815
17
15
x.0
1.01
.05
.07
.08
.02
.05
P 2.12
s.01
.01
.08
.06
.09
.02
.04
(AM IND)
n12
17
15
815
17
15
X00
.02
.04
.03
.05
.02
.01
r 2.13
SG0
.04
.08
.04
.02
(MEX AM)
n12
.02
17
.05
15
815
17
15
x.01
.18
.09
.10
.12
.04
.08
P 2.14
s.01
.09
.08
.09
.15
.04
.04
(MINRTY)
n12
17
15
815
17
15
P 2.15
x s n
.30
.12
.08
.10
x.20
2.21
s00
00
00
00
.01
IP 'D1SADV)
n2
31
2
OVERALL
I'V2
26.78
7.97
106
.268
4.33
.423
2.84
99
.03
.772
.07
99
.04
.264
.06
99
.02
.000*
.04
99
.09
.347
.10
99
.17
-
.09
12

VAPIABLES
Auburn
SEEC
TRAINING PROGRAMS
Project
Teacher
Teacher
Conven-
1070
Researcher
Corps
tional
Turn
About
xP 3.15
S.20
.58
.25
.<&;'l(1, M)
n2.08
.06
.37
-.78
0.45
.01
.80
.27
.02
P 3.16
X.09
0.42
.02
.18
.40
.08
(RULL)
S12
18
18
19
15
17
15
n
P 3.21
x S.
'
n
1.84
5.00
1.94
3.97
.40
2.84
4.89
7P 3.31
S.18
0.17
.88
.36
1.70
.39
(Urban)
n12
18
18
19
15
17
15
6.00
2.71
3.47
.13
2.93
.12
9.33
P 4.11
s5.63
2.63
1.63
.33
2.74
.47
9.64
(Mdul T)
12
17
15
815
17
15
-7.08
5.76
5.00
00
3.27
.13
1.00
P 4.12
X3.88
1.77
00
00
1.88
.48
00
S(Mdul PD)
n12
17
18
915
16
15
-4.67
1.71
3.47
00
2.47
.12
5.40
5.34
2.11
1.63
00
2.65
.47
7.76
P 6
S.21
12
17
15
815
17
15
"C Mdl T)
n.-
----
'
1.
7.08
2.65
5.00
00
2.07
.13
1.00
[
P 4.22
X3.88
.97
00
00
1.44
.48
00
(L
(11 PD)
S12
17
18
915
16
15
n
OVERAL
11..2
.31
1.31.255
.255
.373
.102
3.43
3.60
102 3.51
5.44
.343
99 3.32
3.03
.716
102 2.75
4.40
.280
99 2.33
2.7:
.72
102

VARIABLES
Auburn
SEEC
TRAINING PROGRAMS
Project
1070
Teacher
Teacher
Conven-
Researcher
Corps
tional
Turn
About
P 5.11
(:I) ':
lsx n
3-.33
22.,9
12
39.'6
1.59
1'
23.4;
8.52
15
22.75
15.16
8
"0.33
21.83
15
22.65
20.95
F
34.13
12.P9
15
P 5.12
(FLD
,S
4.S3
.55
12
31.53
.50
1/
9.0000
18
19. 8
29.08
9
90.0000
15
11.00
7.42
1)
48.00
00
15
72.42
2.00
1.47
1.50
4.40
1.41
2.13
P.
5.2''
s1.44
00
.62
1.00
1.45
1.33
.P1
(FLD 0)
n12
17
15
815
1:
15
71.42
1.59
1.93
2.38
2.00
1.18
1.-3
P'.11
s.;4
.91
1.12
1.41
.82
.7P
1.39
(L, -AL T)
n12
17
15
815
17
15
4.00
2.00
2,00
3.00
2.00
1.19
1.00
P 6.12
s00
00
00
00
00
.39
00
(LOCAL D)
n12
1;
18
915
16
15
1.25
.94
t
1.40
1.25
1.',7
1.12
1.0;
P '..21
.43
.42
.61
83
.70
.68
.25
'PAR"
s12
17
15
315
1'
li
1.00
00
2.00
1.00
3.
31.19
2.00
P 5.22
)00
00
00
.44
.39
00
(PA2
D1
si?
-
..-
1t.
915
L
15
15
1.33
6.',5
1.07
1.88
1.13
3.24
4 4:
P (.11
x3.32
10.82
1.73
3.4F
2.58
4.24
7.83
('To
S12
17
15
815
1;
15
OVERALL
35.2',
22.68
99
.51
3).35
28.39
.90;
102 2.21
1.44
.500
99
/
1.70
1.08
.1,5
99 2.05
.91
.9-3
102 1,23
.-2
.203
99 1.
5
.95
945
102 3.0236
152
99

VARIABLES
Auburn
SEEC
TRAINING PROGRAMS
Project
1070
Teacher
Teacher
Conven-
Researcher
Corps
tional
Turn
About
P F.12
(-'croD)
X S
2.00
00
12
.) .94
15
1.31
.F5
1)
12.00
00
1
................--...........
P 8.2
x S n
00
00
00
00
00 00
10
00
00
00
.44
1
1),
00
00
P 11.11::
(SupviN
S n
5.08
3.68
12
2.82
1.25
17
1.25
1.30
8
14."..7
13.12
15
4.88
3.60
17
13.0
18.09
15
P 11.12:
"SupvS)
S h
11
00
12
5.06
1.83
17
9.67
13.57
9
7.00
4.03
15
7.38
1.32
1)
40.0000
15
P 11.21
71.67
2.25
12
2.35
4.83
17
.63
1.65
8
2/ 20
43.37
15
10.00
13.30
17
11.
25.54
15
P 11.22*
x S n
1.24
1.39
17
P 11.31':
(Si pv (I)
x35.75
_
40./8
s n,
10.59
10.77
17
22.88
20.59
8
36.80
41.92
15
19.41
U.31.
1:
26.20
2-.01
15
__
P 11.32*
(Su" '''.1\
_a_
-2.00
x00
n12
'Projec: 10,0 exclLded (rem d.a a.
:hese varia les
OVERALL
2.30
4.11
102
.991
.0
.43
.19.
102 ..36
84 13.43
'4 9.74
84
.21
.73
102
24.51
24 2.35
5.44
102

VARL,BLES
Auburn
SEEC
TRAINING PROGRAMS
Project
1070
Teacher
Researcher
Teacher
Corps
Conven-
tional
Turn
---------------------
P 12.11
(' hoice)
S n - , '
3.92
1.38
12 4,92
1.2i
12
3.65
1.18
1' 4.53
1.50
17
3.8i
1.20
15
L3./5
1.49
8
3 38 .99
8 3. )3
1.32
8
3 4'
1.3;
15 4.73
1.06
15
2.53
1.58
1. 3.00
1.81
li
3.13
1.50
15 4.13
1.50
15
P 12.12
(Choice)
-7
4.38
4.76
4.40
3.75
4.i0
3.94
4.,i
P 12.13
.54
1.44
1.14
1.20
.88
1.83
1.19
Wloice)
12
17
15
815
1/
15
P 12.14
x4.83
5.12
4.67
5.13
4.53
4.12
4.93
(Choice)
S3.40
12
1.64
17
1.78
12
1.17
8
1.59
15
2.35
17
1.00
15
P 12.15
X2.75
2.65
3.33
3.63
3.33
2.88
3.80
(Choice)
S n
1.09
12
1.41
17
1.30
15
.86
8
1.07
15
1.84
1^
1.56
15
P /- 16
X4.20
4,14
4.03
3.90
4,13
3.29
4.13
'Choice)
S.69
12
1.20
17
.77
15
.35
8
.84
15
1.45
17
.82
15
.--
71.92
,_-__-
6.12
00
3.88
.20
5,18
5.93
P 13.1
s2.14
4.56
00
7.04
.75
7.96
9.80
(CT Exp)
n12
17
15
815
17
15
. -----
4.58
4,82
3.25
5.53
5.18
3.2/
P 14.11
s2,72
2 15
2.68
.62
1.98
2.98
12
17
,15
17
15
OVERALL
3.39
1.53
99
.146
4.12
92 4.42
1.32
.120
99 4.73
96 3,16
1.45
.13(-
99 3,96
99 3.41
6.33
.212
99

VARIABLES
Auburn
SEEC
TRAINING PROGRAMS
Project
Teacher
Teacher
Conven-
1070
Researcher
Corps
tional
Turn
About
P 14.12
x S n
2 33
15
12
2 59
185
17
2 75
2 49
8
2 73
68
15
2 24
14*,
17
2 6/
2 67
15
1..---..,
P 14.13
x S n
3 17
2 11
12
2 76,
180
17
2 63
2 55
8
3 93
1 48
15
2 94
1 86
17
2 2/
2 5/
15
P 14.14
x S n
3 42
2.40
12
153
1.14
17
2 50
2 12
8
3 20
1 83
15
3 12
1/8
17
2 27
2 54
15
P 14.15
(SchAtt)
n
13 50
8 20
12
11.71
5 31
17
11 13
93',
8
15 40
182
15
13 47
5 34
17
10 47
9 94
15
P 15.1
(Ind TT)
S
4.00
1.58
12
3.65
128
17
15
3.38
, R6
8
3.80
1.05
15
2.53
1.42
17
4.27
1.29
15
P 15.2
(Ind TT)
X S
5.00 00
12
4.00
00
17
4.00
00
18
4 0000
9
4.00
.00
15
4.50
1.12
li
6 0000
15
P 16.1
(1 Dal)
x S n
18.75
1.71
8
17.70
2.72
10
17.33
2.87
12
20.40
.80
5
16.81
2.53
7
14.20
2.86
5
16.71
2.25
14
P1 i.1
(Coop T)
x S
3.00
135
12
4.12
.96
17
000000
2.89
1.10
9
3.27
1.06
15
3.75
.83
16
4. t-,0
.71
15
OVERALL
1).?
3.44
1.37
99
.209
4.82
9'
102
.798
17 38
2.19
.321
61 3.60
1
1.76
.266
84
-

VARIABLES
Auburn
SEEC
TRAINING PROGRAMS
Project
1070
Teacher
Teacher
Conven-
tional
Researcher
Corps
Turn
Ab u
P 17.2
(Coop T)
s n
2.83
1.14
12
3.82
1.10
17
00
00 00
2.89
1.10
9
3.00
.97
15
3.75
.75
16
3.87
.81
15
5.83
7.94
00
5.78
6.27
7.50
8.47
P 17.3
s2.48
2.01
00
2.20
1.95
1.46
1.26
(Coop T)
n12
17
00
915
16
15
-(3.17
28.45
28.38
29.11
26.33
27.69
29.79
P 19.17
s1.52
3.60
1.05
2.61
3.61
3.88
2.11
(Att)
.12
II
16
19
12
16
14
10.1
12....
12.2
10.6
10.4
10.1
11.4
T 1.1
s7.18
1.95
2.05
2.82
2.95
2.26
2.87
(Prin R)
814
13
714
914
,i-
.26
.22
.17
.18
.35
.17
.27
T 2.12
s.15
.27
.17
.16
.06
.14
.27
(V Ind L)
r10
15
i6
810
13
13
T 2.13
X.20
.28
.12
.13
.05
.08
.32
(V Ind S)
,10
.17
.13
.20
.09
.09
.20
n10
10
qin
10
813
.33
.23
.18
.18
.10
.13
.20
T 2.14
x.27
.27
.19
.13
.08
.16
.18
(V Ind
1)
S n10
II
14
13
15
10
13
.28
-.20
.21
.23
.12
.13
.27
T 2.15
X.10
.14
.14
.17
.05
.09
.14
(V Ind E)
S12
18
18
20
i15
17
15
OVERALL\2
6.97
2.09
84
.230
28.46
2.75
.037
100 11.1
2.63
79
.19
.21
85
.18 8
.1
70
.19
.20
.186
86
.20
.14
.210
115

VAR.ABLES
S
TRAINING PROGRAM
Project
Teacher
Teacher
Conven-
Researcher
Cr
1
Turn
About
P 2.22
(D13ADv)
5 n
.17
.14
6
.11
.02
2
.20
00
1
.0400
2
.41
.27
P 2.23
(DISADv)
s n
.15
.15
8
.17
.14
5
.27
.16
12
.35
.25
4
.08
.09
9
.05
.06
5
.54
.11
9
P 2.24
(D1SADV)
s n
.19
.05
2
.24
.06
3
.31
.02
2
.14
.14
2
.18
.03
3
.07
.i
5
.57
.18
2
P 2.25
s
r
.9900
1
.8000
1
r
.33
.47
3
.16
.14
2
P 1.11 s
(RURL E)
P 3.12
(RURL ;)
X S n
P 3.13
(RURL P)
S
.7500
2
.80
00
1
P 3.14
(RURL 1)
S n
.06
.06
10
1
.39
.40
15
.03
.03
.87
.15
.36
.37
4
OVERALL
.21
.21
15 52
.24
.22
.638
.21
.17
19
.09
.28
23
.12
.26
9
.57
.33
4
.29
.39
.626
51

VARIABLES
Auburn
SEEC
TRAINING PROGRAMS
Project
Teacher
Teacher
1070
Researcher
Corps
Conven-
tional
Turn
About
2.1r
(V1
rid1
)
X S n
12
.2t)
.)
.19
.15
1,1
.21
.14
18
.22
.16
20
.17
.06
15
.1:,
.C9
17
.2u
.14
19
X.0
4.0
2,n
3.0
300
00.0
52.
22s
,04
.03
.05
.0:'
0000
.13
(X In
d1_
)n
101r
;1
Pon
0013
!' 2,
23s
.03
.03
00,0
1.0
400
,01
(XIn
d 5)
.04
.02
00.0
2.1
100
.01
n10
10no
In_
1000
1'1
X.1
2.0
5.0
2.0
300
00.
01T
2.2
4s
.30
.14
,04
.05
,01
.01
.02
(X In
dI)
1011
1413
1513
13
04.0
2.0
3.0
4,0
100
.02
T 2
,25
25s
.03
,02
.05
.07
.01
.01
.03
(X In
d E
n12
1.18
2015
115
.04
.02
.03
.04
,01
00.0
2
T 2
.2S
.03
.02
.04
,06
,01
.01
.03
(X
I,nd T)
n12
18..
2015
115
.34
I,3
3,4
2.4
9,2
9.3
1.5
9".
2.32
.22
.32
, 22
.24
,20
:21
.20
(ir L)
S10
158
10
13
13
X.4
4.3
6;5
1.3
4.3
3.3
4.4
41
2.33
.18
.21
.2F
,25
.21
.30
.2(V
Dir
S)
s n1.
09
101.
00
13
OVERALL
1)..2
.20
115
309
4
.02
.0'5
.02
.05 03 .12
86
.C2
.04
.0P
011
5
.02
.04
.26
115
.39
.25
FS
.40
.1
.25

VA
RIA
BLE
S
rS
EE
C
TR
AIN
ING
PR
OG
RA
MS
Pro
ject
Tea
cher
Tea
cher
Con
ven-
Res
earc
her
Cor
psti
on 1
Tur
nA
bout
i -
_ X S1
.
10
h'
I.
1
.. .
f
I
.. -.
..I,
. - . : 0
.t
...,
; 0
r_)
.2C
I-..
.,
...,
c)
?. ;:
..i
4..)
c.1
0.1
;.
! 4...
:0. U
:irE
)S
I.'I'
!20
1517
I"i
.?,9
.3:
:. 1
0,
.29
.11;
.27
,i,.1
4.
'0.
;1
.le
,.1
4.2
1.1
4: i
i1)
12I
",,
IS17
U
..1
4!
;.2
0.0
9.0
7.2
12.
?.1
124
.15
.15
.06
.V(
,it!
)s
101)
I'10
1313
T 2
.43
.
.I 2
. 0-
.10
.03
.07
.0'3
.14
(X D
ir',
.I
').0
7.1
0.0
'1i -
. 0.7
;.2
1
1010
910
101
..,
.,-,,,
,.0
^..0
5.0
4.0
_).0
-1.0
9T
2 .-
",':
.0;
.0'
.07
.0")
.9,
.09
(ni r
I)
sI0
i!
I1
1510
1.,
..
X.0
.07
.oq
.07
.07
.0)
.11
.-)
s.0
-;-,
.n.0
..,m
7.0
,,-,
,.0
1
4r-
,,"
!.-
.0.Y
. a.
.10
S0
I ,'
,,. 0
1,i
.05
..
1,
.,J
OV
ER
ALL
1
,C,
,
....
_
II
'-)
.17
.IC
J
..c
.
.I
-,.
1...
,
II
....,
,
,,,,
-....
.--
I r
,
.I
.3
,3 -it,
.J .':),
. 0/
...
.;

VARIABLES
Auburn
SEEC
TRAINING PROGRAMS
Project
1070
Teacher
Teacher
Conven-
Researc__her
Corps
tional
Turn
About
T 2
,52
(Pup
L)
i S n10
.35
.1:"
,.4
1,.2)
15.4
4.3
010
,24
,21
-,
.23
.22
9
S:1
10
.2',
.14
,35
,30
.70
1.14
in.1
"),1
710
.30
.17
1145
8
i1 13
,25
.19
.28
.21
,.....
.....1
T 2
,53
(Pup
S)
s n10
.44
.20
T 2
.54
(Pup
I)
L )7 S n10
.39
.2!
.39
.35
11
.25
.19
1413
.25
.2r
..31
.22
15
.41
.33
1013
,21
.1P
T 2
.55
(Pup
E)
S
12
.45
.13
.40
.21
___LB
.37
.20
18
..,.....11,
.. 23 .10
.22
.10
18
-20 20
.35 2' .33
.25
,39
,35
,22
.19
_15
ru
.38
.32
.23
.20
1517
15 15
.29
.15
.28
.15
---
T 2
.56
(Pup
T)
- S12
.44
.11
.T
2 6
2(X
Pup
1..)
x S n10
.04
.05
,03
.04
15
.03
.06
168
.01
.02
.09
.05
.08
.10
1013
13
.01
,01
T 2
..:3
(X P
up S
)
x s n10
.07
.10
.05
.11
10
.02
.04
910
.13
.17
,01
.04
.02
.06
10P
13
.01
.02
T 2
_.-.
4(X
Pup
I)
- x s n10
.03
.04
.01
.02
11
.02
.0"
14
13
.02'
0202
.04
.03
1510
13
.01
.03
OVERALL
.k2
,35 .4.',
.30
.25
70
.31
.27
8r
.35
.20
.132
15
.33
,20
,152
115
,04
.07
R5
.05
.10
70
02 04
P--
1

VARIABLES
rSEC
TRAINING PROGRAM S
Project
Teacher
Teacher
Conven-
Researcher
do
Turn
About
T 2
,65
(X P
up E
)
X.0
5.0
312
.04
.07
18
.03
,04
18
,OS
.13
20
.04
.05
15
.05
.0:'s
:
11
.01
.02
15
T 2
.6;*
(X P
up T
)
X S n
.05
,04
12
.03
,07
IP
.03
.04
18
,08
,13
20
.04
.05
15
.04
.06
17
,01
.02
15
T2-
173
L)
C:
- X S
.06
.06
10
'.2
7.2
715
,07
.09
16
,07
.13
8 J
,12
.10
10
.22
.20
13
.06
,07
13
T 2
.73
(VIn
f.S
)
X S n
.02
.03
10
.13
.23
10
,01 02
9
,14
,17
10
,06
,12
10
.09
.11
8
.04
.06
13
[72.
74(V
1nf
I)
)7 n
JO 15ir
)
.03
,03
11
,02
.05
14 .
07 .07
18
,11
,09
,15
.13
0
.09
,10
,13
.11
15
.01
.02
s
,18
.20
.
17
.04
.08
13
.07
.07
15
T 2
.75
(VIn
f. E
)X S n
.06
,05
12
.21
,26
18
T 2
,76
(VIn
f. T
)
X S
.06
.05
12
.18
.22
18
. 07
.07
18
.15
.13
20
.13
.10
13
,17
.19
17
.07
.06
15
X S
.53
.27
12
.55
.34
18
.50
.37
18
.79 33
20
.73
.22
15
,45
.37
17
.68
.26
15'I'
3.1
.< S
1-:
i /1-
)
OVERALL
112
,04
0711
5.0
34.
.04
01.0
2011
5
,13
,18
85
.0/
.14
85
.05
,09
85
.13
.16
,15-
;11
5
,13
-.1
5.2
1111
5
.62
.34
.1')7
115
-.

VA
RIA
BLE
S
Aub
urn
SE
EC
TR
AIN
ING
PR
OG
RA
MS
Project
Teacher
Teacher
Conven-
1070
Researcher
Corps
tional
Turn
Abo
ut
T 3
.2(L
IT)
s n
,37
,27
12
.41
.32
18la
.49
.37
20
.19
.33
.25
.24
151/
,55
.37
.32
.26
15
T 3
.3(i
/T)
X s n
,35
,21
12
.25
.27
1818
.12
.16
20
,30
.42
.13
.17
1517
.17
.24
.37
.28
15
T 3
.4(S
/T)
SS n
.27
.21
12
.30
.35
1818
413
,33
20
.49
,43
.60
.25
1517
.27
.37
.31
.21
15
T 4
.11
(H C
og Q
)X ' n
.45
,17
12
.51
.32
1818
.62
.25
70
,51
.33
.57
,19
1517
.54
.39
.46
.20
15
4,...
...L
.
T 4
.12
(H C
oq Q
s
,23
.08
12
.22
.19
1818
.24
.13
20
,23
,27
.23
.14
1517
..--
.23
,20
.18
.10
15
T 4
.21
(CogQ)
X s
,11
,10
12
.10
.10
1818
.14
.14
70
.05
.20
.23
.19
1517
.17
.23
.09
.12
15
T 1
.22
( C
o gQ
)x s
.07
.07
, 2
,04
.06
1818
.05
.06
20
.04
.17
.11
.11
1517
.07
.12
.04
.06
15
T 4
.31
(Que
s)s n
,45
'09
12
.32
.18
1818
.40
.16
20
,44
.26
.39
.22
1517
.33
.14
. 30
.14
15
)12
OV
tP.A
.LL
115
.37
.34
.1/4
,24
,29
.166
115
,3F
.34
.119
115
.52
.29
,094
115
.22
;18
.077
115
.13 17
.112
115
.06
.11
.148
115
,37 ,19
,119
115

VARIABLES
Auburn
SEEC
TRAINING PROGRAMS
Project
1070
Teacher
Teacher
Conven-
Researcher
Corps
ti onal
Turn
Abou
T 4
.41
(Pro
c)
7 s n
.51
.13
12
.62
,19
18
.63
,21
18
.58
.26
20
.64
.16
15
.68
,14
17
.69
,14
15
T 4
.43
(Pro
c)
V s n
.27
.15
12
,18
.19
18
,26
.22
18
.33
I
.26
20
.27
.15
15
.18
.19
17
.28
,1F
15
T 5
.1(Atten)
S n
2.84 ,1
412
2.69 ,2
818
2.86 15
18
2.75 ,2
520
2,63 .2
515
2.54 ,2
417
2.17 .2
015
T 5
.2X
C. A
t ten
' n
2.97 .1
812
4
2.81 .2
318
2,98 ,1
218
2,89 .3
020
2,78 .2
315
2,,6
9,2
617
2.93 .2
915
-.1
X
T 6
.1S
(Inc
lvT
)n
2,42 .5
712
2.50
1.03
18
2.50 .7
418
2,06
2,74
.80
,A2
2015
3.22
3,19 ,7
418
15
2,29 ,6
917
3,36
1.09
17
2.40 .9
715
3.29 .7
115
r7.
1(M
gmt)
4.14 .7
412
3,06
1.02
18
3.50
1.11
18
T 7
,2s
(Dul
l)n
4.71
.90
12
4.18 .8
418
4 .5
91
1818
3.85
4,36 .7
917
15
3.97
1.06
17
4.14 .8
415
7T
7.3
s(S
stm
)n
4 .9
7.7
612
4.36 .9
018
4.54
1.10
18
4.39
4.44 96
1715
3.98 .9
717
4.25 .6
715
OVERALL
.)'..
2
.62 .19
115
.082
,25
.21.
.142
115 2
,72
,25
.232
115
1.
2 .F
f'.2
6.1
9411
5 2 .4
0.8
2.0
9711
5 3.3/
113 4.
21-
112 4.
30
112

VARIABLES
Auburn
SEEC
TRAINING PROGRAMS
Project
Teacher
Teacher
Conven-
10 0
Researcher
COr s
tional
Turn
About
.
17.4
(Harsh)
X S n
4.92
.98
12
4.49
.gd
18
4.79
1.01
18
4.27
17
4.57
.87
15
4.15
.96
17
4.20
1.14
15
110.1
(Comm 7)
x S n
12.50
1.31
8
13.10
1.91
10
13.92
.29
12
13.10
.55
5
11.57
1.99
7
11.60
5.51
5
13.86
1.29
14
T 11.1
(TSRT)
X s n
110.38
3.50
8
119.90
25.84
10
106.92
4.56
12
108.80
6.05
5
108.57
6.40
7.
125.80
34.46
5
!?4.29
25.44
14
P 19.27
(ATTP2)
S n
41.25
4.23
8
38.0
11.63
10
40.92
4.34
12
37.20
3.12
5
38.86
4.06
7
.30.60
11.61
5
35.64
12;.79
14
S S n S
,
S n
OVERALL
)1.2
4.47
112
1-.D.08
2.06
.176
61
115.3?
19.72
.148
6I 37.89
1
8.45
.1?7
61

APPENDIX B2
INTERCORRELATIONS OF 62 VARIABLES
The variables for the correlation matrix are indicated only by sequential
number on the following pages. The code and acronyms of the variable are
keyed with its number in the matrix below.
1 - T1.1 (PrinR) 22 - P17.3 (CoopT) 43 E2.0 (Sex)
2 P3.16 (Rurl) 23 P19.17 (ATT) 44 - E3.1 (GPA-G)
3 - P1.1 (GrLv1) 24 P2.25 (Disadv) 45 E4.1 (Grad)
4 P2.12 (AmInd) 25 T2.16 (VIndT) 46 - E5.3 (Rec)
5 P2.14 (ginrty) 26 T2.26 (XIndT) 47 E5.4 (Therap)
6 P4.11 (MdulT) 27 - T2.36 (VDirT) 48 E5.5 (CompEx)
7 P4.12 (,IdulPD) 28 T2.46 (XDirT) 49 - E6.1 (FOup)
8 P5.2 (FIdQ) 29 T2.56 (PupE) 50 E6.2 (MothEd)
9 P6.11 (LocalT) 30 - T2.66 (PupT) 51 E8.1 (TA)
10 P6.12 (LocalD) 31 T2.76 (VInfT) 52 - E9.1 (Pol-Ec)
11 P6.21 (ParnT) 32 T3.1 (S +i /T) 53 E10.1 (SRS)
12 P6.22 (ParnD) 33 T3.4 (S/T) 54 E11.1 (SDogm)
13 P8.11 (McroT) 34 T4.12 (11CogQ) 55 E12.1 (Clusl)
14 P8.12 (MrroD) 35 T4.22 (CogQ) 56 E13.1 (Clus2)
15 P11.11 (SupvT) 36 T4.41 (Proc) 57 E14.1 (Clus3)
16 P11..12 (SupvS) 37 T4.43 (Proc) 58 E15.1 (Clus4)
17 P12.15 (Choice) 38 T5.1 (Atten) 59 E16.11 (AthAc)
18 P12.16 (Choice) 39 T6.1 (Indol) 60 E16.51 (Mils)
19 P13.1 (CTExp) 40 T7.2 (Dull) 61 E16.01 (Act)
20 P15.1 (IndTT) 41 T7.3 (System) 62 E17.0 (AGE)
21 P15.2 (IndTT) 42 T7.4 (Harsh)
95

17
34
56
76
910
1112
11.000
2-C.C10
1.000
3-0.190
C.C50
1.000
40.090
0.110
0.040
1.000
50.210
-0.010
0.010
0.610
1.000
6C.14C
-C.C50
-0.480
0.010
-0.060
1.000
70.300
C.070
-C.25C
-0.170
0.100
0.170
1.000
8-0.020
0.300
-0.040
0.130
0.130
0.150
0.160
1.000
90.070
0.050
0.020
0.160
0.100
-0.010
-0.
--0.140
1.000
IC
-0.040
C.010
-0.07C
-0.120
-0.120
0.090
0.530
0.310.
-0.060
1.000
11
-0.010
0.270
-0.090
0.140
0.010
-0.040
0.050
0.120
0.500
0.040
1.000
1?
-0.
0.600
-0.150
0.280
0.090
0.120
0.010
0.630
0.100
-0.
0.310
1.000
1:
C.070
-c.180
-0.110
-0.050
0.060
0.170
0.040
0.010
-0.040
-0.070
0.010
-0.120
14
0.010
-C.220
-0.400
0.060
-0.100
C.470
-0.230
0.070
-0.050
-0.210
-0.100
0.130
15
-0.100
0.170
-0.130
-0.030
-0.070
0.220
-0.050
0.300
-0.010
-0.050
0.210
0.390
16
-C.09C
-C.260
-0.260
0.020
-0:150
0.400
-0.300
0.030
0.030
-0.230
-0.070
0.040
17
0.070
C.040
-0.09C
0.100
0.040
0.210
-0.110
-0.030
0.260
-0.110
0.240
0.ono
18
0.260
0.090
-0.160
0.050
0.040
0.220
0.280
0.080
0.160
0.100
0.180
0.01.0
19
0.180
-0.200
0.100
0.020
-0.
0.020
-0.060
-0.130
-0.110
-0.140
-0.210
-0.200
20
0.310
0.110
-0.24C
0.090
0.060
0.300
0.280
0.110
0.020
0.100
0.060
0.080
21
0.140
-0.100
-0.230
-0.210
'
0.020
0.300
0.300
0.340
-0.230
0.440
-0.190
0.089
22
0.020
-0.250
0.210
-0.110
0.050
0.190
-0.160
0.150
-0.130
-0.180
-0.270
-0.170
23
C.100
-C.170
0.030
0.070
-0.180
0.030
-0.060
-0.150
0.060
-0.
0.040
-0.170
24
0.1(0
-0.100
-0.290
0.220
C.200
0.210
0.020
0.040
0.090
0.020
-0.040
0.040
2'3
-0.010
-0.320
-0.350
-0.010
-0.060
0.240
0.090
-0.110
0.080
-0.020
-0.080
-0.140
26
C.07C
-C.210
-0.130
0.030
-0.030
0.030
0.080
-0.160
0.
0.030
0.030
-0.140
27
0.070
-C.040
-C.38C
0.130
0.040
0.240
-0.020
-0.020
-0.020
-0.070
-0.050
-0.030
28
0.
-0.080
-0.170
0.030
-0.070
0.210
-0.010
-0.060
-0.050
-0.070
-0.080
-0.030
29
-C.. 12C
-C.080
0.
-0.100
-0.020
-0.030
0.130
0.
-0.050
.0.070
0.010
-0.120
30
-0.100
-C.050
0.16C
-0.070
-0.110
-0.090
-0.070
-0.110
-0.010
-0.140
-0.070
-0.030
31
0.010
-0.0,0
0.550
-0.150
-0.04C
.-0.240
-0.130
-0.100
-0.040
-0.150
-0.100
-0.170
32
-0.080
0.110
0.020
0.270
0.210
0.040
-0.
0.040
0.030
-0.130
0.050
0.090

12
34
56
78
910
33
-C.010
C.230
-C.010
0.280
0.280
-0.060
0.010
0.190
0.030
0.020
34
-0.150
0.010
-0.090,
-0.100
-0.130
-0.020
0.040
-0.110
0.100
-0.010
35
-0.200
0.030
0.010
-0.080
-0.120
0.030
0.030
0.060
-0.070
....0.
36
C.060
C.050
0.100
0.020
0.030
0.020
-0.170
0.080
-0.080
-0.090
37
-0.010
C.C40
-0.060
0.200
C.C90
-C.
0.060
-0.030
-0.
-0.140
3J3
0.700
-0.110
-0.320
0.020
-0.020
0.190
0.210
-0.090
-0.020
0.140
39
C.08C
C. 170
-0.190
0.080
0.160
0.230
0.170'
0.180
-0.010
0.070
40
0.150
-C.040
-0.24C
0.040
0.030
0.110
0.220
0.090
-0.150
0.110
41
0.190
-0.140
-0.220
O.
-0.010
0.080
0.200
0.080
-0.060
0.080
42
0.120
0.040
-0.140
-0.020
0.010
0.090
0.250
0.020
-0.,140
0.130
43
0.070
-C.100
-C.390
-0.070
0.060
0.200
0.020
-0.080
0.060
-0.050
44
0.050
0.050
-0.100
-0.040
-C.C50
0.090
-0.090
0.040
0.030
-0.010
45
0.030
0.490
-0.220
0.090
-0.110
0.090
0.490
0.320
0.060
0.490
46
-C.C50
-C.130
0.120
-0.060
-0.020
O.
0.050
0.120
-0.200
0.260
47
-0.210
C.100
-0.070
-0.020
-0.070
0.160
-0.020
0.150
-0.140
0.090
44
O.
-0.210
-0.110
-0.130
-0.010
0.130
0.000
-0.040
-0.050
0.080
49
0.291j
-C.060
-0.110
-0.120
0.020
0.130
0.100
-0.040
-0.120
-0.060
50
-0.050
-C.180
0.05C
-0.170
-0.140
-0.020
0.010
-0.160
0.010
0.170
51
0.140
-0.120
-0.000
-0.080
-0.160
-0.020
-0.120
-0.220
0.010
-0.280
52
0.040
C.130
0.040
0.030
.0.070
-0.130
0.030
0.030
0.020
0.050
53
0.090
C.120
-0.060
0.030
'
0.050
0.100
0.040
0.160
0.160
-0.060
54
-0.070
0.020
0.050
-0.040
0.020
-0.150
-0.210
-0.210
0.040
-0.120
55
0.170
-0.180
-0.070
-0.140
-0.100
-0.060
-0.030
-0.230
0.130
-0.190
5A
0.190
-0.030
0.130
-0.090
0.050
0.030
-0.100___0.0 l0
5r
_C.07C
0.030
_C.120
0.170
0.010
-0.060
0.0/C
-0.020
0.020
0.120
0.020
-0.1.50
50
-0.020
-0.030
0.050
0.030
0.010
-.0.080
-0.170
-0.180
0.070
. -0.110
5S
0.040
C.010
-0.030
0.060
-0.030
0.140
-0.090
0.010
0.290
-0.010
60
-0.060
0.070
0.06C
-0.080
0.010
-0.080
0.070
0.090
-0.120
0.160
61
-0.010
0.030
-0.050
-0.160
0.120
-0.090
0.010
0.010
-0.090
0.040
62
-0.010
C.190
-0.190
-0.040
-0.150
-0.050
0.170
0.040
-0.080
0.150
11
12
0.060
0.250
0.060
-0.040
0.010
0.070
-0.070
0.120
-0.040
0.000
0.060
O.
-0.060
0.210
-0.160
0.090
-0.130
0.010
-0.160
0.000
0.040
-0.020
-0.030
-0.040
0.250
0.520
-0.160
-0.140
0.010
0.020
-0.060
-0.180
-0.100
-0.070
0.010
-0.330
-0.050
-0.090
O.
0.010
0.200
0.120
0.010
-0.020
0.040
-0.200
-n.zoo
-0.060
-0.030
0.120
-0.020
-0.010
-0.010
0.090
-0.060
0.0130
-0.110
-0.180
0.070
0.130

wa-o
ow()
081 '0-
deo-o-
osvo
otos()
0E0'0-
OZO'0
050'0
0/0'3
031'0-
RE
0E0'0-
010'0
OZ0"0
09Z°0-
080'0
060'0-
010'0-
'0
0470'0
091'0-
050°0
010°0-
Lcen-o
090'0-
"0
04;1'0
010'0-
011'0-
090'0-
OZO°O
010'0
060'0
011'0
010'0-
9E
090'0
010'0
050'0
080'0
001'0-
0S0*0-
0£0'0e
011'0-
090'0-
Ol0"0
090'3-
010'3
SC
04)0'0-
0,0'0-
010'0-
021'0-
080'0-
060'0
010'0
0/0°0-
010'0
090'0-
001'0-
090'0
hE
C2G*0
061'0-
001'0-
001'0-
0E0'0
061'0-
010'0
051'0
060'0-
090'0
011'0-
011'0-
Et
001°0
0E060-
050'0
0E2°0-
001'0
001°0-
060°0
OZ1'0
001'0
0E0'0-
090'0
060'0-
CE
011'0-
01.0'0
0E1°0
0/0'0-
061'0-
0/1°0
U91'0-
OL1"0-
USI'0-
0E0'0-
051'0-
011°0-
li
CS2'0-
011'0
050'0
02E*0-
001'0-
090'0-
0Z1"0-
060'0-
060°0-
011'0-
091'0-
0E1°0
OE
011'0-
060'0
021'0
001'0-
OL0'0
091'0-
OZO'0-
010'0-,
090'0-
3E0°0-
090'3-
06Z*0
be
050'0
090'0-
'0
04/0'0
OLZ'O
OL0'0
0E160
0L0°0
0471'0
091°0
051'0
011°3
9Z
081'0
09060-
0/0'0-
050'0
OS1°0
001°0
0/0'0
010°0
°EV0
090°0
092'0
OL1'0
Le
020'0
080°0
001'0-
0E1'0-
0,71'0
050'0-
OZO'0
0E0°0
0E0'0-
°U-
0/0'3-
Oil'O
9e
001'0
00/'0
oeo.o
090'0-
0E0'0
0E0'0
010'0
04,0'0
061'0
OLO*0-
061'3
051'3
5Z
000'1
0471'0
0E0°0
0,7E"0
0Z1°0
090'0
001'0
011'0
0h,7°0
090'0
025'0
090'0-
oa
000'1
010°0-
OSO*0-
020'0
021'0
061'0
011'0
04,1'0
001'0-
011'0
0E0'0
EZ
000°1
OZ2°0
090'0
OZ1°0
0,71'0-
090'0-
004,'0
3EZ°3
09E'0
02Z'3
ZZ
000'1
011°0
090'0
0,70'0
04,0°0-
00E°0
051°0
06E60
051'0
IZ
000'1
091'0-
094,°0
091'0
011'0
091'0
00'0
001'0
OZ
000'1
060'0-
061'0-
OL1'0
30Z'0-
0E1'3
080'0-
61
000'1
029°0
0E0'0-
0L0°0
OZO°0-
050'3
RI
000'1
011.0
051'0
OZ1'0
011'0-
LI
000'1
OLZ'O
006'0
080'0
91
000'1
OZE'D
050'0-
51
003'1
063"3
'il
000'1
El
./Z
EZ
ZZ
TZ
OZ
61
81
LI
91
GI
'71
El

13
14
15
16
17
UR
19
-20
21
22
23
24
39
0.160
C.040
C.12C
0.020
C.15C
C.130
-0.130
0,1060
0.160
0.
- 0.19()
0.080
40
-0.130
-0.020
-0.170
-0.100
-0.100
0.040
-0.040
0.150
0.010
-0.090
-0.070
'-0.
41
-C.13C
-C.040
-0.120
-0.090
-0.110
-0.020
-.0.030
0.110
-0.120
-0.030
-0.050
-0.010
42
-0.020
-C.070
-0.23C
-0.120
-0.160
-0.030
-0.040
0.140
-0.
'
-0.040
-0.070
-0.050
43
0.0TO
0.110
-0.010
0.040
C.II0
C.040
-0.140
-0.010
0.040
-0.110
-0.100
0.160
44
0.020
-0.020
0.060
-0.040
-0.020
-0.050
-0.030
0.060
-0.130
-0.030
-0.020
-0.
45
-C.25C
-C.290
C.03C
-0.37C
-0.040
0.160
-0.240
0.140
-0.030
-0.530
-0.020
-0.110
46
-0.040
-0.060
-0.020
-0.050
-0.110
-0.090
-0.110
0.030
0.080
0.190
..-0.040
-0.100
47
-0.090
0.100
0.220
0.080
0.090
0.030
-0.150
0.010
0.070
0.1?0
.-0.060
-0.050
48
C.010
C.170
0.050
0.160
0.070
0.060
-0.070
0.050
0.160
0.1,10
0.050
0.020
's9
0.050
C.100
C.06C
-0.
C.C50
0.040
-0.010
0.060
0.210
0.C30
-0.020
0.11U
50
-0.030
-0.060
-0.090
-0.030
-0.
-0.080
0.020
-0.050
-0.100
0.080
0.020
-0.213
51
-C.01C
C.300
-0.070
0.210
0.110
0.030
0.010
0.020
0.050
0.030
0.160
0.190
52
0.020
-0.210
-0.16C
-0.180
0.
0.090
-0.150
0.030
-0.150
.-0.140
0.010
-0.120
53
-0.110
-0.020
0.330
-0.010
0.220
0.170
-0.150
0.080
-0.050
0.120
-0.080
-0.089
54
-0.020
0.140
-0.010
0.120.
0.110
-0.060
-0.060
-0.140
-0.040
-0.040
0.010
0.090
55
0.060
C.240
C.01C
0.190
0.180
0.150
-0.060
0.080
-0.020
0.090
0.250
0.140
56
-0.020
-0.300
-0.130
-0.280
-0.C40
0.020
-0.170
0.040
-0.060
-0.110
-0.020
-0.173
57
0.010
0.040
0.130
0.
0.06
0-0
.-0.080
-0.050
0.050
0.270
-0.1
30-.-0.080
58
-0.0
20C.140
-0.1
800.150
0.050
-0.050
0.010
-0.110
-0.010
0.030
0.020
0.060
59
-0.080
C.270
0.020
0.280
0.170
0.020
-0.080
-0.090
0.110
0.120
0.010
0.130
60
-0.040
0.010
0.040
0.050
0.130
0.100
-0.030
0.060
0.180
0.050
-0.
0.010
61
0.130
-C.040
0.080
-0.050
-0.010
-0.110
-0.080
0.060
0.130
0.140
-0.210
0.
62
-0.130
C.080
0.140
-0.020
-0.090
0.020
-0.
0.130
0.040
0.130
0.150
0.150

25
25 1.00
0
2627
2829
3031
3233
3435
36
?60.
400
1.00
02
l0.
260
0.06
01.
000
28C
. OIC
-C.C
800.
540
1.00
029
0.20
0C
.100
c. 1
10-0
.020
1.00
030
0.20
00.
050
0.09
00.
070
0.56
01.
000
31-0
.230
-0.1
30-0
.510
-0.2
30-0
.060
0.13
01.
000
3?-C
. 06C
-C.1
80O
. 230
O. 0
200.
150
0.07
0-0
.230
1.00
033
-0.2
10-0
.050
0.03
0-0
.010
-0.1
10-0
.220
-0.2
600.
640
1.00
034
0.06
0-0
.080
-0.0
60-0
.090
-0.0
300.
260
-0.C
80-0
.020
-0.1
501.
000
35-C
.050
-C.1
30-0
.060
0.02
0.0.
150
0.36
00.
070
-0.0
50-0
.1'1
00.
550
1.00
036
-0.2
40-C
.' 0
-C. 0
2C0.
090
-0.0
70-0
.250
0.10
0-0
.110
0.03
0-0
.670
-0.3
701.
000
370.
010
-0.'
' 00.
100
-0.1
300.
140
0.29
0-0
. 140
0.63
00.
320
0.33
00.
160
-0.4
5038
C. 2
5CC
100.
160
0.03
0-0
.050
-0.1
00-0
.100
0.13
00.
030
-0.0
70-0
.080
0.04
039
0.06
0-C
.040
C.2
10O
. 080
0.14
00.
110
-0.3
600.
300
0.39
00.
010
-0.1
1.0
0.01
040
0.21
00.
120
-0.
-0.0
500.
160
0.23
00.
050
-0. J
30-0
.11
00.
060
0.21
0-0
.173
410.
310
0.23
0-0
.03)
- -0
.120
0.15
00.
140
0.07
00.
060
0.04
0-0
. 040
O. 0
400.
110
42C
.250
-C.0
60C
.-0
.090
0.13
00.
200
0.08
00.
160
0.02
00.
080
0.03
0-0
.240
430.
180
0.05
00.
270
0.07
0-0
.1C
0-C
.080
-0.3
00-0
.010
0.02
0-0
.030
-0.1
10-0
.053
440.
060
-0.0
400.
210
0.18
0-0
.0.
070
-0.0
100.
060
0.07
0-0
.030
-0.0
100.
o045
C. 0
7C
.C
. C60
-0.0
3 0
-0.0
200.
020
0.11
0-0
.180
-0.0
100.
090
0.07
00.
100
-C. 0
9046
-0.0
60-C
C40
-C.1
3C-0
.090
C. 1
900.
070
0.05
00.
050
0.04
0-0
.070
-0.0
200.
020
470.
010
0.02
00.
090
0.02
00.
080
0.11
0-0
4 08
0-0
.030
-0.0
700.
060
0.08
00.
010
48C
.040
C.0
400.
060
-0.0
400.
150
0.04
0-.
0.10
0-0
.*-
0.09
0-0
.020
-0.0
600.
030
490.
120
-C.0
10C
.050
-0.0
500.
0.01
00.
110
0.03
00.
040
-0.0
60-0
.120
0.02
050
-0.0
100.
050
0.03
0-0
.010
-0.0
10-0
.030
-0.0
10-0
.200
-0.1
30-0
.060
0.02
0-0
.050
51-0
.100
-0.0
900.
110
0.06
0-0
.210
-0.1
20-0
.040
-0.
-0.0
400.
010
0.02
00.
020
52-C
C40
C.
-C. 1
0C-0
.040
0.10
00.
050
0.08
00.
090
0.06
0-0
.040
0.0.
060
53-0
.190
-0.1
600.
040
0.15
0-0
.070
0.11
00.
010
-0.0
700.
.010
-0.0
400.
050
-0.0
5354
-0.0
300.
050
0.10
0-0
.070
0.03
0-0
.020
0.11
00.
040
-0.0
10-0
.150
-0. 0
900.
130
550.
090
C.0
400.
070
0.08
0-0
.01
00-
030
-0.0
20-0
.140
-0.2
50-0
.030
-0. 0
30-0
.020
56-0
.230
-C.1
70-0
.140
-0.0
10-0
.C1C
0.03
00.
230
0.13
00.
160
-0.0
600.
050
0110
57-0
.190
-0.2
400.
090
0.05
0-0
.040
0.05
0O
. 090
0.06
00.
060
-0.0
900.
020
0.06
058
-C. 1
10C
.050
0.11
0-0
.050
0.06
0-0
.010
0.08
00.
120
0.03
0.-0
.120
-0.0
200.
140
59-0
.020
-C.0
30-0
.050
-0.0
800.
01 0
-0.0
600.
030
0.09
00.
070
-0.0
50-0
.110
0.08
060
-0.1
000.
020
-0.1
10-0
.050
0.12
0-0
.--
.0.
-0.0
800.
020
-.0.
060
0.01
0-0
.010
61-0
.060
0.0.
050
0.05
00.
110
-0.0
60.-0
.030
-0.0
500.
060
....0
.130
-0.0
900.
080
620.
050
C. 1
00C
.090
0.10
0-0
.060
0.06
0-.
0.12
0-.
0.07
0-0
.060
-0.0
70-0
.070
0.08
0
t-+ 0 0

WIN
IN
37
37
1.000
38
39
40
41
42
43
44
45
46
47
48
38
0.070
1.000
39
0.100
-0.010
1.000
4C
0.200
0.200
0.070
1.000
41
C.15C
0.300
0.060
0.780
1.000
42
0.320
C. 180
0.140
0.700
0.630
1.000
43
0.060
0.170
0.190
0.080
0.130
0.180
1.000
44
-0.070
0.030
0.
-0.150
-0.040
-0.050
0.250
1,000
45
0.080
C.150
C.15C
0:300
0.220
0.280
-0.010
-0.
1.000
46
0.090
0.0/0
0.060
0.200
0.130
0.250
o.iro.-o.o5o
0.020
1.000
47
0.010
-0.100
0.060
0.090
0.070
0.050
0.150
0.060
0.120
0.090
1.000
4e
C.010
C.040
0.100
0.030.
0.140
0.110
0.460
0.050
-0.090
0.510
0.510
1.000
49
0.020
-C.030
0.290
0.010
0.040
0.080
0.110
0.150
-0.040
-0.120
-0.110
-0.020
50
-0.140
-0.070
-0.190
-0.050
0.040
0.030
0.040
0.030
-0.080
0.250
0.060
0.170
51
C.120
-C.020
-0.060
-0.200
-0.130
-0.110
0.140
-0.010
-0.180
-0.160
-0.010
0.050
5?
0.040
C.070
0.01C
0..270
0.220
0.180
-0.110
0.080
0.080
-0.010
-0.130
-0.140
53
-0.050
-0.060
0.090
-0.060
0.
-0.030
0.150
0.150
0.080
0.060
0.150
0.060
54
-0.010
C.110
-0.060
-0.060
-0.040
-0.060
0.040
-0.090
-0.120
-0.170
-0.060
-0.060
55
-0.010
-C.010
-0.16C
-0.150
-0.080
-0.100
0.190
0.090
-0.150
-0.150
-0.020
0.140
56
0.0 TO
0.030
0.060
0.090
0.110
0.120
-0.190
0.110
0.020
0.000
-0.080
-0.210
Si
0.050
0.040
0.100
-0.030
0.050
0.040
0.110
-0.050
-0.080
-0.020
0.070
0.020
58
C.1CC
C.070
-C.05C
-0.010
-0.020
-0.020
-0.070
-0.070
-0.150
-0.150
-0.050
-0.070
59
0.030
-0.020
0.160
-0.060
-0.020
0.010
0.020
-0.110
-0.030
0 090
-0.010
0.180
60
-0.140
-0.040
0.090
0.100
-0.020
0.100
-0.160
-0.120
0.100
-0.020
0.100
0.100
61
-C.110
-C.030
0.060
-0.100
-..0.120
- 0.120.
0.040
0.020
-0.080
0.090
0.110
-0.030
6?
-0.060
C.030
-0.060
-0.070
-0.
-0.010
-0.040
0.060
0.410
-0.110
0.260
-0.050
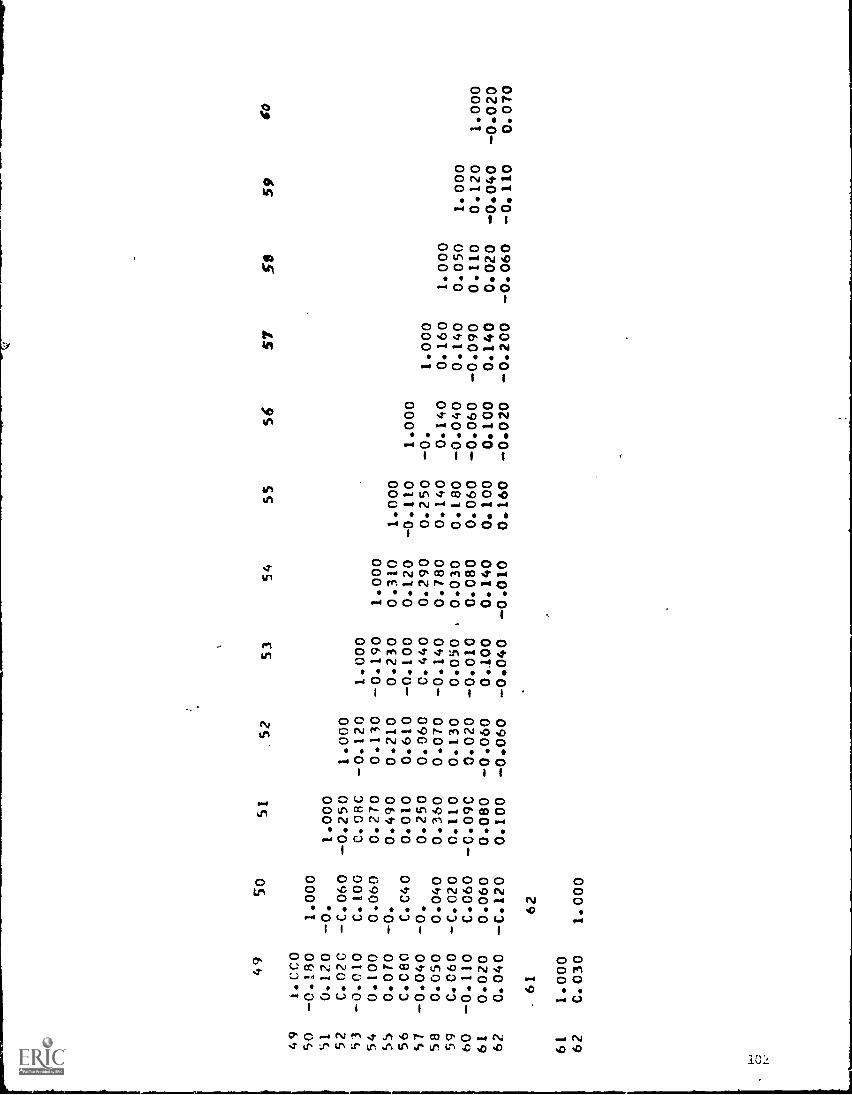
49
50
51
.52
53
54
55
56
57
59
59
049
I.CCO
50
-0.180
1.000
51
0.120
-0.
1.000
52
C.020
-C.060
-0.250
1.000
53
-0.010
C.100
C.08C
-0.120
1.000
54
0.100
0.060
0.270
0.130
-0.190
1.000
55
0.070
-0.
0.490
0.210
0.230
0.310
1.000
56
C.080
C.C40
0.010
0.610
-0.100
0.120
-0.110
1.000
57
-0.040
-0.
0.250
0.060
C.440
0.290
0.250
-0.
1.000
58
0.050
0.040
0.360
0.070
-0.140
0.780
0.140
0.140
0.160
1.000
59
C.C60
-C.020
0.110
0.130
0.050
,0.030
0.180
-0.040
0.140
0.050
1.000
60
-0.110
C.060
-C.09C
0.020
-0.010
0.080
0.060
-0.060
-0.090
0.110
0.120
1.000
61
0.020
0.060
0.080
-0.060
0.100
0.140
0.100
0.100
0.140
0.020
-.0.040
-0.020
62
0.040
-C.120
0.100
-0.060
-0.040
-0.010
0.160
-0.020
-0.200
-0.060
-0.110
0.070
.61
62
61
1.000
62
C.030
1.000

APPENDIX C
FORMS AND INSTRUMENTS USED IN THE STUDY
The questionnaires, attitude scales, interview schedules, and other data-
gathering forms used in the project are included in this appendix in the
following order with one exception. Acronyms are those used in Appendix
A.
ETQ - Questionnaire and attitude scale usually filled out bytrainee shortly after entrance to the field component
of his training program.
INT - Tnterview form used by project staff to record infor-mation asked of trainee, cooperative teacher, and forbuilding principal
PD - Questions asked of program directors
OBS - Form used to record information during classroom ob-servations
PR - Rating of trainee by building principal
PTQ - Questionnaire completed by trainee around time of com-pletion of his training program (not included in thisappendix)
103
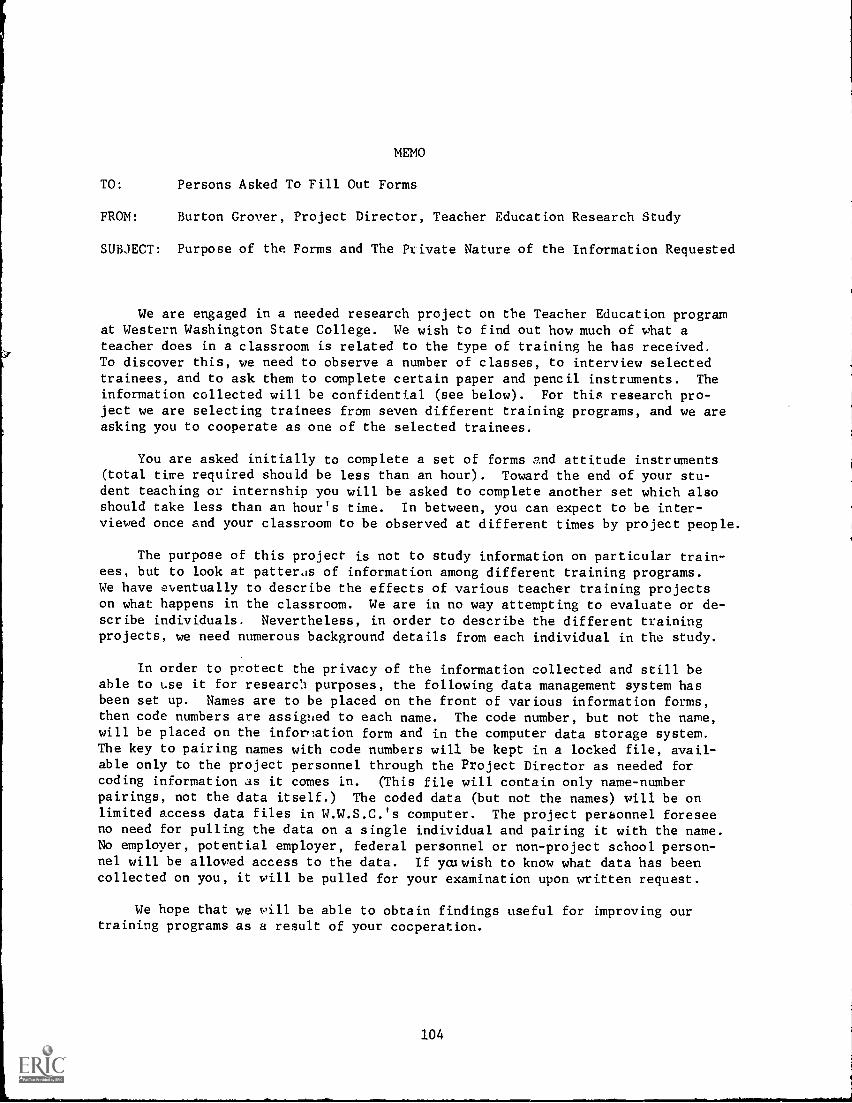
MEMO
TO: Persons Asked To Fill Out Forms
FROM: Burton Grover, Project Director, Teacher Education Research Study
SUBJECT: Purpose of the Forms and The Private Nature of the Information Requested
We are engaged in a needed research project on the Teacher Education programat Western Washington State College. We wish to find out how much of what ateacher does in a classroom is related to the type of training he has received.To discover this, we need to observe a number of classes, to interview selectedtrainees, and to ask them to complete certain paper and pencil instruments. The
information collected will be confidential (see below). For this research pro-ject we are selecting trainees from seven different training programs, and we areasking you to cooperate as one of the selected trainees.
You are asked initially to complete a set of forms and attitude instruments(total time required should be less than an hour). Toward the end of your stu-dent teaching or internship you will be asked to complete another set which alsoshould take less than an hour's time. In between, you can expect to be inter-viewed once and your classroom to be observed at different times by project people.
The purpose of this project is not to study information on particular train-ees, but to look at pattents of information among different training programs.We have eventually to describe the effects of various teacher training projectson what happens in the classroom. We are in no way attempting to evaluate or de-scribe individuals. Nevertheless, in order to describe the different trainingprojects, we need numerous background details from each individual in the study.
In order to protect the privacy of the information collected and still beable to use it for research purposes, the following data management system hasbeen set up. Names are to be placed on the front of various information forms,then code numbers are assigned to each name. The code number, but not the name,will be placed on the inforlation form and in the computer data storage system.The key to pairing names with code numbers will be kept in a locked file, avail-able only to the project personnel through the Project Director as needed forcoding information as it comes in. (This file will contain only name-numberpairings, not the data itself.) The coded data (but not the names) will be onlimited access data files in W.W.S.C.'s computer. The project personnel foreseeno need for pulling the data on a single individual and pairing it with the name.No employer, potential employer, federal personnel or non-project school person-nel will be allowed access to the data. If yaiwish to know what data has beencollected on you, it will be pulled for your examination upon written request.
We hope that we will be able to obtain findings useful for improving ourtraining programs as a result of your cooperation.
104

TRAINEE INFORMATION RECORD -- WWSC
This is confidential information intended to shed light on types ofpeople who enter the programs. This is not an evaluation of the indivi-dual trainee or program. The data on this form will be kept seperatefrom your name. (The first thing we will do is separate this page fromthe rest of the instrument.) Access to this data will be restricted. No
one but the Project Dire,'or will have access to the code through whichnames will be paired with this data.
1. FULL LEGAL NAME, LAST NAME FIRST
Surname
2. HOME ADDRESS
First Middle
Street City State Zip
3. CURRENT MAILING ADDRESS IF DIFFERENT FROM ABOVE
Street City State Zip
4. STUDENT ID NUMBER:
(Leave blank if you can not remember it)
105

5. Date of Birth Place of Birth 6. Sex (Circle one)
male femaleCity State
7. Marital Status (Circle one)
single married divorced widowed
8. What is your present standing? Place an "X" in appropriate space:
Graduate
Undergraduate
Previously received bachelor's degree, but not enrolled in graduateprogram at present.
9A. Undergraduate Academic Major (If you have NO major other than Elementary Edu-cation, write in "Elem. Educ.")
9B. Provide the following GPA's as best you can recall them for your undergraduatework. Use two decimal places if you can recall the exact figure.
GPA for all undergraduate work prior to this year
GPA for all work done for the undergraduate academic major
GPA for the last undergraduate year in college before this year.
10. Last High School attended:
Date of Graduation:
Name of Institution:
Location:
Size of Graduating Class:
11. Universities and Colleges at which you have registered to date:
Degree Name of Institution Location Years
12. How many Brothers and Sisters have you? (If NONE, so state.)
Younger Older

13. In how large a community did you live during your junior high school years
(ages 12-14)? (Place an "X")
Under 5,000
Betweer 5,000 and 35,000
Between 100,000 and 500,000
Over 500,000
Suburb of Metropolitan City
Rural
14. How much concern have the following caused you during the past twelve months?Check one for each item. (Place an "X")
much some none
physical illness
emotional problems
family problems
social relationships
financial difficulties
academic problems
career problems
15. How long has it been since you left high school? (Place an "X")
One year
Two years
Three years
Four years
Five to nine years
Ten or more years
16. Where were you living during your junior high school years (ages 12-14) ifdifferent from place of birth? (Place an "X")
New England Rocky Mountain States
Mid-Atlantic Southwest
South California
Yid-West Pacific Northwest
Great Lakes Area Other (Alaska, Hawaii, etc.)
Plains States
17. Father's (or legal guardian's) occupation while you were in junior high school(ages 12-14):
If a farmer, describe how large was the farm (include approximate acreage).

If a self-employed businessman, describe how large was the business (includeapproximate number of employees).
18. Mother's occupation. To be completed only if mother provided principalsource of income. (Place an "X")
Clerical
Farmer
Housewife; income from investments
Managerial (own business, company manager, executive)
Professional (Doctor, Lawyer)
Teacher
Sales (retail business, insurance)
Semi-skilled work (factory worker)
Service, recreation (motel employee, waitress)
Technical (data processor, medical or dental technician)
Transport, communication (telephone operator, etc.)
Unskilled worked (farm worker, etc.)
Other
19. Whs.: is the highest level of education that you expect to attain duringyour lifetime? Check ONE ONLY. (Place an "X")
Bachelor's Degree Professional degree (law, medicine,dentistry)
Master's Degree Other
Ph.D. I have no idea
20. Mother's education, highest level completed. Check ONE ONLY. (Place an "X")
Elementary school; grade 8 or less
High school, 1-2 years
High school, 3-5 years
Some post high school (trade, vocational, technical, university)
Completed Bachelor's degree
Some graduate study
Completed graduate degree
Do not know108

21. How much teaching experience have you had prior to your current training pro-gram, if any (exclusive of Sunday School, Boy Scouts, etc.)
Years Months
If NONE, check here:
22. Previous experience in working with children.
Type of Activity Amount of Time Spent
(e.g., baby sitting, swimming coach) (e.g., 10 hrs/week for 10 years, 3 weekssummer camp for 2 years)
23. When you think of a college instructor, how important is each of the following
to you? Check ONE for each item. (Circle appropriate number.)
Do not give all items the same rating.
Explanation of scale: Very Of Some No Importance
Important Importance at All
1 2 3 4 5 6 7
Knowledge in own subject 1 2 3 4 5 6 7
Broad general knowledge in all fields 1 2 3 4 5 6 7
Possesses the techniques of good teaching 1 2 3 4 5 6 7
Is a good friend to the student 1 2 3 4 5 6 7
Insists on assignments completed on time 1 2 3 4 5 6 7
Conducts his course basically as a lecture 1 2 3 4 5 6 7
Requests that student call him by his first name 1 2 3 4 5 6 7
Encourages active student participation in class 1 2 3 4 5 6 7
Examines student work very carefully 1 2 3 4 5 6 7
24. Student activities. In column 2 name the activity, in column 3 indicate thenumber of quarters you participated in the activity, in column 4 show the ap-
proximate number of hours spent per week during the quarter you participated,and in column 5 check if you were an officer or captain in the organizationor activity. An example is given on the first line.
1. 2.
Category of Name of
Activity Activity
Athletics(example)
tennis
3.
Quarters
4.
Hours
6
5.
Officer orCaptain

1. 2.
Category of Name of
Activity Activity
DramaticsForensics
3.
Quarters
4.
Hours
5.
Officer orCaptain
Political
Social
Student Gov-ernment
I:Lher (In
clude Schol-astic Clubs orOff-CampusOrganizations
25. Name any previous employment. Past five (5) jobs OR most significant five (5)
jobs.
Given below are groups of statements about which we all have beliefs, opinions,
and attitudes. The first group is about your teacher training program, the othergroups have statements about more general matters. We all think differently abouteach matter, and this scale is an attempt to let you express your beliefs andopinions. There are no right and wrong answers. Please observe the following
rules for marking:
+3 When you are in complete agreement with the statement.+2 When, on the whole, you agree with the statement.+1 When you are in doubt, but if forced to choose, will agree
with the statement.0 When you are totally unable to decide.-1 When you are in doubt, but if forced to choose, will dis-
agree with the statement.-2 When, on the whole, you disagree with the statement.-3 When you are in complete disagreement with the statement.
110

4. Letting your friends down is not so bad because you can't do good all the
time for everybody.
5. It is the duty of each person to do his job the very best: he can.'
6. People would be much better off if they could live far away from otherpeople and never have to do anything for them.
7. At school I usually volunteered for special projects.
8. I feel very bad when I have failed to finish a job I promised I would do.
V. OPINION INVENTORY B
1. In this complicated world of ours the only way we can know what's goingon is to rely on leaders or experts who can be trusted.
2. My blood boils whenever a person stubbornly refuses to admit he's wrong.
3. There are two kinds of people in this world: those who are for the truth
and those who are against the truth.
4. Most people just don't know what's good for them.
5. Of all the different philosophies which exist in this world, there isprobably only one which is correct.
6. The highest form of government is a democracy and the highest form ofdemocracy is a government run by those who are the most intelligent.
7. The main thing in life is for a person to want to do something important.
8. I'd like it if I could find someone who could tell me how to solve mypersonal problems.
9. Most of the ideas which get printed nowadays aren't worth the paper theyare printed on.
10. Man on his own is a helpless and miserable creature.
II. It is only when a person devotes himself to an ideal or cause that life
becomes meaningful.
12. Most people just don't give a "damn" for others.
13. To compromise with our political opponents is dangerous because itusually leads to the betrayal of our own side.
14. It is often desirable to reserve judgement about what's going on untilone has a chance to hear the opinions of those one respects.
15. The present is all too often full of unhappiness. It is only the future
that counts.
16. The United States and Russia have just about nothing in common.
17. In a discussion I often find it necessary to repeat myself several timesto make sure I am being understood.
18. While I don't like to admit this even to myself, my secret ambition is to
become a great man, like Einstein, or Beethoven, or Shakespeare.

I. OPINTONS ABOUT TEACHER TRAINING PROGRAM
1. So far in my education training, I have learned about things that arerelevant to current problems in American education.
2. I am confident that the training program in which I am enrolled will bedoing a good job in preparing me to teach.
3. if I had to do it over again, I would enroll in the same teacher trainingprogram.
4. So far in my education training, I have learned little of any practicalvalue for teaching.
5. I would know much more about teaching methods than I do now if I were ina better training program.
6. The instructors and teachers in my teacher education program have generallybeen very competent.
7. My ideas about the basic aims of education have changed greatly since Istarted in this teacher education program.
li. OPINION INVENTORY A
1. An expert who doesn't come up with a definite answer probably doesn'tknow too much.
2. There is really no such thing as a problem that cannot be solved.
3. A good job is one where what is to be done and how it is to be done arealways clear.
4. In the long run, it is possible to get more done by tackling small, sim-ple problems rather than large and complicated ones.
5. What we are used to is always preferable to what is unfamiliar.
6. A person who leads an even, regular life in which few surprises or unex-pected happenings arise, really has much to be grateful for.
7. I like parties where I know most of the people more than ones where allor most of the people are complete strangers.
8. The sooner we all acquire similar values and ideals the better.
9. I would like to live in a foreign country for a while.
10. People who fit their lives to a schedule probably miss most of the joy ofliving.
11. It is more fun to tackle a complicated problem than to solve a simple one.
_12. Often the most interesting and stimulating people are those who don'tmind being different and original.
13. People who insist upon a 'yes' or 'no' answer just don't know how compli-cated things really are.
112

14. Many of our most important decisions are based upon insufficient iniorma-tion.
15. Teachers or supervisors who hand out vague assignments give a chance for
one to show initiative and originality.
16. A good teacher is one who makes you wonder about your way of looking atthings.
III. SOCIAL ATTITUDES A
1. In order to achieve what we need in our society, the system has to be
drastically changed.
2. In practice the rich and the poor are not equal before the law.
3. Basically, the values of the establishment are hypocritical.
4. The best way to solve social problems is to stick close to the middle ofthe road, to move slowly and to avoid extremes.
5. Society should be quicker to throw out old ideas and traditions and toadopt new thinking and customs.
6. True demperacy is limited in the United States because of the specialprivileges enjoyed by business and industry.
7. Generally, the government does a good job in protecting our self-interest.
8. There are legitimate channels for reform which must be exhausted before
attempting disruption.
9. Anyone who violates the law for reasons of conscience should be willingto accept the legal consequences.
10. Traditions serve a useful social function by providing stability and con-
tinuity.
11. The bureaucracy of American society makes it impossible to live and workspontaneously.
12. A problem with most older people is that they have learned to acceptsociety as it is, not as it should be.
13. The structure of our society is such that self-alienation is inevitable.
_14. While man has great potential for good, society brings out primarily theworst in him.
IV. SOCIAL ATTITUDES E.
1. It is no use worrying about current events or public affairs; I can notdo anything about them anyway.
2. Every person should give some of his time for the good of his town orcountry.
3. Ou: countrywould be a lot better off if we didn't have so many elections
and people didn't have to vote so often.

19. Even though freedom of speech for all groups is a worthwhile goal, it is
unfortunately necessary to restrict the freedom of certain political
groups.
20. It is better to be a dead hero than to be a live coward.
114
1

Name
Program
1. Grade level of children taught by the trainee (if more than one gradelevel, take average)
P CT T 2. What proportion of the children in classes taught by the trainee are ofthe following minority groups: Obtain percentage estimate if possible;if not, obtain fractional estimate. If the student teaches more thanone class, record information seperately for each class.
1/10- 1/5- 2/5-
0 1/10 1/5 2/5 3/5 3/5+
Bla*
Indian
Mexican-American
Estimates obtained from: Principal Coop T. Trainee Coll. 3upv.
Cross-checked with: Principal Coop T. Trainee Coll. Supv.
(If conflicting estimates are given, record the differing estimates,indicate who gave what figures, and comment)
P CT T 3. What proportion of the children in class(es) taught by trainee are fromeconomically disadvantaged families? (Basis: Federal guidelines fordetermining eligibility for various poverty programs) Obtain percentageestimate if possible; if not, obtain fractional estimate. If the studentteacher teaches more than one class, obtain separate estimates for eachclass. If you obtain estimates for more than one person, indicate byrecording. separate figures for each class.
Principal
Coop T.
Stu. T.
1/10- 1/5- 2/5-
0 1/10 1/5 2/5 3/5 3/5+
CT P T 4. Rural vs. Urban. What portion of the children in class(es) taught bytrainee are rural, i.e. do not live in urban or suburban areas, towns,or incorporated villages? Obtain percentage (preferred) or fractionalestimates. If you obtain separate estimates, record separately. Thenindicate if remainder of pupils live in urban, suburban, or small townincorporated village setting. (If in doubt, record name of community.)
115

Self-evident
Coop T.
Principal
Trainee
1/10- 1/5- 2/5- 3/5-0 1/10 1/5 2/5 3/5 4/5 4/5+
Remainder of children are:
Small town Suburban Urban
T 5. Has the trainee worked on any instructional modules (training packages)?Of these, how many have been studied thoroughly (worked through to cri-terion)? Show list if necessary.
T 5. How many course credits in professional education (including psychology
and special methods) have you earned or are enrolled in in the field(school setting)?
7. How much influence have you had over the following types of decisionsconcerning your training in education:(Compared to college faculty and college supervisors, cooperating teacher,principal, professional associates, parents and community representa-tives?
6 - More influence than anybody else5 - As much influence as anybody else4 - As much influence as anybody else, but several people
have equal influence3 - Some influence but others have more2 - Slight influence1 - No influence
Academic, substantive content of professional education training(not counting student teaching or practicum but including labphase. Namely, what you study about education.
Student teaching assignment (where, what grade level, which coop-erating teacher, etc.)
Tasks and duties--the things you actually work on--during studentteaching or internship.
What you study about education during student teaching, if anythingover and above regular student teaching responsibilities.
How you are to be evaluated.
116

T or CT 8. To your knowledge, do any parents or parent groups, or teacher associa-tions have any influence over any of the decision areas listed in #7?
T CT 9. How many times has the trainee been observed with a conference following
the observation?
By a college supervisor (including joint appointee)
By the cooperating teacher
T
CT
T
(in the spaces indicate how many of the observations were preceded by aplanning conference. If different numbers are given by the trainee andthe CT, put the T's number first and the CT's number second in the samespace.)
10. Have you engaged in any micro-teaching experiences, that is structuredepisodes with children that were set up for the trainee to learn ordemonstrate a specific teaching competency or were otherwise focused ona specific aspect of teaching. Such episodes usually are observed, re-corded and subsequently analyzed. (and may be a normal part of the lahphase). If so, how many?
11. How many student teachers has the cooperating teacher supervised priorto the current trainee? (In project 1070, ask the fellow. In TeacherCorps, if there is no cooperating teacher as such, ask the Team Leader.)
12. So far in your education training, you have studied a number of thingsand engaged in a number of activities. To what extent have these as-signments and activities been standard for all students in your programand to what extent have they been uniquely selected and adapted to youas an individual?
Most assignments and activities individually adapted
Half or more individually adapted
Several individualized tasks, but most are standard
A few individually adapted
Nothing individually adapted
CT P 13. (a) A formal study of educational psychology, whether taught on campusor in the field, is very important for teacher trainees.
SA A MA N MD D SD
(b) In general, formal education courses, as they are usually taught,are not too important for a teacher to take.
SD D MD N MA A SA
(c) Usually foundation courses in education are a waste of time.
SD D MD N MA A SA
(d) The only way a person can learn teaching methods is to work withchildren; education courses cannot do the job.

Program Information Inventory
1. What number of college credits in professional education and specialeducation do your trainees earn in the field (public school setting)?
2. Do any of your trainees study and work through instructional modules?If so, how many are scanned or partially studied? How many arestudied thoroughly and have criterion demonstrated?
3. For various decision-making aspects of your training program--contentof education courses, assignment of student teachers, evaluation oftrainees--what relative influence is exerted by cooperating teachers,parent groups, school administrators compared to college staff?
4. (For each trainee in study) How many times have the trainees been ob-served with the observation followed by a conference? Preceded by aconference?
5. Is micro-teaching part of your program? If so, how many micro-teaching episodes are engaged in by your trainees?
6. Compared with features such as field-centeredness and competency-based,how important a feature is individualization of instruction for train-ees?
a. The most important featureb. As important as any other featurec. Important, but not as important as other featuresd. Not too important
7. On a five-point scale (for each trainee), rate the effectiveness ofthe cooperating teacher--both in terms for the specific traineeassigned to him and in terms of trainees in general.
118

ass
at ion Interaction Cognitive Level
1 Attention Scan
1 Attention Scan
ents

Class2.
tuation Interaction Cognitive Level
pil Attention Scan
dividualization rating: Comments
ecial materials or activities
merits

Class management: Comments:
(teacher) dull
(class) disorganized
(aloof
(teacher) unsympathetic
i harsh-
stimulating
systematic
responsive )
understanding
kindly

OBSERVATION SUMMARY SHEET
A. CLASS SITUATION (RECORD NUMBER OF OBSERVED TIME SEGMENTS FOR EACH OF THECATEGORIES)
"LP" -- Formal presentation
"L"
Hin
TOTAL
-- Informal lecture or discussion for whole class
-- Class working primarily in small groups
-- Class working primarily as individuals
B. INTERACTION (INDICATE NUMBER OF TIME SEGMENTS DURING WHICH THE TNDICATEDCODE WAS RECORDED)
Class SituationLP L S i
Any indirect (1, 2 or 3), either single or double symbol
*Extended indirect (22, 33, 23, etc.)
Any direct (6 or 7), either single or double symbol
Extended direct (66, 77, 67, etc.)
Pupil-initiated comment (either "9" or
Extend pupil-initiated comments (99s)
Any extended lecture or information presentation (55s)
Number of time segments during which teacher-pupil inter-action was an expected part of the activity
It99t1)
Number of time segments during which teacher-pupil inter-action was not an expected part of the activity (e.g., movie,sustained silent reading)
(When in doubt, such as when teacher is circulatingamong small groups, count time segment in formercategory)
Total time segments observed
If any number of these did not follow pupil talk, comment.
122

C. QUESTIONS (RECORD NUMBER OF TIME SEGMENTS DURING WHICH ANY INDICATEDQUESTION TYPE OCCURRED OR WAS SOMETHING PUPILS WERE WORKING ON)
K
C
A
S
E
No questions or procedural questions only
Total time segments during which questions (other than proceduralquestions) were recorded
Total time segments occurred
D. PUPIL ATTENTION SCAN (RECORD AS RATIOS, ONE FOR EACH SCAN, EACH AS 48/23)
E. INDIVIDUALIZATION RATING(S)
(Ordinarily, only one score is recorded for each observation. However,
if a shift of class activity occurs during observation which changes theindividualization picture, you may record more than one score and writein comments)
F. Class Management
G. Dull to Stimulating
H. Disorganized to Systematic
I. Harsh to Kind
123

Trainee
Please give your frank appraisal of the above-named teacher trainee on the
three items below. For each item circle the letter of the response thatcomes closest to your honest opinion. Even if you have had little contactwith the trainee, please guess at ratings based on any impressions you have-whether based on rumors, hearsay, appearance, whatever.
This information will be used for an analysis of our teacher training programsand not for the evaluation of the trainee nor for his credentials. When wereceive this rating, we will code it and then detach the name of the trainee.
1. Suppose the above-named teacher trainee applied for a teaching position
in your particular building. Suppose there was a vacancy at a gradelevel or subject similar to that in which the trainee is currently doing
his student teaching:
Would you wish to hire this trainee:
a. Never, not even if there were no other applicants
b. Only if there were no other applicants
c. Probably, if there were only a few other applicants
d. Probably, even if there were other reasonably strong applicants
e. Without even bothering to look for other applicants
2. Suppose you were hiring teachers for a school system about which youknew little except that it is a "typical" school with "typical" children.
Would you hire this trainee:
a. Never, not even if there were no other applicants
b. Only if there were no other applicants
c. Probably, if there were only a few other applicants
d. Probably, even if there were other reasonably strong applicants
e. Without even bothering to look for other applicants
3. Overall, compared to all student teachers you have had experience with,
how would you rate the above-named trainee?
a. Much above average
b. Above average
c. Average
d. Below average
e. Much below average
124