document resume fouladi, rachel t. - eric · document resume. ed 420 717 tm 028 439. author...
TRANSCRIPT
DOCUMENT RESUME
ED 420 717 TM 028 439
AUTHOR Fouladi, Rachel T.TITLE Covariance Structure Analysis Techniques under Conditions of
Multivariate Normality and Nonnormality Modified andBootstrap Based Test Statistics.
PUB DATE 1998-04-00NOTE 28p.;-Paper presented at the Annual Meeting of the American
Educational Research Association (San Diego, CA, April13-17, 1998).
PUB TYPE Reports Evaluative (142) Speeches/Meeting Papers (150)EDRS PRICE MF01/PCO2 Plus Postage.DESCRIPTORS *Computer Software; *Maximum Likelihood Statistics; *Monte
Carlo Methods; *Multivariate Analysis; Tables (Data)IDENTIFIERS AMOS Computer Program; Bootstrap Methods; *Covariance
Structural Analysis; EQS Computer Program; *NonnormalDistributions; Resampling Techniques; Type I Errors
ABSTRACTCovariance structure analytic techniques have become
increasingly popular in recent years. During this period, users ofstatistical software packages have become more and more sophisticated, andmore and more researchers are wanting to make sure that they are using the"best" statistic, whether it be for small sample considerations or for issuesof nonnormality. At present, none of the confirmatory structure analyticprograms include small sample modifications such as the k-factor Bartlettmultiplier (1950) or the Swain multiplier (A, Swain, 1975). They do howeverinclude modifications to address distributional nonnormality. EQS offers theSatorra-Bentler scaled statistics (A. Satorra and P. Bentler, 1988, 1989); itdoes not yet offer the Satorra-Bentler adjusted statistic. AMOS, on the otherhad, offers a bootstrap alternative, however, it does not yet offer either ofthe Satorra-Bentler modified statistics. This Monte Carlo study addresseswhether resampling-based procedures provide improved Type I error controlover the modified test statistics such as the k-factor Bartlett modified,Swain modified, Satorra-Bentler scaled, and Satorra-Bentler adjusted teststatistics. The study provides evidence on the relative performance of theBeran-Strivastave bootstrap procedure and demonstrates that this proceduredoes not provide as good control of Type I error under conditions ofextremely mild distributional nonnormality as the 0-factor Bartlett or Swainmodified maximum likelihood procedure. It does show improved Type I errorcontrol over the standard maximum likelihood procedure. (Contains 7 tables, 6figures, and 42 references.) (Author/SLD)
********************************************************************************
Reproductions supplied by EDRS are the best that can be madefrom the original document.
********************************************************************************
Covariance structure analysis techniques under conditions of multivariatenormality and nonnormality Modified and Bootstrap based test statistics
PERMISSION TO REPRODUCE ANDDISSEMINATE THIS MATERIAL
HAS BEEN GRANTED BY
gacift.2-1Fad GAL
TO THE EDUCATIONAL RESOURCESINFORMATION CENTER (ERIC)
Rachel T. Fouladi
Department of Educational PsychologyUniversity of Texas at AustinAustin, Texas 78712-1296
U.S. DEPARTMENT OF EDUCATIONOffice of Educational Research and Improvement
EDU ATIONAL RESOURCES INFORMATIONCENTER (ERIC)
This document has been reproduced asreceived from the person or organizationoriginating it.
Minor changes have been made toimprove reproduction quality.
Points of view or opinions stated in thisdocument do not necessarily representofficial OERI position or policy.
Abstract. Covariance structure analytic techniques have become increasingly popular in recent years. During thisperiod, users of statistical software packages have become more and more sophisticated, and more and moreresearchers are wanting to make sure they are using the "best" statistic, whether it be for small sample considerationsor for issues of nonnormality. At present, none of the confirmatory structure analytic programs include small samplemodifications such as the k-factor Bartlett multiplier or the Swain multiplier. They do however include modificationsto address distributional nonnormality. EQS offers the Satorra-Bentler scaled statistic; it does not yet offer the
N Satorra-Bentler adjusted statistic. AMOS on the other hand offers a bootstrap alternative, however, does not yet offerCV either of the Satorra-Bentler modified statistics. This Monte Carlo study addresses whether resampling based
procedures provide improved Type I error control over the modified test statistics such as the k-factor Bartlettmodified, Swain modified, Satorra-Bentler scaled, Satorra-Bentler adjusted test statistics.
cie)ntcoNcp
I
Subject descriptors: Covariance structure analysis, bootstrap, resampling, small sample modifications, robustness,multivariate normality, multivariate nonnormality, Type I error.
Introduction
It has long been known that many covariance structure analytic techniques popular with an increasinglylarge body of researchers in education, the behavioral and social sciences can have extremely poor small sampleperformance characteristics (e.g., Anderson & Gerbing, 1984; Bearden, Sharma, & Teel, 1982; Boomsma, 1980). Ithas also long been known that some of these covariance structure analytic techniques are sometimes inappropriatefor use under conditions of distributional nonnormality (e.g., Boomsma, 1980; Browne, 1982; Henly, 1993; Hu,Bentler, & Kano, 1992).
Importantly however, as evidenced by regular inquiries on SEMNET, an electronic mail list serverdedicated to issues related to structural equation modeling, not all researchers have access to large samples, havedata which originate from multivariate normal populations, or have data from populations in which multivariatenormality is not a concern (c.f., Anderson & Amemiya, 1985; Browne, 1987; Browne & Shapiro, 1987; Fouladi,1998, for conditions of asymptotic robustness of normal theory techniques). Fortunately for these researchers, overthe years a number of viable alternatives to standard structure analytic techniques have been proposed, some but notall of which have been implemented in statistical software currently on the market.
The alternative covariance structure analysis procedures under consideration in the present paper includemultiplicative modifications and the application of computer intensive resampling methods to standard covariancestructure analysis techniques. Even though the results of Monte Carlo simulation studies showing that the problemsassociated with the use of covariance structure analysis techniques under small sample size conditions and/ordistributional nonnormality can be greatly alleviated by the use of modified test statistics (Curran, West, & Finch,1996; Fouladi, 1997a,b, 1998) and resampling based test statistics (Ichikawa & Konishi, 1995) are becomingincreasingly well known, until recently the relative performance of the modified procedures was largelyundocumented, and to date, the relative performance of modified and resampling based statistics remainsunexamined. This paper seeks to fill this void in the literature.
Presented at the American Educational Research Association Annual Meeting, April 11-17, 1998, San Diego, CA
2
Modified and Bootstrap based statistics 2
Test Procedures Examined
Consider N independently identically distributed observation vectors obtained from a p-dimensionalmultivariate population, with non-singular pxp population covariance matrix E . In order to test the hypothesis that agiven path, structural, and/or measurement model is an appropriate representation of the pattern of relations amongthe variables in the population, a researcher can use a variety of structure analysis procedures, most of which areformulated using asymptotic covariance distribution theory.
The goodness of fit test statistics used in covariance structure analysis are generally of the form or somefunction of T = cnF where c is a constant scaling factor, n = N -1, N is the sample size, and F is the minimumvalue of F(S, E ) , a scalar valued discrepancy function of the sample covariance matrix S from the population
covariance model matrix E . The standard parametric covariance structure analysis test statistics implemented in
popular software with which one can conduct confirmatory covariance structure analyses, all have c=1. Under fairlygeneral conditions, when the null hypothesis is true, the discrepancy function is appropriately chosen and the model
is identified, these goodness of fit test statistics are asymptotically chi-square distributed with g = 1 p(p + 1) q2
degrees of freedom,' where p is the number of observed variables and q the number of free parameters in the model(Bentler & Dijkstra, 1985; Browne, 1982, 1984; Satorra and Saris, 1985; Shapiro, 1983, 1986; Steiger, Shapiro, &Browne, 1985).
The poor performance of the standard maximum likelihood statistic and other covariance structure analysistest statistics with c=1, under small sample conditions and/or conditions of distributional nonnormality has beenwidely documented for several decades (e.g., Boomsma, 1980; Henly, 1993). Over the years, in various attempts toaddress the problems associated with covariance structure analysis under these conditions, a number of alternative
-procedures have been proposed. The alternative procedures include modified test statistics involving multiplicativescalings of standard covariance structure analysis test statistic suggested by Swain (1975), Satorra and Bentler(1988), and Fouladi (1997c). Other proposed solutions to alleviate problems with standard parametric covariancestructure analysis techniques include the application of computer-intensive resampling procedures (Beran &Srivastava, 1985; Bollen & Stine, 1992).
Swain modified test statistic
Swain (1975) proposed the use of a modified maximum likelihood test statistic to obtain improved smallsample performance characteristics for the standard maximum likelihood chi-square test statistic. Even thoughproposed more than two decades ago, described in a widely cited chapter by Browne (1982), resulting in improvedsmall sample performance under conditions of multivariate normality, and easily computed, the Swain modifiedmaximum likelihood test statistic is little known and little used (Fouladi, 1997a,b, 1998). According to Browne,Swain proposed four multipliers which seemed to result in an improvement of the approximation to the chi-squaredistribution by the standard normal theory covariance structure analysis maximum likelihood goodness of fit statisticunder conditions of multivariate normality. Browne provided the one general multiplying factor which appearedslightly preferable to the others, but which only applies to models which are scale invariant. The Swain multiplicative
modification has c = 1- (t pY
- t )/ (12gn) , where p is the number of observed variables, y = -1) / 2 ,
q = p(p + 1) / 2 - g , g is the number of degrees of freedom in the model, n= N -1, and tx = x(2x 2 + 3x -1) .
Fouladi (1996, 1997a,b, 1998) showed that the empirical Type I error rate of the Swain modified maximumlikelihood procedure converged more quickly to the nominal level than the standard maximum likelihoodimplemented in commonly used statistical software packages. Fouladi (1998) also showed that under certain smalldepartures from distributional multivariate normality, the Swain modified maximum likelihood procedure hadadequate Type I error control, however, under larger departures from distributional normality exhibited empiricalType I error rates which sometimes (depending on the structure of the data) departed substantially from the nominallevel.
k-factor Bartlett multipliers
Bartlett (1950) proposed the usage of N p I 3- 2k / 3 -11 / 6 instead of N -1 as the multiplicativescaling of the minimum value of the maximum likelihood discrepancy function when testing a k-factor model for pobserved variables under reduced sample size conditions, thereby suggesting a scaling of the standard maximumlikelihood chi-square statistic by c =1- (2p + 4k + 5) / (6n) . The modified maximum likelihood test statistic using
'3

Modified and Bootstrap based statistics 3
this multiplier has been implemented in widely used software with exploratory factor analytic capabilities, though notin software or modules used for confirmatory structure analysis.
Fouladi (1997c) argued that the use of the k-factor Bartlett multiplier could be applied under inconfirmatory structure analysis whether or not any latent variables are hypothesized in the model. Fouladi (1997a,b)examined the performance of the 0-factor Bartlett modified maximum likelihood test statistic. Results showedsignificantly improved Type I error control over the standard maximum likelihood test statistic under conditions ofreduced sample size for a variety of models.
As with the Swain modified maximum likelihood procedure, Fouladi (1996, 1997a,b) showed that theempirical Type I error rate of the 0-factor Bartlett modified maximum likelihood procedure converged more quicklyto the nominal level than the standard maximum likelihood procedure. Fouladi (1998) also showed that under certainsmall departures from distributional multivariate normality, 0-factor Bartlett modified had adequate Type I errorcontrol, however, under larger departures from distributional normality exhibited empirical Type I error rates whichsometimes (depending on the structure of the data) departed substantially from the nominal level.
Satorra & Bentler modified test statistics
Satorra and Bentler (Satorra, 1989; Satorra & Bentler, 1988) presented two approaches to improve theasymptotic statistical behavior of covariance structure analysis statistics. Their methods yield the Satorra-Bentlerscaled and adjusted test statistics and are referred to chi-square distributions g and d' degrees of freedomrespectively (c.f., Satorra & Bentler, 1988). Though the two approaches were designed primarily to addressdepartures from the reference distribution under conditions of multivariate nonnormality, they have also been shownto be useful under conditions of multivariate normality.
Simulation studies in the nineties have presented clear evidence on the improved performancecharacteristics of the Satorra-Bentler scaled maximum likelihood test statistic over the standard maximum likelihoodtest statistic (e.g., Chou & Bentler, 1995; Curran, West, & Finch, 1996; Hu & Bentler, 1995; Hu, Bentler, & Kano,1992). Not only has the Satorra- Bentler scaled statistic been shown to be useful under conditions of multivariatenonnormality (Chou & Bentler, 1995; Curran, West, & Finch, 1996; Hu & Bentler, 1995; Hu, Bentler, & Kano,1992), it has also been shown to be useful under conditions of multivariate normality and reduced sample sizes(Curran, West, & Finch, 1996). However, until recently, the performance characteristics of the Satorra-Bentleradjusted maximum likelihood test statistic was largely undocumented. Fouladi (1997a,b, 1998) examined theperformance of the Satorra-Bentler adjusted statistic and determined that, under reduced sample size conditions, notonly did it show improved performance over the standard maximum likelihood test statistic, it also showed improvedperformance over the Satorra-Bentler scaled statistic both under conditions of multivariate normality andnonnormality. Though, under large sample sizes the Satorra-Bentler scaled procedure was preferred.
Resampling based test statistics
There are a number of different implementations of resampling techniques (c.f., Yung & Bentler, 1992,1996). Beran and Srivastava (1985) and Bollen and Stine (1992) considered the use of bootstrap-correctedtechniques in covariance structure analysis. The method described by Beran and Srivastava and Bollen and Stinepermits the establishment of an empirical reference distribution which can be used to test the null hypothesis that themodel is a good fit to the data. The Beran-Srivastava method involves the initial transformation of the data such thatthe data conform to the null hypothesis. After transformation of the data, a large number of independent bootstrapsamples are generated by sampling with replacement, and the test statistic for each bootstrap sample is calculated.The empirical distribution of the test statistic is recorded. This empirical distribution is then used as the referencedistribution to which the observed value from the original data set is compared. Because the null hypothesis of modelfit is rejected for large observed values, the bootstrap critical value is the (1 a )-percentile of the empiricaldistribution. Rejection is obtained if the value of the test statistic based on the original sample exceeds the bootstrapcritical value.
Though recommended over a decade ago, the performance characteristics of resampling based modeltesting procedures have not been widely documented in the context of covariance structure analysis. Results from arecent simulation study on the application of bootstrap methods -in factor analysis by Ichikawa and Konishi (1995)suggest that resampling based covariance structure analysis techniques perform well under conditions ofnonnormality and moderate to large sample sizes, however may not perform as well under small sample conditions.
Ichikawa and Konishi (1995) conducted a Monte Carlo experiment investigating the use of Beran-Srivastava bootstrap methods in maximum likelihood factor analysis under conditions of multivariate normality and
4
Modified and Bootstrap based statistics 4
multivariate nonnormality; they found that tests of model fit based on Beran-Srivastava bootstrap methods performedextremely well under conditions of distributional normality and nonnormality. However, given that their studyexamined the performance of bootstrap based techniques for orthogonal models and data from ellipticaldistributions, they suggest that the results of their study should be generalized with caution. They also note that sincebootstrap samples involve random sampling of data with replacement, some observations are included more thanonce in a bootstrap sample, and can result in numerically ill conditioned sample covariance matrices, particularlyunder small sample conditions. As such, the use of bootstrap based covariance structure analysis techniques may notbe advisable for extremely small sample sizes.
Empirical results on the relative performance of the alternative procedures
That Monte Carlo simulation results show that the problems associated with the use of covariance structureanalysis techniques under small sample size conditions and/or conditions of distributional nonnormality can begreatly alleviated by the use of modified tests statistics and resampling based test statistics is becoming increasinglywell known. Less well-known is the relative performance of these alternative techniques, particularly the relativeperformance of modified and resampling based techniques.
In the only studies to simultaneously examine the performance of the standard maximum likelihood teststatistic and the 0-factor Bartlett, Swain and both Satorra-Bentler modified maximum likelihood test statistics,Fouladi (1997a,b, 1998) found that the application of the 0-factor Bartlett, Swain and Satorra-Bentler multipliers tothe standard maximum likelihood test statistic yielded significant improvements in Type I error control underconditions of multivariate normality and nonnormality. Fouladi (1997a) found, under conditions of multivariatenormality and small sample sizes, the Satorra-Bentler scaled and adjusted test statistic performed better than thestandard maximum likelihood test statistic, however did not yield as good performance as a 0-factor Bartlettmodified or Swain modified maximum likelihood procedure. Under conditions of multivariate nonnormality, Fouladi(1997b, 1998) found the Satorra-Bentler scaled and adjusted test statistic performed better than the standard, 0-factorBartlett modified, and Swain maximum likelihood test statistics under models in which the observed variables weremore than moderately nonnormally distributed and could not be said to be derived from a population with anorthogonal latent variable structure, otherwise, the 0-factor Bartlett modified and Swain modified maximumlikelihood procedures were preferred.
The purpose of this study
To date no study has simultaneously examined the performance of modified covariance structure analysistest statistics and the application of resampling methods to tests of covariance structure analysis recommended byBeran and Srivastava (1985) and Bollen and Stine (1992). As such the relative performance of Beran-Srivastavaresampling methods in covariance structure analysis procedures and modified test statistics remains a question. Thispaper aims to address this unknown using a Monte Carlo simulation project, and in so doing seeks to determinewhich procedures yield improved -Type I error control under conditions of multivariate normality and underconditions of multivariate nonnormality.
Methods
A series of Monte Carlo simulation experiments were conducted in order to compare the error rate controlof the standard, 0-factor Bartlett modified, Swain modified, Satorra-Bentler scaled and adjusted test statistics, andthe Beran-Srivastava bootstrap covariance structure analysis test procedure under conditions of multivariatenormality and nonnormality. The simulation experiment was conducted using a stand-alone FORTRAN computerprogram implementing the procedures under study. Programming accuracy checks were conducted with Mathematica(Wolfram, 1996), EQS (Bentler, 1995), and the SePath (Steiger, 1995).
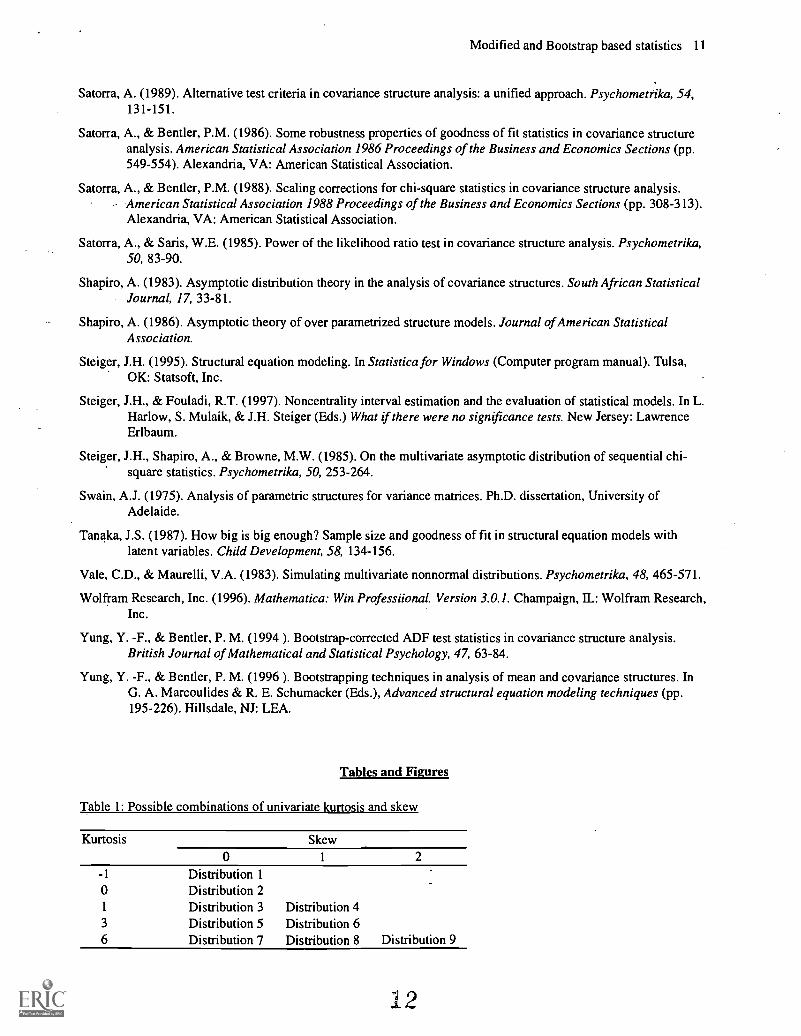
For the examination of Type I error control, data sets were generated from 6-dimensioinal populations withspecified moments. The univariate moments of the 6 variables in each multivariate population were homogeneous. Inthese populations, the means of the variables were all 0, and the variances were all 1. Nine univariate distributiontypes of varying nonnormality were considered. The distributional characteristics of the variables included levels ofskew 71=0, 1, 2, and levels of kurtosis Y2= -1, 0, 1, 3, 6; however, not all possible combinations of skew andkurtosis were examined. The possible combinations of skew and kurtosis are restricted according to the inequality:
yi2 <.62957672 +.717247 (Fleishman, 1978). Table 1 details the combinations of univariate skew and kurtosis
considered in the present paper.
Modified and Bootstrap based statistics 5
The underlying correlation structure of the variables was also varied. The correlational structure of thevariables was either diagonal (uncorrelated variables) or simplex (correlated variables). Figure 1 details thecharacteristics of the models in the population using SEPATH path language; note that no latent variables weredescribed in the models.
In the present study, the Vale and Maurelli (1983) method was used to generate data from the specified p-variate populations. This method is a p-variate extension of the Fleishman (1978) method for generating univariatenonnormal data, and can be used to generate data from populations with specified marginal means, variances, skew,and kurtoses and specified correlation structure.
Multivariate data sets were generated at various sample sizes, N : 2 q , 4 q , 10 q , 20 q , and 50 q , where
q = p(p +1) / 2 g . Sample covariance matrices were obtained for each of the data sets, and structural hypotheses
were tested at two levels of nominal alpha: allominal =.05 and .01. For each sample covariance matrix, the sixstructure analysis procedures were conducted, the decisions for the tests were recorded at each of the nominal levels.Resampling based decisions were based on 1000 bootstrap samples.
Experiments under each condition were replicated 5000 times.
Measures of performanceThere are different methods of examining the performance of test procedures. When the test statistics have a
common reference distribution as is the case with some of the covariance structure analysis test statistics, one canexamine the convergence of the distribution of the test statistics in covariance structure analysis to the referencedistribution by examining the convergence of the moments of the sampling distribution of the test statistics to themoments of the reference distribution. This method has become popular in recent years, however, in general the onlymoment that is examined is the mean; little attention has been paid to higher moments. This method is less usefulwhen test statistics have different reference distributions, as is the case in the present paper. An alternative method ofexamining the performance of test procedures that does not involve the complications of different referencedistributions is to examine the convergence of the empirical Type I error rates to the nominal level.
For each condition, the number of rejections obtained for each correlation pattern test are tabulated andtransformed into proportion rejected. Rejection rates are based on the number of replications for which convergenceobtained. Under each condition, the empirical rejection rate, aEmpirical , for each statistic is observed. For each
cell, the percent bias (B%) of the observed empirical rejection rate from the expected rejection rate, allominal is
obtained where B% = 100(aEmpirical allominal ) allominal Empirical performance of the procedures is
examined using guidelines set forth by Bradley (1978) and Robey and Barcikowski (1992) for what constitutesacceptable departures from nominal alpha. Null-consistent chi-square goodness of fit values based on a normalapproximation to the binomial are also computed. Appropriate summing of the chi-square values can be used toprovide tests of the overall control of empirical rejection rates at the nominal level. Multivariate and univariateanalysis of variance designs are used to further analyze the percent bias results. In the first set of multivariate andunivariate analyses, only the intercept effects in the general linear models are tested, thereby providing tests of thedeparture of the mean percent bias from 0. In the second set of multivariate and univariate analyses, a four-wayfactorial design is used to determine the influence of Model type, Distribution type, Sample size, and Nominal alphaon the percent bias.
Results
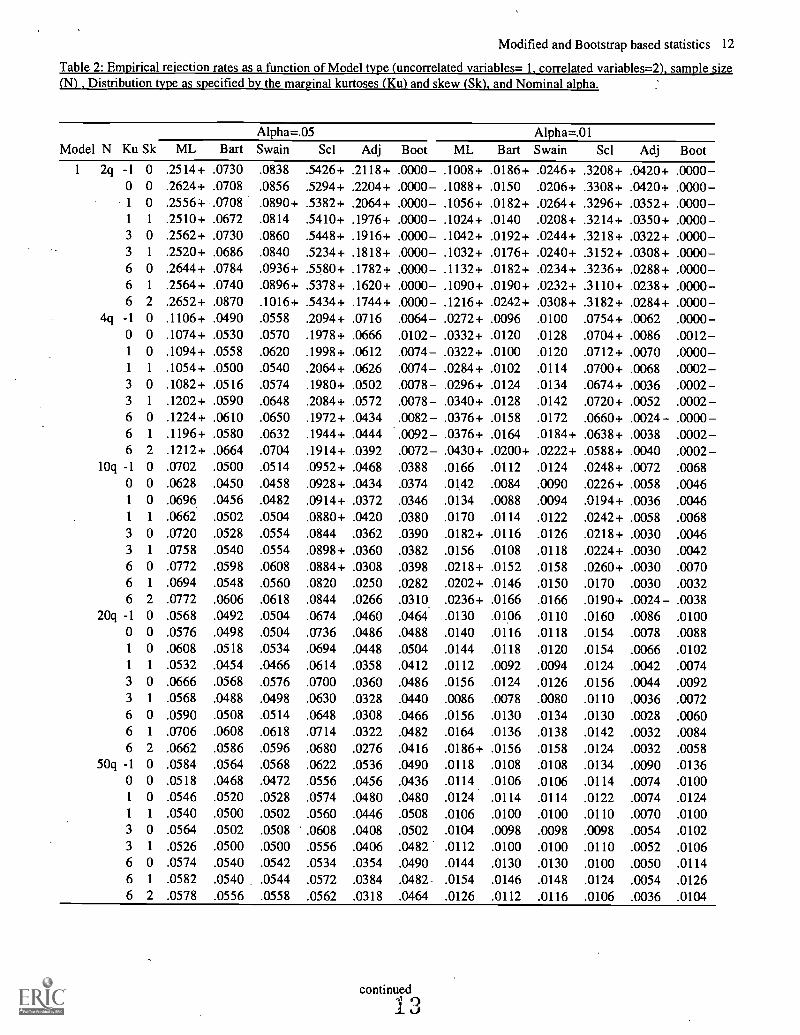
Table 2 details the empirical rejection rates of the 6 covariance structure analysis procedures examined inthis study.
Judgments of overall Type I error control using Bradley-Robey-Barcikowski criteria
Empirical rejection rates are examined using the Bradley, Robey, and Barcikowski (BRB) guidelines forwhat constitutes acceptable levels of departure of empirical Type-I error rates from the nominal level. Bradley (1978)asserted that many researchers are unreasonably generous when defining acceptable departures of empirical alphafrom the nominal level. He held that the departure of empirical alpha from the nominal level was "negligible" ifempirical alpha was within a ± io a according to a 'fairly stringent criterion', and a ±i-a according to the "most
liberal criterion that [he] was able to take seriously" which in the remainder of his article he referred to as the 'liberal
6
Modified and Bootstrap based statistics 6
criterion'. Robey and Barcikowski (1992) supplement the guidelines provided by Bradley for defining acceptabledepartures from the nominal level, providing an 'intermediate criterion' of a±la, and a 'very liberal criterion' of
atia. This set of guidelines { at-ka, at+a, at+a, a±ia) for empirical rates are hereafter referred to
as the BRB criteria for empirical alpha.
Empirical rejection rates in Table 2 less than the lower limit of atia are indicated, as are empirical
rejection rates that exceed the upper limit of a±ia . Inspection of this table reveals that no procedure consistently
provides control of empirical rejection rates within the most liberal of the BRB guidelines for acceptable Type Ierror control.
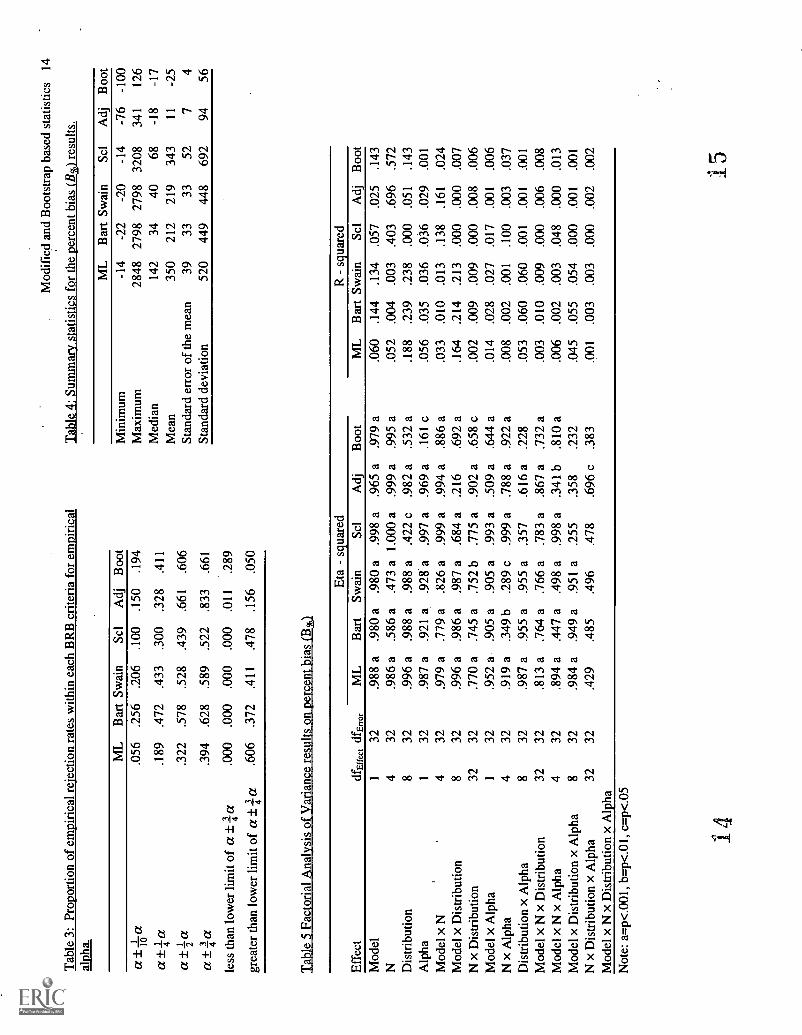
Table 3 provides an overview of the proportion of conditions in which the empirical rejection rate is withineach of the BRB criteria for empirical alpha, is less than the lower limit of atia, and is greater than the upper
limit of a±ia . The results in this table indicate that no procedure consistently controls empirical rejection rates
within the BRB criteria. The standard maximum likelihood procedure has empirical rejection rates that are within themost liberal criterion for empirical alpha, a ± ia, in 39% of the conditions examined. In contrast, the other
procedures have empirical rejection rates that are within atia in over 50% of the conditions. Of particular note is
that the Satorra-Bentler adjusted maximum likelihood procedure, which shows the best of control of empirical alphawithin atia, demonstrates control in 83% of the conditions, followed by the Beran-Srivastava bootstrapmaximum likelihood procedure which provides control in 66% of the conditions. The Swain and the Satorra-Bentlerscaled maximum likelihood procedures provide control within atia in 59% and 52% of the conditions,respectively. The magnitude of the percentages can be used to rank order the procedures from best to worst Type Ierror control. Similar rankings can be obtained from the percentages within the more stringent BRB criteria forempirical Type I error control. The results obtained from a ranking of the percentages within at-34-a and atla
suggest the same overall ordering of the procedures' control of Type I error from best to worst: Satorra-Bentleradjusted, Beran-Srivastava Bootstrap, 0-factor Bartlett modified, Swain modified, Satorra-Bentler scaled, followedby the standard maximum likelihood procedure. A different order is obtained from a ranking of the percentageswithin a tla and at*a: 0-factor Bartlett modified, Swain modified, Beran-Srivastava bootstrap, Satorra-Bentler adjusted, Satorra-Bentler scaled, followed by the standard maximum likelihood procedure.
Of further note, is that all the procedures with the exception of the Beran-Srivastava bootstrap maximumlikelihood procedures had empirical rejection rates in excess of the upper bound of atia a larger proportion of
the time than they had rejection rates that were less than the lower bound of atia, thereby showing a generaltendency of liberal bias over conservative bias for standard maximum likelihood and modified maximum likelihoodtest procedures. By contrast, the bootstrap procedure showed a general tendency of conservative bias over liberalbias.
Overall chi-square goodness of fit tests on empirical alpha
Null-consistent chi-square goodness of fit values based on a normal approximation to the binomial werecomputed comparing the empirical rejection rates to nominal alpha. Appropriate summing of the chi-square valueswas used to provide tests of the overall control of empirical rejection rates at the nominal level. The results showedthat none of the procedures provide overall control empirical rejection rates at the nominal level or at or below thenominal level (p<.001). The magnitude of the chi-square values can be used to rank order the procedures from bestto worst Type I error control. These results suggested the overall the ranking of the procedures' control of Type Ierror at the nominal level from best to worst is: Beran-Srivastava bootstrap, Satorra-Bentler adjusted, 0-factorBartlett modified, Swain modified, standard, followed by the Satorra-Bentler scaled maximum likelihood procedure.
Analysis of variance
A multivariate analysis of variance was conducted to test whether the mean percent bias of the 6 procedureswas within sampling error of 0. Results showed that overall there was a significant difference between the meanpercent bias of the procedures and 0 (p<.001). Univariate analyses were conducted for each of the procedures.Results from the univariate analyses showed that, with the exception of the mean percent bias of the Satorra-Bentler
7
Modified and Bootstrap based statistics 7
adjusted maximum likelihood procedure (p=.114), the mean percent bias of all the other procedures was significantlydifferent from 0 (p<.001). Table 4 presents summary statistics on each of the procedures. These mean and standarderror of the mean results show that overall the standard, 0-factor Bartlett modified, Swain modified, and Satorra-Bent ler scaled maximum likelihood procedures are liberal procedures, and the Beran-Srivastava Bootstrap maximumlikelihood procedure is conservative.
A factorial multivariate analysis of variance was conducted to determine the influence of Model type,Distribution type, Sample size, and Nominal alpha on percent bias. With the exception of Model x Distribution typex Nominal alpha (Pillai-Bartlett trace, p=.026) and Distribution type x Sample size x Nominal Alpha (Pillai-Bartletttrace, p=.152), all multivariate tests of main effects, two-way and three-way interaction effects yielded p<.001; thefour way interaction effect was not tested as there was only one summary empirical rejection rate per cell. Univariatefactorial analyses were conducted for each test procedure; eta-squared values and p-levels associated with each effectare summarized in Table 5, as are estimated R-squared values (SSErrect/SSrotai). These univariate results show thateven though many of the effects in the model are statistically significant, many of the effects account for less than tenpercent of the variability in the percent bias. The effects which account for more than ten percent of the variability inthe percent bias are: (a) Distribution type and Model x Distribution type for the standard maximum likelihoodprocedure, (b) Model type, Distribution type, and Model x Distribution type for the 0-factor Bartlett and Swainmodified maximum likelihood procedures, (c) Sample size and Model x Sample size for the Satorra-Bentler scaledand adjusted maximum likelihood procedures, (d) Model, Sample size, and Distribution type for the Beran-Srivastava Bootstrap based maximum likelihood procedure.
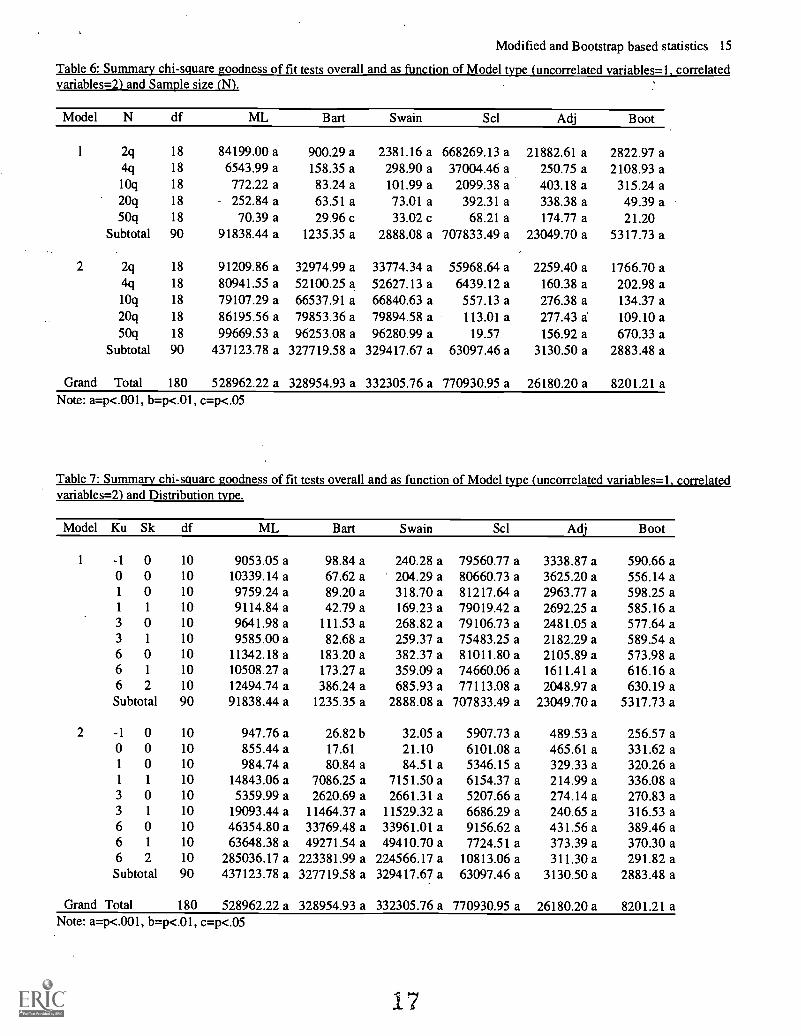
Type 1 error control as a function of Model type, Sample size, and Distribution type
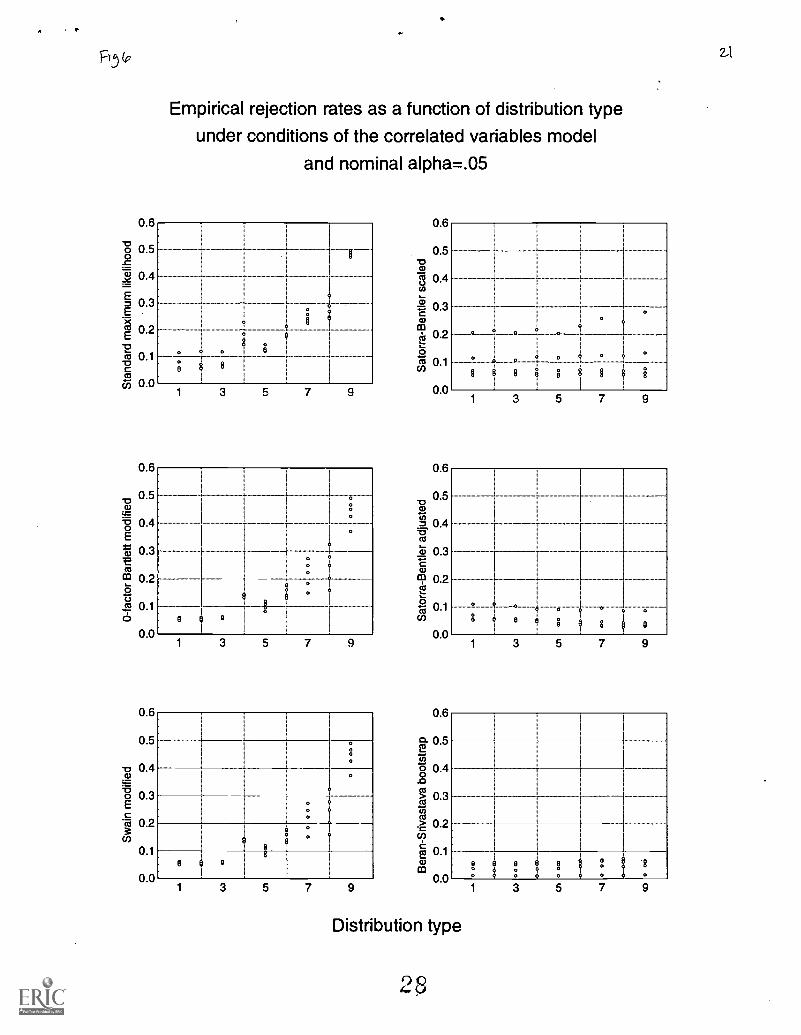
Tables 6 and 7 provide summary chi-square goodness of fit values for the control of Type I error rates at thenominal level overall and as a function of model type, sample size, and distribution type. Comparison of themagnitudes of the chi-square values permits a ranking of the procedures in terms of Type I error control across thevarious conditions. Examination of the overall chi-square values suggests that even though none of the proceduresprovided Type I error control in general the Beran-Srivastava bootstrap procedure had the best performance. Withinthe uncorrelated variables model, the 0-factor Bartlett modified procedure outperformed all other procedures acrossall the distribution types and at N:q of 2, 4, and 10, however at N:q of 20 and 50 the Beran-Srivastava bootstrapprocedure had the best Type I error control. Within the correlated variables model, the 0-factor Bartlett modifiedprocedure outperformed the other procedures for the (K,S) equal to (-1,0), (0,0), and (1,0), for the distributions withincreased leptokurtosis and/or skew alternative procedures were preferred. The Beran-Srivastaba bootstrapprocedure outperformed all other procedures at N:q of 2, 10, and 20. At N:q of 4 the Satorra-Bentler adjustedprocedure was preferred. At N:q of 50, the Satorra-Bentler scaled procedure was preferred.
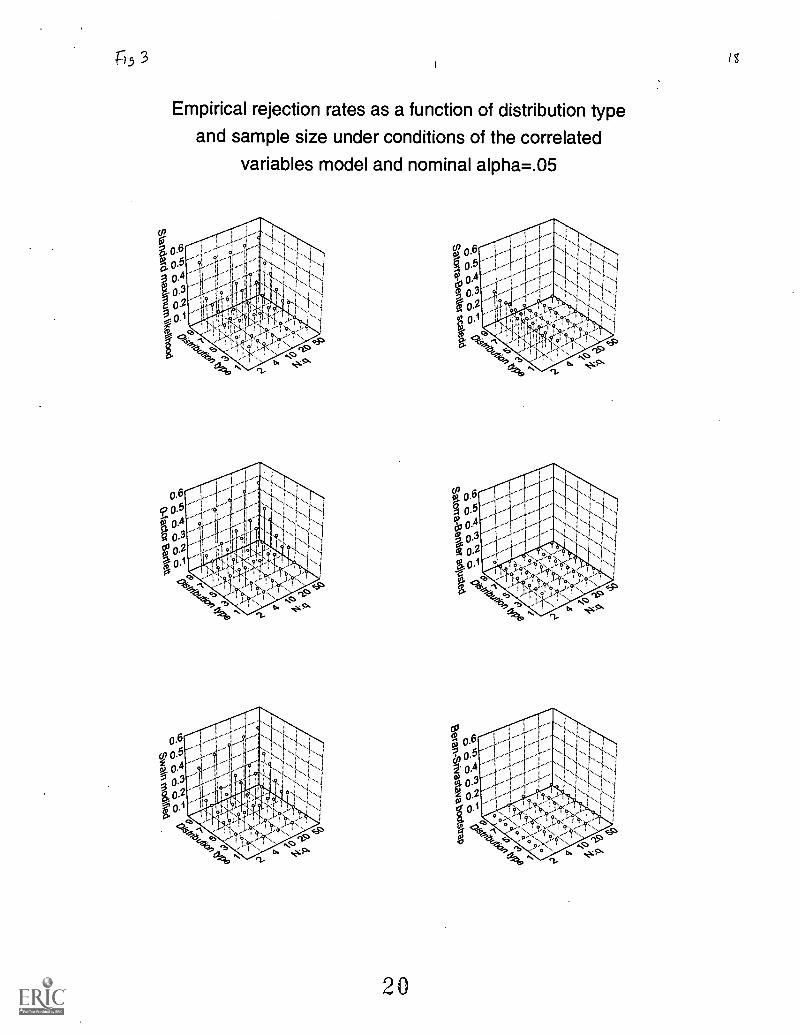
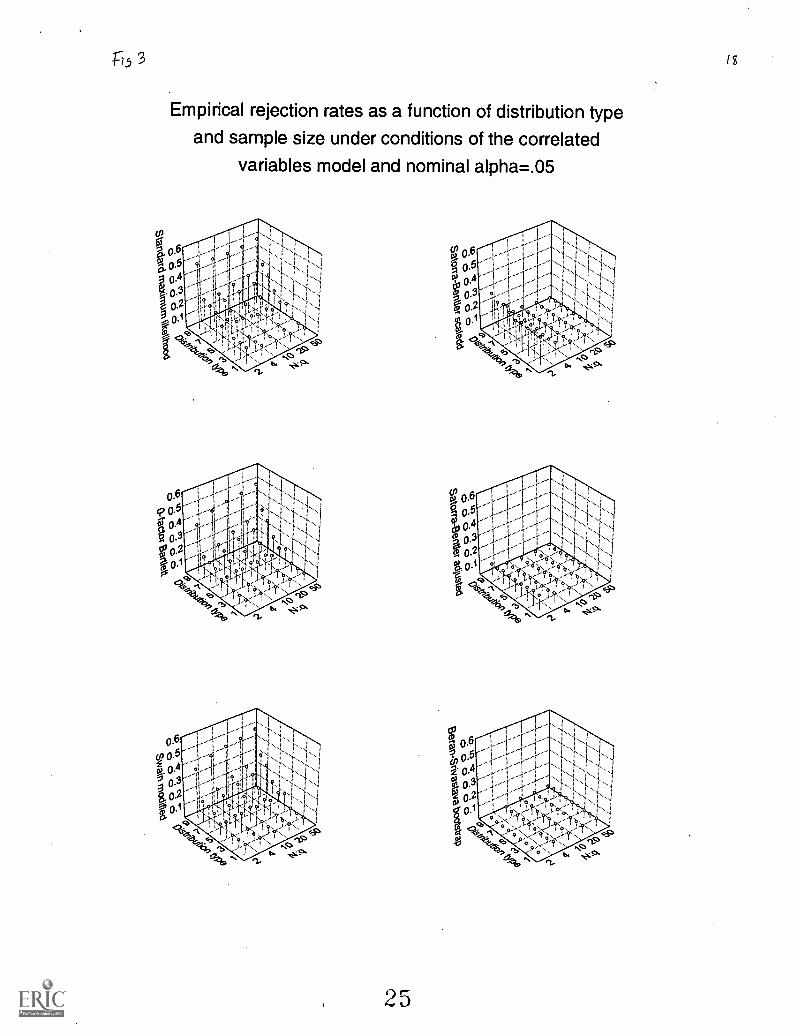
Figures 2-3 depict the influence of Model type, Distribution type and Sample size on the empirical rejectionrates of the 6 procedures at the .05 nominal level. Figure 2 illustrates how for the uncorrelated variables model, theempirical rejection rates of the procedures vary relatively little as a function of distribution type, and vary mainly asa function of sample size. By contrast, Figure 3 illustrates how for the correlated variables model, the empiricalrejection rates of the standard, 0-factor modified, and Swain modified maximum likelihood procedures vary mainlyas a function of distribution type, whereas the Satorra-Bentler scaled and adjusted maximum likelihood proceduresand the Beran-Srivastava Bootstrap maximum likelihood procedure vary mainly as a function of sample size, andrelatively little as a function of distribution type.
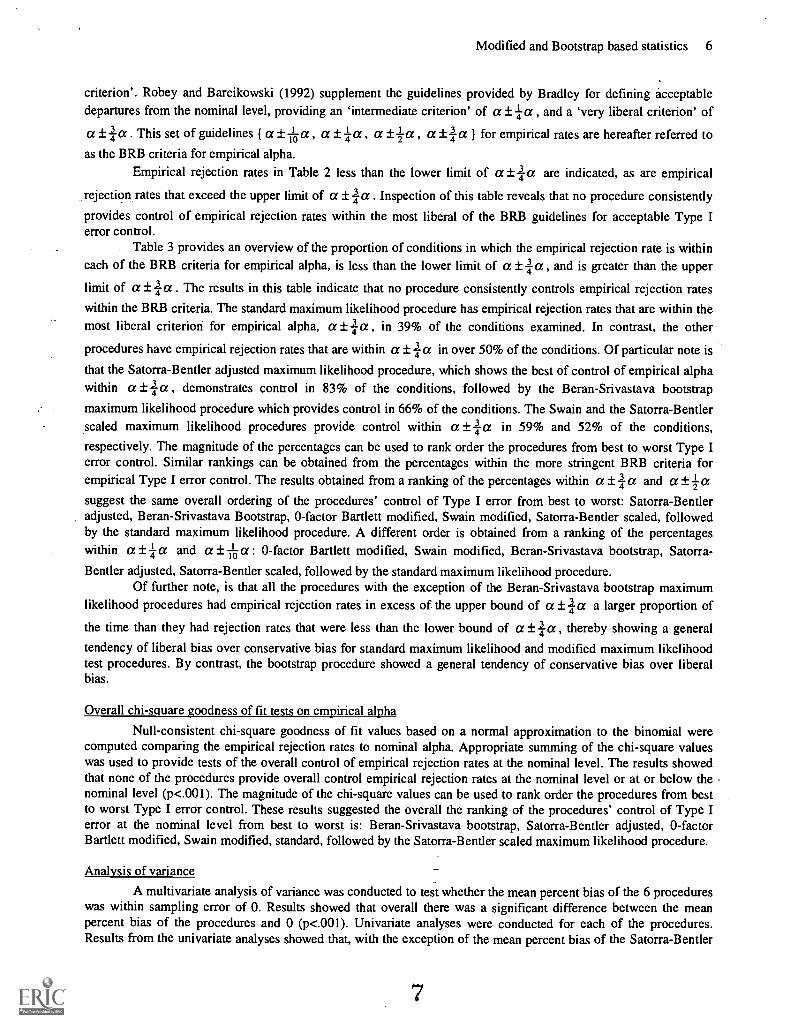
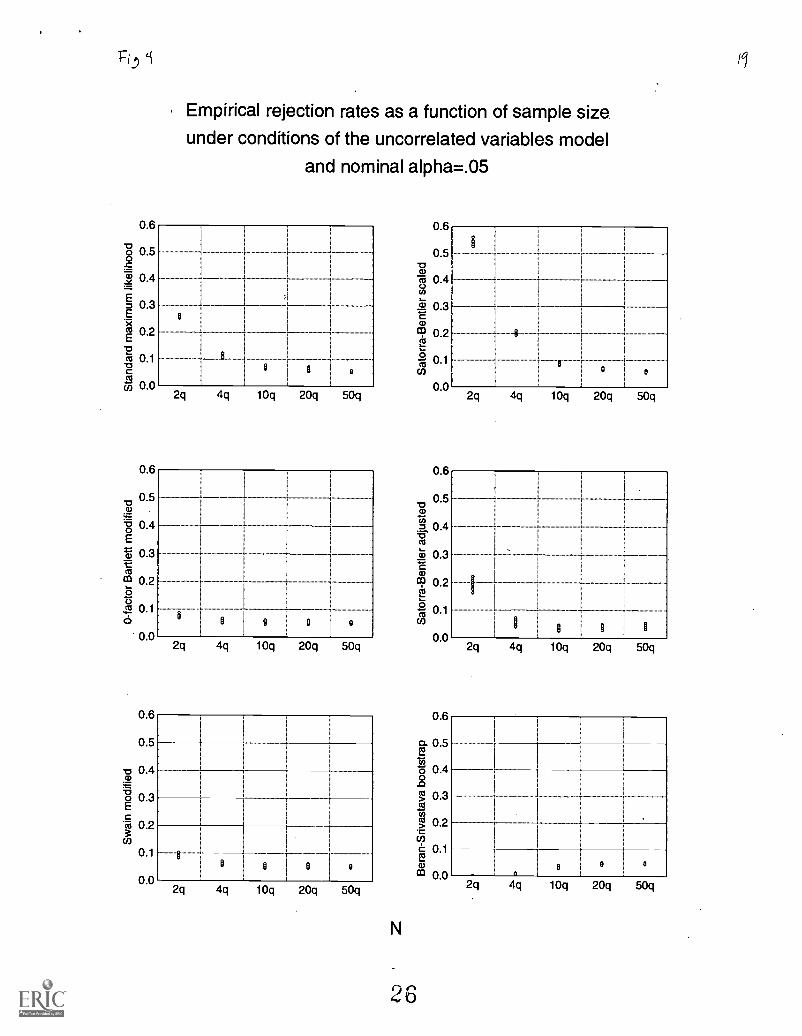
Figure 4 illustrates the empirical rejection rates as a function of sample size under conditions of theuncorrelated variables model and nominal alpha equal to .05. The minimal variability in the empirical rejection ratesfor each procedure at each level of sample size highlights that distribution type is not a major factor under conditionsof the uncorrelated variables model. This figure also illustrates the rapid convergence of empirical rejection rates tothe nominal level for the 0-factor Bartlett and Swain modified maximum likelihood procedures. At all levels ofsample size, the 0-factor Bartlett modified maximum likelihood procedure has the best Type I error control of all theprocedures, followed by the Swain modified maximum likelihood procedure. The Beran-Srivastava bootstrap andSatorra-Bentler adjusted procedures showed better Type I error control than the standard maximum likelihoodprocedure, but not as good as the 0-factor Bartlett modified or the Swain modified procedures.
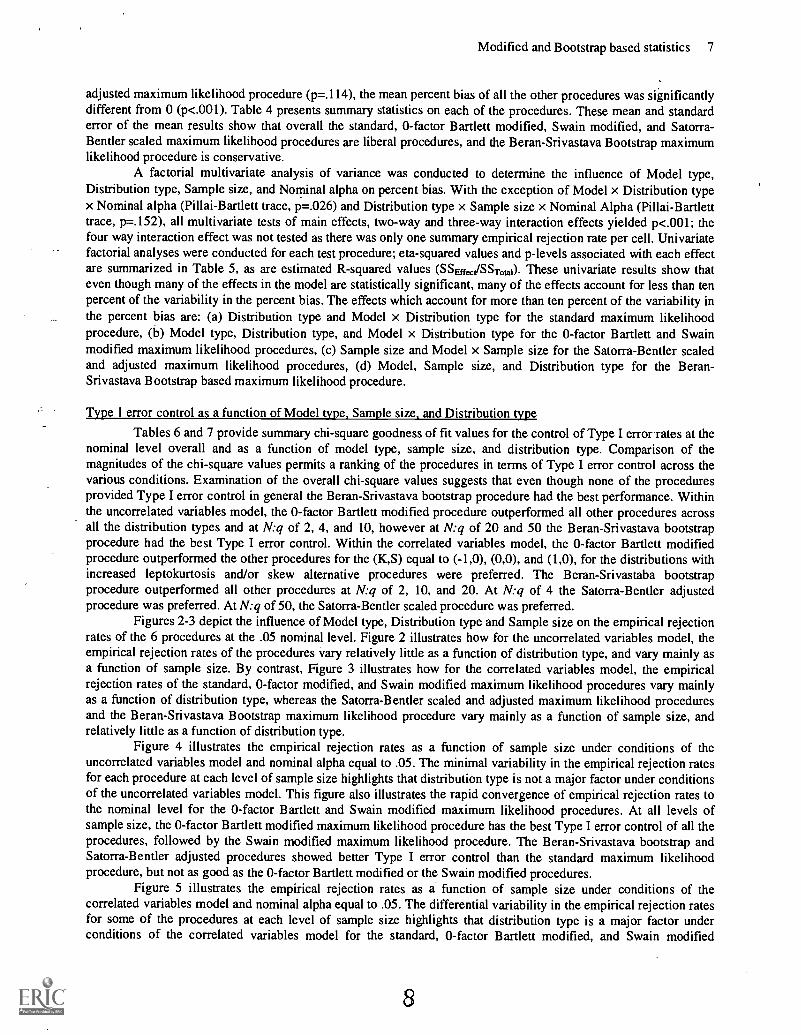
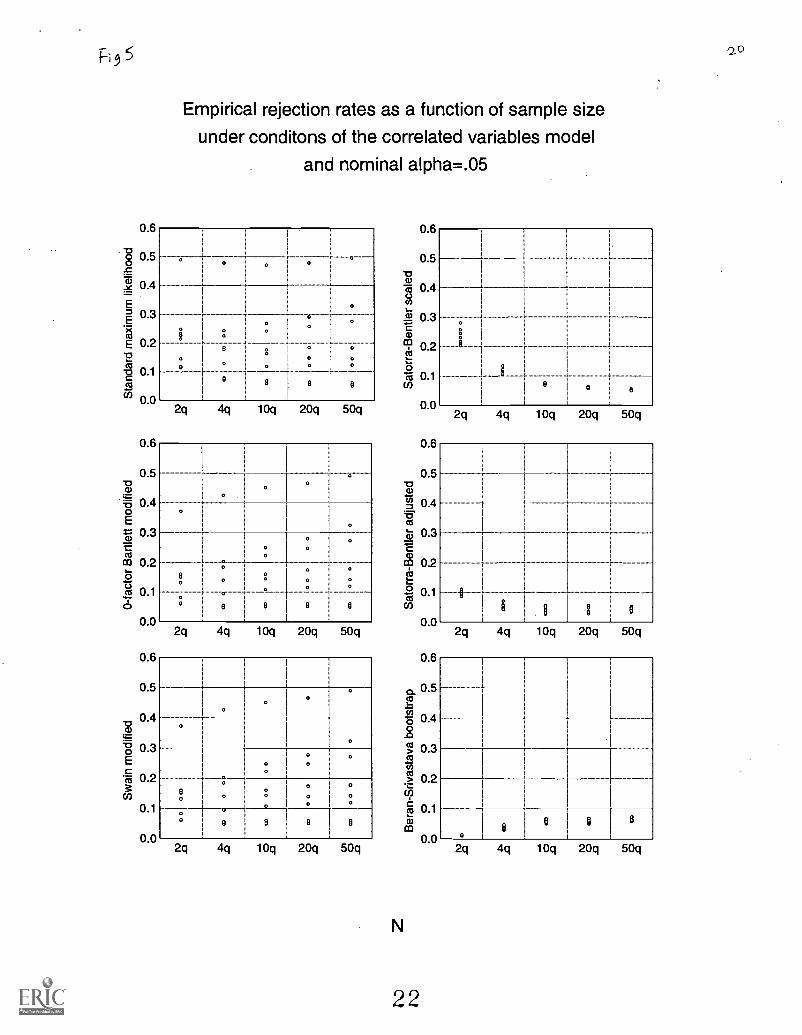
Figure 5 illustrates the empirical rejection rates as a function of sample size under conditions of thecorrelated variables model and nominal alpha equal to .05. The differential variability in the empirical rejection ratesfor some of the procedures at each level of sample size highlights that distribution type is a major factor underconditions of the correlated variables model for the standard, 0-factor Bartlett modified, and Swain modified
8
Modified and Bootstrap based statistics 8
maximum likelihood procedures. This figure also illustrates the rapid convergence of empirical rejection rates to thenominal level for the Satorra-Bentler adjusted and Beran-Srivastava bootstrap procedure. At the lowest level ofsample sizes, these procedures outperformed all the other procedures including the Satorra-Bentler scaled procedurein Type I error control.
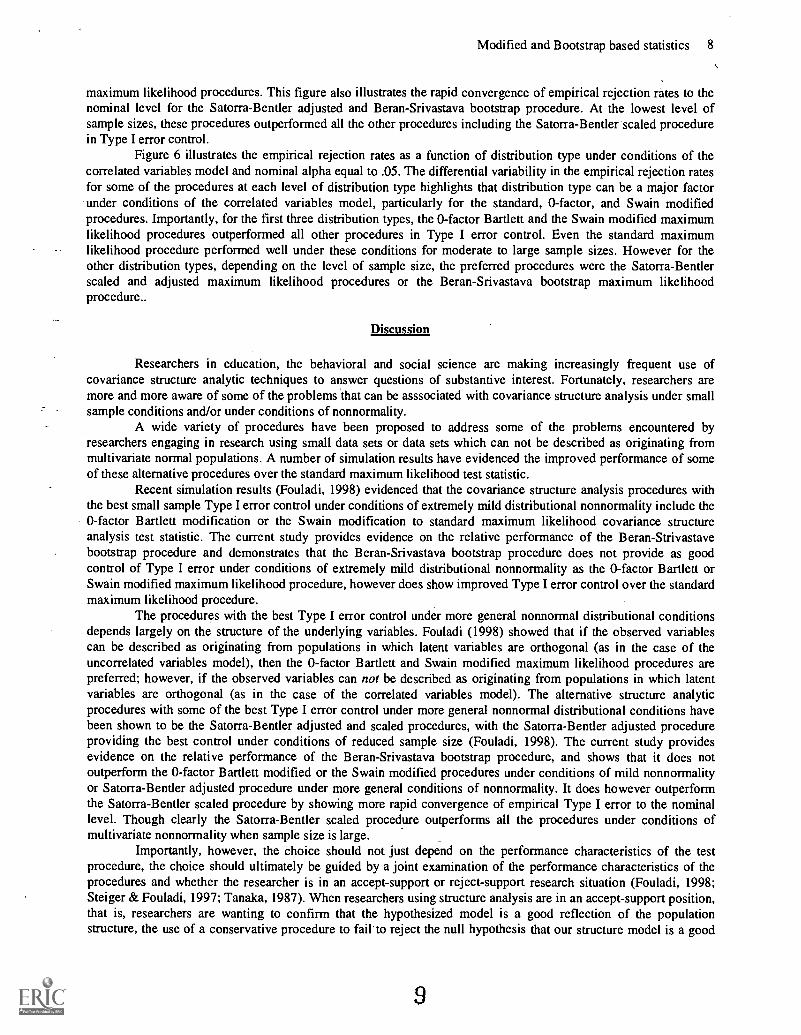
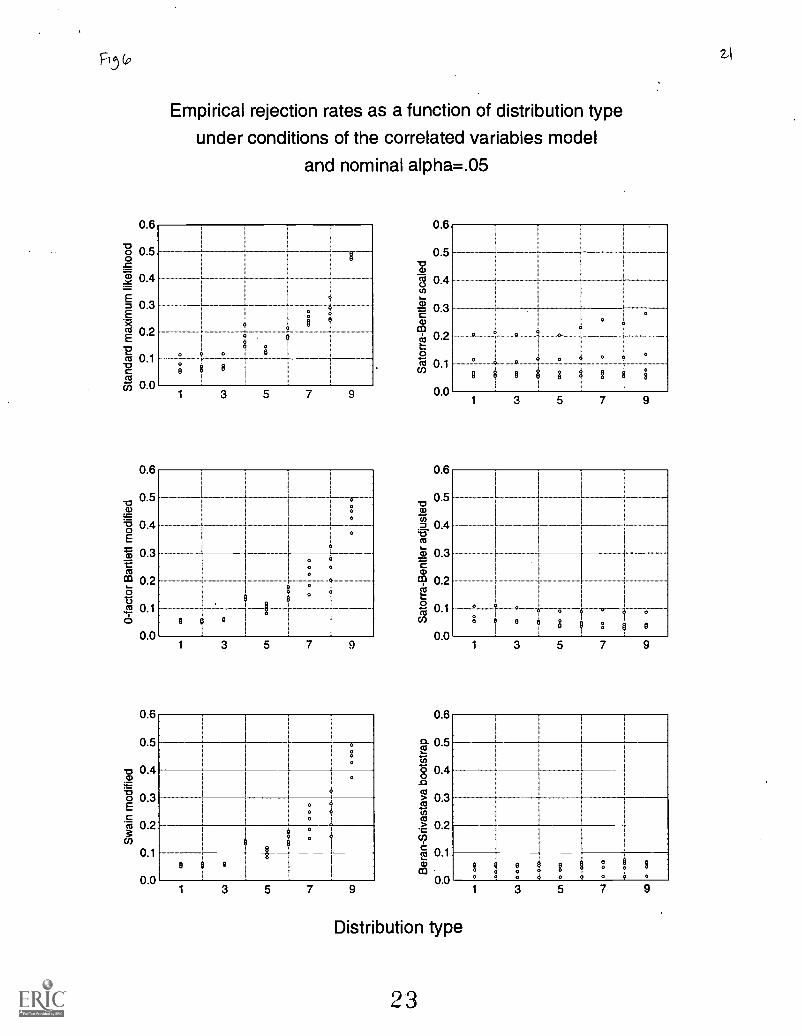
Figure 6 illustrates the empirical rejection rates as a function of distribution type under conditions of thecorrelated variables model and nominal alpha equal to .05. The differential variability in the empirical rejection ratesfor some of the procedures at each level of distribution type highlights that distribution type can be a major factorunder conditions of the correlated variables model, particularly for the standard, 0-factor, and Swain modifiedprocedures. Importantly, for the first three distribution types, the 0-factor Bartlett and the Swain modified maximumlikelihood procedures outperformed all other procedures in Type I error control. Even the standard maximumlikelihood procedure performed well under these conditions for moderate to large sample sizes. However for theother distribution types, depending on the level of sample size, the preferred procedures were the Satorra-Bentlerscaled and adjusted maximum likelihood procedures or the Beran-Srivastava bootstrap maximum likelihoodprocedure..
Discussion
Researchers in education, the behavioral and social science are making increasingly frequent use ofcovariance structure analytic techniques to answer questions of substantive interest. Fortunately, researchers aremore and more aware of some of the problems that can be asssociated with covariance structure analysis under smallsample conditions and/or under conditions of nonnormality.
A wide variety of procedures have been proposed to address some of the problems encountered byresearchers engaging in research using small data sets or data sets which can not be described as originating frommultivariate normal populations. A number of simulation results have evidenced the improved performance of someof these alternative procedures over the standard maximum likelihood test statistic.
Recent simulation results (Fouladi, 1998) evidenced that the covariance structure analysis procedures withthe best small sample Type I error control under conditions of extremely mild distributional nonnormality include the0-factor Bartlett modification or the Swain modification to standard maximum likelihood covariance structureanalysis test statistic. The current study provides evidence on the relative performance of the Beran-Strivastavebootstrap procedure and demonstrates that the Beran-Srivastava bootstrap procedure does not provide as goodcontrol of Type I error under conditions of extremely mild distributional nonnormality as the 0-factor Bartlett orSwain modified maximum likelihood procedure, however does show improved Type I error control over the standardmaximum likelihood procedure.
The procedures with the best Type I error control under more general nonnormal distributional conditionsdepends largely on the structure of the underlying variables. Fouladi (1998) showed that if the observed variablescan be described as originating from populations in which latent variables are orthogonal (as in the case of theuncorrelated variables model), then the 0-factor Bartlett and Swain modified maximum likelihood procedures arepreferred; however, if the observed variables can not be described as originating from populations in which latentvariables are orthogonal (as in the case of the correlated variables model). The alternative structure analyticprocedures with some of the best Type I error control under more general nonnormal distributional conditions havebeen shown to be the Satorra-Bentler adjusted and scaled procedures, with the Satorra-Bentler adjusted procedureproviding the best control under conditions of reduced sample size (Fouladi, 1998). The current study providesevidence on the relative performance of the Beran-Srivastava bootstrap procedure, and shows that it does notoutperform the 0-factor Bartlett modified or the Swain modified procedures under conditions of mild nonnormalityor Satorra-Bentler adjusted procedure under more general conditions of nonnormality. It does however outperformthe Satorra-Bentler scaled procedure by showing more rapid convergence of empirical Type I error to the nominallevel. Though clearly the Satorra- Bentler scaled procedure outperforms all the procedures under conditions ofmultivariate nonnormality when sample size is large.
Importantly, however, the choice should not just depend on the performance characteristics of the testprocedure, the choice should ultimately be guided by a joint examination of the performance characteristics of theprocedures and whether the researcher is in an accept-support or reject-support research situation (Fouladi, 1998;Steiger & Fouladi, 1997; Tanaka, 1987). When researchers using structure analysis are in an accept-support position,that is, researchers are wanting to confirm that the hypothesized model is a good reflection of the populationstructure, the use of a conservative procedure to fail' to reject the null hypothesis that our structure model is a good
9
Modified and Bootstrap based statistics 9
reflection of the population structure is inappropriate. Given the Beran-Srivastava procedure is by-and-large the mostconservative of the available procedures under conditions of multivariate normality and nonnormality, if theresearcher fails to reject the null hypothesis there may be cause for concern, however if the researcher actuallymanages to reject the null hypothesis with the Beran-Srivastava bootstrap procedure, then the researcher can besatisfied that this has not been done under conditions of elevated Type I error.
By contrast, researchers using structure analysis to refute a model are in a reject-support position, that is,the researchers are wanting to disconfirm that a hypothesized model is a good reflection of the population structure.Under these circumstances, the use of a liberal procedure to obtain a rejection the null hypothesis that the structuremodel of interest is a good reflection of the population structure is inappropriate. Thus if a researcher rejects the nullhypothesis using any of the liberally biased maximum likelihood based procedures there may be cause for concern,however, if the researcher actually fails to reject the null hypothesis then the researcher can be satisfied that this hasmore than likely been done under conditions of elevated Type I error.
Final note
At present, none of the structure analytic programs commonly used to conduct confirmatory covariancestructure analyses include modifications such as the k-factor Bartlett multiplier or the Swain multiplier; this is not ofmajor concern, however, since the modified test statistics resultant from the application of these multipliers are easilyobtained. EQS does offer the Satorra-Bentler scaled statistic; however, it does not yet offer the Satorra-Bentleradjusted statistic or the Beran-Srivastava bootstrap procedure. AMOS on the other hand does offers the Beran-Srivastava (Bollen-Stine) bootstrap, however, does not yet offer either of the Satorra-Bentler modified statistics.Even though the other programs do not automatically implement the Beran-Srivastava bootstrap procedure, thoseprograms which enable standard bootstrapping of non-transformed data can be used to obtain proper tests of modelfit with some effort.
Author Note
Rachel T. Fouladi (Ph.D., University of British Columbia, 1996) is Assistant Professor in Research Methodologyand Data Analysis at the Department of Educational Psychology at the University of Texas at Austin.Correspondence concerning this article should be addressed to the author at: University of Texas at Austin, Dept ofEducational Psychology, SZB 504, Austin, TX 78712-1296 U.S.A. Phone 512-471-4155, Fax 512-471-1288, [email protected], http://www.edb.utexas.edu/faculty/fouladi/.
References
Anderson, J.C., & Gerbing, D.W. (1984). The effect of sampling error on convergence, improper solutions, andgoodness of fit indices for maximum likelihood common factor analysis. Psychometrika, 49, 155-173.
Anderson, T.W., & Amemiya, Y. (1985). The asymptotic normal distribution of estimators in factor analysis undergeneral conditions. Technical Report No. 12, prepared under NSF grant DMS 82-19748, Econometricworkshop, Stanford University.
Arbuckle, J. (1996). AMOS-Analysis of moment structures. Chicago, IL: Smallwaters Corporation.
Bearden, W.O., Sharma, S., & Teel, J.R. (1982). Sample size effects on chi-square and other statistics ussed inevaluating causal models. Journal of Marketing Research, 19, 425-530.
Bentler, P.M. (1995) EQS structural equations manual. Encino, CA: Multivariate Software.
Bentler, P.M., & Dijkstra, T. (1985). Efficient estimation via linearization in structure models. In Multivariateanalysis VI, ed. P.R. Krishnaiah, pp. 9-42, Amsterdam, North Holland.
Beran, R., & Srivastava, M.S. (1985). Bootstrap tests and confidence regions for functions of a covariance matrix.The Annals of Statistics, 13, 95-115.
10

Modified and Bootstrap based statistics 10
Bollen, K.A., & Stine, R. (1990). Direct and indirect effects: Classical and bootstrap estimates of variability. InSociological methodology 1990, C.C. Clogg, ed., pp. 115-140. Oxford: Basil-Blackwell.
Boomsma, A. (1983). On the robustness of LISREL (maximum likelihood estimation) against small sample size andnonnormality. Unpublished doctoral dissertation, University of Groningen.
Bradley, J.V. (1978). Robustness? British Journal of Mathematical and Statistical Psychology, 34, 144-152.
Browne, M.W. (1982). Covariance structures. In Topics in applied multivariate analysis, ed. D.M. Hawkins, pp. 72-141. Cambridge: Cambridge University Press.
Browne, M.W., & Shapiro, A. (1987) Robustness of normal theory methods in analysis of linear latent variatemodels. British Journal of Mathematical and Statistical Psychology, 41, 193-208.
Browne. M.W. (1984). Asymptotically distribution free methods for the analysis of covariance structures. BritishJournal of Mathematical and Statistical Psychology, 37, 62-83.
Chou, C.P., & Bentler, P.M. (1995). Estimates and tests in structural equation modeling. In Structural equationmodeling: Concepts, issues, and applications, R. Hoyle, ed., pp. 36-55. Thousand Oaks, CA: Sage.
Chou, C.P., Bentler, P.M., & Satorra, A. (1991). Scaled test statistics and robust standard errors for nonnormal datain covariance structure analysis: A Monte Carlo study. British Journal of Mathematical and StatisticalPsychology, 44, 347-357.
Curran, P.J., West, S.G., & Finch, J.F. (1996). The robustness of test statistics to nonnormality and specificationerror in confirmatory factor analysis. Psychological Methods, 1.
Fleishman, A.I. (1978). A method for simulating nonnormal distributions. Psychometrika, 43, 521-532.
Fouladi, R.T. (1996). A study of procedures to examine correlation pattern hypotheses under conditions ofmultivariate normality and nonnormality. Ph.D. dissertation, University of British Columbia, Vancouver,B.C., Canada.
Fouladi, R.T. (1997a). The use of modified covariance and correlation structure analysis procedures underconditions of multivariate normality: Controlling Type I error. Presented at the International Symposium onContemporary Multivariate Analysis and Its Application, May 19-22, 1997, Hong Kong.
Fouladi, R.T. (1997b). Type I error control of some covariance structure analysis techniques under conditions ofmultivariate non-normality. Computing Science and Statistics, 29, 178-186.
Fouladi, R.T. (1997c). Model Fit in Exploratory and Confirmatory Factor Analysis and Structural EquationModeling under Conditions of Reduced Sample Size: Test Statistics, Point Estimates, and ConfidenceIntervals. Manuscript submitted for publication.
Fouladi, R.T. (1998). Performance of modified test statistics in covariance and correlation structure analysis underconditions of multivariate non-normality. Structural Equation Modeling. Manuscript accepted forpublication.
Henly, S.J. (1993). Robustness of some estimators for the analysis of covariance structures. British Journal ofMathematical and Statistical Psychology, 46, 313-338.
Hu, L., & Bentler, P.M. (1995). Evaluating model fit. In Structural equation modeling: Concepts, issues, andapplications, R. Hoyle (Ed.), pp. 36-55. Thousand oaks, CA: Sage.
Hu, L., Bentler, P.M., & Kano, Y. (1992). Can test statistics in covariance structure analysis be trusted?Psychological Bulletin, 112, 341-362.
Ichikawa, M., & Konishi, S. (1995). Application of the bootstrap methods in factor analysis. Psychometrika, 1, 77-93.
Robey, R.R., & Barcikowski, R.S. (1992). Type I error and the number of iterations in Monte Carlo studies ofrobustness. British Journal of Mathematical and Statistical Psychology, 45, 283-288.
1 1
Modified and Bootstrap based statistics 11
Satorra, A. (1989). Alternative test criteria in covariance structure analysis: a unified approach. Psychometrika, 54,131-151.
Satorra, A., & Bent ler, P.M. (1986). Some robustness properties of goodness of fit statistics in covariance structureanalysis. American Statistical Association 1986 Proceedings of the Business and Economics Sections (pp.549-554). Alexandria, VA: American Statistical Association.
Satorra, A., & Bentler, P.M. (1988). Scaling corrections for chi-square statistics in covariance structure analysis.American Statistical Association 1988 Proceedings of the Business and Economics Sections (pp. 308-313).Alexandria, VA: American Statistical Association.
Satorra, A., & Saris, W.E. (1985). Power of the likelihood ratio test in covariance structure analysis. Psychometrika,50, 83-90.
Shapiro, A. (1983). Asymptotic distribution theory in the analysis of covariance structures. South African StatisticalJournal, 17, 33-81.
Shapiro, A. (1986). Asymptotic theory of over parametrized structure models. Journal of American StatisticalAssociation.
Steiger, J.H. (1995). Structural equation modeling. In Statistica for Windows (Computer program manual). Tulsa,OK: Statsoft, Inc.
Steiger, J.H., & Fouladi, R.T. (1997). Noncentrality interval estimation and the evaluation of statistical models. In L.Harlow, S. Mulaik, & J.H. Steiger (Eds.) What if there were no significance tests. New Jersey: LawrenceErlbaum.
Steiger, J.H., Shapiro, A., & Browne, M.W. (1985). On the multivariate asymptotic distribution of sequential chi-square statistics. Psychometrika, 50, 253-264.
Swain, A.J. (1975). Analysis of parametric structures for variance matrices. Ph.D. dissertation, University ofAdelaide.
Tanaka, J.S. (1987). How big is big enough? Sample size and goodness of fit in structural equation models withlatent variables. Child Development, 58, 134-156.
Vale, C.D., & Maurelli, V.A. (1983). Simulating multivariate nonnormal distributions. Psychometrika, 48, 465-571.
Wolfram Research, Inc. (1996). Mathematica: Win Professiional. Version 3.0.1. Champaign, IL: Wolfram Research,Inc.
Yung, Y. -F., & Bentler, P. M. (1994 ). Bootstrap-corrected ADF test statistics in covariance structure analysis.British Journal of Mathematical and Statistical Psychology, 47, 63-84.
Yung, Y. -F., & Bentler, P. M. (1996 ). Bootstrapping techniques in analysis of mean and covariance structures. InG. A. Marcoulides & R. E. Schumacker (Eds.), Advanced structural equation modeling techniques (pp.195-226). Hillsdale, NJ: LEA.
Tables and Figures
Table 1: Possible combinations of univariate kurtosis and skew
Kurtosis Skew0 1 2
-1 Distribution 10 Distribution 21 Distribution 3 Distribution 43 Distribution 5 Distribution 66 Distribution 7 Distribution 8 Distribution 9
12
Modified and Bootstrap based statistics 12
Table 2: Empirical rejection rates as a function of Model type (uncorrelated variables= 1, correlated variables=2), sample size(N) , Distribution type as specified by the marginal kurtoses (Kul and skew (Sk), and Nominal alpha.
Model N KuAlpha=.05 Alpha=.01
Sk ML Bart Swain Scl Adj Boot ML Bart Swain Scl Adj Boot
1 2q -1 0 .2514+ .0730 .0838 .5426+ .2118+ .0000- .1008+ .0186+ .0246+ .3208+ .0420+ .0000-0 0 .2624+ .0708 .0856 .5294+ .2204+ .0000- .1088+ .0150 .0206+ .3308+ .0420+ .0000-1 0 .2556+ .0708 .0890+ .5382+ .2064+ .0000- .1056+ .0182+ .0264+ .3296+ .0352+ .0000-1 1 .2510+ .0672 .0814 .5410+ .1976+ .0000- .1024+ .0140 .0208+ .3214+ .0350+ .0000-3 0 .2562+ .0730 .0860 .5448+ .1916+ .0000- .1042+ .0192+ .0244+ .3218+ .0322+ .0000-3 1 .2520+ .0686 .0840 .5234+ .1818+ .0000- .1032+ .0176+ .0240+ .3152+ .0308+ .0000-6 0 .2644+ .0784 .0936+ .5580+ .1782+ .0000- .1132+ .0182+ .0234+ .3236+ .0288+ .0000-6 1 .2564+ .0740 .0896+ .5378+ .1620+ .0000- .1090+ .0190+ .0232+ .3110+ .0238+ .0000-6 2 .2652+ .0870 .1016+ .5434+ .1744+ .0000- .1216+ .0242+ .0308+ .3182+ .0284+ .0000 -
4q -1 0 .1106+ .0490 .0558 .2094+ .0716 .0064- .0272+ .0096 .0100 .0754+ .0062 .0000 -0 0 .1074+ .0530 .0570 .1978+ .0666 .0102- .0332+ .0120 .0128 .0704+ .0086 .0012-1 0 .1094+ .0558 .0620 .1998+ .0612 .0074- .0322+ .0100 .0120 .0712+ .0070 .0000 -1 1 .1054+ .0500 .0540 .2064+ .0626 .0074- .0284+ .0102 .0114 .0700+ .0068 .0002-3 0 .1082+ .0516 .0574 .1980+ .0502 .0078- .0296+ .0124 .0134 .0674+ .0036 .0002-3 1 .1202+ .0590 .0648 .2084+ .0572 .0078- .0340+ .0128 .0142 .0720+ .0052 .0002-6 0 .1224+ .0610 .0650 .1972+ .0434 .0082- .0376+ .0158 .0172 .0660+ .0024- .0000-6 1 .1196+ .0580 .0632 .1944+ .0444 .0092- .0376+ .0164 .0184+ .0638+ .0038 .0002-6 2 .1212+ .0664 .0704 .1914+ .0392 .0072- .0430+ .0200+ .0222+ .0588+ .0040 .0002 -
10q -1 0 .0702 .0500 .0514 .0952+ .0468 .0388 .0166 .0112 .0124 .0248+ .0072 .00680 0 .0628 .0450 .0458 .0928+ .0434 .0374 .0142 .0084 .0090 .0226+ .0058 .00461 0 .0696 .0456 .0482 .0914+ .0372 .0346 .0134 .0088 .0094 .0194+ .0036 .00461 1 .0662 .0502 .0504 .0880+ .0420 .0380 .0170 .0114 .0122 .0242+ .0058 .00683 0 .0720 .0528 .0554 .0844 .0362 .0390 .0182+ .0116 .0126 .0218+ .0030 .00463 1 .0758 .0540 .0554 .0898+ .0360 .0382 .0156 .0108 .0118 .0224+ .0030 .00426 0 .0772 .0598 .0608 .0884+ .0308 .0398 .0218+ .0152 .0158 .0260+ .0030 .00706 1 .0694 .0548 .0560 .0820 .0250 .0282 .0202+ .0146 .0150 .0170 .0030 .00326 2 .0772 .0606 .0618 .0844 .0266 .0310 .0236+ .0166 .0166 .0190+ .0024- .0038
20q -1 0 .0568 .0492 .0504 .0674 .0460 .0464 .0130 .0106 .0110 .0160 .0086 .01000 0 .0576 .0498 .0504 .0736 .0486 .0488 .0140 .0116 .0118 .0154 .0078 .00881 0 .0608 .0518 .0534 .0694 .0448 .0504 .0144 .0118 .0120 .0154 .0066 .01021 1 .0532 .0454 .0466 .0614 .0358 .0412 .0112 .0092 .0094 .0124 .0042 .00743 0 .0666 .0568 .0576 .0700 .0360 .0486 .0156 .0124 .0126 .0156 .0044 .00923 1 .0568 .0488 .0498 .0630 .0328 .0440 .0086 .0078 .0080 .0110 .0036 .00726 0 .0590 .0508 .0514 .0648 .0308 .0466 .0156 .0130 .0134 .0130 .0028 .00606 1 .0706 .0608 .0618 .0714 .0322 .0482 .0164 .0136 .0138 .0142 .0032 .00846 2 .0662 .0586 .0596 .0680 .0276 .0416 .0186+ .0156 .0158 .0124 .0032 .0058
50q -1 0 .0584 .0564 .0568 .0622 .0536 .0490 .0118 .0108 .0108 .0134 .0090 .01360 0 .0518 .0468 .0472 .0556 .0456 .0436 .0114 .0106 .0106 .0114 .0074 .01001 0 .0546 .0520 .0528 .0574 .0480 .0480 .0124 .0114 .0114 .0122 .0074 .01241 1 .0540 .0500 .0502 .0560 .0446 .0508 .0106 .0100 .0100 .0110 .0070 .01003 0 .0564 .0502 .0508 .0608 .0408 .0502 .0104 .0098 .0098 .0098 .0054 .01023 1 .0526 .0500 .0500 .0556 .0406 .0482 .0112 .0100 .0100 .0110 .0052 .01066 0 .0574 .0540 .0542 .0534 .0354 .0490 .0144 .0130 .0130 .0100 .0050 .01146 1 .0582 .0540 .0544 .0572 .0384 .0482- .0154 .0146 .0148 .0124 .0054 .01266 2 .0578 .0556 .0558 .0562 .0318 .0464 .0126 .0112 .0116 .0106 .0036 .0104
continued
Mod
ifie
d an
d B
oots
trap
bas
ed s
tatis
tics
14
Tab
le 3
: Pro
port
ion
of e
mpi
rica
l rej
ectio
n ra
tes
with
in e
ach
BR
B c
rite
ria
for
empi
rica
lT
able
4: S
umm
ary
stat
istic
s fo
r th
e pe
rcen
t bia
s (B
%)
resu
lts.
alph
a.
a± !
aio
a+la
- 2
a±ia
less
than
low
er li
mit
of a
±
grea
ter
than
low
er li
mit
of a
tia
ML
Bar
t Sw
ain
Scl
Adj
Boo
tM
LB
art S
wai
nSc
lA
djB
oot
Min
imum
-14
-22
-20
-14
-76
-100
.056
.256
.206
.100
.150
.194
Max
imum
2848
2798
2798
3208
341
126
.189
.472
.433
.300
.328
.411
Med
ian
142
3440
68-1
8-1
7M
ean
350
212
219
343
11-2
5.3
22.5
78.5
28.4
39.6
61.6
06St
anda
rd e
rror
of
the
mea
n39
3333
527
4.3
94.6
28.5
89.5
22.8
33.6
61St
anda
rd d
evia
tion
520
449
448
692
9456
.000
.000
.000
.000
.011
.289
.606
.372
.411
.478
.156
.050
Tab
le 5
Fac
tori
al A
naly
sis
of V
aria
nce
resu
lts o
n pe
rcen
t bia
s (B
%1
Eff
ect
dfE
ffec
t
Eta
- s
quar
edR
- s
quar
eddf
E.
ML
Bar
tSw
ain
Scl
Adj
Boo
tM
LB
art S
wai
nSc
lA
djB
oot
Mod
el1
32.9
88 a
.980
a.9
80 a
.998
a.9
65 a
.979
a.0
60.1
44.1
34.0
57.0
25.1
43N
432
.986
a.5
86 a
.473
a1.
000
a.9
99 a
.995
a.0
52.0
04.0
03.4
03.6
96.5
72D
istr
ibut
ion
832
.996
a.9
88 a
.988
a.4
22 c
.982
a.5
32 a
.188
.239
.238
.000
.051
.143
Alp
ha1
32.9
87 a
.921
a.9
28 a
.997
a.9
69 a
.161
c.0
56.0
35.0
36.0
36.0
29.0
01M
odel
x N
432
.979
a.7
79 a
.826
a.9
99 a
.994
a.8
86 a
.033
.010
.013
.138
.161
.024
Mod
el x
Dis
trib
utio
n8
32.9
96 a
.986
a.9
87 a
.684
a.2
16.6
92 a
.164
.214
.213
.000
.000
.007
N x
Dis
trib
utio
n32
32.7
70 a
.745
a.7
52 b
.775
a.9
02 a
.658
c.0
02.0
09.0
09.0
00.0
08.0
06M
odel
x A
lpha
132
.952
a.9
05 a
.905
a.9
93 a
.509
a.6
44 a
.014
.028
.027
.017
.001
.006
N x
Alp
ha4
32.9
19 a
.349
b.2
89 c
.999
a.7
88 a
.922
a.0
08.0
02.0
01.1
00.0
03.0
37D
istr
ibut
ion
x A
lpha
832
.987
a.9
55 a
.955
a.3
57.6
16 a
.228
.053
.060
.060
.001
.001
.001
Mod
el x
N x
Dis
trib
utio
n32
32.8
13 a
.764
a.7
66 a
.783
a.8
67 a
.732
a.0
03.0
10.0
09.0
00.0
06.0
08M
odel
x N
x A
lpha
432
.894
a.4
47 a
.498
a.9
98 a
.341
b.8
10 a
.006
.002
.003
.048
.000
.013
Mod
el x
Dis
trib
utio
n x
Alp
ha8
32.9
84 a
.949
a.9
51 a
.255
.358
.232
.045
.055
.054
.000
.001
.001
N x
Dis
trib
utio
n x
Alp
ha32
32.4
29.4
85.4
96.4
78.6
96 c
.383
.001
.003
.003
.000
.002
.002
Mod
el x
N x
Dis
trib
utio
n x
Alp
ha
Not
e: a
=p<
.001
, b=
p<.0
1, c
=p<
.05
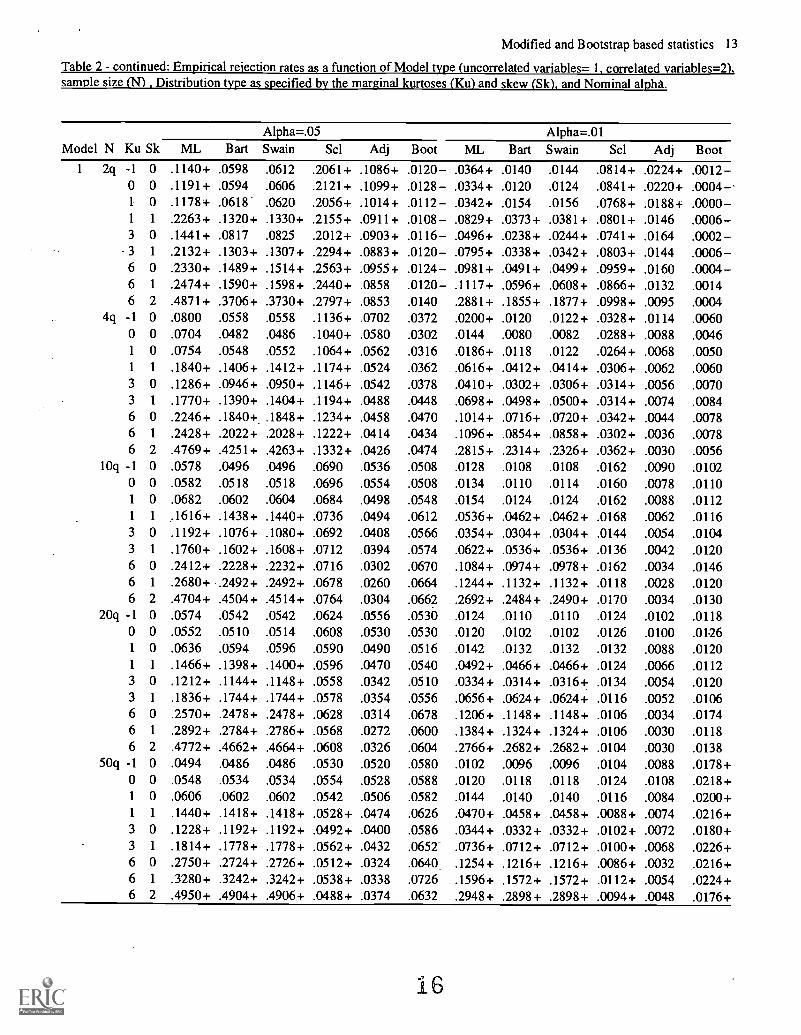
Modified and Bootstrap based statistics 13
Table 2 - continued: Empirical rejection rates as a function of Model type (uncorrelated variables= 1, correlated variables=2),sample size (N) , Distribution type as specified by the marginal kurtoses (Ku) and skew (Sk), and Nominal alpha.
Model N KuAlpha=.05 Alpha=.01
Sk ML Bart Swain Scl Adj Boot ML Bart Swain Scl Adj Boot
1 2q -1 0 .1140+ .0598 .0612 .2061+ .1086+ .0120- .0364+ .0140 .0144 .0814+ .0224+ .0012-0 0 .1191+ .0594 .0606 .2121+ .1099+ .0128- .0334+ .0120 .0124 .0841+ .0220+ .0004 -1 0 .1178+ .0618 .0620 .2056+ .1014+ .0112- .0342+ .0154 .0156 .0768+ .0188+ .0000-1 1 .2263+ .1320+ .1330+ .2155+ .0911+ .0108- .0829+ .0373+ .0381+ .0801+ .0146 .0006-3 0 .1441+ .0817 .0825 .2012+ .0903+ .0116- .0496+ .0238+ .0244+ .0741+ .0164 .0002-3 1 .2132+ .1303+ .1307+ .2294+ .0883+ .0120- .0795+ .0338+ .0342+ .0803+ .0144 .0006-6 0 .2330+ .1489+ .1514+ .2563+ .0955+ .0124- .0981+ .0491+ .0499+ .0959+ .0160 .0004-6 1 .2474+ .1590+ .1598+ .2440+ .0858 .0120- .1117+ .0596+ .0608+ .0866+ .0132 .00146 2 .4871+ .3706+ .3730+ .2797+ .0853 .0140 .2881+ .1855+ .1877+ .0998+ .0095 .0004
4q -1 0 .0800 .0558 .0558 .1136+ .0702 .0372 .0200+ .0120 .0122+ .0328+ .0114 .00600 0 .0704 .0482 .0486 .1040+ .0580 .0302 .0144 .0080 .0082 .0288+ .0088 .00461 0 .0754 .0548 .0552 .1064+ .0562 .0316 .0186+ .0118 .0122 .0264+ .0068 .00501 1 .1840+ .1406+ .1412+ .1174+ .0524 .0362 .0616+ .0412+ .0414+ .0306+ .0062 .00603 0 .1286+ .0946+ .0950+ .1146+ .0542 .0378 .0410+ .0302+ .0306+ .0314+ .0056 .00703 1 .1770+ .1390+ .1404+ .1194+ .0488 .0448 .0698+ .0498+ .0500+ .0314+ .0074 .00846 0 .2246+ .1840+. .1848+ .1234+ .0458 .0470 .1014+ .0716+ .0720+ .0342+ .0044 .00786 1 .2428+ .2022+ .2028+ .1222+ .0414 .0434 .1096+ .0854+ .0858+ .0302+ .0036 .00786 2 .4769+ .4251+ .4263+ .1332+ .0426 .0474 .2815+ .2314+ .2326+ .0362+ .0030 .0056
10q -1 0 .0578 .0496 .0496 .0690 .0536 .0508 .0128 .0108 .0108 .0162 .0090 .01020 0 .0582 .0518 .0518 .0696 .0554 .0508 .0134 .0110 .0114 .0160 .0078 .01101 0 .0682 .0602 .0604 .0684 .0498 .0548 .0154 .0124 .0124 .0162 .0088 .01121 1 .1616+ .1438+ .1440+ .0736 .0494 .0612 .0536+ .0462+ .0462+ .0168 .0062 .01163 0 .1192+ .1076+ .1080+ .0692 .0408 .0566 .0354+ .0304+ .0304+ .0144 .0054 .01043 1 .1760+ .1602+ .1608+ .0712 .0394 .0574 .0622+ .0536+ .0536+ .0136 .0042 .01206 0 .2412+ .2228+ .2232+ .0716 .0302 .0670 .1084+ .0974+ .0978+ .0162 .0034 .01466 1 .2680+ .2492+ .2492+ .0678 .0260 .0664 .1244+ .1132+ .1132+ .0118 .0028 .01206 2 .4704+ .4504+ .4514+ .0764 .0304 .0662 .2692+ .2484+ .2490+ .0170 .0034 .0130
20q -1 0 .0574 .0542 .0542 .0624 .0556 .0530 .0124 .0110 .0110 .0124 .0102 .01180 0 .0552 .0510 .0514 .0608 .0530 .0530 .0120 .0102 .0102 .0126 .0100 .01.261 0 .0636 .0594 .0596 .0590 .0490 .0516 .0142 .0132 .0132 .0132 .0088 .01201 1 .1466+ .1398+ .1400+ .0596 .0470 .0540 .0492+ .0466+ .0466+ .0124 .0066 .01123 0 .1212+ .1144+ .1148+ .0558 .0342 .0510 .0334+ .0314+ .0316+ .0134 .0054 .01203 1 .1836+ .1744+ .1744+ .0578 .0354 .0556 .0656+ .0624+ .0624+ .0116 .0052 .01066 0 .2570+ .2478+ .2478+ .0628 .0314 .0678 .1206+ .1148+ .1148+ .0106 .0034 .01746 1 .2892+ .2784+ .2786+ .0568 .0272 .0600 .1384+ .1324+ .1324+ .0106 .0030 .01186 2 .4772+ .4662+ .4664+ .0608 .0326 .0604 .2766+ .2682+ .2682+ .0104 .0030 .0138
50q -1 0 .0494 .0486 .0486 .0530 .0520 .0580 .0102 .0096 .0096 .0104 .0088 .0178+0 0 .0548 .0534 .0534 .0554 .0528 .0588 .0120 .0118 .0118 .0124 .0108 .0218+1 0 .0606 .0602 .0602 .0542 .0506 .0582 .0144 .0140 .0140 .0116 .0084 .0200+1 1 .1440+ .1418+ .1418+ .0528+ .0474 .0626 .0470+ .0458+ .0458+ .0088+ .0074 .0216+3 0 .1228+ .1192+ .1192+ .0492+ .0400 .0586 .0344+ .0332+ .0332+ .0102+ .0072 .0180+3 1 .1814+ .1778+ .1778+ .0562+ .0432 .0652- .0736+ .0712+ .0712+ .0100+ .0068 .0226+6 0 .2750+ .2724+ .2726+ .0512+ .0324 .0640 .1254+ .1216+ .1216+ .0086+ .0032 .0216+6 1 .3280+ .3242+ .3242+ .0538+ .0338 .0726 .1596+ .1572+ .1572+ .0112+ .0054 .0224+6 2 .4950+ .4904+ .4906+ .0488+ .0374 .0632 .2948+ .2898+ .2898+ .0094+ .0048 .0176+
16
Modified and Bootstrap based statistics 15
Table 6: Summary chi-square goodness of fit tests overall and as function of Model type (uncorrelated variables=1, correlatedvariables=2) and Sample size (N).
Model N df ML Bart Swain Scl Adj Boot
1 2q 18 84199.00 a 900.29 a 2381.16 a 668269.13 a 21882.61 a 2822.97 a4q 18 6543.99 a 158.35 a 298.90 a 37004.46 a 250.75 a 2108.93 a10q 18 772.22 a 83.24 a 101.99 a 2099.38 a 403.18 a 315.24 a20q 18 252.84 a 63.51 a 73.01 a 392.31 a 338.38 a 49.39 a50q 18 70.39 a 29.96 c 33.02 c 68.21 a 174.77 a 21.20
Subtotal 90 91838.44 a 1235.35 a 2888.08 a 707833.49 a 23049.70 a 5317.73 a
2 2q 18 91209.86 a 32974.99 a 33774.34 a 55968.64 a 2259.40 a 1766.70 a4q 18 80941.55 a 52100.25 a 52627.13 a 6439.12 a 160.38 a 202.98 a10q 18 79107.29 a 66537.91 a 66840.63 a 557.13 a 276.38 a 134.37 a20q 18 86195.56 a 79853.36 a 79894.58 a 113.01 a 277.43 a 109.10 a50q 18 99669.53 a 96253.08 a 96280.99 a 19.57 156.92 a 670.33 a
Subtotal 90 437123.78 a 327719.58 a 329417.67 a 63097.46 a 3130.50 a 2883.48 a
Grand Total 180 528962.22 a 328954.93 a 332305.76 a 770930.95 a 26180.20 a 8201.21 aNote: a=p<.001, b=p<.01, c=p<.05
Table 7: Summary chi-square goodness of fit tests overall and as function of Model type (uncorrelated variables=1, correlatedvariables=2) and Distribution type.
Model Ku Sk df ML Bart Swain Scl Adj Boot
1 -1 0 10 9053.05 a 98.84 a 240.28 a 79560.77 a 3338.87 a 590.66 a0 0 10 10339.14 a 67.62 a 204.29 a 80660.73 a 3625.20 a 556.14 a1 0 10 9759.24 a 89.20 a 318.70 a 81217.64 a 2963.77 a 598.25 a1 1 10 9114.84 a 42.79 a 169.23 a 79019.42 a 2692.25 a 585.16 a3 0 10 9641.98 a 111.53 a 268.82 a 79106.73 a 2481.05 a 577.64 a3 1 10 9585.00 a 82.68 a 259.37 a 75483.25 a 2182.29 a 589.54 a6 0 10 11342.18 a 183.20 a 382.37 a 81011.80 a 2105.89 a 573.98 a6 1 10 10508.27 a 173.27 a 359.09 a 74660.06 a 1611.41 a 616.16 a6 2 10 12494.74 a 386.24 a 685.93 a 77113.08 a 2048.97 a 630.19 aSubtotal 90 91838.44 a 1235.35 a 2888.08 a 707833.49 a 23049.70 a 5317.73 a
2 -1 0 10 947.76 a 26.82 b 32.05 a 5907.73 a 489.53 a 256.57 a0 0 10 855.44 a 17.61 21.10 6101.08 a 465.61 a 331.62 a1 0 10 984.74 a 80.84 a 84.51 a 5346.15 a 329.33 a 320.26 a1 1 10 14843.06 a 7086.25 a 7151.50 a 6154.37 a 214.99 a 336.08 a3 0 10 5359.99 a 2620.69 a 2661.31 a 5207.66 a 274.14 a 270.83 a3 1 10 19093.44 a 11464.37 a 11529.32 a 6686.29 a 240.65 a 316.53 a6 0 10 46354.80 a 33769.48 a 33961.01 a 9156.62 a 431.56 a 389.46 a6 1 10 63648.38 a 49271.54 a 49410.70 a 7724.51 a 373.39 a 370.30 a6 2 10 285036.17 a 223381.99 a 224566.17 a 10813.06 a 311.30 a 291.82 aSubtotal 90 437123.78 a 327719.58 a 329417.67 a 63097.46 a 3130.50 a 2883.48 a
Grand Total 180 528962.22 a 328954.93 a 332305.76 a 770930.95 a 26180.20 a 8201.21 aNote: a=p<.001, b=p<.01, c=p<.05
17

Figure 1: Population covariance matrices and models.
Uncorrelated variables population and model.
Population covariance matrix.
1 00 1 0 0 0 00 0 1 0 0 00 0 0 1 0 00 0 0 0 1 00. 0 0 0 0 1_
Model tested, q=6..
[VAR1 ]-{0.0}-[VAR2]-{0.0}-[VAR3]-{0.0}-[VAR4]-{0.0}-[VAR5]-{0.0}-[VAR6]
[VAR2]- {0.0}-[VAR3]-{0.0}-[VAR4]-{0.0}- [VAR5]-{0.0}-[VAR6]
[VAR3]- {0.0}-[VAR4]-{0.0}-[VAR5]-{0.0}-[VAR6]
[VAR4]- {0.0}-[VAR5]-{0.0}- [VAR6]
[VAR5]- {0.0}-[VAR6]
[VAR1]- 1 -[VAR1][VAR2]- 2 -[VAR2][VAR3]- 3 -[VAR3][VAR4]- 4 -[VAR4][VAR5]- 5 -[VAR5][VAR6]- 6 -[VAR6]
18
Modified and Bootstrap based statistics 16
Correlated variables population and model.
Population covariance matrix.
1 .7 .6 .5 .4 .3.7 1 .7 .6 .5 .4.6 .7 1 .7 .6 .5.5 .6 .7 1 .7 .6.4 .5 .6 .7 1 .7.3 .4 .5 .6 .7 1
Model tested, q=11.
[VA R 1 ]-1 -[VA R2]-2-[VAR3]-3-[VAR4]-4- [VAR5]-5-[VAR6]
[VA R2]-1 -[VA R3]-2-[VAR4]-3-[VAR5]-4-[VAR6]
[VA R3]-1 -[VA R4]-2-[VAR5]-3-[VAR6]
[VA R4]- 1 -[VA R5]-2-[VAR6]
[VA R5]- 1 -[VA R6]
[VAR* 6 -[VAR1][VAR2]- 7 -[VAR2][VAR3]- 8 -[VAR3][VAR4]- 9 -[VAR4][VAR5]- 10 -[VAR5][VAR6]- 11 -[VAR6]

a)0.OcoU
5-C
C 4,7
0C
0C
OC
0(C
C15
C w
ON
C.)
Wa)
a).S2 aaso70_
-C3
E
tc3 %C
I-st n, v.%66
CI
Satocta-Nle%
ex scaled
CA
.
0 0 0c>
6Standaid
ctav'amum
WeV
cruzA
(s4.0 0 0 0 0 0
Sakotta-SztAx ad\us\ed
trl -4. VI C
A63,0
a 66666v
0-kackot Valtes&
modfed
o066666
Bevan-Siw
astaxia'ocOstapql
a.
0
to.0 0 0 0 0 CI
SW
iNt m
oevad
to. cn. k6 6 6 6 v
Zak/am-NW** scAs041
ttl s-6 6 6 6 6 6 v
Skacvaald maAlmmVise\tood
CO %LI .3 CI. tsk Af3
6 6 6 6 v%alma-Sent% ac*ske4
tr). %I. VIv6 a 6 6 6
CI-Eado Wastet
trk te. cn. tv.O O 0 0 0 0
Sexm-Sivaskasiabodstap
Vo6 6 6 6cv.
Svii.v\vocMeek

0.6
O 0.5
:,72 0.4
E0.3
0.2E
3$ 0.1aco
0.0
Va)
0.6
0.5
!.=0.4
E
cV) 0.3
CD
Ca 0.202 0.1a
0.0
0.6
0.5
o 0.4a)
-8 0.3E
*4,3 0.2
co
Empirical rejection rates as a function of sample size
under conditions of the uncorrelated variables model
and nominal alpha=.05
8
e 1 0
2q 4q 10q 20q 50q
i
I
1
.
1
i
I
i
1
I
1 1
i e-
1
1
1
i
8 i
i
0i
1 g 0 9
2q 4q 10q 20q 50q
0.0
0.1 g
2q 4q
0
10q 20q 50q
N
21
0.6
0.5
a)8 0.4
1,) 0.3
e9 0.2CD
t 0.1co
0.0
0.6
0.5CD
U).0.4
VCD
0.3
0.0
0.6
0.5
0.40.0;I 0.3CD
g.1 0.2U).0
0.1
a3 0.0
60 0
2q 4q 10q 20q 50q
8 8 0
2q 4q 10q 20q 50q
6
2q 4q 10q 20q 50q
0.6
o 0.50
15 0.4
E0.3
E 0.2
0.1
U) 0.0
0.6
0.5Va)
1.-g- 0.40Eg 0.3
co 0.2ti-t5a) 0.1a
-aa)
-oo 0.3E
0.2
0.0
0.6
0.5
0.4
co0.1
0.02q
Empirical rejection rates as a function of sample size
under conditons of the correlated variables model
and nominal alpha=.05
1 i
1
i
I1
I0 i
i
. .
iI
O I 0 I
00
8 i o io
o 1 8 1
o o i o
0 i oO 1 ° 1 0 i 0 0
11
8 I 8 I g
2q 4q 10q 20q 50q
0 8
*0.
0
8181
2q 4q 10q 20q 50q
I
I 00 i
00
o
I
.i
i0
00
0 00 1
8a
0
o00
°
0
00
0
00
0o : ,
i
1
w-----9 8 8 8
I
4q 10q 20q 50q
0.6
0.5
0.4
0.3
0.2
0.1
0.0
0.6
0.5Va)
0.4Vcu
LB 0.3
0.0
0.6
0.5Ca
O 0.40
CE1> 0.3
> 0.2U)
(Li 0.1a)to
N
22
0.0
i I
8 I 0 1 .
2q 4q 10q 20q 50q
if
a
2q 4q 10q 20q 50q
0
1-
a1 a a
2q 4q 10q 20q 50q
sp
0.6
V0.5
702 0.4
E0.3
E
0.2
al 0.1Vcci
-c)a)
-00 0.4
0.6
0.5
E
g 0.3cts
°3 0.28
,r_a 0.1
0.0
0.6
0.5
-0 0.4CD
-I 0.3
'cfs 0.2
co
0.1
0.0
Empirical rejection rates as a function of distribution type
under conditions of the correlated variables model
and nominal alpha=.05
o 9
e 8 8
0
*
1 3 5 7 9
L00
°
1 3 5 7 9
o
0O 4
0
1 3 5 7 9
0.6
0.5a)
0.40)
0.3
COeo 0.2
g 0.1
0.0
0.6
0.5CD
rg 0.4Cci
0.3
.06;
0? 0.2
81,5 0.1U)
0.0
0.6
cd- 0.5
8 0.4
0.3
co0.2
U)
cci 0.1
£00.0
I
0 0 0
3 5 7 9
1 1
i
Ii
1
1. 1
1
II
I
I Ii 1
1
0oa e e 0 1 .
0 0
3 5 7 9
Distribution type
23
3 5 7 9
2.1

p, 9 2.
Empirical rejection rates as a function of distribution type
and sample size under conditions of the uncorrelated
variables model and nominal alpha=.05
0.6g 0.6c0 0.4
20,30.2
5 0.1
.0,
060.5o. 4
3°'
S:0.20.
4-5=.19'
24
co
0.6
N0.5
3 0.40 0.3y 0.2
.11e34k3
Fi5 3
Empirical rejection rates as a function of distribution type
and sample size under conditions of the correlated
variables model and nominal alpha=.05
0.690.60a03
00 2
1.
A0)
0.6
S 0.6$0.4co
0.3
csofr
4-P 4§s.15=.
b. b. ...N.Is
25
IS
0.6
130 0 .5.c3 0.4
0 .3E
g 0.2E
1c26 0 . 1
CCa
(7) 0.0
Va)
0.6
0.5
E.=
12 0.4E
C) 0.3tCa
a3 0.20O..c2 0.1a
0.0
0.6
0.5
0 0.4a)
'8 0.3EC'co 0.2U)
Empirical rejection rates as a function of sample size
under conditions of the uncorrelated variables model
and nominal alpha=.05
6
2q 4q 1 Oq 20q 50q
1
I
,
1.1
I
,-r-,
,
sr-
1
0 1 a0
2q 4q 1 Oq 20q 50q
0.1 51 0
0.02q 4q
0
1 Oq 20q 50q
0.6
0.5
a)8 0.4
61). 0.3Ca)
0.0
0.6
0.5
.14 0.4Ca
13 0.3
0.2
t 0.1U)
0.0
0.6
0- 0.5
,376c: 0.4
0.3
N
26
.: .., .. .
iI
i
1
I .
. .. .
: I
i
1
I I
i1
"0-0
2q 4q 1 Oq 20q 50q
i1---- 1.--I
. i!
1
.
6 0
2q 4q 1 Oq 20q 50q
60 0
2q 4q 1 Oq 20q 50q
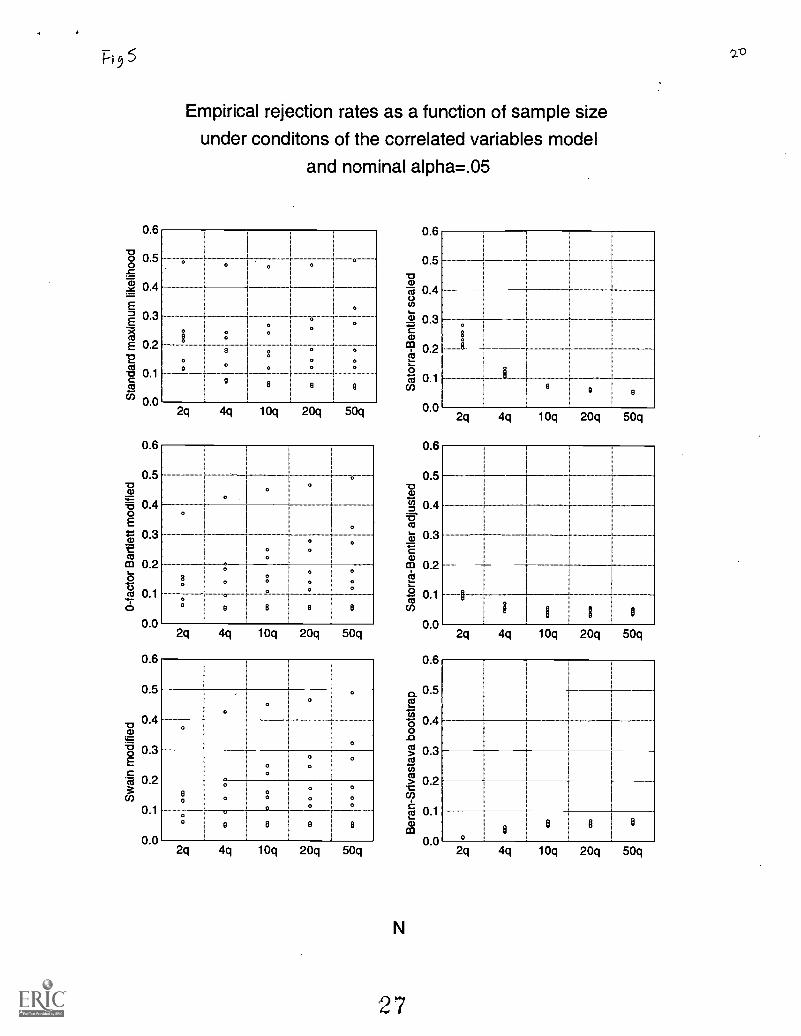
Fig 5
Va)
0.6
0.5
0.4
0.3
0.2
0.1
0.0
0.6
0.5
0.40E
0.3
co 0.20as 0.1
Va)
-g 0.3E
cti 0.2Co
0.1
0.0
0.6
0.5
0.4
0.02q
Empirical rejection rates as a function of sample size
under conditons of the correlated variables model
and nominal alpha=.05
Ii
00
8°I01010°0
011°100,0188
°0
0,0
2q 4q 10q 20q 50q
0
I8 00
8 8
00
2q 4q 10q 20q 50q
0
8
00
00
00
I
8 8
ooo 0
0 o
6
4q 10q 20q 50q
N
27
0.6
0.5
0.4
0.
0.2
0.1
0.0
0.6
0.573a)
tj 0.4V43 0.3
i
i
i - - - -
89
2q 4q 10q 20q 50q
0.0
0.6
al> 0.3
0.2CO
(8 0.1a)
c00.0
2q 4q 10q 20q 50q
6
0
2q 4q 10q 20q 50q
2 0
4
0.6
13 0.50
'1) 0.4
E 0.3
0.2
1203 0.1
ccs
(7) 0.0
0.6
0.5
0.4
0.3
0.2
0.1
0.0
0.6
0.5
-ct?) 0.4
E0.3
'Es 0.2U)
0.1
0.0
Empirical rejection rates as a function of distribution type
under conditions of the correlated variables model
and nominal alpha=.05
1 2
0 /3
o0
O re 8
8
3 5 7 9
0 0
3 5 7 9
3 5 7 9
0.6
0.5Va)
0.4
0.0
0.6
0.5a)
`A 0.4CU
0.3
36)
0? 0.2
2 0.1U)
0.0
0.6
g 0.5
13; 0.4.0
I 0.3
0.2
0.0
3 5 7 9
a e e 88 ci
3 5 7 9
--t
I
. 0
Distribution type
3 5 7 9
2,1
U.S. Department of EducationOffice of Educational Research and Improvement (OERI)
National Library of Education (NLE)Educational Resources Information Center (ERIC)
REPRODUCTION RELEASE(Specific Document)
I. DOCUMENT IDENTIFICATION:
0
T ca.,03?
Title: Co atria tea 44rocitve ,utalhip .1)1 Ail d. he Piorrn
5,5 1e 1 taa undo and f' oft6tkiiPe.1 44d 6110/3frr? b4oed fesh
va) 41zs
Author(s): iacLa 7 That..e-Corporate Source:
eprbf- educa-iiirwa P.syctiwayr--anxites-g- Tadao 4a--4106-1,__
II. REPRODUCTION RELEASE:
Publication Date:
Apri l Its-
In order to disseminate as widely as possible timely and significant materials of interest to the educational community, documents announced in themonthly abstract journal of the ERIC system, Resources in Education (RIE), are usually made available to users in microfiche, reproduced paper copy,and electronic media, and sold through the ERIC Document Reproduction Service (EDRS). Credit is given to the source of each document, and, ifreproduction release is granted, one of the following notices is affixed to the document.
If permission is granted to reproduce and disseminate the identified document, please CHECK ONE of the following three options and sign at the bottomof the page.
The sample sticker shown below will beaffixed to all Level 1 documents
1
PERMISSION TO REPRODUCE ANDDISSEMINATE THIS MATERIAL HAS
BEEN GRANTED BY
\e
S?'
TO THE EDUCATIONAL RESOURCESINFORMATION CENTER (ERIC)
Level 1
Check here for Level 1 release, permitting reproductionand dissemination in microfiche or other ERIC archival
media (e.g., electronic) and paper copy.
The sample sticker shown below will beaffixed to all Level 2A documents
PERMISSION TO REPRODUCE ANDDISSEMINATE THIS MATERIAL IN
MICROFICHE, AND IN ELECTRONIC MEDIAFOR ERIC COLLECTION SUBSCRIBERS ONLY,
HAS BEEN GRANTED BY
2A
e\e
TO THE EDUCATIONAL RESOURCESINFORMATION CENTER (ERIC)
Level 2A
Check here for Level 2A release, permitting reproductionand dissemination In microfiche and In electronic media
for ERIC archival collection subscribers only
The sample sticker shown below will beaffixed to all Level 2B documents
PERMISSION TO REPRODUCE ANDDISSEMINATE THIS MATERIAL IN
MICROFICHE ONLY HAS BEEN GRANTED BY
2B
,e,
Sad
TO THE EDUCATIONAL RESOURCESINFORMATION CENTER (ERIC)
Level 2B
Check here for Level 28 release, permittingreproduction and dissemination in microfiche only
Documents will be processed as indicated provided reproduction quality permits.If permission to reproduce Is granted, but no box is checked, documents will be processed at Level 1.
I hereby grant to the Educational Resources Information Center (ERIC) nonexclusive permission to reproduce and disseminate this documentas indicated above. Reproductio'n from the ERIC microfiche or electronic media by persons other than ERIC employees and its systemcontractors requires permission from the copyright holder. Exception is made for non-profit reproduction by libraries and other service agenciesto satisfy information needs of educators in response to discrete Inquiries.
Signhere,-)
OroanizationAeddr ss:please -2,13, 504; T A1,45-htel
A1411 fA q-8312 -1
Printed Name/Position/Title:
Radii) Tam/ -&ack-41;.
Tel.Z127"1-9/ "H5S FY', - 1-31 -/?3E-Mail Address:
Date: Liii5-715
.4744,t: 6, 014:4 atte,x44.044toveo

III. DOCUMENT AVAILABILITY INFORMATION (FROM NON-ERIC SOURCE):
If permission to reproduce is not granted to ERIC, or, if you wish ERIC to cite the availability of the document from another source, pleaseprovide the following information regarding the availability of the document. (ERIC will not announce a document unless it is publiclyavailable, and a dependable source can be specified. Contributors should also be aware that ERIC selection criteria are significantly morestringent for documents that cannot be made available through EDRS.)
Publisher/Distributor:
Address:
Price:
IV. REFERRAL OF ERIC TO COPYRIGHT/REPRODUCTION RIGHTS HOLDER:
If the right to grant this reproduction release is held by someone other than the addressee, please provide the appropriate name andaddress:
Name:
Address:
V. WHERE TO SEND THIS FORM:
Send this form to the following ERIC Clearinghouse:THE UNIVERSITY OF MARYLAND
ERIC CLEARINGHOUSE ON ASSESSMENT AND EVALUATION1129 SHRIVER LAB, CAMPUS DRIVE
COLLEGE PARK, MI) 20742-5701Attn: Acquisitions
However, if solicited by the ERIC Facility, or if making an unsolicited contribution to ERIC, return this form (and the document beingcontributed) to:
ERIC Processing and Reference Facility1100 West Street, rd Floor
Laurel, Maryland 20707-3598
Telephone: 301-497-4080Toll Free: 800-799-3742
FAX: 301-953-0263*e-mail: [email protected]
WWW: http://ericfac.piccard.csc.com
EFF-088 (Rev. 9/97)PREVIOUS VERSIONS OF THIS FORM ARE OBSOLETE.